THIS REPORT CONTAINS ASSESSMENTS OF COMMODITY AND TRADE ISSUES MADE BY
USDA STAFF AND NOT NECESSARILY STATEMENTS OF OFFICIAL U.S. GOVERNMENT
POLICY
Required Report - public distribution
Date: 3/5/2019
GAIN Report Number: KS1905
Korea - Republic of
Oilseeds and Products Annual
Korea Remains Mature, Steady Market for Oilseeds and
Products
Approved By:
Ron Verdonk
Prepared By:
Sunchul Choi//Amanda F. Hinkle
Report Highlights:
With a slight increase in projected acreage due to the government-run rice area reduction program,
soybean production is expected to rise slightly to 92,000 metric tons (MT) in Marketing Year (MY)
2019/2020. Soybean imports are expected to remain constant at 1.27 million MT (MMT). Soybean
meal production is also expected to remain steady at 792,000 MT, with nearly all soybean meal used in
compound feed production. Soybean meal imports are expected to remain constant at 1.9 MMT.
Soybean meal consumption is forecast to slightly increase to 2.65 MMT, as swine and poultry
inventories continue to grow. Soybean oil imports from the United States are expected to remain
constant at 200 TMT out of total imports of 280 TMT.
Commodities: Oilseed, Soybean
Production:
Soybeans accounted for approximately 52 percent of Korea’s total oilseed production in MY 2017/18,
followed by perilla (31 percent), peanuts (9 percent) and sesame (9 percent) (Table 3). Korea also
produces a small amount of rapeseed. However, the Korean government has not released rapeseed
production numbers since 2010.
The Korean Rural Economic Institute (KREI) conducted a nationwide survey December 11-17, 2018 to
ascertain the planting intentions of soybean farmers. According to the survey results, MY 2019/20
soybean area is forecast to increase to 52,149 hectares, up 1,511 hectares (3 percent) from official
harvested area in MY 2018/19 (Table 1). KREI estimates seemed to reflect the effect of domestic rice
area reduction programs that encourage rice farmers to cultivate soybeans on their paddy land. Using
the KREI survey results and the rice reduction program as a benchmark, FAS Seoul is forecasting that
soybean production for MY 2019/20 will increase by 3 percent from KOSTAT official data in the
previous year when a five-year average yield is applied. Yields are expected to be similar to those in
2018/19 crop, which had sharply declined from the preceding year due to unfavorable weather
conditions.
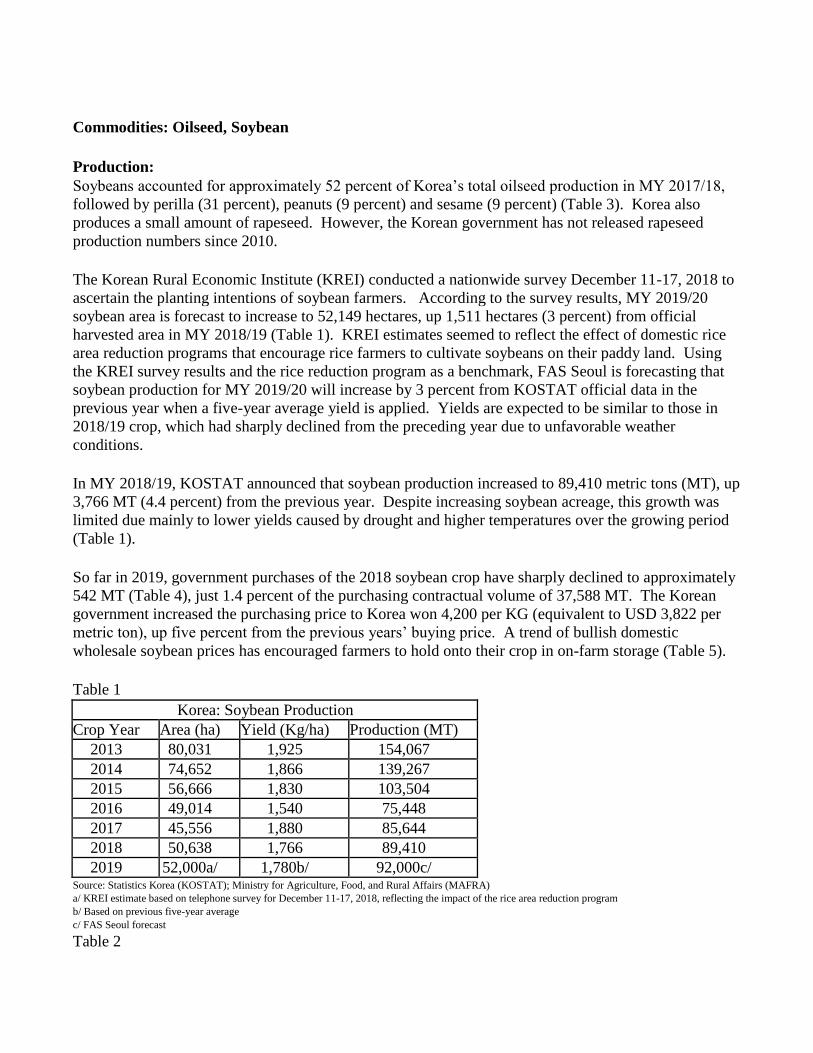
In MY 2018/19, KOSTAT announced that soybean production increased to 89,410 metric tons (MT), up
3,766 MT (4.4 percent) from the previous year. Despite increasing soybean acreage, this growth was
limited due mainly to lower yields caused by drought and higher temperatures over the growing period
(Table 1).
So far in 2019, government purchases of the 2018 soybean crop have sharply declined to approximately
542 MT (Table 4), just 1.4 percent of the purchasing contractual volume of 37,588 MT. The Korean
government increased the purchasing price to Korea won 4,200 per KG (equivalent to USD 3,822 per
metric ton), up five percent from the previous years’ buying price. A trend of bullish domestic
wholesale soybean prices has encouraged farmers to hold onto their crop in on-farm storage (Table 5).
Table 1
Korea: Soybean Production
Crop Year Area (ha) Yield (Kg/ha) Production (MT)
2013 80,031 1,925 154,067
2014 74,652 1,866 139,267
2015 56,666 1,830 103,504
2016 49,014 1,540 75,448
2017 45,556 1,880 85,644
2018 50,638 1,766 89,410
2019 52,000a/ 1,780b/ 92,000c/ Source: Statistics Korea (KOSTAT); Ministry for Agriculture, Food, and Rural Affairs (MAFRA)
a/ KREI estimate based on telephone survey for December 11-17, 2018, reflecting the impact of the rice area reduction program
b/ Based on previous five-year average
c/ FAS Seoul forecast
Table 2

Korea: 2019 Soybean Planting Intentions
Crop Year Upland (ha) Paddy Land (ha) Total (ha)
2018 Harvest (A) 41,767 8,872 50,638
2019 Intention1/ (B) 43,217 8,931 52,149
Growth Rate (%) (B/A) +3.5 +0.7 +3 Source: Korea Rural Economic Institute (KREI)
1/ Based on KREI telephone survey for December 11-17, 2018
Table 3
Korea: Oilseed Area and Production
(Hectares and Metric tons)
Crops MY 2016 MY 2017 MY 2018
Area Production Area Production Area Production
Soybean 49,014 75,448 45,556 85,644 50,638 80,804
Peanuts1/
5,632 15,530 5,190 14,910 NA2/
NA2/
Sesame 27,170 13,575 29,682 14,258 24,760 12,727
Perilla 45,474 50,024 43,352 50,738 NA2/
NA2/
Total 127,290 154,577 123,780 165,550 NA2/
NA2/
Source: Ministry for Agriculture, Food, and Rural Affairs (MAFRA) and KOSTAT
Notes:
1/ In-shell
2/ Data should be available May 2019
Table 4
Korea: Government Purchases of Soybeans
Year
Grown in rice paddy area Grown in upland area
Total Purchase
(MT) Price (KRW/Kg)1/
Quantity
(MT) Price (KRW/Kg)1/
Quantity
(MT)
2012 3,618 0 3,618 0 0
2013 3,868 1,373 3,868 7,571 8,943
2014 3,868 na 3,868 na 9,409
2015 3,868 na 3,868 na 11,424
2016 3,868 na 3,868 na 2,114
2017 4,011 na 4,011 na 10,725
2018 4,200 na 4,200 na 542 Source: Korea Agro-Fishery & Food Trade Corporation (aT); National Agricultural Cooperative Federation (NACF)
1/ Price based on No. 1 grade of large-sized kernel
Table 5
Korea: Wholesale Prices of Domestic Soybeans
(High Quality, Korean Won per Kg)
Mont
h Jan Feb Mar Apr May Jun July Aug Sep Oct Nov Dec
2013
6,22
9
6,31
1
6,31
4
6,31
4
6,33
3
6,32
6
6,33
8
6,28
6
6,28
6
5,88
5
5,19
3
4,59
4
2014 4,43 4,14 4,05 4,05 4,05 4,05 4,05 4,05 4,05 3,93 3,99 3,97

5 2 7 7 7 7 7 7 7 1 7 3
2015
3,97
7
4,00
0
3,88
8
3,88
6
3,92
9
3,97
1
3,97
1
3,94
6
3,91
4
3,95
2
4,16
5
4,22
5
2016
4,25
5
4,27
3
4,28
6
4,28
6
4,28
6
4,28
6
4,31
6
4,34
3
4,34
4
4,34
3
4,86
1
5,29
9
2017
5,08
6
4,95
9
4,91
4
4,91
4
4,90
8
4,87
5
4,89
1
4,90
9
4,91
9
4,94
9
4,72
2
4,67
0
2018
4,68
6
4,73
7
4,92
8
5,03
1
5,12
2
5,18
6
5,16
6
5,07
7
5,08
9
5,24
9
5,40
0
5,32
9
2019
5,26
3
5,26
3
Source: Korea Agro-Fishery& Food Trade Corporation (aT)
Applicable Exchange Rate (Korean Won per USD): 1,099 on average in 2018
Consumption:
Soybeans account for the majority of oilseed consumption. Total domestic consumption in MY 2019/20
is forecast to stay around 1.35 million MT (MMT), remaining unchanged from the current marketing
year’s estimate, amid stagnant domestic production and flat consumer demand consistent with a mature
market. Of this total, 1 MMT will be used for crush, 300,000 MT will be used for domestic food use in
products like tofu, soymilk and soy sauce, and the remaining 50,000 MT will be consumed as domestic
feed and waste. All domestic production goes to food use. Future growth in overall soybean
consumption is expected to be minimal. Consumption for crushing will be constant at the level of 1
MMT if CJ Corporation, the largest Korean soybean crusher, continues soybean crushing in their
flexible crushing facilities, which are convertible depending on the comparison of crushing margins
between rapeseed and soybeans.
As is projected for the next marketing year, in MY 2018/19, soybean consumption is expected to stay
around 1.35 MMT, due to lower consumption of domestic soybeans as food, caused by higher prices
resulting from lower domestic soybean production. This total consists of 1 MMT for crushing, 300,000
MT for food and 50,000 MT for feed, seed and waste.
In MY 2017/18, because of better crushing margins, Korean soybean crushers increased soybean
crushing to 1,011,900 MT, up two percent from the previous year (Table 6). The bearish trend in
international soybean prices led to the increase of locally crushing soybeans for soybean meal for feed.
Total soybean consumption increased to 1.36 MMT, up 8,000 MT or just one percent from the previous
year. The greater demand for crushing soybeans offset the lower consumption of food grade soybeans
(due to lower production of domestic soybeans) while imported soybean consumption has been
constant.
Table 6
Korea: Soybean Consumption for Crushing
(Metric Ton)
Month MY 16/17 MY 17/18 MY 18/19
October 67,000 91,600 81,300
November 89,000 85,500 79,000
December 90,000 92,000 84,000

January 86,200 87,000 Na
February 77,130 81,700 Na
March 87,100 87,600 Na
April 74,000 75,000 Na
May 80,100 84,400 Na
June 80,100 78,700 Na
July 83,100 86,000 Na
August 87,900 80,700 Na
September 88,500 81,700 Na
Total 990,130 1,011,900 Na Source: Korea Soybean Processing Association
Table 7
Korea: Distribution of Imported Soybeans for Food Manufacturing
by the Korea Agro Fisheries & Food Trade Corp. (aT)
(Calendar Year, Metric Ton)
Item\Year 2016 2017 2018
Soybean Curd 102,112 100,993 93,048
Soy Paste 33,730 32,891 28,247
Soy Paste/Soy Flour 4,650 4,344 3,028
Soy Milk 26,553 25,772 24,541
Soy Sprout 25,077 17,966 17,372
Others 1/ 224 237 1,450
Sub. Total 192,346 182,203 167,686
By product 2/ 44,629 38,103 31,677
Total (A) 236,975 220,306 199,363
TRQ Allocation to End-Users Direct Commercial Purchases
Soybean Curd
2,560 3,500
13,000 Soymilk
Soy-Paste/Red Pepper
Soy Sprout 9,980 11,980 12,000
Total (B) 12,540 15,480 25,000
Soy-sauce/protein (after crushing) (C) 0 0 0
Grand Total (A+B+C) 249,515 235,786 224,363 Source: Korea Agro-Fishery & Food Trade Corporation (aT)
Note: Quantity is on the basis of cleaned soybeans.
1/ Government, military employees and others
2/ for feed
Trade:
Soybeans accounted for more than 83 percent of total oilseed imports, of which approximately 78
percent were used for crushing in the last marketing year. Due to constant demand for imported
soybeans, MY 2019/20 soybean imports are forecast to remain unchanged from the current marketing
year estimate of 1.27 MMT. MY 2018/19 soybean imports are expected to increase one percent from
the previous year due to a limited domestic soybean production for food processing with constant
demand for crushing purposes.
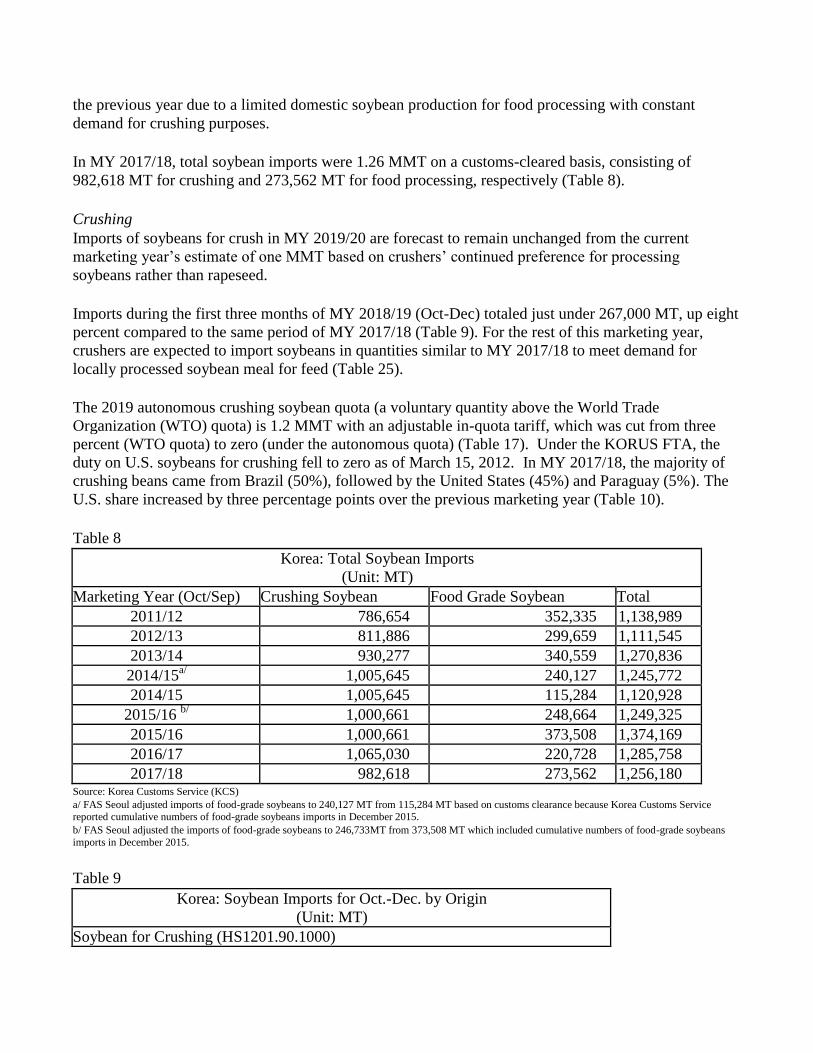
In MY 2017/18, total soybean imports were 1.26 MMT on a customs-cleared basis, consisting of
982,618 MT for crushing and 273,562 MT for food processing, respectively (Table 8).
Crushing
Imports of soybeans for crush in MY 2019/20 are forecast to remain unchanged from the current
marketing year’s estimate of one MMT based on crushers’ continued preference for processing
soybeans rather than rapeseed.
Imports during the first three months of MY 2018/19 (Oct-Dec) totaled just under 267,000 MT, up eight
percent compared to the same period of MY 2017/18 (Table 9). For the rest of this marketing year,
crushers are expected to import soybeans in quantities similar to MY 2017/18 to meet demand for
locally processed soybean meal for feed (Table 25).
The 2019 autonomous crushing soybean quota (a voluntary quantity above the World Trade
Organization (WTO) quota) is 1.2 MMT with an adjustable in-quota tariff, which was cut from three
percent (WTO quota) to zero (under the autonomous quota) (Table 17). Under the KORUS FTA, the
duty on U.S. soybeans for crushing fell to zero as of March 15, 2012. In MY 2017/18, the majority of
crushing beans came from Brazil (50%), followed by the United States (45%) and Paraguay (5%). The
U.S. share increased by three percentage points over the previous marketing year (Table 10).
Table 8
Korea: Total Soybean Imports
(Unit: MT)
Marketing Year (Oct/Sep) Crushing Soybean Food Grade Soybean Total
2011/12 786,654 352,335 1,138,989
2012/13 811,886 299,659 1,111,545
2013/14 930,277 340,559 1,270,836
2014/15a/ 1,005,645 240,127 1,245,772
2014/15 1,005,645 115,284 1,120,928
2015/16 b/
1,000,661 248,664 1,249,325
2015/16 1,000,661 373,508 1,374,169
2016/17 1,065,030 220,728 1,285,758
2017/18 982,618 273,562 1,256,180 Source: Korea Customs Service (KCS)
a/ FAS Seoul adjusted imports of food-grade soybeans to 240,127 MT from 115,284 MT based on customs clearance because Korea Customs Service reported cumulative numbers of food-grade soybeans imports in December 2015.
b/ FAS Seoul adjusted the imports of food-grade soybeans to 246,733MT from 373,508 MT which included cumulative numbers of food-grade soybeans
imports in December 2015.
Table 9
Korea: Soybean Imports for Oct.-Dec. by Origin
(Unit: MT)
Soybean for Crushing (HS1201.90.1000)

MY2018/19 USA Brazil China Others Total
Oct. 2018 50,995 48,243 - - 99,238
Nov 24,899 12,052 - - 36,951
Dec 115,671 15,100 - 100 130,871
Subtotal 191,565 75,395 - 100 267,060 MY2017/18a/ 99,771 99,385 0 48,467 247,623
Soybean for Sprouting (HS1201.90.3000)
MY2018/19 USA Brazil China Others Total
Oct. 2018 20 - 60 - 80
Nov 120 - 2,770 - 2,890
Dec 999 - 1,479 36 2,514
Subtotal 1,139 - 4,309 36 5,484 MY2017/18a/ 720 0 9,762 80 10,562
Soybean for Food Processing (HS1201.90.9000)
MY2018/19 USA Brazil China Others Total
Oct. 2018 34,944 - 170 2,316 37,430
Nov 32,417 - 445 2,184 35,046
Dec 13,663 - 9,782 2,579 26,024
Subtotal 81,024 - 10,397 7,079 98,500 MY2017/18a/ 122,182 0 4,361 2,702 129,246
Soybeans Total
MY2018/19 USA Brazil China Others Total
Oct. 2018 85,959 48,243 230 2,316 136,748
Nov 57,436 12,052 3,215 2,184 74,887
Dec 130,333 15,100 11,261 2,715 159,409
Subtotal 273,728 75,395 14,706 7,215b/ 371,044 MY2017/18a/ 222,673 99,385 14,123 51,249 387,431 Source: Korea Customs Service (KCS)
a/ October – December 2017
b/ 5,501MT (Russia), 1,359MT (Canada) and 355 MT (Australia)
Table 10
Korea: Crushing Soybean Imports by Origin
(Unit: MT)
Marketing Year (Oct/Sep) USA Brazil Paraguay Others Total
2010/11 485,109 405,551 43,621 0 934,281
2011/12 173,447 418,292 194,915 0 786,654
2012/13 374,167 384,262 53,461 0 811,886
2013/14 372,504 455,920 101,853 0 930,277
2014/15 326,169 628,209 51,025 200 1,005,603
2015/16 291,894 573,836 134,769 120 1,000,661
2016/17 451,193 484,505 129,123 201 1,065,030
2017/18 437,483 496,269 48,466 400 982,618 Source: Korea Customs Service (KCS)
a/ Paraguay

Food Use
The Korea Agro-Fishery and Food Trade Corporation (aT), the government’s state trading arm, controls
the bulk of marketing of non-GMO food-grade soybeans for food processing under its autonomous
WTO Tariff Rate Quota (TRQ). aT distributes soybeans to end-users and charges a mark-up that
supports domestic crop production and pays for some costs of handling and cleaning, which involves
removing any foreign material and broken soybeans upon arrival.
In preparation for its 2020 WTO TRQ-based procurement plan, aT forward contracted or purchased
170,000 MT of soybeans on basis trading contracts at the end of 2018, with delivery planned during the
first half of 2020. Accordingly, in MY 2019/20 imports of food-grade soybeans are forecast to be
270,000 MT under the autonomous WTO TRQ and FTA TRQs, with the majority coming from the
United States followed by China, Canada and Australia. The United States is expected to retain 70 – 80
percent of the import market for food-use soybeans. The gains under the KORUS FTA have further
strengthened the U.S. position. U.S. food-grade soybeans are primarily used in products like tofu,
soybean paste/sauce and soymilk, while China mainly supplies soybeans for sprouting.
Despite the fact that the government hasn’t announced its 2019 autonomous WTO TRQ for food grade
soybeans yet, the volume of the WTO TRQ is estimated to be in the range between 210,000 and
230,000 MT. aT expects the government to release the TRQ in early March 2019, anticipating 92
percent for aT’s bidding process with the remainder for import license to end-users who can contract
with soybean suppliers directly. In late 2017, under the 2019 TRQ regime, aT had already purchased
170,000 MT through basis trading contracts from the United States for delivery during the first half of
2019. The remainder will likely be purchased off the spot market sometime this year, with delivery
during the second half of the year. Korea is also expected to import 54,732 MT under 2019 FTA TRQs
from the United States (28,982 MT), China (10,000 MT), Australia (750 MT) and Canada (15,000 MT);
that is, those countries which have FTA TRQ agreements with Korea. Therefore, total imports of food-
grade soybeans will be around 270,000 MT in 2019.
In 2018, Korea imported 273,562 MT of food-grade soybeans, consisting of 231,427 MT of yellow
soybeans and 42,135 MT of soybeans for sprouting, under a combination of the autonomous WTO TRQ
and FTA TRQs. Under the autonomous WTO TRQ, the state trading company distributed 199,363 MT
of imported soybeans to local food processors and 25,000 MT in import licenses to end-users,
respectively (Table 7). Under the 2018 FTA TRQs, Korea also imported 50,899 MT, consisting of
28,135 MT from the United States, 610 MT from Australia, 12,494 MT from Canada and 9,660 MT
from China, respectively (Table 15).
In 2018, aT sold at a fixed price about 150,314 MT of imported food-quality soybeans (excluding soy
by-products and sprouts) at an average price of 1,100 Korean Won/KG (or USD 1,000/MT, using the
applicable exchange rate of 1,099 Korean Won per USD on average in 2018), unchanged from the
previous year. During this period, the average price of imported soybeans for food processing was USD
556/MT (CIF). Based on these figures, aT made an estimated margin of USD 67 million by selling
imported food-grade soybeans to end-users. Meanwhile, 17,372 MT of soybeans for sprouting were
sold to end-users at an average bidding price of Korean Won 2,420/KG (or USD 2,202/MT) while the

average price of imported soybeans for sprouting was USD 895/MT (CIF). The estimated margin is
calculated at USD 23 million. Additionally, 31,677MT of soybean by-products (after screening and
cleaning food grade soybeans) were sold to feed mills at Korean Won 500/KG (or USD 455/MT) at a
total discount of USD 3 million.
Table 11
Korea: Food-Grade Soybean Imports by Origin
(Unit: MT)
Marketing Year (Oct/Sep) USA Brazil China Canada Australia Others Total
2010/11 216,984 35 80,162 7,449 0 17 304,647
2011/12 225,084 5,300 109,726 11,525 0 700 352,335
2012/13 192,728 1,702 83,449 19,105 0 2,675 299,659
2013/14 247,832 0 80,307 7,584 4,836 0 340,559
2014/15a/ 195,737 2,500 33,822 6848 1,220 0 240,127
2014/15 70,894 2,500 33,822 6,848 1,220 0 115,284
2015/16 b/
199,185 1,091 20,371 24,901 1,931 1,185 248,664
2015/16 324,029 1,091 20,371 24,901 1,931 1,185 373,508
2016/17 158,207 0 40,559 20,243 884 1,250 221,143
2017/18 204,910 0 48,124 13,244 926 6,358 273,562
Source: Korea Customs Service (KCS)
a/ FAS Seoul adjusted imports of food-grade soybeans to 195,737 MT from 70,894 MT based on customs clearance because Korea Customs Service
reported cumulative numbers of food-grade soybeans imported from the United States in December 2015.
b/ FAS Seoul adjusted imports of food-grade soybeans to 199,185 MT from 324,029 MT to include cumulative numbers of food-grade soybeans imported
from the United States in December 2015.
Tariffs
The government is expected to announce the 2019 autonomous WTO TRQ in early March 2019. aT
will purchase soybeans for food processing and sprouting purposes with 92 percent of the TRQ, with the
remainder of the TRQ being granted as import licenses to end-users under a TRQ auctioning system.
The portion for import licenses will effectively allow end-users or importers to bypass aT and buy
directly from suppliers. The applicable in-quota tariff rate is five percent, while the out-of-quota tariff
rate is a prohibitive 487 percent, or 956 Korean won (or 0.87 USD) per kg, whichever is greater (Table
17).
Under the KORUS-FTA, Korea established a zero-duty TRQ for 10,000 MT of food-grade identity-
preserved (IP) soybeans in the first year of the agreement (2012), increasing to 20,000 MT in 2013 and
25,000 MT in 2014. Starting 2015, the TRQ grows three percent annually in perpetuity. Korea is
expected to import 28,982 MT of IP soybeans from the United States under 2019 KORUS FTA TRQ
(Table 12 & 14). The TRQ is administered by an association of food-grade soybean processors, which
gives U.S. suppliers direct market access to these processing companies (Table 13).
The KORUS FTA TRQ of 28,982 MT in 2019 was allocated to soybean processors a year earlier, as
shown in Table 13, so that they could make forward contracts with U.S. farmers. The TRQ fill rate
under the KORUS FTA reached almost 100 percent in 2018, a distinct improvement from 35 percent in
2012. In 2018, Korean soybean processors imported 28,135 MT, which included 3,042 MT of soybeans
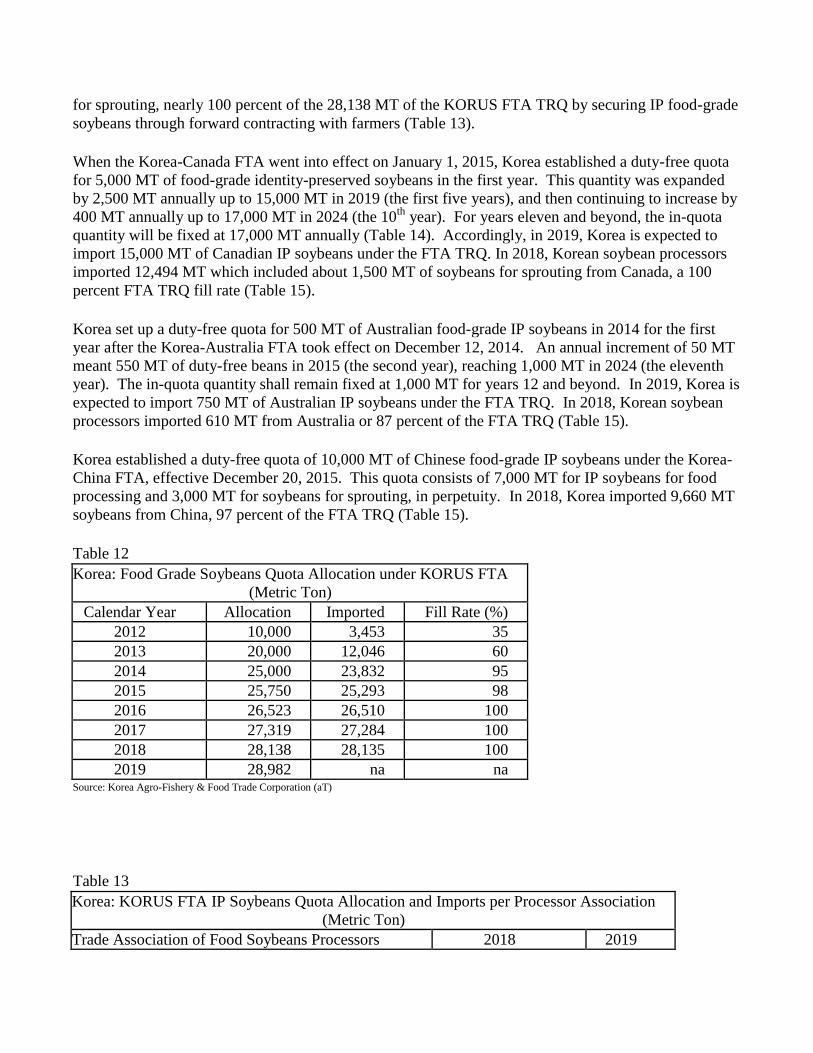
for sprouting, nearly 100 percent of the 28,138 MT of the KORUS FTA TRQ by securing IP food-grade
soybeans through forward contracting with farmers (Table 13).
When the Korea-Canada FTA went into effect on January 1, 2015, Korea established a duty-free quota
for 5,000 MT of food-grade identity-preserved soybeans in the first year. This quantity was expanded
by 2,500 MT annually up to 15,000 MT in 2019 (the first five years), and then continuing to increase by
400 MT annually up to 17,000 MT in 2024 (the 10th
year). For years eleven and beyond, the in-quota
quantity will be fixed at 17,000 MT annually (Table 14). Accordingly, in 2019, Korea is expected to
import 15,000 MT of Canadian IP soybeans under the FTA TRQ. In 2018, Korean soybean processors
imported 12,494 MT which included about 1,500 MT of soybeans for sprouting from Canada, a 100
percent FTA TRQ fill rate (Table 15).
Korea set up a duty-free quota for 500 MT of Australian food-grade IP soybeans in 2014 for the first
year after the Korea-Australia FTA took effect on December 12, 2014. An annual increment of 50 MT
meant 550 MT of duty-free beans in 2015 (the second year), reaching 1,000 MT in 2024 (the eleventh
year). The in-quota quantity shall remain fixed at 1,000 MT for years 12 and beyond. In 2019, Korea is
expected to import 750 MT of Australian IP soybeans under the FTA TRQ. In 2018, Korean soybean
processors imported 610 MT from Australia or 87 percent of the FTA TRQ (Table 15).
Korea established a duty-free quota of 10,000 MT of Chinese food-grade IP soybeans under the Korea-
China FTA, effective December 20, 2015. This quota consists of 7,000 MT for IP soybeans for food
processing and 3,000 MT for soybeans for sprouting, in perpetuity. In 2018, Korea imported 9,660 MT
soybeans from China, 97 percent of the FTA TRQ (Table 15).
Table 12
Korea: Food Grade Soybeans Quota Allocation under KORUS FTA
(Metric Ton)
Calendar Year Allocation Imported Fill Rate (%)
2012 10,000 3,453 35
2013 20,000 12,046 60
2014 25,000 23,832 95
2015 25,750 25,293 98
2016 26,523 26,510 100
2017 27,319 27,284 100
2018 28,138 28,135 100
2019 28,982 na na Source: Korea Agro-Fishery & Food Trade Corporation (aT)
Table 13
Korea: KORUS FTA IP Soybeans Quota Allocation and Imports per Processor Association
(Metric Ton)
Trade Association of Food Soybeans Processors 2018 2019

Allocation Import Allocation
Korea Federation of Tofu Coop.(KFTC) 9,829 9,829 10,032
Korea Jang Cooperative 5,363 5,362 5,545
Korea Food Industry Association 4,190 4,188 4,267
Korea Soybean Foodstuffs Association 2,068 2,068 2,427
Korea Bean Curd Manufacture Coop. 2,575 2,575 2,653
Seoul Kyung In Beancurd Manufacture Cooperation 295 295 306
Korea Bean Sprouts Association 3,042 3,042 2,819
Korea Dhyana Food Industry Cooperative 146 146 147
Seoul Soybean-Processed Foods Cooperative 537 537 533
Korea Bean Curd Manufacture Coop. 93 93 102
Korea Soybean Sprouts Cooperative 0 0 151
Total 28,138 28,135 28,982
Source: Korea Customs Service (KCS); Korea Agro-Fishery & Food Trade Corporation (aT)
Table 14
Korea: IP Soybeans TRQ Scheme under FTAs
(Metric Ton, Calendar Year)
Year 2014 2015 2016 2017 2018 2019 2020 2021 2022 2023 2024
USA
25,00
0
25,75
0
26,52
3
27,31
9 28,13
8
28,98
2
29,85
1
30,74
7
31,66
9
32,61
9
33,59
8
Austral
ia
500 550 600 650 700 750 800 850 900 950 1,000
Canada na 5,000 7,500 10,00
0 12,50
0
15,00
0
15,40
0
15,80
0
16,20
0
16,60
0
17,00
0
China na na 10,00
0
10,00
0 10,00
0
10,00
0
10,00
0
10,00
0
10,00
0
10,00
0
10,00
0
Total 25,50
0
31,30
0
44,62
3
47,96
9 51,33
8
54,73
2
56,05
1
57,39
7
58,76
9
60,16
9
61,59
8 Source: FAS/Seoul based on Korea’s FTAs
Table 15
Korea: Actual Imports of Food Grade Soybeans under FTA TRQ
(Metric Ton)
Calendar Year 2014 2015 2016 2017 2018
USA 23,832 25,293 26,510 27,284 28,135
Australia 0 476 588 625 610
Canada na 4,847 7,477 9,935 12,494
China na 0 9,300 10,000 9,660
Total 23,832 30,616 43,875 47,844 50,899 Source: FAS/Seoul based on Korea’s FTAs

Production, Supply and Demand Data Statistics:
Soybean, Oilseed PS&D
Oilseed, Soybean 2017/2018 2018/2019 2019/2020 Market Begin Year Oct 2017 Oct 2018 Oct 2019
Korea, Republic of USDA Official New Post USDA Official New Post USDA Official New Post
Area Planted 70 46 70 51 0 52
Area Harvested 46 46 57 51 0 52
Beginning Stocks 48 48 40 33 0 42
Production 86 86 100 89 0 92
MY Imports 1256 1256 1365 1270 0 1270
MY Imp. from U.S. 642 642 600 650 0 650
MY Imp. from EU 0 0 0 0 0 0
Total Supply 1390 1390 1505 1392 0 1404
MY Exports 0 0 0 0 0 0
MY Exp. to EU 0 0 0 0 0 0
Crush 1000 1012 1100 1000 0 1000
Food Use Dom. Cons. 300 300 300 300 0 300
Feed Waste Dom. Cons. 50 45 50 50 0 50
Total Dom. Cons. 1350 1357 1450 1350 0 1350
Ending Stocks 40 33 55 42 0 54
Total Distribution 1390 1390 1505 1392 0 1404
CY Imports 1275 1240 1400 1250 0 1250
CY Imp. from U.S. 600 693 600 650 0 650
CY Exports 0 0 0 0 0 0
CY Exp. to U.S. 0 0 0 0 0 0
Yield 1.8696 1.8696 1.7544 1.7451 0 1.7692
(1000 HA) ,(1000 MT) ,(MT/HA)
Soybean Import Trade Matrix
Import Trade Matrix
Country Korea, Republic of
Commodity Oilseed, Soybean
Time Period OCT/SEP Units: 1,000MT
Imports for: 2016
2017
U.S. 609 U.S. 642
Others
Others
Brazil 485 Brazil 496
China 41 China 48
Paraguay 129 Paraguay 49
Canada 20 Canada 13
Total for Others 675
606
Others not Listed 2
8
Grand Total 1286
1256 Source: Korea Customs Service (KCS)

Table 16
Korea: Oilseed Imports
(Metric Tons, USD1,000)
MY 2015/16 MY 2016/17 MY 2017/18
Volume Value Volume Value Volume Value
Soybean 1,249,325a/ 563,445
a/ 1,286,131 602,057 1,256,180 586,499
Peanuts 757 1,266 602 935 549 854
Copra 203 239 424 482 331 360
Linseed 8,531 7,533 3,204 2,795 187 187
Rapeseed 2,071 1,263 3,753 2,073 6,974 3,584
Sunflower Seed 3,547 5,608 3,710 5,406 3,465 4,722
Cotton Seed 153,219 48,092 157,003 47,297 145,172 37,732
Castor Bean 5 4 8 10 6 11
Sesame Seed 74,406 109,487 73,660 105,869 69,280 110,562
Mustard Seed 2,594 2,090 1,262 1,209 1,726 1,771
Safflower Seed 393 235 360 242 462 332
Perilla Seed 25,294 39,091 24,976 31,635 17,611 35,282
Others 6,720 34,009 6,386 29,295 6,581 8,146
Total 1,527,065 a/
812,362a/ 1,561,479 829,305 1,508,524 790,042
Source: Korea Customs Service a/ FAS/Seoul reflects statistical adjustment of food grade soybean imports.
Table 17
Korea: Applied Tariff Schedule for Oilseeds
(Percent)
Commodity H.S. Code 2017 2018 2019
Soybean, Seed 1201.10.xxxx 3 3 3
Soybean, Crushing 1/ 1201.90.1000 3(0) 3(0) 3(0)
Soybean, Feed 1/ 1201.90.2000 3(0) 3(0) 3(0)
Soybean, Sprouting 2/ 1201.90.3000 3(5) 3(5) 3(5)
Soybean, Food Grade 2/ 1201.90.9000 3(5) 3(5) 3(5)
Peanuts, Seed, in shell 1202.30.1000 40 40 40
Peanuts, Seed, shelled 1202.30.1000 24 24 24
Peanuts, in Shell 3/ 1202.41.0000 40 40 40
Peanuts, Shelled 3/ 1202.42.0000 24 24 24
Copra 1203.00.0000 3 3 3
Linseed 1204.00.0000 3 3 3
Rapeseed 1205.xx.xxxx 10 10 10
Sunflower Seed 1206.00.0000 25 25 25
Cottonseed 4/ 1207.29.1000 2 (0) 2 (0) 2 (0)
Sesame Seed 5/ 1207.40.0000 40 40 40
Mustard Seed 1207.50.0000 3 3 3
Perilla Seed 6/ 1207.99.1000 40 40 40

Castor Beans 1207.99.4000 3 3 3
Safflower Seed 1207.99.5000 3 3 3
Others 1207.99.9000 3 3 3 Source: Korea Customs Research Institute, Tariff Schedules of Korea.
Note: The Seed Industry Act restricts imports of listed commodities for planting seed purposes.
1/The number in parenthesis is the in-quota autonomous TRQ tariff rate assessed on 1.2 million tons of soybeans imported for crushing and feed purposes in CY 2019. The number not in parenthesis is the in-quota WTO TRQ tariff rate.
2/ applied duty rate of 5 percent for food grade soybeans imported and administered by the Korea Agro-Fishery & Food Trade Corporation (aT) under the
WTO TRQ. Soybeans imported out-of-quota by private importers will be assessed a tariff rate of 487 percent or Korean won 956/Kg, whichever is greater. 3/The in-quota amount is 4,907.3 tons on a shelled basis. Peanuts imported out-of-quota are assessed a tariff of 230.5 percent.
4/The number in parenthesis is the in-quota tariff rate assessed on all cotton seed for feed.
5/The in-quota amount under the WTO TRQ is 6,731 tons. Sesame imported out-of-quota is assessed a tariff of 630 percent or Korean won 6,660/Kg, whichever is greater.
6/ 40 percent or Korean won 410/Kg, whichever is greater.
Commodities:
Meal, Soybean
Meal, Rapeseed
Production:
Essentially all of the vegetable meal produced in Korea is made from imported soybeans. Soybean meal
production in MY 2017/18 increased to 801,627 MT (79.2 percent applicable extraction rate basis), up
two percent from the previous year, reflecting growing demand for poultry feed after the industry fully
recovered from a Highly Pathogenic Avian Influenza (HPAI) outbreak in November 2016.
There are only two soybean crushers in Korea: CJ Corporation and Sajo O&F Company Ltd, with a
crushing ratio of 65:35 percent. In MY 2017/18, CJ Corp’s crushing capacity remained unchanged at
2,100 MT per day. Sajo O&F’s crushing capacity also remained unchanged from the previous year, at
1,100 MT per day (Table 18).
MY 2019/20 demand for crushing soybeans will remain flat at one MMT as long as crushing margins
remain steady. Soybean demand for crushing is steady, equivalent to the country’s one MMT crushing
capacity. Soybean meal production for MY 2019/20 is forecast to hold steady at 792,000 MT with an
extraction rate of 79.2 percent and crude protein content at 44 percent.
MY 2018/19 soybean meal production is expected at 792,000 MT, a similar level compared to the
previous year based on soybean crushing margins with reasonable soybean prices in the international
markets.
In an effort to strengthen their competitiveness against imported meal from South America, local
crushing companies have continued producing de-hulled hi-pro soybean meal with a 47-percent protein
content by blending U.S. and Brazilian soybeans. In 2018, production of de-hulled hi-pro, 47-percent
protein soybean meal declined to 21 percent of total soybean meal production, three percent lower than
the previous year because of lower exports of hi-pro soybean meal to Japan (Table 19 & 20).
The breakdown of production by company and product follows. In 2018, CJ produced 47-percent
protein de-hulled meal and 45-percent protein meal in a ratio of 30:70, decreasing the production of 47-
percent protein meal by five percentage points from the previous 35:65 ratio. However, Sajo produced

meal at a 46-percent versus 45-percent protein content at a ratio of 68:32, increasing the production of
46-percent protein meal by nine percentage points, in view of their previous 59:41 ratio.
This change was made because some feed millers preferred using higher protein meal to produce
compound feed for poultry and swine in recognition of the feed value of hi-pro meals. The
USSEC/Seoul office continues to educate Korean feed millers about the economic value of hi-pro
meals.
Table 18
Korea: Soybean Crushing Capacity
(As of February 2019)
Soybean Crusher Capacity (MT/day) Location
CJ Corp 2,100 a/ Incheon
Sajo O&F 1,100 Incheon
Total 3,200 Source: Soybean Crushing Industry
Note: Day=24 hours processing basis for 330 days
a/ of them, 700 MT have been converted to crush for either rapeseed or soybeans depending on crushing margin since December 2012.
Consumption:
Nearly all imported and domestically produced soybean meal is used in compound feed production.
Given its ready availability, Korean feed millers prefer soybean meal. It is the second most widely used
ingredient in compound feed production after corn, accounting for about 12.2 percent of total compound
feed production in MY 2017/18, up 0.1 percentage point from the previous year.
MY 2019/20 soybean meal consumption is forecast to reach around 2.65 MMT, a slightly higher level
than the current marketing year, as local swine and poultry inventories are expected to continue
growing.
MY 2018/19 soybean meal consumption for animal feed is predicted to increase to 2.6 MMT, up 1.4
percent from the previous marketing year, as poultry production has recovered to the inventory level
attained prior to the severe outbreak of Highly Pathogenic Avian Influenza (HPAI) in November 2016.
Obviously, the outbreak of HPAI or other possible epidemic diseases such as Foot and Mouth Disease
(FMD) in the marketing year would reduce demand for compound feed later in the year.
MY 2017/18 soybean meal consumption was revised up to 2.56 MMT to make up for the lack of supply
from the protein portion of feed grade wheat, as the inclusion rate of this grain declined by 2.8 percent
points from the previous year. (Tables 21 & 22).
Rapeseed meal consumption for feed in MY 2019/20 is forecast to stay around 280,000 MT, unchanged
from the previous year. MY 2018/19 consumption is expected to increase 10 percent to 280,000 MT
from the previous year, as poultry and swine inventories are growing. In MY 2017/18, feed millers
consumed 254,000 MT, up 31 percent from the previous year due to increasing compound feed
requirements from poultry and swine sectors coupled with lower import prices of rapeseed meals (Table
21 & 23). The DDGS inclusion rate for compound feed production has been constant at five percent in

recent years. Please refer to KS1748 DDGS in the Korean Market for more details about DDGS in
Korea.
Trade:
Soybean meal imports during MY 2019/20 are forecast at 1.9 MMT, remaining unchanged from the
current marketing year, as Korean livestock inventories are expected to be stagnant. Despite an increase
of eight percent in soybean meal imports for the first three months over the same period of MY 2017/18
(Table 24), for MY 2018/19 as a whole, soybean meal imports are expected to increase to around 1.9
MMT, about a four percent increase over the previous marketing year. This increase in imports will
help meet a greater demand for compound feed for poultry and swine. MY 2017/18 soybean meal
imports have been revised up to 1.83 MMT, increasing five percent from the previous year due to a
stronger rebound of compound feed production for poultry, after the industry recovered from the
damage of an HPAI outbreak in November 2016.
Rapeseed meal imports during MY 2019/20 are forecast at 300,000 MT, remaining unchanged from the
current marketing year to meet constant demand for feed production. In MY 2018/19, rapeseed meal
imports are expected to increase slightly due to constant demand from the feed sector. Korean feed
millers imported 293,649 MT of rapeseed meal in MY 2017/18, marking a sharp increase of 38 percent
from the previous marketing year due to greater supply availability from India, along with a bearish
trend in international vegetable protein meal markets. India was the only supplier of rapeseed meal to
Korea.
Palm kernel meal and copra meal imports are forecast to remain major protein resources for animal feed
in both MY 2018 and MY 2019. DDGS imports are also forecast to be strong to meet a greater demand
for vegetable protein from feed sectors in Korea (Table 22).
The 2019 autonomous soybean meal WTO TRQ is set at 2.45 MMT with a zero percent in-quota import
duty, unchanged from the previous year. The 2019 WTO TRQ for DDGS is set at zero percent for
unlimited volume, coupled with a zero percent in-quota import duty for countries under FTAs. In order
to help the livestock industry, the Korean government has maintained an autonomous zero duty TRQ for
other vegetable protein meals such as cottonseed meal and cottonseed hulls. TRQ volumes for copra
meal and palm kernel meal were eliminated when the zero duty under the Korean-ASEAN FTA was
implemented.
Under the Korean-ASEAN FTA, copra and palm kernel meals are imported duty free from Southeast
Asian countries such as Indonesia, Malaysia and the Philippines. Indian soybean meal is imported duty
free under the Korea-India Comprehensive Economic Partnership Agreement (CEPA). As part of the
KORUS FTA, Korea eliminated import duties on vegetable protein meals such as soybean meal
(2304.00.0000), DDGS (2303.30.0000), and cottonseed meal (2306.10.0000) beginning March 15,
2012.
Export
Korea exports some locally-crushed soybean meal that is less competitive than imported meal. Soybean
meal exports for MY 2019/20 are forecast to remain unchanged from the current marketing year’s
estimate of 50,000 MT. The major markets for Korean soybean meal are Japan, followed by China,
Vietnam and Malaysia: countries where there are overseas feed mills established by Korean crushers
(Table 19).
Table 19
Korea: Soybean Meal Exports
(Metric Ton)
Country MY 15/16 MY 16/17 MY 17/18
Japan 61,312 89,038 31,626
Vietnam 12,040 3,480 2,660
Malaysia 600 407 264
Philippine 180 180 141
China 986 6,840 5,587
Others 519 371 736
Total 75,637 100,316 41,014 Source: Korea Customs Service
Production, Supply and Demand Data Statistics:
Soybean Meal PS&D
Meal, Soybean 2017/2018 2018/2019 2019/2020 Market Begin Year Oct 2017 Oct 2018 Oct 2019
Korea, Republic of USDA Official New Post USDA Official New Post USDA Official New Post
Crush 1000 1012 1100 1000 0 1000
Extr. Rate, 999.9999 0.788 0.7925 0.7873 0.792 0 0.792
Beginning Stocks 203 203 171 209 0 231
Production 788 802 866 792 0 792
MY Imports 1846 1828 1870 1900 0 1900
MY Imp. from U.S. 12 10 10 50 0 50
MY Imp. from EU 0 0 0 0 0 0
Total Supply 2837 2833 2907 2901 0 2923
MY Exports 41 41 40 50 0 50
MY Exp. to EU 0 0 0 0 0 0
Industrial Dom. Cons. 0 0 0 0 0 0
Food Use Dom. Cons. 25 20 25 20 0 20
Feed Waste Dom. Cons. 2600 2563 2670 2600 0 2650
Total Dom. Cons. 2625 2583 2695 2620 0 2670
Ending Stocks 171 209 172 231 0 203
Total Distribution 2837 2833 2907 2901 0 2923
(1000 MT) ,(PERCENT)
Soybean Meal Import Trade Matrix
Import Trade Matrix Country Korea, Republic of
Commodity Meal, Soybean Time Period OCT/SEP Units: 1,000MT
Imports for: 2016
2017

U.S. 7 U.S. 10
Others
Others
Brazil 1443 Brazil 1706
Argentina 217 Argentina 10
China 28 China 37
India 51 India 65
Total for Others 1739
1818
Others not Listed 1
0
Grand Total 1747
1828
Source: Korea Customs Service (KCS)
Note: H.S. 2304 only
Rapeseed Meal PS&D
Meal, Rapeseed 2017/2018 2018/2019 2019/2020 Market Begin Year Oct 2017 Oct 2018 Oct 2019
Korea, Republic of USDA Official New Post USDA Official New Post USDA Official New Post
Crush 8 8 11 5 0 5
Extr. Rate, 999.9999 0.625 0.625 0.6364 0.6 0 0.6
Beginning Stocks 15 15 24 40 0 43
Production 5 5 7 3 0 3
MY Imports 294 294 275 300 0 300
MY Imp. from U.S. 0 0 0 0 0 0
MY Imp. from EU 0 0 0 0 0 0
Total Supply 314 314 306 343 0 346
MY Exports 0 0 0 0 0 0
MY Exp. to EU 0 0 0 0 0 0
Industrial Dom. Cons. 50 20 50 20 0 20
Food Use Dom. Cons. 0 0 0 0 0 0
Feed Waste Dom. Cons. 240 254 240 280 0 280
Total Dom. Cons. 290 274 290 300 0 300
Ending Stocks 24 40 16 43 0 46
Total Distribution 314 314 306 343 0 346
(1000 MT) ,(PERCENT)
Rapeseed Meal Import Trade Matrix
Import Trade Matrix Country Korea, Republic of
Commodity Meal, Rapeseed

Time Period OCT/SEP Units: 1,000MT
Imports for: 2016
2017
U.S. 0 U.S. 0
Others
Others
India 180 India 293
Canada 21
Japan 10
Total for Others 211
293
Others not Listed 1
0
Grand Total 212
293
Source: Korea Customs Service (KCS)
Author Defined:
Table 20
Korea: Soybean Meal Production1/
(Metric Ton)
Month MY 16/17 MY 17/18 MY 18/19
October 49,000 65,400 58,700
November 63,000 61,400 57,000
December 64,000 66,230 60,800
January 62,000 62,800 Na
February 55,500 59,300 Na
March 63,600 63,200 Na
April 53,950 54,000 Na
May 58,220 61,400 Na
June 57,800 57,300 Na
July 60,400 62,600 Na
August 63,200 58,500 Na
September 63,300 58,800 Na
Total 713,970 730,930 Na
Extraction Rate (Percent) 72.11 72.23 Na Source: Korea Soybean Processing Association 1/ based on crushers’ applicable extraction rate
Table 21
Korea: Feed Ingredients for Animal Use
(October/September Basis)
Items MY 2015/2016 MY 2016/2017 MY 2017/2018
1,000
MT
Percent 1,000
MT
Percent 1,000
MT
Percent

Total Grains and Grain
Substitution
12,395 63.8 12,116 63.9 12,474 63.7
- Wheat 1,910 9.8 2,025 10.7 1,546 7.9
- Corn 7,841 40.4 7,031 37.1 7,564 38.6
- Others 2,644 13.6 3,060 16.1 3,364 17.3
Total Vegetable Protein 4,937 25.4 4,764 25.1 4,973 25.4
- Soybean Meal 1/ 2,531 13.0 2,296 12.1 2,391 12.2
- Rapeseed Meal 200 1.0 194 1.0 254 1.3
- Cottonseed Meal 0 0.0 1 0.0 0 0.0
- Palm Kernel Meal 721 3.7 738 3.9 702 3.6
-Copra Meal 317 1.6 203 1.1 276 1.4
-Sesame Meal 37 0.2 32 0.2 36 0.2
-Perilla seed Meal 3 0.0 1 0.0 2 0.0
-Corn Gluten Meal 71 0.4 68 0.4 70 0.4
DDGS 779 4.0 945 5.0 982 5.0
- Others 274 1.4 286 1.4 260 1.3
Total Animal Protein 205 1.1 184 1.0 198 1.0
- Fish meal 15 0.1 14 0.1 12 0.1
-Meat & Bone Meal 30 0.2 23 0.1 24 0.1
-Others 160 0.8 147 0.8 162 0.8
Total Others 1,886 9.7 1,896 10.0 1,946 10.0
TOTAL COMPOUND FEED 19,423 100.0 18,960 100.0 19,591 100.0 Source: Korea Feed Association
1/ include dehullled locally processed soybean meal
Table 22
Korea: Imports of Major Protein Meals
(October/September)
MY 2015/016 MY 2016/017 MY 2017/018
Volume
(MT)
Value
(1,000USD)
Volume
(MT)
Value
(1,000USD)
Volume
(MT)
Value
(1,000USD)
Soybean Meal 2,104,092 807,293 1,747,046 687,196 1,828,269 707,128
Rapeseed Meal 223,484 67,095 212,026 58,085 293,649 79,004
Fish Meal 49,910 86,077 48,812 84,409 50,055 86,536
Bone Meal 246 399 322 471 268 594
Cottonseed Meal 10,281 5,248 12,351 5,638 9,966 3,975
Sunflower Seed
Meal 3,747 1,200 8,668 2,154 2,046 501
Copra Meal 289,902 53,437 210,406 40,952 294,880 48,852
Palm Kernel Meal 724,064 76,744 789,602 92,382 762,151 106,376
Corn Germ Meal 27,507 4,914 25,708 5,009 26,272 5,338
Others 465,317 53,698 391,178 34,595 343,968 31,972
Total 3,898,550 1,156,105 3,446,217 1,010,992 3,611,539 1,070,284

DDGS 849,401 185,831 1,036,935 203,325 1,079,254 229,849 Source: Korean Customs Service (KCS)
Table 23
Korea: Price Comparison of Major Imported Protein Meals
(USD/MT, CIF, Arrival Basis on annual average)
MY 2012 MY 2013 MY 2014 MY 2015 MY 2016 MY 2017
Soybean Meal 543.00 549.23 480.71 383.68 393.35 386.77
Rapeseed Meal 337.98 276.47 275.11 300.22 273.95 269.04
Fish Meal 1,776.74 1,654.13 2,004.71 1,724.64 1,729.27 1,728.80
Bone Meal 1,567.31 1,305.88 1,082.44 1,621.95 1,462.73 2,216.42
Cottonseed Meal 424.89 479.07 462.22 510.46 456.48 398.86
Sunflower Seed Meal 416.46 424.81 404.75 320.26 248.50 244.87
Copra Meal 224.27 261.21 196.07 184.33 194.63 166.67
Palm Kernel Meal 182.12 189.55 127.73 105.99 117.00 139.57
Corn Germ Meal 302.48 306.84 250.42 178.65 194.84 203.18
Others 134.01 127.40 133.82 115.16 88.44 92.95
DDGS 348.62 320.18 244.49 218.78 196.08 212.97 Source: Korean Customs Service (KCS)
Table 24
Korea: Soybean Meal Imports for Oct.-Dec. by Origin
(Unit: MT, H.S. 2304 basis)
MY 2018/19 USA Brazil Vietnam India China Others Total
Oct. 2018 2,856 159,842 6,500 6,269 8,755 0 184,222
Nov 813 143,785 0 4,767 1,790 0 151,155
Dec 2,271 149,074 6,590 4,309 794 0 163,038
Subtotal 5,940 452,701 13,090 15,345 11,339 0 498,415
MY 2017/18 a/ 407 437,042 5,000 15,392 1,522 334 459,697
Source: Korea Customs Service (KCS) a/ October – December 2017
Table 25
Korea: Compound Feed Production
(October/September, 1,000 MT)
Animal Type MY 2016/17 MY 2017/18 MY 2018/19a/
Poultry 5,402 5,906 6,000
Swine 6,327 6,461 6,500
Cattle 5,807 5,719 5,800
Others b/
1,381 1,456 1,500
Sub. Total 18,917 19,542 19,800
Aquaculture 148 152 150
Milk Substitute 52 52 55
Grand Total 19,117 19,746 20,005 Source: Korea Feed Association (KFA), Ministry for Agriculture, Food, and Rural Affairs (MAFRA) a/ FAS/ Seoul forecast

b/ include ducks, pet food, rabbit, horse, sheep, deer, quail etc.
Table 26
Korea: Animal Inventory (1,000 Head, 1,000 Birds, as Feb, 2019)
Animal Year March June September December
Beef Cattle 2014 3,083 3,149 3,103 3,028
2015 2,896 2,984 2,996 2,909
2016 2,821 2,996 3,016 2,963
2017 2,885 3,034 3,120 3,020
2018 2,947 3,117 3,168 3,090
2019 3,021c/ 3,137c/ 3,250c/ na
Dairy Cattle 2014 437 436 442 445
2015 439 433 430 428
2016 425 420 421 418
2017 416 414 411 409
2018 408 405 407 408
2019 405-407c/ na na na
Swine 2014 9,698 9,680 9,966 10,090
2015 9,971 10,018 10,332 10,187
2016 10,315 10,355 10,699 10,367
2017 11,005 11,187 11,493 11,273
2018 11,156 11,304 11,641 11,333
Layer a/ 2014 64,572 62,851 65,263 67,674
2015 68,878 67,907 72,090 71,877
2016 70,177 68,281 69,853 71,043
2017 51,608 57,383 67,833 72,710
2018 71,324 67,043 71,227 74,741
Broiler b/ 2014 77,879 103,593 75,846 77,746
2015 82,749 110,489 81,184 81,851
2016 86,541 101,014 76,420 87,830
2017 79,332 104,205 80,546 85,436
2018 91,053 112,681 83,278 85,915 Source: Korea Statistics (KOSTAT)
a/ Excluding breeders
b/ Excluding multi-use broilers
c/ KREI forecast
d/ FAS Seoul forecast
Note: The Korean government changed the basis for estimating cattle inventory as of September 2017. The Korea Statistics
Service switched from a sample survey-based cattle inventory estimate to the actual number of cattle registered under the
traceability system. As it is mandatory to register cattle under the traceability system, this change will allow for more
accurate inventory numbers. However, this change increased cattle inventory statistics by an average of 240,000 head
(KS1810). Swine inventory numbers also followed the registration of the traceability system beginning 2017.
Table 27
Korea: Applied Tariff Schedule for Oil Cake and Meals

(Percent)
Commodity H.S. Code 2017 2018 2019
DDGS a/ 2303.30.0000 2 (0) 2 (0) 2 (0)
Soybean Meal b/
2304.00.0000 1.8 (0) 1.8 (0) 1.8 (0)
Peanut Meal 2305.00.0000 5 5 5
Cottonseed Meal c/ 2306.10.0000 2 (0) 2 (0) 2 (0)
Linseed Meal 2306.20.0000 5 5 5
Sunflower Seed Meal 2306.30.0000 5 5 5
Rapeseed Meal 2306.40.0000 0 0 0
Copra Meal 2306.50.0000 2 2 2
Palm Kernel Meal 2306.60.0000 2 2 2
Cottonseed Hull for feed d/
2308.00.3000 5 (0) 5 (0) 5 (0) Source: Korea Customs Service
The figures in parentheses are the autonomous quota tariff rates. The number not in parenthesis is the in-quota WTO TRQ tariff rate.
a/ The applied duty is assessed on the unlimited volume of residues of brewing or distilling dregs and waste for 2019. b/ The applied duty is assessed on the first 2.45 million tons of soybean meal for 2019.
c/ The applied duty is assessed on the unlimited volume of cottonseed meal for feed for 2019.
d/ The applied duty is assessed on the unlimited volume of cottonseed hull for feed and 2,000 tons for mushroom growing for 2019.
Commodities:
Oil, Soybean
Oil, Palm
Production:
Due to the greater crushing margins from soybean processing over rapeseed, CJ Corporation, Korea’s
largest soybean crusher, has continued processing soybeans rather than canola seed since 2013. MY
2017/18 soybean oil production increased to 194,890 MT, up three percent over the previous marketing
year. Current MY 2018/19 soybean oil production is expected to remain stable at 190,000 MT, a level
similar to the previous marketing year, unless crushing margins between soybeans and rapeseed are
overturned. MY 2019/20 soybean oil production is forecast to stay around 190,000 MT, remaining
unchanged from the current marketing year due to a saturated domestic market.
Consumption:
Soybean oil and palm oil accounted for 73 percent of the country’s total oil supply in MY 2017/18
(Table 30). Most soybean oil is consumed in the hotel, restaurant and institutional (HRI) sector and at
home, but soybean oil consumption has recently decreased in the biodiesel sector due to less
competitive prices than palm oil. Food processors and restaurants rely heavily on imported soybean oil,
while locally processed soybean oil is generally for home use. Palm oil is primarily used for food
processing, especially ramen (instant noodle) production, since it is more functional and cheaper than
soybean oil. Palm oil has been increasingly used in local biodiesel production. Please refer to KS1801
for additional details on the vegetable oil market in Korea.
Soybean oil consumption in MY 2019/20 is forecast at 470,000 MT, unchanged from the current
marketing year’s estimate. This attributable to tapering demand for soybean oil used in bio-diesel
production, as it is less cost effective than palm oil. Meanwhile, palm oil consumption during this
period is forecast at 570,000 MT, up about two percent from the current marketing year because of

increasing demand from the bio-diesel sector, and stable demand from other food processing sub-
sectors. Palm oil consumption in the current marketing year (MY 2018/19) is expected to increase to
560,000 MT, up two percent from the previous year with the mandate of biodiesel maintained at three
percent since 2018 from the previous 2.5 percent minimum.
Trade:
The biodiesel sector has been the main driver behind rising edible oil imports since MY 2007/08.
However, MY 2019/20 soybean oil imports are forecast at 280,000 MT, unchanged from the current
marketing year’s estimate as the vegetable oil content mandate in biodiesel is being met by cheaper
palm oil. In MY 2018/19, soybean oil imports are expected to remain at 280,000 MT, stagnant from
the previous year.
U.S. soybean oil exporters’ market share has risen from 19 percent in MY 2014/15 to 47 percent in MY
2016/17 and then expanded to 83 percent in MY 2017/18, with an expectation of a 70-80 percent share
in MY 2018/19 based on import statistics for the first three months (Table 32). In effect, the U.S. has
taken market share from Argentina in recent years. Three reasons influenced the Korean buyers’ pivot to
U.S. soybean oil. First, Argentinian drought conditions caused the oil content of their soybeans to fall.
Second, Korean end users prefer colorless oil, but the Argentinian oil has a red tint. Third, the KORUS
FTA reduced the tariff on U.S. soybean oil from 1.62 percent in 2018 to 1.08 percent in 2019 with the
out-of-quota rate at five percent for non-FTA exporters. (The KORUS FTA has been cutting tariff rates
on American oil exports over a ten-year period before reaching zero in 2021.)
In MY 2019/20, palm oil imports are forecast to increase to 570,000 MT, up two percent from the
current marketing year, mainly due to rising demand from the biodiesel industry. The Korean
government has implemented revised regulations increasing the mandatory inclusion rate from 2.5
percent to three percent since 2018 (through 2020). Palm oil imports for biodiesel are expected to reach
330,000 MT in MY 2019/20, up three percent from the current marketing year as it is more
competitively-priced than other oil-based feedstock. Palm oil imports for use in the local soap industry
are expected to remain steady at 20,000 MT. In MY 2017/18, palm oil imports increased to 550,460
MT to meet demand for biodiesel production, up four percent from the previous year. Palm oil has been
imported duty-free under the Korea-ASEAN FTA since June 2007.
Under the KORUS FTA, effective since March 2012, Korea’s 5.4 percent duty on imports of crude
soybean oil has been diminishing according to a phase-out schedule of 10 equal, annual reductions (year
2021). Meanwhile, the 5.4 percent rate on refined soybean oil was phased out in five equal annual
reductions. Since 2016, U.S. refined soybean oil has been imported duty- free. Korea also eliminated
the import duty on palm oil immediately under the KORUS FTA.
Production, Supply and Demand Data Statistics:
Soybean Oil PS&D
Oil, Soybean 2017/2018 2018/2019 2019/2020 Market Begin Year Oct 2017 Oct 2018 Oct 2019
Korea, Republic of USDA Official New Post USDA Official New Post USDA Official New Post
Crush 1000 1012 1100 1000 0 1000
Extr. Rate, 999.9999 0.177 0.1927 0.1773 0.19 0 0.19

Beginning Stocks 60 60 41 59 0 54
Production 177 195 195 190 0 190
MY Imports 276 276 300 280 0 280
MY Imp. from U.S. 225 225 200 200 0 200
MY Imp. from EU 0 0 0 0 0 0
Total Supply 513 531 536 529 0 524
MY Exports 2 2 2 5 0 5
MY Exp. to EU 0 0 0 0 0 0
Industrial Dom. Cons. 50 20 50 20 0 20
Food Use Dom. Cons. 420 450 440 450 0 450
Feed Waste Dom. Cons. 0 0 0 0 0 0
Total Dom. Cons. 470 470 490 470 0 470
Ending Stocks 41 59 44 54 0 49
Total Distribution 513 531 536 529 0 524
(1000 MT) ,(PERCENT)
Soybean Oil Import Trade Matrix
Import Trade Matrix
Country Korea, Republic of
Commodity Oil, Soybean
Time Period OCT/SEP Units: 1,000MT
Imports for: 2016
2017
U.S. 145 U.S. 225
Others
Others
Argentina 117 Argentina 29
Vietnam 27 Vietnam 11
Thailand 1 1
Total for Others 145
41
Others not Listed 16
10
Grand Total 306
276
Source: Korea Customs Service (KCS)
Palm Oil PS&D
Oil, Palm 2017/2018 2018/2019 2019/2020 Market Begin Year Oct 2017 Oct 2018 Oct 2019
Korea, Republic of USDA Official New Post USDA Official New Post USDA Official New Post
Area Planted 0 0 0 0 0 0
Area Harvested 0 0 0 0 0 0
Trees 0 0 0 0 0 0
Beginning Stocks 66 66 71 66 0 66
Production 0 0 0 0 0 0
MY Imports 550 550 580 560 0 570
MY Imp. from U.S. 0 0 0 0 0 0
MY Imp. from EU 0 0 0 0 0 0

Total Supply 616 616 651 626 0 636
MY Exports 0 0 0 0 0 0
MY Exp. to EU 0 0 0 0 0 0
Industrial Dom. Cons. 275 330 295 340 0 350
Food Use Dom. Cons. 270 220 285 220 0 220
Feed Waste Dom. Cons. 0 0 0 0 0 0
Total Dom. Cons. 545 550 580 560 0 570
Ending Stocks 71 66 71 66 0 66
Total Distribution 616 616 651 626 0 636
CY Imports 520 603 550 560 0 570
CY Imp. from U.S. 0 0 0 0 0 0
CY Exports 0 0 0 0 0 0
CY Exp. to U.S. 0 0 0 0 0 0
Yield 0 0 0 0 0 0
(1000 HA) ,(1000 TREES) ,(1000 MT) ,(MT/HA)
Palm Oil Import Trade Matrix
Import Trade Matrix
Country Korea, Republic of
Commodity Oil, Palm
Time Period OCT/SEP Units: 1,000MT
Imports for: 2015
2016
U.S. 0 U.S. 0
Others
Others
Malaysia 267 Malaysia 242
Indonesia 258 Indonesia 306
Total for Others 525
548
Others not Listed 2
2
Grand Total 527
550
Source: Korea Customs Service (KCS)
Author Defined:
Table 28
Korea: Domestic Production of Vegetable Oils1/
(Metric Ton)
Commodities MY 2015/16 MY 2016/17 MY 2017/18
Soybean Oil 199,500 189,600 194,890
Corn Oil 49,719 51,520 51,520
Sesame Oil 21,521 21,809 20,885
Rice Bran Oil 10,000 10,000 10,000
Rapeseed Oil 1,290 1,996 3,349

Perilla Seed Oil 30,491 30,200 27,339
Total 312,521 306,315 307,983 Source: Foreign Agriculture Service, Seoul, Korea
1/ FAS/Seoul estimates
Table 29
Korea: Soybean Oil Production
(Metric Ton)
Month MY 16/17 MY 17/18 MY 18/19
October 13,000 18,000 16,000
November 17,000 16,800 15,300
December 17,000 17,790 16,200
January 16,500 16,600 Na
February 14,600 15,400 Na
March 16,300 16,300 Na
April 14,700 13,800 Na
May 13,900 16,300 Na
June 15,500 15,300 Na
July 16,300 16,600 Na
August 17,300 15,800 Na
September 17,500 16,200 Na
Total 189,600 194,890 Na
Extraction Rate 19.15 19.26 Na Source: Korea Soybean Processing Association (KSPA)
Table 30
Korea: Total Supply of Edible Oils
(Metric Ton)
Commodity MY 2015/16 MY 2016/17 MY 2017/18
Soybean Oil 449,298 496,005 474,312
Palm Oil 479,503 527,137 550,460
Corn Oil 53,910 58,319 57,405
Rapeseed Oil 116,764 128,870 150,618
Coconut Oil 41,411 42,787 56,428
Olive Oil 12,908 13,378 14,757
Cottonseed Oil 326 204 328
Sesame Oil 22,003 22,519 21,413
Rice Bran Oil 22,967 22,273 21,454
Perilla Seed Oil 31,346 31,066 28,263
Fish Oil 6,552 8,162 7,005
Sunflower Oil 26,849 25,265 26,095
Total 1,263,837 1,375,985 1,408,537 Source: Foreign Agriculture Service, Seoul, Korea
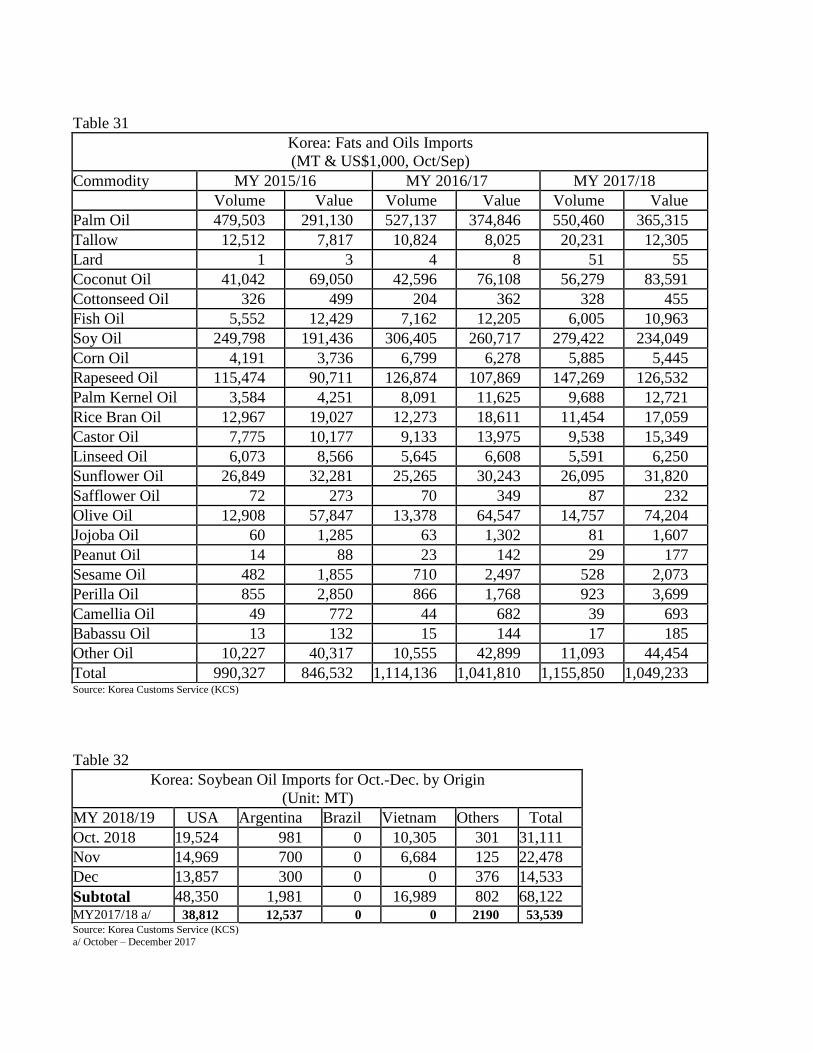
Table 31
Korea: Fats and Oils Imports
(MT & US$1,000, Oct/Sep)
Commodity MY 2015/16 MY 2016/17 MY 2017/18
Volume Value Volume Value Volume Value
Palm Oil 479,503 291,130 527,137 374,846 550,460 365,315
Tallow 12,512 7,817 10,824 8,025 20,231 12,305
Lard 1 3 4 8 51 55
Coconut Oil 41,042 69,050 42,596 76,108 56,279 83,591
Cottonseed Oil 326 499 204 362 328 455
Fish Oil 5,552 12,429 7,162 12,205 6,005 10,963
Soy Oil 249,798 191,436 306,405 260,717 279,422 234,049
Corn Oil 4,191 3,736 6,799 6,278 5,885 5,445
Rapeseed Oil 115,474 90,711 126,874 107,869 147,269 126,532
Palm Kernel Oil 3,584 4,251 8,091 11,625 9,688 12,721
Rice Bran Oil 12,967 19,027 12,273 18,611 11,454 17,059
Castor Oil 7,775 10,177 9,133 13,975 9,538 15,349
Linseed Oil 6,073 8,566 5,645 6,608 5,591 6,250
Sunflower Oil 26,849 32,281 25,265 30,243 26,095 31,820
Safflower Oil 72 273 70 349 87 232
Olive Oil 12,908 57,847 13,378 64,547 14,757 74,204
Jojoba Oil 60 1,285 63 1,302 81 1,607
Peanut Oil 14 88 23 142 29 177
Sesame Oil 482 1,855 710 2,497 528 2,073
Perilla Oil 855 2,850 866 1,768 923 3,699
Camellia Oil 49 772 44 682 39 693
Babassu Oil 13 132 15 144 17 185
Other Oil 10,227 40,317 10,555 42,899 11,093 44,454
Total 990,327 846,532 1,114,136 1,041,810 1,155,850 1,049,233 Source: Korea Customs Service (KCS)
Table 32
Korea: Soybean Oil Imports for Oct.-Dec. by Origin
(Unit: MT)
MY 2018/19 USA Argentina Brazil Vietnam Others Total
Oct. 2018 19,524 981 0 10,305 301 31,111
Nov 14,969 700 0 6,684 125 22,478
Dec 13,857 300 0 0 376 14,533
Subtotal 48,350 1,981 0 16,989 802 68,122 MY2017/18 a/ 38,812 12,537 0 0 2190 53,539 Source: Korea Customs Service (KCS)
a/ October – December 2017

Table 33
Korea: Applied Tariff Schedule For Fats And Oils
(Percent)
Commodity H.S. Code General Rate 2018 2019
Lard 1501.00.10xx 3 3 3
Beef Tallow 1502.00.10xx 2 2 2
Other Tallow 1502.00.90xx 3 3 3
Fish Oil 1504.xx.xxxx 3 3 3
Soybean Oil for Food, Crude 1507.10.1000 5 5 5
Soybean Oil For Biodiesel, Crude 1507.10.2000 5 5 5
Soybean Oil for Other, Crude 1507.10.9000 5 5 5
Soybean Oil for Food, Refined 1507.90.1010 5 5 5
Soybean Oil For Biodiesel, Refined 1507.90.1020 5 5 5
Soybean Oil for Other, Refined 1507.90.1090 5 5 5
Soybean Oil, Other 1507.90.9000 5 8 8
Peanut Oil 1508.xx.xxxx 27 27 27
Olive Oil 1509.xx.xxxx 5 5 5
Palm Crude Oil 1511.10.0000 3 3 3
Palm Oil 1511.90.xxxx 2 2 2
Sunflower Oil 1512.1x.xxxx 5 5 5
Safflower Oil 1512.1x.xxxx 5 5 5
Cotton Seed Oil 1512.2x.xxxx 5 5 5
Coconut Oil 1513.1x.xxxx 3 3 3
Palm Kernel Oil 1513.2x.xxxx 8 8 8
Rapeseed Oil, Crude 1514.11.0000 5 5 5
Rapeseed Oil, Refined 1514.19.xxxx 5 5 5
Rapeseed Oil, Other, Crude 1514.91.1000 5 5 5
Linseed Oil 1515.1x.xxxx 5 5 5
Corn Oil 1515.2x.xxxx 5 5 5
Castor Oil 1515.30.xxxx 5 8 8
Tung Oil 1515.90.9040 8 8 8
Sesame Oil 1/
1515.50.0000 40 40 40
Perilla Seed Oil 1515.90.1000 36 36 36
Rice Bran Oil 1515.90.9010 5 5 5
Other, Crude 1515.90.9090 5 5 5 Source: Korea Customs Research Institute, Tariff Schedules for Korea
1/ In-Quota tariff rate under the WTO TRQ. Quota is 668 tons. The out-of-quota tariff rate is 630 percent or 12,060 Won/Kg, whichever is greater.

Recommended