1
Novel Method to Assess Antiretroviral Target Trough Concentrations Using In 1
Vitro Susceptibility Data 2
3
Edward P. Acosta1*, Kay L. Limoli2, Lan Trinh2, Neil T. Parkin3, Jennifer R. King1, 4
Jodi M. Weidler2, Ighovwerha Ofotokun4, and Christos J. Petropoulos2 5
6
1 Division of Clinical Pharmacology, University of Alabama at Birmingham School of 7
Medicine, Birmingham, AL; 8
2 Monogram Biosciences, Inc., South San Francisco, CA; 9
3 Data First Consulting Inc., Menlo Park, CA; 10
4 Emory University, Atlanta, GA. 11
12
*Corresponding author: 13
Edward P. Acosta, Pharm.D. 14
University of Alabama at Birmingham, School of Medicine 15
Division of Clinical Pharmacology, 1670 University Blvd., VH 258 16
Birmingham, AL 35294-0019 17
Phone: 205-934-2655 18
Fax: 205-934-6201 19
E-mail: [email protected] 20
Running title: Antiretroviral trough concentrations 21
22
Copyright © 2012, American Society for Microbiology. All Rights Reserved.Antimicrob. Agents Chemother. doi:10.1128/AAC.00691-12 AAC Accepts, published online ahead of print on 10 September 2012
on April 4, 2019 by guest
http://aac.asm.org/
Dow
nloaded from
2
ABSTRACT 23
Durable suppression of HIV-1 replication requires the establishment of antiretroviral 24
drug concentrations that exceed the susceptibility of the virus strain(s) infecting the 25
patient. Minimum plasma drug concentrations (Ctrough) are correlated with response, but 26
determination of target Ctrough values are hindered by a paucity of in vivo concentration-27
response data. In the absence of these data, in vitro susceptibility measurements, 28
adjusted for serum protein binding, can provide estimations of suppressive in vivo drug 29
concentrations. We derived serum protein binding correction factors (PBCF) for 30
protease inhibitors, non-nucleoside reverse transcriptase inhibitors, and an integrase 31
inhibitor by measuring the effect of a range of human serum concentrations on in vitro 32
drug susceptibility measured with the PhenoSense® HIV assay. PBCFs corresponding 33
to 100% HS were extrapolated using linear regression, and ranged from 1.4 for 34
nevirapine to 77 for nelfinavir. Using the mean 95% inhibitory concentration (IC95) of 35
≥1200 drug-susceptible viruses we calculated protein-bound IC95 (PBIC95) values. 36
PBIC95 values were concordant with the minimum effective Ctrough concentrations that 37
were established in well-designed pharmacodynamic studies (e.g. indinavir, saquinavir, 38
and amprenavir). In other cases, the PBIC95 values were notably lower (e.g. darunavir, 39
efavirenz and nevirapine) or higher (nelfinavir, etravirine) than existing target 40
recommendations. The establishment of PBIC95 values as described here provides a 41
convenient and standardized approach for estimating the minimum drug exposure that 42
is required to maintain viral suppression and prevent the emergence of drug resistant 43
variants, particularly when in vivo concentration-response relationships are lacking. 44
Keywords: HIV-1, susceptibility, protein binding, trough concentration.45
on April 4, 2019 by guest
http://aac.asm.org/
Dow
nloaded from
3
INTRODUCTION 46
Fully suppressive antiretroviral therapy (ART) for human immunodeficiency virus type 1 47
(HIV-1) infection requires the administration of drug combinations that target multiple 48
sites on one or more proteins required for viral replication. Approved antiretrovirals 49
(ARVs) include nucleoside/nucleotide and non-nucleoside reverse transcriptase 50
inhibitors (NRTIs and NNRTIs), protease inhibitors (PIs), entry inhibitors, and integrase 51
strand-transfer inhibitors (INSTIs). With the exception of the NRTIs, which require 52
intracellular phosphorylation, plasma drug concentrations are correlated with drug 53
efficacy. At the same time, high drug concentrations are associated with excess toxicity. 54
55
To durably suppress HIV replication in infected patients, ARV concentrations must 56
reach and be maintained at levels that exceed the susceptibility of the virus to that drug. 57
Treatment response is often hampered by the failure to achieve sufficient drug exposure 58
(i.e., poor adherence, drug interactions), reduced drug susceptibility (i.e. viral drug 59
resistance), or both. Drug concentrations within patients vary over time and, due to ease 60
of sampling, are generally characterized by minimum (trough) concentrations (Ctrough) 61
immediately prior to administration of the next scheduled dose. Drug concentrations 62
also vary considerably between individual patients as a result of differences in 63
absorption, distribution, metabolism, and excretion. In addition, each drug 64
characteristically binds to human plasma proteins to different extents. Furthermore, the 65
susceptibility of HIV-1 variants, even in patients not previously exposed to drug therapy, 66
varies over a range that is unique to each drug (23, 24, 47). 67
68
on April 4, 2019 by guest
http://aac.asm.org/
Dow
nloaded from
4
In vivo clinical pharmacodynamic data are available for some, but not all, ARVs. 69
Efficient collection of these data is difficult and ideally performed early in the drug 70
development process. Alternative methods of incorporating ARV pharmacokinetics into 71
therapeutic decision-making are being explored. In vitro phenotypic drug susceptibility 72
testing of individual patient viruses is now widely available, and generates information 73
that can be used to calculate an inhibitory quotient (IQ), defined as the ratio between 74
the Ctrough and the drug concentration that inhibits in vitro replication by a defined 75
percentage (e.g. IC50 or IC95) (27, 35, 44, 57). Derivatives of the IQ, including the 76
genotypic IQ (GIQ, or Ctrough divided by the number of resistance-associated mutations 77
for a given drug) have also been evaluated (36). Several studies have attempted to 78
define the optimal IQ required to produce long-term viral suppression; in some cases IQ 79
has been retrospectively linked to clinical outcome (15, 34, 42, 43, 56), while in others, 80
direct relationships between IQ and viral load response were not observed (5, 13). 81
82
For most ARV drugs, little to no in vivo concentration-response data have been 83
generated, or these data are inconsistent with clinical observations. Collectively, there is 84
insufficient agreement in the field regarding the determination of the optimal ARV target 85
trough concentrations in the absence of concentration-response data. We conducted 86
the current study to address this deficiency by: 1) assessing the activity of PIs, NNRTIs, 87
and an INSTI in a standardized in vitro phenotypic drug susceptibility assay 88
(PhenoSense® HIV, Monogram Biosciences) in the presence of human serum (HS), 2) 89
establishing drug specific serum protein binding correction factors (PBCFs), and 3) 90
on April 4, 2019 by guest
http://aac.asm.org/
Dow
nloaded from
5
approximating the optimum target trough concentrations for currently available PIs, 91
NNRTIs, and INSTIs. 92
93
METHODS 94
Determination of drug activity in the presence of human serum 95
The PhenoSense® HIV assay (Monogram Biosciences, South San Francisco, CA) was 96
performed as described (48) with the following modifications. For all PIs except 97
darunavir and atazanavir, each drug was prepared at 10 times the final concentration 98
using complete media containing 10% fetal bovine serum (FBS) without HS. Fifteen 99
microliters (µL) of the 10X drug stocks were mixed with 85 µL of complete media 100
containing 10% FBS and 0%, 25%, 50%, or 75% pooled HIV-negative HS, or 90% HS 101
plus 10% FBS, in 96-well plates. Fifty µL of trypsinized, transfected (virus-producing) 102
cells were added to the plates containing 100 µL drug and media, which had been re-103
suspended in the corresponding media (i.e. with or without HS at 25-90%). Thus the 104
concentration of HS present during virus particle formation was 22.5%, 45.0%, 67.5%, 105
or 81%; FBS was present at 10% for all conditions. Viral stocks were harvested 106
approximately 48 hours after transfection, and 100 µL was used to infect fresh 293 cell 107
cultures (target cells) that had been plated in a volume of 50 µL in media containing 108
10% FBS. During the period of time when darunavir and atazanavir were evaluated, 109
several modifications to the PhenoSense assay were implemented, resulting in subtle 110
differences in final HS concentrations compared to the procedure described above. 111
These changes resulted in final HS concentrations during virus production being 21.7%, 112
43.5%, 65.2%, or 76.5% during virus production. For the purposes of this report these 113
on April 4, 2019 by guest
http://aac.asm.org/
Dow
nloaded from
6
minor differences (3-6%) in final HS concentration was ignored during analysis. For 114
NNRTIs and raltegravir, virus produced in the presence of the same range in HS 115
concentrations as used for most of the PIs, but in the absence of drugs, was used, and 116
the drugs were added at the time of infection. Three lots of HS (Intergen, Purchase, NY) 117
were used during the course of these experiments. The HS contained an average of 118
0.77 mg/mL alpha-1 acid glycoprotein, and 44.6 mg/mL albumin. This level of alpha-1 119
acid glycoprotein is consistent with values previously reported in HIV-negative subjects 120
(29). 121
122
Approximately 72 hours after infection, target cells were lysed and luciferase activity 123
was measured to assess virus replication in the presence or absence of drugs at each 124
concentration of HS. IC50 and IC95 values were determined as described (48). Between 125
2 and 32 (mean = 8.5) replicates of susceptibility assays were performed for each virus, 126
using either a drug sensitive reference virus (NL4-3) or a well-characterized multi-drug 127
resistant virus (MDRC-4) that exhibits reduced susceptibility to all licensed reverse 128
transcriptase and protease inhibitors. 129
130
Calculation of Protein Binding Correction Factors and Target Trough Concentrations 131
A PBCF corresponding to 45% HS was defined as the fold-increase in experimentally 132
determined IC50 in the presence of 45% HS compared to normal complete medium 133
(10% FBS). The PBCF was calculated within each batch, then averaged across 134
replicates from multiple batches. The PBCF for 100% HS was derived by linear 135
regression analysis (Prism 5.0, GraphPad, San Diego, CA) based on fold-changes in 136
on April 4, 2019 by guest
http://aac.asm.org/
Dow
nloaded from
7
IC50 in the presence of 22.5%, 45.0%, 67.5%, or 81% HS vs. 0% HS; the PBCF was 137
extrapolated from the Y-intercept when X = 100. R-squared values for the linear 138
regression (log10[IC50] vs. % HS) were between 0.82 and 0.99, except for SQV (0.59) 139
and TPV (0.61). Second and third-order polynomial fitting was inferior for all drugs (data 140
not shown). 141
142
Mean IC50 and IC95 values of wild-type viruses for each drug were derived from the 143
susceptibility measurements of clinical isolates tested between 2009-2010, as compiled 144
in the Monogram Biosciences database. An isolate was defined as wild type in protease 145
(PR) and reverse transcriptase (RT) if drug-selected mutations in PR and RT as 146
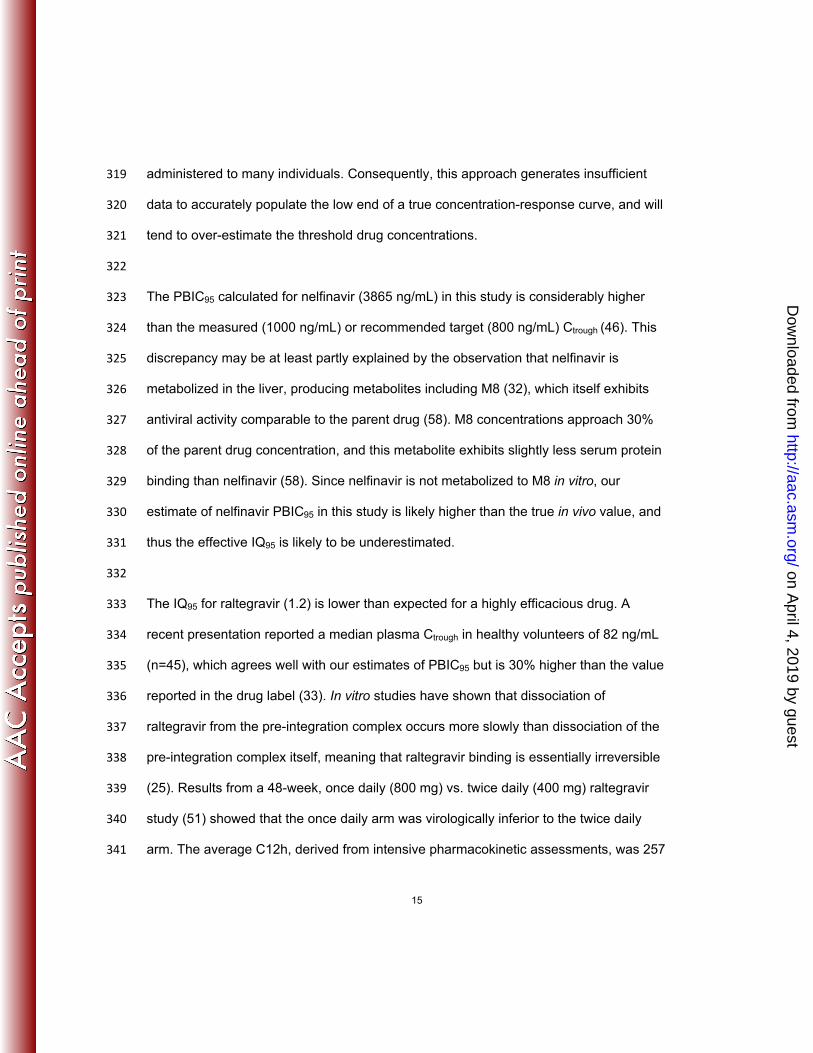
previously described (47) were not detected (N=6,537). For raltegravir, drug selected 147
mutations were defined as any change from the wild-type subtype B amino acid 148
sequence at the following positions: H51, T66, E92, F121, G140, Y143, Q146, S147, 149
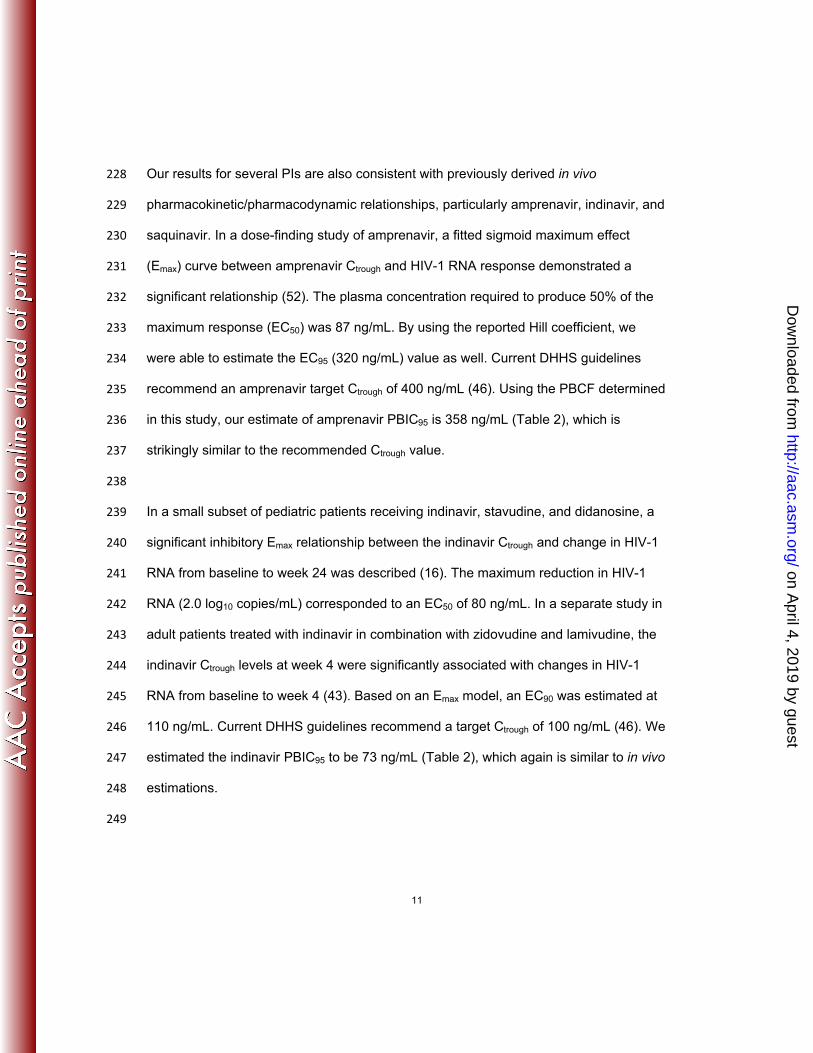
Q148, S153, N155, and R263 (N=1200). The PR and RT genotypes of these viruses 150
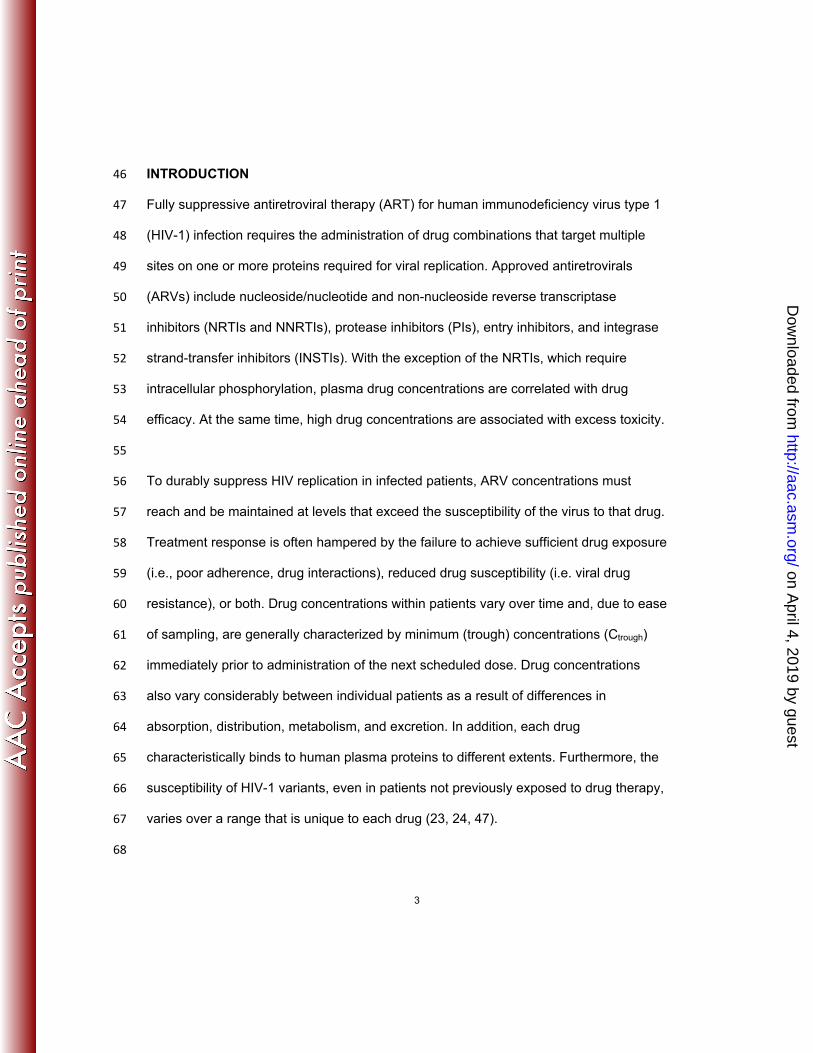
were not available. The protein-bound IC50 or IC95 values (PBIC50 or PBIC95, 151
respectively) were computed by multiplying the mean IC50 or IC95 values by the 152
corresponding PBCF for each drug. All Ctrough values except that for raltegravir are 153
derived from the individual drug manufacturers’ prescribing information (1-3, 6-9, 17, 19, 154
38, 54, 55). The Ctrough for raltegravir was taken from the intensive PK profiles of 155
patients treated with raltegravir twice daily in the QDMRK study (51). 156
157
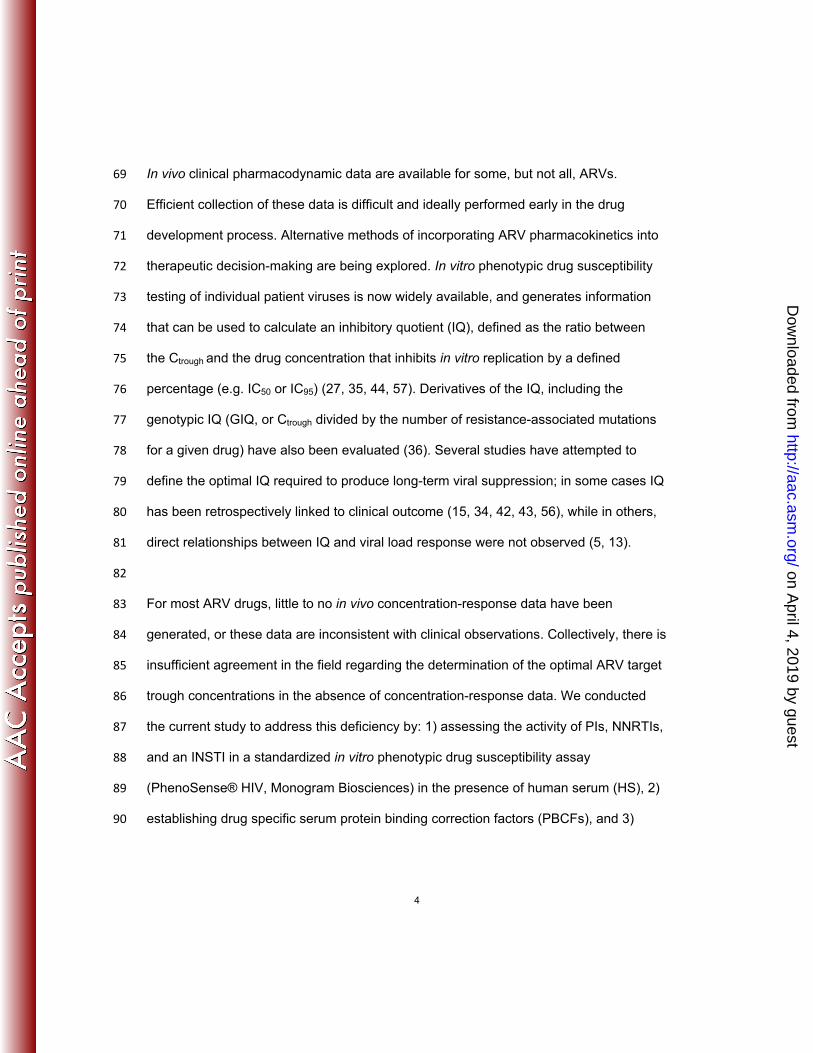
RESULTS 158
on April 4, 2019 by guest
http://aac.asm.org/
Dow
nloaded from
8
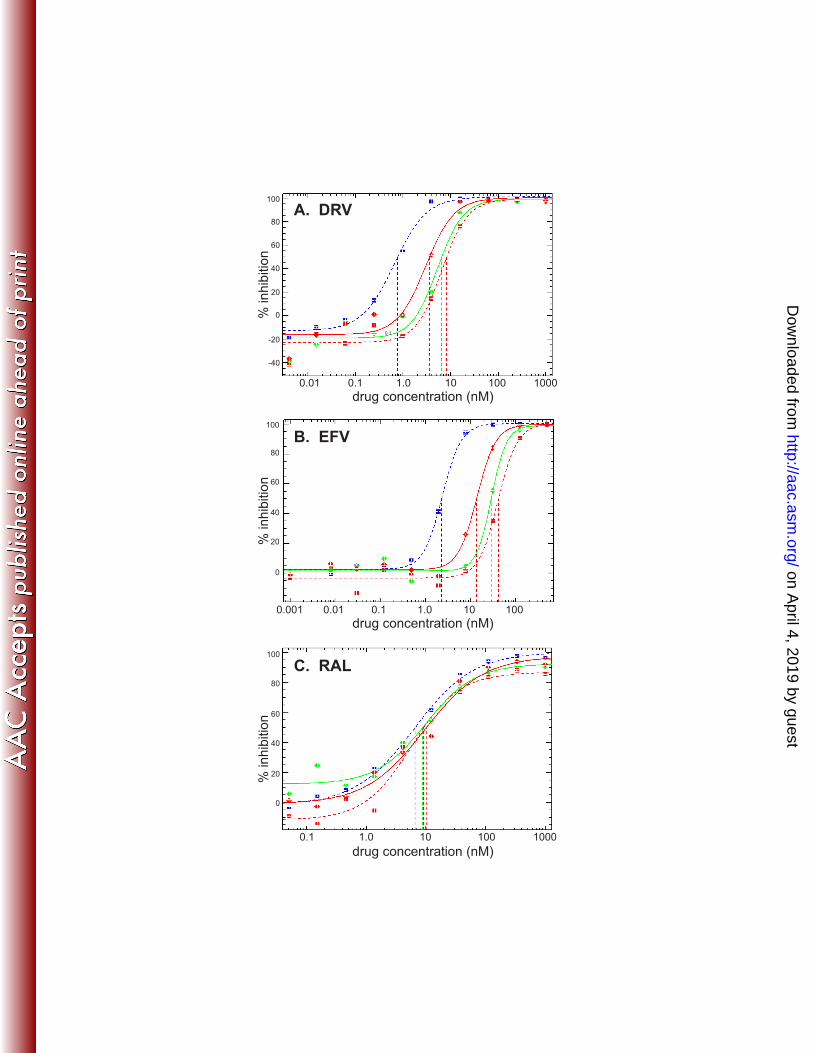
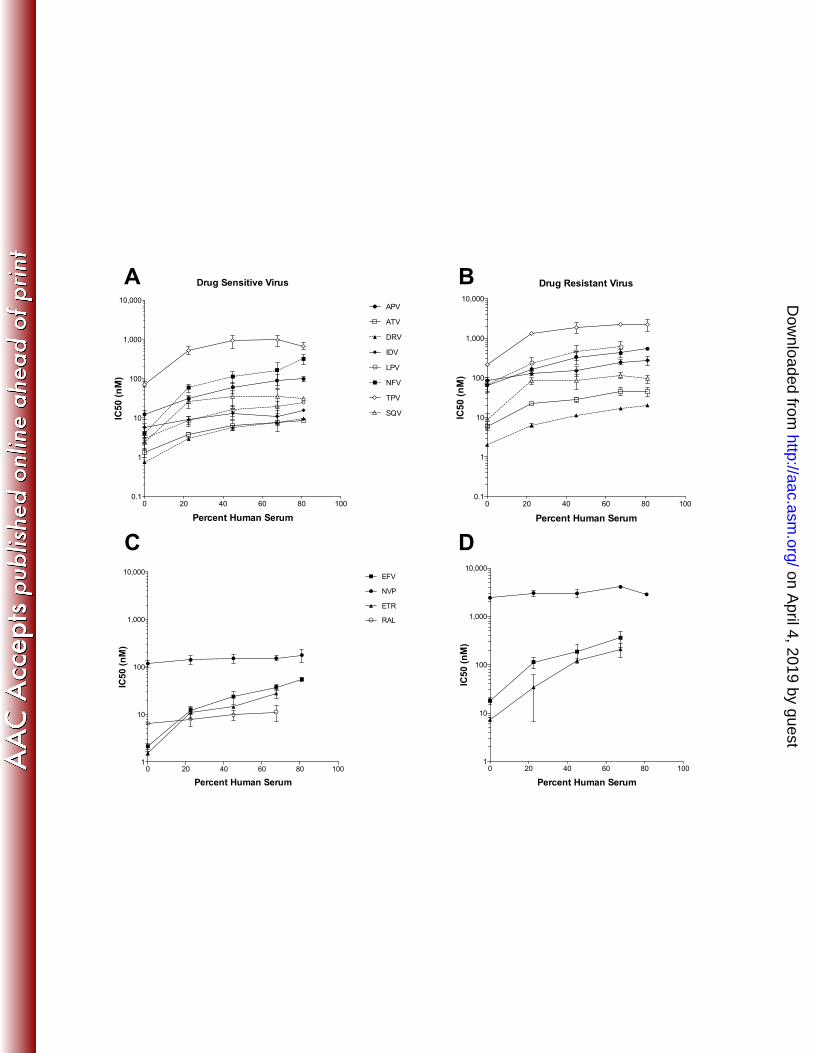
Drug susceptibility was determined using the PhenoSense assay (48) under standard 159
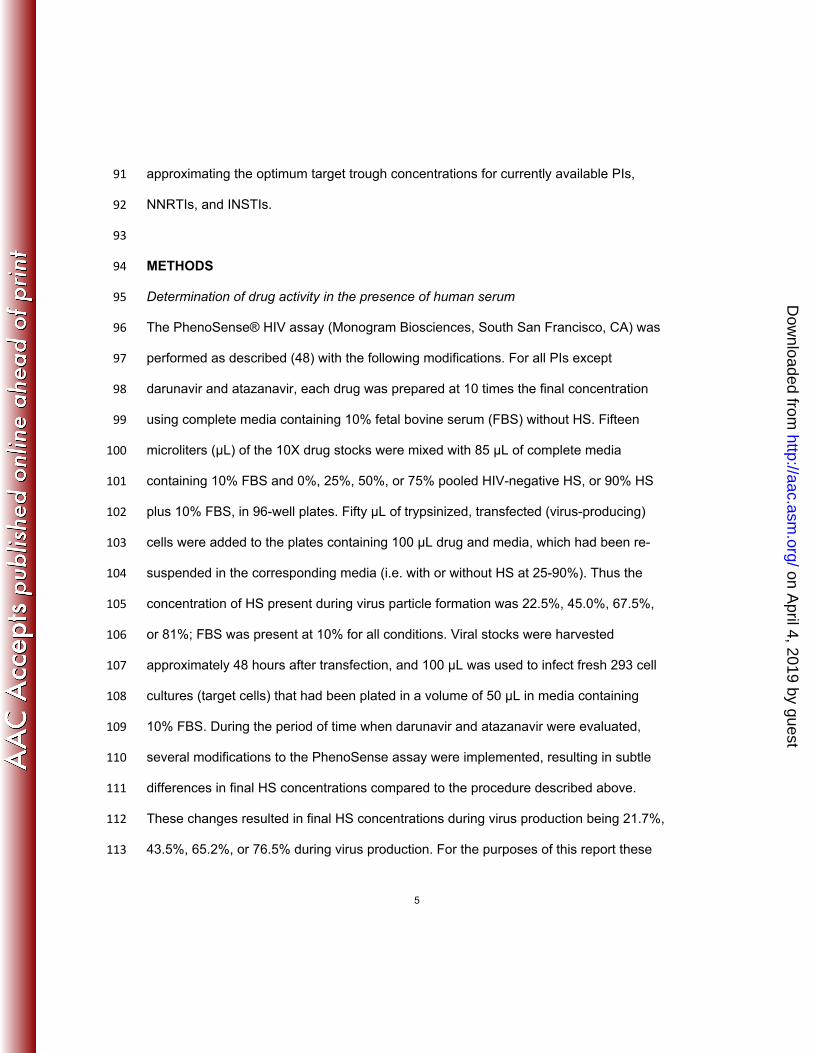
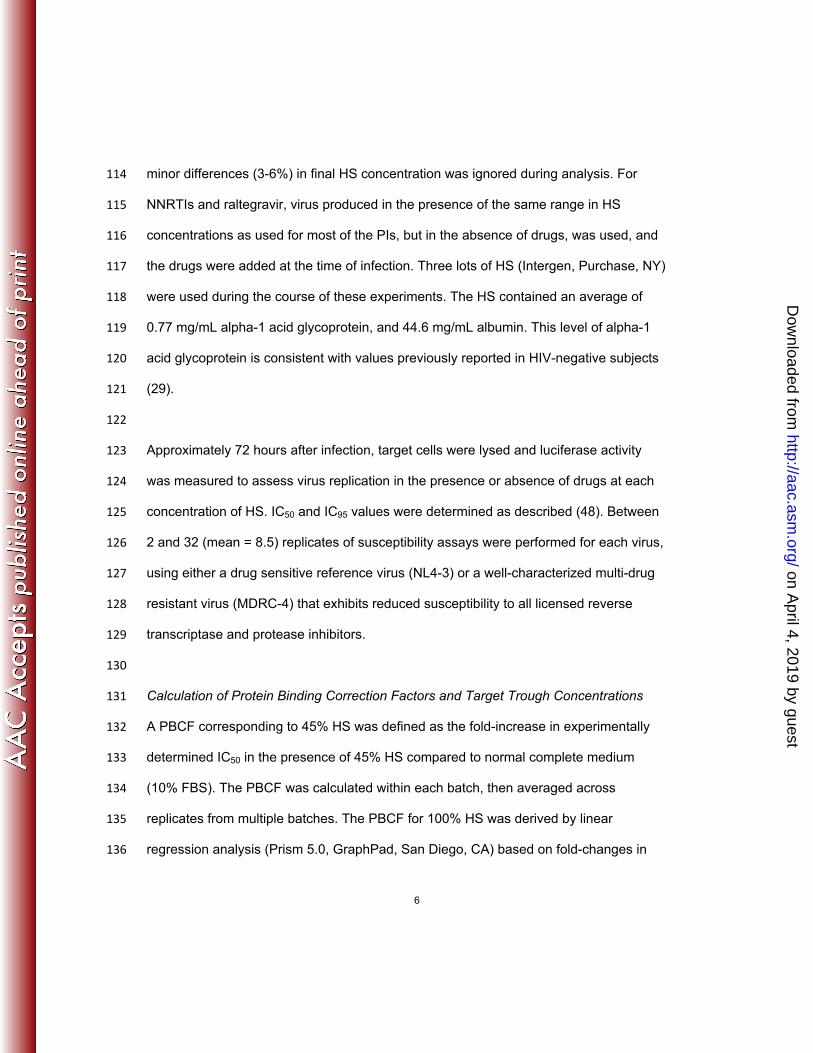
conditions (10% FBS) and in the presence of 23 to 81% HS. In some cases, because of 160
the cytostatic effects of HS on cultured cells, infectivity (i.e. luciferase signal) was too 161
low to accurately determine the IC50 at 81% HS. Assays were performed using a drug 162
susceptible reference virus (NL4-3) and a well-characterized multi-drug resistant 163
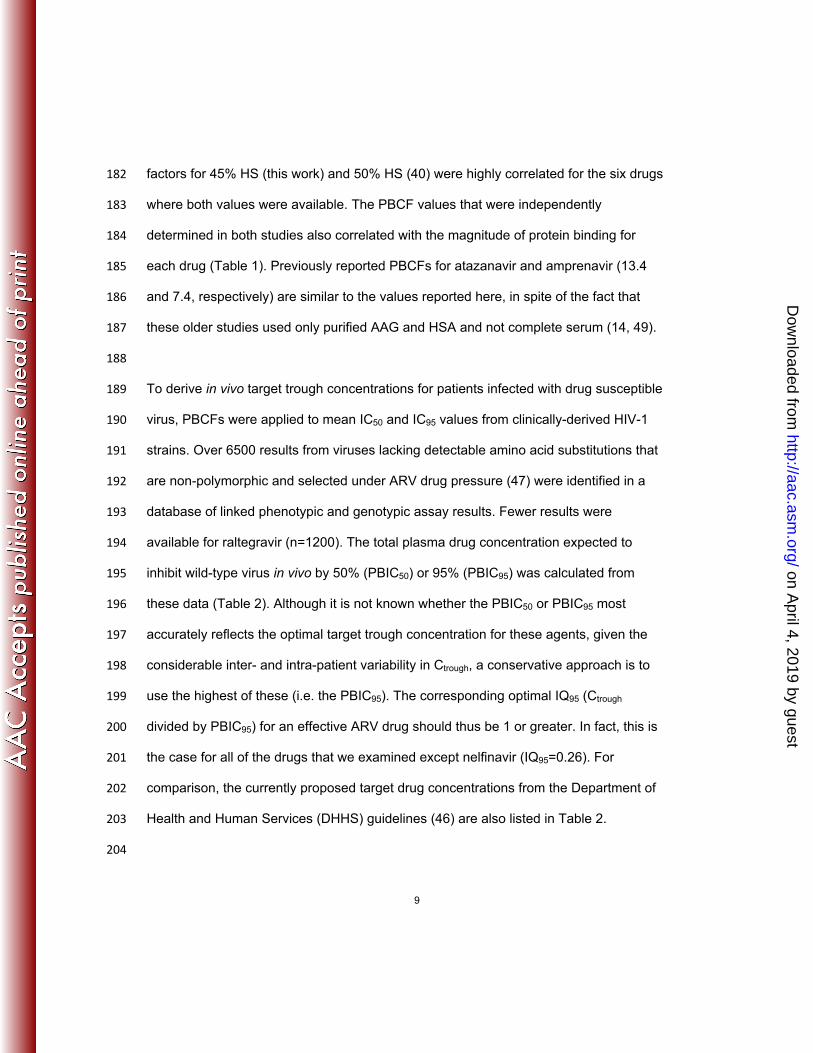
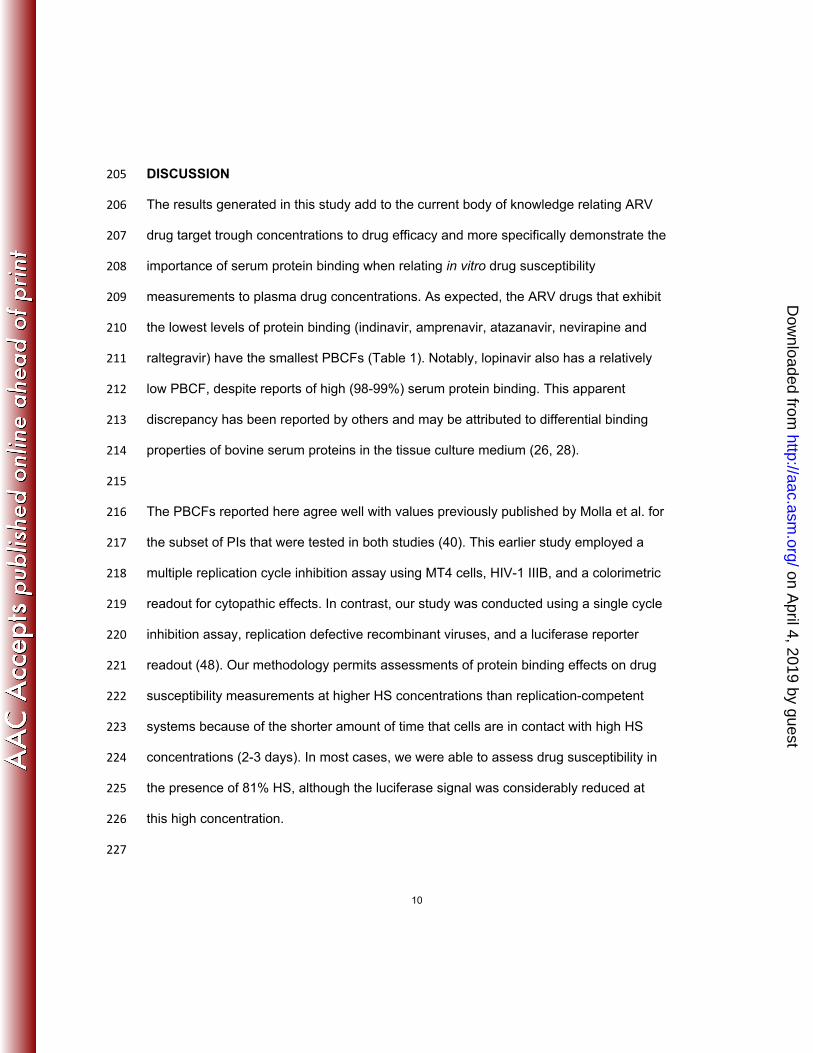
reference virus (MDRC-4). Representative inhibition curves generated using NL4-3 are 164
shown in Figure 1 for a PI (darunavir, Fig. 1A), NNRTI (efavirenz, Fig. 1B), and INSTI 165
(raltegravir, Fig. 1C). IC50 values of all drugs for both the drug-susceptible and resistant 166
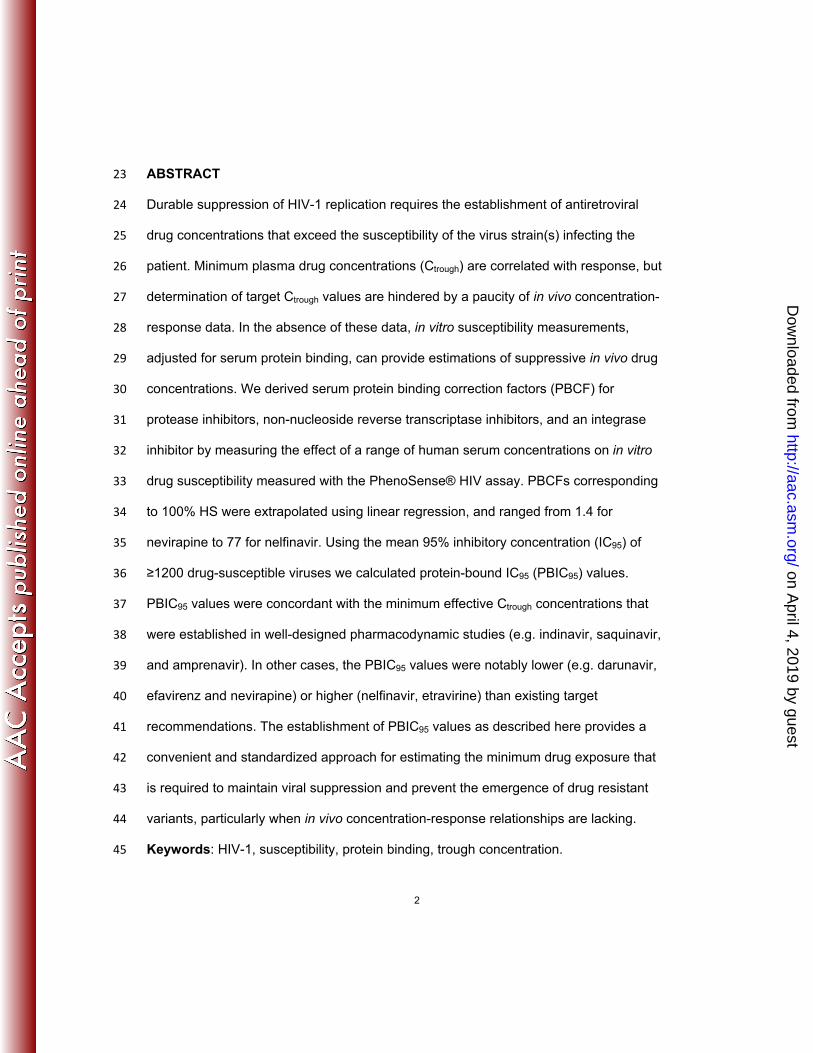
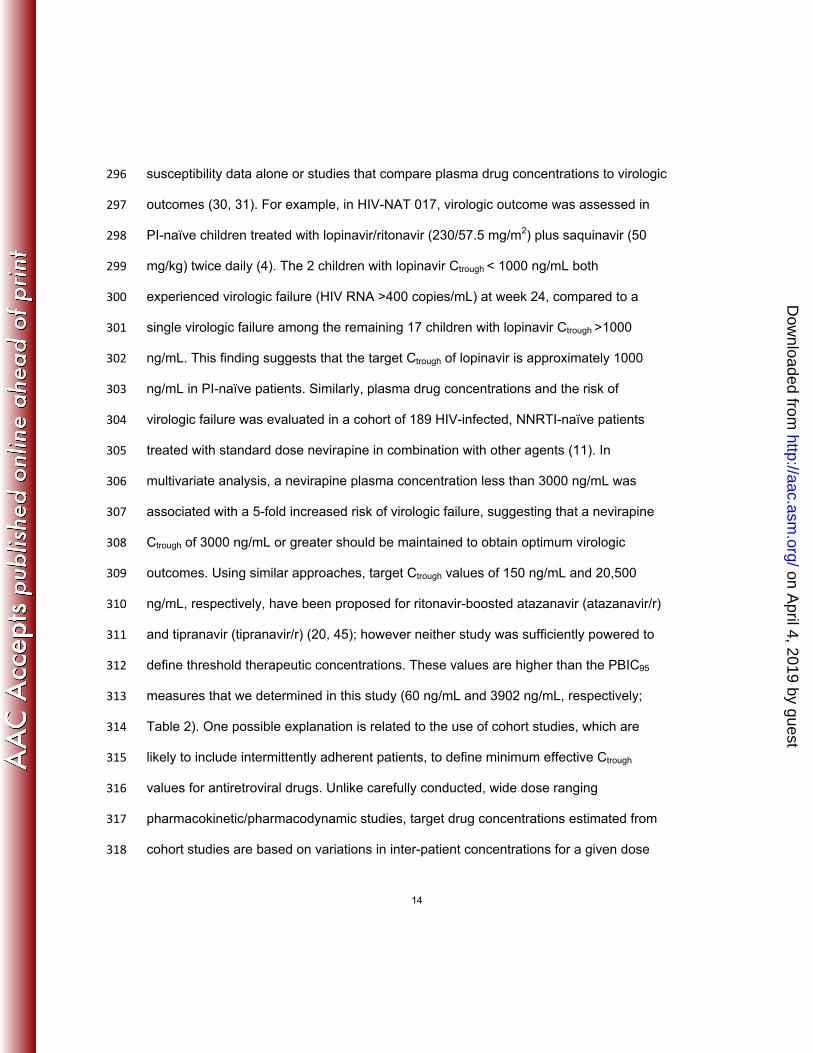
viruses at increasing HS concentrations are plotted in Figure 2. As expected, the 167
inhibition curves (Figure 1) shifted toward higher drug concentrations (i.e. to the right) 168
as the percentage of HS increased, although the magnitude of this shift was specific for 169
each drug. For example, the IC50 for saquinavir and tipranavir between 23 and 81% HS 170
remained relatively constant, while the IC50 for most other drugs increased 171
incrementally. Since the relationship between IC50 and HS concentration for most drugs 172
was fairly linear between 23 and 81% HS, the IC50 at 100% HS was estimated using 173
linear regression. 174
175
The ratio between the estimated IC50 at 100% HS (mimicking the in vivo situation) and 176
the IC50 under standard in vitro conditions is referred to as the PBCF. A PBCF for 45% 177
HS can also be calculated using the experimental data. Table 1 lists the PBCF values 178
for 100% HS and 45% HS derived here, along with the 50% HS correction factors 179
derived in a previous study (40), as well as estimations of protein binding derived from 180
in vitro biochemistry studies as reported by the various drug manufacturers. Correction 181
on April 4, 2019 by guest
http://aac.asm.org/
Dow
nloaded from
9
factors for 45% HS (this work) and 50% HS (40) were highly correlated for the six drugs 182
where both values were available. The PBCF values that were independently 183
determined in both studies also correlated with the magnitude of protein binding for 184
each drug (Table 1). Previously reported PBCFs for atazanavir and amprenavir (13.4 185
and 7.4, respectively) are similar to the values reported here, in spite of the fact that 186
these older studies used only purified AAG and HSA and not complete serum (14, 49). 187
188
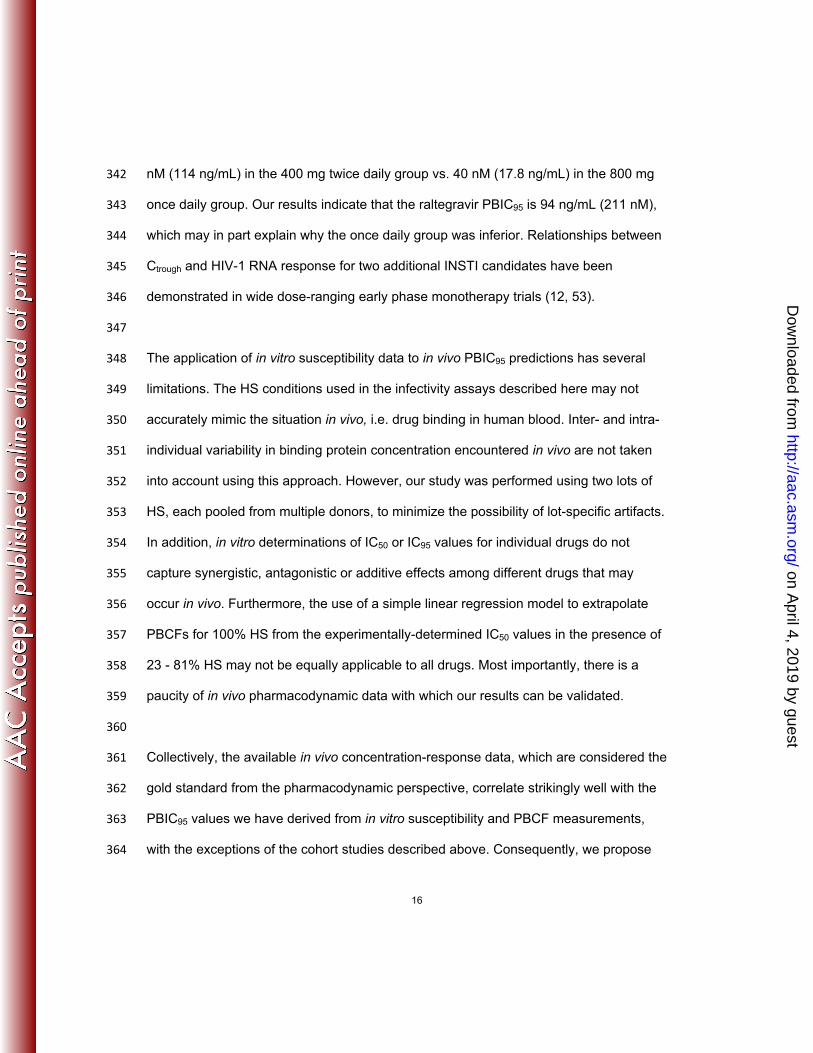
To derive in vivo target trough concentrations for patients infected with drug susceptible 189
virus, PBCFs were applied to mean IC50 and IC95 values from clinically-derived HIV-1 190
strains. Over 6500 results from viruses lacking detectable amino acid substitutions that 191
are non-polymorphic and selected under ARV drug pressure (47) were identified in a 192
database of linked phenotypic and genotypic assay results. Fewer results were 193
available for raltegravir (n=1200). The total plasma drug concentration expected to 194
inhibit wild-type virus in vivo by 50% (PBIC50) or 95% (PBIC95) was calculated from 195
these data (Table 2). Although it is not known whether the PBIC50 or PBIC95 most 196
accurately reflects the optimal target trough concentration for these agents, given the 197
considerable inter- and intra-patient variability in Ctrough, a conservative approach is to 198
use the highest of these (i.e. the PBIC95). The corresponding optimal IQ95 (Ctrough 199
divided by PBIC95) for an effective ARV drug should thus be 1 or greater. In fact, this is 200
the case for all of the drugs that we examined except nelfinavir (IQ95=0.26). For 201
comparison, the currently proposed target drug concentrations from the Department of 202
Health and Human Services (DHHS) guidelines (46) are also listed in Table 2. 203
204
on April 4, 2019 by guest
http://aac.asm.org/
Dow
nloaded from
10
DISCUSSION 205
The results generated in this study add to the current body of knowledge relating ARV 206
drug target trough concentrations to drug efficacy and more specifically demonstrate the 207
importance of serum protein binding when relating in vitro drug susceptibility 208
measurements to plasma drug concentrations. As expected, the ARV drugs that exhibit 209
the lowest levels of protein binding (indinavir, amprenavir, atazanavir, nevirapine and 210
raltegravir) have the smallest PBCFs (Table 1). Notably, lopinavir also has a relatively 211
low PBCF, despite reports of high (98-99%) serum protein binding. This apparent 212
discrepancy has been reported by others and may be attributed to differential binding 213
properties of bovine serum proteins in the tissue culture medium (26, 28). 214
215
The PBCFs reported here agree well with values previously published by Molla et al. for 216
the subset of PIs that were tested in both studies (40). This earlier study employed a 217
multiple replication cycle inhibition assay using MT4 cells, HIV-1 IIIB, and a colorimetric 218
readout for cytopathic effects. In contrast, our study was conducted using a single cycle 219
inhibition assay, replication defective recombinant viruses, and a luciferase reporter 220
readout (48). Our methodology permits assessments of protein binding effects on drug 221
susceptibility measurements at higher HS concentrations than replication-competent 222
systems because of the shorter amount of time that cells are in contact with high HS 223
concentrations (2-3 days). In most cases, we were able to assess drug susceptibility in 224
the presence of 81% HS, although the luciferase signal was considerably reduced at 225
this high concentration. 226
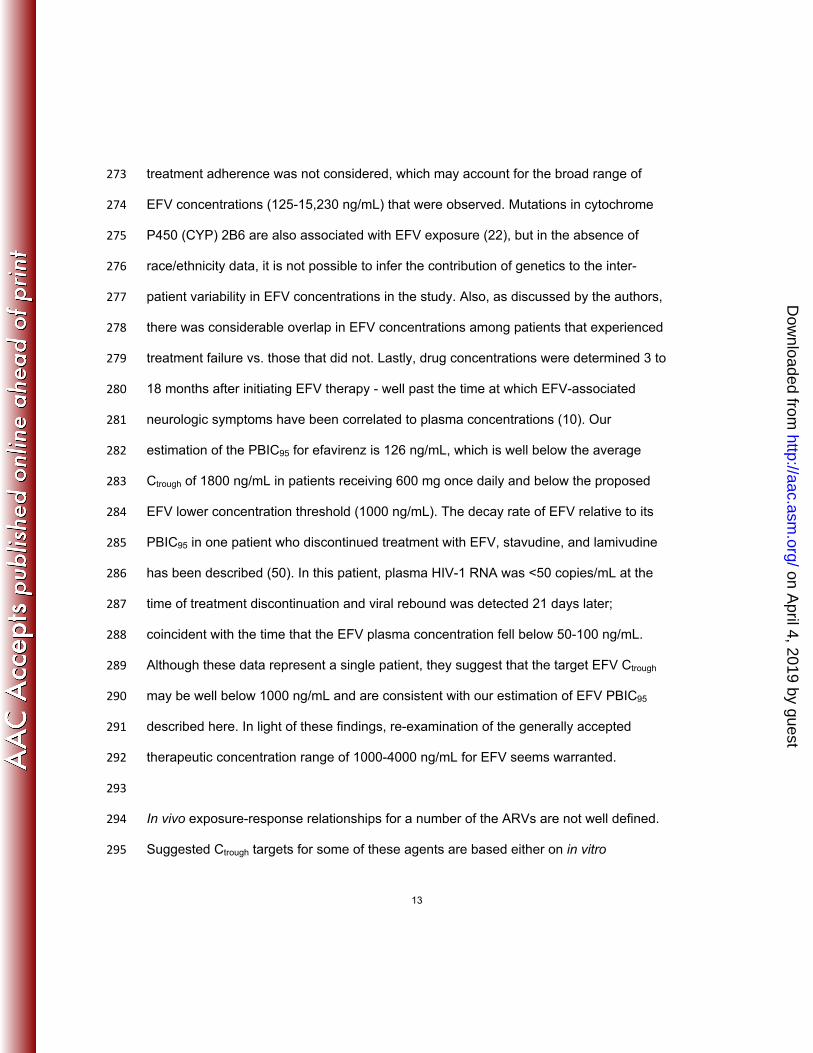
227
on April 4, 2019 by guest
http://aac.asm.org/
Dow
nloaded from
11
Our results for several PIs are also consistent with previously derived in vivo 228
pharmacokinetic/pharmacodynamic relationships, particularly amprenavir, indinavir, and 229
saquinavir. In a dose-finding study of amprenavir, a fitted sigmoid maximum effect 230
(Emax) curve between amprenavir Ctrough and HIV-1 RNA response demonstrated a 231
significant relationship (52). The plasma concentration required to produce 50% of the 232
maximum response (EC50) was 87 ng/mL. By using the reported Hill coefficient, we 233
were able to estimate the EC95 (320 ng/mL) value as well. Current DHHS guidelines 234
recommend an amprenavir target Ctrough of 400 ng/mL (46). Using the PBCF determined 235
in this study, our estimate of amprenavir PBIC95 is 358 ng/mL (Table 2), which is 236
strikingly similar to the recommended Ctrough value. 237
238
In a small subset of pediatric patients receiving indinavir, stavudine, and didanosine, a 239
significant inhibitory Emax relationship between the indinavir Ctrough and change in HIV-1 240
RNA from baseline to week 24 was described (16). The maximum reduction in HIV-1 241
RNA (2.0 log10 copies/mL) corresponded to an EC50 of 80 ng/mL. In a separate study in 242
adult patients treated with indinavir in combination with zidovudine and lamivudine, the 243
indinavir Ctrough levels at week 4 were significantly associated with changes in HIV-1 244
RNA from baseline to week 4 (43). Based on an Emax model, an EC90 was estimated at 245
110 ng/mL. Current DHHS guidelines recommend a target Ctrough of 100 ng/mL (46). We 246
estimated the indinavir PBIC95 to be 73 ng/mL (Table 2), which again is similar to in vivo 247
estimations. 248
249
on April 4, 2019 by guest
http://aac.asm.org/
Dow
nloaded from
12
A significant correlation between saquinavir Ctrough and sustained viral load suppression 250
has been observed in children (21). The minimum mean saquinavir Ctrough associated 251
with durable viral load suppression was 200 ng/mL. Additional support for this target 252
comes from the modeling of saquinavir pharmacokinetics/pharmacodynamics following 253
saquinavir monotherapy in HIV-positive patients (18). Following administration of 1200 254
mg saquinavir three times daily (soft gel formulation), both area-under-the-curve (AUC) 255
and Ctrough measures were related to peak reduction in plasma HIV-1 RNA. The median 256
24 hour AUC (AUC24) was 20 µgxh/mL, which corresponded to 85% of the maximum 257
effect (EC85); the Ctrough at this dose was 216 ng/mL (18). Current DHHS guidelines 258
recommend a target Ctrough of 100 to 250 ng/mL (46). We calculated the saquinavir 259
PBIC95 to be 234 ng/mL (Table 2), which is highly concordant with clinically established 260
values. 261
262
There is controversy regarding the optimum Ctrough for efavirenz. The reported 263
therapeutic range (lower to upper exposure targets) for efavirenz is 1,000 to 4,000 264
ng/mL (37). These data come from a study that explored the relationships of EFV 265
exposure with efficacy and development of central nervous system (CNS) side effects. 266
Since the discordance between this pharmacodynamic study and our in vitro results is 267
considerable, it is worth noting that this was an exploratory field trial where all patients 268
received the same EFV dose and not a well-controlled, broad dose-ranging study. In 269
addition, EFV concentrations were determined using blood samples that were collected 270
on average 14 hours post-dosing (range of 8-20 hours). Although EFV has a relatively 271
long half-life, actual Ctrough values were not determined or estimated. Furthermore, 272
on April 4, 2019 by guest
http://aac.asm.org/
Dow
nloaded from
13
treatment adherence was not considered, which may account for the broad range of 273
EFV concentrations (125-15,230 ng/mL) that were observed. Mutations in cytochrome 274
P450 (CYP) 2B6 are also associated with EFV exposure (22), but in the absence of 275
race/ethnicity data, it is not possible to infer the contribution of genetics to the inter-276
patient variability in EFV concentrations in the study. Also, as discussed by the authors, 277
there was considerable overlap in EFV concentrations among patients that experienced 278
treatment failure vs. those that did not. Lastly, drug concentrations were determined 3 to 279
18 months after initiating EFV therapy - well past the time at which EFV-associated 280
neurologic symptoms have been correlated to plasma concentrations (10). Our 281
estimation of the PBIC95 for efavirenz is 126 ng/mL, which is well below the average 282
Ctrough of 1800 ng/mL in patients receiving 600 mg once daily and below the proposed 283
EFV lower concentration threshold (1000 ng/mL). The decay rate of EFV relative to its 284
PBIC95 in one patient who discontinued treatment with EFV, stavudine, and lamivudine 285
has been described (50). In this patient, plasma HIV-1 RNA was <50 copies/mL at the 286
time of treatment discontinuation and viral rebound was detected 21 days later; 287
coincident with the time that the EFV plasma concentration fell below 50-100 ng/mL. 288
Although these data represent a single patient, they suggest that the target EFV Ctrough 289
may be well below 1000 ng/mL and are consistent with our estimation of EFV PBIC95 290
described here. In light of these findings, re-examination of the generally accepted 291
therapeutic concentration range of 1000-4000 ng/mL for EFV seems warranted. 292
293
In vivo exposure-response relationships for a number of the ARVs are not well defined. 294
Suggested Ctrough targets for some of these agents are based either on in vitro 295
on April 4, 2019 by guest
http://aac.asm.org/
Dow
nloaded from
14
susceptibility data alone or studies that compare plasma drug concentrations to virologic 296
outcomes (30, 31). For example, in HIV-NAT 017, virologic outcome was assessed in 297
PI-naïve children treated with lopinavir/ritonavir (230/57.5 mg/m2) plus saquinavir (50 298
mg/kg) twice daily (4). The 2 children with lopinavir Ctrough < 1000 ng/mL both 299
experienced virologic failure (HIV RNA >400 copies/mL) at week 24, compared to a 300
single virologic failure among the remaining 17 children with lopinavir Ctrough >1000 301
ng/mL. This finding suggests that the target Ctrough of lopinavir is approximately 1000 302
ng/mL in PI-naïve patients. Similarly, plasma drug concentrations and the risk of 303
virologic failure was evaluated in a cohort of 189 HIV-infected, NNRTI-naïve patients 304
treated with standard dose nevirapine in combination with other agents (11). In 305
multivariate analysis, a nevirapine plasma concentration less than 3000 ng/mL was 306
associated with a 5-fold increased risk of virologic failure, suggesting that a nevirapine 307
Ctrough of 3000 ng/mL or greater should be maintained to obtain optimum virologic 308
outcomes. Using similar approaches, target Ctrough values of 150 ng/mL and 20,500 309
ng/mL, respectively, have been proposed for ritonavir-boosted atazanavir (atazanavir/r) 310
and tipranavir (tipranavir/r) (20, 45); however neither study was sufficiently powered to 311
define threshold therapeutic concentrations. These values are higher than the PBIC95 312
measures that we determined in this study (60 ng/mL and 3902 ng/mL, respectively; 313
Table 2). One possible explanation is related to the use of cohort studies, which are 314
likely to include intermittently adherent patients, to define minimum effective Ctrough 315
values for antiretroviral drugs. Unlike carefully conducted, wide dose ranging 316
pharmacokinetic/pharmacodynamic studies, target drug concentrations estimated from 317
cohort studies are based on variations in inter-patient concentrations for a given dose 318
on April 4, 2019 by guest
http://aac.asm.org/
Dow
nloaded from
15
administered to many individuals. Consequently, this approach generates insufficient 319
data to accurately populate the low end of a true concentration-response curve, and will 320
tend to over-estimate the threshold drug concentrations. 321
322
The PBIC95 calculated for nelfinavir (3865 ng/mL) in this study is considerably higher 323
than the measured (1000 ng/mL) or recommended target (800 ng/mL) Ctrough (46). This 324
discrepancy may be at least partly explained by the observation that nelfinavir is 325
metabolized in the liver, producing metabolites including M8 (32), which itself exhibits 326
antiviral activity comparable to the parent drug (58). M8 concentrations approach 30% 327
of the parent drug concentration, and this metabolite exhibits slightly less serum protein 328
binding than nelfinavir (58). Since nelfinavir is not metabolized to M8 in vitro, our 329
estimate of nelfinavir PBIC95 in this study is likely higher than the true in vivo value, and 330
thus the effective IQ95 is likely to be underestimated. 331
332
The IQ95 for raltegravir (1.2) is lower than expected for a highly efficacious drug. A 333
recent presentation reported a median plasma Ctrough in healthy volunteers of 82 ng/mL 334
(n=45), which agrees well with our estimates of PBIC95 but is 30% higher than the value 335
reported in the drug label (33). In vitro studies have shown that dissociation of 336
raltegravir from the pre-integration complex occurs more slowly than dissociation of the 337
pre-integration complex itself, meaning that raltegravir binding is essentially irreversible 338
(25). Results from a 48-week, once daily (800 mg) vs. twice daily (400 mg) raltegravir 339
study (51) showed that the once daily arm was virologically inferior to the twice daily 340
arm. The average C12h, derived from intensive pharmacokinetic assessments, was 257 341
on April 4, 2019 by guest
http://aac.asm.org/
Dow
nloaded from
16
nM (114 ng/mL) in the 400 mg twice daily group vs. 40 nM (17.8 ng/mL) in the 800 mg 342
once daily group. Our results indicate that the raltegravir PBIC95 is 94 ng/mL (211 nM), 343
which may in part explain why the once daily group was inferior. Relationships between 344
Ctrough and HIV-1 RNA response for two additional INSTI candidates have been 345
demonstrated in wide dose-ranging early phase monotherapy trials (12, 53). 346
347
The application of in vitro susceptibility data to in vivo PBIC95 predictions has several 348
limitations. The HS conditions used in the infectivity assays described here may not 349
accurately mimic the situation in vivo, i.e. drug binding in human blood. Inter- and intra-350
individual variability in binding protein concentration encountered in vivo are not taken 351
into account using this approach. However, our study was performed using two lots of 352
HS, each pooled from multiple donors, to minimize the possibility of lot-specific artifacts. 353
In addition, in vitro determinations of IC50 or IC95 values for individual drugs do not 354
capture synergistic, antagonistic or additive effects among different drugs that may 355
occur in vivo. Furthermore, the use of a simple linear regression model to extrapolate 356
PBCFs for 100% HS from the experimentally-determined IC50 values in the presence of 357
23 - 81% HS may not be equally applicable to all drugs. Most importantly, there is a 358
paucity of in vivo pharmacodynamic data with which our results can be validated. 359
360
Collectively, the available in vivo concentration-response data, which are considered the 361
gold standard from the pharmacodynamic perspective, correlate strikingly well with the 362
PBIC95 values we have derived from in vitro susceptibility and PBCF measurements, 363
with the exceptions of the cohort studies described above. Consequently, we propose 364
on April 4, 2019 by guest
http://aac.asm.org/
Dow
nloaded from
17
that this parameter is an appropriate surrogate measure of target Ctrough for antiretroviral 365
drugs (excluding those that require intracellular activity, i.e. NRTI) in lieu of formal early-366
phase pharmacodynamic assessments. Ideally, concentration-response relationships 367
for ARV drugs should be defined early in the development process. Phase III trials (or 368
Phase IV post-marketing studies) are not the appropriate time to define drug target 369
concentrations because their design requires that all participants either receive one 370
given dosage or one of several dosages within a narrow range. Late Phase I or early 371
Phase II trials should incorporate wide dose-finding designs encompassing dosages 372
that exceed 10-fold differences (preferably larger) in order to adequately populate 373
concentration-response curves. In the absence of clearly defined concentration-374
response relationships, identifying precise target drug exposure is not possible. 375
376
The derivation of PBCFs that can be applied to IC50 data generated by routine 377
phenotypic assays such as PhenoSense HIV also provides a useful way to relate these 378
in vitro concentrations to total in vivo drug exposure for applications including 379
therapeutic drug monitoring and calculation of IQ values for viruses with reduced drug 380
susceptibility. 381
382
on April 4, 2019 by guest
http://aac.asm.org/
Dow
nloaded from
18
ACKNOWLEDGMENTS 383
We gratefully acknowledge the contributions of the Monogram Clinical Reference 384
Laboratory for performing PhenoSense and GeneSeq assays, and Mojgan Haddad 385
(Monogram Biosciences) for assistance with retrieval of IC50 and IC95 data from the 386
Monogram database and regression analysis. Development of the Monogram 387
PhenoSense and GeneSeq Integrase assays was supported by a grant from the 388
NIH/NIAID, SBIR-AT 5 R44 AI057074. EA is the recipient of NIH grant R01 AI05869. 389
390
on April 4, 2019 by guest
http://aac.asm.org/
Dow
nloaded from
19
REFERENCES 391
1. Abbott. 2010. KALETRA (lopinavir/ritonavir) tablets and oral solution: Highlights of 392
Prescribing Information. Abbott, North Chicago, IL. 393
2. Abbott. 2010. NORVIR (ritonavir) tablets and oral solution: Highlights of Prescribing 394
Information. Abbott, North Chicago, IL. 395
3. Agouron. 2010. VIRACEPT (nelfinavir mesylate) tablets and oral powder: Prescribing 396
Information. Agouron, La Jolla, CA. 397
4. Ananworanich, J., P. Kosalaraksa, A. Hill, U. Siangphoe, A. Bergshoeff, C. Pancharoen, 398
C. Engchanil, K. Ruxrungtham, and D. Burger. 2005. Pharmacokinetics and 24-week 399
efficacy/safety of dual boosted saquinavir/lopinavir/ritonavir in nucleoside-pretreated 400
children. Pediatr Infect Dis J 24:874-9. 401
5. Barrail-Tran, A., L. Morand-Joubert, G. Poizat, G. Raguin, C. Le Tiec, F. Clavel, E. Dam, 402
G. Chene, P. M. Girard, and A. M. Taburet. 2008. Predictive values of the human 403
immunodeficiency virus phenotype and genotype and of amprenavir and lopinavir 404
inhibitory quotients in heavily pretreated patients on a ritonavir-boosted dual-protease-405
inhibitor regimen. Antimicrob Agents Chemother 52:1642-6. 406
6. Boehringer-Ingelheim. 2010. APTIVUS (tipranavir) tablets and oral solution: Highlights 407
of Prescribing Information. Boehringer-Ingelheim, Ridgefield, CT. 408
7. Boehringer-Ingelheim. 2010. Viramune (nevirapine) tablets and oral suspension: 409
Highlights of Prescribing Information. Boehringer-Ingelheim, Ridgefield, CT. 410
8. Bristol-Myers Squibb. 2010. REYATAZ (atazanavir sulfate) Capsules: Highlights of 411
Prescribing Information. Bristol-Myers Squibb, Princeton, NJ. 412
9. Bristol-Myers Squibb. 2010. SUSTIVA (efavirenz) capsules and tablets: Highlights of 413
Prescribing Information. Bristol-Myers Squibb, Princeton, NJ. 414
10. Clifford, D. B., S. Evans, Y. Yang, E. P. Acosta, K. Goodkin, K. Tashima, D. Simpson, D. 415
Dorfman, H. Ribaudo, and R. M. Gulick. 2005. Impact of efavirenz on 416
neuropsychological performance and symptoms in HIV-infected individuals. Ann Intern 417
Med 143:714-21. 418
on April 4, 2019 by guest
http://aac.asm.org/
Dow
nloaded from
20
11. de Vries-Sluijs, T. E., J. P. Dieleman, D. Arts, A. D. Huitema, J. H. Beijnen, M. Schutten, 419
and M. E. van der Ende. 2003. Low nevirapine plasma concentrations predict virological 420
failure in an unselected HIV-1-infected population. Clin Pharmacokinet 42:599-605. 421
12. DeJesus, E., D. Berger, M. Markowitz, C. Cohen, T. Hawkins, P. Ruane, R. Elion, C. 422
Farthing, L. Zhong, A. K. Cheng, D. McColl, and B. P. Kearney. 2006. Antiviral activity, 423
pharmacokinetics, and dose response of the HIV-1 integrase inhibitor GS-9137 (JTK-303) 424
in treatment-naive and treatment-experienced patients. J Acquir Immune Defic Syndr 425
43:1-5. 426
13. Demeter, L. M., H. Jiang, A. L. Mukherjee, G. D. Morse, R. DiFrancesco, R. DiCenzo, C. 427
Dykes, P. Sista, L. Bacheler, K. Klingman, A. Rinehart, and M. Albrecht. 2009. A 428
randomized trial of therapeutic drug monitoring of protease inhibitors in antiretroviral-429
experienced, HIV-1-infected patients. AIDS 23:357-68. 430
14. Drusano, G. L., J. A. Bilello, S. L. Preston, E. O'Mara, S. Kaul, S. Schnittman, and R. 431
Echols. 2001. Hollow-fiber unit evaluation of a new human immunodeficiency virus type 432
1 protease inhibitor, BMS-232632, for determination of the linked pharmacodynamic 433
variable. J Infect Dis 183:1126-9. 434
15. Eron, J. J., Jr., J. G. Park, R. Haubrich, F. Aweeka, B. Bastow, G. E. Pakes, S. Yu, H. Wu, 435
and D. D. Richman. 2009. Predictive value of pharmacokinetics-adjusted phenotypic 436
susceptibility on response to ritonavir-enhanced protease inhibitors (PIs) in human 437
immunodeficiency virus-infected subjects failing prior PI therapy. Antimicrob Agents 438
Chemother 53:2335-41. 439
16. Fletcher, C. V., R. C. Brundage, R. P. Remmel, L. M. Page, D. Weller, N. R. Calles, C. 440
Simon, and M. W. Kline. 2000. Pharmacologic characteristics of indinavir, didanosine, 441
and stavudine in human immunodeficiency virus-infected children receiving 442
combination therapy. Antimicrob Agents Chemother 44:1029-34. 443
17. Genentech. 2010. INVIRASE (saquinavir mesylate) capsules and tablets: Prescribing 444
Information. Genentech, South San Francisco, CA. 445
on April 4, 2019 by guest
http://aac.asm.org/
Dow
nloaded from
21
18. Gieschke, R., B. Fotteler, N. Buss, and J. L. Steimer. 1999. Relationships between 446
exposure to saquinavir monotherapy and antiviral response in HIV-positive patients. Clin 447
Pharmacokinet 37:75-86. 448
19. GlaxoSmithKline. 2010. LEXIVA (fosamprenavir calcium) tablets and oral suspension: 449
Highlights of Prescribing Information. GlaxoSmithKline, Research Triangle Park, NC. 450
20. Gonzalez de Requena, D., S. Bonora, I. Cavechia, L. Veronese, A. Di Garbo, F. Canta, R. 451
Marrone, A. Ibanez, M. Sciandra, M. G. Millia, A. Sinicco, and G. Di Perri. 2005. 452
Atazanavir Ctrough is associated with efficacy and safety at 24 weeks: definition of 453
therapeutic range. Presented at the 6th International Workshop on Clinical 454
Pharmacology of HIV Therapy, Quebec City, Canada, 28-30 April 2005. Abstract 60. 455
21. Grub, S., P. Delora, E. Ludin, F. Duff, C. V. Fletcher, R. C. Brundage, M. W. Kline, N. R. 456
Calles, H. Schwarzwald, and K. Jorga. 2002. Pharmacokinetics and pharmacodynamics 457
of saquinavir in pediatric patients with human immunodeficiency virus infection. Clin 458
Pharmacol Ther 71:122-30. 459
22. Haas, D. W., H. J. Ribaudo, R. B. Kim, C. Tierney, G. R. Wilkinson, R. M. Gulick, D. B. 460
Clifford, T. Hulgan, C. Marzolini, and E. P. Acosta. 2004. Pharmacogenetics of efavirenz 461
and central nervous system side effects: an Adult AIDS Clinical Trials Group study. AIDS 462
18:2391-400. 463
23. Harrigan, P. R., M. D. Miller, P. McKenna, Z. L. Brumme, and B. A. Larder. 2002. 464
Phenotypic susceptibilities to tenofovir in a large panel of clinically derived human 465
immunodeficiency virus type 1 isolates. Antimicrob Agents Chemother 46:1067-72. 466
24. Harrigan, P. R., J. S. Montaner, S. A. Wegner, W. Verbiest, V. Miller, R. Wood, and B. A. 467
Larder. 2001. World-wide variation in HIV-1 phenotypic susceptibility in untreated 468
individuals: biologically relevant values for resistance testing. AIDS 15:1671-7. 469
25. Hazuda, D., M. Iwamoto, and L. Wenning. 2009. Emerging pharmacology: inhibitors of 470
human immunodeficiency virus integration. Annu Rev Pharmacol Toxicol 49:377-94. 471
26. Hickman, D., S. Vasavanonda, G. Nequist, L. Colletti, W. M. Kati, R. Bertz, A. Hsu, and 472
D. J. Kempf. 2004. Estimation of serum-free 50-percent inhibitory concentrations for 473
on April 4, 2019 by guest
http://aac.asm.org/
Dow
nloaded from
22
human immunodeficiency virus protease inhibitors lopinavir and ritonavir. Antimicrob 474
Agents Chemother 48:2911-7. 475
27. Hoefnagel, J. G., P. P. Koopmans, D. M. Burger, R. Schuurman, and J. M. Galama. 2005. 476
Role of the inhibitory quotient in HIV therapy. Antivir Ther 10:879-92. 477
28. Hsu, A., R. Bertz, D. Hickman, M. Emery, G. Kumar, J. F. Denissen, S. Vasavanonda, A. 478
Molla, D. J. Kempf, G. R. Granneman, and E. Sun. 2001. Assessment of plasma protein 479
binding of lopinavir (LPV) and ritonavir (RTV) between in vitro and ex vivo experiments 480
and between HIV-infected patients and HIV-negative healthy volunteers. Presented at 481
the 8th Conference on Retroviruses and Opportunistic Infections, Chicago, IL, February 482
4-8. Abstract 753. 483
29. Israili, Z. H., and P. G. Dayton. 2001. Human alpha-1-glycoprotein and its interactions 484
with drugs. Drug metabolism reviews 33:161-235. 485
30. Kredo, T., J. S. Van der Walt, N. Siegfried, and K. Cohen. 2009. Therapeutic drug 486
monitoring of antiretrovirals for people with HIV. Cochrane Database Syst 487
Rev:CD007268. 488
31. la Porte, C. J. L., D. J. Back, T. Blaschke, C. A. B. Boucher, C. V. Fletcher, C. Flexner, J. G. 489
Gerber, A. D. M. Kashuba, J. Schapiro , and D. M. Burger. 2006. Updated guideline to 490
perform therapeutic drug monitoring for antiretroviral agents. Reviews in Antiviral 491
Therapy 3:4-14. 492
32. Lillibridge, J. H., B. H. Liang, B. M. Kerr, S. Webber, B. Quart, B. V. Shetty, and C. A. Lee. 493
1998. Characterization of the selectivity and mechanism of human cytochrome P450 494
inhibition by the human immunodeficiency virus-protease inhibitor nelfinavir mesylate. 495
Drug Metab Dispos 26:609-16. 496
33. Luber, A., P. D. Slowinski, E. Acosta, G. Pakes, K. Pappa, and D. Condoluci. 2009. 497
Steady-State Pharmacokinetics (PK) of Fosamprenavir (FPV) and Raltegravir (RAL) Alone 498
and Combined with Unboosted and Ritonavir-Boosted FPV. Presented at the 499
Interscience Conference on Antimicrobial Agents and Chemotherapy, San Francisco, CA, 500
USA, 12-15 September. A1-1297. 501
on April 4, 2019 by guest
http://aac.asm.org/
Dow
nloaded from
23
34. Mallolas, J., J. Blanco, P. Labarga, A. Vergara, A. Ocampo, M. Sarasa, M. Arnedo, Y. 502
Lopez-Pua, J. Garcia, J. Juega, A. Guelar, A. Terron, D. Dalmau, I. Garcia, M. Zarraga, E. 503
Martinez, X. Carne, T. Pumarola, R. Escayola, and J. Gatell. 2007. Inhibitory quotient as 504
a prognostic factor of response to a salvage antiretroviral therapy containing ritonavir-505
boosted saquinavir. The CIVSA Study. HIV Med 8:226-33. 506
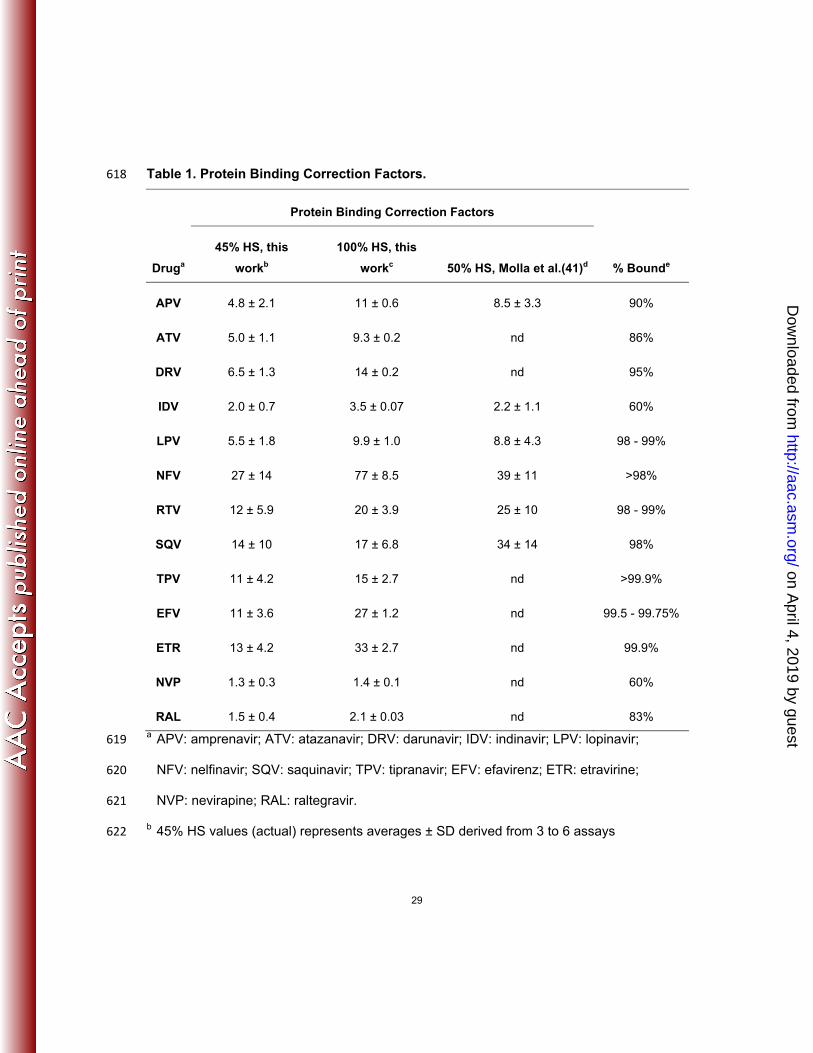
35. Marcelin, A. G., P. Flandre, G. Peytavin, and V. Calvez. 2005. Predictors of virologic 507
response to ritonavir-boosted protease inhibitors. AIDS Rev 7:225-32. 508
36. Marcelin, A. G., C. Lamotte, C. Delaugerre, N. Ktorza, H. Ait Mohand, R. Cacace, M. 509
Bonmarchand, M. Wirden, A. Simon, P. Bossi, F. Bricaire, D. Costagliola, C. Katlama, G. 510
Peytavin, and V. Calvez. 2003. Genotypic inhibitory quotient as predictor of virological 511
response to ritonavir-amprenavir in human immunodeficiency virus type 1 protease 512
inhibitor-experienced patients. Antimicrob Agents Chemother 47:594-600. 513
37. Marzolini, C., A. Telenti, L. A. Decosterd, G. Greub, J. Biollaz, and T. Buclin. 2001. 514
Efavirenz plasma levels can predict treatment failure and central nervous system side 515
effects in HIV-1-infected patients. AIDS 15:71-5. 516
38. Merck. 2010. CRIXIVAN (indinavir mesylate) capsules: Prescribing Information. Merck, 517
Whitehouse Station, NJ. 518
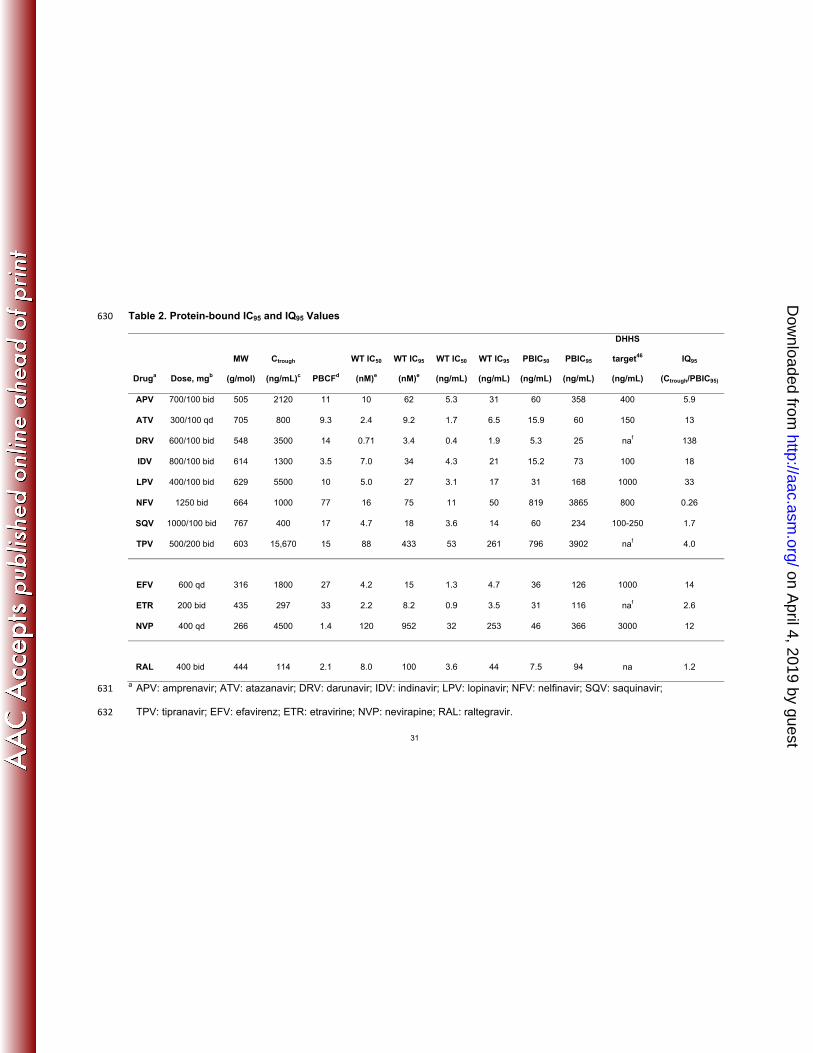
39. Merck. 2010. ISENTRESS (raltegravir) tablets: Highlights of Prescribing Information. 519
Merck, Whitehouse Station, NJ. 520
40. Molla, A., S. Vasavanonda, G. Kumar, H. L. Sham, M. Johnson, B. Grabowski, J. F. 521
Denissen, W. Kohlbrenner, J. J. Plattner, J. M. Leonard, D. W. Norbeck, and D. J. 522
Kempf. 1998. Human serum attenuates the activity of protease inhibitors toward wild-523
type and mutant human immunodeficiency virus. Virology 250:255-62. 524
41. Molla, A. V., Sudthida; kumar, Gondi; Sham, Hing L.; Johnson, Marianne; Grabowski, 525
Brian; Denissen, Jon; Kohlbrenner, William; Plattner, Jacob; Leonard, John; Norbeck, 526
Daniel; Kempf, Dale. 1998. Human Serum Attenuates the Activity of Protease Inhibitors 527
toward Wild-Type and Mutant Human Immunodeficiency Virus. Virology 250:255-262. 528
42. Molto, J., J. R. Santos, N. Perez-Alvarez, S. Cedeno, C. Miranda, S. Khoo, L. Else, J. M. 529
Llibre, M. Valle, and B. Clotet. 2008. Darunavir inhibitory quotient predicts the 48-week 530
on April 4, 2019 by guest
http://aac.asm.org/
Dow
nloaded from
24
virological response to darunavir-based salvage therapy in human immunodeficiency 531
virus-infected protease inhibitor-experienced patients. Antimicrob Agents Chemother 532
52:3928-32. 533
43. Morello, J., C. De Mendoza, V. Soriano, L. Anta, G. Gonzalez-Pardo, A. Corral, F. Blanco, 534
I. Jimenez-Nacher, J. Gonzalez-Lahoz, and S. Rodriguez-Novoa. 2009. Use of different 535
inhibitory quotients to predict early virological response to tipranavir in antiretroviral-536
experienced human immunodeficiency virus-infected patients. Antimicrob Agents 537
Chemother 53:4153-8. 538
44. Morse, G. D., L. M. Catanzaro, and E. P. Acosta. 2006. Clinical pharmacodynamics of 539
HIV-1 protease inhibitors: use of inhibitory quotients to optimise pharmacotherapy. 540
Lancet Infect Dis 6:215-25. 541
45. Naeger, L., J. Zheng, and K. Struble. 2006. Virologic Response to Tipranavir Based on 542
Plasma Concentration and Baseline Resistance Parameters. Presented at the Conference 543
on Retroviruses and Opportunistic Infections, Denver, CO, February 5-8. 639a. 544
46. Panel on Antiretroviral Guidelines for Adults and Adolescents. 2011. Guidelines for the 545
use of antiretroviral agents in HIV-1-infected adults and adolescents. Department of 546
Health and Human Services. [Online.] 547
http://www.aidsinfo.nih.gov/ContentFiles/AdultandAdolescentGL.pdf. Accessed 548
October 14, 2011. 549
47. Parkin, N. T., N. S. Hellmann, J. M. Whitcomb, L. Kiss, C. Chappey, and C. J. 550
Petropoulos. 2004. Natural variation of drug susceptibility in wild-type human 551
immunodeficiency virus type 1. Antimicrob Agents Chemother 48:437-43. 552
48. Petropoulos, C. J., N. T. Parkin, K. L. Limoli, Y. S. Lie, T. Wrin, W. Huang, H. Tian, D. 553
Smith, G. A. Winslow, D. J. Capon, and J. M. Whitcomb. 2000. A novel phenotypic drug 554
susceptibility assay for human immunodeficiency virus type 1. Antimicrob Agents 555
Chemother 44:920-8. 556
49. Preston, S. L., P. J. Piliero, J. A. Bilello, D. S. Stein, W. T. Symonds, and G. L. Drusano. 557
2003. In vitro-in vivo model for evaluating the antiviral activity of amprenavir in 558
on April 4, 2019 by guest
http://aac.asm.org/
Dow
nloaded from
25
combination with ritonavir administered at 600 and 100 milligrams, respectively, every 559
12 hours. Antimicrob Agents Chemother 47:3393-9. 560
50. Ribaudo, H. J., D. W. Haas, C. Tierney, R. B. Kim, G. R. Wilkinson, R. M. Gulick, D. B. 561
Clifford, C. Marzolini, C. V. Fletcher, K. T. Tashima, D. R. Kuritzkes, and E. P. Acosta. 562
2006. Pharmacogenetics of plasma efavirenz exposure after treatment discontinuation: 563
an Adult AIDS Clinical Trials Group Study. Clin Infect Dis 42:401-7. 564
51. Rizk, M. L., Y. Hang, W. L. Luo, J. Su, J. Zhao, H. Campbell, B. Y. Nguyen, P. Sklar, J. J. 565
Eron, Jr., and L. Wenning. 2012. Pharmacokinetics and Pharmacodynamics of Once-566
Daily Versus Twice-Daily Raltegravir in Treatment-Naive HIV-Infected Patients. 567
Antimicrob Agents Chemother. 568
52. Sadler, B. M., C. Gillotin, Y. Lou, and D. S. Stein. 2001. Pharmacokinetic and 569
pharmacodynamic study of the human immunodeficiency virus protease inhibitor 570
amprenavir after multiple oral dosing. Antimicrob Agents Chemother 45:30-7. 571
53. Song, I., S. Chen, Y. Lou, J. Borland, T. Fujiwara, S. Piscitelli, and S. Min. 2009. 572
Pharmacokinetic (PK) and Pharmacodynamic (PD) Relationship of S/GSK1349572, a Next 573
Generation Integrase Inhibitor (INI), in HIV-1 Infected Patients. Presented at the The 5th 574
IAS Conference on HIV Pathogenesis, Treatment and Prevention, Cape Town, South 575
Africa, July 19-22. Abstract WEPEB250. 576
54. Tibotec. 2009. INTELENCE (etravirine) tablets: Full Prescribing Information. Tibotec, 577
Raritan, NJ. 578
55. Tibotec. 2010. PREZISTA (darunavir) Tablet, Film Coated for Oral use: Full Prescribing 579
Information. Tibotec, Raritan, NJ. 580
56. Winston, A., G. Hales, J. Amin, E. van Schaick, D. A. Cooper, and S. Emery. 2005. The 581
normalized inhibitory quotient of boosted protease inhibitors is predictive of viral load 582
response in treatment-experienced HIV-1-infected individuals. AIDS 19:1393-9. 583
57. Winston, A., and S. Khoo. 2008. Clinical application of the inhibitory quotient: is there a 584
role in HIV protease inhibitor therapy? Curr Opin HIV AIDS 3:608-11. 585
58. Zhang, K. E., E. Wu, A. K. Patick, B. Kerr, M. Zorbas, A. Lankford, T. Kobayashi, Y. 586
Maeda, B. Shetty, and S. Webber. 2001. Circulating metabolites of the human 587
on April 4, 2019 by guest
http://aac.asm.org/
Dow
nloaded from
26
immunodeficiency virus protease inhibitor nelfinavir in humans: structural 588
identification, levels in plasma, and antiviral activities. Antimicrob Agents Chemother 589
45:1086-93. 590
591
592 593
on April 4, 2019 by guest
http://aac.asm.org/
Dow
nloaded from
27
FIGURE LEGENDS 594
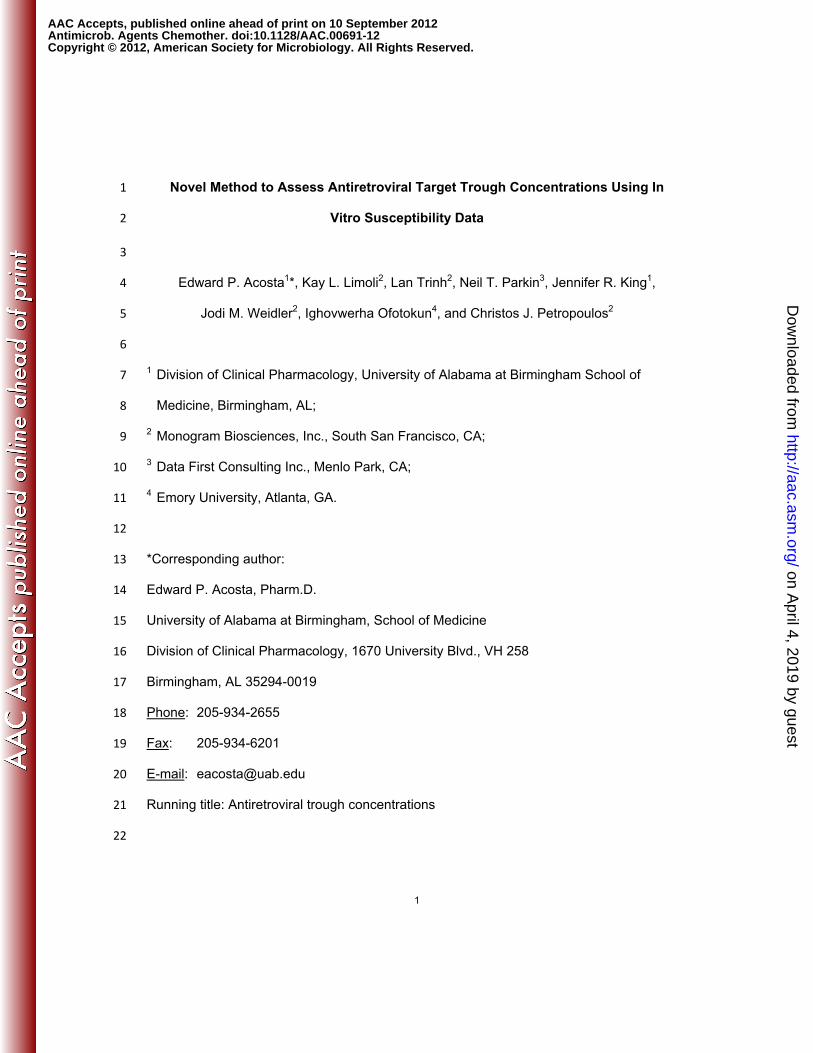
595
Figure 1. Effect of human serum on in vitro drug susceptibility. Representative 596
PhenoSense® inhibition curves showing the effect of adding human serum at 22.5% 597
(red diamonds, solid line), 45.0% (green diamonds, solid line), or 67.5% (red squares, 598
dotted line), compared to standard (10% FBS) conditions (blue squares, dotted line). 599
The drug susceptible (NL4-3) reference virus was used. A: darunavir (DRV); B: 600
efavirenz (EFV); C: raltegravir (RAL). Vertical dotted lines denote the IC50. 601
602
Figure 2. Relationship between ARV drug IC50 and human serum concentration. 603
Mean IC50 values from replicate susceptibility assays +/- SD are shown. A: susceptibility 604
of the drug susceptible (NL4-3) reference virus to protease inhibitors (PIs); B: 605
susceptibility of the multi-drug resistant (MDRC-4) reference virus to PIs. Results for 606
nelfinavir with MDRC-4 are not shown since human serum concentrations shifted the 607
IC50 beyond the dynamic range of the assay. APV: amprenavir (closed circles, solid 608
line); ATV: atazanavir (open squares, solid line); DRV: darunavir (closed triangle, dotted 609
line); IDV: indinavir (closed diamonds, solid line); LPV: lopinavir (open circles, dotted 610
line); NFV: nelfinavir (filled squares, dotted line); SQV: saquinavir (open triangles, 611
dotted line); TPV: tipranavir (open diamonds, solid line). C: susceptibility of the drug 612
susceptible (NL4-3) reference virus to NNRTIs and raltegravir; D: susceptibility of the 613
multi-drug resistant (MDRC-4) reference virus to NNRTIs. Since the multi-drug resistant 614
virus contains the wild-type integrase region, the results for this virus with raltegravir are 615
on April 4, 2019 by guest
http://aac.asm.org/
Dow
nloaded from
28
included in panel C. EFV: efavirenz (filled squares); ETR: etravirine (filled triangles); 616
NVP: nevirapine (filled circles); RAL: raltegravir (open circles). 617
on April 4, 2019 by guest
http://aac.asm.org/
Dow
nloaded from
29
Table 1. Protein Binding Correction Factors. 618
Protein Binding Correction Factors
Druga
45% HS, this
workb
100% HS, this
workc 50% HS, Molla et al.(41)d % Bounde
APV 4.8 ± 2.1 11 ± 0.6 8.5 ± 3.3 90%
ATV 5.0 ± 1.1 9.3 ± 0.2 nd 86%
DRV 6.5 ± 1.3 14 ± 0.2 nd 95%
IDV 2.0 ± 0.7 3.5 ± 0.07 2.2 ± 1.1 60%
LPV 5.5 ± 1.8 9.9 ± 1.0 8.8 ± 4.3 98 - 99%
NFV 27 ± 14 77 ± 8.5 39 ± 11 >98%
RTV 12 ± 5.9 20 ± 3.9 25 ± 10 98 - 99%
SQV 14 ± 10 17 ± 6.8 34 ± 14 98%
TPV 11 ± 4.2 15 ± 2.7 nd >99.9%
EFV 11 ± 3.6 27 ± 1.2 nd 99.5 - 99.75%
ETR 13 ± 4.2 33 ± 2.7 nd 99.9%
NVP 1.3 ± 0.3 1.4 ± 0.1 nd 60%
RAL 1.5 ± 0.4 2.1 ± 0.03 nd 83% a APV: amprenavir; ATV: atazanavir; DRV: darunavir; IDV: indinavir; LPV: lopinavir; 619
NFV: nelfinavir; SQV: saquinavir; TPV: tipranavir; EFV: efavirenz; ETR: etravirine; 620
NVP: nevirapine; RAL: raltegravir. 621
b 45% HS values (actual) represents averages ± SD derived from 3 to 6 assays 622
on April 4, 2019 by guest
http://aac.asm.org/
Dow
nloaded from
30
c 100% HS values (extrapolated) represents averages ± SE derived from linear 623
regression 624
d mean ± SD of ratios between 50% HS and control for all viruses listed in Table 1 from 625
ref (41). nd, not done. 626
e All percent bound values are from product prescribing information for each drug (1-3, 627
6-9, 17, 19, 38, 39, 54, 55). 628
629
on April 4, 2019 by guest
http://aac.asm.org/
Dow
nloaded from
31
Table 2. Protein-bound IC95 and IQ95 Values 630
Druga Dose, mgb
MW
(g/mol)
Ctrough
(ng/mL)c PBCFd
WT IC50
(nM)e
WT IC95
(nM)e
WT IC50
(ng/mL)
WT IC95
(ng/mL)
PBIC50
(ng/mL)
PBIC95
(ng/mL)
DHHS
target46
(ng/mL)
IQ95
(Ctrough/PBIC95)
APV 700/100 bid 505 2120 11 10 62 5.3 31 60 358 400 5.9
ATV 300/100 qd 705 800 9.3 2.4 9.2 1.7 6.5 15.9 60 150 13
DRV 600/100 bid 548 3500 14 0.71 3.4 0.4 1.9 5.3 25 naf 138
IDV 800/100 bid 614 1300 3.5 7.0 34 4.3 21 15.2 73 100 18
LPV 400/100 bid 629 5500 10 5.0 27 3.1 17 31 168 1000 33
NFV 1250 bid 664 1000 77 16 75 11 50 819 3865 800 0.26
SQV 1000/100 bid 767 400 17 4.7 18 3.6 14 60 234 100-250 1.7
TPV 500/200 bid 603 15,670 15 88 433 53 261 796 3902 naf 4.0
EFV 600 qd 316 1800 27 4.2 15 1.3 4.7 36 126 1000 14
ETR 200 bid 435 297 33 2.2 8.2 0.9 3.5 31 116 naf 2.6
NVP 400 qd 266 4500 1.4 120 952 32 253 46 366 3000 12
RAL 400 bid 444 114 2.1 8.0 100 3.6 44 7.5 94 na 1.2
a APV: amprenavir; ATV: atazanavir; DRV: darunavir; IDV: indinavir; LPV: lopinavir; NFV: nelfinavir; SQV: saquinavir; 631
TPV: tipranavir; EFV: efavirenz; ETR: etravirine; NVP: nevirapine; RAL: raltegravir. 632
on April 4, 2019 by guest
http://aac.asm.org/
Dow
nloaded from
32
b prescribed dose and frequency (bid: twice daily; qd: once daily); for protease inhibitors other than NFV the amount of co-633
dosed with ritonavir is indicated after the slash. 634
c all Ctrough values are taken from the individual drug manufacturer’s prescribing information (1-3, 6-9, 17, 19, 38, 54, 55) 635
except raltegravir which was from reference (51). 636
d protein binding correction factor at 100% HS, extrapolated from experimental data described above 637
e wild-type (WT) virus IC50 and IC95 data are the means of a large collection of independent determinations from clinical 638
samples lacking drug-selected mutations in PR or RT (for PIs and NNRTIs, n=6537) or IN (for RAL, n=1200). 639
f not applicable: no target drug concentration has been determined for PI naïve patients; for PI-experienced patients, the 640
recommended Ctrough values for darunavir, tipranavir, and etravirine are 550, 20, 500, and 52 ng/mL, respectively (46) 641
on April 4, 2019 by guest
http://aac.asm.org/
Dow
nloaded from
drug concentration (nM)
% in
hib
itio
n
40
60
80
100
0
20
1.00.10.01 10 100
B. EFV
drug concentration (nM)
% in
hib
itio
n40
60
80
100
-40
-20
0
20
1.0
0.1
0.01 10 100 1000
A. DRV
40
60
80
100
0
20
1.00.1 10 100 1000
drug concentration (nM)
% in
hib
itio
n
C. RAL
0.001
0.1
on April 4, 2019 by guest
http://aac.asm.org/
Dow
nloaded from
Drug Sensitive Virus
0 20 40 60 80 1000.1
1
10
100
1,000
10,000APV
ATV
DRV
LPV
NFV
IDV
TPV
SQV
Percent Human Serum
IC50 (nM)
0 20 40 60 80 1001
10
100
1,000
10,000EFV
NVP
ETR
RAL
Percent Human Serum
IC50 (nM)
Drug Resistant Virus
0 20 40 60 80 1000.1
1
10
100
1,000
10,000
Percent Human Serum
IC50 (nM)
0 20 40 60 80 1001
10
100
1,000
10,000
Percent Human Serum
IC50 (nM)
A B
C D
on April 4, 2019 by guest
http://aac.asm.org/
Dow
nloaded from
Recommended