Non Experimental Design in EducationUmmul Ruthbah

A way around RCT• Experiments are difficult to run.• Is there a way around?• There are several techniques• Difference in Difference • Regression discontinuity• Propensity score matching
Methodology 1: Difference in Difference (DID)• Suppose we want to evaluate the impact of
supplementary tutoring on primary school students (Ruthbah, Rabbani, Hossain & Sarwar 2012).
• One way to do it is to assign students randomly to the program.
• What if the program is already in place and it did not follow the RCT protocol?
• How do we create a control group now?

Evaluating the Education Support Program of the CDIP• The Center for Development Innovation and Practices provide 2
hours of supplementary tuition to nursery, grade 1 and 2 students in many districts of Bangladesh.
• Operating learning centres adjacent to primary schools since 2005.
• Supplementary tuition (about 10 hours per week) to primary school students in nursery, grade 1 and grade 2.
• 1,750 learning centres adjacent to the primary schools.
• We want to estimate the effect of the program on the participants test score and dropout rate.

Treatment and Control
• We could compare students who participated in the program with those who did not.
• But it could be that only the weak students participated into the program and therefore the treatment and control students are not similar
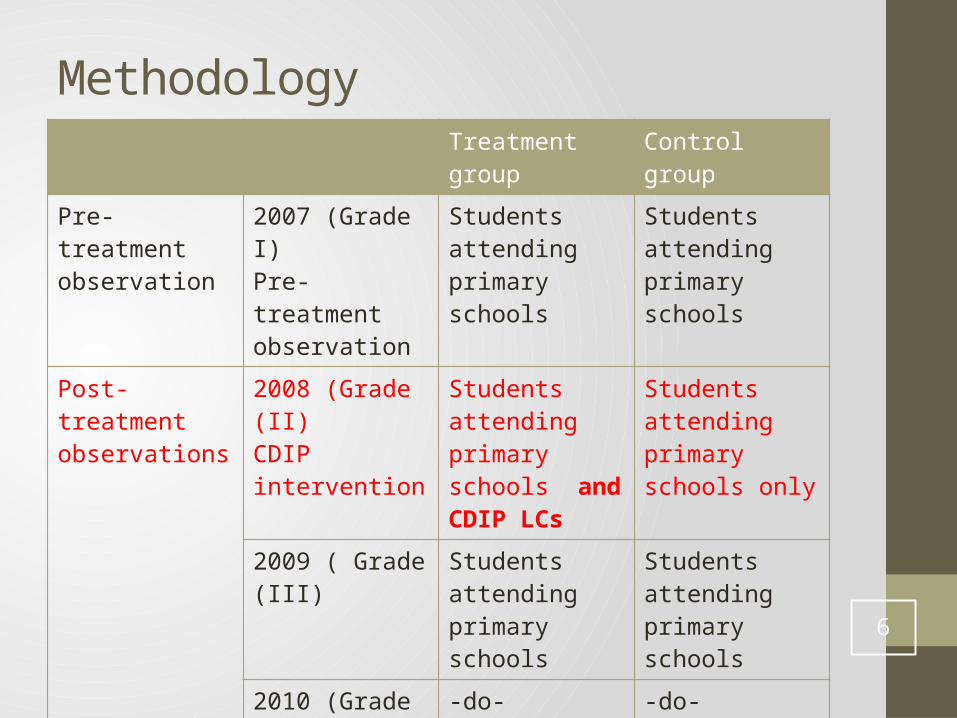
Methodology Treatment group Control group
Pre-treatment observation
2007 (Grade I)Pre-treatment observation
Students attending primary schools
Students attending primary schools
Post- treatment observations
2008 (Grade (II)CDIP intervention
Students attending primary schools and CDIP LCs
Students attending primary schools only
2009 ( Grade (III)
Students attending primary schools
Students attending primary schools
2010 (Grade IV) -do- -do-
2011 (Grade V) -do- -do-6

Methodology
Test Scores in Final Difference in test scores between 2007 and 2008
2007 (grade 1) 2008 (grade 2)
Students who participated in ESP (Treatment)
XT2007 XT
2008
XT2008 - XT
2007
(a)
Students who did not participate in ESP (Control)
XC2007 XC
2008 XC2008 - XC
2007
(b)
Difference between treatment and control groups
XT2007 - XC
2007 XT2008 - XC
2008(a) – (b) = DID
estimate(c) 7

Sampling Strategy
• 304 learning centres in 2008 in 33 unions of 8 upazilas in Bangladesh.
• Only 262 centres had students from grade 2.
• A sample of 1900 students (950 in each of treatment and control groups) from 159 learning centres and the associated primary schools.
8

Sampling Strategy
• Multistage sampling
Select the learning centres
Select students who were in grade 2 in 2008 and participated in the program
Select control students (6 on average) from the schools who were in grade 2 in 2008 but did not participate in the program.
9
The Surveys
• Three sets of questionnaire on: • Performance of the treatment and control students
in the final exams.
• Background of students
• School information
10

The Field Experience
• Could not get the complete list of students who were in grade two in 2008 and attended the ESP.
• We collected data on 2147 students, of whom 1078 students attended 144 different CDIP learning centers in 2008.
• The schools could provide the marks/test scores for 2007 for only 1215 students.
11

Figure 1: total marks obtained
2007 2008 2009 2010 20110
50
100
150
200
250
203.33
175.76
151.37 146.21132.93
205.97
173.83152.06 148.12
139.52
Treatment
Control
Year
Mar
ks (o
ut o
f 300
)
12

Figure 2: difference in marks between pre-post treatment years
2008 2009 2010 2011
-80
-70
-60
-50
-40
-30
-20
-10
0
-27.57
-51.96
-57.12
-70.4
-32.14
-53.91-57.85 -66.45
Difference be-tween treat-ment and control
Treatment
Control
Year
Mar
ks (o
ut o
f 300
)
13

Results: class performance (did estimates)
Total Bengali English Math
(1) (2) (3) (4)Grade 2 0.072
(.06)0.12**
(.06)-0.01(0.06)
0.05(0.07)
Grade 3 .013 (.06)
.01 (.05)
.040 (.07)
-.002 (.07)
Grade 4 .06(.07)
.06(.06)
.09(.07)
-.02(.08)
Grade 5 0.01(.06)
0.03(.06)
0.01(.06)
-0.01(.06)
14

Methodology 2: Regression Discontinuity Design
• Jacob and Lefgren (2002) examine the effect of summer school and grade retention on students’ achievement.• The ideal situation would be to randomly assign
students with poor grades to summer school or retain in the same grade. And compare them with those who did not go to summer school or repeated the grade (the control group).• But it is not possible to ethical and or other reasons. • How do we find the counterfactual (the control
group)?

Measuring the Impact of Remedial Education • Chicago Public Schools introduced an accountability policy
in 1996.• Schools should decide who goes to summer school and who
should repeat the grade depending on the student’s performance in a standardized test on Math and Reading.

Figure 3: The Design
Treatment – Control Groups
• Students just below the cut-off in June test constitute the treatment group and those at the cut-off belong to the control group for assessing the impact of summer school on future achievement.
• Students just below the cut-off in August test constitute the treatment group and those at the cut-off belong to the control group for assessing the impact of grade retention on future achievement.

Figure 4: the Relationship between June Reading Scores and the Probability of Attending Summer School or being Retained

Figure 5: Relationship between June reading and next year reading and math performance for third grade students
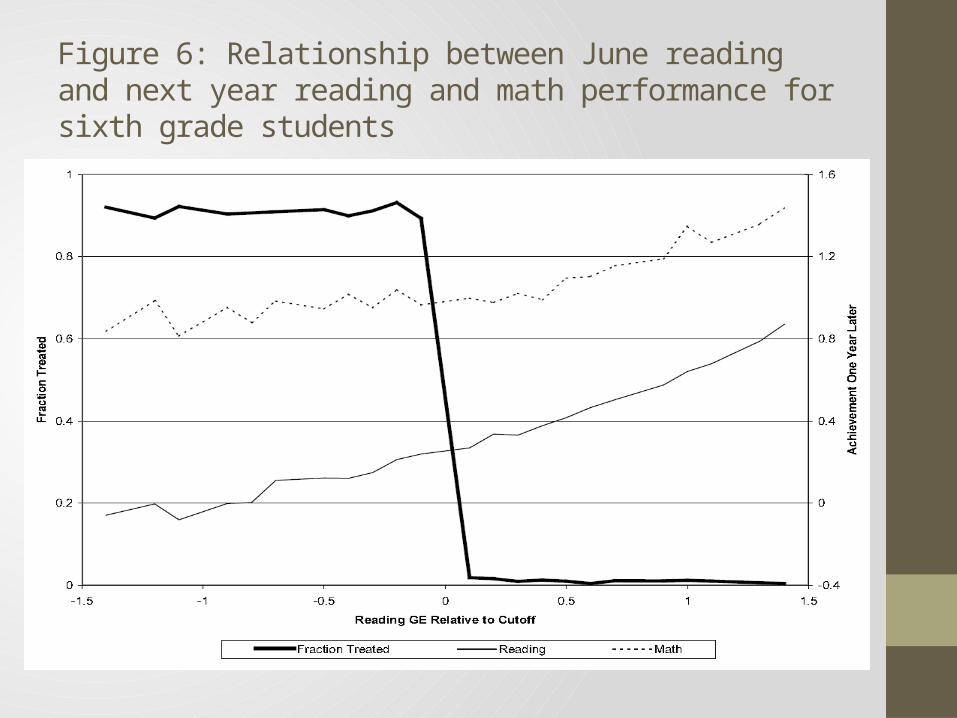
Figure 6: Relationship between June reading and next year reading and math performance for sixth grade students

Figure 7: Relationship between August reading and next year reading and math performance for third grade students

Figure 8: Relationship between August reading and next year reading and math performance for sixth grade students

The DID Estimate
• can use the following DID estimator to find the impact of summer school:
• Where, = mean achievement c = student at the cut-off c-1 = student just below the cut-off T = the probability of attending the summer school t = time period

RDD: Main Idea
• There is a continuous variable that determines treatment.• The assignment to treatment is a discontinuous function of
that variable.
• Where, S = selection variable c = the cut-off T = 1 if treated, 0 otherwise.

Methodology 3: the Propensity Score Matching• If the program affects the treatment group in a different way
then it would have affected the control group.
• The DID estimates are of no use.
• It happens is selection into the program depends on factors that also affect the outcome of interest.
• Example: the decision to attend the leaning centers may depend on the parents years of education and parents education is believed to have influence on students test scores.
• How to create a treatment – control group is this case?

Matching
• For the same level of parental education there are some students who attend the LCs and some who do not.
• For each level of parental education those who attend the LCs belong to the treatment group and those who do not belong to the control group.
• We take the average difference in test scores of treatment and control students for each level of parental education.
• The average of the differenced test scores over all parental education level is out treatment effect.

More than One Determinants• What if there are more than one variable (factor) that affect
both selection and outcome variable? For example: parental education and income.
• Use propensity scores .
• Propensity score = probability of getting treatment = f(parental education, income).
• Students with same parental education and income will have the same probability of getting treatment (propensity score)

Treatment an Control Groups• For the same propensity score students who went to the LCs
belong to the treatment group and those who did not belong to the control group.
Recommended