1
NOAA Joint Hurricane Testbed (JHT) Final Report
Date: August 31, 2011
Project title: Advanced Applications of the Monte Carlo Wind Probability Model
Principal Investigators: Mark DeMaria, Stan Kidder
Affiliation: DeMaria (NESDIS), Kidder (CIRA)
NHC Focal Points: Michael Brennan, Robbie Berg, Dan Brown, Chris Lauer,
Chris Landsea
Other Contributors: Andrea Schumacher (CIRA), Robert DeMaria (CIRA)
Project dates: Aug. 2009-Jul. 2011
1. Long-Term Objectives and Specific Plans to Achieve Them
Under previous JHT support a program for estimating the probability of occurrence of 34,
50, and 64 kt winds was developed by NESDIS and CIRA. A Monte Carlo (MC) method
is utilized to combine the uncertainty in the tropical cyclone track, intensity and wind
structure forecasts. The MC probability program has been used operationally at NHC,
CPHC and JTWC since 2006. The model was upgraded in 2010 to include situation-
dependent track forecast uncertainty through the Goerss Predicted Consensus Error
(GPCE) product, which was also developed under previous JHT support.
In the current two-year project, four new applications of the MC model were developed.
These include (1) Landfall timing and intensity distributions; (2) Methods for using the
MC model to enhance WFO local products; (3) Probabilities integrated over coastal
segments; (4) Automated guidance for issuing coastal watches and warnings.
The current project also includes four refinements to the MC model code. These include
(1) A procedure to adjust the model time step for fast moving and small storms; (2)
Modification of the azimuthal interpolation routine that occasionally leads to inconsistent
probability values for 34, 50 and 64 kt winds; (3) Evaluation of the spatial interpolation
method that sometimes results in inconsistencies between the gridded and text
probabilities; (4) Evaluation of the underlying wind radii model utilized by the MC
model.
The timeline for this project is provided in the Appendix.
2. Accomplishments
The accomplishments are described for each of the four new applications and four code
refinements. All of the tasks were completed, although additional feedback is being
obtained during the 2011 hurricane season. Additional products were developed based on
forecaster feedback, which were not included in the original proposal. These new
applications are also described below.
Application 1, landfall timing and intensity distributions.

2
The MC model code was modified to create a new output file that includes the track,
intensity and wind radii of all 1000 realizations. A separate post-processing routine was
developed that calculates the landfall timing and intensity distributions for a set of user
defined points. Because this application requires a forecaster to select points of interest, a
prototype graphical user interface (GUI) called the Hurricane Landfall Probability
Applications (HuLPA) was developed for demonstration of these capabilities. HuLPA is
java-based, but a similar application could be developed in the ATCF framework. Figure
1 is a screen capture of the HuLPA application run on a Windows system. Because of the
use of java, the program also runs on Linux systems. The user selects from a set of storm
cases (Hurricane Gustav initialized at 06 UTC on 31 August 2008 in this example), and
then the program displays the NHC forecast track and intensity. The user then selects the
coastal points of interest (Sabine Pass to Pascagoula in this example), and the application
of interest (landfall timing and intensity distribution in this example). The user can
modify the selected points or forecast case and re-run the application.
The Version 1.0 of the HuLPA program was installed at NHC for evaluation during the
2010 hurricane season. Based on forecaster feedback during Hurricane Alex, the display
was modified to also include the probability of the storm reaching at least tropical storm
and each of the five Saffir-Simpson Hurricane categories at any time during the forecast
period. The middle panel in Fig. 1 shows that information for the Hurricane Gustav
example. Several other modifications were made to HuLPA and version 1.4 was installed
at NHC for testing during the 2011 season.
Figure 1. Screen capture of the HuLPA program for a case from Hurricane Gustav
(2008) that shows the landfall intensity and timing application.

3
Application 2: WFO Local Products
In coordination with Pablo Santos from the Miami, FL WFO and Dave Sharp from the
Melbourne, FL WFO, an extensive verification of the 12 h incremental probabilities was
performed for coastal and inland points to help them refine their WFO applications. 400
forecast cases from 20 land falling storms from the 2004-2008 hurricane seasons were
run with the 2009 version of the MC model. In Year 2, additional verification cases from
2010 were provided to refine the WFO application. The previous coastal verification
cases were re-run with the 2010 version of the model and two versions were provided for
comparison (with and without the GPCE input). A comparison of the two versions
provided confirmation that the GPCE input improves the skill of the MC model. The
WFO applications have now been developed from the GPCE version.
Application 3. Integrated probabilities
The ability to estimate the probability of 34, 50 and 64 kt winds at any point along a user
specified section of coastline was added to the HuLPA program in version 1.2, which was
tested during the 2010 season. Forecaster feedback during the landfall of Hurricane Karl
in Mexico suggested that the algorithm underestimated the integrated probabilities.
Further analysis showed that the coastal points used in the numerical integration were too
far apart for a small storm like Karl. The program was modified to reduce the spacing of
the coastal points. This improvement was added to HuLPA version 1.4 that was installed
for the 2011 hurricane season. The coastal resolution is now adequate for the smallest of
tropical cyclones.
Application 4. Automated watch/warning guidance
The algorithm for providing automated coastal hurricane and tropical storm
watch/warning guidance was not available in HuLPA during the 2010 season, but is now
included in version 1.4. The algorithm uses probability thresholds to provide guidance on
the end points of the U.S. watches and warning. The method uses the cumulative
probabilities from the previous 48 h of MC model runs, and requires a lower probability
value for lifting a watch or warning than putting one up. Figure 3 shows an example of
the watch/warning guidance from the HulPA program for a case from Hurricane Earl.
Again based on forecaster feedback, a table of the endpoints of the watches and warnings
was added to the HuLPA output. The automated watch/warning capabilities are being
evaluated by the NHC forecasters during the 2011 season.
The thresholds for the automated watch/warning guidance were initially determined by
comparing the objective watch/warning guidance to those issued by NHC for 2004-2009.
However, based on forecaster feedback following a training session provided to NHC in
June of 2011, the method for determining the thresholds was modified. Rather than
simply trying to reproduce the past history of NHC watches and warnings (WWs), the
thresholds for putting up and taking down the WWs are determined from specified hit
rates and lead times. The lead time can be in terms of the arrival of 34 or 64 kt winds.
The version of the algorithm included in HuLPA version 1.4 used the hit rate from the
4
past five years of NHC warnings, and the lead times of the current definitions of watches
and warnings (48 hr and 36 hr before the arrival of 34 kt winds, respectively). If the hit
rate and lead time are unrealistically large, the algorithm results in an impractical false
alarm rate. Based on testing on the past five years of U.S. landfalling storms, the false
alarm rate with the current version of HuLPA was a little lower than that of the WWs
issued by NHC. This analysis can also be used to evaluate how much the lead times of
WWs could be extended and still have acceptable false alarm rates. With the current
forecast error statistics, the lead time cannot be extended much longer than the current
NHC definitions.
Figure 2. Screen capture showing an example of the automated watch/warning guidance
for Hurricane Earl from the MC model run initialized at 01 Sept 2010 at 0600 UTC. The
MC model from this run and the previous 48 h are utilized by the HuLPA program.
Additional Applications
Following the 2010 season, considerable feedback was obtained from the JHT project
focal points (M. Brennan and D. Brown) and a former JHT focal point who now works
for the Weather Channel (R. Knabb). They requested new HuLPA products that show the
probability and cumulative probability distributions of the start and end times of the 34,
50 and 64 kt winds, and new maps for the eastern Pacific, the Hawaii region and the far
eastern Atlantic. The ability to plot the tracks of all 1000 realizations utilized in the MC
model was also requested, where they can be plotted for all forecast times or any range of

5
forecast times. Examples of these new capabilities that are available in 2011 in HuLPA
version 1.4 are shown in Figs. 3-5.
Figure 3. Screen capture showing the HuLPA product for displaying the distributions of
the starting and ending times of 34, 50 and 64 kt winds at a user specified point for a
case from Hurricane Gustav (2008). The selected point is indicated in green on the left
panel.
Figure 4. Screen capture showing the HuLPA product to display the tracks and
intensities of all 1000 realizations for all forecast times (left) or at a single forecast time
(right) for a case from Hurricane Earl (2010). The tracks of each realization are color
coded by the storm intensity.

6
Figure 5. Example of the east Pacific map with the 1000 realizations for a case from
tropical storm Adrian from the 2011 east Pacific hurricane season.
Code refinement 1. Time step adjustment.
The MC model code was modified to allow the time step to be reduced from 2 to 1 hr.
This change was implemented in 2010 and reduced the noise in the graphical products for
very small and fast moving storms (Fig. 6). The 1 hr time step was also needed for
several of the HuLPA products.
Figure 6. 0-120 hr cumulative 64 kt wind probabilities for Hurricane Gordon (2006)
initialized on 19 Sept 2006 at 18 UTC. The left panel used the 2 h time step of the current
operational MC model and the right panel used a 1 h time step.

7
Code refinement 2. Azimuthal interpolation of wind radii
The wind radii in the MC model are determined from a simple climatology and
persistence (CLIPER) model, where the surface wind field is represented by a modified
Rankine vortex. If used in its continuous form, the radii of each wind threshold (34, 50
and 64 kt) would be consistent. However, because the model includes a persistence
component based on the 4 quadrant values from the NHC official forecast at t=0, the
wind radii are azimuthally interpolated from the underlying vortex model evaluated in 4
quadrants. This interpolation works very well in most cases. However, in a few cases
where the radii are zero in some quadrants for some wind thresholds but not for others,
the interpolation can introduce an inconsistency between the radii values. For example,
the 34 kt radii can be smaller than the 50 kt radii for a small range of azimuth. The
azimuthal interpolation was modified so that the radii can never be smaller than radius of
maximum wind, which resolved this problem.
The modified code was implemented for the 2011 hurricane season, but resulted in an
unexpected problem. For very small hurricanes with maximum winds near the 64 kt
threshold, the wind radii in the NHC forecast/advisory at t=0 can be smaller than the
radius of maximum wind in the radii CLIPER model. The code modification to solve the
problem with the azimuthal interpolation forced the observed radii at t=0 to be set to zero,
resulting in an large underestimate of the 64 kt wind probabilities in the early part of the
forecast. This problem was uncovered during Hurricane Beatriz from the early part of the
2011 season. While the problem was being diagnosed, NHC reverted back to the 2010
version of the MC model, which continues to be run in the 2011 season. The MC model
code has since been modified to correct the first problem due to the azimuthal
interpolation, but retain the t=0 h NHC wind radii even when they are smaller than the
radius of maximum wind (RMW) in the radii CLIPER model. In that case, the RMW is
modified to be consistent with the NHC wind radii, rather than the other way around. The
same procedure is used for 50 and 34 kt wind radii. The version of the MC model with
both corrections is ready for implementation for the 2012 season.
Code refinement 3. Spatial interpolation of probabilities
The MC model is run on a large domain with a 0.5o lat/lon grid spacing for graphical
products and on a set of coastal points for text products. The large domain product is also
interpolated to a much finer grid for use in AWIPS and the National Digital Forecast
Database (NDFD). In regions of large probability gradients, the interpolated gridded
values do not agree with the corresponding values calculated directly at the specified
coastal points. To evaluate the magnitude of these errors, a series of convergence tests
was performed where the model was run with the spacing of the lat/lon grid equal to 0.5,
0.4, 0.3, 0.25, 0.2 and 0.1o. The 0 to 120 h cumulative probabilities of the 34, 50 and 64
kt winds were linearly interpolated to coastal points utilized in the text product, and these
were compared to the values where the probabilities were calculated directly at the

8
coastal points. For the evaluation, large (Hurricane Ike) and small (Hurricane Charley)
tropical cyclone cases were considered. The Ike case was initialized on 01 September
2008 at 1200 UTC (about 48 h before its Texas landfall) and the Charley case was
initialized on 13 August 2004 at 0000 UTC (about 24 h before its southwest Florida
landfall).
Figure 7 shows the mean absolute error (MAE) of the 120 h cumulative 34 and 64 kt
probabilities at the coastal points due to linear interpolation. Only those points within a
few hundred km of the landfall location were included to exclude the large number of
points where the probabilities were zero, which would artificially deflate the MAE. As
expected, the errors are larger for the Charley case because the probability gradients are
larger, due to the small size of the storm. Figure 7 indicates that the MAE due to
interpolation could be cut in half simply by reducing the grid spacing on the
computational grid to 0.25o. Preliminary timing tests indicate that this would not cause a
significant delay in the generation of the real time products.
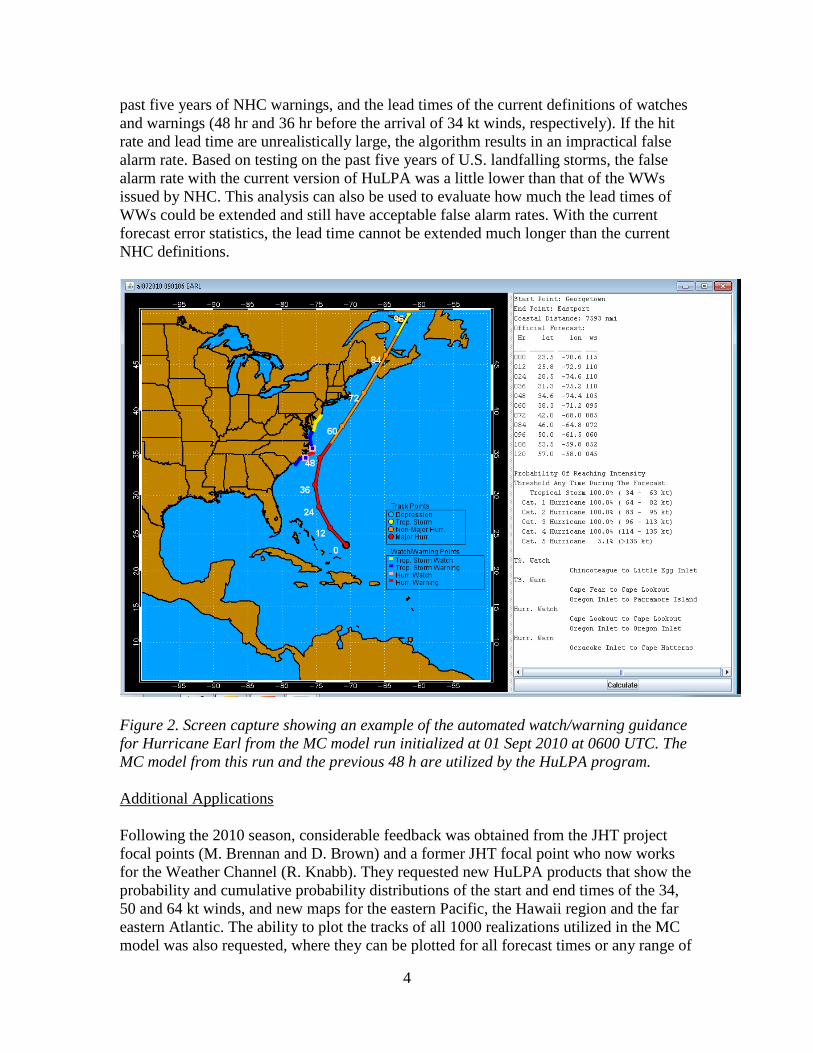
The results in Fig. 7 show that even with the 0.5o grid spacing, the average interpolation
errors are between 1.5 and 4%, which are close to the underlying noise level of the MC
model with 1000 realizations. However, the errors at a few points near the gradient
regions can be much larger. Figure 8 shows the maximum and minimum errors for the
Ike and Charley cases. This figure shows that magnitude of the interpolation errors can be
as high as 25% with the 0.5o grid spacing. Again, this can be reduced by a factor of two
by halving the grid spacing. It is recommended that the spacing of the computational grid
be reduced to improve the consistency with the text product. The MC model was adapted
to accommodate the reduced grid spacing, but that change has many downstream
implications for NHC. Those will need to be addressed by NHC before this change can
be made.
9
Figure 7. The mean absolute error of the 120 h cumulative probability of 34 and 64 kt
winds due to linear interpolation from the evenly spaced lat/lon grid to the coastal
locations for cases from Hurricanes Ike (2008) and Charley (2004).
Figure 8. Same as figure 7, but for the maximum and minimum errors at any coastal
point.
Code refinement 4. Radii model evaluation
Because NHC and JTWC do not forecast wind radii out to 120 h, the radii in the MC
model are determined from the radii CLIPER model and its error distributions, as
described above. An evaluation of the MC model wind radii was performed by
comparing the radii probability distributions generated by the MC model and the
climatological distributions. Results showed that the model does a reasonable job of
reproducing the distributions of wind radii from the NHC best track (Figure 9). Given
that the entire wind surface wind field must be estimated from just the track and
maximum wind of each realization, there are few alternatives to the simple wind radii
model, other than to apply a bias correction if the distributions were systematically
different than the observations (which they are not). If NHC, CPHC and JTWC
eventually provide wind radii forecasts for the entire forecast period, it may be possible
to improve the wind radii estimation method.

10
Figure 9. The distribution of Atlantic 34kt wind radii (nmi) from the combined NHC
forecast advisory (1988-2003) and NHC best track (2004-2008) (black) and those from
5000 realizations from 5 runs of the MC model from 2009 (blue).
3. Summary and Recommendations
Four new applications of and four improvements to the MC model wind speed
probability model were investigated. Based on forecaster feedback, several new
applications were also developed in the context of the Hurricane Landfall Probability
Application (HuLPA). Below is developer recommendations based on the project results.
Applications 1, 3 and 4 include the development of capabilities to calculate and display
landfall intensity and timing distributions, coastal integrated probabilities and automated
guidance for watches and warnings. These are included in HuLPA version 1.4 that is
already running at NHC. New applications (not in the original proposal) to HuLPA
include the addition of east Pacific and Hawaii region maps, the ability to plot and
display the time of arrival of 34, 50 and 64 kt winds, and the tracks and intensities from
the 1000 realizations in the MC model. A few additional changes to HuLPA are being
made based on additional forecaster feedback, and a version 1.5 will be provided at the
end of the 2011 season. The recommendation for this part of the project is to install
version 1.5 of HuLPA for the 2012 season that will include any final forecaster
suggestions based on the experience from the rest of the 2011 season. The HuLPA
program is considered a prototype, and includes the java-based GUI for forecaster input
and product output, and FORTRAN code for the underlying calculations. In the longer
term, NHC should consider transitioning the most useful of these HuLPA applications to
the ATCF or other operational platform.
11
Application 2 involved performing an extensive verification of the cumulative and
incremental wind speed probabilities at coastal and near-coastal points for the contiguous
U.S. coastline. This verification was performed and delivered to the Miami WFO for their
local application. This task is completed.
Code refinement 1 involved modifying the MC model time step. That modification was
implemented in 2010 since it did not increase the run time very much and makes the
probabilities more accurate. The change should be retained in the model.
Code refinement 2 is to improve the azimuthal interpolation of the wind radii in the
CLIPER model. That change was ready for the 2011 season, but uncovered an
unexpected inconsistency between the NHC wind radii at t=0 and the radius of maximum
wind the radii CLIPER model. The inconsistency has been addressed, so the developer
recommendation is for implementing this change for the 2012 season.
Code refinement 3 is related to the inconsistency between the MC probabilities on the
evenly spaced lat/lon (0.5o) grid interpolated to coastal points and the text product where
the probabilities are calculated directly on coastal points. Results showed that this
problem can be addressed by reducing the resolution of the evenly spaced grid to 0.25o.
The MC model subroutine is ready to handle this change, and the increase in run time is
not that large due to the grid optimization routines. Thus, the developer recommendation
is for the operational version of the MC model to be run on a 0.25o lat/lon grid as soon as
possible. However, there are downstream implications that NHC must address regarding
the AWIPS and other derived products.
Code refinement 4 is to address the accuracy of the wind radii CLIPER model. Results
show that the method reproduces the basic radii climatology and there are few
alternatives to determining the entire surface wind field from just the track and maximum
wind forecast. If the operational centers begin to provide wind radii forecasts for the full
forecast period, the issue can be revisited.
All of the improvements described in this report as well as a number of new applications
of the MC model are being documented in a two part paper that is in preparation for
Weather and Forecasting (DeMaria, et al, 2011b).
Presentations
DeMaria, M., S. Kidder, R. DeMaria, A. Schumacher, D. Brown, M. Brennan, R. Knabb,
P. Santos and D. Sharp, 2010: Advanced applications of the Monte Carlo wind
probability model: A Year 1 Joint Hurricane Testbed Update. Presented at the 64th
Interdepartmental Hurricane Conference, March 1-4, 2010 Savannah, GA. Available
from http://www.ofcm.gov/ihc10/linking_file_ihc10.htm .

12
DeMaria, M., R. DeMaria, A. Schumacher, D. Brown, M. Brennan, R. Knabb, P. Santos,
D. Sharp, and S. Kidder, 2011a: Advanced applications of the Monte Carlo Wind
Probability Model: A Year 2 Joint Hurricane Testbed Update. Presented at the 65th
Interdepartmental Hurricane Conference, Feb. 28 – Mar 3, 2010 Miami, FL. <Available
from http://www.ofcm.gov/ihc11/linking_file_ihc11.htm>
Publications
DeMaria, M., J.A. Knaff, M.J. Brennan, D. Brown, C. Lauer, R.T. DeMaria, A.
Schumacher, R.D. Knabb, D.P. Roberts, C.R. Sampson, P. Santos, D. Sharp and K.A.
Winters, 2011b: Operational tropical cyclone wind speed probabilities: Part I. Recent
model improvements and Verification. To be submitted to Wea. Forecasting, Dec 2012.
DeMaria, M., J.A. Knaff, M.J. Brennan, D. Brown, C. Lauer, R.T. DeMaria, A.
Schumacher, R.D. Knabb, D.P. Roberts, C.R. Sampson, P. Santos, D. Sharp and K.A.
Winters, 2011b: Operational tropical cyclone wind speed probabilities: Part II. Advanced
Applications. To be submitted to Wea. Forecasting, Dec 2012.
Santos, P., M. DeMaria and D.W. Sharp, 2010: Determining optimal thresholds for
inland locations of tropical cyclone incremental wind speed probabilities to support the
provision of expressions of uncertainty within text forecast products. Extended Abstract,
AMS 20th
Conference on Probability and Statistics in the Atmospheric Sciences (18-21
Jan. 2010)(Atlanta, GA). Available from
http://ams.confex.com/ams/90annual/techprogram/paper_160384.htm
Schumacher, A.B., M. DeMaria, J. Knaff, C.R. Sampson, and D. P. Brown, 2010:
Objective tropical cyclone warning guidance using Monte Carlo wind speed probabilities.
Extended Abstract, 29th
Conference on Hurricanes and Tropical Meteorology, (10-14
May 2010) (Tucson, AZ). Available from
http://ams.confex.com/ams/29Hurricanes/techprogram/paper_168839.htm
13
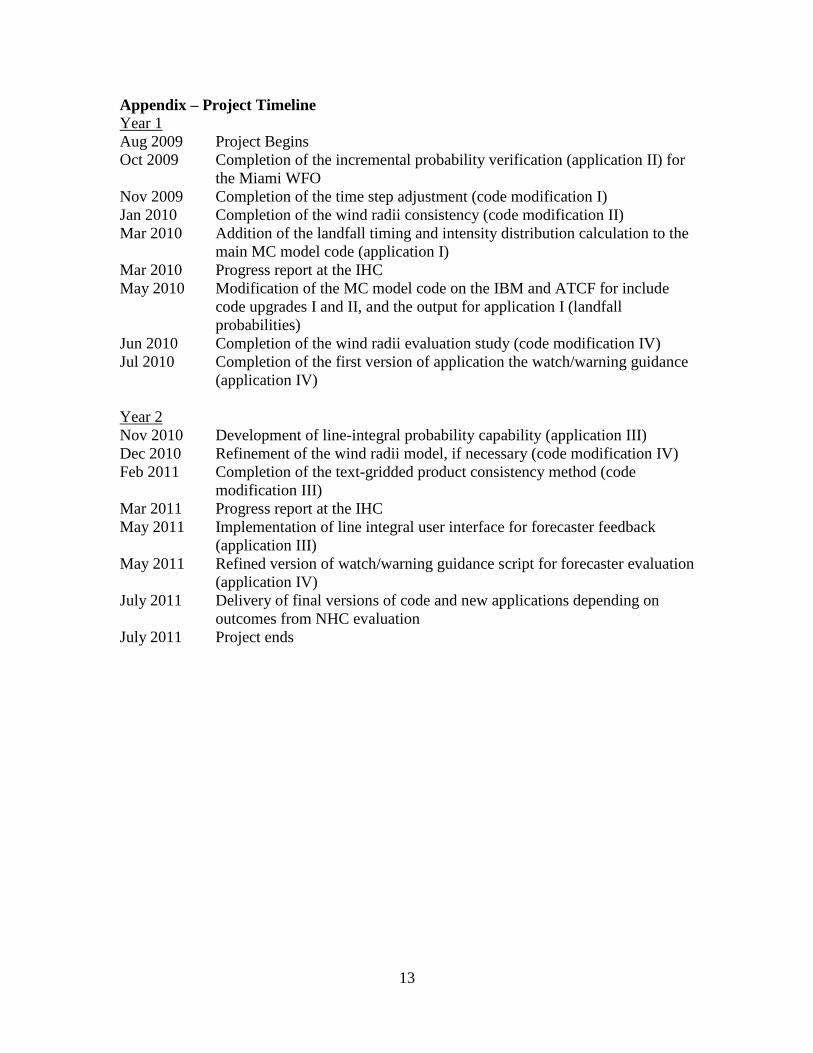
Appendix – Project Timeline
Year 1
Aug 2009 Project Begins
Oct 2009 Completion of the incremental probability verification (application II) for
the Miami WFO
Nov 2009 Completion of the time step adjustment (code modification I)
Jan 2010 Completion of the wind radii consistency (code modification II)
Mar 2010 Addition of the landfall timing and intensity distribution calculation to the
main MC model code (application I)
Mar 2010 Progress report at the IHC
May 2010 Modification of the MC model code on the IBM and ATCF for include
code upgrades I and II, and the output for application I (landfall
probabilities)
Jun 2010 Completion of the wind radii evaluation study (code modification IV)
Jul 2010 Completion of the first version of application the watch/warning guidance
(application IV)
Year 2
Nov 2010 Development of line-integral probability capability (application III)
Dec 2010 Refinement of the wind radii model, if necessary (code modification IV)
Feb 2011 Completion of the text-gridded product consistency method (code
modification III)
Mar 2011 Progress report at the IHC
May 2011 Implementation of line integral user interface for forecaster feedback
(application III)
May 2011 Refined version of watch/warning guidance script for forecaster evaluation
(application IV)
July 2011 Delivery of final versions of code and new applications depending on
outcomes from NHC evaluation
July 2011 Project ends
Recommended