
New LSA Research & LSA 15 Conference Preview
April 2, 2015
About me • Local Search Association, Search Engine Land• Impact of digital media on offline consumer
behavior• Search, local, mobile, social + indoor location• Twitter: @gsterling
About me
You must unlearn what you have learned
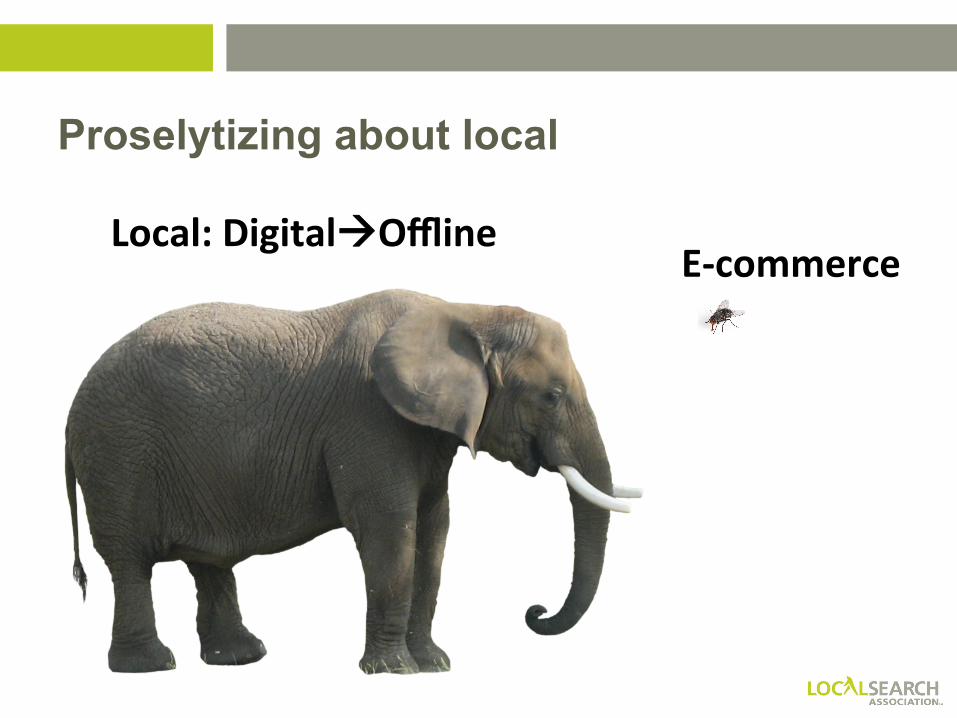
Proselytizing about local
E-‐commerce Local: DigitalàOffline

The big-picture numbers
• US GDP (2014): nearly $18 Trillion• 70% of economy = consumer spending (most within 15 - 20 miles) • 93% of retail spending offline; e-commerce (2014): roughly $304 billion • Roughly 80% of internet users do online research before buying offline
Source: US Commerce Department, US Bureau of Economic Analysis (2014); Opus Research, E-tailing Group (2012 – 2014)

A Brief Word about the New LSA
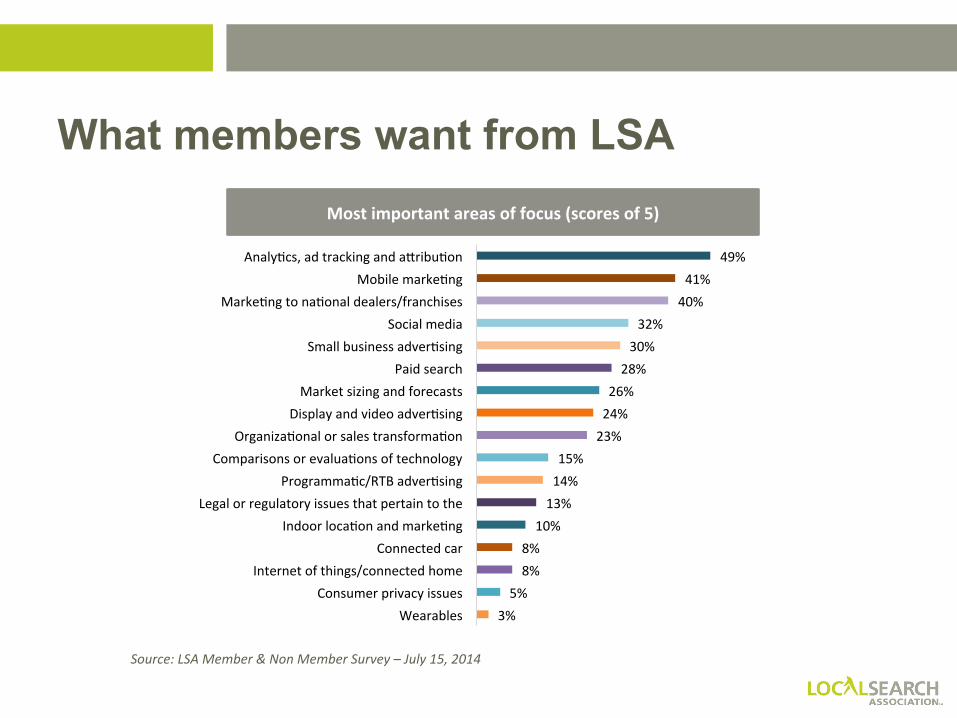
Most important areas of focus (scores of 5)
3% 5% 8% 8% 10% 13% 14% 15%
23% 24% 26% 28% 30% 32%
40% 41%
49%
Wearables Consumer privacy issues
Internet of things/connected home Connected car
Indoor locaFon and markeFng Legal or regulatory issues that pertain to the
ProgrammaFc/RTB adverFsing Comparisons or evaluaFons of technology
OrganizaFonal or sales transformaFon Display and video adverFsing Market sizing and forecasts
Paid search Small business adverFsing
Social media MarkeFng to naFonal dealers/franchises
Mobile markeFng AnalyFcs, ad tracking and aTribuFon
Source: LSA Member & Non Member Survey – July 15, 2014
What members want from LSA
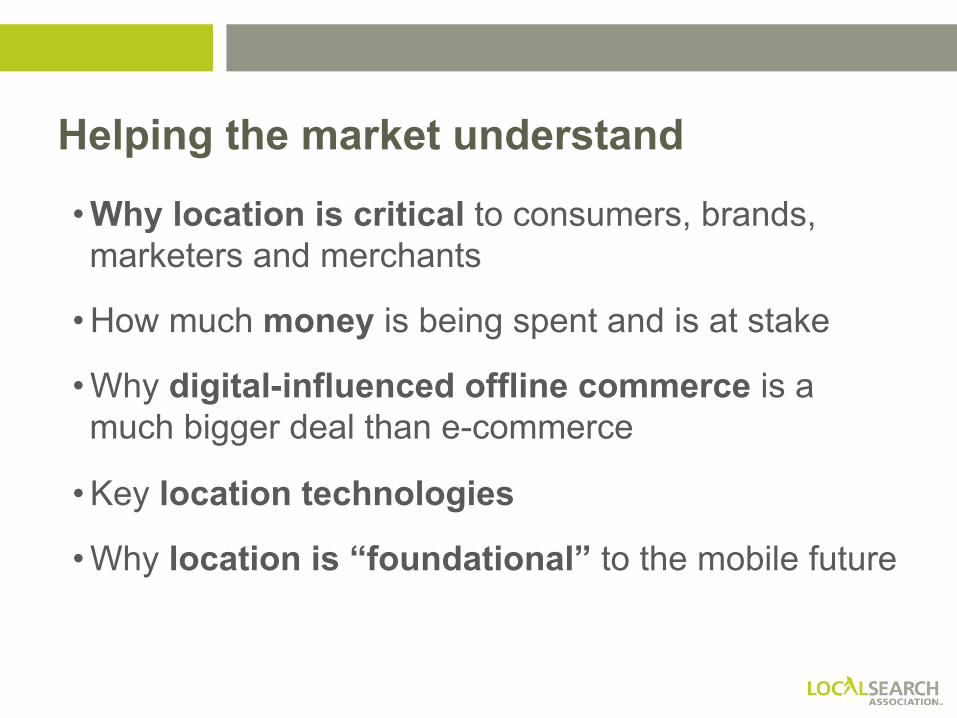
Helping the market understand
• Why location is critical to consumers, brands, marketers and merchants
• How much money is being spent and is at stake
• Why digital-influenced offline commerce is a much bigger deal than e-commerce
• Key location technologies
• Why location is “foundational” to the mobile future
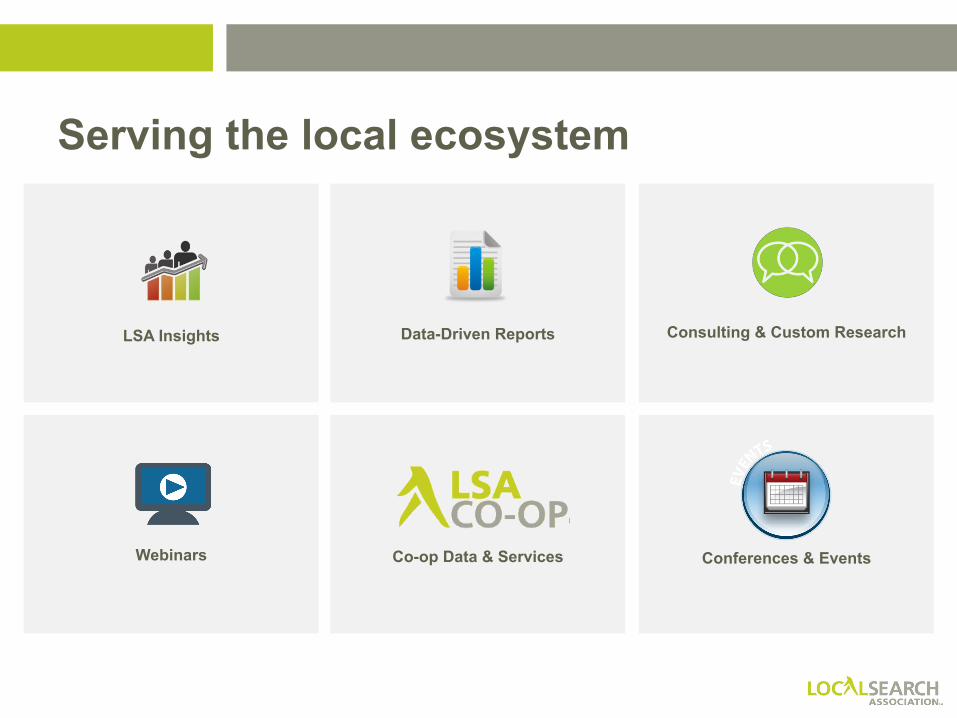
LSA Insights Data-Driven Reports Consulting & Custom Research
Webinars Co-op Data & Services Conferences & Events
Serving the local ecosystem
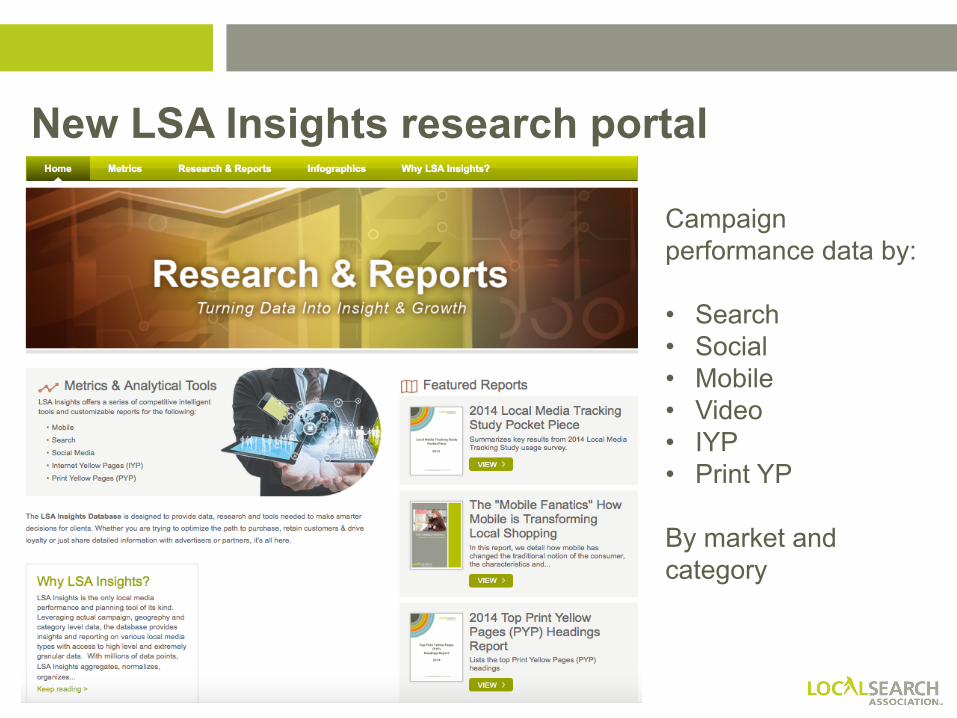
New LSA Insights research portal
Campaign performance data by: • Search • Social • Mobile • Video • IYP • Print YP
By market and category
Migration to Mobile
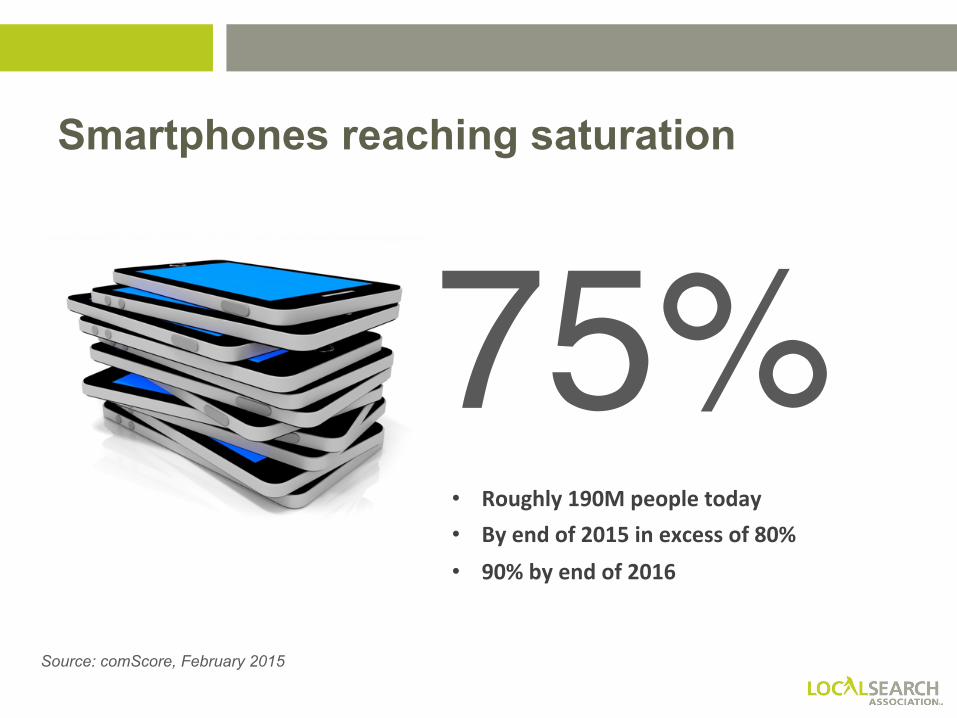
75%Source: comScore, February 2015
• Roughly 190M people today • By end of 2015 in excess of 80% • 90% by end of 2016
Smartphones reaching saturation
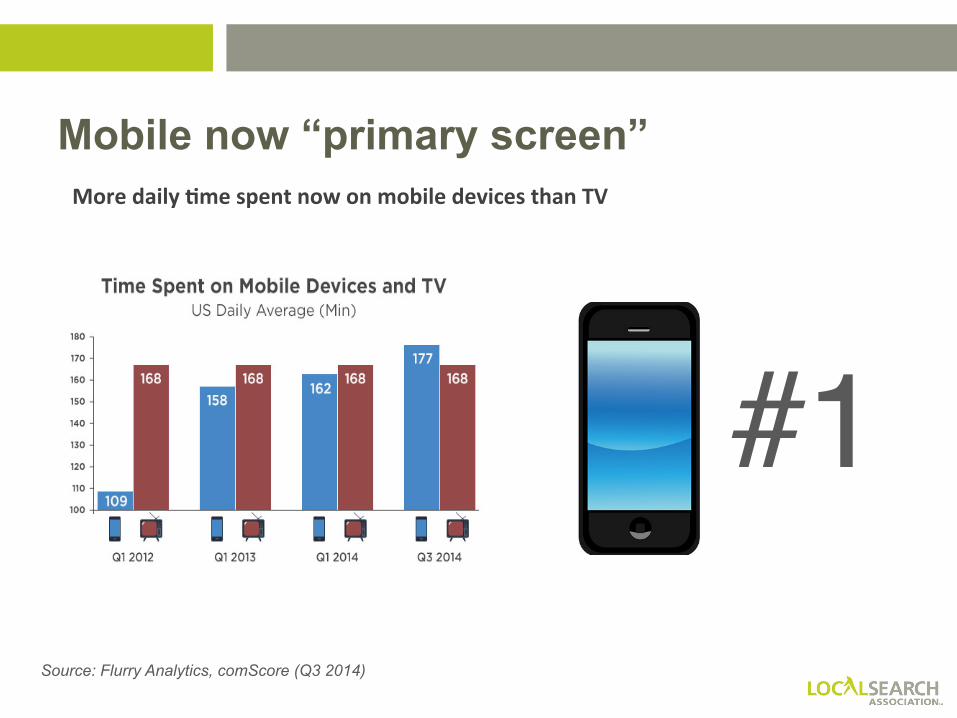
#1Source: Flurry Analytics, comScore (Q3 2014)
More daily Jme spent now on mobile devices than TV
Mobile now “primary screen”
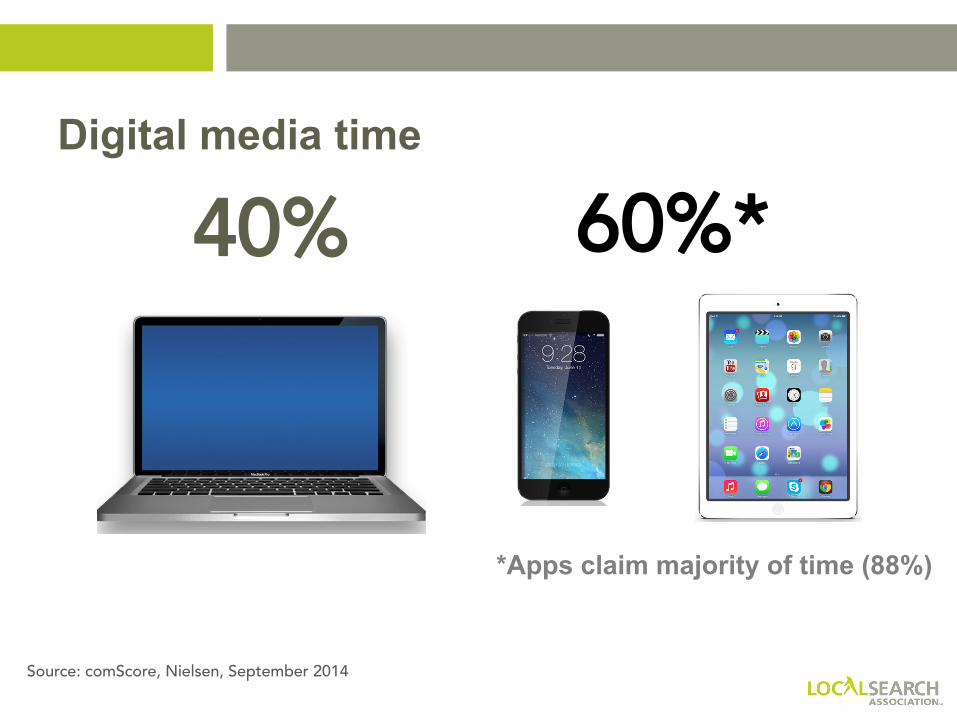
60%* 40%
*Apps claim majority of time (88%)
Source: comScore, Nielsen, September 2014
Digital media time
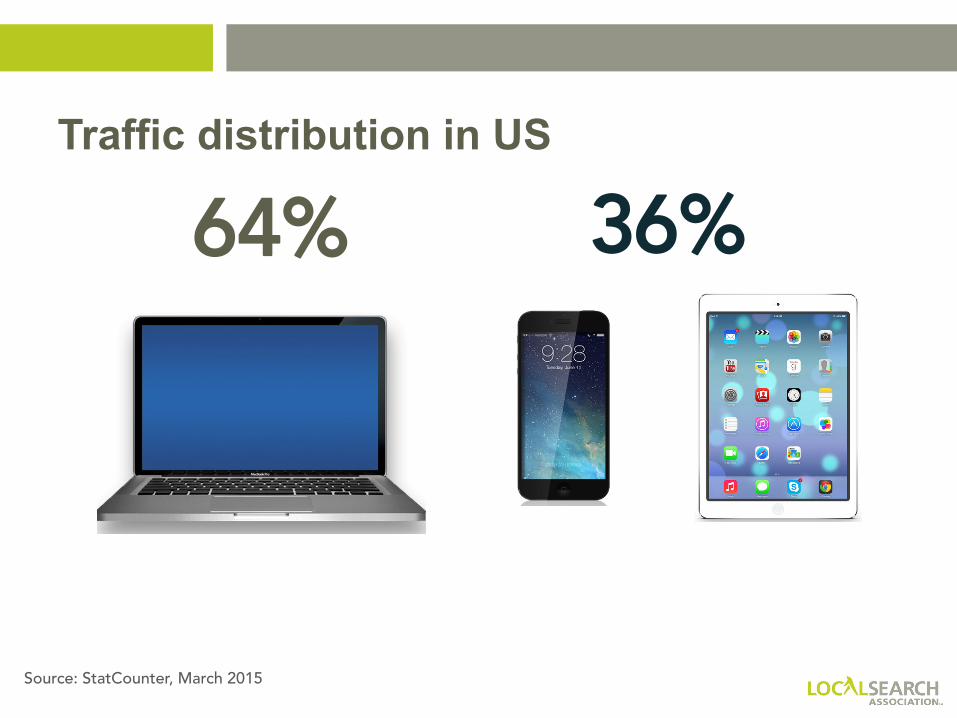
36% 64%
Source: StatCounter, March 2015
Traffic distribution in US
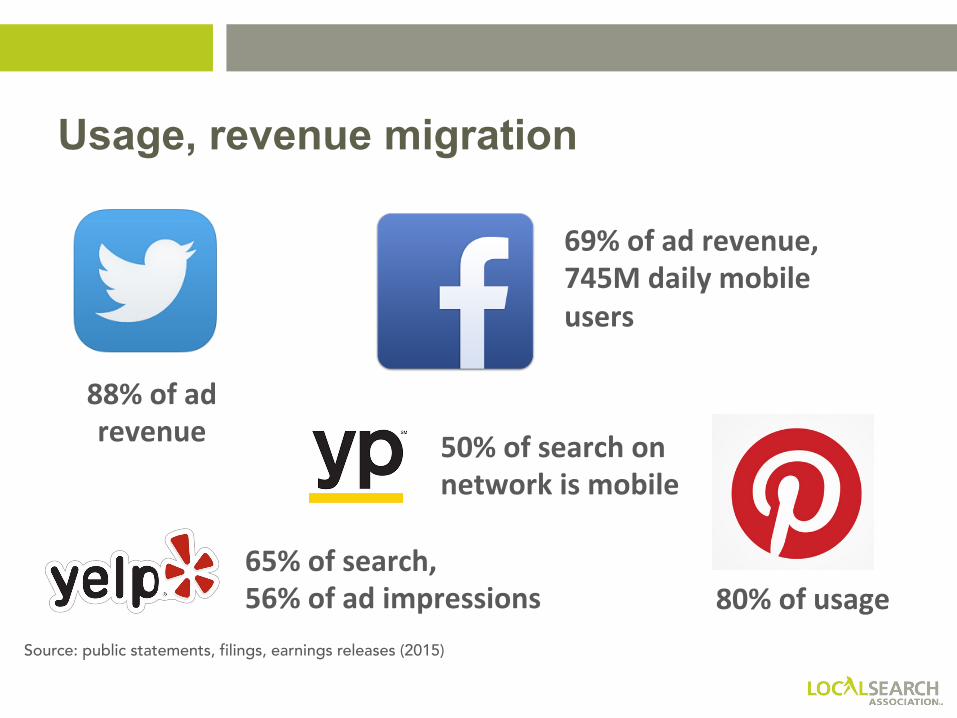
Usage, revenue migration
65% of search, 56% of ad impressions
88% of ad revenue
69% of ad revenue, 745M daily mobile users
Source: public statements, filings, earnings releases (2015)
80% of usage
50% of search on network is mobile
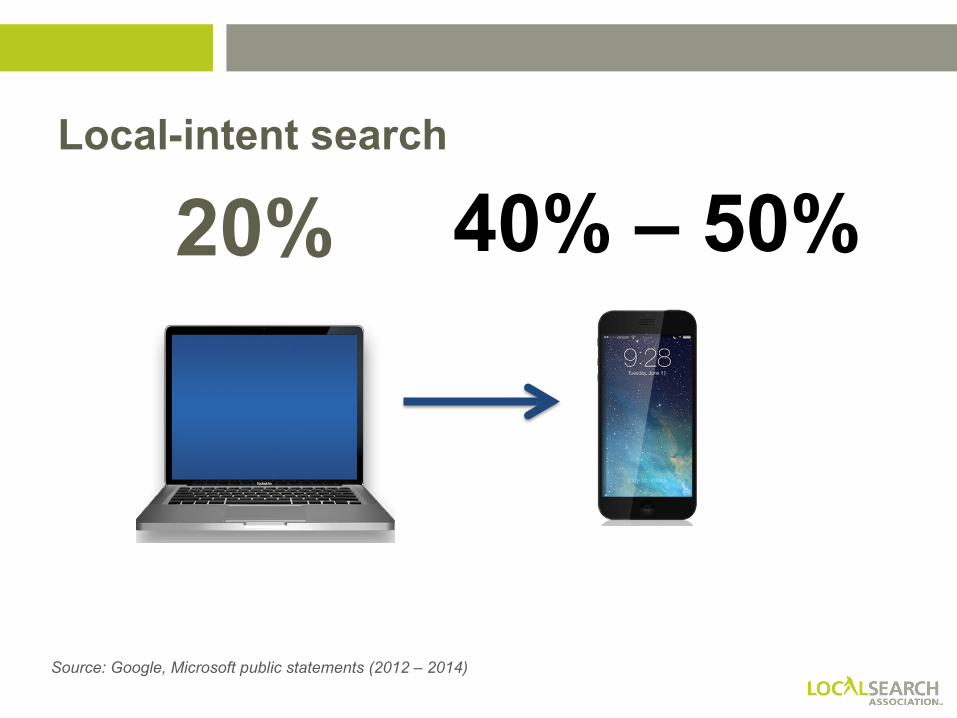
40% – 50% 20%
Source: Google, Microsoft public statements (2012 – 2014)
Local-intent search
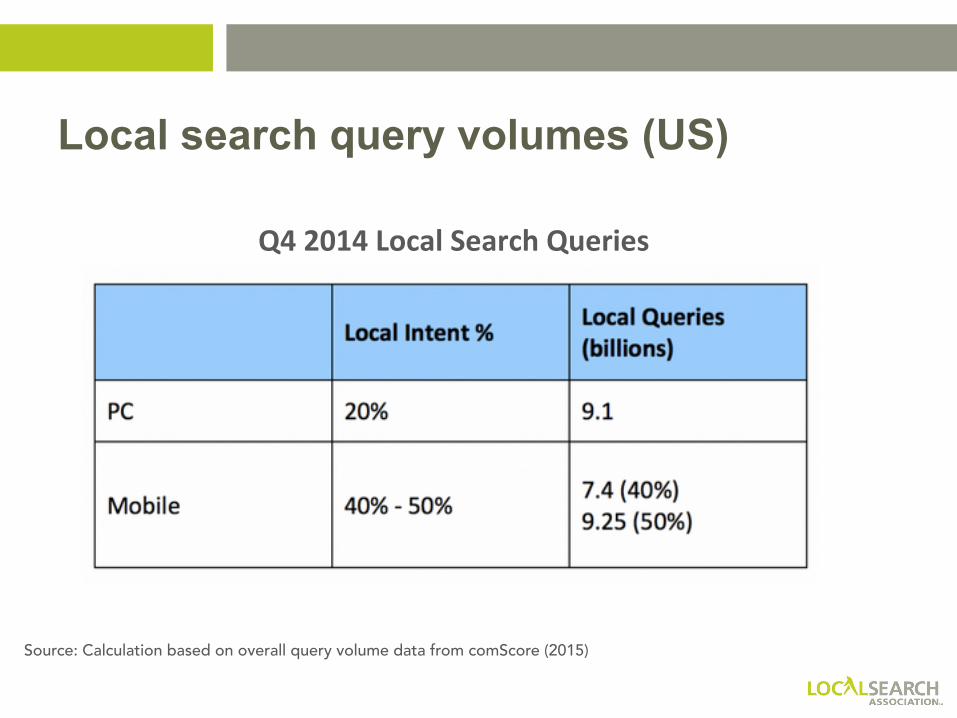
Local search query volumes (US)
Source: Calculation based on overall query volume data from comScore (2015)
Q4 2014 Local Search Queries
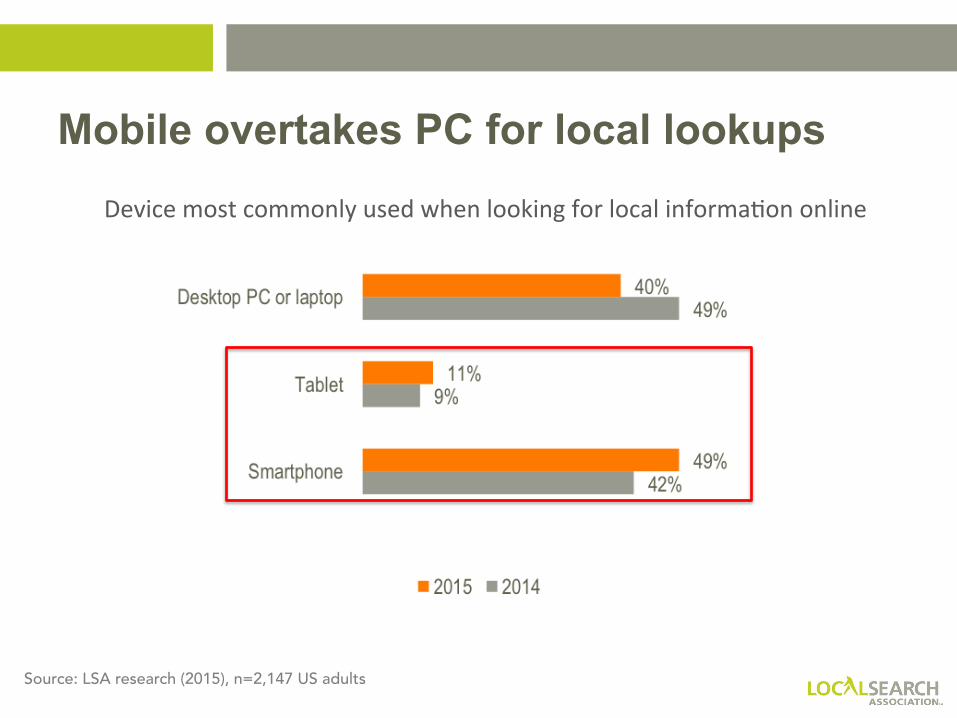
Mobile overtakes PC for local lookups
Device most commonly used when looking for local informaFon online
Source: LSA research (2015), n=2,147 US adults
Source: LSA research (2015), n=2,147 US adults
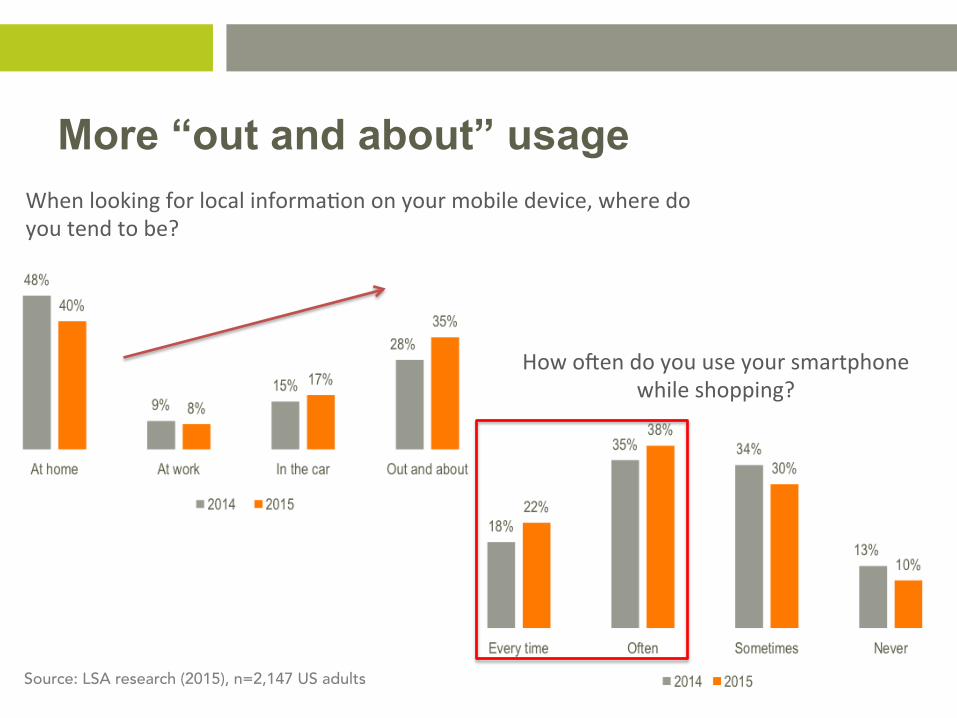
When looking for local informaFon on your mobile device, where do you tend to be?
How oWen do you use your smartphone while shopping?
More “out and about” usage
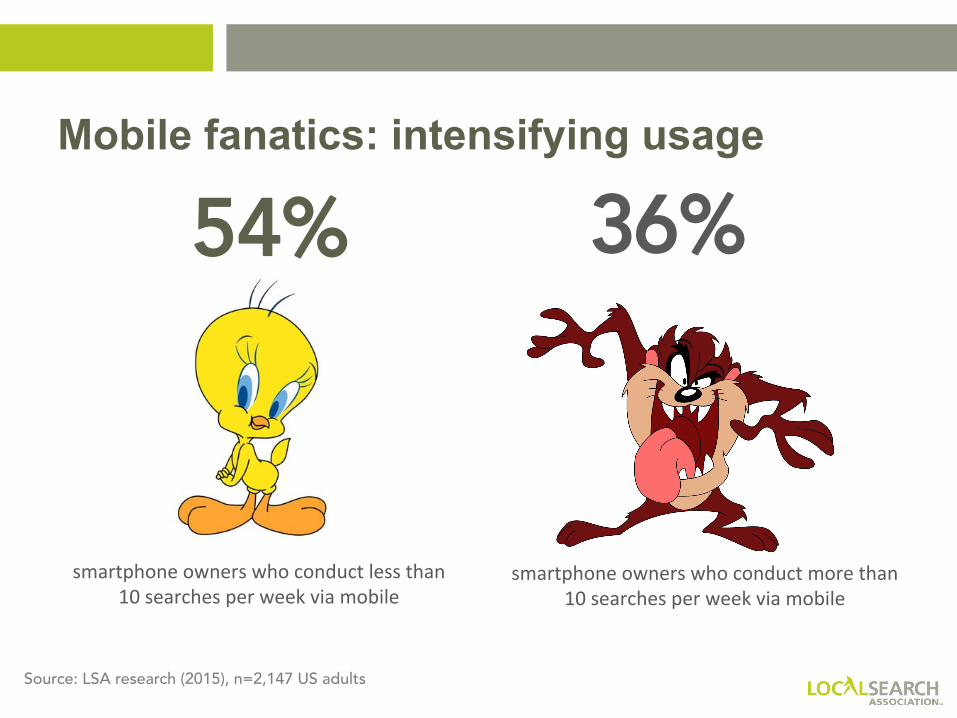
36% 54% Mobile fanatics: intensifying usage
Source: LSA research (2015), n=2,147 US adults
smartphone owners who conduct less than 10 searches per week via mobile
smartphone owners who conduct more than 10 searches per week via mobile
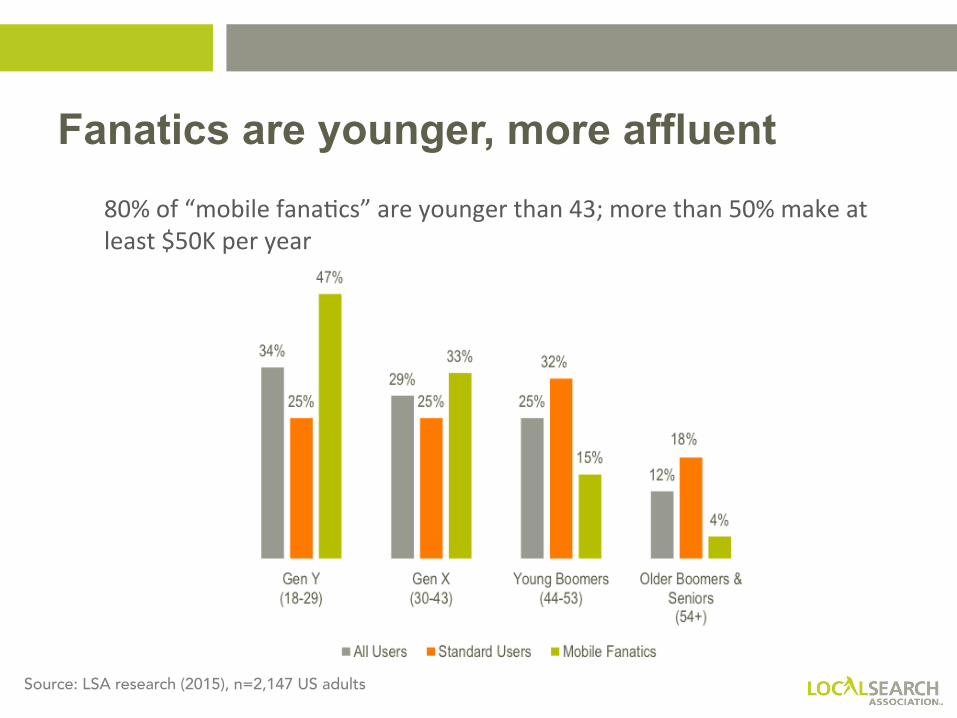
Fanatics are younger, more affluent
Source: LSA research (2015), n=2,147 US adults
80% of “mobile fanaFcs” are younger than 43; more than 50% make at least $50K per year
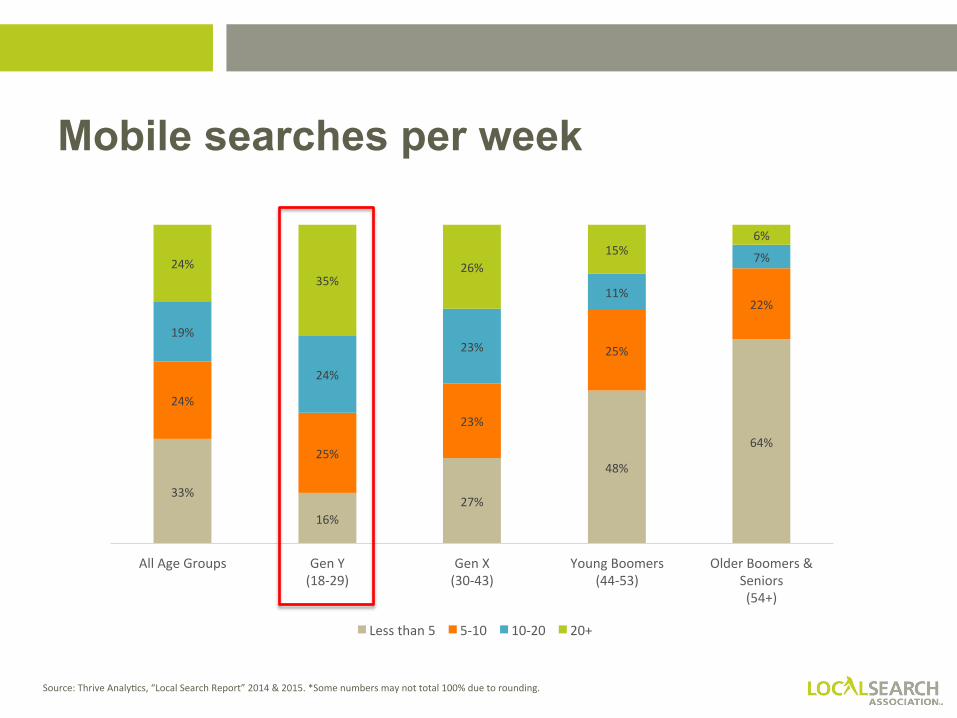
Mobile searches per week
Source: Thrive AnalyFcs, “Local Search Report” 2014 & 2015. *Some numbers may not total 100% due to rounding.
33%
16% 27%
48%
64%
24%
25%
23%
25%
22%
19%
24%
23%
11%
7% 24% 35%
26% 15%
6%
All Age Groups Gen Y (18-‐29)
Gen X (30-‐43)
Young Boomers (44-‐53)
Older Boomers & Seniors (54+)
Less than 5 5-‐10 10-‐20 20+
Source: LSA research (2015), n=2,147 US adults
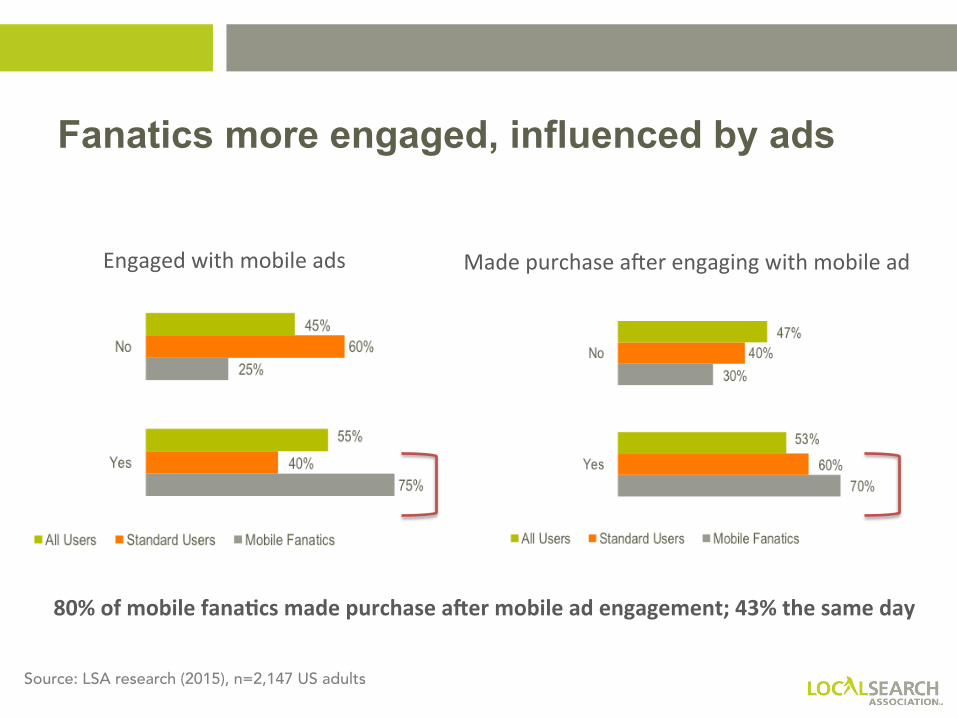
Engaged with mobile ads Made purchase aWer engaging with mobile ad
Fanatics more engaged, influenced by ads
80% of mobile fanaJcs made purchase aUer mobile ad engagement; 43% the same day
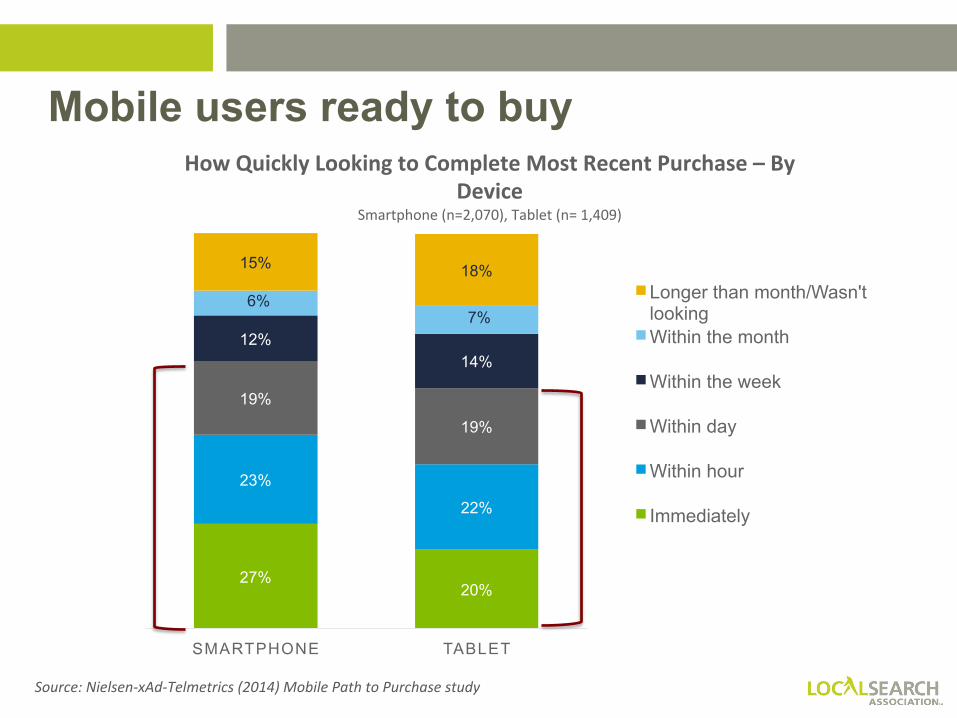
27% 20%
23%
22%
19%
19%
12% 14%
6% 7%
15% 18%
SMARTPHONE TABLET
Longer than month/Wasn't looking Within the month
Within the week
Within day
Within hour
Immediately
How Quickly Looking to Complete Most Recent Purchase – By Device
Smartphone (n=2,070), Tablet (n= 1,409)
Source: Nielsen-‐xAd-‐Telmetrics (2014) Mobile Path to Purchase study
Mobile users ready to buy
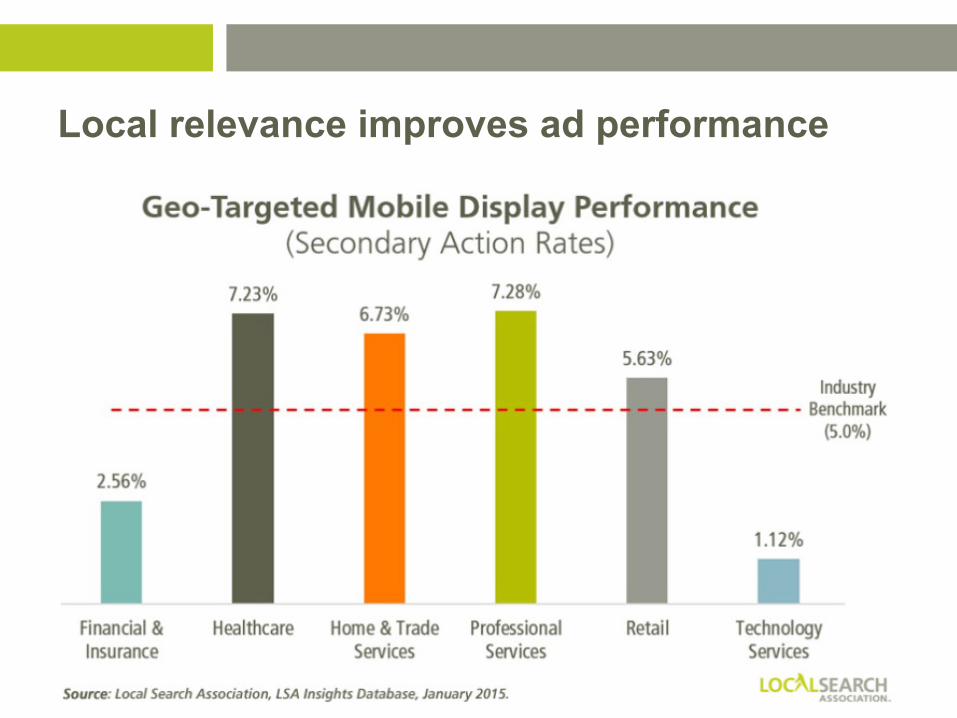
Local relevance improves ad performance
Mktrs Haven’t Kept Up
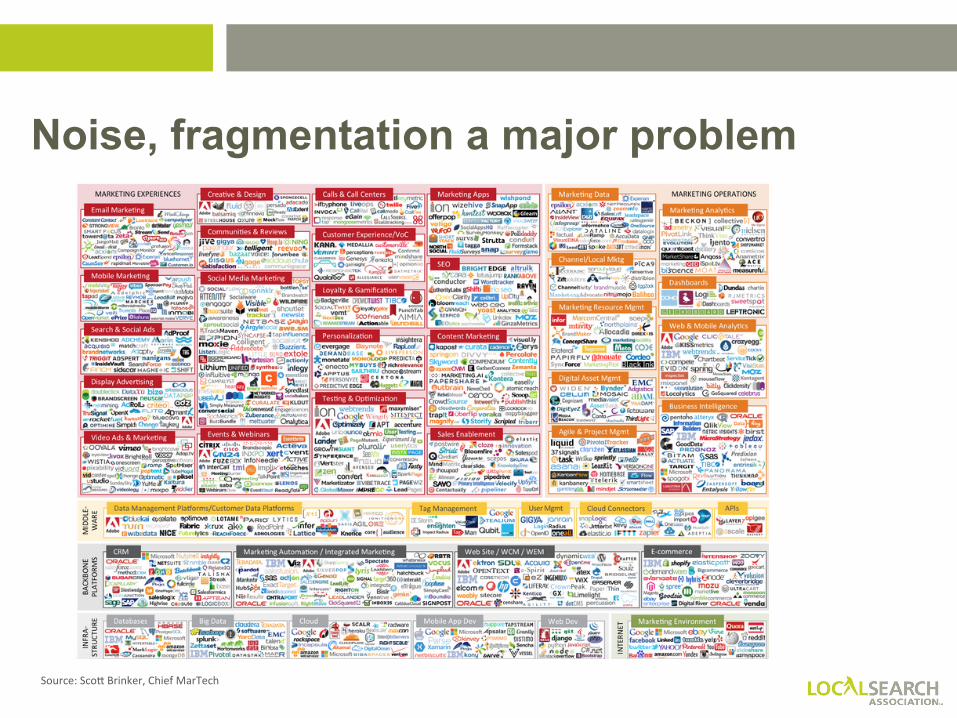
Noise, fragmentation a major problem
Source: ScoT Brinker, Chief MarTech
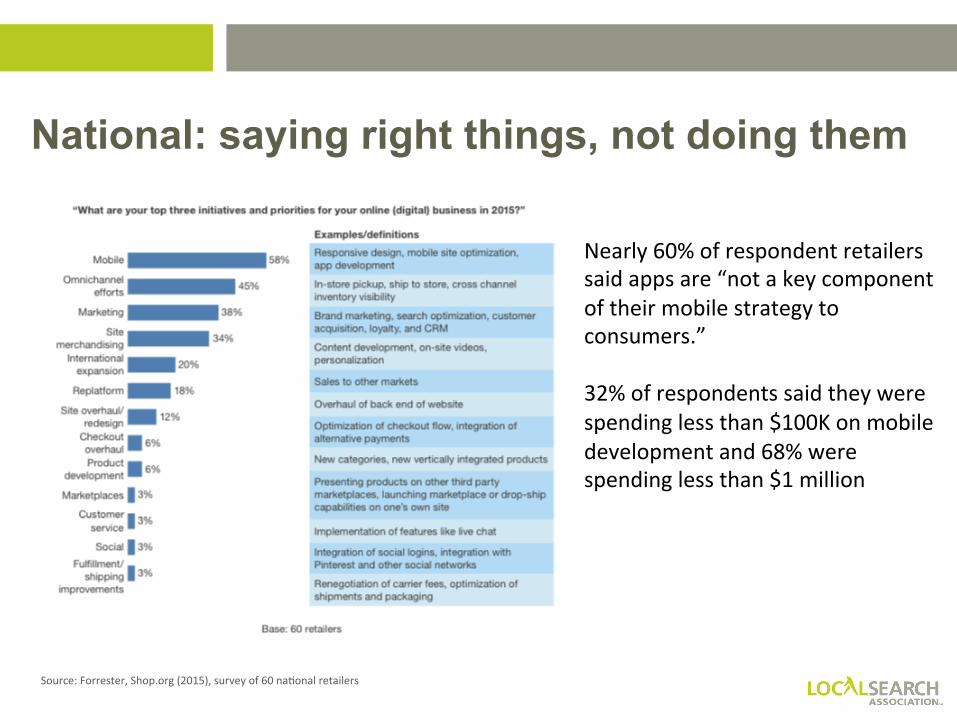
National: saying right things, not doing them
Source: Forrester, Shop.org (2015), survey of 60 naFonal retailers
Nearly 60% of respondent retailers said apps are “not a key component of their mobile strategy to consumers.” 32% of respondents said they were spending less than $100K on mobile development and 68% were spending less than $1 million
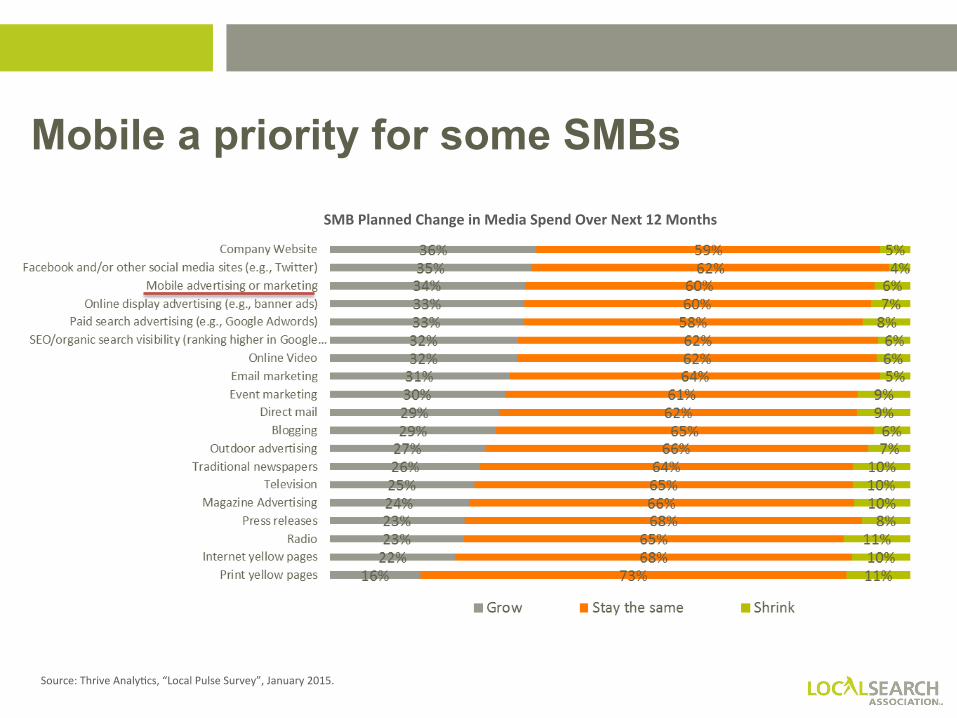
Mobile a priority for some SMBs
Source: Thrive AnalyFcs, “Local Pulse Survey”, January 2015.
SMB Planned Change in Media Spend Over Next 12 Months
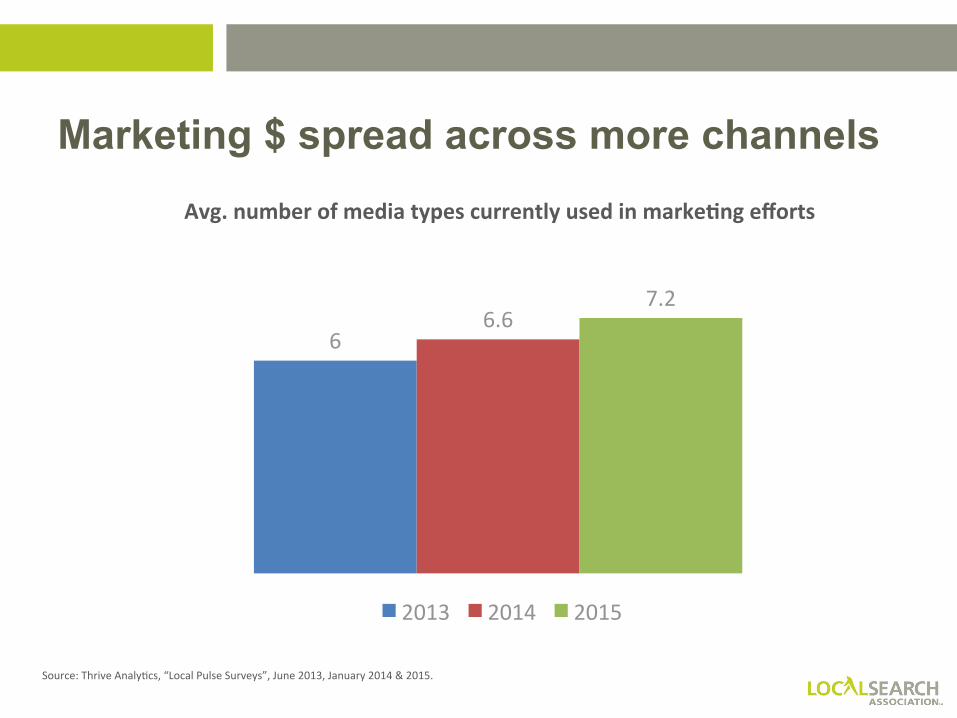
Marketing $ spread across more channels
6 6.6
7.2
2013 2014 2015
Source: Thrive AnalyFcs, “Local Pulse Surveys”, June 2013, January 2014 & 2015.
Avg. number of media types currently used in markeJng efforts
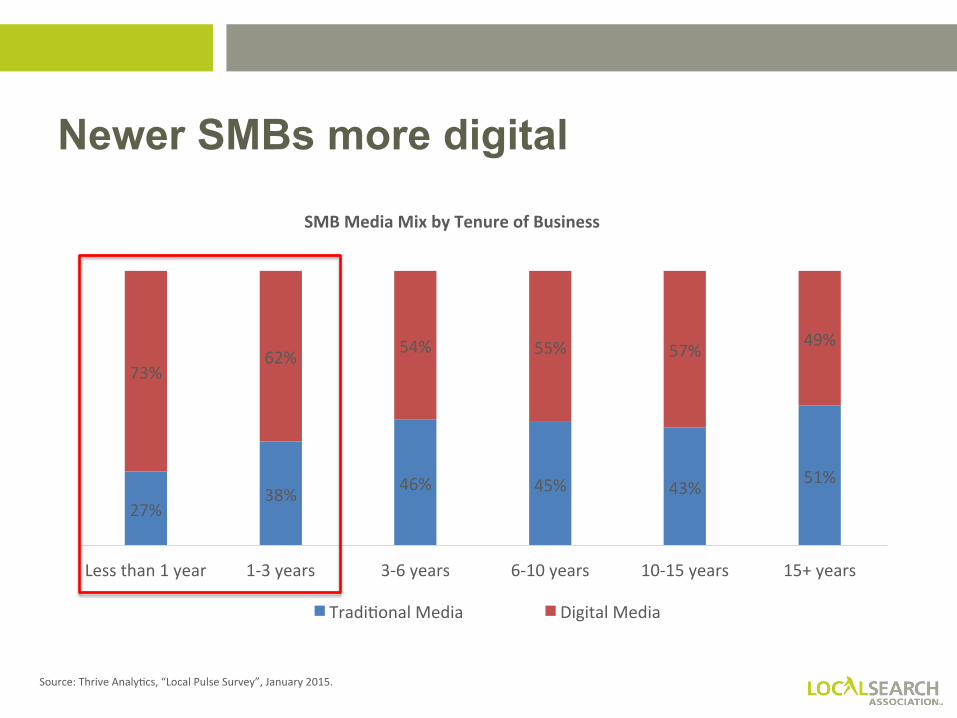
Newer SMBs more digital
27% 38% 46% 45% 43% 51%
73% 62% 54% 55% 57% 49%
Less than 1 year 1-‐3 years 3-‐6 years 6-‐10 years 10-‐15 years 15+ years
TradiFonal Media Digital Media
Source: Thrive AnalyFcs, “Local Pulse Survey”, January 2015.
SMB Media Mix by Tenure of Business
In fact, most SMBs not mobile-ready
• 60% have no strategy to market to mobile consumers
• 60% of SMBs don’t utilize tools to measure performance
Source: Thrive AnalyFcs, “Local Pulse Survey”. January 2015.
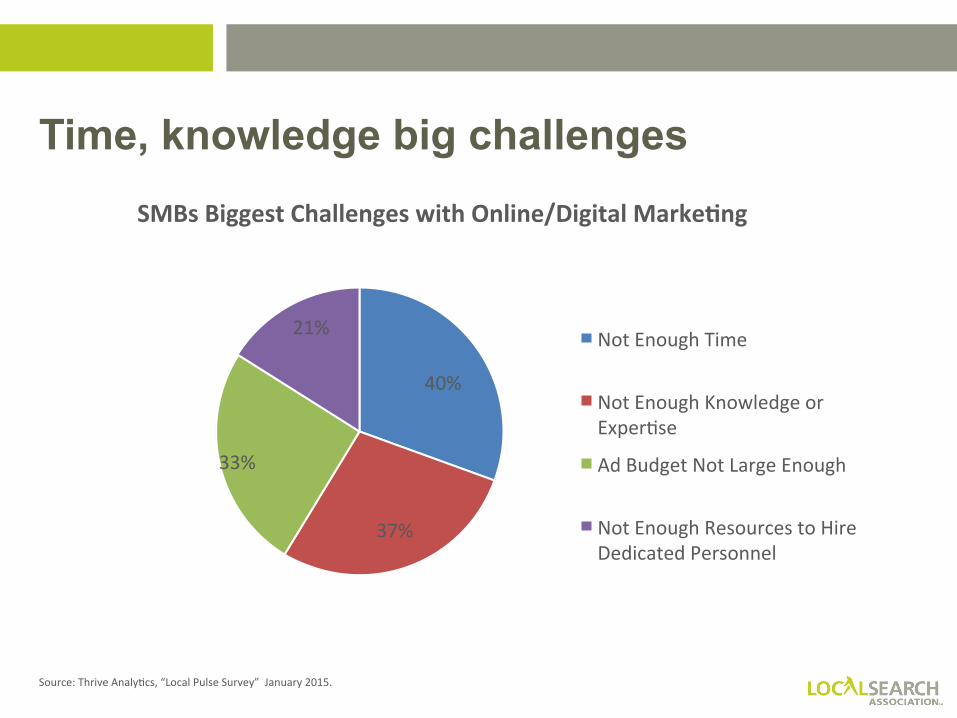
Time, knowledge big challenges
40%
37%
33%
21% Not Enough Time
Not Enough Knowledge or ExperFse
Ad Budget Not Large Enough
Not Enough Resources to Hire Dedicated Personnel
Source: Thrive AnalyFcs, “Local Pulse Survey” January 2015.
SMBs Biggest Challenges with Online/Digital MarkeJng
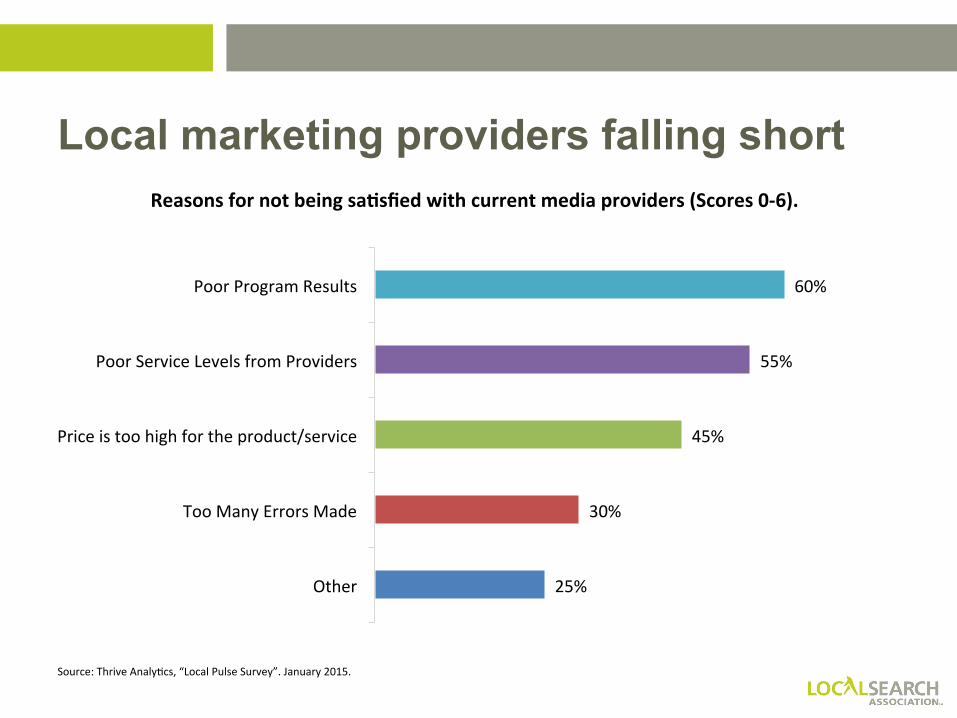
Local marketing providers falling short
25%
30%
45%
55%
60%
Other
Too Many Errors Made
Price is too high for the product/service
Poor Service Levels from Providers
Poor Program Results
Reasons for not being saJsfied with current media providers (Scores 0-‐6).
Source: Thrive AnalyFcs, “Local Pulse Survey”. January 2015.
Conference: LSA 15
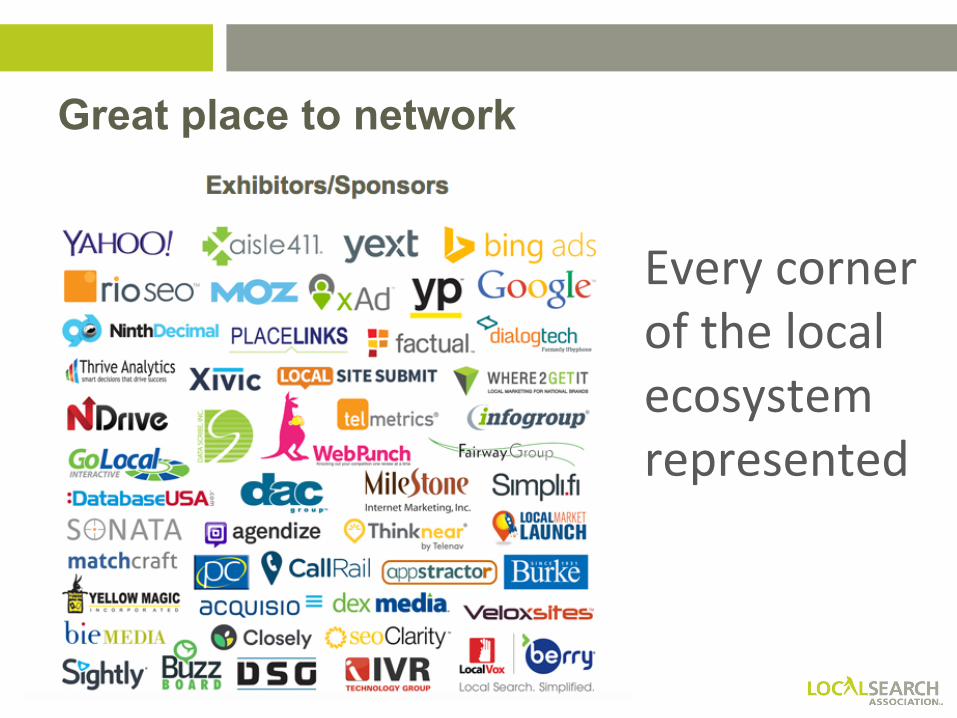
Great place to network
Every corner of the local ecosystem represented
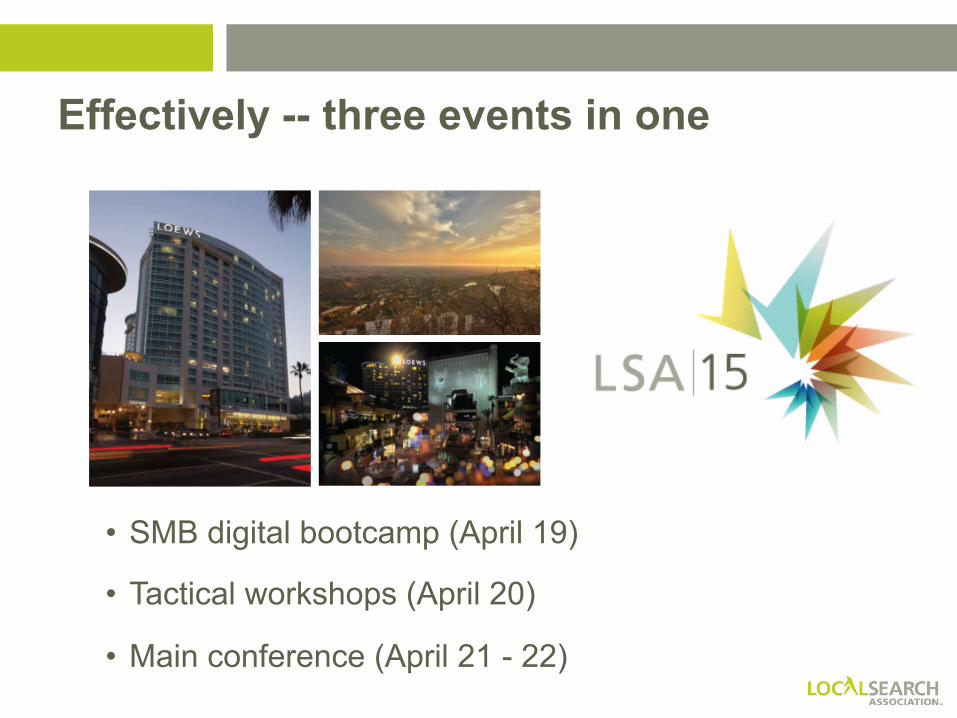
Effectively -- three events in one
• SMB digital bootcamp (April 19)
• Tactical workshops (April 20)
• Main conference (April 21 - 22)
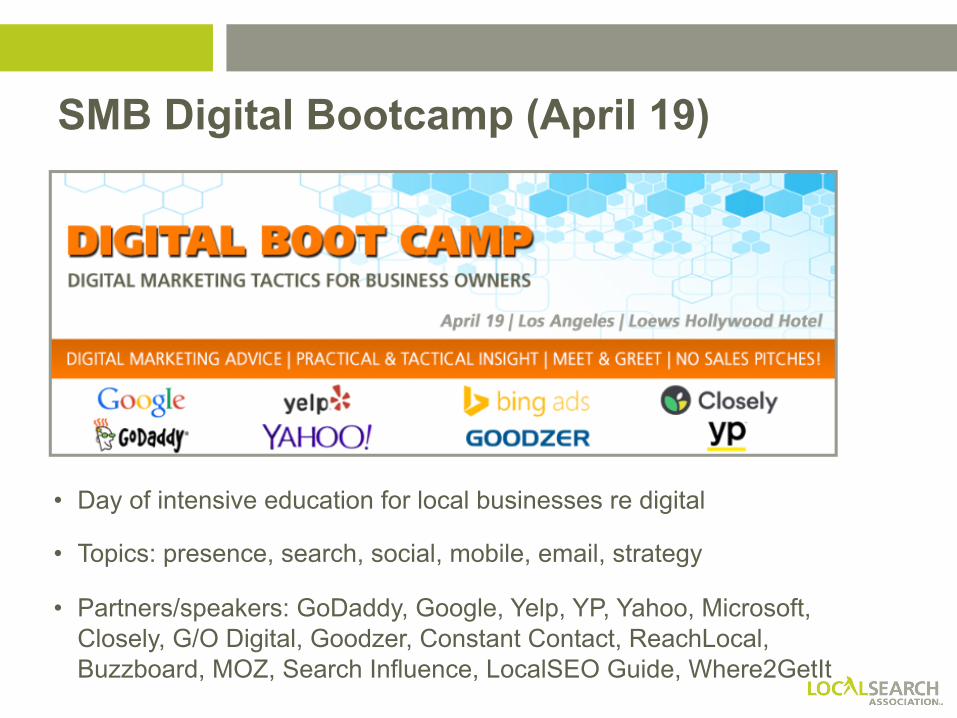
SMB Digital Bootcamp (April 19)
• Day of intensive education for local businesses re digital
• Topics: presence, search, social, mobile, email, strategy
• Partners/speakers: GoDaddy, Google, Yelp, YP, Yahoo, Microsoft, Closely, G/O Digital, Goodzer, Constant Contact, ReachLocal, Buzzboard, MOZ, Search Influence, LocalSEO Guide, Where2GetIt
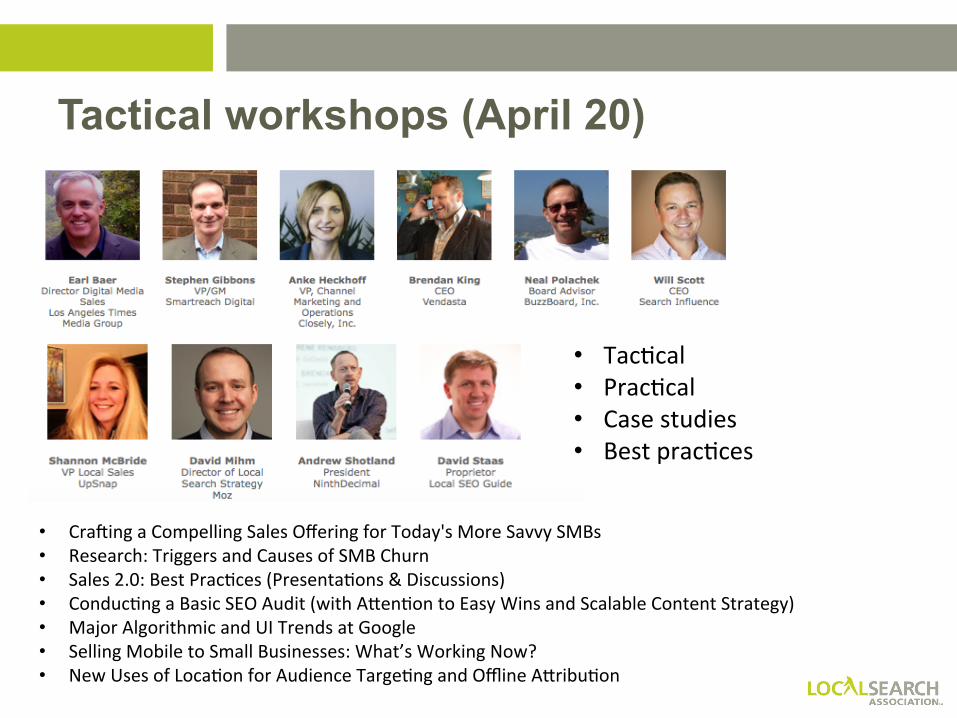
Tactical workshops (April 20)
• CraWing a Compelling Sales Offering for Today's More Savvy SMBs • Research: Triggers and Causes of SMB Churn • Sales 2.0: Best PracFces (PresentaFons & Discussions) • ConducFng a Basic SEO Audit (with ATenFon to Easy Wins and Scalable Content Strategy) • Major Algorithmic and UI Trends at Google • Selling Mobile to Small Businesses: What’s Working Now? • New Uses of LocaFon for Audience TargeFng and Offline ATribuFon
• TacFcal • PracFcal • Case studies • Best pracFces
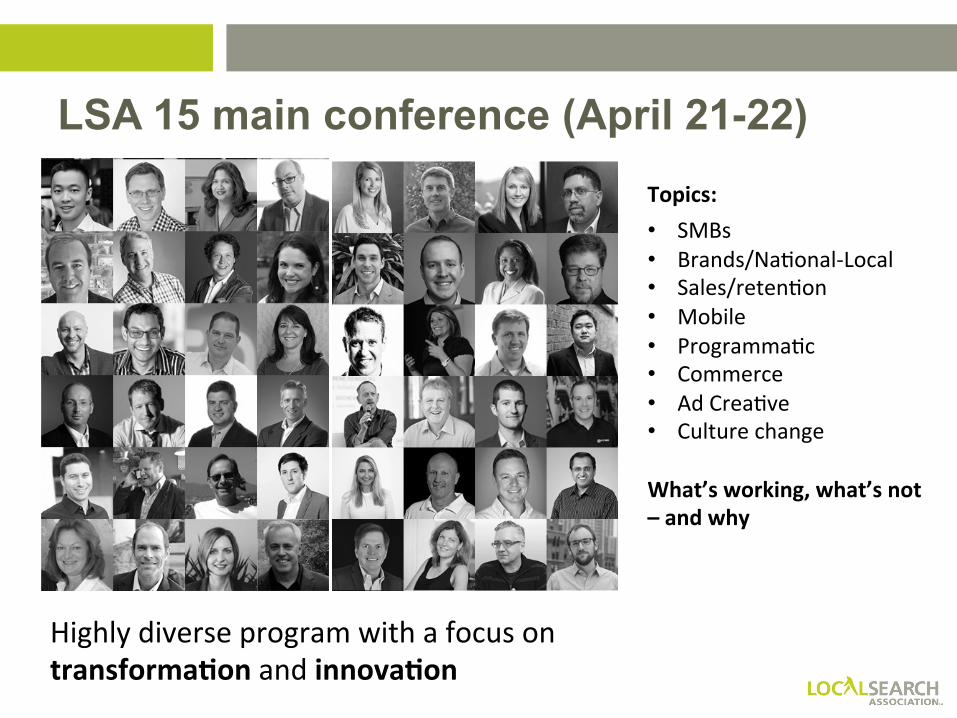
LSA 15 main conference (April 21-22) Topics:
• SMBs • Brands/NaFonal-‐Local • Sales/retenFon • Mobile • ProgrammaFc • Commerce • Ad CreaFve • Culture change
What’s working, what’s not – and why
Highly diverse program with a focus on transformaJon and innovaJon
Key sessions
Hope to see you there: http://thelsa.org
• Research: Triggers and Causes of SMB Churn • Serving the Small-‐Budget Marketer • Selling Mobile to Small Businesses: What’s Working Now? • Major Algorithmic and UI Trends at Google: What They Mean • How Mobile Commerce Will Change Local • The Art of Mobile Ad CreaFve • The ProgrammaFc Future: Where Does Local Fit? • The Brand PerspecFve or How I learned to Embrace Chaos • Digital Assistants and the Future of Search

Questions
Recommended