A Solution to Water Crisis in Energy Production:
Feasibility of Using Impaired Waters for Coal Fired
Power Plant Cooling
Heng Li, Shih-Hsiang Chien, Radisav Vidic
University of Pittsburgh
Ming-Kai Hsieh, David Dzombak
Carnegie Mellon University

OVERVIEW
• Water-Energy Nexus
• Water requirements in thermoelectric power
production
• Alternative waters for power plant cooling
• Research materials and methods
• Results and discussions
• Summary

WATER-ENERGY NEXUS
Current Approach:
• Planning for future electricity production without considering how water requirements will be met over time, and
• Planning for future water resources with the assumption that electricity will be readily availability
Energy-water relationship:
• Need electricity to produce water
• Need water to produce electricity
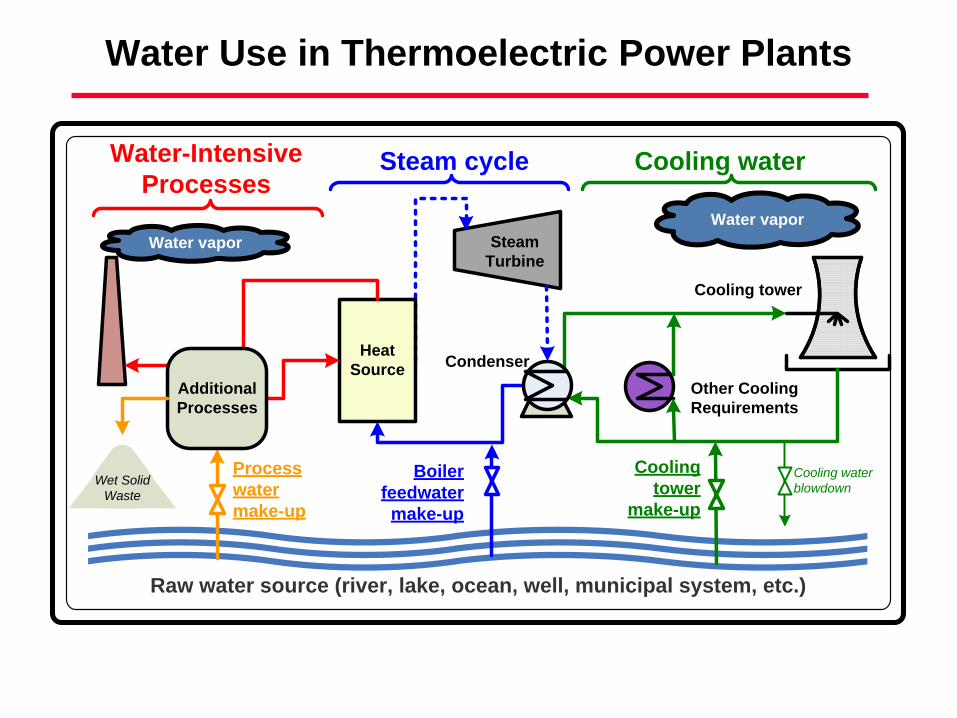
Water Use in Thermoelectric Power Plants
Water vapor
Water vapor
Water-Intensive
ProcessesSteam cycle Cooling water
Condenser
Cooling tower
Heat
Source
Boiler
feedwater
make-up
Cooling
tower
make-up
Process
water
make-up
Cooling water
blowdown
Raw water source (river, lake, ocean, well, municipal system, etc.)
Other Cooling
Requirements
Steam
Turbine
Additional
Processes
Wet Solid
Waste
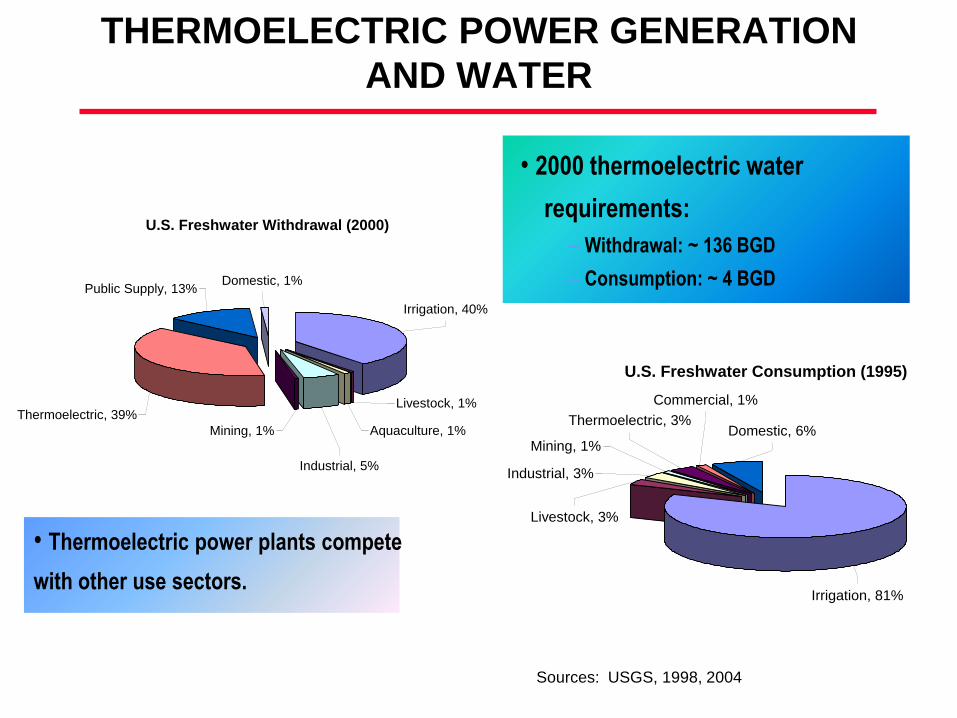
THERMOELECTRIC POWER GENERATION
AND WATER
U.S. Freshwater Withdrawal (2000)
Thermoelectric, 39%
Public Supply, 13%Domestic, 1%
Irrigation, 40%
Livestock, 1%
Aquaculture, 1%
Industrial, 5%
Mining, 1%
U.S. Freshwater Consumption (1995)
Thermoelectric, 3%
Mining, 1%
Industrial, 3%
Livestock, 3%
Irrigation, 81%
Domestic, 6%
Commercial, 1%
Sources: USGS, 1998, 2004
• 2000 thermoelectric water
requirements:
– Withdrawal: ~ 136 BGD
– Consumption: ~ 4 BGD
• Thermoelectric power plants compete
with other use sectors.

LIMITATIONS IN WATER AVAILABILITY FOR
POWER PLANT COOLING
TX
CA
MT
AZ
ID
NV
NM
CO
IL
OR
UT
KS
WY
IANE
SD
MN
ND
OK
FL
WI
MO
AL
WA
GA
AR
LA
MI
IN
PA
NY
NC
MS
TN
KYVA
OH
SC
ME
WV
MI VTNH
MD
NJ
MA
CT
DE
RI
Legend
shortage
Statewide
Regional
Local
None
No response or uncertain
Survey ResponsesExtent of State Shortages Likely over the Next Decade
under Average Water Conditions
AK
HI
HI
HI
HI
HI
Source: US Government Accountability Office2003
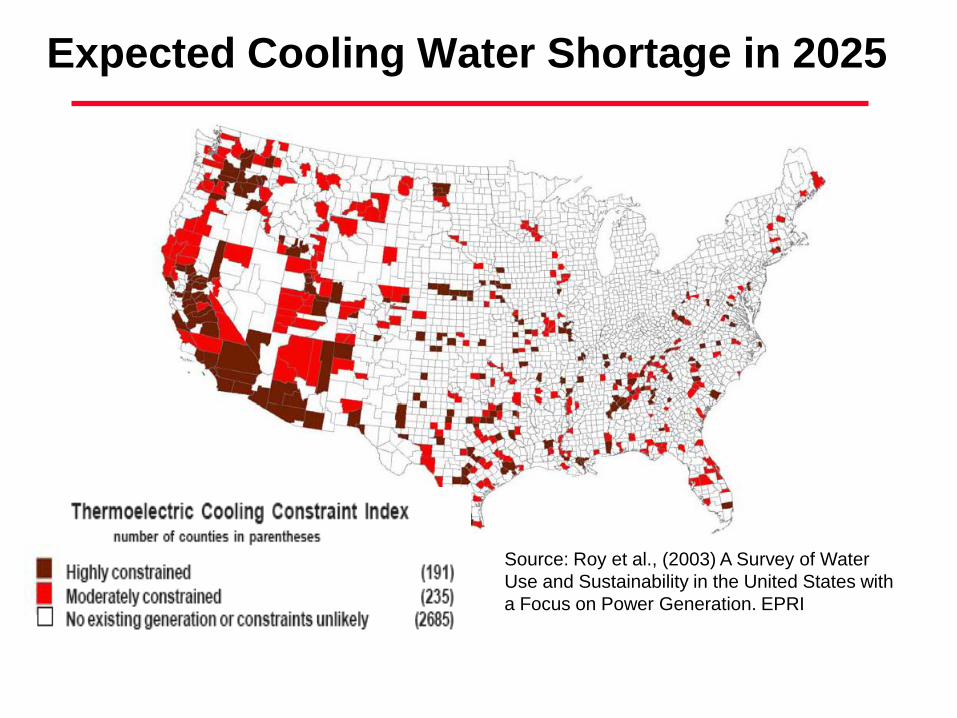
Source: Roy et al., (2003) A Survey of Water
Use and Sustainability in the United States with
a Focus on Power Generation. EPRI
Expected Cooling Water Shortage in 2025
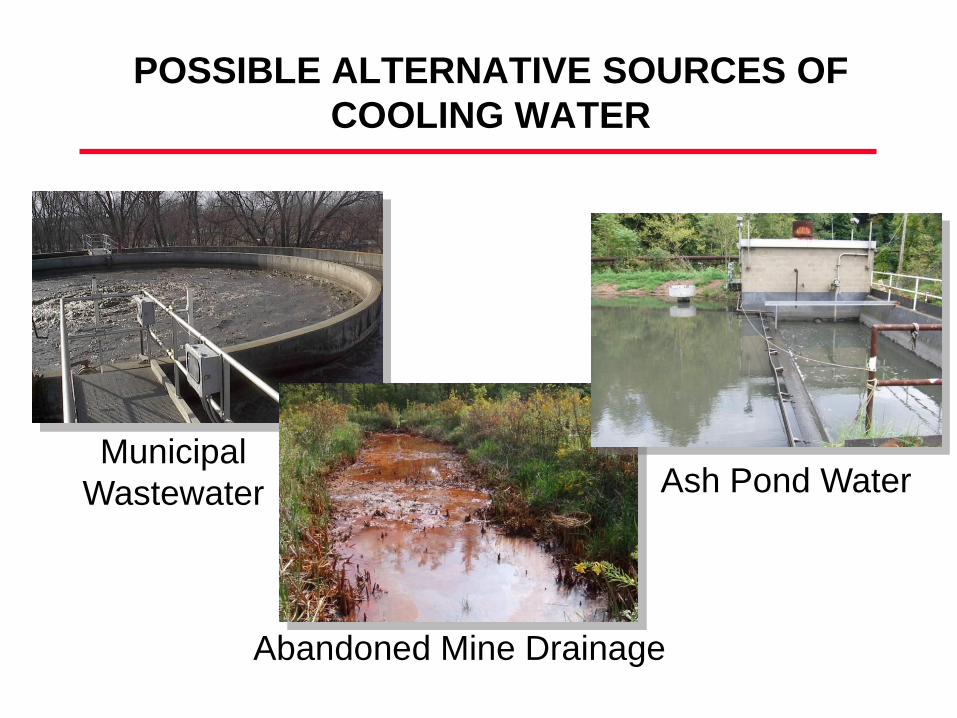
POSSIBLE ALTERNATIVE SOURCES OF
COOLING WATER
Municipal
Wastewater
Abandoned Mine Drainage
Ash Pond Water
REUSE OF MUNICIPAL WASTEWATER
IN THE COOLING SYSTEMS OF
THERMOELECTRIC POWER PLANTS
• 11.4 trillion gallons of municipal wastewater
collected and treated annually in U.S.
• Experience with use of treated municipal
water for power plant cooling in arid west;
e.g., Burbank, Las Vegas, Phoenix
• Significant additional treatment beyond
secondary treatment (e.g., clarification,
filtration, N and P removal)
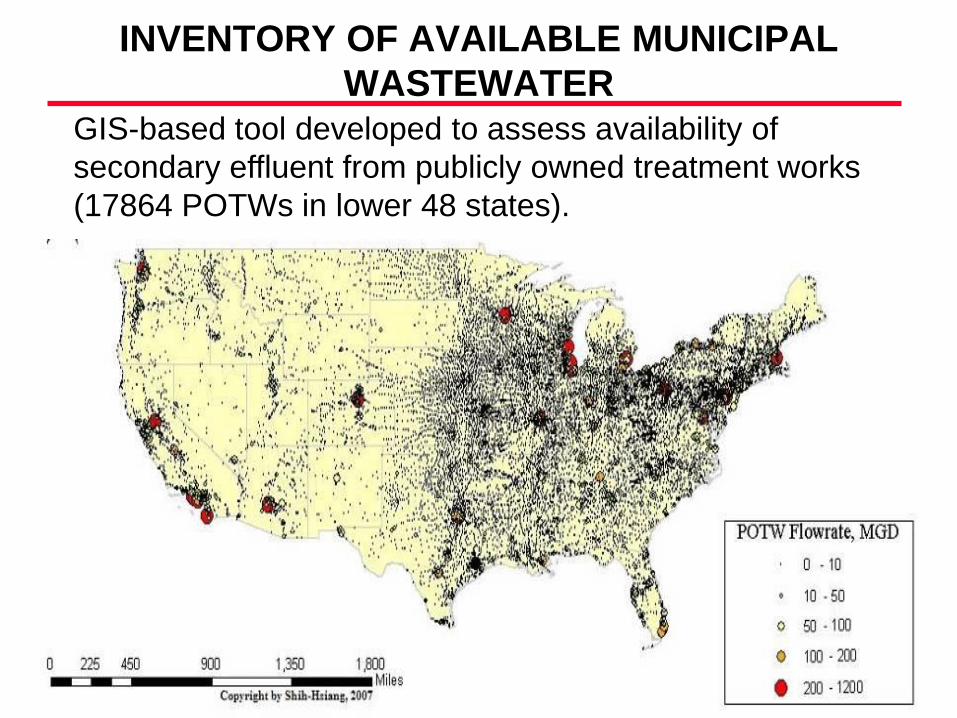
GIS-based tool developed to assess availability of
secondary effluent from publicly owned treatment works
(17864 POTWs in lower 48 states).
INVENTORY OF AVAILABLE MUNICIPAL
WASTEWATER
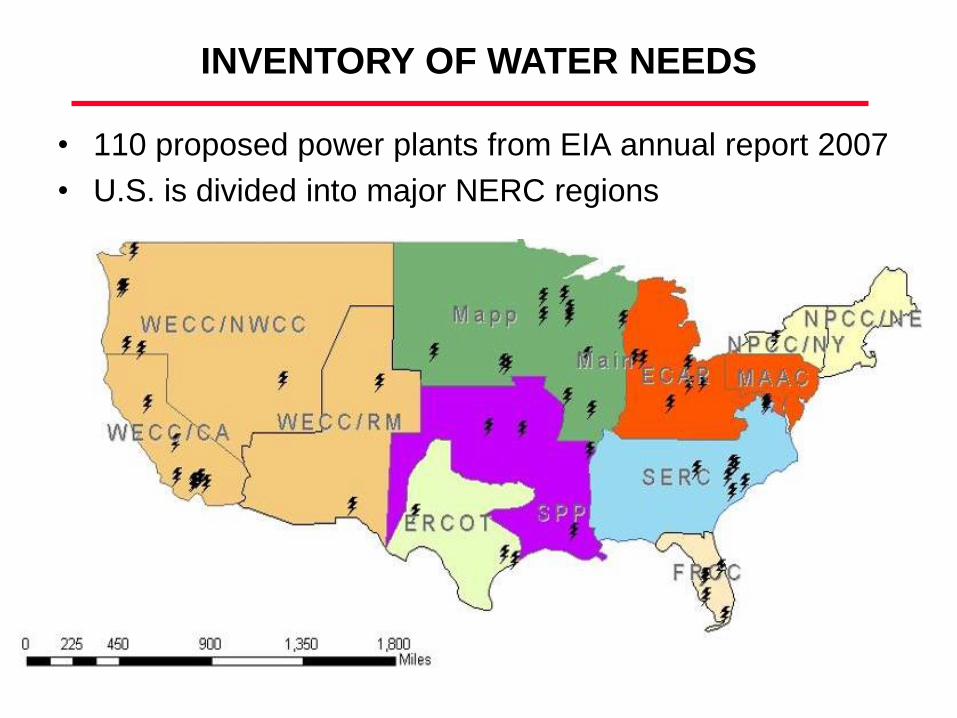
INVENTORY OF WATER NEEDS
• 110 proposed power plants from EIA annual report 2007
• U.S. is divided into major NERC regions

POWER PLANTS WITH SUFFICIENT MUNICIPAL
WASTEWATER FOR COOLING
81
92
49
76
0
20
40
60
80
100
10 25
Pe
rce
nta
ge
, %
Coverage radius, mile
Proposed Power Plants Existing Power Plants
SUMMARY – WASTEWATER AVAILABILITY
POTWs located within 10 and 25 mile radius from
the proposed power plants can satisfy 81% and
92% of proposed and 49% and 76% of existing
power plant cooling water needs, respectively.
On average, one fairly large POTW can
completely satisfy the cooling water demand for
each of these power plants.
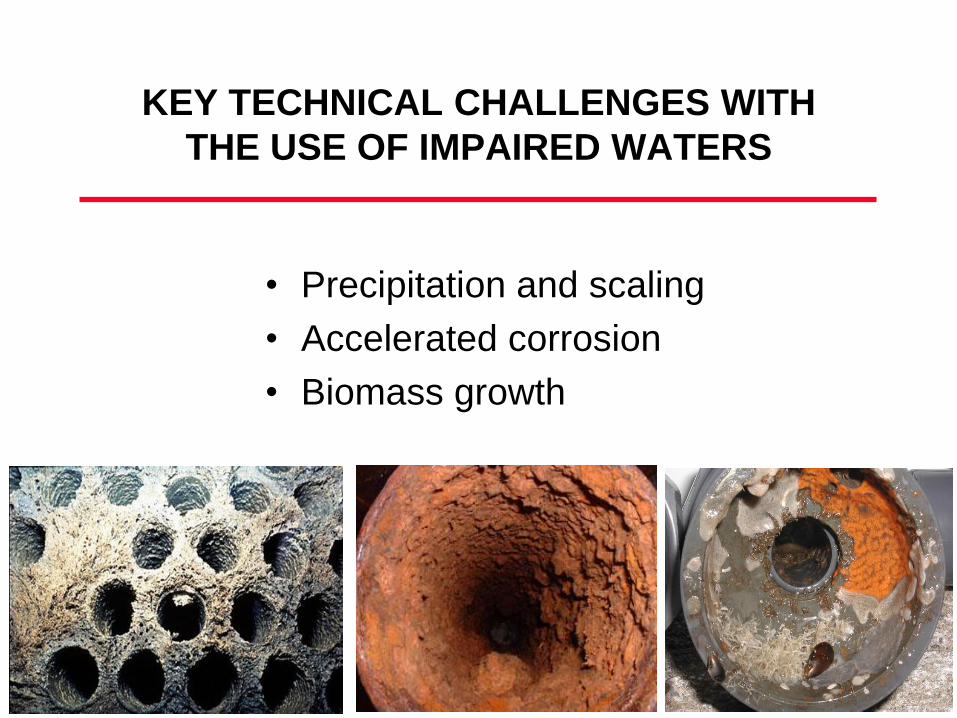
KEY TECHNICAL CHALLENGES WITH
THE USE OF IMPAIRED WATERS
• Precipitation and scaling
• Accelerated corrosion
• Biomass growth
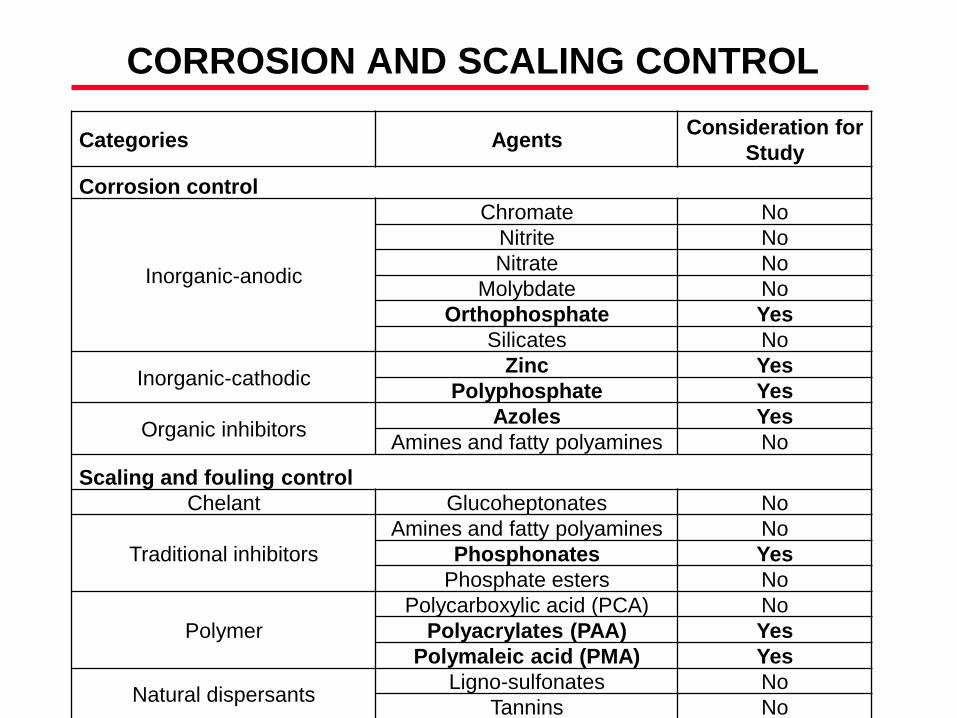
CORROSION AND SCALING CONTROL
Categories AgentsConsideration for
Study
Corrosion control
Inorganic-anodic
Chromate No
Nitrite No
Nitrate No
Molybdate No
Orthophosphate Yes
Silicates No
Inorganic-cathodicZinc Yes
Polyphosphate Yes
Organic inhibitorsAzoles Yes
Amines and fatty polyamines No
Scaling and fouling control
Chelant Glucoheptonates No
Traditional inhibitors
Amines and fatty polyamines No
Phosphonates Yes
Phosphate esters No
Polymer
Polycarboxylic acid (PCA) No
Polyacrylates (PAA) Yes
Polymaleic acid (PMA) Yes
Natural dispersantsLigno-sulfonates No
Tannins No
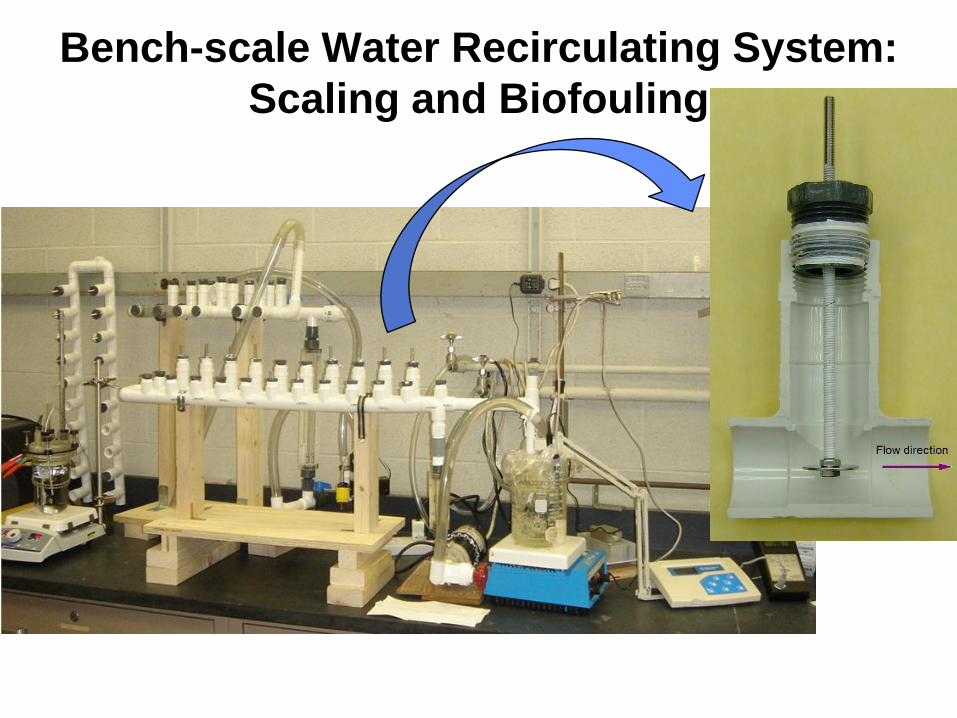
Bench-scale Water Recirculating System:
Scaling and Biofouling
P
Hot plate
Flo
w m
ete
r
Valve
Pump
Electrode holder
Synthetic
wastewater
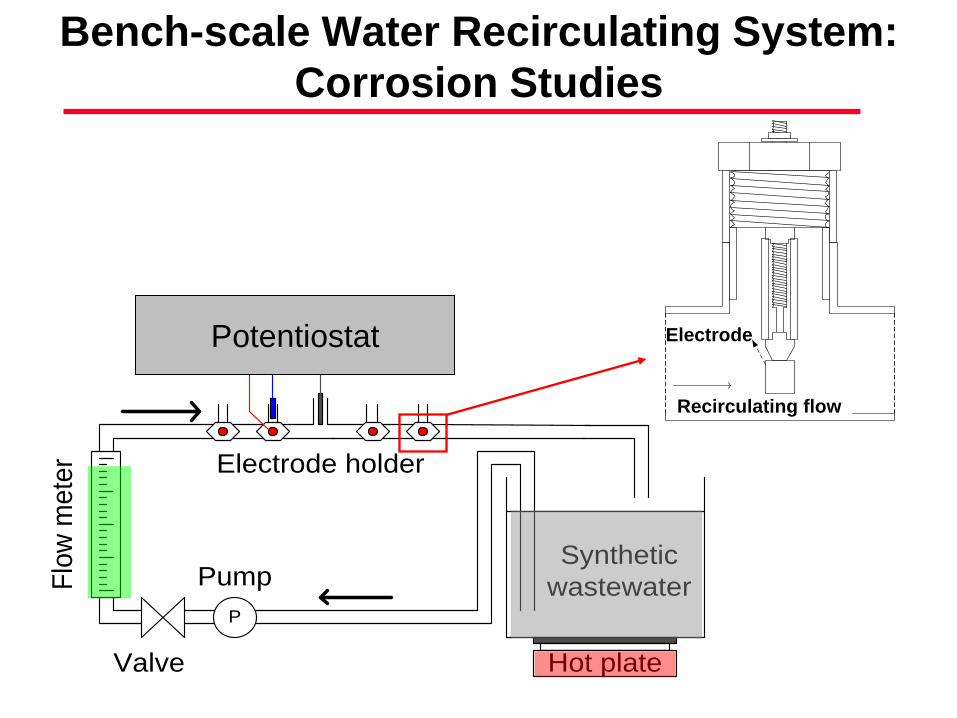
PTPotentiostat Electrode
Recirculating flow
Bench-scale Water Recirculating System:
Corrosion Studies
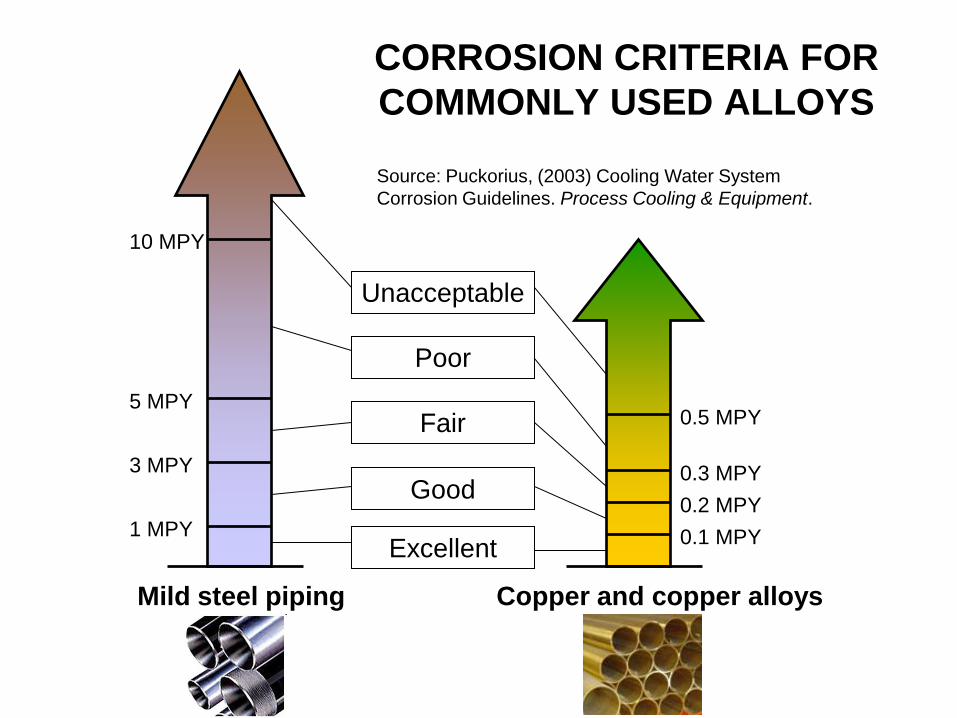
CORROSION CRITERIA FOR
COMMONLY USED ALLOYS
1 MPY
3 MPY
5 MPY
10 MPY
0.1 MPY
0.2 MPY
0.3 MPY
0.5 MPY
Excellent
Good
Fair
Poor
Unacceptable
Mild steel piping Copper and copper alloys
Source: Puckorius, (2003) Cooling Water System
Corrosion Guidelines. Process Cooling & Equipment.
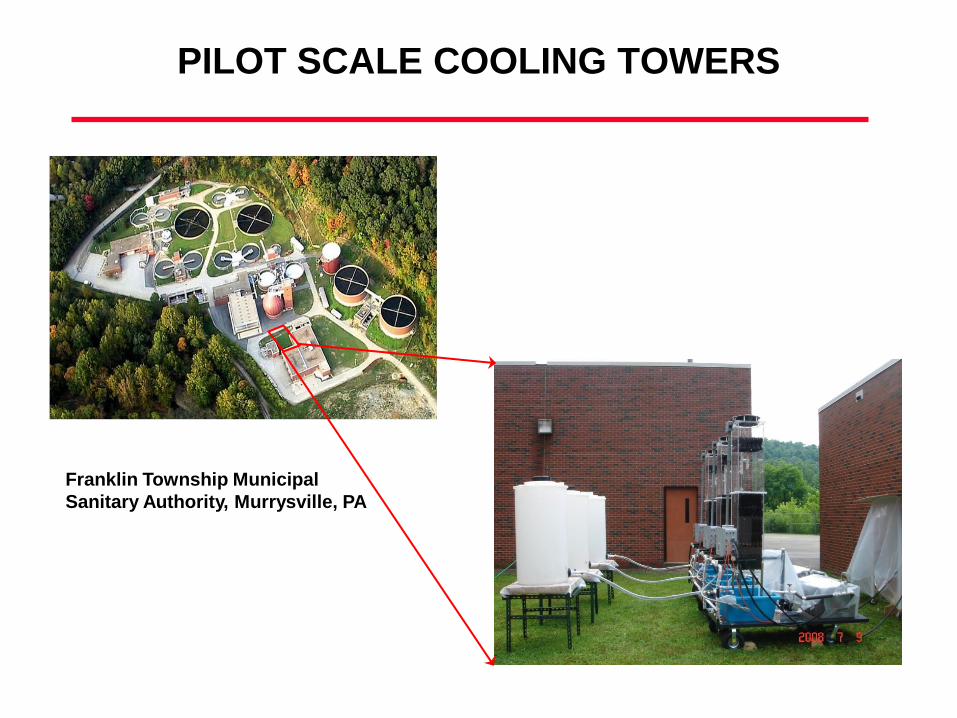
PILOT SCALE COOLING TOWERS
Franklin Township Municipal
Sanitary Authority, Murrysville, PA
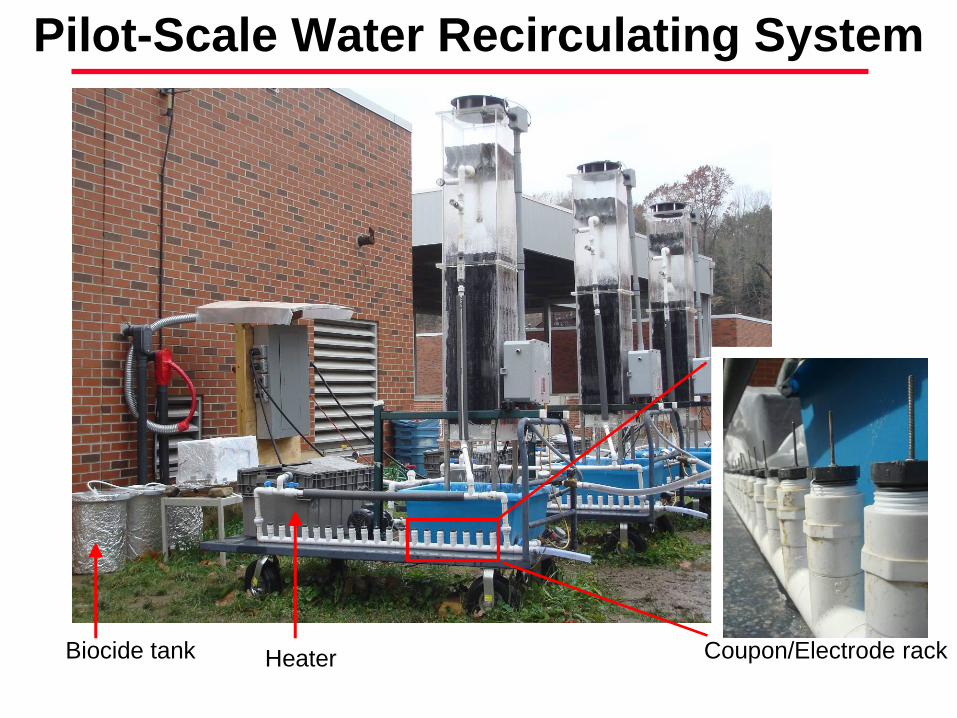
Pilot-Scale Water Recirculating System
Coupon/Electrode rackBiocide tank Heater
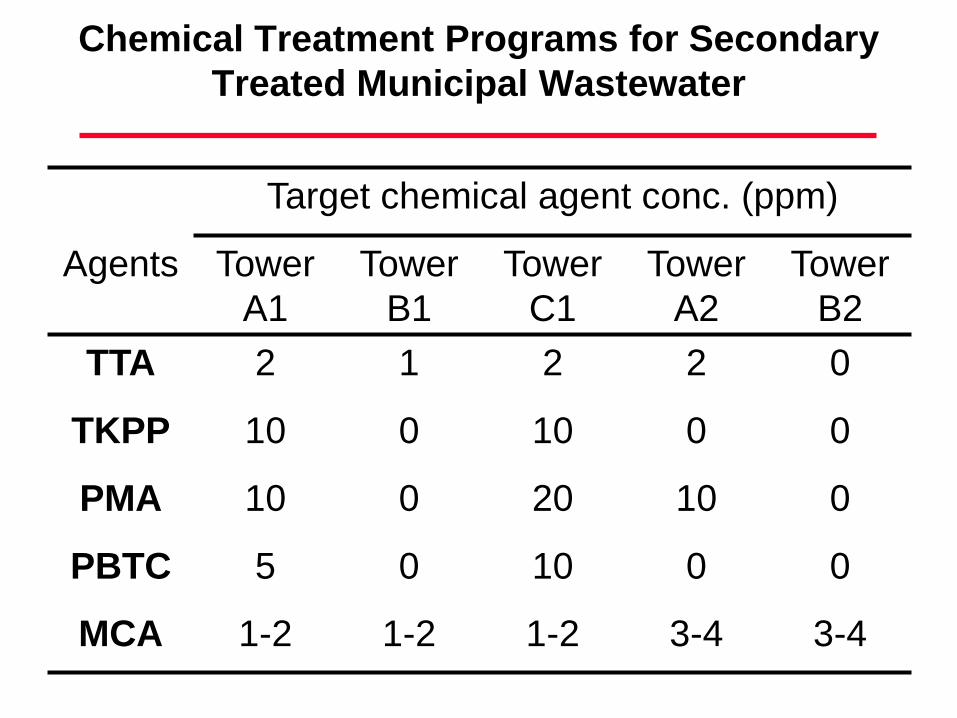
Chemical Treatment Programs for Secondary
Treated Municipal Wastewater
Target chemical agent conc. (ppm)
Agents Tower
A1
Tower
B1
Tower
C1
Tower
A2
Tower
B2
TTA 2 1 2 2 0
TKPP 10 0 10 0 0
PMA 10 0 20 10 0
PBTC 5 0 10 0 0
MCA 1-2 1-2 1-2 3-4 3-4
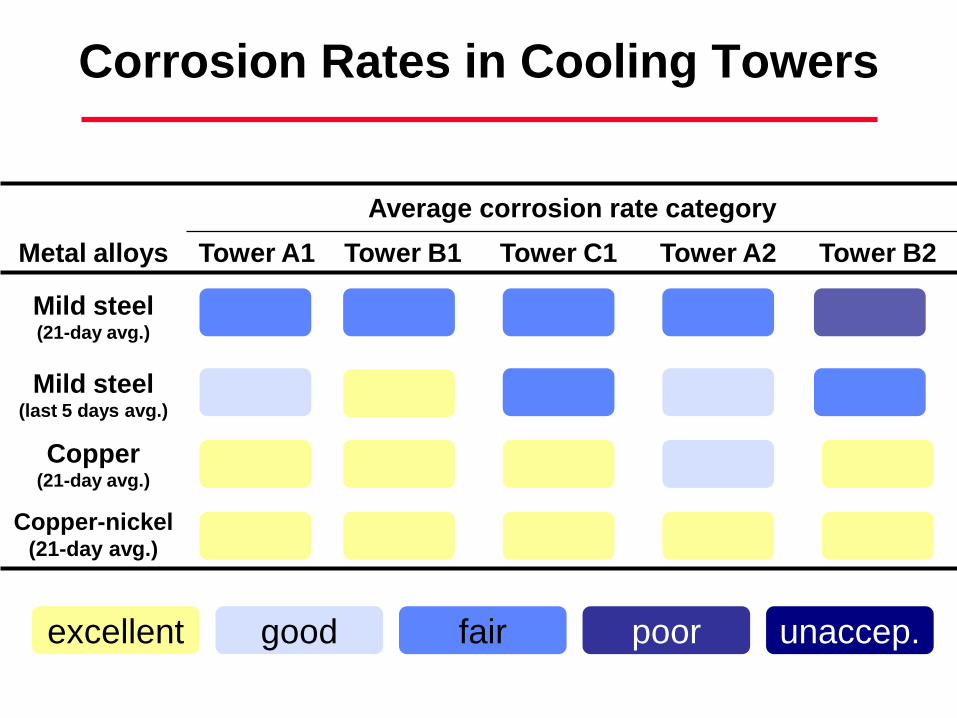
Corrosion Rates in Cooling Towers
Average corrosion rate category
Metal alloys Tower A1 Tower B1 Tower C1 Tower A2 Tower B2
Mild steel(21-day avg.)
Mild steel(last 5 days avg.)
Copper(21-day avg.)
Copper-nickel(21-day avg.)
excellent good fair poor unaccep.
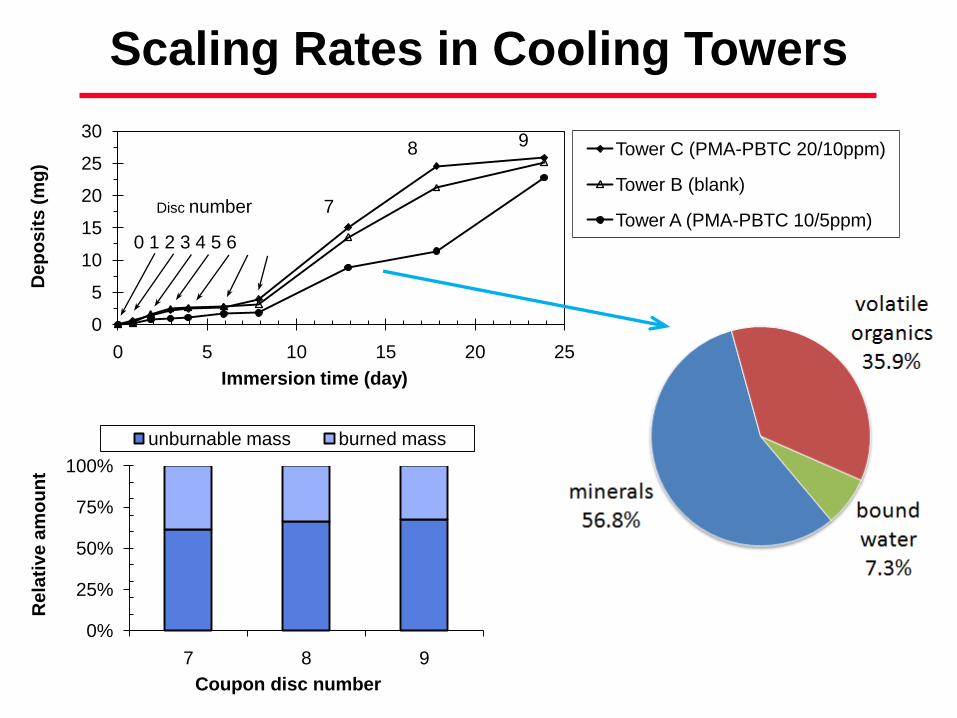
Scaling Rates in Cooling Towers
0
5
10
15
20
25
30
0 5 10 15 20 25
De
po
sit
s (
mg
)
Immersion time (day)
Tower C (PMA-PBTC 20/10ppm)
Tower B (blank)
Tower A (PMA-PBTC 10/5ppm)
98
7
0 1 2 3 4 5 6
Disc number
0%
25%
50%
75%
100%
7 8 9
Re
lati
ve
am
ou
nt
Coupon disc number
unburnable mass burned mass
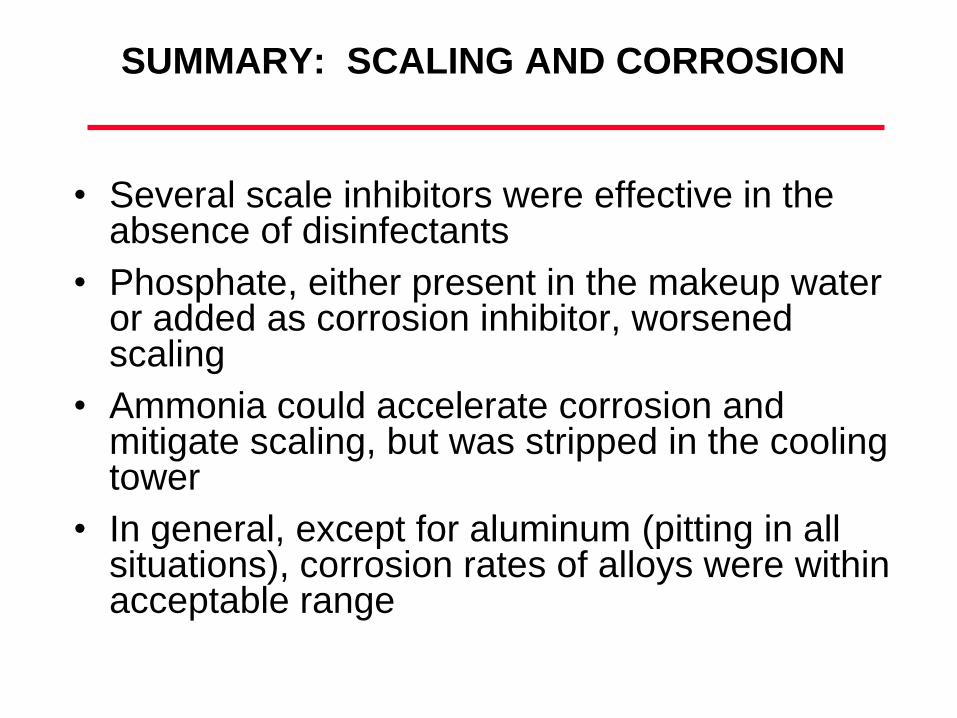
SUMMARY: SCALING AND CORROSION
• Several scale inhibitors were effective in the absence of disinfectants
• Phosphate, either present in the makeup water or added as corrosion inhibitor, worsened scaling
• Ammonia could accelerate corrosion and mitigate scaling, but was stripped in the cooling tower
• In general, except for aluminum (pitting in all situations), corrosion rates of alloys were within acceptable range

SUMMARY: BIOFOULING
• Addition of chlorine impaired the
effectiveness of the antiscalants and
accelerated corrosion
• Chloramine was an effective biocide and much less corrosive than chlorine
• Continuous monochloramine dosing to achieve 3 – 4 ppm as Cl2 successfully inhibited biomass growth with planktonicheterotrophic plate count under 104
CFU/ml and sessile heterotrophic plate count under 104 CFU/cm2
ADDITIONAL ISSUES WITH THE USE
OF IMPAIRED WATERS
• Pretreatment before use vs. extensive chemical
addition to the cooling tower
• LCA of the alternatives
• Regulatory issues
• Social issues
Acknowledgement
U.S. DOE – National Energy Technology Laboratory
“Reuse of Treated Internal or External Wastewaters in the Cooling
Systems of Coal-based Thermoelectric Power Plants”
(Grant # DE-FC26-06NT42722)
Jim Brucker and Gene Greco
Franklin Township Municipal Sanitary Authority (Murrysville, PA)
Recommended