JESS REYESCSV Pillar Lead for Planet
Nestlé Philippines, Inc.
CLIMATE CHANGE INITIATIVES OF NESTLÉ
Our Purpose:
Enhancing quality of life and contributing to a
healthy future.

PHP 130.4 billion in sales in 2015
Cover over 500,000 outlets through
a network of 43 grocery distributors
3rd top tax payer in the country
Top 6 Nestlé market worldwide
Nestlé in the Philippines

OUR BRANDS
Over 20 brands
Manufacturing Facilities
Cabuyao FactoryInfant Nutrition & Liquid Beverages
Lipa FactoryBreakfast Cereals and MILO
Pulilan FactoryNESTLÉ Ice Cream and Fresh Dairy
CDO FactoryNESCAFE and BEAR BRAND
Tanauan FactoryCOFFEE-MATE and BEAR BRAND
1976 19921984
2009 2012
5 Manufacturing Facilities, 7 Co-manufacturers

Nestlé Policy on Environmental Sustainability
video
Nestlé Policy on Environmental Sustainability

Nestlé Commitment on Climate Change
Nestlé aims:
• To constantly lower GHG emissions associated with production and distribution
• To design products that help consumers lower their own GHG emissions in the use of the products.

Nestlé Commitments on Climate Change
Mitigation Adaptation Reporting

Mitigation Adaptation
• Reduction of GHG emissions from direct operations
• Extend scope of GHG reduction efforts along the value chain
• Identify the reduction potential and put in place programs for different GHG
• Further reduction in waste in the supply chain
• Implement a strategy to tackle deforestation
Nestlé Commitments on Climate Change
Reporting

• Engage with governments, farmers, and other stakeholders
• Participate in public policy dialogue
• Identify practical actions and agricultural systems that can be implemented at farm level
• Include enhanced resilience to climate change in plant breeding
• Develop early warning systems
• Share synthesized information on climate adaptation
Adaptation
Nestlé Commitments on Climate Change
Mitigation Reporting
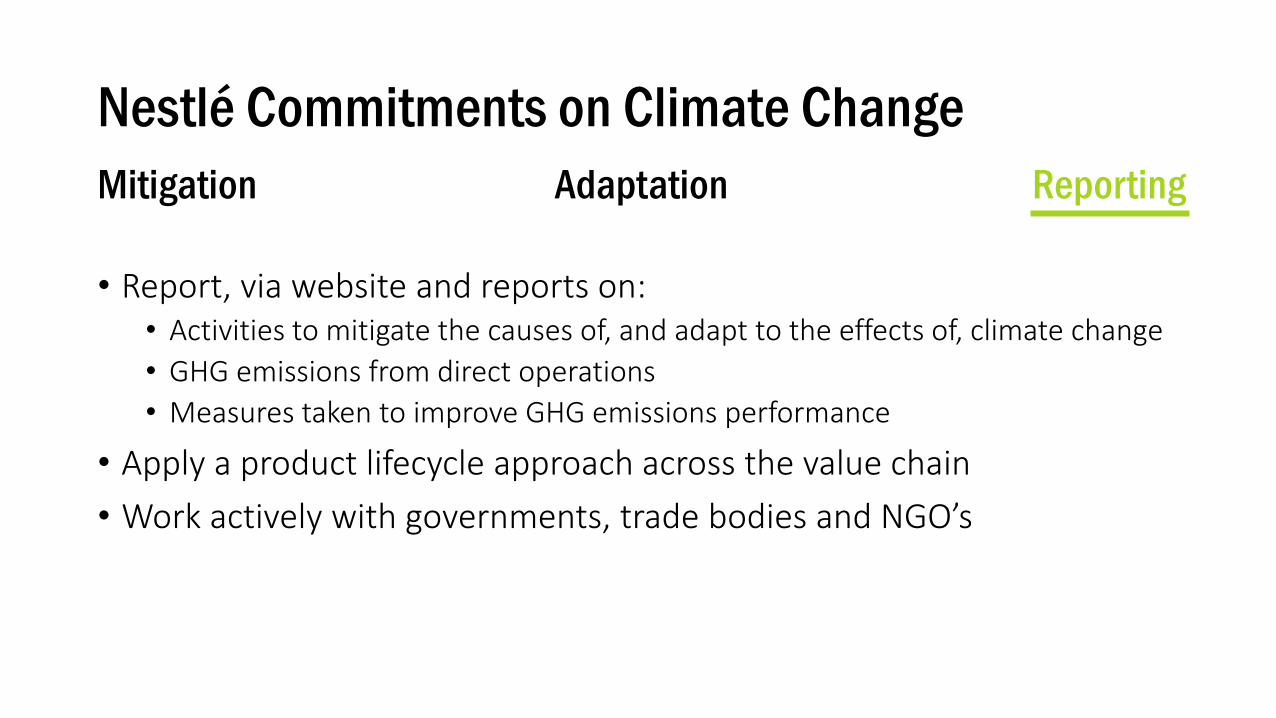
Reporting
• Report, via website and reports on:• Activities to mitigate the causes of, and adapt to the effects of, climate change
• GHG emissions from direct operations
• Measures taken to improve GHG emissions performance
• Apply a product lifecycle approach across the value chain
• Work actively with governments, trade bodies and NGO’s
Adaptation
Nestlé Commitments on Climate Change
Mitigation

Implementation across the value chain
Manufacturing
Sourcing
Distribution & Marketing

Nestlé Responsible Sourcing
• Nestlé conducts audits on suppliers to ensure traceability of raw materials and to work with them to improve environment practices
4 Pillars:Human RightsSafety and HealthEnvironmental SustainabilityBusiness Integrity

The Nescafé Plan
• Long-term approach to Creating Shared Value in the coffee industry that aims to guarantee long-term supply of quality coffee and having a lower environmental impact.
• Gives farmers access to world-class coffee farming technologies, transfers knowledge through training, and promotes sustainable practices

Ash and Sludge used as soil conditioner
• Factory by-products in the form of ash and sludge, which normally end up as waste, are converted into compost or organic soil conditioner for coffee trees.
100% of the coffee waste is converted to soil conditioner
*Not actual pictures from site

17
The Nestlé Energy Management Roadmap
Our Ambition• Be a reference company for energy
conservation
• Be recognized as “energy
responsible” by all stakeholders
Efficient use of equipment
Efficient processes
Nestlé Model – every year• Continuous energy savings
• Steady CO2 emission reduction
• Dedicated CAPEX for energy savings
projects
• Renewable energy projects
Improvement Drivers• Use of NEMT and EnMatrix
• Markets to propose Energy savings
projects to feed a database
• Targeted energy assessments
• Cogeneration
• Renewable energiess
Competitive advantage
• Reduction of TCOP
• Corporate image
• Prepared to future energy stress
Operational Pillars
• Efficiency in production
• Best practices in facilities
• Awareness and management of
performance
• Innovation in process technology
Renewable
Energies
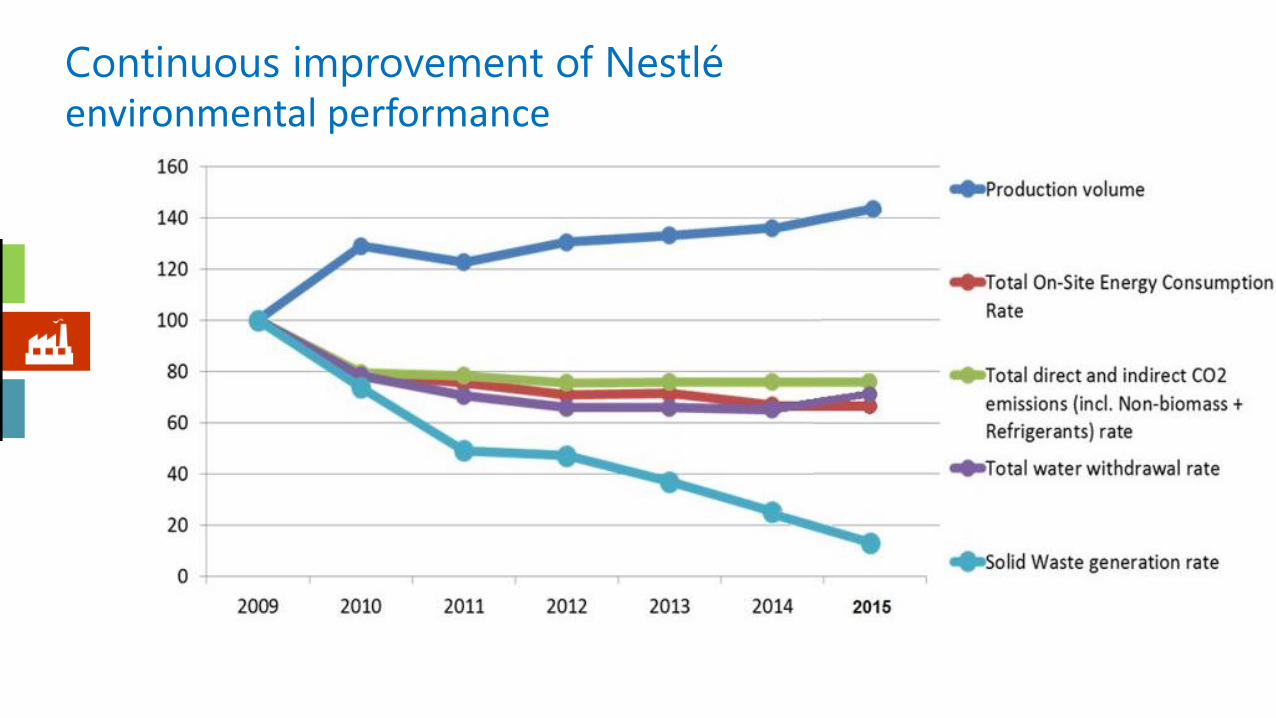
Continuous improvement of Nestlé environmental performance

The Nestlé Energy Management Roadmap
Efficient use of equipment
Efficient processes
Renewable
Energies
Energy Target Setting

21
ETS methodology
Intr
oducti
on
Safe
ty
Facto
ry
pre
senta
tion
Facto
ry t
our
Day 1
EnM
atr
ix,
NEM
T,
Wate
r m
appin
g
Data
collecti
on
Day 2
Identi
ficati
on
of
pote
nti
als
Pri
ori
tisa
tion
Invest
ment
est
imati
on
Payback
calc
ula
tion
Conso
lidati
on
of
pote
nti
als
Pre
para
tion o
f
Fin
al
pre
senta
tion
Fin
al
pre
senta
tion
Com
mit
ment
on a
cti
on p
lan
Daily
Debri
efi
ng
Day 3 to 8 Day 9 Day 10
D M A I C
22
Resources
Min. 10 FTE for 2 weeks on-site:
Factory / Market:
Factory Engineer, IS Engineer, Process Engineer, Production supervisor,
Market Energy Champion, Market Water champion
Nestec:
CO-ENG/Serv Energy expert and Water expert, PTC process specialist,
Knowledge companies:
steam & combustion, electricity, water, compressed air, etc.
On the last day:
Steering Committee:
Market Technical Manager, Factory Manager, Chief Engineer
Factory / Market:
Factory Engineer, Factory IP, Production manager

23
=> On-site MilestonesInfo on
Teamroom
DAY1
Factory data
for calculations
4
List of opportunities
to be pursued
5
Chart with all
projects
7
Complete Summary XLS
file ($, GJ, etc.)
8
Projects
descriptions &
calculations on
Teamroom
9
Final presentation
10
Energy
Target
Setting

ETS Action plan example
Priority Project Short Description
SavingsEnergy Saving Water Saving CO2 Investment Payback
[kEU
R/y
ear]
[kC
HF/
year
]
[GJ/
year
]
[GJ/
t]
m3
/yea
r
[m3
/t]
Dir
ect
[t]
[tC
o2
/t]
[kEU
R]
[kC
HF]
[Yea
r]
1
1
2
2
3
33
Projects with Payback < 1 YearProjects with Payback 1-3 YearsProjects with Payback > 3 Years
Total

Typical projects: Apply the good practices in production
processes
25
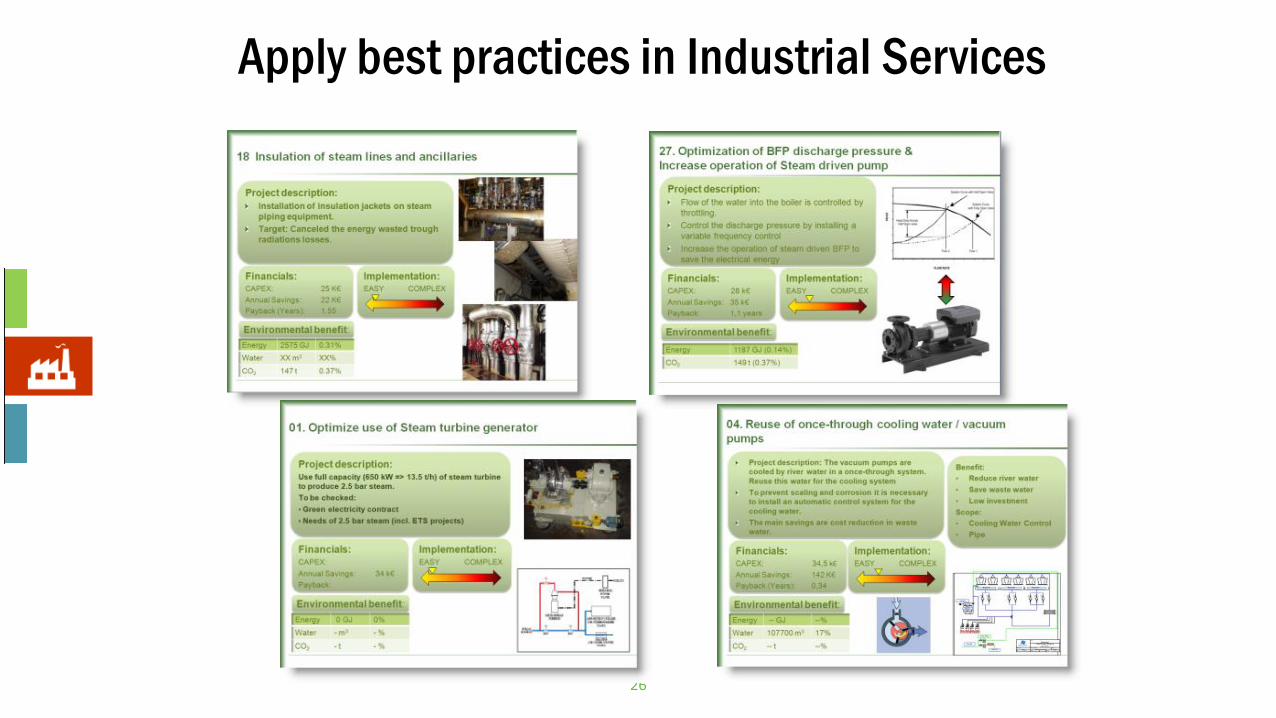
Apply best practices in Industrial Services
26

PROJECTS - Optimization and Management
CIP Improvement
• Shortening CIP Time by relocating conductivity meter
• Annual Savings of 5.2 Mio
Optimize Dearator Use in Boiler House
• Reduce from 2 to 1 Dearator

PROJECTS - Optimization and Management
Steam Trap and Direct Leak Management
• Replace leaking steam traps
• Arrest direct steam leaks

Energy and Resource Recovery Projects
Condensate recovery from Evaporators• Condensate from Evaporators and the cow water is
presently drained.
• This can be recovered after assessing the suitabilityof the water for Boiler operations.
• Total condensate recoverable – 2450 Kg/h
Recover flash steam from dryer air heaters
• Flash steam recovery from dryer air heater and connect it to the LP steam header
• Quantity of flash steam – 446 kg/h

Packaging Impact Quick Evaluation Tool
• Nestlé uses a simplified life cycle approach in packaging development through an eco-design tool, PIQET, to evaluate the impact of the new packaging during its conceptualization and development stage including green house gas emissions.

Packaging Optimization – NESTLÉ Fruit Selection Yogurt
• Original packaging: preformed plastic cup
• New packaging: plastic sheet that is formed, filled, and sealed (FFS) at the production line with a paper label and metallized polyethylene terephthalate (MPET) lid.
Reduced annual packaging material usage

Packaging Optimization – NESCAFÉ 3in1 Variants • Original packaging: 3-layer laminate (printing, barrier, and sealant layer)
• New packaging: thinner 2-layer or duplex laminate (printing and sealant-barrier layer)
Lighter, thinner, and still continues to ensure product quality throughout its guaranteed shelf life.

Solatube® Daylighting System• Lighting system that captures sunlight from outdoors and diffuses the light
inside the facility
Provide 1.5 times more illumination

Renewable Energy forCanlubang & Lipa Factory
34
Lipa FactoryRegional Supply Center for breakfast cereals
Hub of MILO products
2.5 MW of clean and renewable energy source from Aboitiz Power

Coffee Waste as fuel for boiler
• Waste in the form of spent coffee grounds, roasted chaffs, and coffee wash generated frommanufacturing coffee products are collected and fed into a atmospheric fluidized bed boiler.
150,000 kg of spent coffee grounds per day are used producing 20-ton per hour of steam energy.
Annual savings of more than 4,000 million liters of oil, reduced SOxemission by nearly 300 tons and prevention of 70,000 tons of waste.


Renewable Energy Source in other Nestlé Markets
• The UK and Ireland: since April 2016, our entire grid-supplied electricity in the UK and Ireland has been sourced from renewable sources, including wind
• Mexico: Nestlé Mexico currently meets 80% of its electricity needs through wind power, one of the first food companies in Mexico to do so;
• Spain: in 2015, Nestlé Spain sourced 85% of its electricity from renewable power sources, supported by green energy certificates. This has enabled us to avoid more than 20 000 tonnes of CO2 – emissions equivalent to more than 8230 return trips from Geneva to Sydney;
• Italy: in 2015, Nestlé Italy bought 100% renewable electricity.

Greening the Supply Chain
• Nestlé shares its best practices and assists its business partners (raw material suppliers, co-manufacturers, transportation provider, etc.) in raising environmental performance by incorporating environment protection into business practices.
• The program includes Environmental Management Systems Training, on-site visits, fora, and recognition.

Message from the Chairman
..."we are committed to being a leader in environmental performance.
This leadership is only possible through the collective commitment of the tens of thousands of individual Nestlé employees who, on a daily basis, work to make this a better planet on which to live."
Peter Brabeck-Letmathe
Recommended