Embed Size (px)
Citation preview

Nestlé in the USA &
Frozen Meals Performance
February 23, 2017
Jeff Hamilton
President
Nestlé Food Division
Nestlé USA
Disclaimer
This presentation contains forward looking statements
which reflect Management’s current views and estimates.
The forward looking statements involve certain risks and
uncertainties that could cause actual results to differ materially
from those contained in the forward looking statements.
Potential risks and uncertainties include such factors as general
economic conditions, foreign exchange fluctuations, competitive
product and pricing pressures and regulatory developments.
February 23, 2017 CAGNY 20172
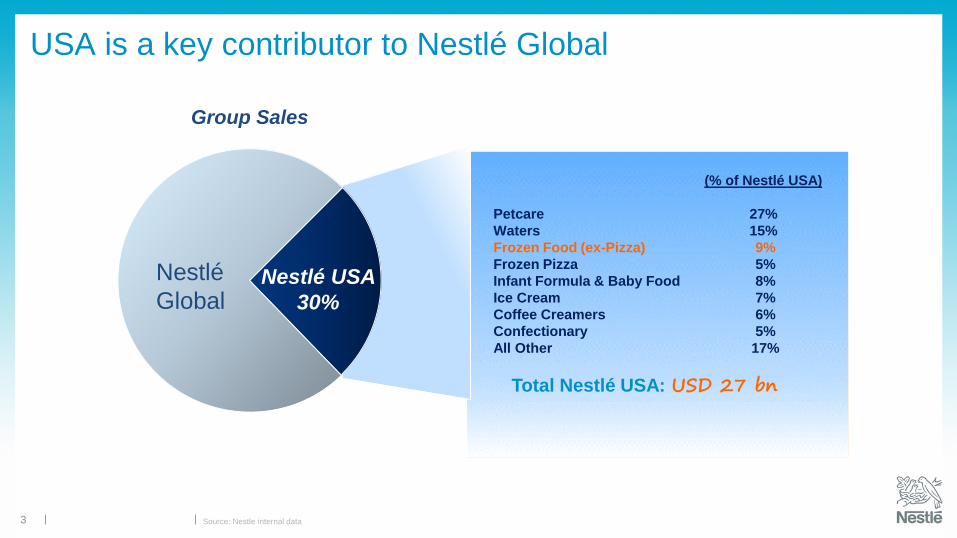
Petcare
Waters
Frozen Food (ex-Pizza)
Frozen Pizza
Infant Formula & Baby Food
Ice Cream
Coffee Creamers
Confectionary
All Other
(% of Nestlé USA)
27%
15%
9%
5%
8%
7%
6%
5%
17%
USA is a key contributor to Nestlé Global
3
Group Sales
Nestlé USA
30%
Nestlé
Global
Total Nestlé USA: USD 27 bn
Source: Nestle internal data
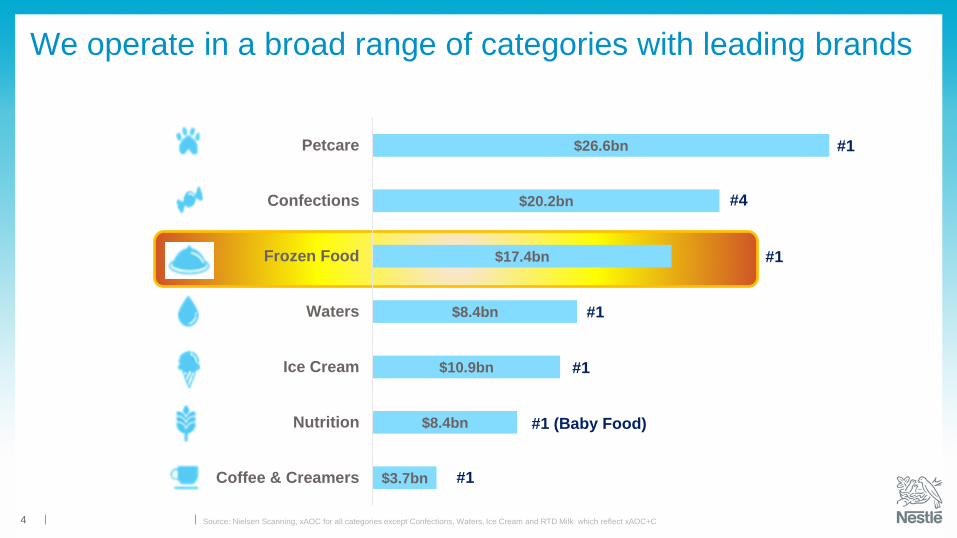
We operate in a broad range of categories with leading brands
$3.7bn
$8.4bn
$10.9bn
$8.4bn
$17.4bn
$20.2bn
$26.6bn
Coffee & Creamers
Nutrition
Ice Cream
Waters
Frozen Food
Confections
Petcare
#1 (Baby Food)
4 Source: Nielsen Scanning, xAOC for all categories except Confections, Waters, Ice Cream and RTD Milk which reflect xAOC+C
#1
#4
#1
#1
#1
#1
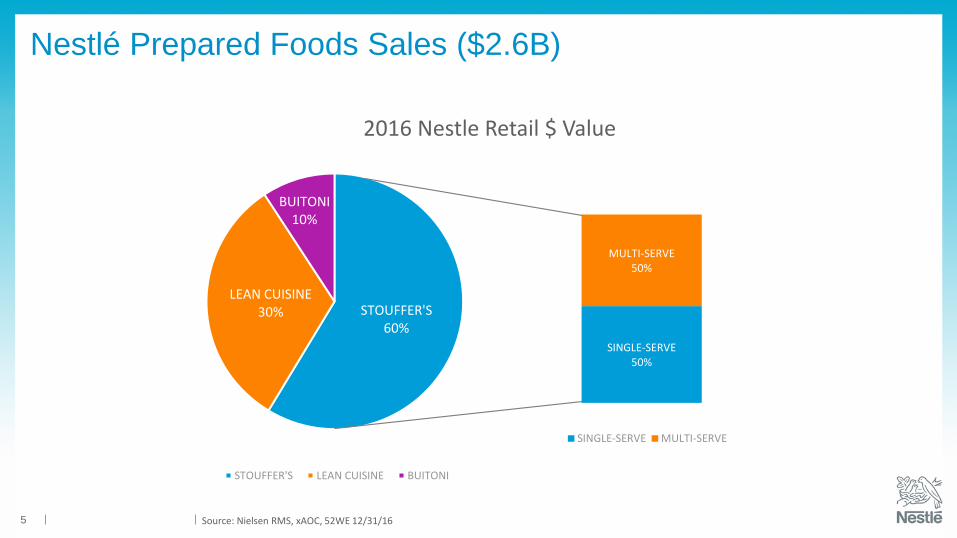
Nestlé Prepared Foods Sales ($2.6B)
5
STOUFFER'S60%
LEAN CUISINE30%
BUITONI10%
STOUFFER'S LEAN CUISINE BUITONI
SINGLE-SERVE50%
MULTI-SERVE50%
SINGLE-SERVE MULTI-SERVE
2016 Nestle Retail $ Value
Source: Nielsen RMS, xAOC, 52WE 12/31/16
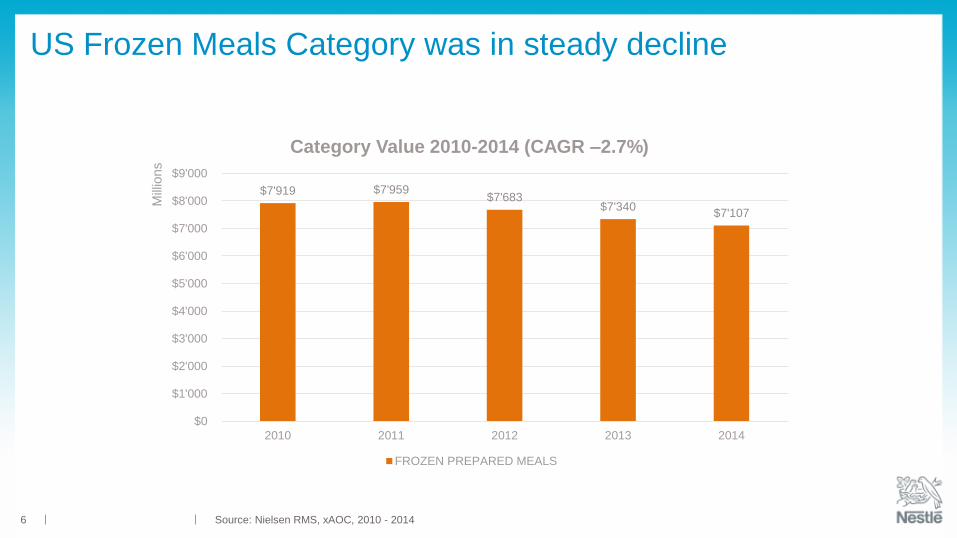
US Frozen Meals Category was in steady decline
6 Source: Nielsen RMS, xAOC, 2010 - 2014
$7'919 $7'959 $7'683
$7'340 $7'107
$0
$1'000
$2'000
$3'000
$4'000
$5'000
$6'000
$7'000
$8'000
$9'000
2010 2011 2012 2013 2014
Mill
ions
Category Value 2010-2014 (CAGR –2.7%)
FROZEN PREPARED MEALS
7
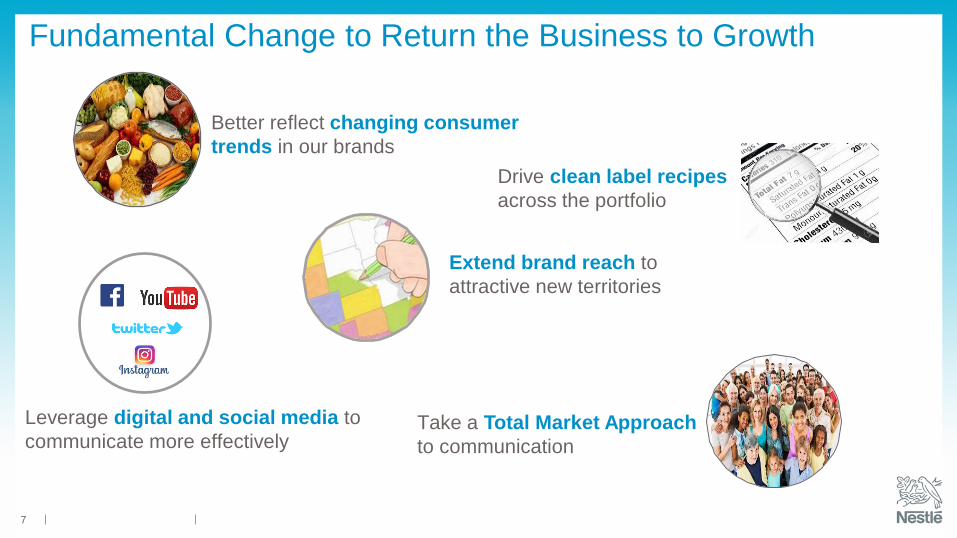
Fundamental Change to Return the Business to Growth
Better reflect changing consumer
trends in our brands
Drive clean label recipes
across the portfolio
Extend brand reach to
attractive new territories
Leverage digital and social media to
communicate more effectivelyTake a Total Market Approach
to communication
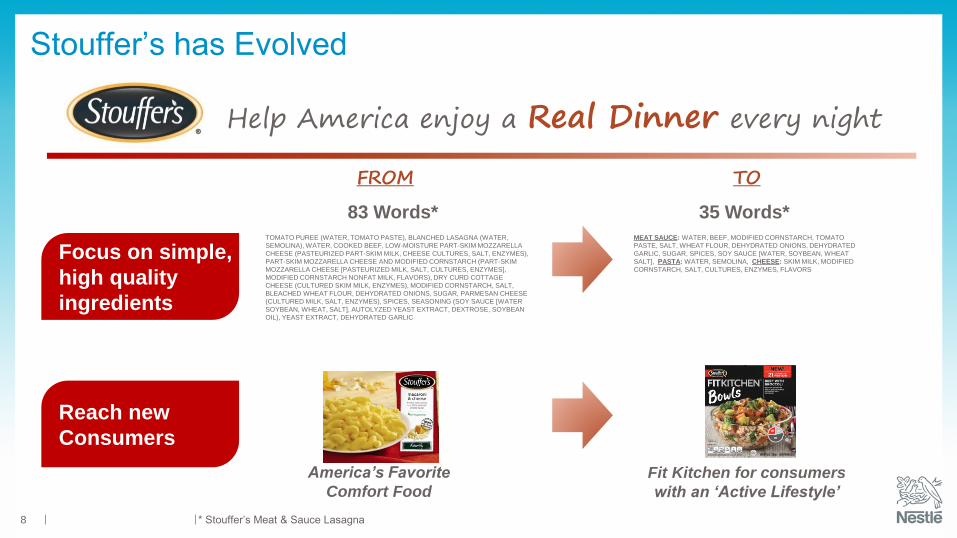
Stouffer’s has Evolved
8
Help America enjoy a Real Dinner every night
FROM TO
Focus on simple,
high quality
ingredients
Reach new
Consumers
America’s Favorite
Comfort Food
Fit Kitchen for consumers
with an ‘Active Lifestyle’
TOMATO PUREE (WATER, TOMATO PASTE), BLANCHED LASAGNA (WATER,
SEMOLINA), WATER, COOKED BEEF, LOW-MOISTURE PART-SKIM MOZZARELLA
CHEESE (PASTEURIZED PART-SKIM MILK, CHEESE CULTURES, SALT, ENZYMES),
PART-SKIM MOZZARELLA CHEESE AND MODIFIED CORNSTARCH (PART-SKIM
MOZZARELLA CHEESE [PASTEURIZED MILK, SALT, CULTURES, ENZYMES],
MODIFIED CORNSTARCH NONFAT MILK, FLAVORS), DRY CURD COTTAGE
CHEESE (CULTURED SKIM MILK, ENZYMES), MODIFIED CORNSTARCH, SALT,
BLEACHED WHEAT FLOUR, DEHYDRATED ONIONS, SUGAR, PARMESAN CHEESE
(CULTURED MILK, SALT, ENZYMES), SPICES, SEASONING (SOY SAUCE [WATER
SOYBEAN, WHEAT, SALT], AUTOLYZED YEAST EXTRACT, DEXTROSE, SOYBEAN
OIL), YEAST EXTRACT, DEHYDRATED GARLIC
MEAT SAUCE: WATER, BEEF, MODIFIED CORNSTARCH, TOMATO
PASTE, SALT, WHEAT FLOUR, DEHYDRATED ONIONS, DEHYDRATED
GARLIC, SUGAR, SPICES, SOY SAUCE [WATER, SOYBEAN, WHEAT
SALT], PASTA: WATER, SEMOLINA, CHEESE: SKIM MILK, MODIFIED
CORNSTARCH, SALT, CULTURES, ENZYMES, FLAVORS
83 Words* 35 Words*
* Stouffer’s Meat & Sauce Lasagna

Stouffer’s Fit Kitchen Communication
9
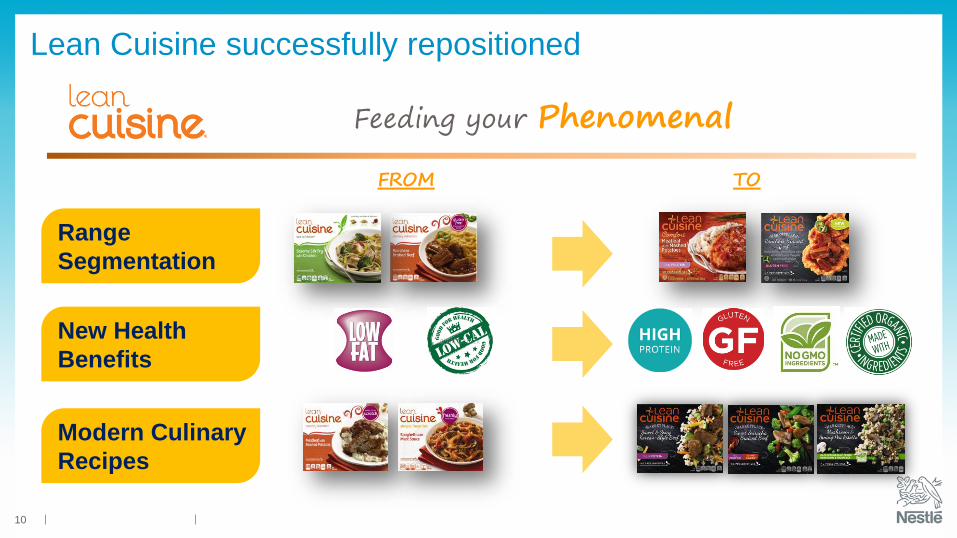
Lean Cuisine successfully repositioned
10
Feeding your Phenomenal
FROM TO
Range
Segmentation
New Health
Benefits
Modern Culinary
Recipes

Lean Cuisine Communication
11
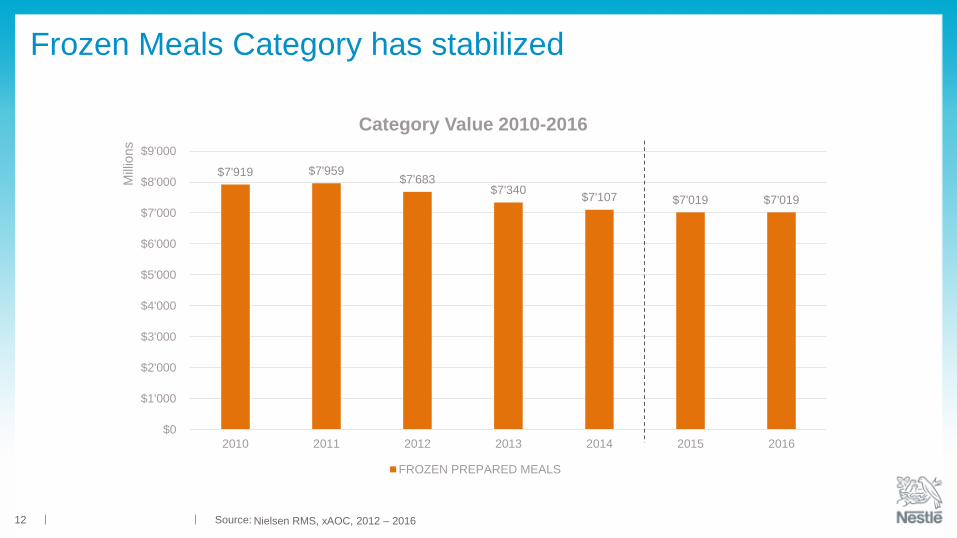
Frozen Meals Category has stabilized
12 Source: Nielsen RMS, xAOC, 2012 – 2016
$7'919 $7'959 $7'683
$7'340 $7'107 $7'019 $7'019
$0
$1'000
$2'000
$3'000
$4'000
$5'000
$6'000
$7'000
$8'000
$9'000
2010 2011 2012 2013 2014 2015 2016
Mill
ions
Category Value 2010-2016
FROZEN PREPARED MEALS
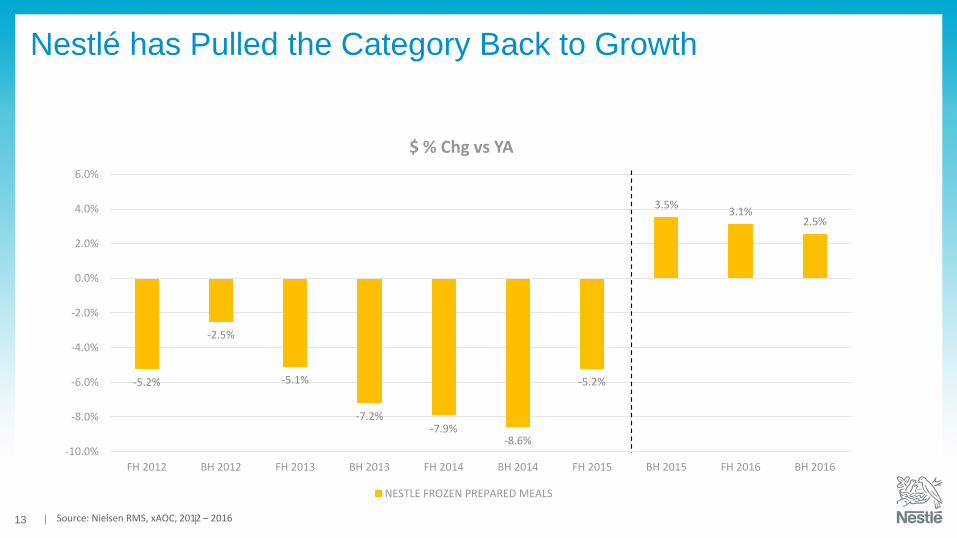
Nestlé has Pulled the Category Back to Growth
13
-5.2%
-2.5%
-5.1%
-7.2%-7.9%
-8.6%
-5.2%
3.5%3.1%
2.5%
-10.0%
-8.0%
-6.0%
-4.0%
-2.0%
0.0%
2.0%
4.0%
6.0%
FH 2012 BH 2012 FH 2013 BH 2013 FH 2014 BH 2014 FH 2015 BH 2015 FH 2016 BH 2016
$ % Chg vs YA
NESTLE FROZEN PREPARED MEALS
Source: Nielsen RMS, xAOC, 2012 – 2016
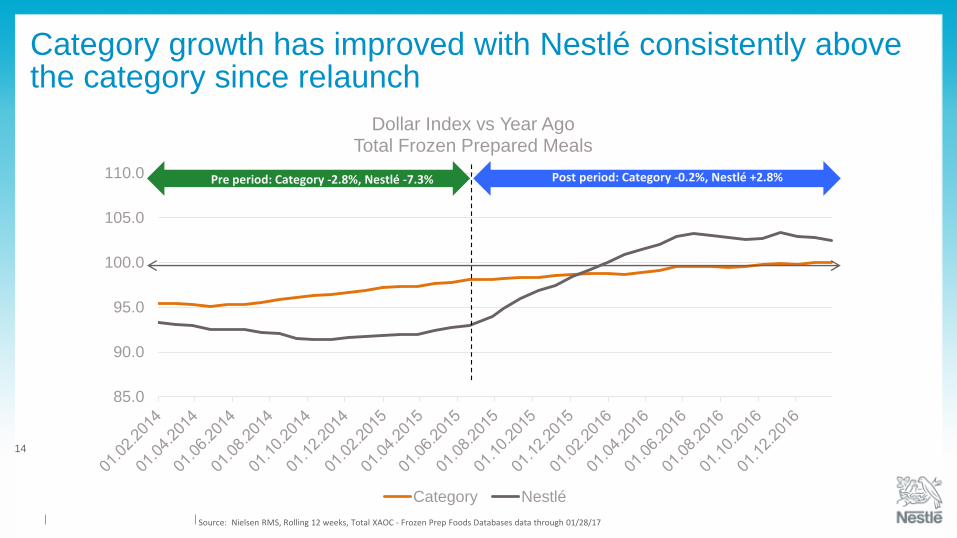
Category growth has improved with Nestlé consistently above the category since relaunch
14
85.0
90.0
95.0
100.0
105.0
110.0
Dollar Index vs Year AgoTotal Frozen Prepared Meals
Category Nestlé
Pre period: Category -2.8%, Nestlé -7.3% Post period: Category -0.2%, Nestlé +2.8%
Source: Nielsen RMS, Rolling 12 weeks, Total XAOC - Frozen Prep Foods Databases data through 01/28/17
15
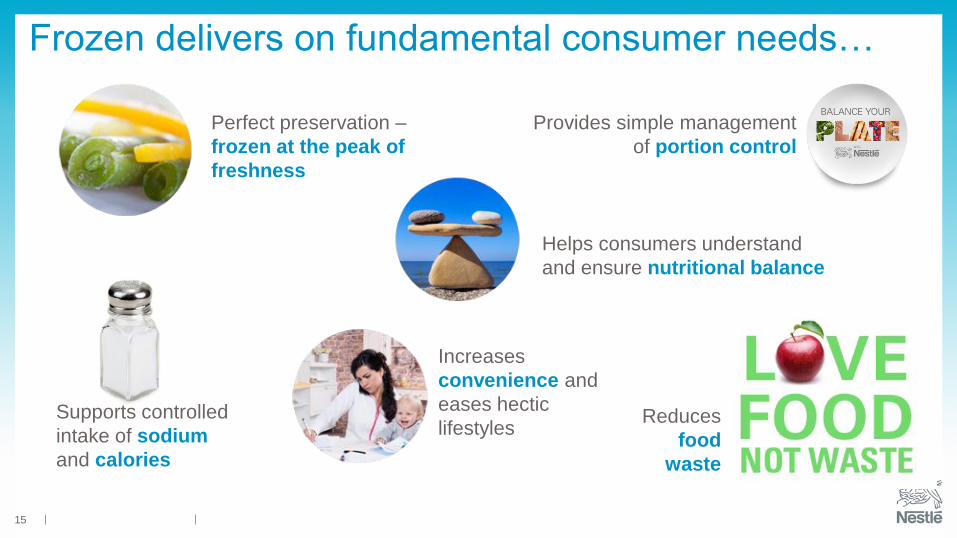
Provides simple management
of portion control
Perfect preservation –
frozen at the peak of
freshness
Frozen delivers on fundamental consumer needs…
Supports controlled
intake of sodium
and calories
Increases
convenience and
eases hectic
lifestylesReduces
food
waste
Helps consumers understand
and ensure nutritional balance
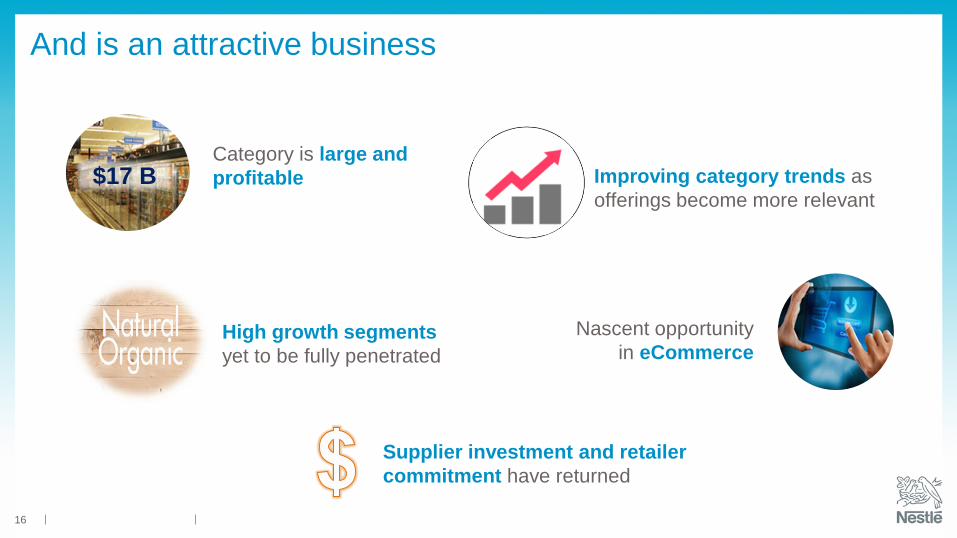
And is an attractive business
16
Category is large and
profitable
High growth segments
yet to be fully penetrated
Improving category trends as
offerings become more relevant
Supplier investment and retailer
commitment have returned
Nascent opportunity
in eCommerce
$17 B
Virtuous
Circle
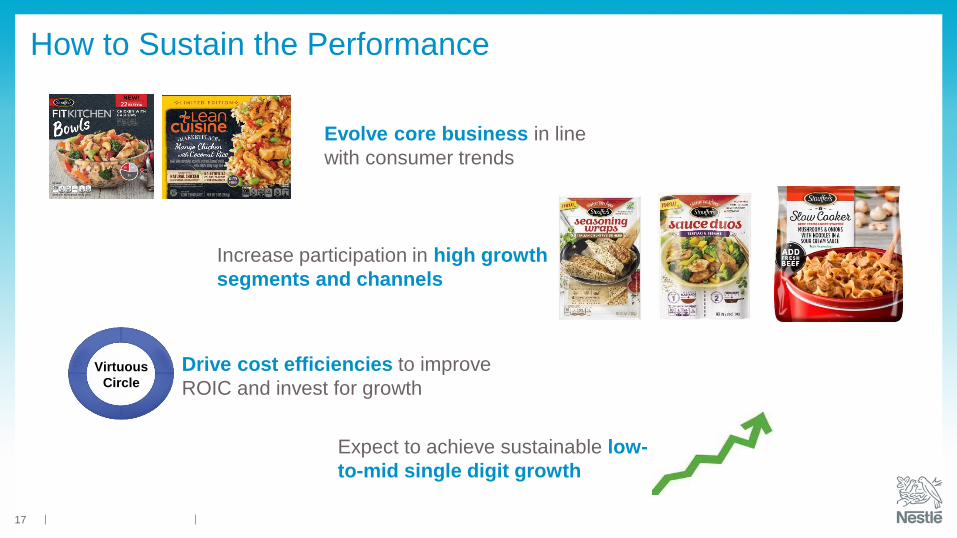
How to Sustain the Performance
17
Evolve core business in line
with consumer trends
Increase participation in high growth
segments and channels
Drive cost efficiencies to improve
ROIC and invest for growth
Expect to achieve sustainable low-
to-mid single digit growth