
Negative Trials in RCC:Where Did We Go Wrong?
Can We Do Better?
Tim Eisen
9th European Kidney Cancer Symposium, Dublin, April 2014

Tim Eisen - Disclosures
Company Research Support
Advisory Board
Trial Management
Group
Honoraria
Astra Zeneca + + +Astellas + +Aveo + + +Bayer + + + +GSK + + + +Immatics +Pfizer + + +Roche + +

Appraisal
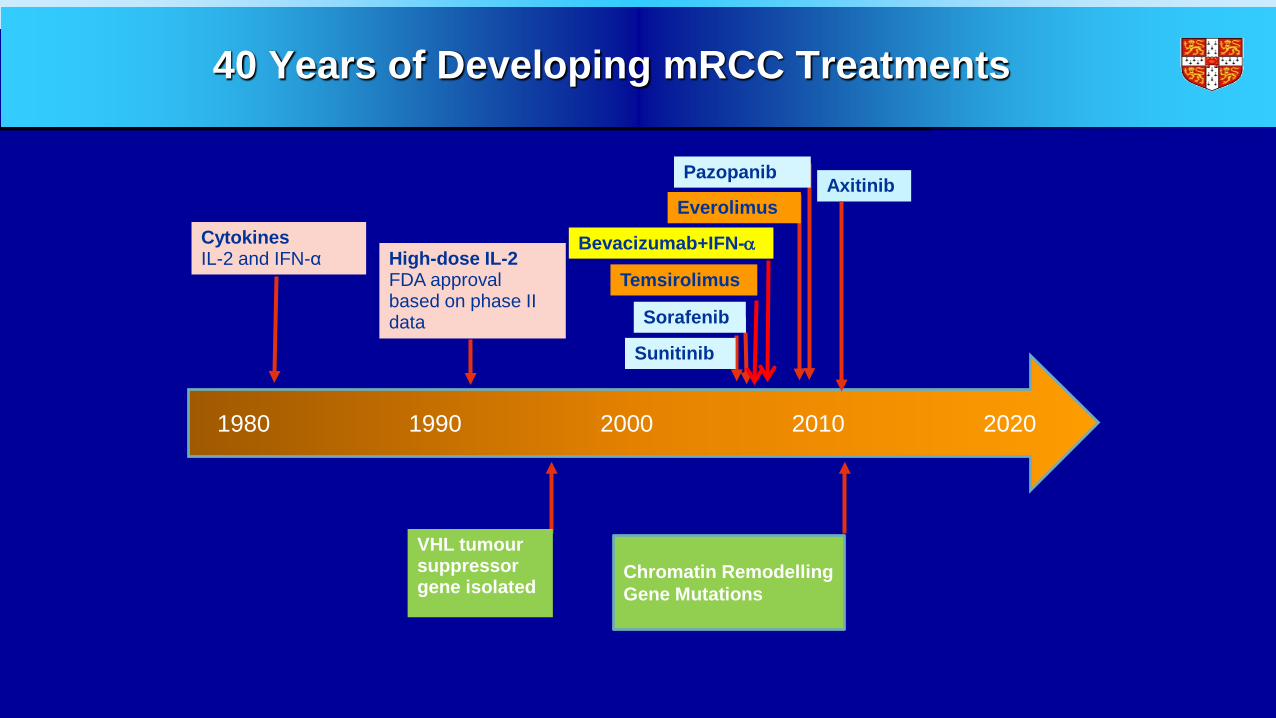
40 Years of Developing mRCC Treatments
1980 1990 2000 2010 2020
CytokinesIL-2 and IFN-α High-dose IL-2
FDA approvalbased on phase II data
Sunitinib
Sorafenib
Temsirolimus
Bevacizumab+IFN-α
Everolimus Axitinib
Pazopanib
Chromatin Remodelling Gene Mutations
VHL tumour suppressor gene isolated
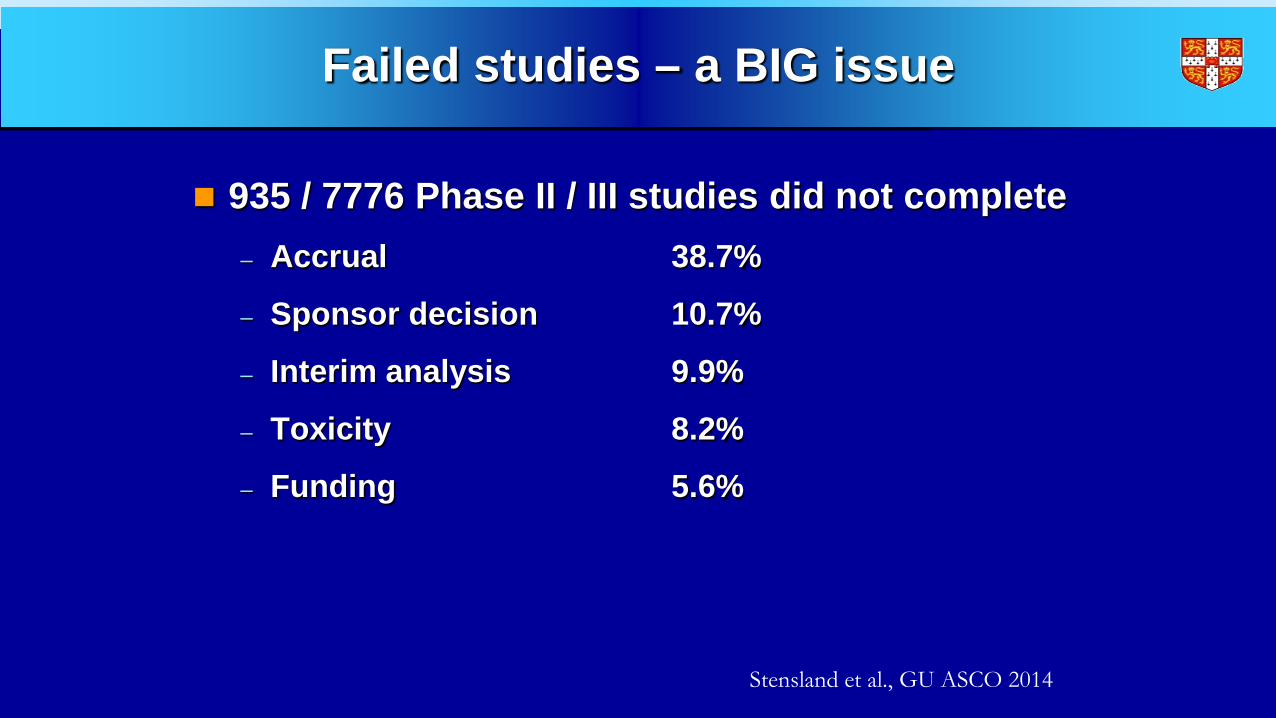
Failed studies – a BIG issue
935 / 7776 Phase II / III studies did not complete– Accrual 38.7%
– Sponsor decision 10.7%
– Interim analysis 9.9%
– Toxicity 8.2%
– Funding 5.6%
Stensland et al., GU ASCO 2014
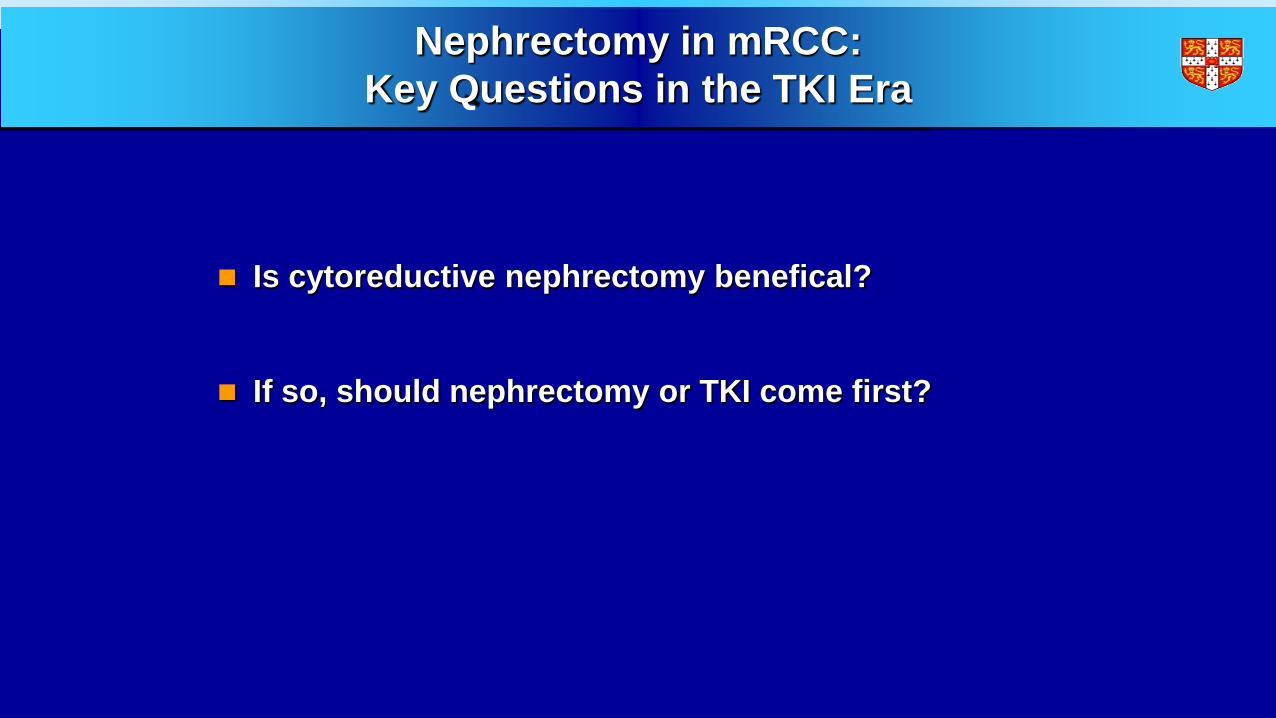
Nephrectomy in mRCC:Key Questions in the TKI Era
Is cytoreductive nephrectomy benefical?
If so, should nephrectomy or TKI come first?
CARMENA V SURTIME

There are many ongoing Phase III studies of adjuvant targeted therapy in RCC...
Trial Treatment arms andduration
Patients N
SORCE1 Sorafenib (3 years)Sorafenib (1 year) then
placebo (2 years)Placebo (3 years)
Resected clear-cell/non-clear-cell RCC and intermediate- or high-risk disease
1656
ASSURE2 Sorafenib SunitinibPlacebo
Resected clear-cell/non-clear-cell RCC and intermediate-high- or very-high-risk disease
1923
S-TRAC3 SunitinibPlacebo
Resected predominantly clear-cell RCC and high-risk disease
720
PROTECT4 PazopanibPlacebo
Resected (predominantly) clear-cell RCC with high or moderately high risk of recurrence
1500
EVEREST5 EverolimusPlacebo
Resected clear-cell/non-clear-cell RCC and intermediate-high- or very-high-risk disease
1218
1 year
1 year
1 year
54 weeks
1. www.clinicaltrials.gov. NCT00492258; 2. www.clinicaltrials.gov. NCT00326898;3. www.clinicaltrials.gov. NCT00375674; 4. www.clinicaltrials.gov. NCT01235962; 5. www.clinicaltrials.gov. NCT01120249.
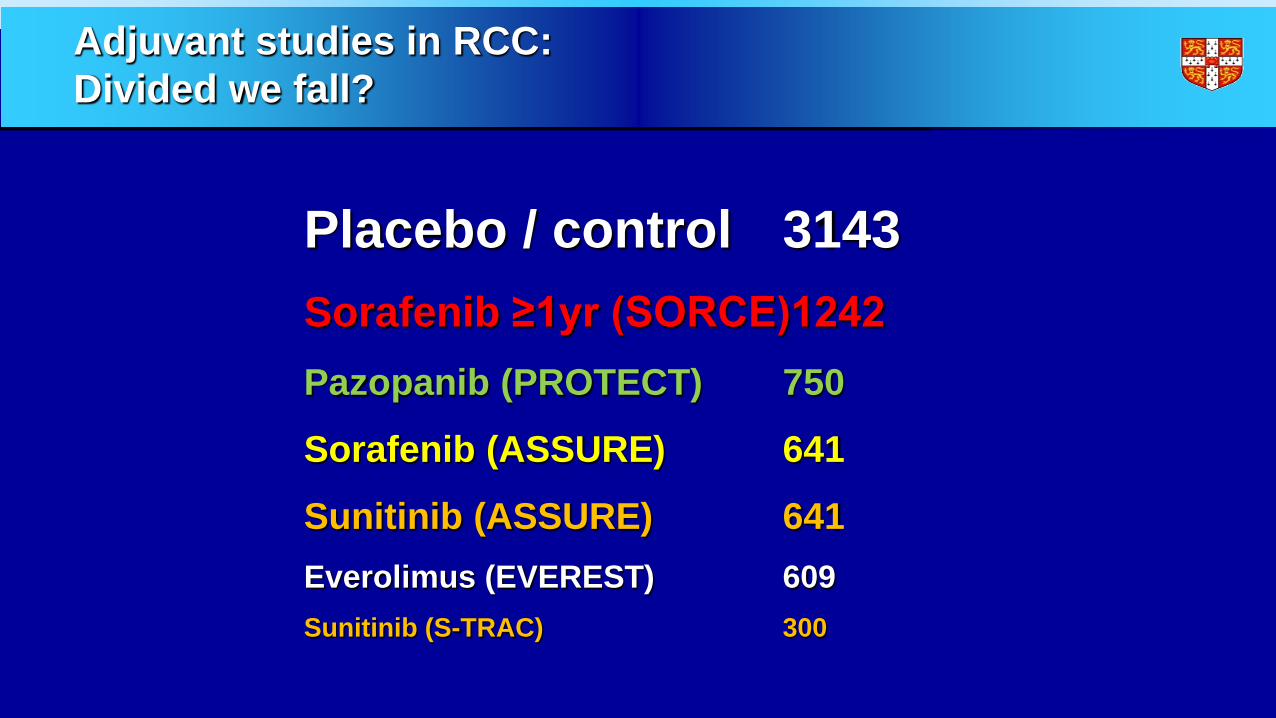
Adjuvant studies in RCC:Divided we fall?
Placebo / control 3143Sorafenib ≥1yr (SORCE)1242Pazopanib (PROTECT) 750
Sorafenib (ASSURE) 641
Sunitinib (ASSURE) 641Everolimus (EVEREST) 609Sunitinib (S-TRAC) 300

ARISER (G250 v Placebo)
Risk Group Staging % of total Leibovich Score1 T3/4; N0/X; M0 75% 4 - 92 Any T; N+; M0 8% 2 – 113 T1b/2; N0/NX; M0; G>3 17% 3 - 8
• Metastases at baseline in 11%• Median DFS 71 months• 5 year OS 78%
Belldegrun et al., ASCO 2013

MAMS vs traditionalTraditional Approach
Phase II
Phase III
T1
C T1
T2T3
C T3
T4
C T4
Multi-arm, Multi-stage
T2 T3T1C T4
Phase II
Phase III
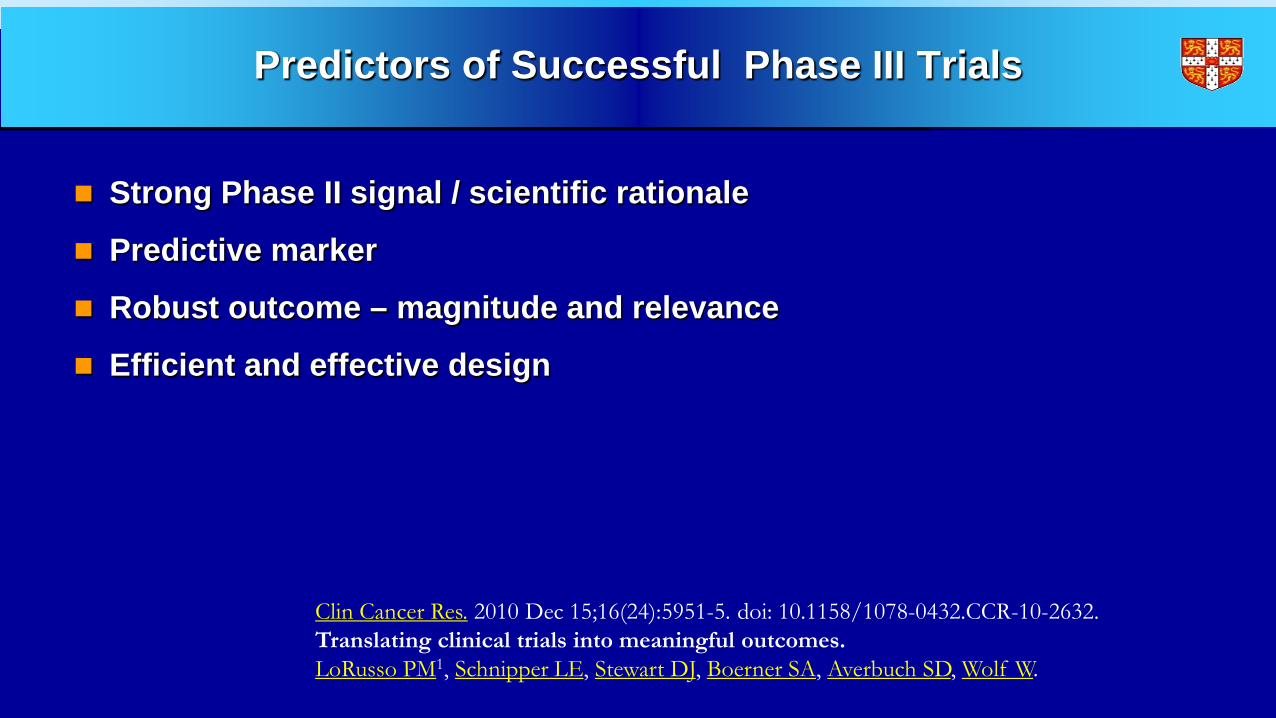
Predictors of Successful Phase III Trials
Strong Phase II signal / scientific rationale
Predictive marker
Robust outcome – magnitude and relevance
Efficient and effective design
Clin Cancer Res. 2010 Dec 15;16(24):5951-5. doi: 10.1158/1078-0432.CCR-10-2632.Translating clinical trials into meaningful outcomes.LoRusso PM1, Schnipper LE, Stewart DJ, Boerner SA, Averbuch SD, Wolf W.
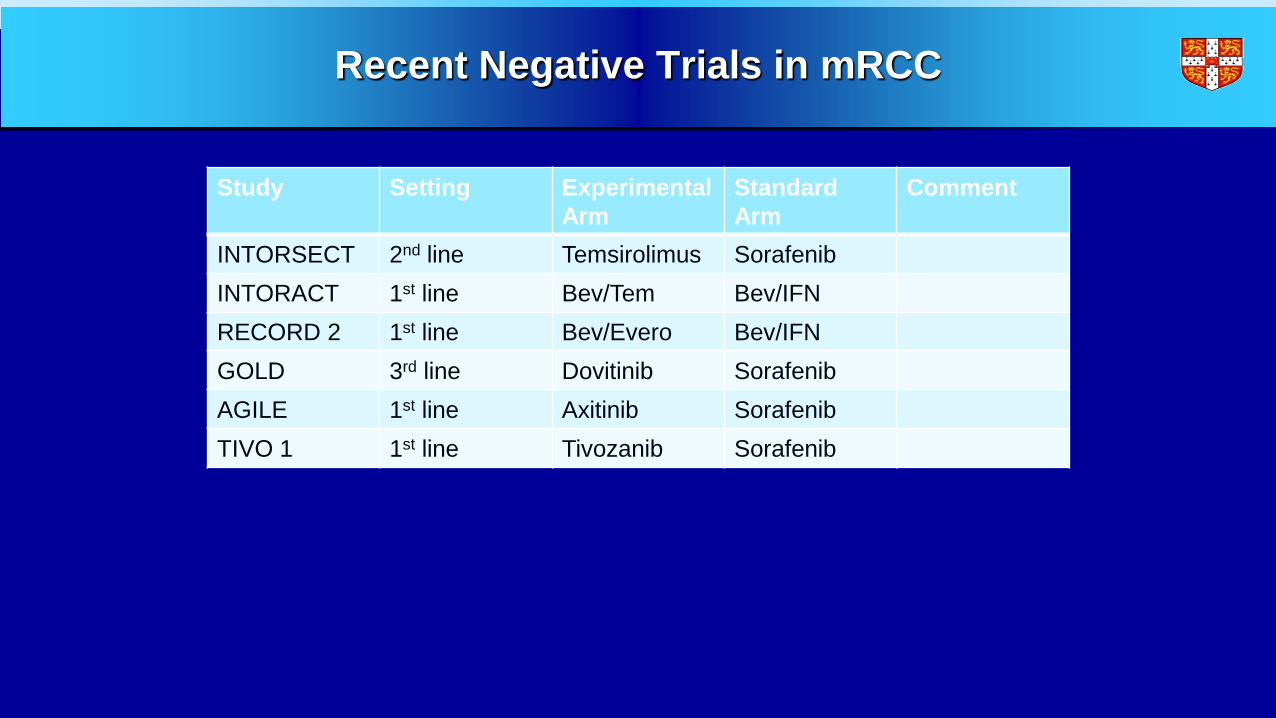
Recent Negative Trials in mRCC
Study Setting ExperimentalArm
StandardArm
Comment
INTORSECT 2nd line Temsirolimus SorafenibINTORACT 1st line Bev/Tem Bev/IFNRECORD 2 1st line Bev/Evero Bev/IFNGOLD 3rd line Dovitinib SorafenibAGILE 1st line Axitinib SorafenibTIVO 1 1st line Tivozanib Sorafenib

INTORSECT Phase III Study Design1
aDose reductions were allowed: temsirolimus (to 20 mg then 15 mg); sorafenib (to 400 mg/day, then every other day) 1. Hutson TE et al ESMO 2012; abstract LBA22_PR
N = 512
Key eligibility criteria:• mRCC• PD on 1st-line sunitinib
Stratification factors:• Duration of sunitinib
therapy (≤ or > 6 mos)• MSKCC risk group• Histology (clear cell or
non clear-cell)• Nephrectomy status
Primary end point: PFS (IRC)Secondary end points: OS, PFS (investigator), PFS at 12, 24, and 36 weeks, ORR, duration of response
Temsirolimus25 mg IV weeklya
n = 259
Sorafenib400 mg oral BIDa
n = 253
RANDOM I ZATION1:1

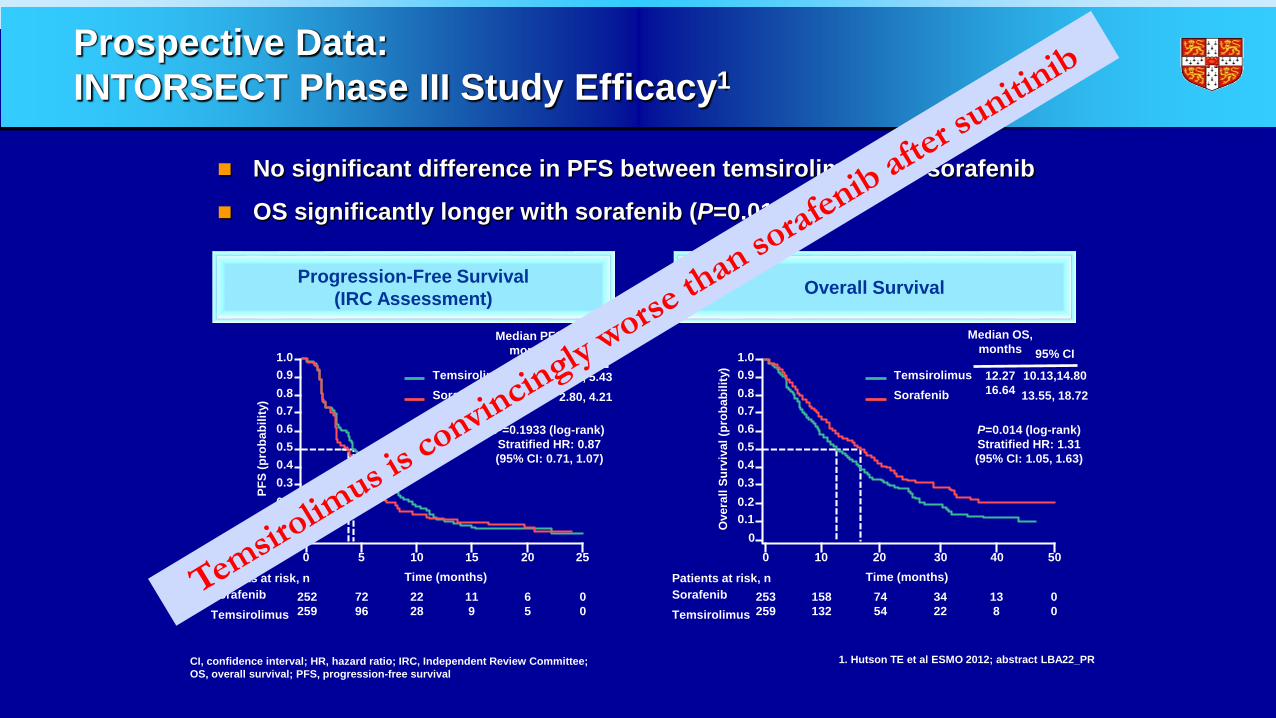
Prospective Data: INTORSECT Phase III Study Efficacy1
No significant difference in PFS between temsirolimus and sorafenib
OS significantly longer with sorafenib (P=0.014)
1. Hutson TE et al ESMO 2012; abstract LBA22_PR
1.00.90.80.70.60.50.40.30.20.1
00 5 10 15 20 25
PFS
(pro
babi
lity)
Time (months)Patients at risk, nSorafenibTemsirolimus
252259
7296
2228
119
65
00
TemsirolimusSorafenib
Median PFS,months 95% CI
4.283.91
4.01, 5.432.80, 4.21
P=0.1933 (log-rank)Stratified HR: 0.87(95% CI: 0.71, 1.07)
Progression-Free Survival(IRC Assessment)
CI, confidence interval; HR, hazard ratio; IRC, Independent Review Committee; OS, overall survival; PFS, progression-free survival
1.00.90.80.70.60.50.40.30.20.1
00 10 20 30 40 50
Ove
rall
Surv
ival
(pro
babi
lity)
Time (months)Patients at risk, nSorafenibTemsirolimus
253259
158132
7454
3422
138
00
TemsirolimusSorafenib
Median OS,months 95% CI
12.2716.64
10.13,14.8013.55, 18.72
P=0.014 (log-rank)Stratified HR: 1.31(95% CI: 1.05, 1.63)
Overall Survival

Recent Negative Trials in mRCC
Study Importantquestion?
Strong rationale?
Predictive marker?
Good design?
INTORSECT Yes Yes No YesINTORACTRECORD 2GOLDAGILETIVO 1
www.esmo2012.org
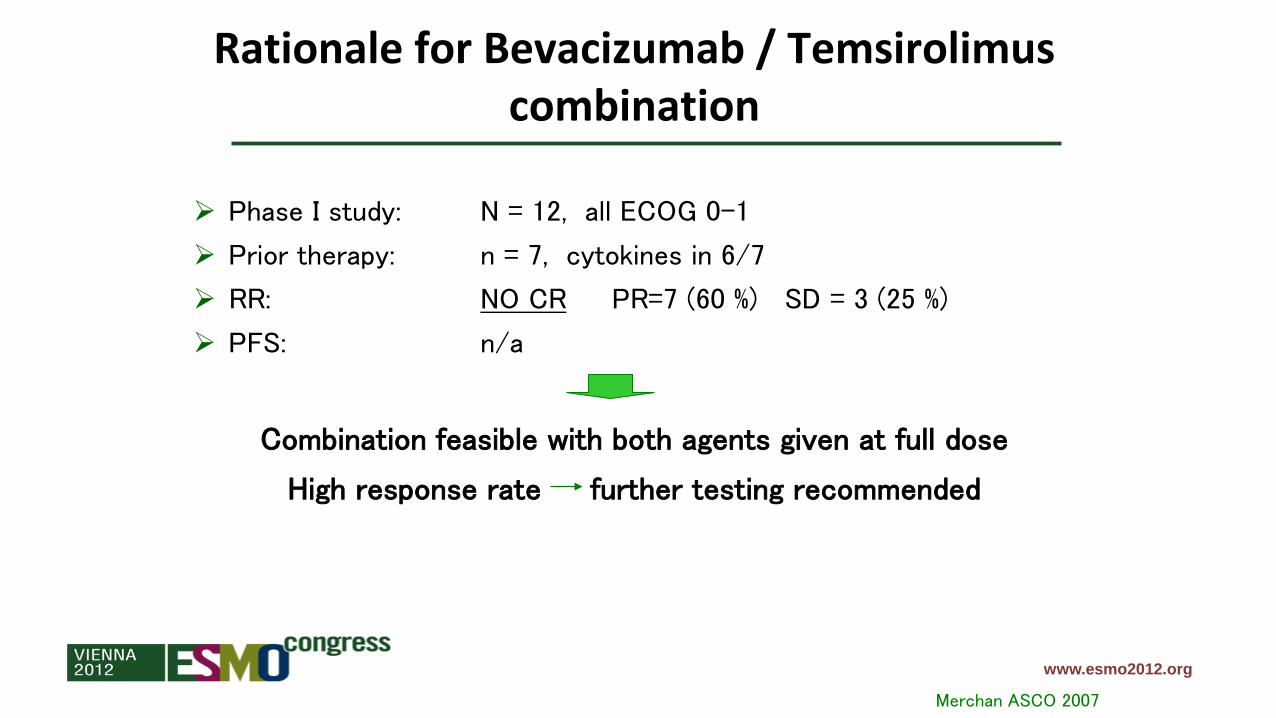
Rationale for Bevacizumab / Temsirolimus combination
Merchan ASCO 2007
Phase I study: N = 12, all ECOG 0-1
Prior therapy: n = 7, cytokines in 6/7
RR: NO CR PR=7 (60 %) SD = 3 (25 %)
PFS: n/a
Combination feasible with both agents given at full dose
High response rate further testing recommended

www.esmo2012.org
Rationale for Everolimus/Bevacizumab combination
Whorf et al ASCO 2008; Hainsworth et al JCO 2010
Phase II study: N = 30 untreated patients in preliminary reportN = 50 untreated patients in final report
Median PFS: 12 months in ASCO 2008 presentation (9 months in abstract) 9.1 months in the final report (JCO 2010)
RR: NO CR PR=23 % SD = 53 %
Combination feasible with both agents given at full dose
Very active (“12 months PFS”) further testing recommended

Recent Negative Trials in mRCC
Study Setting ExperimentalArm
StandardArm
Comment
INTORSECT 2nd line Temsirolimus Sorafenib PositiveINTORACT 1st line Bev/Tem Bev/IFN Ph I signal RECORD 2Large Ph II
1st line Bev/Evero Bev/IFN Ph II signal +/-
GOLD 3rd line Dovitinib Sorafenib True negativeAGILE 1st line Axitinib SorafenibTIVO 1 1st line Tivozanib Sorafenib

AGILE Study Design*
Previously untreated metastatic RCC
RANDOMIZE
Axitinib 5 mg BID†
(n=192)
2:1
Sorafenib 400 mg BID(n=96)
Primary endpoint: PFSRandomization stratified by ECOG PS (0 vs 1). * ClinicalTrials.gov: NCT00920816.† Titrated stepwise to 7 mg BID and then 10 mg BID in patients without grade 3 or 4 (CTCAE v3.0) axitinib-related AEs for a consecutive 2-week period, unless BP >150/90 mmHg. 22
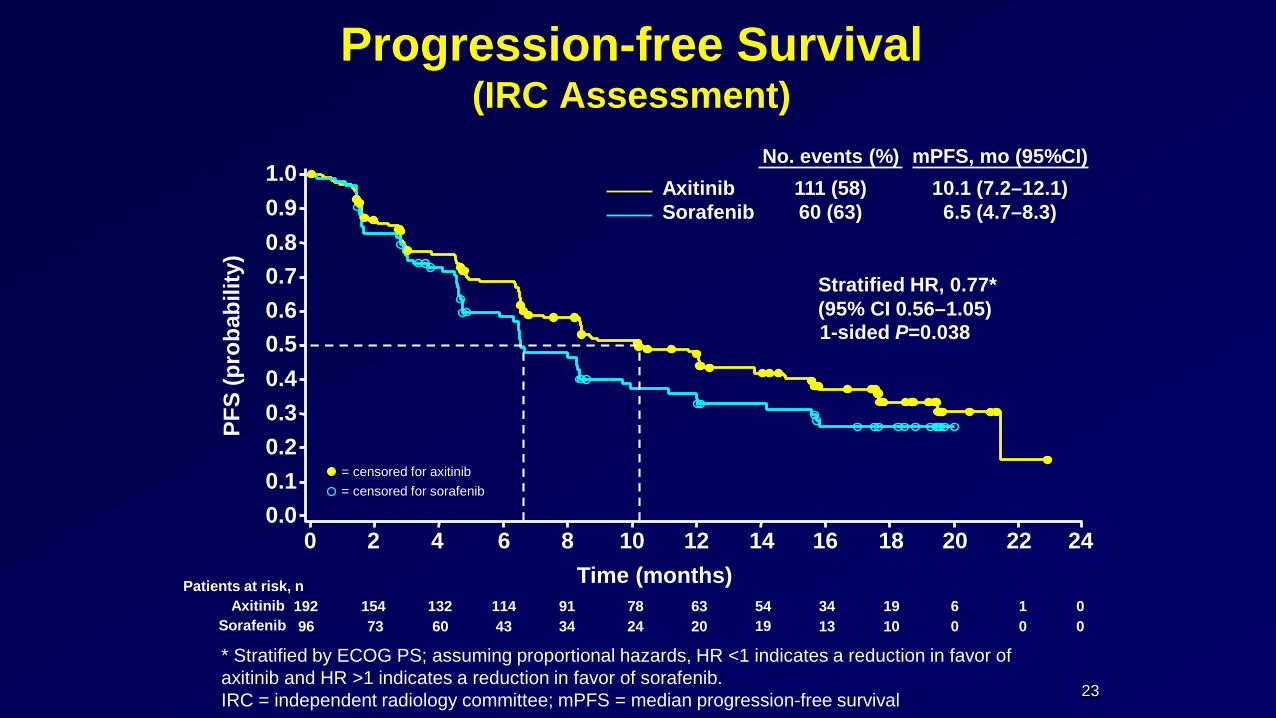
Progression-free Survival (IRC Assessment)
* Stratified by ECOG PS; assuming proportional hazards, HR <1 indicates a reduction in favor of axitinib and HR >1 indicates a reduction in favor of sorafenib.IRC = independent radiology committee; mPFS = median progression-free survival
1.00.90.80.70.60.50.40.30.20.10.0
0 2 4 6 8 10Time (months)
12 14 16 18 20
PFS
(pro
babi
lity)
22 24
1-sided P=0.038
Stratified HR, 0.77*(95% CI 0.56–1.05)
Axitinib Sorafenib
No. events (%)111 (58)60 (63)
192 154 132 114 91 78 63 54 19 6 096 73 60 43 34 24 20 19 10 0 0
Patients at risk, nAxitinib
Sorafenib3413
10
= censored for axitinib= censored for sorafenib
23
mPFS, mo (95%CI)10.1 (7.2–12.1)
6.5 (4.7–8.3)

Statistical Design• Primary endpoint for first-line comparison was PFS, assessed by
independent radiology committee (IRC)− 90% power to detect a 78% improvement in mPFS from 5.5 mo with sorafenib
to 9.8 mo with axitinib, corresponding to an HR of 0.56 (overall 1-sided α=0.025)
− An estimated 247 treatment-naïve patients were needed to observe the required 148 IRC-assessed PFS events
− One interim futility analysis was planned at 74 (50%) investigator-assessed PFS events; independent data monitoring committee (DMC) could adjust number of IRC-assessed PFS events based on conditional power at interim analysis
− Number of PFS events was increased to 169 by DMC
24

Recent Negative Trials in mRCC
Study Setting ExperimentalArm
StandardArm
Comment
INTORSECT 2nd line Temsirolimus Sorafenib True negativeINTORACT 1st line Bev/Tem Bev/IFN Ph I signal RECORD 2Large Ph II
1st line Bev/Evero Bev/IFN Ph II signal +/-
GOLD 3rd line Dovitinib Sorafenib True negativeAGILE 1st line Axitinib Sorafenib StatisticsTIVO 1 1st line Tivozanib Sorafenib

26
TIVO-1: Phase III superiority study of tivozanib vs sorafenib as first-line targeted therapy for advanced RCC
Motzer et al. J Clin Oncol 2012; 30(Suppl): Abstract 4501 (Oral presentation)
RANDOMISED
1:1Stratification factors• Geographic region• Prior treatments for mRCC • Number of metastatic lesions
Key eligibility criteria• Advanced RCC • Clear cell histology• Measurable disease • Prior nephrectomy• 0–1 prior therapy for mRCC• No prior VEGF or mTOR therapy• ECOG PS 0–1
Tivozanib 1.5 mg/day p.o., 3 weeks on/1 week off
(N=260)
Sorafenib 400 mg p.o. b.d., continuous
(N=257)
Crossover to tivozanib via separate protocol
Progression

27
HR=0.797; P=0.042
Median PFS, months (95% CI)
Tivozanib 11.9 (9.3–14.7)
Sorafenib 9.1 (7.3–9.5)
100
0
40
20
0 5 10 15Time since randomisation (months)
20
Prob
abili
ty o
f PFS
(%)
60
80
No. at riskTivozanib 260 257 217 210 181 179 164 163 144 140 126 117 109 100 94 68 65 29 29 2 2 0Sorafenib 257 253 218 212 184 183 146 144 120 113 91 84 73 68 64 46 44 19 18 2 2 0
TivozanibSorafenib
Tivozanib is superior to sorafenib for PFS (primary endpoint, independent radiological review)
ITT population
Data on file, AVEO/Astellas Pharma 2012, Study 301 CSR, Table 17 and Figure 3 Motzer et al. J Clin Oncol 2012; 30(Suppl): Abstract 4501 (Oral presentation)

28
Use of next-line treatments confounds the OS comparison
Still on tivozanib
treatment
Still on sorafenib
treatment
Randomised to tivozanib arm (n=260)
Randomised to sorafenib arm (n=257)
27%(n=71)
12%(n=31)
Discontinued initial
therapy 73%
(n=189)
Discontinued initial
therapy 88%
(n=226)
64%18%
10%8%
26%
3%
2%
70% (156/158 patients received
tivozanib)
VEGF (n=18)mTOR (n=16)No therapy (n=121)Other*(n=34)
VEGF (n=158)mTOR (n=4)No therapy (n=58)Other* (n=6)
Motzer et al. J Clin Oncol 2013; 31(Suppl 6): Abstract 350 (Poster)
*Other includes radiotherapy and cytokinesDue to rounding, total does not equal 100%
28

29
TIVO-1: final OS analysisMedian OS,
months (95% CI)
Tivozanib 28.8 (22.5–NR)
Sorafenib (includes patients who crossed over)
29.3 (29.3–NR)
Surv
ival
(%) HR=1.25; P=0.105
Tivozanib armSorafenib arma
No. at riskTivozanib 260 256 241 227 211 198 183 170 159 148 142 133 125 89 39 2 0Sorafenib 257 249 241 232 218 208 194 181 170 167 157 151 137 98 43 3 0
Time (months)
100
0
40
20
60
80
0 6 10 18 262 8 12 20 284 1614 22 3024 32
aincludes patients who crossed over to tivozanib after progression on sorafenibMotzer et al. J Clin Oncol 2013; 31(Suppl 6): Abstract 350 (Poster)
29

Recent Negative Trials in mRCC
Study Setting ExperimentalArm
StandardArm
Comment
INTORSECT 2nd line Temsirolimus Sorafenib PositiveINTORACT 1st line Bev/Tem Bev/IFN Ph I signal RECORD 2Large Ph II
1st line Bev/Evero Bev/IFN Ph II signal +/-
GOLD 3rd line Dovitinib Sorafenib True negativeAGILE 1st line Axitinib Sorafenib StatisticsTIVO 1 1st line Tivozanib Sorafenib Design

Conclusions
Perspective
Help ourselves in difficult situations
Minimise Risk & Maximise Efficiency:– How persuasive will the data be?
– Try to foresee consequences of design
– Strength of Phase II / scientific rationale
– Realistic statistical design
– Novel designs
Phase II: Use RECIST as a continuous variable
Multi-Arm Multi-Stage

Recommended