NBER WORKING PAPER SERIES
FINANCIAL GLOBALIZATION, GOVERNANCE,AND THE EVOLUTION OF THE HOME BIAS
Bong-Chan KhoRené M. Stulz
Francis E. Warnock
Working Paper 12389http://www.nber.org/papers/w12389
NATIONAL BUREAU OF ECONOMIC RESEARCH1050 Massachusetts Avenue
Cambridge, MA 02138July 2006
Respectively, Seoul National University; Ohio State University, ECGI and NBER; University of Virginia,IIIS and NBER. We are grateful to Ji-Woong Chung, Jin-Woo Kim, Carrie Pan and Francesca Silvestrini forresearch assistance. We thank Craig Doidge for providing us with cross-listing data. We are grateful to HeitorAlmeida, John Ammer, Menzie Chinn, Andrew Karolyi, Philip Lane, José Viòals, Daniel Wolfenson, andthe participants of a seminar at Ohio State, at the BIS Annual Conference, and at the ECB Conference onFinancial Globalization for comments. Warnock thanks the Darden School Foundation for generous support.
©2006 by Bong-Chan Kho, René M. Stulz and Francis E. Warnock. All rights reserved. Short sections oftext, not to exceed two paragraphs, may be quoted without explicit permission provided that full credit,including © notice, is given to the source.
Financial Globalization, Governance, and the Evolution of the Home BiasBong-Chan Kho, René M. Stulz and Francis E. WarnockNBER Working Paper No. 12389July 2006JEL No. F36, F30, G32, G30, G11, G15
ABSTRACT
Despite the disappearance of formal barriers to international investment across countries, we findthat the average home bias of U.S. investors towards the 46 countries with the largest equity marketsdid not fall from 1994 to 2004 when countries are equally weighted but fell when countries areweighted by market capitalization. This evidence is inconsistent with portfolio theory explanationsof the home bias, but is consistent with what we call the optimal insider ownership theory of thehome bias. Since foreign investors can only own shares not held by insiders, there will be a largehome bias towards countries in which insiders own large stakes in corporations. Consequently, forthe home bias to fall substantially, insider ownership has to fall in countries where it is high. Poorgovernance leads to concentrated insider ownership, so that governance improvements make itpossible for corporate ownership to become more dispersed and for the home bias to fall. We findthat the home bias of U.S. investors decreased the most towards countries in which the ownershipby corporate insiders is low and countries in which ownership by corporate insiders fell. Usingfirm-level data for Korea, we find that portfolio equity investment by foreign investors in Koreanfirms is inversely related to insider ownership and that the firms that attract the most foreignportfolio equity investment are large firms with dispersed ownership.
Bong-Chan KhoCollege of Business AdministrationSeoul National UniversitySinlim-Dong, Kwanak-KuSeoul 151-742, [email protected]
René M. StulzFisher College of BusinessOhio State University806A Fisher Hall2100 Neil AvenueColumbus, OH 43210-1144and [email protected]
Francis E. WarnockDarden Business SchoolUniversity of VirginiaCharlottesville, VA 22906-6550and [email protected]
1. Introduction
Fifty years ago, investing in foreign securities was almost impossible for most investors.
Typically, their country forbade them to do so or, equivalently, made it impossible for them to
obtain foreign currency to pay for foreign securities. Moreover, the countries in which they would
have wanted to invest almost always did not allow them do so. As a result, capital markets in
most countries were essentially completely segmented. Since then, explicit barriers to
international investment have been brought down and, for the largest and most developed
countries, largely eliminated. To use the analogy of Friedman (2005), when one focuses on
explicit barriers, the financial world has become flat when one looks at developed countries and
has become flatter when one considers emerging markets.
Since the early 1990s, after a wave of liberalizations in emerging markets, stock markets
from developed countries as well as from a large number of emerging countries have been open
to foreign investors. The neo-classical model of portfolio choice predicts that, under these
circumstances, investors hold portfolios that are well-diversified internationally, so that risk is
shared across countries efficiently and capital flows where it can be used most profitably.1
Instead, capital does not appear to flow where neo-classical models predict it could be used most
profitably (see Lucas, 1990) and investors still hold portfolios that are overweighted in the
securities of the country they come from. In other words, the home bias is still with us, even
though what used to be the main argument for the existence of such a bias, formal barriers to
international investment, has not been important since the early 1990s for most countries with
functioning stock markets. Consequently, the financial world is much flatter de jure than de facto,
which limits the sharing of risks internationally and prevents capital from flowing where neo-
classical models suggest it would have the highest return.
In this paper, we investigate how the home bias has evolved since the end of the equity
market liberalization wave of the beginning of the 1990s, why the home bias is still with us and 1 See Lewis (1999) and Karolyi and Stulz (2003) for reviews of the literature.
2
what financial globalization means for the home bias.2 The traditional approach to explaining the
home bias, which we call the portfolio approach, focuses on investors’ portfolio demands and
identifies reasons why investors have different demands for home country securities compared to
foreign securities. Four such reasons have played a dominant role in the literature: (1) explicit
barriers to international investment, (2) hedging motives, (3) differential access to information,
and (4) behavioral biases. We review this literature in the next section. However, except for
behavioral biases, the reasons for the home bias advanced by this literature cannot explain the
magnitude of the home bias. Further, the impact of explicit barriers to international investment
and differential access to information has fallen over time, so that some of these explanations for
the home bias suggest a decreasing, if not disappearing, home bias.
The portfolio approach makes the critical assumption that there is no optimal ownership
structure for firms. Yet, there is a considerable literature on the determinants of insider ownership
in corporations. That literature predicts that insider ownership should be more concentrated when
agency problems between those who control corporations and outside investors are stronger.
These agency problems are stronger when the institutions that protect investors in a country are
poorer.3 If foreign investors have a strong home bias towards a country (so that they underweight
that country’s equities in their portfolio strongly) and it remains optimal for insiders to have large
ownership stakes in corporations in that country, it is not possible for the home bias towards that
country to fall sharply as long as foreign investors are not corporate insiders. To consider a
simple example, in 2004, France represented 4.75% of the world market portfolio. If investors
were mean-variance optimizers, there were no barriers to international investment, there were no
information asymmetries and each country’s stock market wealth equals its equity market
2 As Burger and Warnock (2004) show for U.S. investors, there is a strong home bias in bond holdings. We ignore this bias in this paper. Portfolio models do not in general predict that investors should hold the world market portfolio of bonds. For instance, in the well-known model of Solnik (1974), local-currency bonds are risk-free bonds for local investors but risky bonds for foreign investors. In that model, foreign investors take short positions in local currency bonds to hedge the currency risk of their local equity investments. 3 See Stulz (2005) for references.
3
capitalization, the absence of a home bias would mean that foreign investors would hold 95.25%
of each French firm. Yet, in 2004, the equally-weighted average of insider ownership for French
firms for which data was available on Worldscope was 58.1%. If it was optimal for French firms
to have 58.1% insider ownership, then foreign investors could not have possibly held 95.25% of
each French firm’s equity unless foreign investors were also insiders. In fact, if 58.1% insider
ownership was optimal and insiders were residents, which is typically the case, the largest
fraction of the common stock of French firms foreign investors could hold was 41.9% on average.
With this perspective, the existence of an optimal insider ownership bounds the holdings of
foreign investors and prevents the elimination of the home bias.
The existence of an optimal level of insider ownership leads to what we call the optimal
insider ownership theory of the home bias. With this theory, the upper bound on foreign
ownership through equity holdings is determined by the optimal size of insider ownership. This
theory has sharply different predictions for the evolution of the home bias than the portfolio
choice models with rational investors. Optimal insider ownership depends on the institutions that
support corporate governance in a country as well as on the risks of predation by the state. With
weak governance because of weak institutions, concentrated insider ownership is optimal.
Consequently, to improve the potential for risk-sharing through equity holdings, institutions have
to improve so that decentralized ownership becomes optimal. Therefore, for the home bias to
have a chance to disappear, institutions that support decentralized ownership have to become
prevalent across the world.
Portfolio investors can only hold shares not held by insiders. Hence, as pointed out by
Dahlquist, Pinkowitz, Stulz, and Williamson (2003), portfolio investors cannot hold the world
market portfolio, but they can hold the world market portfolio of shares not held by insiders,
which we call the float-adjusted world market portfolio. If all investors hold the float-adjusted
world market portfolio, there is a mechanical relation between insider holdings and foreign
ownership: as insider holdings fall, foreign investors buy a fraction of the shares sold by insiders
4
equal to the weight of the country in the float-adjusted world market portfolio. But if foreign
investors do not hold the float-adjusted world market portfolio, there is no necessary relation
between a change in insider ownership and a change in shares held by foreign investors because
all the shares sold by insiders could be bought by local investors. In either case, our theory
implies that there is a lower bound on the home bias that depends on insider ownership. For many
countries, this lower bound is high enough that there would be a large home bias towards these
countries even if the lower bound were binding.
We use data from 1994 to 2004 to investigate the evolution of the home bias. Our sample
period starts after a period of liberalization of equity markets in emerging countries, so that we
can consider a large number of countries whose equity markets are reasonably open to foreign
investors. 4 We first show that there is no evidence of a systematic decrease in ownership
concentration across the world. Consequently, the upper bound on risk-sharing has not increased
systematically. We then investigate how the holdings of U.S. investors in foreign countries
changed from 1994 to 2004, the first and latest years of the U.S. Treasury’s comprehensive and
high quality benchmark surveys of ownership of foreign securities by U.S. residents. Using this
dataset, we find that for a sample of 46 countries with the largest stock markets, the percentage of
stock market wealth invested in these countries by U.S. residents increased from 9.76% to
13.44% from 1994 to 2004. However, it would be wrong to infer from this that over time there is
a systematic increase in portfolio investment across countries towards the investment level that
would prevail without a home bias. In fact, the percentage of U.S. stock market wealth invested in
13 countries decreased over that period of time, and in 6 other countries the increase in U.S.
investment did not match the growth in the market. Further, the average change in the home bias
per country from 1994 to 2004 is not significantly different from zero. Strikingly, we find that the
4 Henry (2000), Bekaert and Harvey (2000), Levine and Zervos (1998) and Kim and Singal (2000) provide equity market liberalization dates for emerging markets. The only emerging markets with liberalization dates after 1992 are Jordan (1995), Nigeria (1993) and Zimbabwe (1993). These countries are not included in this study.
5
home bias decreases from 1994 to 2004 in countries where insiders had smaller stakes in firms in
1994 and where the stake of insiders fell from 1994 to 2004. This result is robust when taking
into account the endogeneity of insider holdings predicted by our theory.
The U.S. dataset has two main advantages. First, it is high quality, as the U.S. government
constructs it from security-level benchmark surveys. Second, it represents the international
positions of the largest group of foreign equity investors in the world. The disadvantages of the
U.S. dataset are that it provides data only for U.S. investors and only at the country level.5 This
sharply limits our ability to test our theory. We therefore use a second dataset that has firm-level
ownership data for foreign investors as well as corporate insiders. Few countries have such data
available over an extended time period. The dataset we were able to obtain is from Korea.
Besides having the data we need, Korea is interesting because it experienced the largest reduction
in the home bias from U.S. investors of any country from 1994 to 2004. Strikingly, the proportion
of the Korean stock market capitalization held by foreign investors tripled from 13.50% in 1996
to 41.33% in 2004. The Korean dataset reinforces our U.S. results. Foreign ownership is highly
concentrated in a small number of large firms with fairly dispersed ownership. More generally,
we find that the foreign ownership of Korean firms is inversely related to insider ownership and
grew in firms in which insider ownership fell.
The paper proceeds as follows. In Section 2, we review portfolio theories of the home bias. In
Section 3, we develop in more detail the implications of insider ownership concentration for the
home bias. In Section 4, we show that there is no evidence that insider ownership fell across the
world from 1994 to 2004. In Section 5, we document the evolution of the home bias of U.S.
investors from 1994 to 2004 and investigate the extent to which the evolution of the home bias
for U.S. investors is consistent with the various theories of the home bias. In Section 6, we
5 Another country-level data set, the IMF's Coordinated Portfolio Investment Survey (CPIS), started too late for our study (in 1997) and is complete starting only in 2001.
6
investigate whether the evolution of the home bias at the firm level for Korean firms is consistent
with the various theories of the home bias. We conclude in Section 7.
2. Portfolio models of the home bias
The models that use the portfolio approach to explain the home bias all proceed similarly.
They posit an indirect utility function which depends on wealth and state variables. The investor
maximizes the expected indirect utility function based on his expectation of the joint distribution
of asset returns and state variables. Investors differ across countries because the indirect utility
function and/or expectations of the joint distribution of returns and state variables differ across
countries. These differences lead to a home bias.
Most of the early literature on the home bias was focused on the role of barriers to
international investment. A number of papers presented models where domestic investors faced a
cost of investing in a foreign country (see, for instance, Black, 1974, Stulz, 1981a, and Errunza
and Losq, 1985). With such a cost, domestic investors overweight domestic stocks in their
portfolios. These models generally imply that investors will invest in the foreign stocks that have
the greatest diversification benefit for them, which are the foreign stocks least correlated with
domestic stocks.
In testing these models, the literature looked at the cross-section of stock returns. If there are
barriers to international investment, the international capital asset pricing model does not hold.
The evidence shows that there are departures from the international capital asset pricing model
for countries with capital markets that are not completely open to foreign investors and that
departures from the international capital asset pricing model vary with the degree of segmentation
of markets (see, for instance, Bekaert and Harvey, 1995). When a market is completely
segmented from the world markets, one would expect the capital asset pricing model to hold
domestically for that market, so that the expected return of a stock should be proportional to the
stock’s beta with respect to the market portfolio of the country. In contrast, when a market is
7
completely integrated in the world markets and the capital asset pricing model holds, one would
expect the expected return of a stock to be proportional to the beta of the stock with respect to the
world market portfolio. With these models, as barriers disappear, investors hold the world market
portfolio.
As barriers to international investment became less important but the home bias persisted,
authors focused more on alternative explanations for the home bias. Though one might think that
exchange rate risks lead investors to hold different equity portfolios, this need not be the case. If
there is no inflation, so that exchange rate risks are real exchange rate risks, investors can hedge
foreign exchange risks through money market positions, so that in principle foreign exchange
risks do not affect equity portfolios (see Solnik, 1974, Adler and Dumas, 1983). The fact is that
investors in different countries consume different goods and hence are exposed to different
inflation risks which can lead them to hold different portfolios of equities if portfolios that hedge
these relative price risks include stocks (Stulz, 1981b). The literature on hedging focuses either on
inflation risk directly or on the role of non-traded goods in consumption baskets. Cooper and
Kaplanis (1994) examine the role of inflation and conclude that the home bias cannot be
explained by inflation hedging. Evidence on the role of relative price risks in explaining the home
bias seems also to suggest that these risks are too small to explain the home bias (see, for
instance, Pesenti and Van Wincoop, 2002). Finally, investors are subject to various risks that they
might want to hedge also, such as risks to their human capital. Human capital risks may lead
investors to short domestic stocks (Baxter and Jermann, 1997), so that these risks can make the
home bias even more puzzling.6
If markets are efficient and investors are mean-variance optimizers, as long as investors
consider identical joint distributions of real asset returns, they hold the same portfolio which is
the market portfolio. The theories of the home bias considered so far assume that the joint
6 However, in the Engel and Matsumoto (2006) dynamic general equilibrium model, if goods prices are sticky, productivity shocks can make it optimal to overweight domestic equities.
8
distributions of asset real returns differ because of barriers to international investment and
because of differences in consumption baskets, or assume that investors are not mean-variance
optimizers. An additional possibility is that individuals simply have different expectations about
stock returns, volatilities, and covariances. In particular, if investors are more uncertain about the
expected returns for foreign stocks, these stocks will appear more risky to them and they will
overweight their portfolio with domestic stocks (see Gehrig, 1993). This kind of argument has
some empirical support, but it has three weaknesses. First, Jeske (2001, p. 31) concludes that “it
is unable to account for the patterns of home bias that can be observed both qualitatively and
quantitatively.” Second, investors who are better informed about their home market will at times
have bad signals justifying a low allocation to their home market, yet allocations to home
countries always exhibit a home bias and change little (see Jeske, 2001). Third, if resident
investors are better informed, we would expect them to outperform foreign investors. Yet, some
authors find that in some countries foreign investors outperform domestic investors.7
A possible explanation for the home bias is simply that investors exaggerate the risks of
investing abroad or hold biased estimates of expected returns for stocks from their own country.
There is survey evidence that is consistent with behavioral explanations of the home bias. For
instance, Shiller, Kon-Ya and Tsutsui (1996) show that investors are more optimistic about their
home equity markets than about foreign markets using survey data from the U.S. and Japan.8
Graham, Harvey, and Huang (2005) show that investors who believe they have greater
competence in their understanding of financial markets are substantially more likely to own
foreign stocks. Some authors have built models generating a home bias that use utility functions
that embed some behavioral factors emphasized in the psychology literature. In particular, Solnik
(2005) builds on an insight of Statman (1999) and models the portfolio allocation decision
7 See Seasholes (2000), Grinblatt and Keloharju (2000), and Froot and Ramadorai (2001). In addition, Thomas, Warnock and Wongswan (2006) find that U.S. investors’ foreign equity allocations beat the MSCI World (excluding US) index. 8 See also Kilka and Weber (2000) and Strong and Xu (2003).
9
between foreign and home country stocks as one where investors view foreign assets through a
narrow frame as assets with upside potential, but have regret when that upside potential does not
manifest itself.
3. Firm value, ownership structure, and governance
The simplest version of the portfolio models discussed in the previous section predicts that all
investors hold the world market portfolio if there are no barriers to international investment. With
this simple model, it would never be optimal for an individual to hold more equity in a firm in his
portfolio than the firm’s proportional share in the world market portfolio. Yet, everywhere in the
world, corporate insiders overweight the firm they control in their portfolio.9
The portfolio model and corporate finance approaches to firm ownership differ radically. The
corporate finance approach emphasizes that greater ownership by those who control the
corporation (the insiders in the following) can reduce the adverse impact of agency problems and
information asymmetries, so that there exists a level of insider ownership that maximizes firm
value.10 The optimal stake of the insiders can be very large. We first discuss the determinants of
the optimal stake of the insiders. We argue that when the institutions that protect the rights of
investors are poor, the optimal stake of the insiders is large. We consider then the implications of
poor institutions and high optimal insider ownership for investors who are not insiders.
3.1. The optimal insider ownership
Consider, for simplicity, a private firm controlled by an entrepreneur. We assume that he
owns all the equity of the firm. He is free to do what he wants as sole owner. In particular, he
faces no limits on the private benefits of control he consumes. The entrepreneur then chooses to
sell equity to the public through an IPO. The value of that equity will depend on how much
9 In an international macro model of portfolio choice with sticky goods prices and output that is demand determined in the short run, this overweighting can be optimal in the face of productivity shocks (Engel and Matsumoto, 2006). 10 See Helwege, Pirinsky and Stulz (2006) for a detailed review of the corporate finance approach to firm ownership and references.
10
ownership the entrepreneur retains for at least two reasons. First, if the entrepreneur were to sell
all his equity, his incentives to work hard and make correct decisions for the firm or to limit his
consumption of private benefits of control would be low.11 The nature of private benefits the
entrepreneur can extract from the firm he controls varies widely across the globe and depends on
how well outside investors are protected. While in the U.S. private benefits may take the form of
a nicer corporate plane, in many countries insiders can and at times do take money away from
minority shareholders through related party transactions.12 As the entrepreneur extracts private
benefits of control, the value of the cash flows available to minority shareholders falls and the
value of their shares is reduced. Second, the entrepreneur knows more about the firm’s future
cash flows than outsiders. Consequently, outsiders will use the retention decision of the
entrepreneur to assess the value of the future cash flows.13 They expect the entrepreneur to sell
more shares if he believes them to be overpriced, so that the price they are willing to pay for the
shares falls with the fraction of his ownership the entrepreneur wants to sell.
Investors will not buy equity from the entrepreneur if they believe that he will extract private
benefits from the firm to such an extent that there will be no cash flows left for outside investors.
To make public equity possible, it is therefore critical that it is costly for the insiders to extract
private benefits and that these costs increase as insiders extract more private benefits. Laws and
regulations that protect outside investors from expropriation by insiders increase the costs of
extracting private benefits of control. Outside investors are better protected if a country’s laws
and regulations are enforced efficiently and fairly, so that the degree to which investors are
protected from expropriation by insiders depends generally on the quality of a country’s
institutions. The entrepreneur can also increase the costs of extracting private benefits from the
firm by setting up firm-level governance mechanisms.
11 See, for instance, Jensen and Meckling (1976). 12 See Johnson, La Porta, Lopez-de-Silanes and Shleifer (2000). 13 See, for instance, Leland and Pyle (1977).
11
Firms in countries in which the insiders face low costs of extracting private benefits of
control will have higher insider ownership.14 Minority shareholders receive their proportionate
share of the firm’s cash flows net of the private benefits extracted by insiders. When insiders face
low costs of extracting private benefits of control, investors expect low cash flows and put a low
price on equity unless insiders commit to limit their extraction of private benefits of control.
Insiders can commit to lower extraction of private benefits of control by increasing their
ownership share of the firm. The reason for this is that insiders have fewer incentives to extract
private benefits of control if they have a large stake. If the insiders can extract private benefits
equal to a fraction δ of the cash flows and own a fraction α of the equity, they receive a fraction δ
+ α(1 – δ) of the firm’s cash flows. If α is equal to one, the fact that the insiders can extract
private benefits has no value to them since they own all of the firm’s cash flows and can do with
them what they want. When α is smaller than one, insiders pay for their private benefits partly out
of their own pocket because these private benefits come at the expense of dividends they would
otherwise receive. The lower the ownership of the insiders, the less they pay for their private
benefits out of their own pocket. Consequently, by choosing a high level of ownership, insiders
commit to low extraction of private benefits.
As long as there is some protection of minority shareholders, there is a cost to insiders from
extracting private benefits. For instance, they might get caught doing so and have to pay
penalties. The cost of extracting private benefits will increase for insiders as the protection of
investors improves through laws and enforcement of laws. As the cost of extracting private
benefits increases, the benefits of high insider ownership become worth less to outsiders. In fact,
if the cost of extracting private benefits is infinite, ownership is optimally dispersed. It follows
from this discussion that optimal insider ownership is higher in countries with poorer institutions
to protect investors. At the extreme, if these institutions are extremely poor, there is no public
equity. 14 See Shleifer and Wolfenzon (2002) and Stulz (2005).
12
Good institutions make dispersed ownership feasible, but even with good institutions, there
will be firms with concentrated ownership. First, insiders may derive non-pecuniary private
benefits from controlling a large stake. For instance, by controlling a large corporation, they
might be able to play an important role in their country. Hence, good institutions are a necessary
but not sufficient condition for dispersed ownership. As Gilson (2006) discusses, the non-
pecuniary benefits of controlling a large corporation may be higher in smaller countries – there
are fewer such corporations in smaller countries. Similarly, Ehrhardt and Nowak (2003) find
evidence that control is valued more in firms located in small towns. Second, if institutions
improve so that more dispersed ownership is possible, the ability of insiders to sell shares
depends on the market for their shares. If the market for shares is illiquid, it will be expensive for
insiders to sell shares because the sales will have a substantial market impact. As Helwege,
Pirinsky and Stulz (2006) show for U.S. firms, insiders reduce their stake when the market for
their shares is liquid and when their shares have performed well.
3.2. Insiders and outside investors
We consider first the case where the world capital asset pricing model holds and insider
ownership affects expected cash flows but not covariances of cash flows with the world market
portfolio. In this case, if there are no barriers to international investment, the discount rate for
expected cash flows does not depend on the level of insider ownership or on the type of outside
shareholders the company attracts. Suppose now that the optimal insider ownership is α*. As
pointed out by Dahlquist, Pinkowitz, Stulz and Williamson (2003), it immediately follows that all
investors who are not insiders can only hold (1 – α*) of the firm. One would expect insiders to be
mostly residents of the country where the firm is located. Suppose the world is divided between
insiders, whose wealth is completely invested in the firm they own, and non-insiders, who invest
in securities. Foreign investors represent a fraction b of the non-insiders. In this case, foreign
investors own a fraction b(1 – α*) of the firm if they have no home bias. Consider a country
where insiders own 50% of the equity. Suppose that U.S. investors own equity wealth equal to
13
half the equity wealth of portfolio investors in the world, so that b = 0.5. In this case, U.S.
investors would own 0.5(1 – 0.5), or 25% of the equity of that country if no portfolio investors
have a home bias. The portfolio model discussed in the previous section would imply that if U.S.
investors own half of the world portfolio equity wealth, they should own half of the equity of that
country. If the country represents 1% of the world market portfolio and the equity market wealth
of countries is equal to their market capitalization, the portfolio model would predict that if
foreign investors have no home bias, they should own 99% of the equity of that country.
However, because of the optimal holdings of insiders, foreigners cannot own more than 50% of
the equity of the country.
We now turn to the case where the demand curve for shares is not perfectly elastic. In this
case, greater interest in shares of a company from foreign investors corresponds to a shift in the
demand curve and increases the stock price. The increase in the stock price can make it more
advantageous for insiders to sell shares. In addition to a shift in the demand curve, greater interest
from foreign investors can also increase the elasticity of the demand curve. As foreign investors
buy shares in a company for the first time, these shares contribute much less to the risk of their
portfolio than they would contribute to the risk of the portfolios of local investors who already
own shares of that company. Finally, greater participation of investors in the market for the
company’s stock would increase liquidity in the stock. With greater liquidity, insiders could sell
shares with less of a price impact. Hence, if changes in governance make it optimal for insiders to
decrease their stake, interest from foreign investors can make it easier for insiders to decrease
their holdings. It follows from this that if the demand curve for shares is not perfectly elastic, an
exogenous increase in interest in a company from foreign investors could lead to a decrease in
insider ownership. Such a decrease would not be possible if governance were sufficiently poor
that it would not support less concentrated ownership.
Could the factors that lead insiders to have high optimal holdings also lead to a home bias
among portfolio investors so that portfolio investors would overweight stocks from their home
14
country relative to the world float portfolio? Leuz, Lins, and Warnock (2006) show that U.S.
investors invest less in firms in which the controlling shareholder holds more control rights in
countries with poor disclosure. Giannetti and Simonov (2006) show that this result holds in
Sweden for foreign investors and small investors, but they argue that larger local shareholders
may be able to extract benefits from control and may be more protected from the consequences of
agency conflicts between controlling shareholders and minority shareholders, so that they have a
comparative advantage for investing in companies in which that conflict is more serious.
Everything else equal, we would expect control rights held by insiders to be higher in countries in
which private benefits are more valuable for the reasons already discussed. In an efficient market,
higher expected consumption of private benefits simply lowers firm value. As long as firm value
is properly discounted for the consumption of private benefits, the anticipated consumption of
private benefits should have no impact on the investment decision of portfolio investors. 15
Consequently, for private benefits to affect the investment decision of portfolio investors
differently, these investors have to have different information or opinions about the anticipated
consumption of private benefits and the implications of private benefits for the risk of firms. If
resident investors all have more precise information about private benefits, foreign investors will
be reluctant to trade with them since they would be at an information disadvantage. As a result, if
trade takes place, it will be at a price that protects foreign investors from being taken advantage
of. At that price, it may be too expensive for residents to trade with foreign investors. If only
some foreign investors have valuable information, then trade will take place as long as these
investors can hide their trades among liquidity traders.
Insider ownership has to be high when investor protection is poor. However, poor investor
protection increases the cost of participation for investors since firms are less transparent and
15 Giannetti and Koskinen (2005) construct a model in which wealthy investors bid up share prices in countries with poor investor protection because they can obtain benefits from control by holding a large stake in a corporation, so that small investors find equity investment less profitable because share prices are not fully discounted to reflect the consumption of private benefits by insiders.
15
investors must assess the consequences of poor investor protection. One would expect resident
investors to find it less costly to assess the consequences of poor investor protection in their
country than foreign investors. Resident investors receive valuable information in the normal
course of their activities that foreign investors would have to expend resources to gather. This
advantage of residents would be especially valuable in countries with poor investor protection
since these countries typically have poor disclosure and would enable them to forecast the
distribution of future cash flows more cheaply for a given level of accuracy. Further, controlling
shareholders face social and cultural constraints. Such constraints are much harder to understand
for foreign investors. Consequently, poor institutions increase participation costs for foreign
investors and create estimation risk for them. As a result, one would expect fewer foreigners to
invest in countries with poor institutions and these investors to hold fewer assets. Viewed from
this perspective, good governance reduces participation costs and estimation risk. These benefits
from good governance are more important for foreign investors than for domestic investors for
the simple reason that domestic investors already have some of the information that is produced
as a result of better governance.
The analysis so far has assumed that the optimal insider ownership does not depend on who
holds the shares not held by insiders. There is a literature that emphasizes the role of institutional
investors as monitors.16 With this literature, greater holdings by monitoring institutions would
lead to lower insider holdings since the monitoring by institutions would make it more costly for
insiders to extract private benefits of control. Though there are grounds to suspect that there is a
relationship between optimal insider ownership and the composition of outside investor
ownership, such a relationship would seem to be a second-order effect compared to the
determinants of insider ownership we have discussed.
16 For a survey, see Gillan and Starks (2003).
16
4. Financial globalization and the evolution of the upper bound on international risk
sharing through equity ownership
For investors to hold the world market portfolio, corporate ownership has to be highly
dispersed, so that all shares could potentially be acquired by foreign investors. In most countries,
however, insiders own large stakes in most corporations.17 If the benefits that insiders derive from
controlling the corporation are maximized when they own such stakes, they will not sell their
shares to foreign investors. Consequently, the shares held by insiders place an upper bound on the
share ownership by foreign investors. Though in many countries insiders control more votes than
cash flow rights, the cash flow rights held by insiders are relevant for evaluating the upper bound
on risk-sharing, since the risks of cash flows are shared.
We discussed in section 3 how insider ownership is determined. In this section, we examine
whether it evolved across countries from 1994 through 2004 in a way to make it possible for
foreign portfolio investors to hold much larger stakes in corporations. We report data for 1994,
2004, and the change from 1994 through 2004. The problem with estimating insider ownership is
that, in many countries, the reporting requirements are weak or non-existent. Further, the cash
flow rights of insiders result from their direct ownership of shares as well as from indirect
ownership. For instance, the controlling shareholder could own 40% of the shares of the firm
directly, but a different firm that he controls also could own 10% of the shares in addition. Direct
insider ownership can therefore understate the extent to which insiders own cash flow rights in
the firm if the 10% owned through a different firm are not taken into account. Various authors
have painstakingly identified the direct and indirect ownership of cash flows of controlling
shareholders for subsets of firms to estimate the ultimate ownership of these shareholders.18 In
this paper, because we focus on country aggregate insider ownership rather than firm-level
ownership, knowledge of the ultimate ownership of the controlling shareholders is not necessary
17 See La Porta, Lopez-de-Silanes and Shleifer (1999). 18 Claessens, Djankov, and Lang (2000), Faccio and Lang (2002), Lins (2003), and La Porta, Lopez-de-Silanes, Shleifer (1999).
17
to estimate the number of shares held by insiders as long as all shares held by insiders at the firm
level are taken into account.19 To obtain the country aggregate insider ownership, we aggregate
block holdings reported by Worldscope at the firm level and then compute a country insider
ownership measure from block holdings. We include only firms for which insider ownership is
available, does not exceed 100%, and is not equal to zero.
The Worldscope data has strengths and weaknesses. First, the approach we use makes it
feasible to estimate insider ownership for two different years for a large number of countries.
Though some papers have estimated insider ownership over time, they have done so for
individual countries.20 Here, we want to compare insider ownership in two different years across
a broad range of countries. Second, the approach of focusing on the controlling shareholder alone
assumes that blocks are independent from the controlling shareholder. This seems often unlikely.
Our approach may therefore capture better the shares that are part of a controlling coalition.
Third, we are not able to identify whether a block is aligned with the controlling shareholder or
not. Consequently, some of the blocks may not be part of the controlling coalition and we will
overstate the holdings of the controlling coalition. Fourth, some equity stakes that are indirect
equity stakes from the controlling shareholder or stakes from allies of the controlling shareholder
may be too small to be counted as blocks, so that we would understate the holdings of the
controlling coalition. Fifth, reporting requirements and the enforcement of reporting requirements
varies across the world. Sixth, Worldscope at times includes shares held by depository banks in
the insider category. This problem is more severe in 1994 than in 2004. Though we attempted to
correct for this problem, the correction is imperfect since shares held by these banks may actually
be held by insiders. Our results are not sensitive to this correction. Seventh, the firms included in
Worldscope vary over time. In particular the coverage of Worldscope has improved over time. It
19 We thank Daniel Wolfenzon for his insights on this issue. 20 See, for instance, Franks, Mayer and Rossi (2005).
18
is well-known that insider ownership is negatively related to the size of a firm.21 It could therefore
be that as firms are added to Worldscope average insider ownership increases because the new
firms are smaller. This would be less of a problem with a value-weighted measure of insider
ownership.
To check the Worldscope data, we compared insider ownership computed from Worldscope
with insider ownership computed from the Korean dataset we use in Section 6 of this paper for
2004. We find that our dataset has 571 observations with equally-weighted average insider
ownership of 39.38%. Worldscope has 564 observations with average insider ownership of
39.8%. We looked at a sample of individual firms. For some, the insider ownership data is exactly
the same in both databases. However, for others it is not. On average, though, the difference is
trivial. The problem with this comparison is that Korea has excellent insider ownership data, so
that the task of Worldscope is straightforward there. In another check, we estimated insider
ownership using the median of the year before, the year after, and the year considered (though we
did not have 2005 available for all firms). Doing so did not change our results meaningfully.
Table 1 reports insider ownership for 1994 and 2004 for 42 countries as well as the change in
insider ownership in these countries between 1994 and 2004. We use two separate measures of
insider ownership for each country. The first measure is the equally-weighted average of insider
ownership for the firms for which data is available. The second measure is the value-weighted
average of insider ownership. If we had insider ownership for all firms in a country, one minus
the value-weighted average of insider ownership would be the upper bound for foreign ownership
in that country if insiders are resident investors.
In 1994, the average of the equally-weighted averages of insider ownership across 42
countries is 49.0%. In contrast, the average of the value-weighted averages of insider ownership
is 43.4%. The distribution of the insider ownership measures across countries conforms to the
21 See, for instance, Demsetz and Lehn (1985).
19
results obtained in other studies.22 In particular, the U.S. has the lowest value-weighted insider
ownership at 12.5%. Further, as expected, the U.K. has a low value-weighted insider ownership.
Turkey has the highest value-weighted insider ownership at 72.5%. When we turn to 2004, we
find no evidence of a decrease in ownership concentration. The average of the equally-weighted
averages of insider ownership is 50.9% and the average of the value-weighted averages is 45.7%.
Argentina experiences a dramatic increase in ownership concentration over the period. However,
both measures of insider ownership are higher in 2004 than in 1994 even when we exclude
Argentina. In 2004 Ireland has the most diffuse ownership followed by the U.S. and the U.K., and
Argentina replaces Turkey as the country with the most concentrated ownership. The average
change in insider ownership is not significantly different from zero for either of our measures.
5. The evolution of the home bias of U.S. investors
To investigate the holdings of U.S. investors in foreign countries, we use surveys conducted
by the Treasury Department, the Federal Reserve Bank of New York, and the Federal Reserve
Board in 1994 and 2004.23 These so-called benchmark surveys provide the most reliable data on
the holdings of U.S. investors, the largest group of foreign investors in the world. We first
document holdings by U.S. investors across countries in 1994 and in 2004. We start from the 47
countries that have the highest market capitalization in 1997. Because the U.S. data reports
investments in Belgium and Luxembourg together for 1994, we combine these two countries for
2004 as well and have 46 countries.
Table 2 reports the weight of each of these 46 countries in the portfolio of stocks of U.S.
investors. The sum of the weights increases by 37.70% from 9.76% in 1994 to 13.44% to 2004.24
22 See La Porta, Lopez-de-Silanes and Shleifer (1999). 23 The holdings data are as of March 31, 1994 and December 31, 2004, as reported in Table 18 of Department of Treasury et al. (2005). For a primer on the surveys, see Griever, Lee and Warnock (2001). 24 In Table 2, the fraction of foreign stocks in the equity portfolio of U.S. investors increases from 10.25% to 15.27% when we consider all foreign countries. Consequently, it appears that the fraction of the portfolio of U.S. investors invested in countries other than the 46 we focus on increased from 0.48% to 1.83%.
20
With the portfolio model, the sum of the weights of these countries in the stock portfolio of U.S.
investors should be 62.30% in 1994 and 54.50% in 2004 in the absence of a home bias.25 A
simple way to evaluate the extent of the home bias for U.S. investors is to compute the ratio of
the portfolio weight of foreign countries in the portfolio of U.S. investors relative to the portfolio
weight of these countries in the world market portfolio. In 1994, the allocation to these 46
countries from U.S. investors represented 15.73% of what it would have been had they held the
world market portfolio. In 2004, that allocation was 24.59% of the portfolio share of these
countries in the world market portfolio. If the home bias is measured as one minus the decimal
value of that percentage, so that there is no home bias when investors hold the world market
portfolio, the home bias fell from 0.84 to 0.75 from 1994 to 2004, or by 10.71%.
If what happened over these 10 years had been a systematic reduction in the home bias across
countries, we should observe a reduction in the home bias measure for each country. Table 2
shows the home bias measures for each country in 1994 and 2004. It also shows the percentage
change in the home bias measure for each country. As illustrated in Figure 1, the home bias did
not decrease systematically across countries. Out of 46 countries with complete data, the home
bias increased for 19 countries and decreased for 27 countries. The home bias increased the most
for Argentina and fell the most for Korea. The average reduction in the home bias is 0.027 with a
However, this increase is misleading. It is almost entirely due to U.S. companies that re-incorporated or created special-purpose vehicles (or corporations) in tax havens. Indeed, the countries we include constitute 100% of U.S. holdings in countries other than Caribbean financial centers in 1994 and 99% in 2004. 25 We require market capitalization data expressed in U.S. dollars for year-ends of 1993 and 2004 as well as March 1994 and various months in 2004. For year-end data we rely on Standard & Poors (2005, 2003), which is the best source of year-end market capitalization expressed in U.S. dollars. For months that are not year-end, for emerging markets we use the Emerging Markets Database. For industrial countries and the rest of the world aggregate, market capitalizations for March 1994 are December 1993 amounts (from EMDB) plus country-specific MSCI price changes. For industrial countries for months in 2004 (explained below), data are from www.fibv.com. Exceptions are the following, for which December 2004 and MSCI price returns were used: France (no entry in FIBV), Netherlands (no entry in FIBV), and Singapore (for December 2004, FIBV data do not match S&P (2005) data). For Israel, as of December 2004 and March 1994 there were $9.2 billion and $1.9 billion, respectively, in Israeli stocks listed on Nasdaq but not the TASE. These are omitted from typical market capitalization data; we add them to the end-2004 and end-1994 amounts from Standard & Poors.
21
p-value of 0.155. Consequently, one cannot reject the hypothesis that there was no change in the
average home bias between 1994 and 2004.
The home bias measured using the aggregate portfolio share of the 46 countries in the
portfolio of stocks of U.S. investors fell much more than the average home bias – by more than
three times that amount, as it fell by 0.09 instead of 0.027. Such a result can only obtain if the
home bias fell more for countries that have larger weights in the world market portfolio. The
distribution of country portfolio shares in the world market portfolio is extremely skewed. Four
countries account for 59.58% of the market capitalization of the 46 countries for which we have
data. The home bias of U.S. investors decreased towards each of these four countries from 1994
to 2004.
In Table 3, for the 40 countries for which we have complete insider ownership and home bias
data for both 1994 and 2004, we report correlations for the variables we use in our regressions to
explain the change in the home bias from 1994 to 2004. We measure the home bias in two ways.
One way is the traditional approach of computing the world market portfolio including all
outstanding shares. The second way, which we call the float-adjusted home bias, uses the float-
adjusted world market portfolio to compute the home bias. The correlation between the changes
in the two measures is 0.72. The first column shows the correlations of the change in home bias
(measured the traditional way) with the variables of interest in our analysis. We see that the
change in the home bias is negatively correlated with the bias in 1994, which is consistent with a
catching up effect. Our next variable is the change in insider ownership. As expected, there is a
strong positive correlation between the change in insider ownership (∆io) and the change in the
home bias. Not surprisingly in light of the earlier results of Ahearne, Griever and Warnock
(2004), Edison and Warnock (2004), and Ammer, Holland, Smith and Warnock (2005), we find
that an increase in the fraction of a market’s capitalization that is available in the U.S. through a
cross-listing (∆xlist) is associated with a decrease in the home bias. We use next the Edison and
Warnock (2003) measure of the change of the fraction of a market’s capitalization unavailable for
22
investment by foreign investors (∆for). The change in the home bias does not have a significant
correlation with the change in that measure. We next examine whether changes in home bias are
related to changes in relative market capitalizations (∆wgtw). They are not. We then consider six
governance measures from Kaufmann, Kraay, and Mastruzzi (2005). A higher value for these
measures corresponds to a better governance outcome. We find that the home bias is significantly
negatively correlated with three measures: governance effectiveness (∆ge), regulatory quality
(∆rq), and rule of law (∆rl). The other three measures do not have a significant correlation with
the change in the home bias. Next, we use the Sarkissian and Schill (2004) measure of geographic
proximity. We find that it is not significantly related to the change in the home bias. Finally, if
foreign investors trade on momentum, their holdings would be heavily determined by recent
returns. Using the return for the three years ending in 2004 as a proxy for recent returns, the
market’s return does not have a significant correlation with the change in the home bias.
The float-adjusted measure of the change in the home bias has an insignificant correlation
with the change in insider ownership. This is consistent with the hypothesis that insider
ownership affects the home bias across countries primarily through its impact on the fraction of a
market’s capitalization available to foreign investors. We also see that the change in the float-
adjusted home bias is not significantly correlated with the change in governance measures, except
for the (marginally significant at the 10% level) negative correlation with government
effectiveness. In contrast, however, the correlation of the change in the float-adjusted home bias
with the change in the fraction of the stock market cross-listed is quite strong.
The correlation table shows that the change in the home bias is strongly negatively correlated
with the change in several governance variables and with the change in cross-listing, and is
positively correlated with the change in insider ownership. Following our discussion of Section 3,
we would expect improvements in governance to bring about a decrease in insider ownership, but
it could also be the case that increases in foreign interest led to decreases in insider ownership. To
disentangle these effects, we estimate regressions of the change in the home bias on the level of
23
the home bias in 1994, the level of insider ownership in 1994, the change in insider ownership,
and various other control variables. To account for the possible endogeneity of the change in
insider ownership, we report regressions where we instrument the change in insider ownership.
Our instrumental variables are the changes in the governance variables. 26 We estimate all
regressions twice. The first estimate of a regression uses the world market portfolio to calculate
the home bias, while the second estimate uses the float-adjusted world market portfolio. If insider
ownership plays a role only because it limits the shares available for investment for portfolio
investors, we would expect insider ownership not to be significant in regressions that use the
float-adjusted portfolio. In contrast, if insider ownership is significant for other reasons, perhaps
because it proxies for governance and governance affects foreign holdings directly, then we
would expect insider ownership to be significant in the regressions that use the float-adjusted
portfolio.
Regression (1) of Panel A in Table 4 shows that the change in the home bias is negatively
related to the home bias in 1994, positively related to the insider ownership in 1994 and
positively related to the change in insider ownership over the sample period. Regression (5) is the
same regression using the float-adjusted home bias. In that regression, neither of the insider
ownership variables is significant. This confirms the result we found with the correlation table,
namely that at the country level insider ownership affects the home bias through its impact on the
fraction of shares available for portfolio investment rather than for other reasons. In all the
regressions shown in Table 4 that use the conventional measure of the home bias, insider
ownership in 1994 and the change in insider ownership are significant. These results are
consistent with the prediction of the analysis of Section 3 that foreign equity portfolio investment
26 The governance variables are good instruments because they explain close to 40% of the variation in the change in insider ownership but are not correlated with changes in foreign ownership once we account for changes in insider ownership. We also estimated the regressions without instrumenting insider ownership. The qualitative results are the same.
24
is naturally limited by the extent of insider holdings.27 In contrast, the measures of insider
ownership are never significant in the regressions that use the float-adjusted home bias.
We investigate next whether the insider ownership variables are significant in the regressions
on the left-hand side of Table 4 because they proxy for omitted variables. First, we control for the
fraction of a market available in the U.S. through cross-listings on Nasdaq and NYSE in 1994 and
the change in that fraction. We see that these cross-listing variables remove the significance of the
bias in 1994, consistent with the evidence in Ahearne, Griever, and Warnock (2004), but they
have no impact on the insider ownership variables. Next, we add variables reflecting the extent to
which restrictions limited foreign ownership in a country in 1994 and how these restrictions
changed from 1994 to 2004. The restriction variables are not significant in regression (3), but
they are significant and positive when we use the float-adjusted measure of the home bias in
regression (7). Regressions (4) and (8) control for a country’s weight in the world market
portfolio in 1994 and the change in the weight. The change in the weight is marginally
significant, suggesting that, at least when controlling for initial bias levels and for insider
ownership, the bias increased against countries whose equity markets grew. Panel B report results
where we use the governance variables. The governance variables are not significant. Finally,
Panel C uses geographic proximity and our momentum variable. These variables are not
significant either.28
We find strong evidence that changes in the U.S. home bias towards a country are related to
the size of insider holdings in that country and to the change in these holdings. Insider holdings
could affect foreign ownership for two different reasons. In Section 3, they did so because they
limit the shares available for other investors. Alternatively, it could be that foreign investors value
the incentive effects of insider ownership. However, the latter explanation can be rejected
27 Argentina experienced a large increase in insider ownership in our dataset. We re-estimated our regressions without Argentina and found that our results hold. Our results hold also if we estimate our regressions without Japan and also without the U.K. 28 In unreported results, we also tried the Sarkissian and Schill (2004) measures of cultural, economic, and industrial proximity. None were significant.
25
because it would imply negative coefficients on the insider ownership variables in the float-
adjusted regressions. Further, we would then expect governance variables to be significant after
controlling for the insider ownership variables. They are not. Of course, as already discussed in
Section 3, equilibrium insider ownership depends on a country’s institutions. Consequently,
country governance variables do affect foreign ownership, but they do so through their impact on
equilibrium insider ownership. We investigate this relationship further in the next section, using
firm-level ownership data for foreign investors and corporate insiders in Korea.
6. Understanding the evolution of the home bias towards Korea
In this section, we first show how foreign ownership increased dramatically in Korea from
1996 to 2004. We then investigate how insider ownership and governance can explain the current
holdings of Korean shares by foreign investors. In the last part of the section, we show how
changes in insider ownership and other firm characteristics can help explain changes in foreign
ownership in Korea.
6.1. The growth in foreign ownership in Korea
Table 5 documents the evolution of foreign ownership in Korea from 1996 to 2004. We
obtain foreign ownership data from the FnGuide for the end of each year over the sample period.
The equally-weighted average of the ownership share of foreign investors in Korean firms starts
at 6.18% in 1996 and almost doubles to 11.25% by 2004. The problem with including all firms in
the average is that we include firms where foreigners have direct foreign investment stakes. For
instance, the Hankuk Shell Oil Company Ltd. has foreign ownership of 70.91%. However, most
of that ownership is in the form of foreign direct investment (FDI) by the corporate owner of the
company. To look more directly at portfolio ownership by foreign investors, we separate the
firms with FDI investment (the FDI firms in the following) from the other firms (the non-FDI
26
firms) using a list of firms that benefited from FDI.29 The list, which contains information about
the company name, foreign investor, foreign country, and first reporting date, enables us to divide
our sample firms into two groups: FDI firms and non FDI firms.30
As expected, foreign ownership is much higher on average in the FDI firms. Without the FDI
firms, the equally-weighted average of foreign ownership increases from 5.12% to 7.44%, or by
45.31%. Strikingly, the number of FDI firms increases by 64.51% from 1996 to 2004. Further,
the market capitalization of these firms relative to the market capitalization of the Korean stock
market increased from 11.6% to 31.8%. Consequently, the economic importance of firms with
FDI increased sharply.
We turn next to the value-weighted average of the investment shares of foreign investors in
Korean firms. The value-weighted average experiences a much more dramatic increase than the
equally-weighted average, tripling from 13.50% to 41.33%. The investment share of foreign
investors does not increase monotonically over time. There are large increases in 1998, 2000, and
2001. There is essentially no increase in 1997 and 1999, a trivial increase in 2004, and a drop in
2002. Limits on foreign investment were removed in 1998 for most companies. In 2000 and 2001,
limits on some privatized companies were increased substantially. The evidence seems to indicate
that limits were binding for some companies, so that the relaxation of the limits explains some of
the increase in foreign ownership. For instance, for Korea Telecom, the limit was 20% in 2000
and foreign ownership was 19.43%. The limit was increased to 49% in 2001 and foreign
ownership jumped that year to 37.22%. Further, the government sold its remaining stakes in some
of the privatized companies during that period of time.
29 The list is from the Ministry of Commerce, Industry and Energy, which administers the reporting requirement of a firm’s foreign investor pursuant to the Foreign Investment Promotion Act of September 16, 1998, which defines foreign direct investment in Korean firms. The main criterion for foreign direct investment is that it involves the purchase of stock for “the purpose of establishing a continuous relationship with and participating in the management of said Korean corporation or company”. 30 The list includes all firms that have a record as an FDI as of 2005 year-end, among which we identify 102 KSE listed-firms included in our sample as of 2004 year-end.
27
The difference between the value-weighted measure of foreign investment and the equally-
weighted measure indicates that foreign investors concentrate their holdings in large firms. Figure
2 demonstrate the concentration of foreign holdings in 2004. It turns out that foreign investment
in the five largest Korean firms with insider ownership below 20% represents 61.78% of the
foreign investment in the Korean firms in our sample including all firms traded on the main
exchange. Firms with insider ownership of less than 20% would meet the least restrictive
criterion used by LaPorta, Lopez-de-Silanes, and Shleifer (1999) to identify firms with dispersed
ownership. These five firms are Samsung Electronics, POSCO, Kookmin Bank, Korea Telecom
Corp., and SK Corporation. Two of these five firms are privatized firms.
6.2. Insider ownership, governance, and the home bias in Korea
We showed in Section 3 that 100% minus the percentage insider ownership constitutes an
upper bound for foreign ownership. Consequently, firms with small insider ownership are firms
in which foreign ownership can potentially be very large. We obtain insider ownership data from
the TS2000 database maintained by the Korea Listed Companies Association. Strikingly, for the
five firms discussed in the previous section, the average foreign ownership was 60.51% in 2004.
These firms had average insider ownership of 8.57%. Three of these firms had insider ownership
below 5%. A random sample of five large U.S. firms would most likely yield a group of firms
with similar insider ownership. In this section we explore more directly the role of insider
ownership and corporate governance as determinants of foreign ownership in 2004. We use all
firms with no FDI on the main exchange and use size as our only firm characteristic that is not
governance related.
With the Korean data, we can verify that 100% minus the percentage insider ownership is
indeed an upper bound for the fractional ownership of foreign portfolio investors. First, we
checked this for firms with no FDI. All Korean firms with no FDI have a fractional ownership by
foreign investors lower than this bound. Second, not surprisingly, there are some FDI firms where
foreign ownership is greater than 100% minus the percentage of insider ownership. There are 102
28
firms with FDI and 17 have foreign ownership in 2004 greater than 100% minus insider
ownership.
We investigate the relation between foreign portfolio investment in 2004 and its upper-bound
across firms. To do this, we regress the foreigners’ share of firm ownership on 100 - insider
ownership. 31 Institutional investors are typically reluctant to invest in small firms and most
foreign investors are institutional investors. We therefore estimate a regression with all non-FDI
firms and a regression with non-FDI firms with capitalization in excess of $100 million (large
firms in what follows). Table 6 shows the regression estimates. The coefficient on 100 - insider
ownership is positive and highly statistically significant in regressions (1) and (7). The economic
significance of the coefficients is also substantial. In regression (7), we find that across large
firms 10% more insider ownership is associated with 4.13% less foreign ownership.32
Regressions (2) and (8) use the direct ownership of the controlling shareholder as an
explanatory variable. We see that an increase in the direct ownership of the controlling
shareholder has a negative impact on foreign ownership. This is a striking result because it
suggests that the incentive effects of greater cash flow rights for the controlling shareholder have
at most a second-order effect for foreign investors. If these effects had a first-order effect, we
would expect direct ownership to have a positive coefficient.
We construct data on corporate governance rankings based on the surveys of corporate
governance practices conducted by the Korea Corporate Governance Service (KCGS) for the
years from 2002 to 2004.33 The annual survey contains over 100 questions divided into five
31 In contrast to the regressions in Section 5, we do not report results with insider ownership instrumented because there are no natural firm-level instruments available. 32 One could argue that our measure of the fraction of shares potentially available to foreign investors should take into account the shares held by the government and government-related entities. When we use the variable (100 – insiders – shares held by the government or government entities), the coefficient on that variable is 0.357 and significant. 33 The KCGS was established in June 2002 as an independent, nonprofit organization under the joint sponsorship of six member firms, including the Korea Stock Exchange and Kosdaq Stock Market. The KCGS performs annual surveys to award the top 10 best governed listed companies since Spring 2003, based on the criteria contained in the Code of Best Practice available at www.cgs.or.kr/eng/. The reliability of the responses is carefully verified by the KCGS with the evidence documentation provided by the responding firms. The response rate is very high: 426, 672, 528 KSE-listed firms for the years of 2002, 2003, and 2004, respectively.
29
categories: shareholder rights, board of directors, disclosure, audit system, and dividend
payments. For each of the questionnaires, different weights are assigned toward a total of 300
points by the KCGS. For the purpose of our analysis, we rank each firm based on its total scores
for each year, and scale the ranks by the number of responding firms to get percentage ranks
ranging from 0 to 100. Lower ranks imply better governance; if a firm is ranked 10, this means
that 90% of the Korean firms that responded to the survey have worse governance. The average
governance ranking of the five firms discussed earlier in this section is 2.20 in 2004, meaning that
97.80% of the firms with a governance ranking had worse governance than (the average of) these
five firms. Across all firms, we find in regressions (3) and (9) of Table 6 that better governance is
associated with greater foreign ownership. The coefficient on the corporate governance ranking is
negative and significant in both. For large firms, an increase in a firm’s governance ranking from
the 50th percentile to the top of the ranking would increase foreign ownership by 15.65%.
In Korea, all shares of common stock have the same voting rights. Consequently, for the
controlling shareholder of a firm to own more control rights than cash flow rights, he has to own
stakes in other affiliated firms that own shares in the firm considered. Ownership parity,
introduced by Black, Jang, and Kim (2005), measures the extent to which the controlling
shareholder exerts his control through related parties. It is defined as 100 – (Insider ownership –
Largest shareholder direct ownership). If the ownership parity is 100, there are no related parties,
so that the controlling shareholder owns the shares through which he exerts control. If the
controlling shareholder were to own less shares, ownership parity would be less than 100 and
would fall as the related parties held more shares. An increase in ownership parity is expected to
reduce the controlling shareholder agency costs. In regressions (4) and (10), we regress foreign
ownership on the ownership parity. Though the coefficient on ownership parity is positive, it is
significant only when we use the whole sample.
30
It is well-known from the literature that foreign investors overweight large firms. 34
Regressions (5) and (11) verify this. Not only is the coefficient on size highly significant, the R-
square of these regressions is extremely high. In Korea, large firms are subject to a higher
standard for many governance attributes—for instance, firms with assets above 2 trillion Kwon
have to have at least 50% of outside directors—which creates a substantial negative correlation
between size and the governance index. 35 Consequently, we have to check whether the
governance index is significant because of size being an omitted variable.
In regressions (6) and (12), we regress foreign ownership on the logarithm of the firm’s total
capitalization, 100 – insider ownership, ownership parity, and the governance rating. All the
variables are statistically significant in both regressions. The economic significance of the
variable 100 – insider ownership is still large: for large firms, a decrease in insider holdings from
the median (38%) to the smallest amount (3.6%) would translate into an increase in foreign
ownership of 11.39%. An increase in the corporate governance ranking from the median to the
highest score would increase foreign ownership by 6.4%. The coefficient on ownership parity is
negative in these regressions. Note, however, that insider ownership enters twice in this
regression because it is used in the definition of ownership parity, rendering the interpretation of
the coefficient on ownership parity more difficult. Specifically, we can rewrite the regression so
that ownership parity has a positive coefficient of 0.102 and sole ownership has a negative
coefficient of -0.170.36 Consequently, with this rewriting, there is a positive relation between
34 See Kang and Stulz (1997), Dahlquist and Robertsson (2001), Ammer, Holland, Smith, and Warnock (2005), and Leuz, Lins, and Warnock (2006). 35 See Black, Jang, and Kim (2005) and Nam (2004). The correlation between size and governance ranking in our full sample is -0.460. 36 Let IO be insider ownership, OwnPar be ownership parity, and Sole be the ownership of the controlling shareholder. Including both (100-IO) and OwnPar (=100-IO+Sole) in column (6) of Table 6, we estimate coefficients of +.170 and -0.068, respectively. Thus, we get 0.170*(100 – IO) - 0.068*(100 – IO + Sole), which can be rewritten as 0.102*OwnPar - 0.170*Sole.
31
foreign ownership and ownership parity. With either interpretation, greater insider ownership is
associated with lower foreign ownership.
6.3. The evolution of the home bias in Korea
We now investigate in Table 7 whether changes in insider ownership and other firm
characteristics can help explain the change in the home bias in Korea. We first estimate
regressions similar to those of Table 6 for every year in our sample. We add two firm
characteristics that have been shown to help explain foreign ownership, namely Tobin’s q and the
ratio of cash flow to assets (see Kang and Stulz (1997) and Dahlquist and Robertsson (2001)). We
see that every year after 1998 100 - insider ownership has a positive significant coefficient.
Before the end of 1998, foreigners still faced restrictions in investing in the typical firm. Not
surprisingly, size has a positive significant coefficient. Tobin’s q and cash flow have positive
coefficients, but they are not always significant. The coefficient on ownership parity is negative
when it is significant; in these cases, if we included sole ownership instead of 100 - insider
ownership, the coefficient on ownership parity would be positive and significant. For the last
three years, we add the governance index to the regressions. The index is not significant in 2002,
but it is significantly negative in 2003 and 2004. This evidence indicates that firm-level
governance is related to foreign ownership. This result is related to the evidence in Leuz, Lins and
Warnock (2006) that foreign investors invest less in firms where the agency conflict between the
controlling shareholder and minority investors is stronger when these firms are located in
countries with poor disclosure. In their paper, they use a proxy for the intensity of the agency
conflict that is related to ownership parity in this paper.37 Our evidence shows that more nuanced
measures of governance could uncover a relation between governance and foreign ownership in
countries with relatively good disclosure and governance institutions. Finally, it is useful to note
37 See also Dahlquist, Pinkowitz, Stulz and Williamson (2003) and Gianetti and Simonov (2006) for evidence on Sweden showing that foreign investors invest less in firms where the difference between the voting rights and cash flow rights held by the controlling shareholder is greater.
32
that the yearly regressions explain a substantial fraction of the variation in foreign ownership
across firms. The highest adjusted R2 is 0.601 for 2004.
We then estimate fixed-effect panel regressions that also include a full set of year dummies.
These fixed effects should capture unobserved firm heterogeneity and therefore help with
potential endogeneity problems (see Himmelberg, Hubbard and Palia (1999)). We estimate these
regressions using the sample from 1998 to 2004. We see that 100 - insider ownership has a
significant positive coefficient. As in Table 6, we also use a sample of large firms. The coefficient
on 100 - insider ownership is larger in absolute value for these firms.
The last two regressions in Table 7 parallel the U.S. regressions in Table 4. We regress the
change in foreign ownership from 1998 to 2004 on changes in firm characteristics as well as the
initial (1998) values of each firm characteristic and foreign ownership. The change in 100 -
insider ownership has a significant positive coefficient. The coefficient is strikingly large for the
large firms. For these firms, a decrease in insider ownership of 10% corresponds to an increase in
foreign ownership of 4.58%. We show in the last two columns only the estimates for the changes
variables. Similar to the U.S. results in Table 4, taking into account the coefficients on initial
values (not shown), these regressions indicate that over this period foreign ownership increased in
firms that had less insider ownership in 1998 and that reduced insider ownership between 1998
and 2004. The evidence we find at the firm level for Korea is therefore wholly consistent with the
evidence we find using data on U.S. investors’ foreign equity holdings.
7. Conclusion
In this paper, we investigate the evolution of the home bias in the age of financial
globalization. We document that the average bias of U.S. investors towards the countries that
have the largest capital markets in the world did not fall significantly from 1994 to 2004.
However, if the home bias is estimated from aggregate data of U.S. investment to the rest of the
world, the home bias fell. The explanation for these findings is that foreign investment in a
33
country depends crucially on the extent to which the institutions of that country support diffuse
ownership of corporations. If the institutions of a country are extremely poor, a country has no
publicly traded equity and there will be no foreign portfolio equity investment. In most countries,
insider ownership is concentrated because the institutions of the country do not support diffuse
ownership. This insider ownership concentration is an obstacle to international risk-sharing. We
develop a theory of the home bias based on the existence of an optimal level of insider ownership
that differs across countries and call it the optimal insider ownership theory of the home bias. We
show that the home bias towards many countries could fall substantially only if the optimal
insider ownership level of these countries were to fall substantially. The road towards greater
risk-sharing therefore goes through an improvement in institutions that make diffuse ownership of
firms possible in the countries where it is not. We provide evidence at the firm level for Korea
showing that foreign investors invest more in firms with lower insider ownership and better
governance. The experience of the large Korean firms with diffuse ownership shows that when
such firms exist, foreign portfolio investors can end up owning a majority of the firms’ shares.
34
Bibliography
Adler, M. and B. Dumas, 1983, International portfolio choice and corporation finance: A
synthesis, Journal of Finance 38, 925-984. Ahearne, A. G., W. L. Griever, and F. E. Warnock, 2004, Information costs and home bias: An
analysis of U.S. holdings of foreign equities, Journal of International Economics 62, 313-336. Ammer, J., S. Holland, D. Smith, and F. E. Warnock, 2005, Look at Me Now: The Role of Cross-
Listings in Attracting U.S. Shareholders, working paper, Board of Governors of the Federal Reserve System.
Baxter, M. and U. J. Jermann, 1997, The international diversification puzzle is worse than you
think, American Economic Review 87, 170-180. Bekaert, G. and C. R. Harvey, 1995, Time-varying world market integration, Journal of Finance
50, 403-444. Bekaert, G., and C.R. Harvey, 2000, Foreign speculators and emerging equity markets, Journal of
Finance 55, 565-613. Black, F., 1974, International capital market equilibrium with investment barriers, Journal of
Financial Economics 1, 337-352. Black, B., H. Jang, and W. Kim, 2005, Predicting firms’ corporate governance choices: Evidence
from Korea, Journal of Corporate Finance, forthcoming. Burger, J. D., and F. E. Warnock, 2004, Foreign Participation in Local Currency Bond Markets,
International Finance Discussion Papers, Board of Governors of the Federal Reserve System, No. 794, Washington, D.C.
Claessens, S., S. Djankov, and L.H.P. Lang, 2000, The separation of ownership and control in
east Asian corporations, Journal of Financial Economics 58, 81-112. Cooper, I. A., and E. Kaplanis, 1994, Home bias in equity portfolios, inflation hedging and
international capital market equilibrium, Review of Financial Studies 7, p. 45-60. Dahlquist, M., L. Pinkowitz, R. M. Stulz, and R. Williamson, 2003, Corporate governance and
the home bias, Journal of Financial and Quantitative Analysis 38, 87-110. Dahlquist, M., and G. Robertsson, 2001, Direct foreign ownership, institutional investors, and
firm characteristics, Journal of Financial Economics 59, 413-440. Demsetz, H., and K. Lehn, 1985, The structure of corporate ownership: Cause and consequences,
Journal of Political Economy 93, 1155-1177. Department of Treasury, Federal Reserve Bank of New York, and Board of Governors of the
Federal Reserve System, 2005. Report on U.S. Portfolio Holdings of Foreign Equities as of December 31, 2004.
35
Edison, H. J., and F. E. Warnock, 2003, A simple measure of the intensity of capital controls, Journal of Empirical Finance 10, 81-103.
Edison, H. J., and F. E. Warnock, 2004, U.S. investors’ emerging market equity portfolios: A
security-level analysis, The Review of Economics and Statistics 86, 691-704. Ehrhardt, O., and E. Nowak, 2003, Private benefits and minority shareholder expropriation,
working paper, University of Southern Switzerland, Lugano, Switzerland. Engel, C., and A. Matsumoto, 2006, Portfolio choice in a monetary open-economy DSGE model,
NBER working paper no. 12214, NBER, Cambridge, MA. Errunza, V. and E. Losq, 1985, International asset pricing under mild segmentation: Theory and
test, Journal of Finance 40, 105-124. Faccio, M., and L. Lang, 2002, The ultimate ownership of western European corporations,
Journal of Financial Economics 65, 365-395. Franks, J., C. Mayer, and S. Rossi, 2004, Ownership: Evolution and Regulation, Unpublished
paper, London Business School. Friedman, T. L., 2005, The World is Flat, Farrar, Strauss, and Giroux. Froot, K. A., and T. Ramadorai, 2001, The information content of international portfolio flows,
NBER working paper no. 8472. Gehrig, T., 1993, An information based explanation of domestic bias in international equity
investment, Scandinavian Journal of Economics 95, 97-109. Giannetti, M., and A. Simonov, 2006, Which investors fear expropriation? Evidence from
portfolio choices, Journal of Finance, forthcoming. Giannetti, M., and Y. Koskinen, 2005, Investor protection and the demand for equity,
unpublished working paper, Stockholm School of Economics, Stockholm, Sweden. Gillan, S. L., and L. T. Starks, 2003, Corporate governance, corporate ownership, and the role of
institutional investors: A global perspective, unpublished working paper, University of Texas, Austin, TX.
Gilson, R. J., 2006, Controlling shareholders and corporate governance: Complicating the
comparative taxonomy, Harvard Law Review 119, 1641-1679. Graham, J. R., C. R. Harvey, and H. Huang, 2005, Investor competence, trading frequency, and
home bias, unpublished working paper. Griever, W. L., G. A. Lee, and F. E. Warnock, 2001, The U.S. system for measuring cross-border
investment in securities: A primer with a discussion of recent developments, Federal Reserve Bulletin 87(10), 633-650.
36
Grinblatt, M., and M. Keloharju, 2000, The investment behavior and performance of various investor types: A study of Finland’s unique data set, Journal of Financial Economics 55, 43-67.
Helwege, J., C. Pirinsky, and R. M. Stulz, 2006, Why do firms become widely-held? An analysis
of the dynamics of corporate ownership, Journal of Finance, forthcoming. Henry, P. B., 2000, Stock market liberalization, economic reform and emerging market equity
prices, Journal of Finance 55, 529-564. Himmelberg, C. P. R., G. Hubbard and D. Palia, 1999, Understanding the determinants of
managerial ownership and the link between ownership and performance, Journal of Financial Economics 53, 353-384
Jensen, M. C., and W. H. Meckling, 1976, Theory of the firm: Managerial behavior, agency costs
and ownership structure, Journal of Financial Economics 3, 305-360. Jeske, K., 2001, Equity home bias: Can information cost explain the puzzle?, Federal Reserve
Bank of Atlanta Economic Review (Third quarter), 31-42. Johnson, S., R. La Porta, F. Lopez-de-Silanes and A. Shleifer, 2000, Tunneling, American
Economic Review 90, 22-27. Kang, J. and R. M. Stulz, 1997, Why is there a home bias? An analysis of foreign portfolio equity
ownership in Japan, Journal of Financial Economics 46, 3-28.
Karolyi, A. and R. Stulz, 2003, Are assets priced locally or globally?, in G. Constantinides, M. Harris and R. Stulz, eds.: The Handbook of the Economics of Finance, North-Holland Publishers, New York, NY.
Kaufmann, D., A. Kraay, and M. Mastruzzi, 2005, Governance matters IV: Governance indicators for 1996-2004, World Bank, Washington, D.C.
Kilka, M., and M. Weber, 2000, Home bias in international stock return expectations, Journal of
Psychology and Financial Markets 1, 176-193. Kim, E. H., and V. Singal, 2000, Stock markets openings: Experience of emerging economies,
Journal of Business 73, 25-66. La Porta, R., F. Lopez-de-Silanes, A. Shleifer, 1999, Corporate ownership around the world, Journal
of Finance 54, 471-517. Leland, H. E., and D. H. Pyle, 1977, Informational asymmetries, financial structure, and financial
intermediation, Journal of Finance 32, 371-387. Leuz, C., K. V. Lins, and F. E. Warnock, 2006, Do foreigners invest less in poorly governed
firms?, NBER working paper no. 12222, NBER, Cambridge, MA. Levine, R., and S. Zervos, 1998, Capital control liberalization and stock market development,
World Development.
37
Lewis, K. K., 1999, Trying to explain home bias in equities and consumption, Journal of Economic Literature 37, 571-608.
Lins, K., 2003, Equity ownership and firm value in emerging markets, Journal of Financial and
Quantitative Analysis, 38, 159-184. Lucas, R. E. Jr., 1990, Why doesn’t capital flow from rich to poor countries?, American
Economic Review 80, 92-96.
Nam, I. C., 2004, Corporate governance in the Republic of Korea and its implications for firm performance, working paper, Asian Development Bank Institute.
Pesenti, P., and E. Van Wincoop, 2002, Can nontradables generate substantial home bias?,
Journal of Money, Credit, and Banking 34, 26-50. Sarkissian, S., and M. Schill, 2004, The overseas listing decision: New evidence of proximity
preference, Review of Financial Studies 17, 769-810. Seasholes, M. S., 2000, Smart foreign traders in emerging markets, Working paper, University of
California at Berkeley. Shiller, R.J., Kon-Ya, F., and Y. TsuTsui, 1996, Why did the Nikkei crash? Expanding the scope
of expectations data collection, Review of Economic and Statistics 78, 156-164. Shleifer, A., and D. Wolfenzon, 2002, Investor protection and equity markets, Journal of
Financial Economics 66, 3-27. Solnik, B., 1974, An equilibrium model of the international capital market, Journal of Economic
Theory 8, 500-524. Solnik, B., 2005, Equity home bias and regret: An equilibrium model, unpublished working
paper. Standard and Poors, 2003. Global Stock Markets Factbook. Standard and Poors, 2005. Global Stock Markets Factbook. Statman, M., 1999, Foreign stocks in behavioral portfolios, Financial Analysts Journal
(March/April), 12-16. Strong, N.C., and X. Xu, 2003, Understanding the equity home bias: evidence from survey data,
Review of Economics and Statistics 85, 307–312. Stulz, R. M., 1981a, On effects of barriers to international investment, Journal of Finance 36,
923-934. Stulz, R. M., 1981b, A model of international asset pricing, Journal of Financial Economics 9,
383-406. Stulz, R. M., 2005, The limits of financial globalization, Journal of Finance 60, 1595-1638.
38
Thomas, C. P., F. E. Warnock, and J. Wongswan, 2006, The performance of international equity portfolios, NBER working paper no. 12346, NBER, Cambridge, MA.
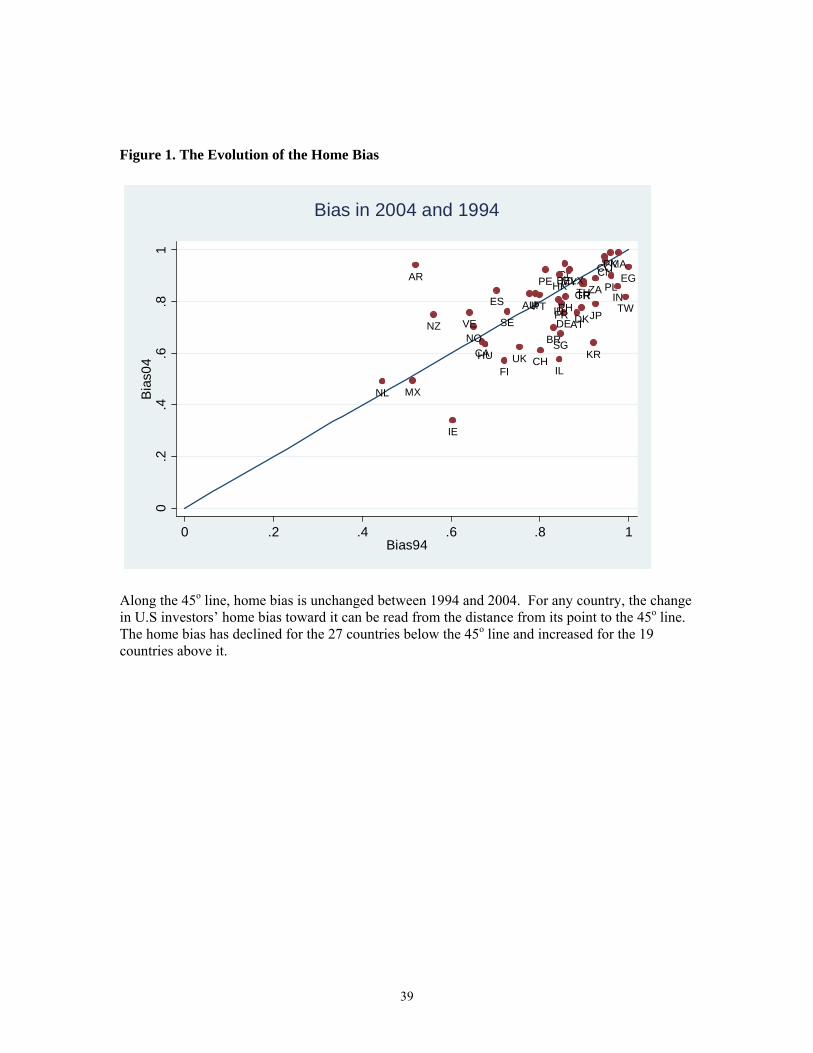
39
Figure 1. The Evolution of the Home Bias
AR
AT
AU
BRCA
CH
CL CNCO
DE DK
EG
ES
FI
FR
UK
GRHK
HU
ID
IE
IL
INIT
JP
KR
MA
MX
MY
NL
NONZ
PE
PH
PK
PL
PTSE
SG
THTRTW
VE
ZABELX
0.2
.4.6
.81
Bia
s04
0 .2 .4 .6 .8 1Bias94
Bias in 2004 and 1994
Along the 45o line, home bias is unchanged between 1994 and 2004. For any country, the change in U.S investors’ home bias toward it can be read from the distance from its point to the 45o line. The home bias has declined for the 27 countries below the 45o line and increased for the 19 countries above it.
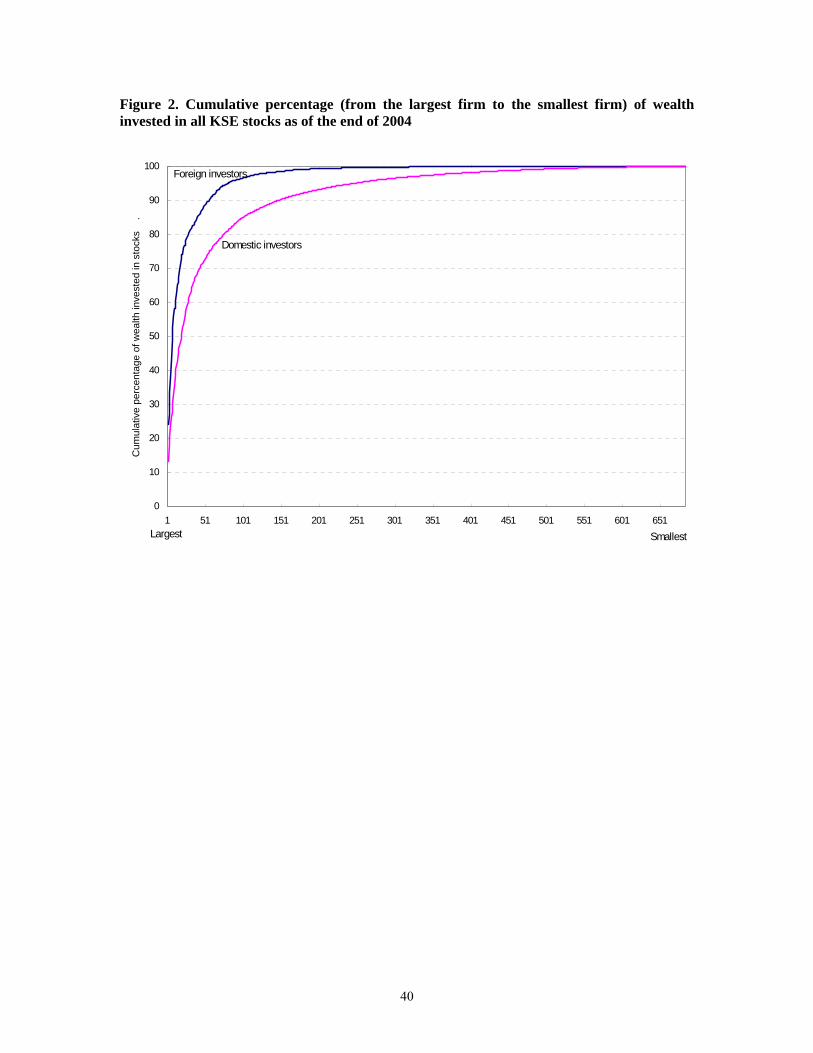
40
Figure 2. Cumulative percentage (from the largest firm to the smallest firm) of wealth invested in all KSE stocks as of the end of 2004
0
10
20
30
40
50
60
70
80
90
100
1 51 101 151 201 251 301 351 401 451 501 551 601 651
Cum
ulat
ive
perc
enta
ge o
f wea
lth in
vest
ed in
sto
cks
.
Domestic investors
Foreign investors
Largest Smallest
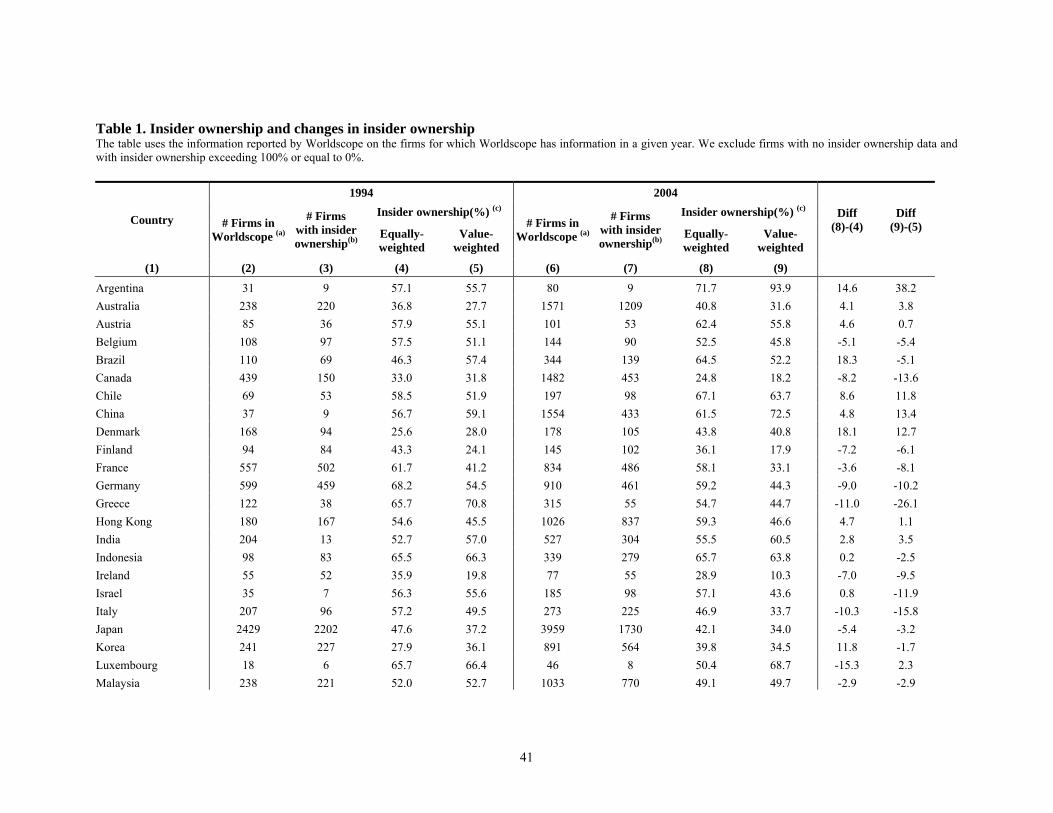
41
Table 1. Insider ownership and changes in insider ownership The table uses the information reported by Worldscope on the firms for which Worldscope has information in a given year. We exclude firms with no insider ownership data and with insider ownership exceeding 100% or equal to 0%.
1994 2004 Insider ownership(%) (c) Insider ownership(%) (c)
Country # Firms in Worldscope (a)
# Firms with insider ownership(b)
Equally-weighted
Value-weighted
# Firms in Worldscope (a)
# Firms with insider ownership(b)
Equally-weighted
Value-weighted
Diff (8)-(4)
Diff (9)-(5)
(1) (2) (3) (4) (5) (6) (7) (8) (9)
Argentina 31 9 57.1 55.7 80 9 71.7 93.9 14.6 38.2 Australia 238 220 36.8 27.7 1571 1209 40.8 31.6 4.1 3.8 Austria 85 36 57.9 55.1 101 53 62.4 55.8 4.6 0.7 Belgium 108 97 57.5 51.1 144 90 52.5 45.8 -5.1 -5.4 Brazil 110 69 46.3 57.4 344 139 64.5 52.2 18.3 -5.1 Canada 439 150 33.0 31.8 1482 453 24.8 18.2 -8.2 -13.6 Chile 69 53 58.5 51.9 197 98 67.1 63.7 8.6 11.8 China 37 9 56.7 59.1 1554 433 61.5 72.5 4.8 13.4 Denmark 168 94 25.6 28.0 178 105 43.8 40.8 18.1 12.7 Finland 94 84 43.3 24.1 145 102 36.1 17.9 -7.2 -6.1 France 557 502 61.7 41.2 834 486 58.1 33.1 -3.6 -8.1 Germany 599 459 68.2 54.5 910 461 59.2 44.3 -9.0 -10.2 Greece 122 38 65.7 70.8 315 55 54.7 44.7 -11.0 -26.1 Hong Kong 180 167 54.6 45.5 1026 837 59.3 46.6 4.7 1.1 India 204 13 52.7 57.0 527 304 55.5 60.5 2.8 3.5 Indonesia 98 83 65.5 66.3 339 279 65.7 63.8 0.2 -2.5 Ireland 55 52 35.9 19.8 77 55 28.9 10.3 -7.0 -9.5 Israel 35 7 56.3 55.6 185 98 57.1 43.6 0.8 -11.9 Italy 207 96 57.2 49.5 273 225 46.9 33.7 -10.3 -15.8 Japan 2429 2202 47.6 37.2 3959 1730 42.1 34.0 -5.4 -3.2 Korea 241 227 27.9 36.1 891 564 39.8 34.5 11.8 -1.7 Luxembourg 18 6 65.7 66.4 46 8 50.4 68.7 -15.3 2.3 Malaysia 238 221 52.0 52.7 1033 770 49.1 49.7 -2.9 -2.9
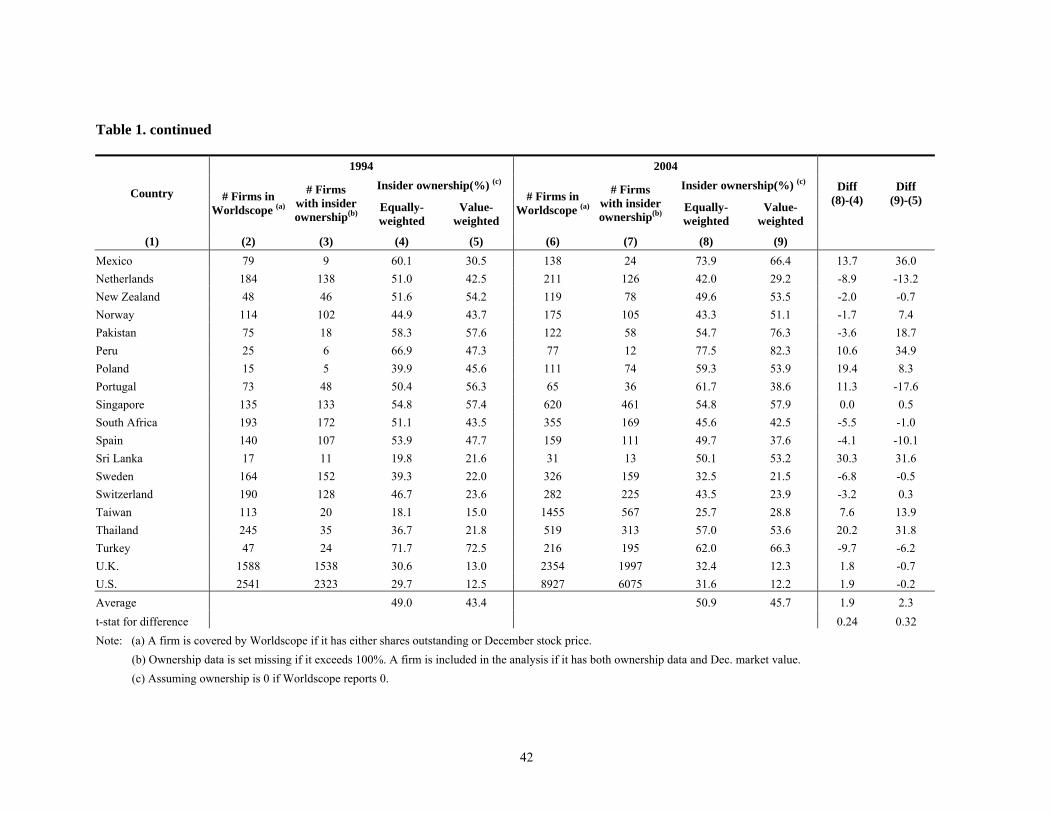
42
Table 1. continued
1994 2004 Insider ownership(%) (c) Insider ownership(%) (c)
Country # Firms in Worldscope (a)
# Firms with insider ownership(b)
Equally-weighted
Value-weighted
# Firms in Worldscope (a)
# Firms with insider ownership(b)
Equally-weighted
Value-weighted
Diff (8)-(4)
Diff (9)-(5)
(1) (2) (3) (4) (5) (6) (7) (8) (9) Mexico 79 9 60.1 30.5 138 24 73.9 66.4 13.7 36.0 Netherlands 184 138 51.0 42.5 211 126 42.0 29.2 -8.9 -13.2 New Zealand 48 46 51.6 54.2 119 78 49.6 53.5 -2.0 -0.7 Norway 114 102 44.9 43.7 175 105 43.3 51.1 -1.7 7.4 Pakistan 75 18 58.3 57.6 122 58 54.7 76.3 -3.6 18.7 Peru 25 6 66.9 47.3 77 12 77.5 82.3 10.6 34.9 Poland 15 5 39.9 45.6 111 74 59.3 53.9 19.4 8.3 Portugal 73 48 50.4 56.3 65 36 61.7 38.6 11.3 -17.6 Singapore 135 133 54.8 57.4 620 461 54.8 57.9 0.0 0.5 South Africa 193 172 51.1 43.5 355 169 45.6 42.5 -5.5 -1.0 Spain 140 107 53.9 47.7 159 111 49.7 37.6 -4.1 -10.1 Sri Lanka 17 11 19.8 21.6 31 13 50.1 53.2 30.3 31.6 Sweden 164 152 39.3 22.0 326 159 32.5 21.5 -6.8 -0.5 Switzerland 190 128 46.7 23.6 282 225 43.5 23.9 -3.2 0.3 Taiwan 113 20 18.1 15.0 1455 567 25.7 28.8 7.6 13.9 Thailand 245 35 36.7 21.8 519 313 57.0 53.6 20.2 31.8 Turkey 47 24 71.7 72.5 216 195 62.0 66.3 -9.7 -6.2 U.K. 1588 1538 30.6 13.0 2354 1997 32.4 12.3 1.8 -0.7 U.S. 2541 2323 29.7 12.5 8927 6075 31.6 12.2 1.9 -0.2 Average 49.0 43.4 50.9 45.7 1.9 2.3 t-stat for difference 0.24 0.32 Note: (a) A firm is covered by Worldscope if it has either shares outstanding or December stock price. (b) Ownership data is set missing if it exceeds 100%. A firm is included in the analysis if it has both ownership data and Dec. market value. (c) Assuming ownership is 0 if Worldscope reports 0.
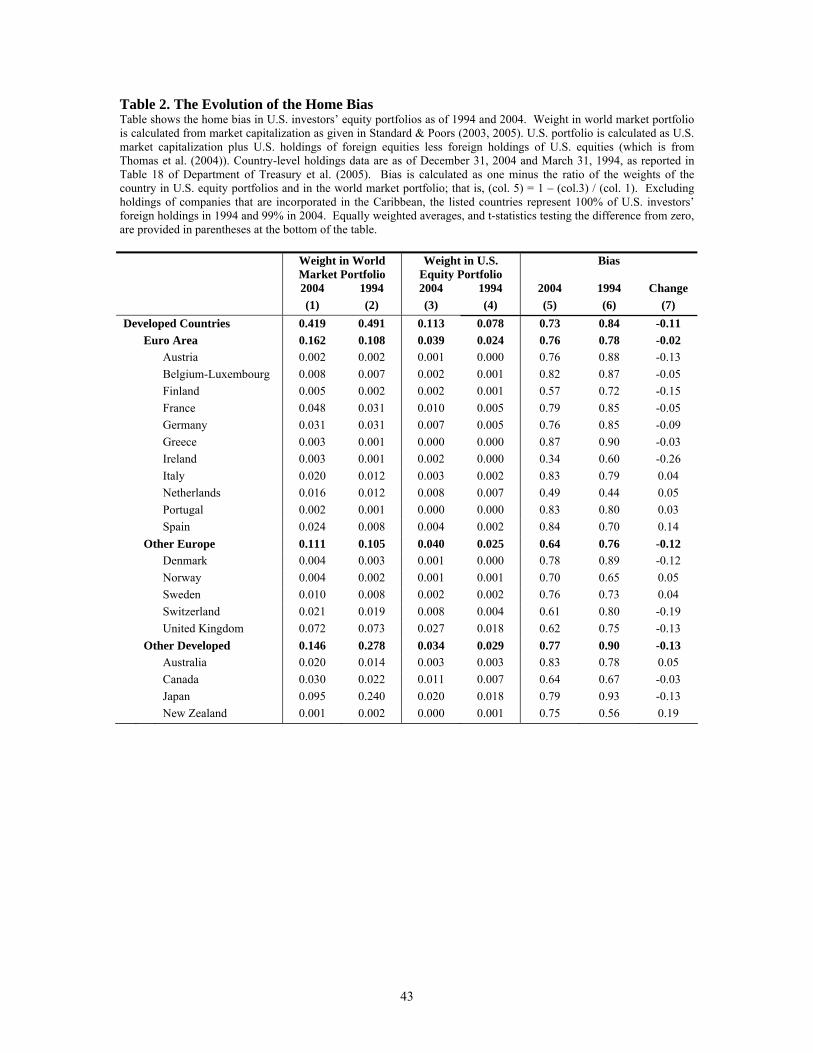
43
Table 2. The Evolution of the Home Bias Table shows the home bias in U.S. investors’ equity portfolios as of 1994 and 2004. Weight in world market portfolio is calculated from market capitalization as given in Standard & Poors (2003, 2005). U.S. portfolio is calculated as U.S. market capitalization plus U.S. holdings of foreign equities less foreign holdings of U.S. equities (which is from Thomas et al. (2004)). Country-level holdings data are as of December 31, 2004 and March 31, 1994, as reported in Table 18 of Department of Treasury et al. (2005). Bias is calculated as one minus the ratio of the weights of the country in U.S. equity portfolios and in the world market portfolio; that is, (col. 5) = 1 – (col.3) / (col. 1). Excluding holdings of companies that are incorporated in the Caribbean, the listed countries represent 100% of U.S. investors’ foreign holdings in 1994 and 99% in 2004. Equally weighted averages, and t-statistics testing the difference from zero, are provided in parentheses at the bottom of the table. Weight in World
Market Portfolio Weight in U.S.
Equity Portfolio Bias
2004 1994 2004 1994 2004 1994 Change (1) (2) (3) (4) (5) (6) (7) Developed Countries 0.419 0.491 0.113 0.078 0.73 0.84 -0.11 Euro Area 0.162 0.108 0.039 0.024 0.76 0.78 -0.02 Austria 0.002 0.002 0.001 0.000 0.76 0.88 -0.13 Belgium-Luxembourg 0.008 0.007 0.002 0.001 0.82 0.87 -0.05 Finland 0.005 0.002 0.002 0.001 0.57 0.72 -0.15 France 0.048 0.031 0.010 0.005 0.79 0.85 -0.05 Germany 0.031 0.031 0.007 0.005 0.76 0.85 -0.09 Greece 0.003 0.001 0.000 0.000 0.87 0.90 -0.03 Ireland 0.003 0.001 0.002 0.000 0.34 0.60 -0.26 Italy 0.020 0.012 0.003 0.002 0.83 0.79 0.04 Netherlands 0.016 0.012 0.008 0.007 0.49 0.44 0.05 Portugal 0.002 0.001 0.000 0.000 0.83 0.80 0.03 Spain 0.024 0.008 0.004 0.002 0.84 0.70 0.14 Other Europe 0.111 0.105 0.040 0.025 0.64 0.76 -0.12 Denmark 0.004 0.003 0.001 0.000 0.78 0.89 -0.12 Norway 0.004 0.002 0.001 0.001 0.70 0.65 0.05 Sweden 0.010 0.008 0.002 0.002 0.76 0.73 0.04 Switzerland 0.021 0.019 0.008 0.004 0.61 0.80 -0.19 United Kingdom 0.072 0.073 0.027 0.018 0.62 0.75 -0.13 Other Developed 0.146 0.278 0.034 0.029 0.77 0.90 -0.13 Australia 0.020 0.014 0.003 0.003 0.83 0.78 0.05 Canada 0.030 0.022 0.011 0.007 0.64 0.67 -0.03 Japan 0.095 0.240 0.020 0.018 0.79 0.93 -0.13 New Zealand 0.001 0.002 0.000 0.001 0.75 0.56 0.19
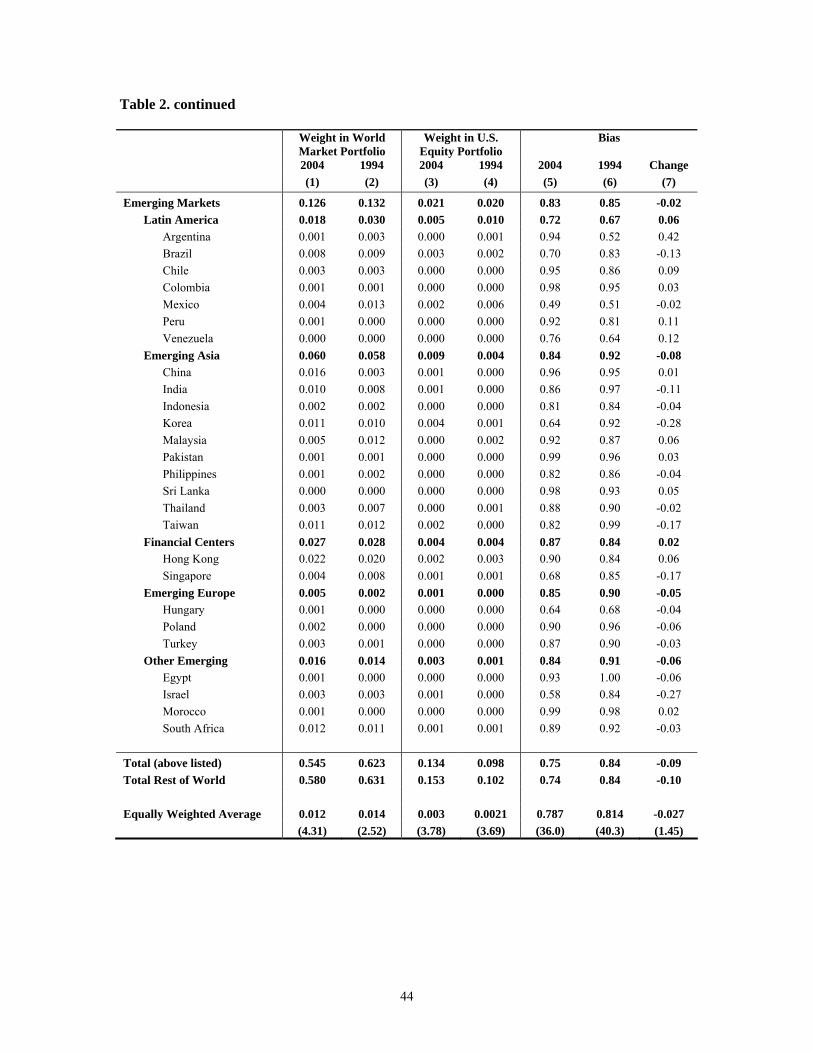
44
Table 2. continued
Weight in World Market Portfolio
Weight in U.S. Equity Portfolio
Bias
2004 1994 2004 1994 2004 1994 Change
(1) (2) (3) (4) (5) (6) (7)
Emerging Markets 0.126 0.132 0.021 0.020 0.83 0.85 -0.02 Latin America 0.018 0.030 0.005 0.010 0.72 0.67 0.06 Argentina 0.001 0.003 0.000 0.001 0.94 0.52 0.42 Brazil 0.008 0.009 0.003 0.002 0.70 0.83 -0.13 Chile 0.003 0.003 0.000 0.000 0.95 0.86 0.09 Colombia 0.001 0.001 0.000 0.000 0.98 0.95 0.03 Mexico 0.004 0.013 0.002 0.006 0.49 0.51 -0.02 Peru 0.001 0.000 0.000 0.000 0.92 0.81 0.11 Venezuela 0.000 0.000 0.000 0.000 0.76 0.64 0.12 Emerging Asia 0.060 0.058 0.009 0.004 0.84 0.92 -0.08 China 0.016 0.003 0.001 0.000 0.96 0.95 0.01 India 0.010 0.008 0.001 0.000 0.86 0.97 -0.11 Indonesia 0.002 0.002 0.000 0.000 0.81 0.84 -0.04 Korea 0.011 0.010 0.004 0.001 0.64 0.92 -0.28 Malaysia 0.005 0.012 0.000 0.002 0.92 0.87 0.06 Pakistan 0.001 0.001 0.000 0.000 0.99 0.96 0.03 Philippines 0.001 0.002 0.000 0.000 0.82 0.86 -0.04 Sri Lanka 0.000 0.000 0.000 0.000 0.98 0.93 0.05 Thailand 0.003 0.007 0.000 0.001 0.88 0.90 -0.02 Taiwan 0.011 0.012 0.002 0.000 0.82 0.99 -0.17 Financial Centers 0.027 0.028 0.004 0.004 0.87 0.84 0.02 Hong Kong 0.022 0.020 0.002 0.003 0.90 0.84 0.06 Singapore 0.004 0.008 0.001 0.001 0.68 0.85 -0.17 Emerging Europe 0.005 0.002 0.001 0.000 0.85 0.90 -0.05 Hungary 0.001 0.000 0.000 0.000 0.64 0.68 -0.04 Poland 0.002 0.000 0.000 0.000 0.90 0.96 -0.06 Turkey 0.003 0.001 0.000 0.000 0.87 0.90 -0.03 Other Emerging 0.016 0.014 0.003 0.001 0.84 0.91 -0.06 Egypt 0.001 0.000 0.000 0.000 0.93 1.00 -0.06 Israel 0.003 0.003 0.001 0.000 0.58 0.84 -0.27 Morocco 0.001 0.000 0.000 0.000 0.99 0.98 0.02 South Africa 0.012 0.011 0.001 0.001 0.89 0.92 -0.03 Total (above listed) 0.545 0.623 0.134 0.098 0.75 0.84 -0.09 Total Rest of World 0.580 0.631 0.153 0.102 0.74 0.84 -0.10 Equally Weighted Average 0.012 0.014 0.003 0.0021 0.787 0.814 -0.027 (4.31) (2.52) (3.78) (3.69) (36.0) (40.3) (1.45)
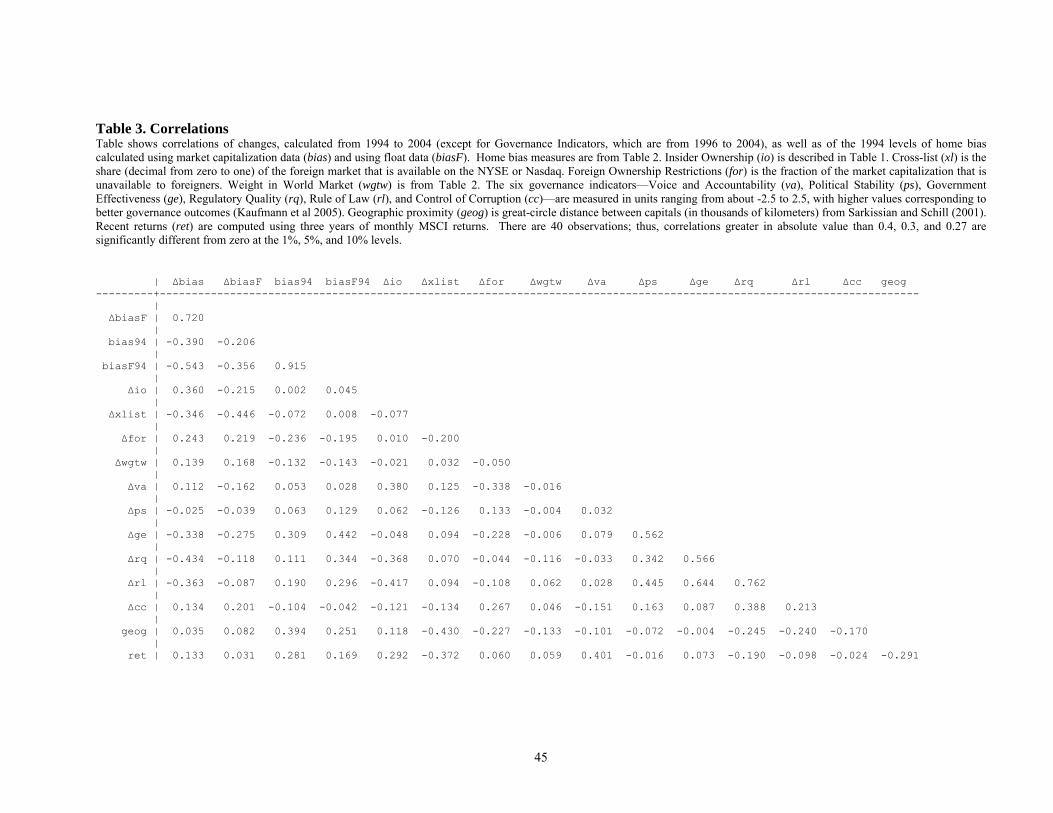
45
Table 3. Correlations Table shows correlations of changes, calculated from 1994 to 2004 (except for Governance Indicators, which are from 1996 to 2004), as well as of the 1994 levels of home bias calculated using market capitalization data (bias) and using float data (biasF). Home bias measures are from Table 2. Insider Ownership (io) is described in Table 1. Cross-list (xl) is the share (decimal from zero to one) of the foreign market that is available on the NYSE or Nasdaq. Foreign Ownership Restrictions (for) is the fraction of the market capitalization that is unavailable to foreigners. Weight in World Market (wgtw) is from Table 2. The six governance indicators—Voice and Accountability (va), Political Stability (ps), Government Effectiveness (ge), Regulatory Quality (rq), Rule of Law (rl), and Control of Corruption (cc)—are measured in units ranging from about -2.5 to 2.5, with higher values corresponding to better governance outcomes (Kaufmann et al 2005). Geographic proximity (geog) is great-circle distance between capitals (in thousands of kilometers) from Sarkissian and Schill (2001). Recent returns (ret) are computed using three years of monthly MSCI returns. There are 40 observations; thus, correlations greater in absolute value than 0.4, 0.3, and 0.27 are significantly different from zero at the 1%, 5%, and 10% levels. | ∆bias ∆biasF bias94 biasF94 ∆io ∆xlist ∆for ∆wgtw ∆va ∆ps ∆ge ∆rq ∆rl ∆cc geog ---------+----------------------------------------------------------------------------------------------------------------------- | ∆biasF | 0.720 | bias94 | -0.390 -0.206 | biasF94 | -0.543 -0.356 0.915 | ∆io | 0.360 -0.215 0.002 0.045 | ∆xlist | -0.346 -0.446 -0.072 0.008 -0.077 | ∆for | 0.243 0.219 -0.236 -0.195 0.010 -0.200 | ∆wgtw | 0.139 0.168 -0.132 -0.143 -0.021 0.032 -0.050 | ∆va | 0.112 -0.162 0.053 0.028 0.380 0.125 -0.338 -0.016 | ∆ps | -0.025 -0.039 0.063 0.129 0.062 -0.126 0.133 -0.004 0.032 | ∆ge | -0.338 -0.275 0.309 0.442 -0.048 0.094 -0.228 -0.006 0.079 0.562 | ∆rq | -0.434 -0.118 0.111 0.344 -0.368 0.070 -0.044 -0.116 -0.033 0.342 0.566 | ∆rl | -0.363 -0.087 0.190 0.296 -0.417 0.094 -0.108 0.062 0.028 0.445 0.644 0.762 | ∆cc | 0.134 0.201 -0.104 -0.042 -0.121 -0.134 0.267 0.046 -0.151 0.163 0.087 0.388 0.213 | geog | 0.035 0.082 0.394 0.251 0.118 -0.430 -0.227 -0.133 -0.101 -0.072 -0.004 -0.245 -0.240 -0.170 | ret | 0.133 0.031 0.281 0.169 0.292 -0.372 0.060 0.059 0.401 -0.016 0.073 -0.190 -0.098 -0.024 -0.291
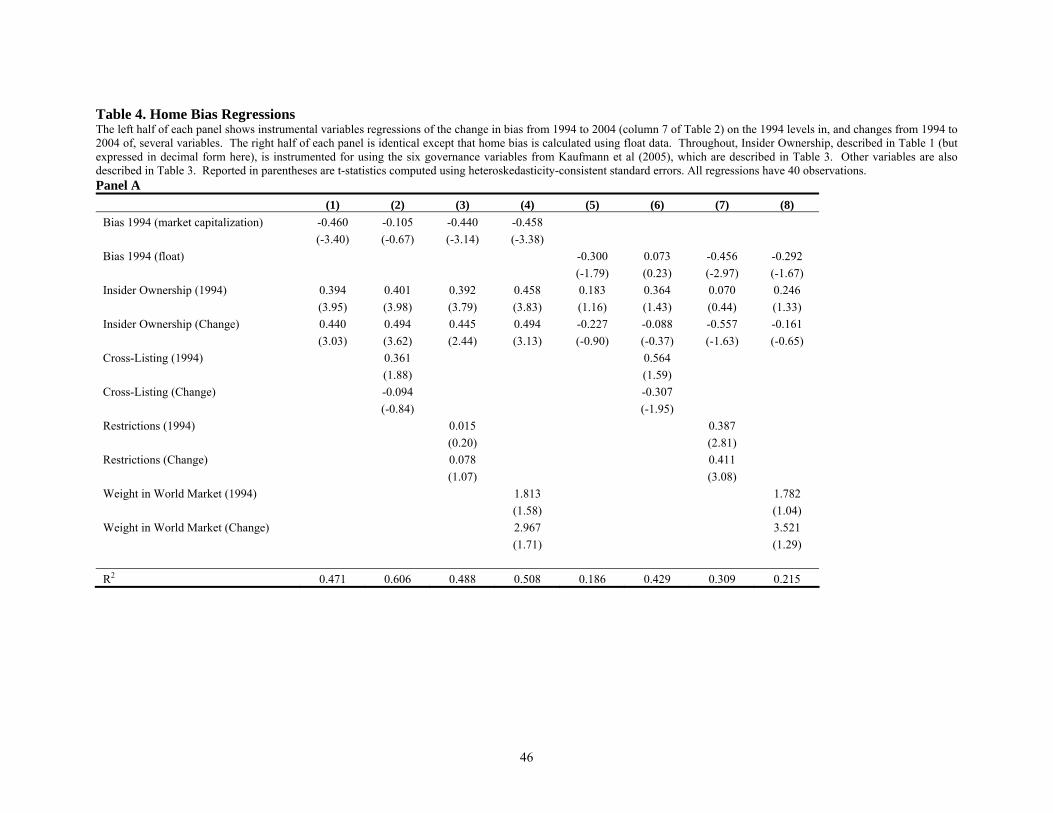
46
Table 4. Home Bias Regressions The left half of each panel shows instrumental variables regressions of the change in bias from 1994 to 2004 (column 7 of Table 2) on the 1994 levels in, and changes from 1994 to 2004 of, several variables. The right half of each panel is identical except that home bias is calculated using float data. Throughout, Insider Ownership, described in Table 1 (but expressed in decimal form here), is instrumented for using the six governance variables from Kaufmann et al (2005), which are described in Table 3. Other variables are also described in Table 3. Reported in parentheses are t-statistics computed using heteroskedasticity-consistent standard errors. All regressions have 40 observations. Panel A
(1) (2) (3) (4) (5) (6) (7) (8) Bias 1994 (market capitalization) -0.460 -0.105 -0.440 -0.458
(-3.40) (-0.67) (-3.14) (-3.38) Bias 1994 (float) -0.300 0.073 -0.456 -0.292 (-1.79) (0.23) (-2.97) (-1.67) Insider Ownership (1994) 0.394 0.401 0.392 0.458 0.183 0.364 0.070 0.246
(3.95) (3.98) (3.79) (3.83) (1.16) (1.43) (0.44) (1.33) Insider Ownership (Change) 0.440 0.494 0.445 0.494 -0.227 -0.088 -0.557 -0.161
(3.03) (3.62) (2.44) (3.13) (-0.90) (-0.37) (-1.63) (-0.65) Cross-Listing (1994) 0.361 0.564
(1.88) (1.59) Cross-Listing (Change) -0.094 -0.307
(-0.84) (-1.95) Restrictions (1994) 0.015 0.387
(0.20) (2.81) Restrictions (Change) 0.078 0.411
(1.07) (3.08) Weight in World Market (1994) 1.813 1.782
(1.58) (1.04) Weight in World Market (Change) 2.967 3.521
(1.71) (1.29) R2 0.471 0.606 0.488 0.508 0.186 0.429 0.309 0.215
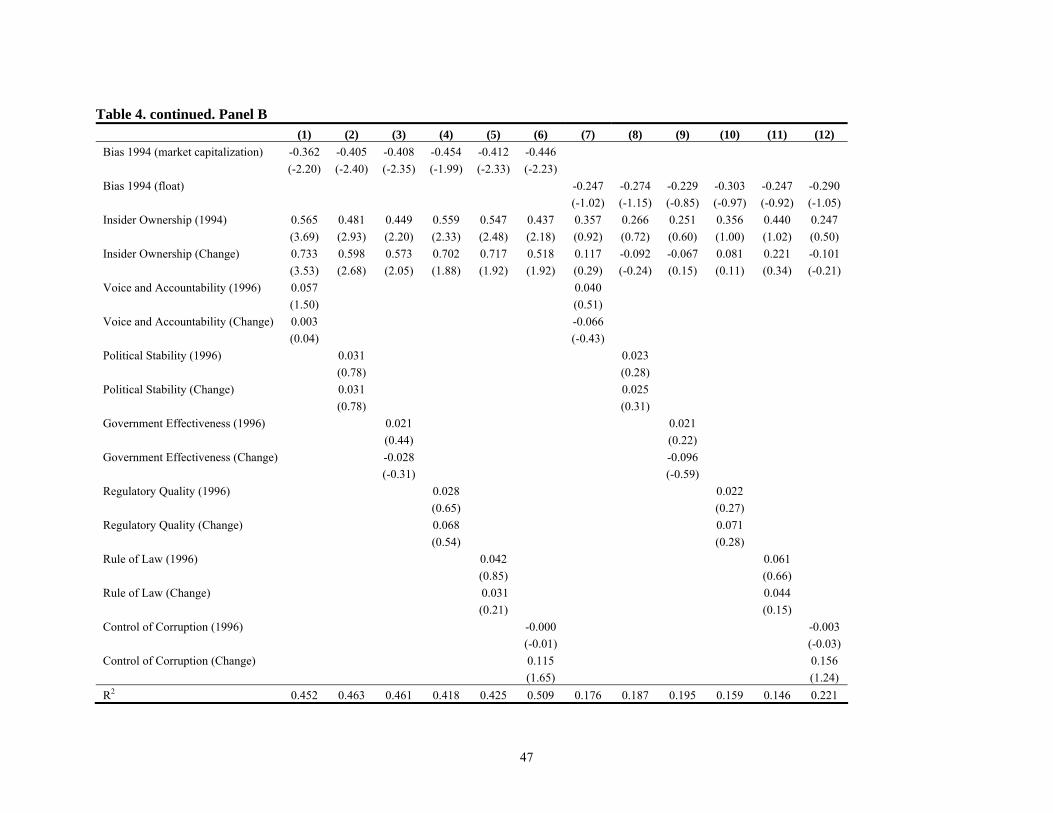
47
Table 4. continued. Panel B (1) (2) (3) (4) (5) (6) (7) (8) (9) (10) (11) (12) Bias 1994 (market capitalization) -0.362 -0.405 -0.408 -0.454 -0.412 -0.446
(-2.20) (-2.40) (-2.35) (-1.99) (-2.33) (-2.23) Bias 1994 (float) -0.247 -0.274 -0.229 -0.303 -0.247 -0.290 (-1.02) (-1.15) (-0.85) (-0.97) (-0.92) (-1.05) Insider Ownership (1994) 0.565 0.481 0.449 0.559 0.547 0.437 0.357 0.266 0.251 0.356 0.440 0.247
(3.69) (2.93) (2.20) (2.33) (2.48) (2.18) (0.92) (0.72) (0.60) (1.00) (1.02) (0.50) Insider Ownership (Change) 0.733 0.598 0.573 0.702 0.717 0.518 0.117 -0.092 -0.067 0.081 0.221 -0.101
(3.53) (2.68) (2.05) (1.88) (1.92) (1.92) (0.29) (-0.24) (0.15) (0.11) (0.34) (-0.21) Voice and Accountability (1996) 0.057 0.040
(1.50) (0.51) Voice and Accountability (Change) 0.003 -0.066
(0.04) (-0.43) Political Stability (1996) 0.031 0.023
(0.78) (0.28) Political Stability (Change) 0.031 0.025
(0.78) (0.31) Government Effectiveness (1996) 0.021 0.021
(0.44) (0.22) Government Effectiveness (Change) -0.028 -0.096
(-0.31) (-0.59) Regulatory Quality (1996) 0.028 0.022
(0.65) (0.27) Regulatory Quality (Change) 0.068 0.071
(0.54) (0.28) Rule of Law (1996) 0.042 0.061
(0.85) (0.66) Rule of Law (Change) 0.031 0.044
(0.21) (0.15) Control of Corruption (1996) -0.000 -0.003
(-0.01) (-0.03) Control of Corruption (Change) 0.115 0.156 (1.65) (1.24) R2 0.452 0.463 0.461 0.418 0.425 0.509 0.176 0.187 0.195 0.159 0.146 0.221
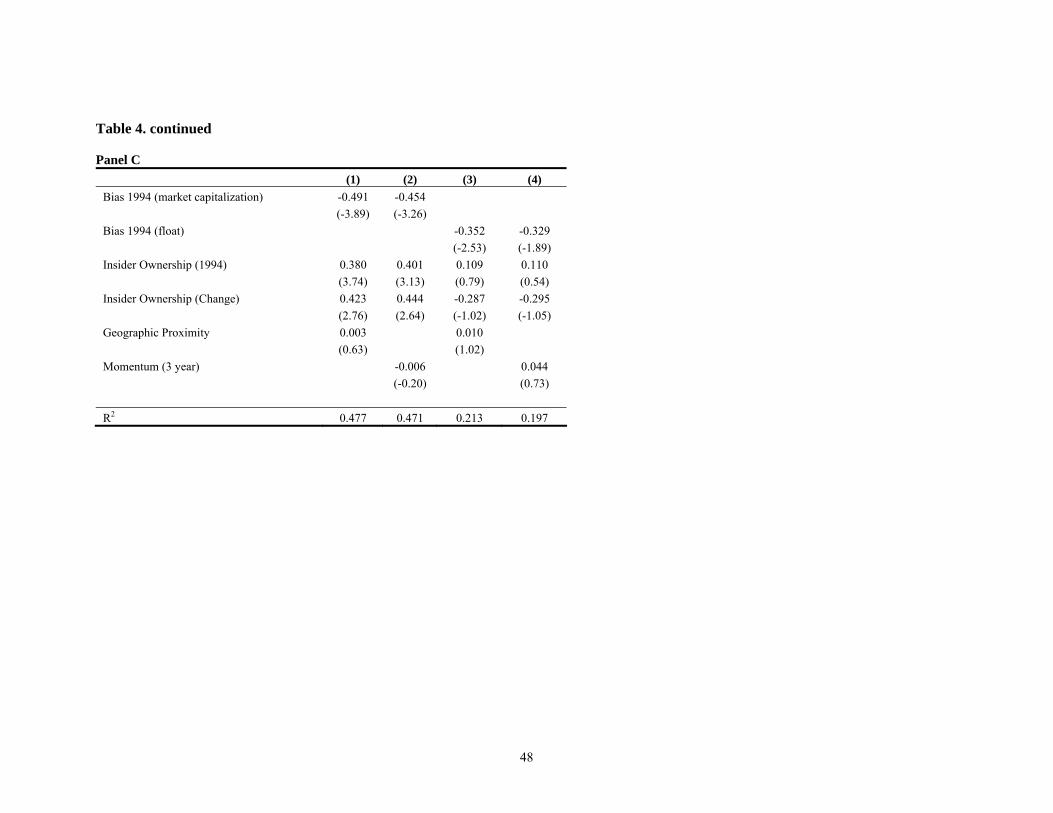
48
Table 4. continued Panel C
(1) (2) (3) (4) Bias 1994 (market capitalization) -0.491 -0.454
(-3.89) (-3.26) Bias 1994 (float) -0.352 -0.329 (-2.53) (-1.89) Insider Ownership (1994) 0.380 0.401 0.109 0.110
(3.74) (3.13) (0.79) (0.54) Insider Ownership (Change) 0.423 0.444 -0.287 -0.295
(2.76) (2.64) (-1.02) (-1.05) Geographic Proximity 0.003 0.010
(0.63) (1.02) Momentum (3 year) -0.006 0.044
(-0.20) (0.73) R2 0.477 0.471 0.213 0.197
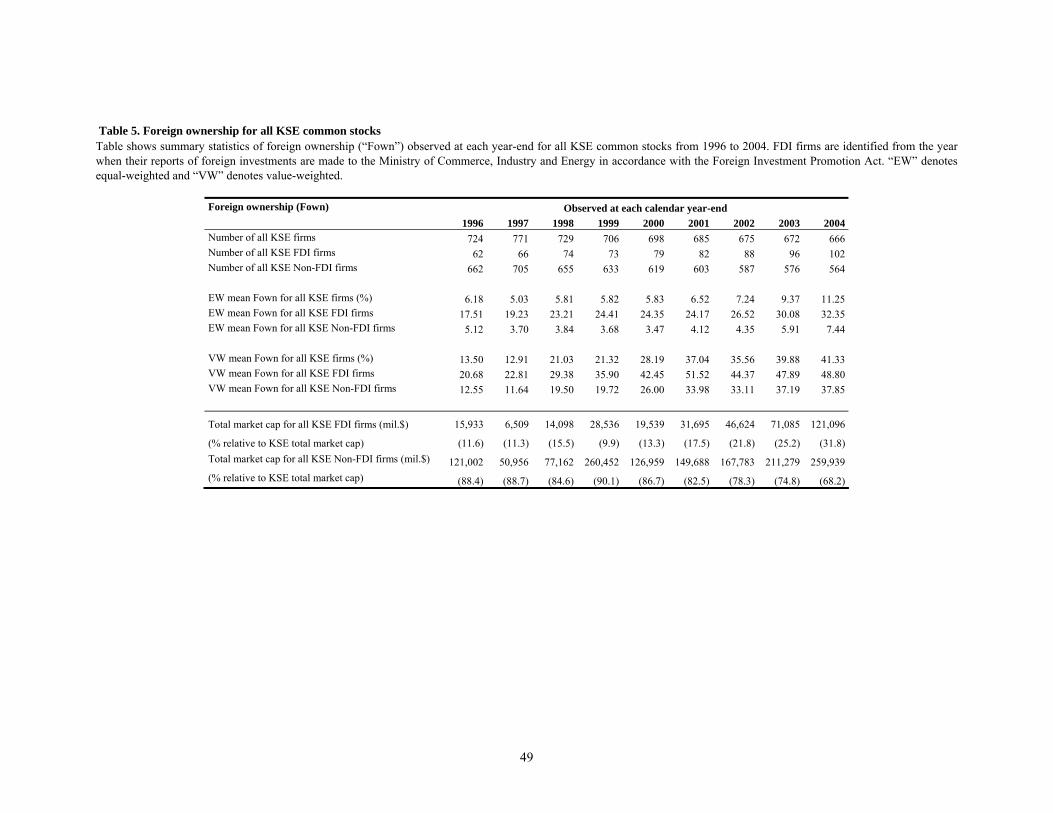
49
Table 5. Foreign ownership for all KSE common stocks Table shows summary statistics of foreign ownership (“Fown”) observed at each year-end for all KSE common stocks from 1996 to 2004. FDI firms are identified from the year when their reports of foreign investments are made to the Ministry of Commerce, Industry and Energy in accordance with the Foreign Investment Promotion Act. “EW” denotes equal-weighted and “VW” denotes value-weighted.
Foreign ownership (Fown) Observed at each calendar year-end 1996 1997 1998 1999 2000 2001 2002 2003 2004Number of all KSE firms 724 771 729 706 698 685 675 672 666Number of all KSE FDI firms 62 66 74 73 79 82 88 96 102Number of all KSE Non-FDI firms 662 705 655 633 619 603 587 576 564 EW mean Fown for all KSE firms (%) 6.18 5.03 5.81 5.82 5.83 6.52 7.24 9.37 11.25 EW mean Fown for all KSE FDI firms 17.51 19.23 23.21 24.41 24.35 24.17 26.52 30.08 32.35 EW mean Fown for all KSE Non-FDI firms 5.12 3.70 3.84 3.68 3.47 4.12 4.35 5.91 7.44 VW mean Fown for all KSE firms (%) 13.50 12.91 21.03 21.32 28.19 37.04 35.56 39.88 41.33 VW mean Fown for all KSE FDI firms 20.68 22.81 29.38 35.90 42.45 51.52 44.37 47.89 48.80 VW mean Fown for all KSE Non-FDI firms 12.55 11.64 19.50 19.72 26.00 33.98 33.11 37.19 37.85
Total market cap for all KSE FDI firms (mil.$) 15,933 6,509 14,098 28,536 19,539 31,695 46,624 71,085 121,096
(% relative to KSE total market cap) (11.6) (11.3) (15.5) (9.9) (13.3) (17.5) (21.8) (25.2) (31.8)Total market cap for all KSE Non-FDI firms (mil.$) 121,002 50,956 77,162 260,452 126,959 149,688 167,783 211,279 259,939 (% relative to KSE total market cap) (88.4) (88.7) (84.6) (90.1) (86.7) (82.5) (78.3) (74.8) (68.2)
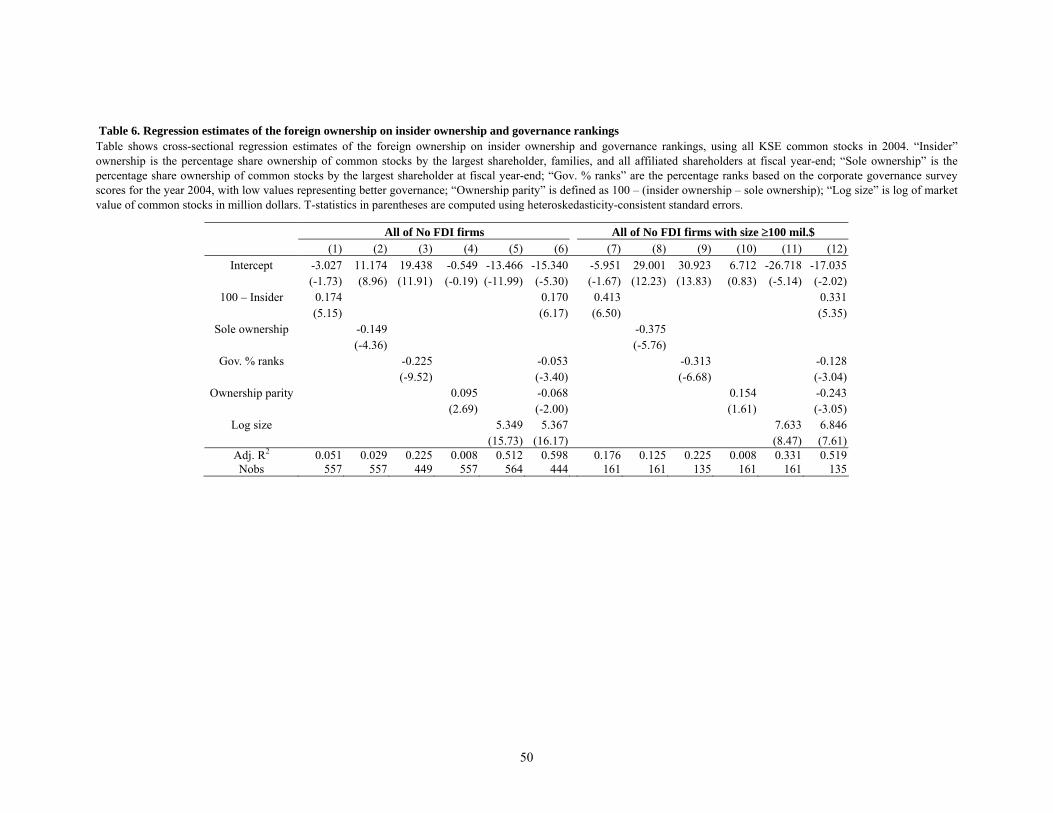
50
Table 6. Regression estimates of the foreign ownership on insider ownership and governance rankings Table shows cross-sectional regression estimates of the foreign ownership on insider ownership and governance rankings, using all KSE common stocks in 2004. “Insider” ownership is the percentage share ownership of common stocks by the largest shareholder, families, and all affiliated shareholders at fiscal year-end; “Sole ownership” is the percentage share ownership of common stocks by the largest shareholder at fiscal year-end; “Gov. % ranks” are the percentage ranks based on the corporate governance survey scores for the year 2004, with low values representing better governance; “Ownership parity” is defined as 100 – (insider ownership – sole ownership); “Log size” is log of market value of common stocks in million dollars. T-statistics in parentheses are computed using heteroskedasticity-consistent standard errors.
All of No FDI firms All of No FDI firms with size ≥100 mil.$ (1) (2) (3) (4) (5) (6) (7) (8) (9) (10) (11) (12)
Intercept -3.027 11.174 19.438 -0.549 -13.466 -15.340 -5.951 29.001 30.923 6.712 -26.718 -17.035 (-1.73) (8.96) (11.91) (-0.19) (-11.99) (-5.30) (-1.67) (12.23) (13.83) (0.83) (-5.14) (-2.02)
100 – Insider 0.174 0.170 0.413 0.331 (5.15) (6.17) (6.50) (5.35)
Sole ownership -0.149 -0.375 (-4.36) (-5.76)
Gov. % ranks -0.225 -0.053 -0.313 -0.128 (-9.52) (-3.40) (-6.68) (-3.04)
Ownership parity 0.095 -0.068 0.154 -0.243 (2.69) (-2.00) (1.61) (-3.05)
Log size 5.349 5.367 7.633 6.846 (15.73) (16.17) (8.47) (7.61)
Adj. R2 0.051 0.029 0.225 0.008 0.512 0.598 0.176 0.125 0.225 0.008 0.331 0.519 Nobs 557 557 449 557 564 444 161 161 135 161 161 135
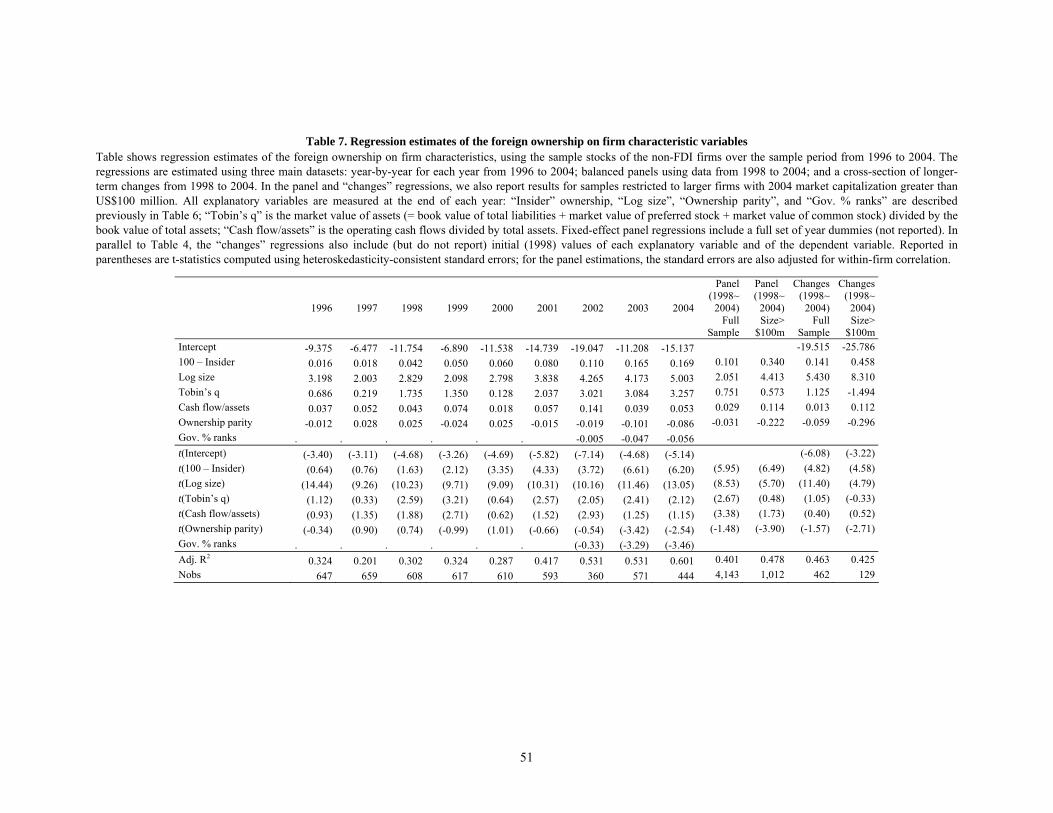
51
Table 7. Regression estimates of the foreign ownership on firm characteristic variables
Table shows regression estimates of the foreign ownership on firm characteristics, using the sample stocks of the non-FDI firms over the sample period from 1996 to 2004. The regressions are estimated using three main datasets: year-by-year for each year from 1996 to 2004; balanced panels using data from 1998 to 2004; and a cross-section of longer-term changes from 1998 to 2004. In the panel and “changes” regressions, we also report results for samples restricted to larger firms with 2004 market capitalization greater than US$100 million. All explanatory variables are measured at the end of each year: “Insider” ownership, “Log size”, “Ownership parity”, and “Gov. % ranks” are described previously in Table 6; “Tobin’s q” is the market value of assets (= book value of total liabilities + market value of preferred stock + market value of common stock) divided by the book value of total assets; “Cash flow/assets” is the operating cash flows divided by total assets. Fixed-effect panel regressions include a full set of year dummies (not reported). In parallel to Table 4, the “changes” regressions also include (but do not report) initial (1998) values of each explanatory variable and of the dependent variable. Reported in parentheses are t-statistics computed using heteroskedasticity-consistent standard errors; for the panel estimations, the standard errors are also adjusted for within-firm correlation.
1996 1997 1998 1999 2000 2001 2002 2003 2004
Panel(1998~
2004)Full
Sample
Panel (1998~
2004)Size>
$100m
Changes(1998~
2004)Full
Sample
Changes(1998~
2004)Size>
$100mIntercept -9.375 -6.477 -11.754 -6.890 -11.538 -14.739 -19.047 -11.208 -15.137 -19.515 -25.786 100 – Insider 0.016 0.018 0.042 0.050 0.060 0.080 0.110 0.165 0.169 0.101 0.340 0.141 0.458 Log size 3.198 2.003 2.829 2.098 2.798 3.838 4.265 4.173 5.003 2.051 4.413 5.430 8.310 Tobin’s q 0.686 0.219 1.735 1.350 0.128 2.037 3.021 3.084 3.257 0.751 0.573 1.125 -1.494 Cash flow/assets 0.037 0.052 0.043 0.074 0.018 0.057 0.141 0.039 0.053 0.029 0.114 0.013 0.112 Ownership parity -0.012 0.028 0.025 -0.024 0.025 -0.015 -0.019 -0.101 -0.086 -0.031 -0.222 -0.059 -0.296 Gov. % ranks . . . . . . -0.005 -0.047 -0.056 t(Intercept) (-3.40) (-3.11) (-4.68) (-3.26) (-4.69) (-5.82) (-7.14) (-4.68) (-5.14) (-6.08) (-3.22)t(100 – Insider) (0.64) (0.76) (1.63) (2.12) (3.35) (4.33) (3.72) (6.61) (6.20) (5.95) (6.49) (4.82) (4.58)t(Log size) (14.44) (9.26) (10.23) (9.71) (9.09) (10.31) (10.16) (11.46) (13.05) (8.53) (5.70) (11.40) (4.79)t(Tobin’s q) (1.12) (0.33) (2.59) (3.21) (0.64) (2.57) (2.05) (2.41) (2.12) (2.67) (0.48) (1.05) (-0.33)t(Cash flow/assets) (0.93) (1.35) (1.88) (2.71) (0.62) (1.52) (2.93) (1.25) (1.15) (3.38) (1.73) (0.40) (0.52)t(Ownership parity) (-0.34) (0.90) (0.74) (-0.99) (1.01) (-0.66) (-0.54) (-3.42) (-2.54) (-1.48) (-3.90) (-1.57) (-2.71)Gov. % ranks . . . . . . (-0.33) (-3.29) (-3.46) Adj. R2 0.324 0.201 0.302 0.324 0.287 0.417 0.531 0.531 0.601 0.401 0.478 0.463 0.425 Nobs 647 659 608 617 610 593 360 571 444 4,143 1,012 462 129
Recommended