Confidential
“Navigator Holdings Ltd. (NYSE:NVGS)”
Navigator Holdings Ltd.
Stifel 2021 Virtual Transportation & Logistics Conference
February 2021
ConfidentialStrictly Private and Confidential
This presentation contains certain statements that may be deemed to be
“forward-looking statements” within the meaning of applicable federal
securities laws. Most forward-looking statements contain words that identify
them as forward-looking, such as “may”, “plan”, “seek”, “will”, “expect”, “intend”,
“estimate”, “anticipate”, “believe”, “project”, “opportunity”, “target”, “goal”,
“growing” and “continue” or other words that relate to future events, as
opposed to past or current events. All statements, other than statements of
historical facts, that address activities, events or developments that Navigator
Holdings Ltd. (“Navigator” or the “Company”) expects, projects, believes or
anticipates will or may occur in the future, including, without limitation,
acquisitions of vessels, the outlook for fleet utilization and shipping rates,
general industry conditions, future operating results of the Company’s vessels,
capital expenditures, expansion and growth opportunities, business strategy,
ability to pay dividends and other such matters, are forward-looking
statements. Although the Company believes that its expectations stated in this
presentation are based on reasonable assumptions, actual results may differ
any expectations or goals expressed in, or implied by, the forward-looking
statements included in this presentation, possibly to a material degree.
Navigator cannot assure you that the assumptions made in preparing any of
the forward-looking statements will prove accurate or that any long-term
financial goals will be realized. All forward-looking statements included in this
presentation speak only as of the date made, and Navigator undertakes no
obligation to update or revise publicly any such forward-looking statements,
whether as a result of new information, future events, or otherwise. In particular
Navigator cautions you not to place undue weight on certain forward-looking
statements pertaining to potential growth opportunities or long-term financial
goals set forth herein.
2
FORWARD-LOOKING STATEMENT
Confidential
TABLE OF CONTENTS
BUSINESS AND MARKET UPDATE
FINANCIAL INFORMATION
3Strictly Private and Confidential
ConfidentialStrictly Private and Confidential
4
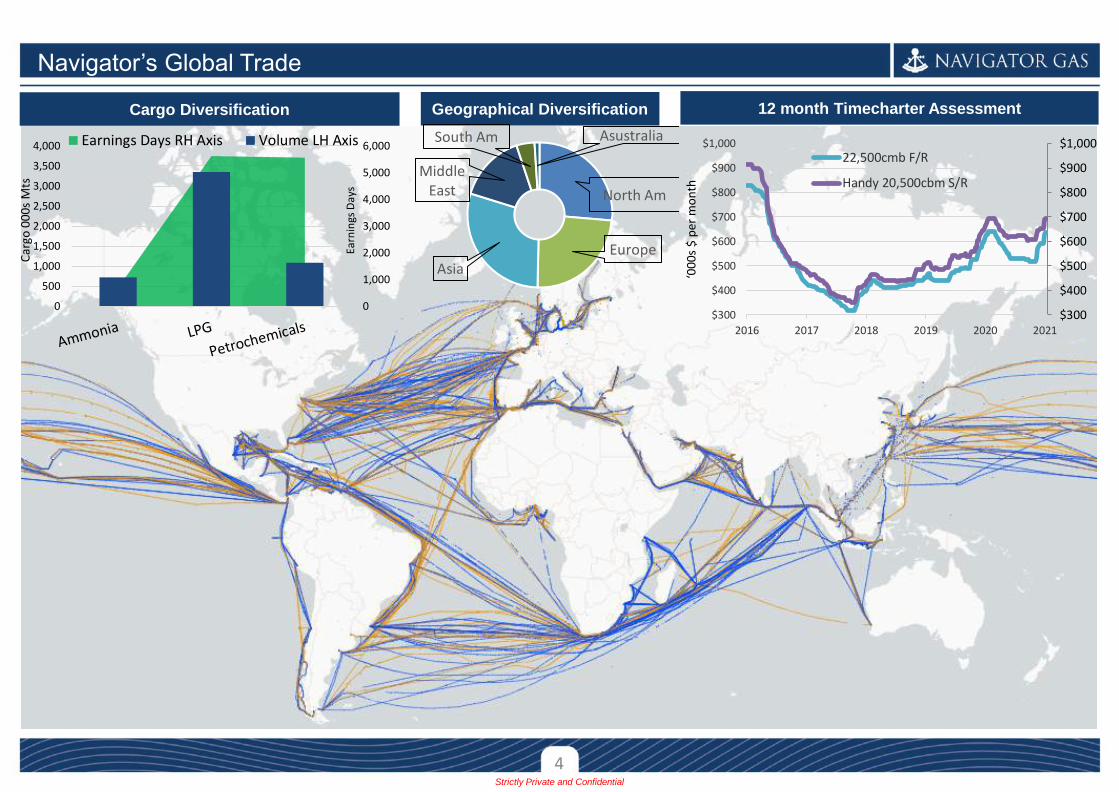
Navigator’s Global Trade
$300
$400
$500
$600
$700
$800
$900
$1,000
$300
$400
$500
$600
$700
$800
$900
$1,000
2016 2017 2018 2019 2020 2021
‘000
s $
per
mo
nth
22,500cmb F/R
Handy 20,500cbm S/R
12 month Timecharter AssessmentCargo Diversification Geographical Diversification
0
1,000
2,000
3,000
4,000
5,000
6,000
0
500
1,000
1,500
2,000
2,500
3,000
3,500
4,000
Car
go 0
00s
Mts
Earnings Days RH Axis Volume LH Axis
North Am
EuropeAsia
Middle East
South Am Asustralia
Earn
ings
Day
s
ConfidentialStrictly Private and Confidential
5
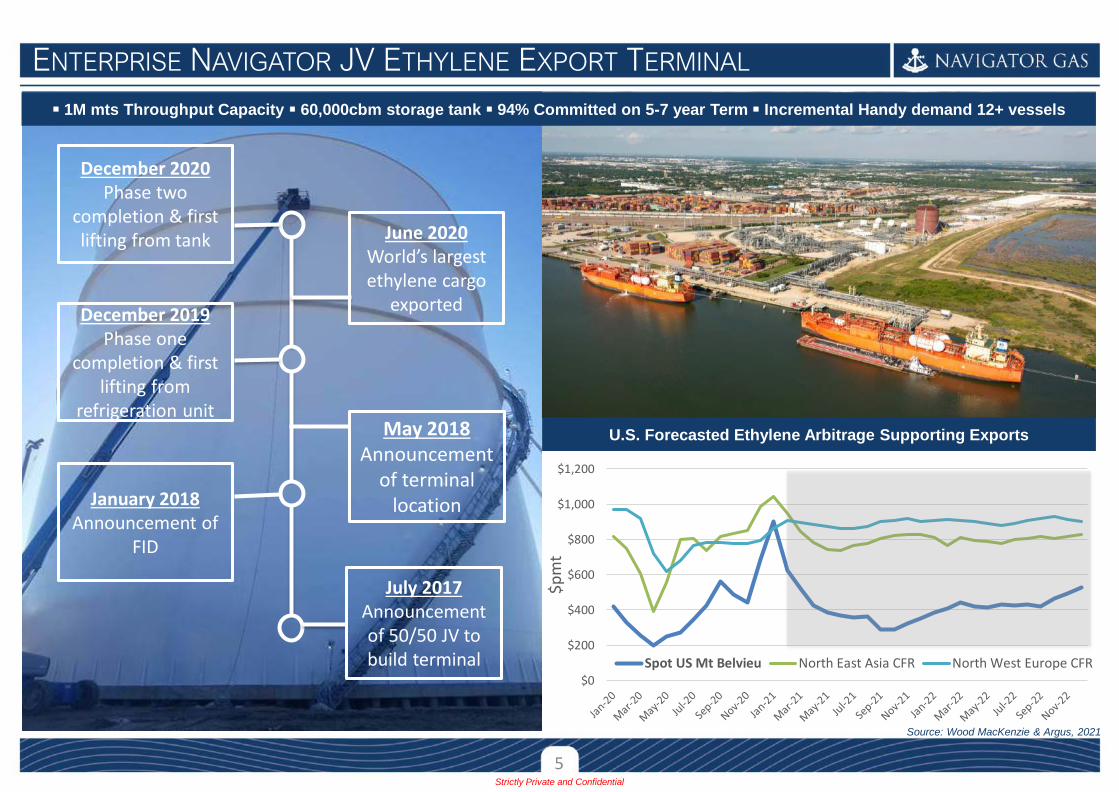
ENTERPRISE NAVIGATOR JV ETHYLENE EXPORT TERMINAL
U.S. Forecasted Ethylene Arbitrage Supporting Exports
$0
$200
$400
$600
$800
$1,000
$1,200
$p
mt
Spot US Mt Belvieu North East Asia CFR North West Europe CFR
Source: Wood MacKenzie & Argus, 2021
▪ 1M mts Throughput Capacity ▪ 60,000cbm storage tank ▪ 94% Committed on 5-7 year Term ▪ Incremental Handy demand 12+ vessels
December 2020 Phase two
completion & first lifting from tank June 2020
World’s largest ethylene cargo
exportedDecember 2019
Phase one completion & first
lifting from refrigeration unit
May 2018 Announcement
of terminal location
July 2017 Announcement of 50/50 JV to build terminal
January 2018 Announcement of
FID
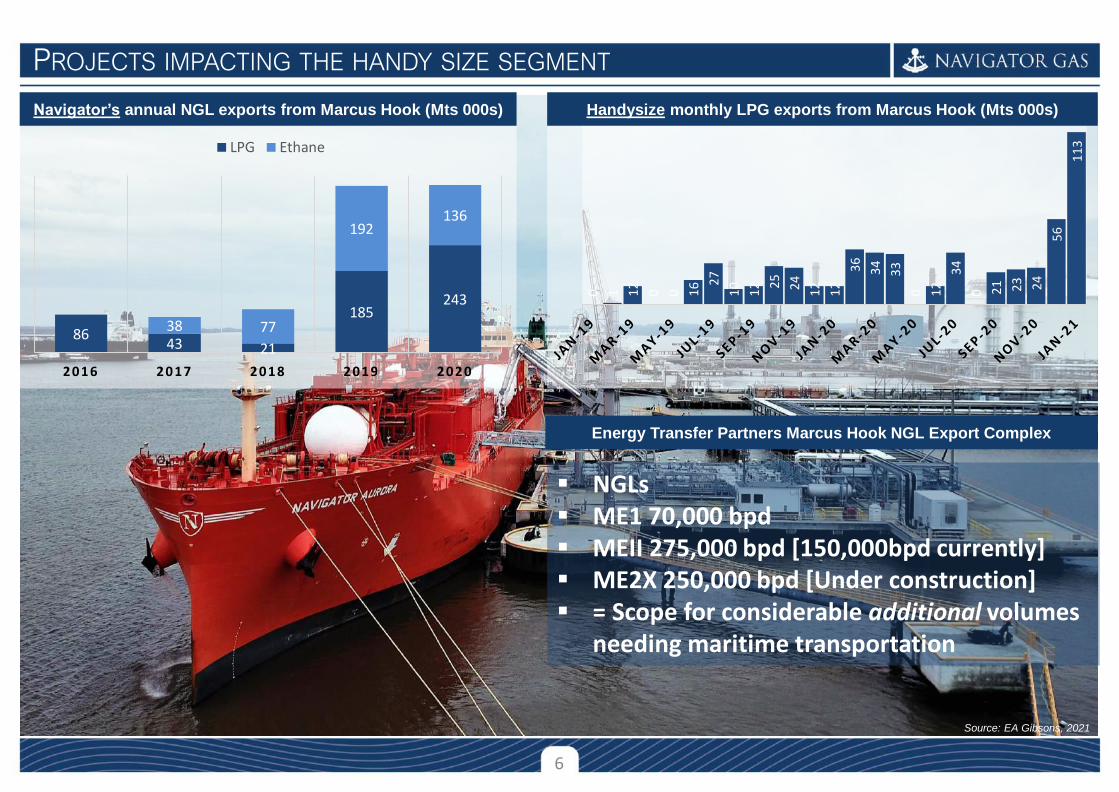
PROJECTS IMPACTING THE HANDY SIZE SEGMENT
▪ NGLs▪ ME1 70,000 bpd▪ MEII 275,000 bpd [150,000bpd currently]▪ ME2X 250,000 bpd [Under construction]▪ = Scope for considerable additional volumes
needing maritime transportation
6
8643 21
185243
38 77
192136
2016 2 0 1 7 2018 2019 2020
LPG Ethane
Navigator’s annual NGL exports from Marcus Hook (Mts 000s)
Energy Transfer Partners Marcus Hook NGL Export Complex
0 1 12
0 0 16 2
7
10
12 2
5
24
12
12
36
34
33
0 12
34
0 21 23 24
56
11
3
Handysize monthly LPG exports from Marcus Hook (Mts 000s)
Source: EA Gibsons, 2021
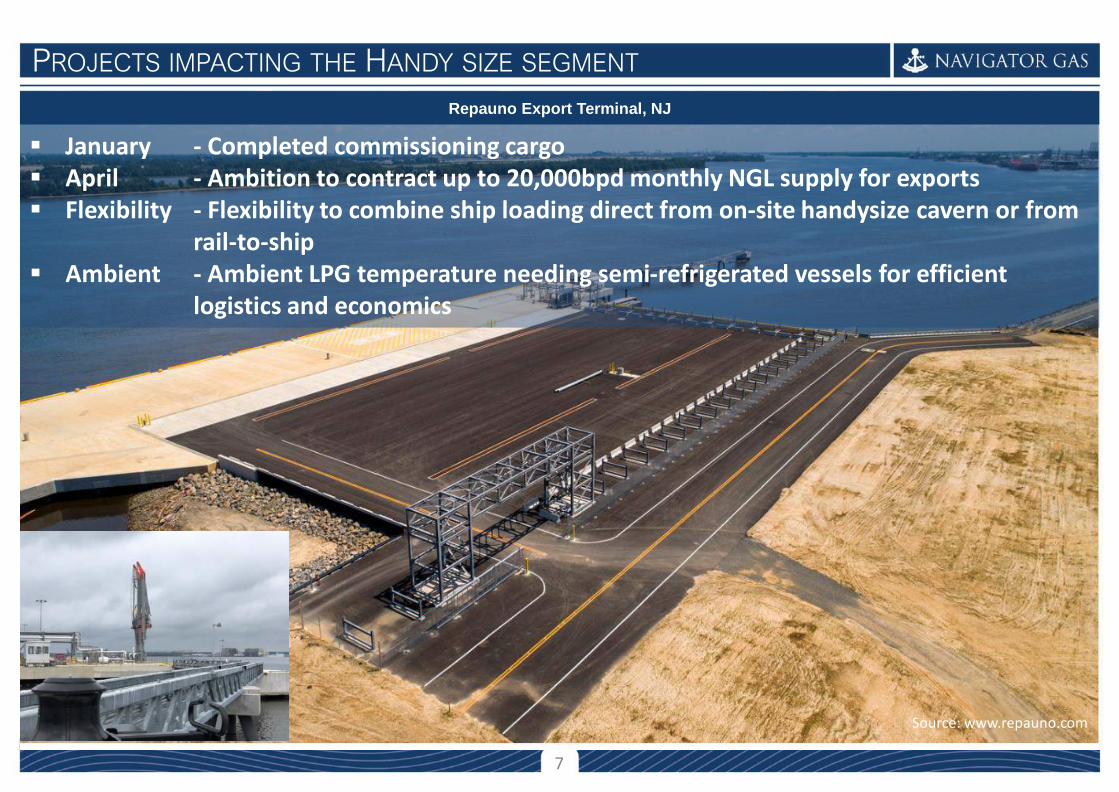
PROJECTS IMPACTING THE HANDY SIZE SEGMENT
Source: www.repauno.com
7
Repauno Export Terminal, NJ
▪ January - Completed commissioning cargo▪ April - Ambition to contract up to 20,000bpd monthly NGL supply for exports▪ Flexibility - Flexibility to combine ship loading direct from on-site handysize cavern or from
rail-to-ship▪ Ambient - Ambient LPG temperature needing semi-refrigerated vessels for efficient
logistics and economics
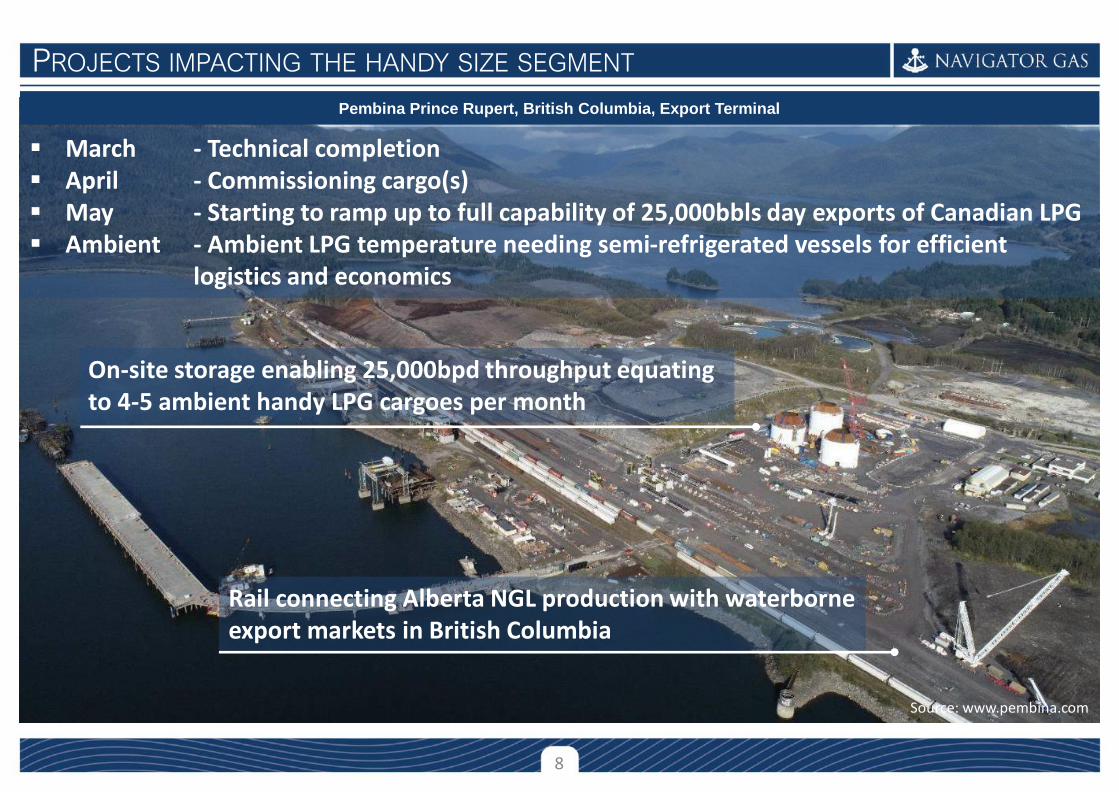
PROJECTS IMPACTING THE HANDY SIZE SEGMENT
Source: www.pembina.com
Rail connecting Alberta NGL production with waterborne export markets in British Columbia
On-site storage enabling 25,000bpd throughput equating to 4-5 ambient handy LPG cargoes per month
8
Pembina Prince Rupert, British Columbia, Export Terminal
▪ March - Technical completion▪ April - Commissioning cargo(s)▪ May - Starting to ramp up to full capability of 25,000bbls day exports of Canadian LPG▪ Ambient - Ambient LPG temperature needing semi-refrigerated vessels for efficient
logistics and economics
Confidential
TABLE OF CONTENTS
BUSINESS AND MARKET UPDATE
FINANCIAL INFORMATION
9Strictly Private and Confidential

ConfidentialStrictly Private and Confidential
STRONG BALANCE SHEET WITH DIVERSITY OF FUNDING SOURCES
Navigator has continued to
rely predominantly on a
combination of senior debt
and equity for vessel related
capex and have built up very
strong relationships with key
ship finance institutions as
demonstrated by:
August 2020, the Company
accessed the Norwegian
Debt Capital Markets by
raising $100 million
unsecured bond. (Closed September 10, 2020)
September 17, 2020
refinanced $290 million loan
facility with a new $210
million revolving credit
facility, generating an
additional $30 million for
general corporate
purposes.
Last year, a $77.5 million
sale and leaseback for one
vessel was concluded
(closed October 28, 2019).
Navigator also arranged a
$69.0 million Terminal
Credit Facility to part
finance its investment in the
U.S. Morgan’s Point
ethylene terminal, (fully
drawn in January 2021).
Debt Maturity Profile Debt Capitalization/LTV Levels ($ millions)
Current lenders and leasing institutions
Liquidity overview (millions) as at 30th Sept 20
As of September 30, 2020 Actual DebtLoan to
Value %
Vessel Net Book Value 1,561.4 839.4 53.8%
Broker assessment value adj (118.3) - -
Broker assessed values 1,443.1 839.4 58.2%
Total debt (35 vessels) 839.4
Total Shareholders’ equity 938.2
Total capitalization 1,777.6
Debt / Capitalization 47.2%
10
$100m
$54m
$66m$50m
$31m$151m
$66m
$72m
2020 2021 2022 2023 2024 2025
$100 million Bond $107 million facility
$160.8 million facility $278 million facility
$210 million facility $220 million facility
NOK 600 million Bond
$61.0 Minimum cash requirement -
Bank covenant, $42.8
Excess Cash, $18.2
$58.0 $58.0
$20.0$20.0
Cash Collateral, $6.1
$145.1
Cash equivalent Terminal facilityundrawn as at 30
Sept 2020
Vessel refinancingundrawn as at 30
Sept 2020
Liquidity
ConfidentialStrictly Private and Confidential
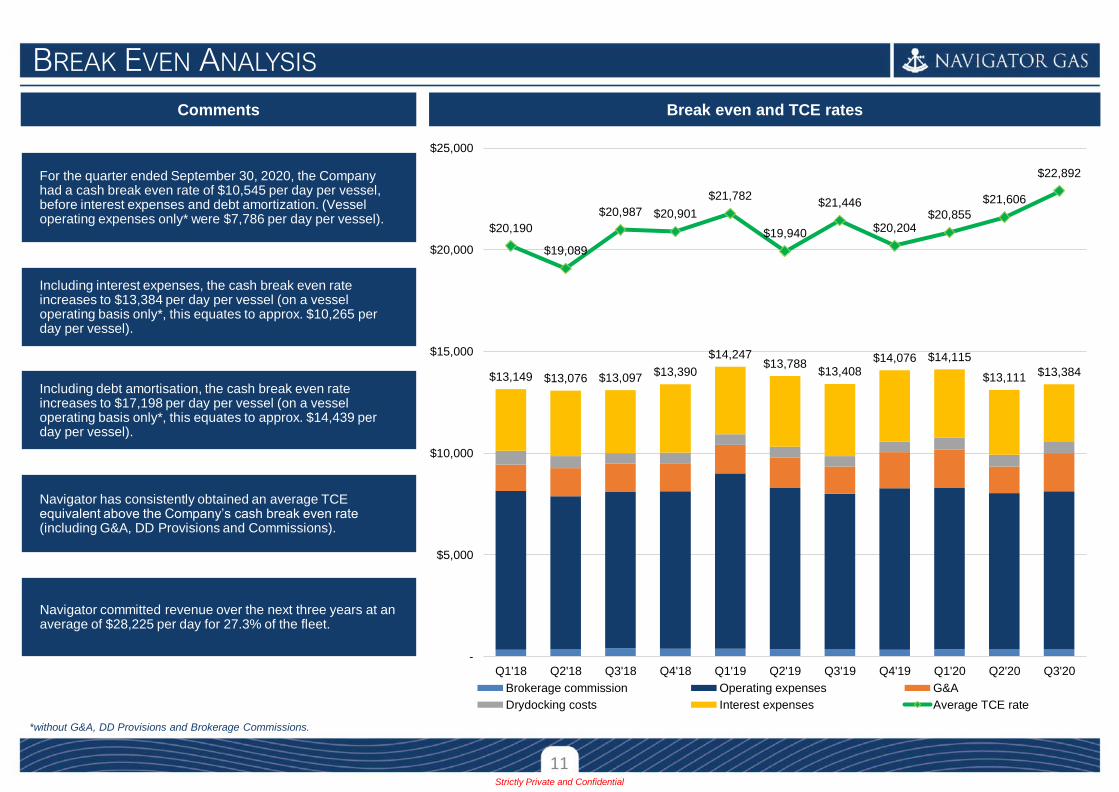
BREAK EVEN ANALYSIS
Comments Break even and TCE rates
For the quarter ended September 30, 2020, the Company had a cash break even rate of $10,545 per day per vessel, before interest expenses and debt amortization. (Vessel operating expenses only* were $7,786 per day per vessel).
Including interest expenses, the cash break even rate increases to $13,384 per day per vessel (on a vessel operating basis only*, this equates to approx. $10,265 per day per vessel).
Including debt amortisation, the cash break even rate increases to $17,198 per day per vessel (on a vessel operating basis only*, this equates to approx. $14,439 per day per vessel).
Navigator has consistently obtained an average TCE equivalent above the Company’s cash break even rate (including G&A, DD Provisions and Commissions).
Navigator committed revenue over the next three years at an average of $28,225 per day for 27.3% of the fleet.
*without G&A, DD Provisions and Brokerage Commissions.
11
$13,149 $13,076 $13,097$13,390
$14,247$13,788
$13,408$14,076 $14,115
$13,111 $13,384
$20,190
$19,089
$20,987 $20,901
$21,782
$19,940
$21,446
$20,204$20,855
$21,606
$22,892
-
$5,000
$10,000
$15,000
$20,000
$25,000
Q1'18 Q2'18 Q3'18 Q4'18 Q1'19 Q2'19 Q3'19 Q4'19 Q1'20 Q2'20 Q3'20
Brokerage commission Operating expenses G&A
Drydocking costs Interest expenses Average TCE rate
ConfidentialStrictly Private and Confidential
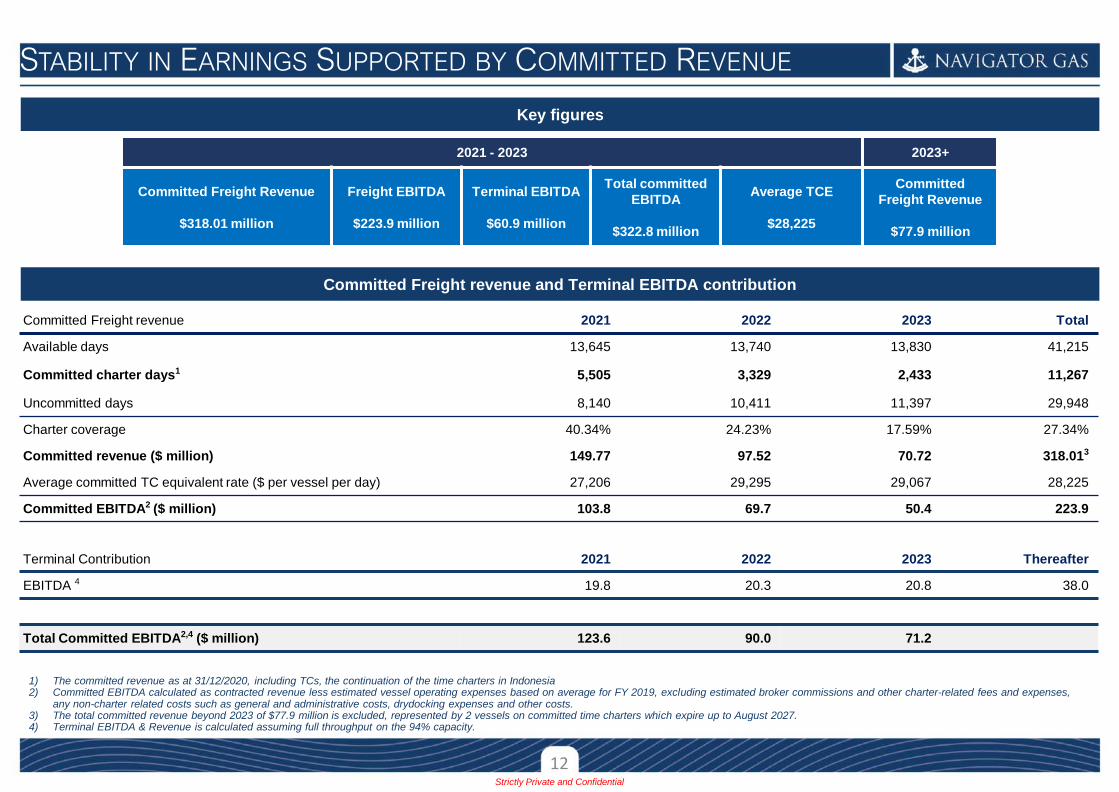
STABILITY IN EARNINGS SUPPORTED BY COMMITTED REVENUE
Committed Freight revenue and Terminal EBITDA contribution
Committed Freight revenue 2021 2022 2023 Total
Available days 13,645 13,740 13,830 41,215
Committed charter days1 5,505 3,329 2,433 11,267
Uncommitted days 8,140 10,411 11,397 29,948
Charter coverage 40.34% 24.23% 17.59% 27.34%
Committed revenue ($ million) 149.77 97.52 70.72 318.013
Average committed TC equivalent rate ($ per vessel per day) 27,206 29,295 29,067 28,225
Committed EBITDA2 ($ million) 103.8 69.7 50.4 223.9
Terminal Contribution 2021 2022 2023 Thereafter
EBITDA 4 19.8 20.3 20.8 38.0
Total Committed EBITDA2,4 ($ million) 123.6 90.0 71.2
1) The committed revenue as at 31/12/2020, including TCs, the continuation of the time charters in Indonesia 2) Committed EBITDA calculated as contracted revenue less estimated vessel operating expenses based on average for FY 2019, excluding estimated broker commissions and other charter-related fees and expenses,
any non-charter related costs such as general and administrative costs, drydocking expenses and other costs.3) The total committed revenue beyond 2023 of $77.9 million is excluded, represented by 2 vessels on committed time charters which expire up to August 2027.4) Terminal EBITDA & Revenue is calculated assuming full throughput on the 94% capacity.
2021 - 2023 2023+
Committed Freight Revenue
$318.01 million
Freight EBITDA
$223.9 million
Terminal EBITDA
$60.9 million
Total committed
EBITDA
$322.8 million
Average TCE
$28,225
Committed
Freight Revenue
$77.9 million
12
Key figures
ConfidentialStrictly Private and Confidential
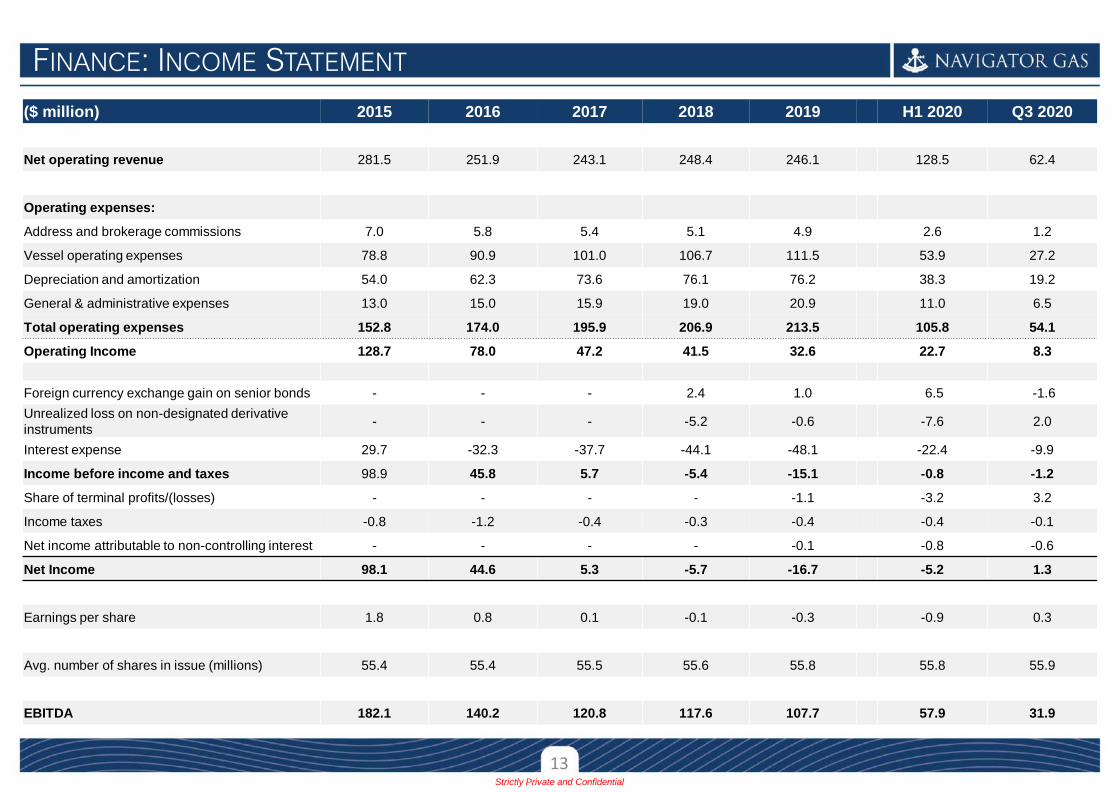
FINANCE: INCOME STATEMENT
($ million) 2015 2016 2017 2018 2019 H1 2020 Q3 2020
Net operating revenue 281.5 251.9 243.1 248.4 246.1 128.5 62.4
Operating expenses:
Address and brokerage commissions 7.0 5.8 5.4 5.1 4.9 2.6 1.2
Vessel operating expenses 78.8 90.9 101.0 106.7 111.5 53.9 27.2
Depreciation and amortization 54.0 62.3 73.6 76.1 76.2 38.3 19.2
General & administrative expenses 13.0 15.0 15.9 19.0 20.9 11.0 6.5
Total operating expenses 152.8 174.0 195.9 206.9 213.5 105.8 54.1
Operating Income 128.7 78.0 47.2 41.5 32.6 22.7 8.3
Foreign currency exchange gain on senior bonds - - - 2.4 1.0 6.5 -1.6
Unrealized loss on non-designated derivative
instruments - - - -5.2 -0.6 -7.6 2.0
Interest expense 29.7 -32.3 -37.7 -44.1 -48.1 -22.4 -9.9
Income before income and taxes 98.9 45.8 5.7 -5.4 -15.1 -0.8 -1.2
Share of terminal profits/(losses) - - - - -1.1 -3.2 3.2
Income taxes -0.8 -1.2 -0.4 -0.3 -0.4 -0.4 -0.1
Net income attributable to non-controlling interest - - - - -0.1 -0.8 -0.6
Net Income 98.1 44.6 5.3 -5.7 -16.7 -5.2 1.3
Earnings per share 1.8 0.8 0.1 -0.1 -0.3 -0.9 0.3
Avg. number of shares in issue (millions) 55.4 55.4 55.5 55.6 55.8 55.8 55.9
EBITDA 182.1 140.2 120.8 117.6 107.7 57.9 31.9
13
ConfidentialStrictly Private and Confidential
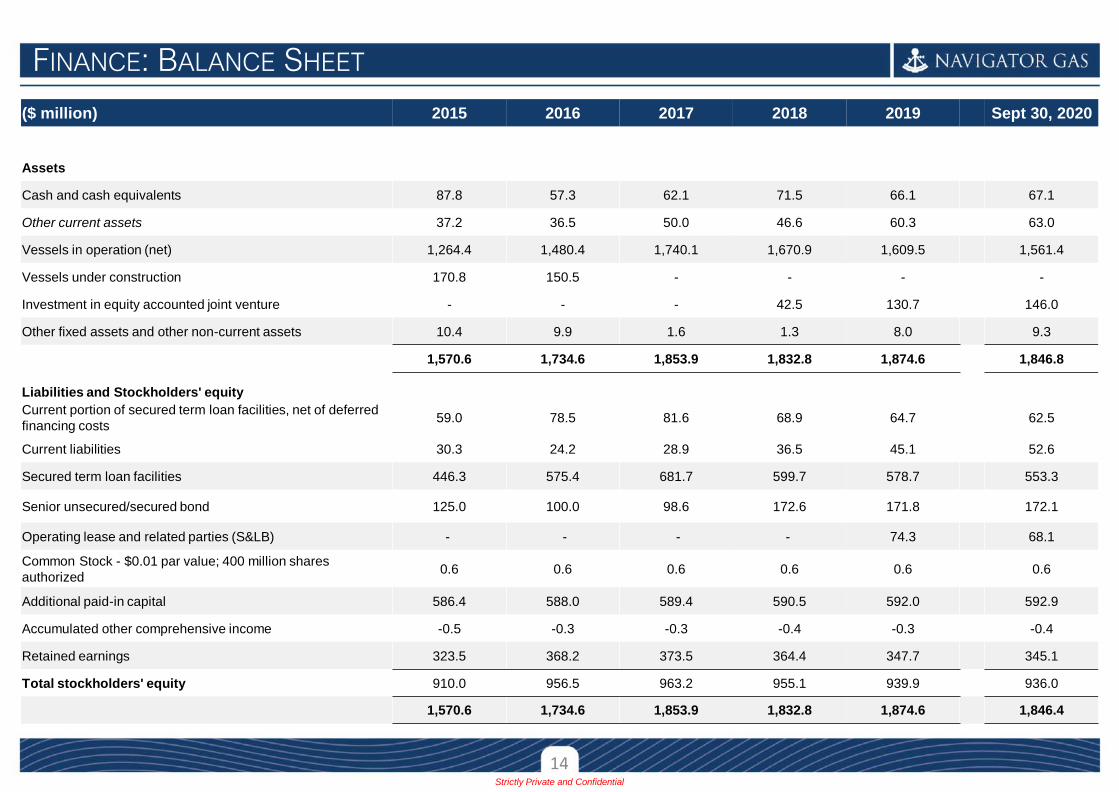
FINANCE: BALANCE SHEET
($ million) 2015 2016 2017 2018 2019 Sept 30, 2020
Assets
Cash and cash equivalents 87.8 57.3 62.1 71.5 66.1 67.1
Other current assets 37.2 36.5 50.0 46.6 60.3 63.0
Vessels in operation (net) 1,264.4 1,480.4 1,740.1 1,670.9 1,609.5 1,561.4
Vessels under construction 170.8 150.5 - - - -
Investment in equity accounted joint venture - - - 42.5 130.7 146.0
Other fixed assets and other non-current assets 10.4 9.9 1.6 1.3 8.0 9.3
1,570.6 1,734.6 1,853.9 1,832.8 1,874.6 1,846.8
Liabilities and Stockholders' equity
Current portion of secured term loan facilities, net of deferred
financing costs59.0 78.5 81.6 68.9 64.7 62.5
Current liabilities 30.3 24.2 28.9 36.5 45.1 52.6
Secured term loan facilities 446.3 575.4 681.7 599.7 578.7 553.3
Senior unsecured/secured bond 125.0 100.0 98.6 172.6 171.8 172.1
Operating lease and related parties (S&LB) - - - - 74.3 68.1
Common Stock - $0.01 par value; 400 million shares
authorized0.6 0.6 0.6 0.6 0.6 0.6
Additional paid-in capital 586.4 588.0 589.4 590.5 592.0 592.9
Accumulated other comprehensive income -0.5 -0.3 -0.3 -0.4 -0.3 -0.4
Retained earnings 323.5 368.2 373.5 364.4 347.7 345.1
Total stockholders' equity 910.0 956.5 963.2 955.1 939.9 936.0
1,570.6 1,734.6 1,853.9 1,832.8 1,874.6 1,846.4
14
ConfidentialStrictly Private and Confidential
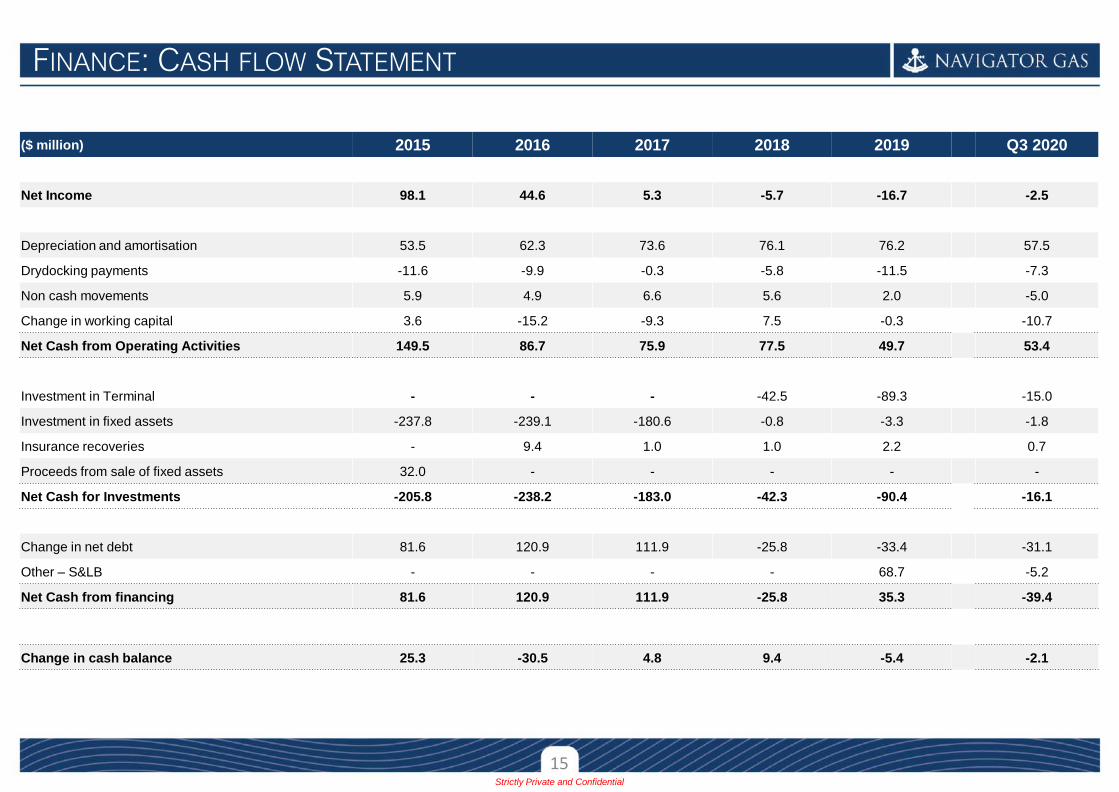
FINANCE: CASH FLOW STATEMENT
($ million) 2015 2016 2017 2018 2019 Q3 2020
Net Income 98.1 44.6 5.3 -5.7 -16.7 -2.5
Depreciation and amortisation 53.5 62.3 73.6 76.1 76.2 57.5
Drydocking payments -11.6 -9.9 -0.3 -5.8 -11.5 -7.3
Non cash movements 5.9 4.9 6.6 5.6 2.0 -5.0
Change in working capital 3.6 -15.2 -9.3 7.5 -0.3 -10.7
Net Cash from Operating Activities 149.5 86.7 75.9 77.5 49.7 53.4
Investment in Terminal - - - -42.5 -89.3 -15.0
Investment in fixed assets -237.8 -239.1 -180.6 -0.8 -3.3 -1.8
Insurance recoveries - 9.4 1.0 1.0 2.2 0.7
Proceeds from sale of fixed assets 32.0 - - - - -
Net Cash for Investments -205.8 -238.2 -183.0 -42.3 -90.4 -16.1
Change in net debt 81.6 120.9 111.9 -25.8 -33.4 -31.1
Other – S&LB - - - - 68.7 -5.2
Net Cash from financing 81.6 120.9 111.9 -25.8 35.3 -39.4
Change in cash balance 25.3 -30.5 4.8 9.4 -5.4 -2.1
15
ConfidentialStrictly Private and Confidential
NGT Services (UK) Limited
Verde Building
10 Bressenden Place
SW1E 5DH
United Kingdom
Tel: +44 (0) 20 7340 4850
Navigator Gas US, LLC
650 Madison Avenue
New York NY 10022
United States of America
Tel: +1 (212) 355 5893
www.navigatorgas.com
NGT Services (Poland) Sp. Z o.o.
MAG Centrum
ul.T.Wendy 15
Gdynia, 81-341
Poland
Strictly Private and Confidential
Recommended