Embed Size (px)
Citation preview

UNITED STATES
SECURITIES AND EXCHANGE COMMISSIONWashington, D.C. 20549
FORM 6-K
REPORT OF FOREIGN PRIVATE ISSUER PURSUANT TO RULE 13A-16 OR 15D-16 OF THE SECURITIES
EXCHANGE ACT OF 1934
For the month of November 2021
Commission File Number 001-38440
Grindrod Shipping Holdings Ltd.
#03-01 Southpoint200 Cantonment Road
Singapore 089763
(Address of principal executive offices)
Indicate by check mark whether the registrant files or will file annual reports under cover of Form 20-F or Form 40-F. Form 20-F Form 40-F Indicate by check mark if the registrant is submitting the Form 6-K in paper as permitted by Regulation S-T Rule 101(b)(1): . Note: Regulation S-T Rule 101(b)(1) only permits the submission in paper of a Form 6-K if submitted solely to provide an attached annual reportto security holders. Indicate by check mark if the registrant is submitting the Form 6-K in paper as permitted by Regulation S-T Rule 101(b)(7): . Note: Regulation S-T Rule 101(b)(7) only permits the submission in paper of a Form 6-K if submitted to furnish a report or other document thatthe registrant foreign private issuer must furnish and make public under the laws of the jurisdiction in which the registrant is incorporated,domiciled or legally organized (the registrant's "home country"), or under the rules of the home country exchange on which the registrant'ssecurities are traded, as long as the report or other document is not a press release, is not required to be and has not been distributed to theregistrant's security holders, and, if discussing a material event, has already been the subject of a Form 6-K submission or other Commissionfiling on EDGAR.

INFORMATION CONTAINED IN THIS FORM 6-K REPORT
On November 17, 2021, Grindrod Shipping Holdings Ltd. (the “Company”) issued a press release announcing the Company’s financial resultsfor the three months and nine months ended September 30, 2021. A copy of the press release is filed as Exhibit 99.1 to this Report on Form 6-K. Exhibits 99.1 Press Release of Grindrod Shipping Holdings Ltd. dated November 17, 2021

SIGNATURES
Pursuant to the requirements of the Securities Exchange Act of 1934, the registrant has duly caused this report to be signed on its behalf by theundersigned, thereunto duly authorized. GRINDROD SHIPPING HOLDINGS LTD. Dated: November 17, 2021 /s/ Stephen Griffiths Name: Stephen Griffiths Title: Chief Financial Officer
Exhibit 99.1
GRINDROD SHIPPING HOLDINGS LTD.
UNAUDITED FINANCIAL RESULTS FOR THE THREE MONTHS & NINE MONTHS ENDED SEPTEMBER 30, 2021
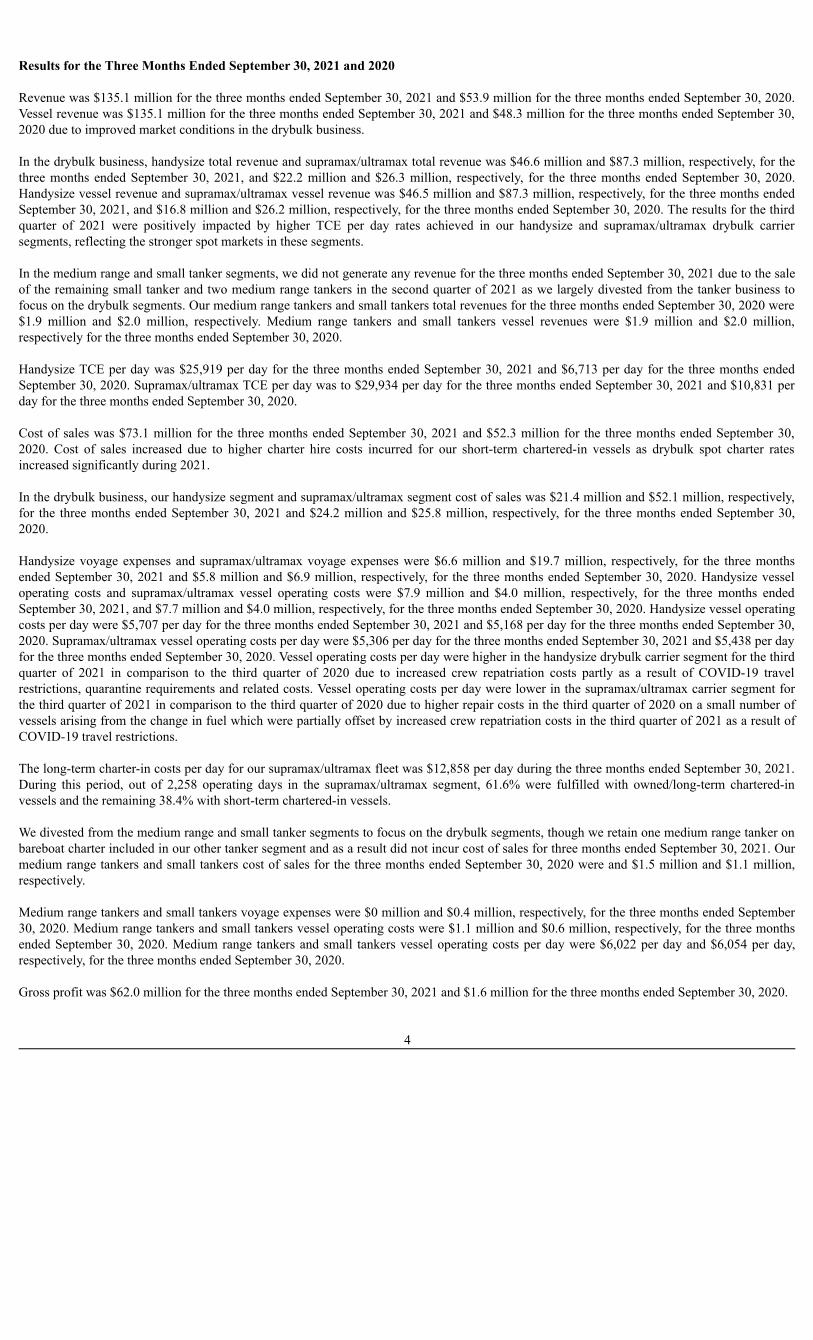
Singapore, November 17, 2021: — Grindrod Shipping Holdings Ltd. (NASDAQ: GRIN) (JSE: GSH) (“Grindrod Shipping” or “Company” or“we” or “us” or “our”), a global provider of maritime transportation services predominantly in the drybulk sector, today announced its unauditedearnings results for the three months and nine months ended September 30, 2021. Financial Highlights for the three months Ended September 30, 2021 ▪ Revenues of $135.1 million ▪ Gross profit of $62.0 million ▪ Profit for the period of $49.1 million ▪ Profit for the period attributable to owners of the Company of $44.0 million, or $2.29 per ordinary share ▪ Adjusted net income of $45.8 million, or $2.38 per ordinary share(1)
▪ Adjusted EBITDA of $69.0 million(1)
▪ Repurchased a combined total of 91,871 ordinary shares in the open market on NASDAQ and the JSE at an average price of $14.87 per
share ▪ Handysize and supramax/ultramax TCE per day of $25,919 and $29,934, respectively(1) Financial Highlights for the nine months Ended September 30, 2021 ▪ Revenues of $366.4 million ▪ Gross profit of $110.2 million ▪ Profit for the period of $76.7 million ▪ Profit for the period attributable to owners of the Company of $66.1 million, or $3.44 per ordinary share ▪ Adjusted net income of $67.3 million, or $3.50 per ordinary share(1)
▪ Adjusted EBITDA of $131.5 million(1)
▪ Repurchased a combined total of 125,338 ordinary shares in the open market on NASDAQ and the JSE at an average price of $13.16
per share. ▪ Handysize and supramax/ultramax TCE per day of $18,847 and $21,514, respectively(1)
▪ Period end cash and cash equivalents of $76.1 million and restricted cash of $9.0 million (1) Adjusted EBITDA, Adjusted net income and TCE per day are non-GAAP financial measures. For the definitions of these non-GAAP financialmeasures and the reconciliation of these measures to the most directly comparable financial measure calculated and presented in accordancewith GAAP, please refer to the definitions and reconciliations in “Non-GAAP Financial Measures” at the end of this press release.
1

Operational Highlights for the three months Ended September 30, 2021 ▪ The Company exercised its option to extend the firm charter-in period of the 2015-built supramax bulk carrier IVS Pinehurst for 11 to 13
months at $10,000/day, starting from approximately January 3, 2022. ▪ On September 1, 2021, the acquisition of the remaining 31.14% equity stake in its IVS Bulk joint venture (“IVS Bulk”) and concurrent
redemption of the IVS Bulk preference shares were concluded. ▪ On September 15, 2021, the Company amended one of its existing credit facilities to drawdown an additional $23.0 million to fund the
IVS Bulk acquisition described above. ▪ On September 16, 2021, the Company completed the acquisition of the 2019 Japanese-built ultramax bulk carrier IVS Phoenix for $23.5
million and the concurrent financing for $25.0 million. Recent Developments ▪ On November 17, 2021, the Company’s Board of Directors declared an interim quarterly cash dividend of $0.72 per ordinary share,
payable on or about December 13, 2021, to all shareholders of record as of December 3, 2021 (the “Record Date”). As of November 17,2021, there were 19,185,352 common shares of the Company outstanding (excluding treasury shares). The dividend is the first dividenddeclared under the Company’s recently announced capital return policy and represents approximately 30% of the Company’s net incomefor the third quarter of 2021, as adjusted for certain extraordinary items and after deducting the $1.4 million of shares repurchasedduring the quarter. In view of the Record Date of December 3, 2021, shareholders may not reposition shares between the JSE and the U.S. Register duringthe period from December 1, 2021, at 9.00 a.m. (South African time) until December 6, 2021at 9.00 a.m. (South African time).
▪ The Company exercised its option to extend the firm charter-in period of the 2014-built supramax bulk carrier IVS Naruo for 12 months
at $13,000/day, starting from approximately January 21, 2022. ▪ As of November 14, 2021, we have contracted the following TCE per day for the fourth quarter of 2021 (1): - Handysize: approximately 1,205 operating days(2) at an average TCE per day of approximately $30,265 - Supramax/ultramax: approximately 1,579 operating days(2) at an average TCE per day of approximately $33,102 (1) TCE per day is a non-GAAP financial measure. For the definition of this non-GAAP financial measure and the reconciliation of this measureto the most directly comparable financial measure calculated and presented in accordance with GAAP, please refer to the definitions andreconciliations in “Non-GAAP Financial Measures” at the end of this press release.(2) Operating days: the number of available days in the relevant period a vessel is controlled by us after subtracting the aggregate number ofdays that the vessel is off-hire due to a reason other than scheduled drydocking and special surveys, including unforeseen circumstances. We useoperating days to measure the aggregate number of days in a relevant period during which vessels are actually available to generate revenue.
2

CEO Commentary Martyn Wade, the Chief Executive Officer of Grindrod Shipping, commented: “During the third quarter of 2021, Grindrod Shipping achieved stronger results taking full advantage of the robust market conditions and ourexpanded owned fleet following the acquisition of the remaining portion of our IVS Bulk subsidiary. We generated Gross Profit, Profit for theperiod attributable to owners of the Company, Adjusted EBITDA and Adjusted Net Income of $62.0 million, $44.0 million, $69.0 million, and$45.8 million, respectively. We are particularly pleased to announce the declaration of our first quarterly cash dividend of $0.72 per ordinaryshare under our new dividend and capital return policy of returning approximately 30% of our Adjusted Net Income to our shareholders througha combination of share repurchase and dividends. Today, Grindrod Shipping is strategically positioned to benefit from the robust dry bulk market. With an average age of six years, our Fleetconsists of approximately 70% “Eco” vessels built predominantly in Japan, and is, we believe, among the youngest and most efficient in theindustry, with distinct commercial and operational advantages. In addition, our dynamic and flexible commercial strategy of opportunisticallychartering-in vessels at attractive rates on both long- and short-term time charters with extension options improves our ability to service our cargocontracts and realise potential earnings and profitability with contracted rates which are at levels significantly below the current spot rates. Wewere also able to generate additional revenue during the period from our short-term fleet, with several vessels that were opportunisticallychartered-in during 2020 at rates well below current spot rates. The original charters contained fixed rate extension options which continue tobenefit the profitability of the Company. Furthermore, as also disclosed, we hold purchase options for five of our long-term chartered-in vessels, below their prevailing market values,thereby presenting us with highly attractive options to grow our owned fleet. The recent acquisition and financing of the IVS Phoenix during thequarter is a prime example of the advantages and benefits of this strategy. Finally, we were pleased to complete the Company’s first capital markets secondary offering since our spin-off and listing in 2018. The Companydid not sell any shares in the offering, but it has benefited from increased daily trading liquidity, has a stronger US institutional shareholder base,and increased market float in the US, which has now reached over 37% of shares outstanding, as of October, 2021.”
3
Results for the Three Months Ended September 30, 2021 and 2020 Revenue was $135.1 million for the three months ended September 30, 2021 and $53.9 million for the three months ended September 30, 2020.Vessel revenue was $135.1 million for the three months ended September 30, 2021 and $48.3 million for the three months ended September 30,2020 due to improved market conditions in the drybulk business.
In the drybulk business, handysize total revenue and supramax/ultramax total revenue was $46.6 million and $87.3 million, respectively, for thethree months ended September 30, 2021, and $22.2 million and $26.3 million, respectively, for the three months ended September 30, 2020.Handysize vessel revenue and supramax/ultramax vessel revenue was $46.5 million and $87.3 million, respectively, for the three months endedSeptember 30, 2021, and $16.8 million and $26.2 million, respectively, for the three months ended September 30, 2020. The results for the thirdquarter of 2021 were positively impacted by higher TCE per day rates achieved in our handysize and supramax/ultramax drybulk carriersegments, reflecting the stronger spot markets in these segments. In the medium range and small tanker segments, we did not generate any revenue for the three months ended September 30, 2021 due to the saleof the remaining small tanker and two medium range tankers in the second quarter of 2021 as we largely divested from the tanker business tofocus on the drybulk segments. Our medium range tankers and small tankers total revenues for the three months ended September 30, 2020 were$1.9 million and $2.0 million, respectively. Medium range tankers and small tankers vessel revenues were $1.9 million and $2.0 million,respectively for the three months ended September 30, 2020. Handysize TCE per day was $25,919 per day for the three months ended September 30, 2021 and $6,713 per day for the three months endedSeptember 30, 2020. Supramax/ultramax TCE per day was to $29,934 per day for the three months ended September 30, 2021 and $10,831 perday for the three months ended September 30, 2020. Cost of sales was $73.1 million for the three months ended September 30, 2021 and $52.3 million for the three months ended September 30,2020. Cost of sales increased due to higher charter hire costs incurred for our short-term chartered-in vessels as drybulk spot charter ratesincreased significantly during 2021. In the drybulk business, our handysize segment and supramax/ultramax segment cost of sales was $21.4 million and $52.1 million, respectively,for the three months ended September 30, 2021 and $24.2 million and $25.8 million, respectively, for the three months ended September 30,2020. Handysize voyage expenses and supramax/ultramax voyage expenses were $6.6 million and $19.7 million, respectively, for the three monthsended September 30, 2021 and $5.8 million and $6.9 million, respectively, for the three months ended September 30, 2020. Handysize vesseloperating costs and supramax/ultramax vessel operating costs were $7.9 million and $4.0 million, respectively, for the three months endedSeptember 30, 2021, and $7.7 million and $4.0 million, respectively, for the three months ended September 30, 2020. Handysize vessel operatingcosts per day were $5,707 per day for the three months ended September 30, 2021 and $5,168 per day for the three months ended September 30,2020. Supramax/ultramax vessel operating costs per day were $5,306 per day for the three months ended September 30, 2021 and $5,438 per dayfor the three months ended September 30, 2020. Vessel operating costs per day were higher in the handysize drybulk carrier segment for the thirdquarter of 2021 in comparison to the third quarter of 2020 due to increased crew repatriation costs partly as a result of COVID-19 travelrestrictions, quarantine requirements and related costs. Vessel operating costs per day were lower in the supramax/ultramax carrier segment forthe third quarter of 2021 in comparison to the third quarter of 2020 due to higher repair costs in the third quarter of 2020 on a small number ofvessels arising from the change in fuel which were partially offset by increased crew repatriation costs in the third quarter of 2021 as a result ofCOVID-19 travel restrictions. The long-term charter-in costs per day for our supramax/ultramax fleet was $12,858 per day during the three months ended September 30, 2021.During this period, out of 2,258 operating days in the supramax/ultramax segment, 61.6% were fulfilled with owned/long-term chartered-invessels and the remaining 38.4% with short-term chartered-in vessels.
We divested from the medium range and small tanker segments to focus on the drybulk segments, though we retain one medium range tanker onbareboat charter included in our other tanker segment and as a result did not incur cost of sales for three months ended September 30, 2021. Ourmedium range tankers and small tankers cost of sales for the three months ended September 30, 2020 were and $1.5 million and $1.1 million,respectively. Medium range tankers and small tankers voyage expenses were $0 million and $0.4 million, respectively, for the three months ended September30, 2020. Medium range tankers and small tankers vessel operating costs were $1.1 million and $0.6 million, respectively, for the three monthsended September 30, 2020. Medium range tankers and small tankers vessel operating costs per day were $6,022 per day and $6,054 per day,respectively, for the three months ended September 30, 2020. Gross profit was $62.0 million for the three months ended September 30, 2021 and $1.6 million for the three months ended September 30, 2020.
4
Other operating income (expense) was operating income of $0.4 million for the three months ended September 30, 2021 and operating expenseof $6.3 million for the three months ended September 30, 2020. Other operating expense in the third quarter of 2020 related to impairments onships recognized in this period in 2020 and no impairments on ships were recognized in the comparative period of 2021.
Administrative expense was $10.9 million for the three months ended September 30, 2021 and $6.0 million for the three months endedSeptember 30, 2020. Administrative expense increased in the third quarter of 2021 as compared to the third quarter of 2020 due to increased staffcosts. Interest income was $0.1 million for the three months ended September 30, 2021 and $0.1 million for the three months ended September 30,2020. Interest expense was $2.4 million for the three months ended September 30, 2021 and $3.9 million for the three months ended September 30,2020. Interest expense decreased in the third quarter of 2021 as compared to the third quarter of 2020 due to a decrease in LIBOR and therepayment of the mezzanine loan that was priced at a relatively higher interest rate. Income tax benefit was $0.0 million for the three months ended September 30, 2021 and was $0.1 million for the three months ended September30, 2020. Profit for the three months ended September 30, 2021 was $49.1 million compared to a loss of $14.7 million for the three months endedSeptember 30, 2020. Profit attributable to owners of the Company for the three months ended September 30, 2021 was $44.0 million comparedto a loss of $14.3 million for the three months ended September 30, 2020.
5

Results for the Nine Months Ended September 30, 2021 and 2020 Revenue was $366.4 million for the nine months ended September 30, 2021 and $221.1 million for the nine months ended September 30, 2020.Vessel revenue was $316.0 million for the nine months ended September 30, 2021 and $176.3 million for the nine months ended September 30,2020. The results for the first nine months of 2021 were positively impacted by higher TCE per day rates achieved in our handysize andsupramax/ultramax drybulk business, reflecting the stronger spot markets in these segments, and relatively lower TCE per day rates achieved inour medium range tanker and small tanker segments for the first two quarters of the year, reflecting the weaker spot market in this segment. Shipsale revenue was marginally higher for the nine months of 2021 compared to the nine months of 2020.
In the drybulk business, handysize total revenue and supramax/ultramax total revenue was $107.6 million and $201.7 million, respectively, forthe nine months ended September 30, 2021, and $60.8 million and $90.0 million, respectively, for the nine months ended September 30, 2020.Handysize vessel revenue and supramax/ultramax vessel revenue was $107.2 million and $201.7 million, respectively, for the nine months endedSeptember 30, 2021, and $55.1 million and $89.8 million, respectively, for the nine months ended September 30, 2020. In the tankers business, our medium range tankers and small tankers total revenues were $44.4 million and $8.2 million, respectively, for the ninemonths ended September 30, 2021, and $51.1 million and $14.6 million, respectively, for the nine months ended September 30, 2020. Mediumrange tankers and small tankers vessel revenues were $1.8 million and $1.3 million, respectively, for the nine months ended September 30, 2021and $22.3 million and $5.5 million, respectively for the nine months ended September 30, 2020. Handysize TCE per day was $18,847 per day for the nine months ended September 30, 2021 and $6,079 per day for the nine months endedSeptember 30, 2020. Supramax/ultramax TCE per day was to $21,514 per day for the nine months ended September 30, 2021 and $9,717 per dayfor the nine months ended September 30, 2020. Medium range tankers TCE per day was $8,268 per day for the nine months ended September 30, 2021 and $17,857 per day for the nine monthsended September 30, 2020. Small tankers TCE per day was $8,648 per day for the nine months ended September 30, 2021 and $13,118 per dayfor the nine months ended September 30, 2020. Cost of sales was $256.2 million for the nine months ended September 30, 2021 and $210.6 million for the nine months ended September 30,2020. Cost of sales increased due to the higher short-term charter hire costs as drybulk spot charter rates increased in the first nine months of2021 as well as increased cost of ship sales as two medium range tankers and a small tanker were sold in 2021 compared to the sale of two oldermedium range tankers, one small tanker and an older handysize bulker with lower cost prices in 2020. In the drybulk business, our handysize segment and supramax/ultramax segment cost of sales was $63.0 million and $141.0 million, respectively,for the nine months ended September 30, 2021 and $67.4 million and $89.1 million, respectively, for the nine months ended September 30, 2020. Handysize voyage expenses and supramax/ultramax voyage expenses were $20.7 million and $48.4 million, respectively, for the nine monthsended September 30, 2021 and $24.5 million and $37.9 million, respectively, for the nine months ended September 30, 2020. Handysize vesseloperating costs and supramax/ultramax vessel operating costs were $23.1 million and $11.5 million, respectively, for the nine months endedSeptember 30, 2021, and $21.0 million and $9.7 million, respectively, for the nine months ended September 30, 2020. Handysize vessel operatingcosts per day were $5,638 per day for the nine months ended September 30, 2021 and $4,935 per day for the nine months ended September 30,2020. Supramax/ultramax vessel operating costs per day were $5,244 per day for the nine months ended September 30, 2021 and $4,955 per dayfor the nine months ended September 30, 2020. Vessel operating costs per day were higher in the handysize and supramax/ultramax drybulkcarrier segments for the first nine months of 2021 in comparison to the first nine months of 2020 due to increased crew repatriation costs partly asa result of COVID-19 travel restrictions, quarantine requirements and related costs. The long-term charter-in costs per day for our supramax/ultramax fleet was $12,690 per day during the first nine months of 2021. During thisperiod, out of 7,122 operating days in the supramax/ultramax segment, 58.8% were fulfilled with owned/long-term chartered-in vessels and theremaining 41.2% with short-term chartered-in vessels.
In the tankers business, medium range tankers and small tankers cost of sales were $44.8 million and $8.3 million, respectively, for the ninemonths ended September 30, 2021 and $42.5 million and $13.0 million, respectively, for the nine months ended September 30, 2020. Medium range tankers voyage expenses and small tankers voyage expenses were $0.0 million and $0.4 million, respectively, for the nine monthsended September 30, 2021 and $0.0 million and $1.3 million, respectively, for the nine months ended September 30, 2020. Medium range tankersvessel operating costs and small tankers vessel operating costs were $1.4 million and $0.6 million, respectively, for the nine months endedSeptember 30, 2021 and $5.8 million and $2.1 million, respectively, for the nine months ended September 30, 2020. Medium range tankers vesseloperating costs per day were $6,634 per day for the nine months ended September 30, 2021 and $6,530 per day for the nine months endedSeptember 30, 2020. Small tankers vessel operating costs per day were $5,895 per day for the nine months ended September 30, 2021 and $6,288per day for the nine months ended September 30, 2020.
6

Gross profit was $110.2 million for the nine months ended September 30, 2021 and $10.5 million for the nine months ended September 30, 2020.
Other operating income (expense) was an income of $0.8 million for the nine months ended September 30, 2021 and an expense of $4.1 millionfor the nine months ended September 30, 2020. Other operating income increased in the first nine months of 2021 as compared to the first ninemonths of 2020. The reversals of impairments on ships and on right-of-use assets were partly offset by higher impairments on goodwill andintangibles, financial assets and the disposal group for the nine months ended September 30, 2021, compared to impairment losses on ships thatwere partially offset by exchange rate gains in the nine months ended September 30, 2020.
Administrative expense was $26.6 million for the nine months ended September 30, 2021 and $18.2 million for the nine months endedSeptember 30, 2020. Administrative expense increased in the first nine months of 2021 as compared to the first nine months of 2020 due toincreased staff costs.
Share of losses of joint ventures was $0.0 million for the nine months ended September 30, 2021 and a loss of 2.6 million for the nine monthsended September 30, 2020.
Interest income was $0.2 million for the nine months ended September 30, 2021 and $0.5 million for the nine months ended September 30, 2020. Interest expense was $10.2 million for the nine months ended September 30, 2021 and $12.5 million for the nine months ended September 30,2020. Interest expense decreased in the first nine months of 2021 as compared to the first nine months of 2020 due to a decrease in LIBOR andthe repayment of the mezzanine loan that was priced at a relatively higher interest rate. Income tax benefit (expense) was a benefit of $2.4 million for the nine months ended September 30, 2021 and an expense of $0.5 million for thenine months ended September 30, 2020. The income tax benefit increased in the first nine months of 2021 as compared to the first nine months of2020 due to the reversal of a provision for a tax-related legal case which was decided in our favor. Profit for the nine months ended September 30, 2021 was $76.7 million and a loss of $27.0 million for the nine months ended September 30,2020. Profit attributable to owners of the Company for the nine months ended September 30, 2021 was $66.1 million and a loss of $24.8 millionfor the nine months ended September 30, 2020. Net cash flows generated from operating activities was an inflow of $136.6 million for the nine months ended September 30, 2021 and $56.6million for the nine months ended September 30, 2020. Net cash used in investing activities was an outflow of $46.3 million for the nine monthsended September 30, 2021 and $25.5 million for the nine months ended September 30, 2020. Net cash flows used in financing activities was anoutflow of $51.8 million for the nine months ended September 30, 2021 and $28.7 million for the nine months ended September 30, 2020. As of September 30, 2021, we had cash and equivalents of $76.1 million and restricted cash of $9.0 million.
7

Conference Call details Tomorrow, Thursday, November 18, 2021, at 8:00 a.m. Eastern Time/ 3:00 p.m. South African Time/ 9:00 p.m. Singapore Time, the Company'smanagement will host a conference call and webcast to discuss the earnings results. Conference Call details: Participants should dial into the call 10 minutes before the scheduled time using the following numbers: +1 877 5539962 (US Toll Free Dial In), +0808 238 0669 (UK Toll Free Dial In), +65 3158 5482 (Singapore Dial In), or +27 10 5003039 (South Africa DialIn), +44 (0) 2071 928592 (International Standard Dial In). Please quote “Grindrod” to the operator. Slides and Audio Webcast / Slides Presentation details There will be a live, and then archived webcast of the conference call and accompanying slides, accessible through the Grindrod Shippingwebsite www.grinshipping.com (click on Notices & Events). The slide presentation of the third quarter 2021 financial results will be accessiblein PDF format 10 minutes prior to the conference call and webcast. Participants to the live webcast should register on the website approximately10 minutes prior to the start of the webcast. About Grindrod Shipping Grindrod Shipping owns and operates a diversified fleet of owned, long-term and short-term chartered-in drybulk vessels predominantly in thehandysize and supramax/ultramax segments. The drybulk business, which operates under the brand “Island View Shipping” (“IVS”) includes aFleet of 31 vessels consisting of 15 handysize drybulk carriers and 16 supramax/ultramax drybulk carriers. The company also owns one mediumrange tanker on bareboat charter. The Company is based in Singapore, with offices in London, Durban, Tokyo, Cape Town and Rotterdam.Grindrod Shipping is listed on NASDAQ under the ticker “GRIN” and on the JSE under the ticker “GSH”.
8
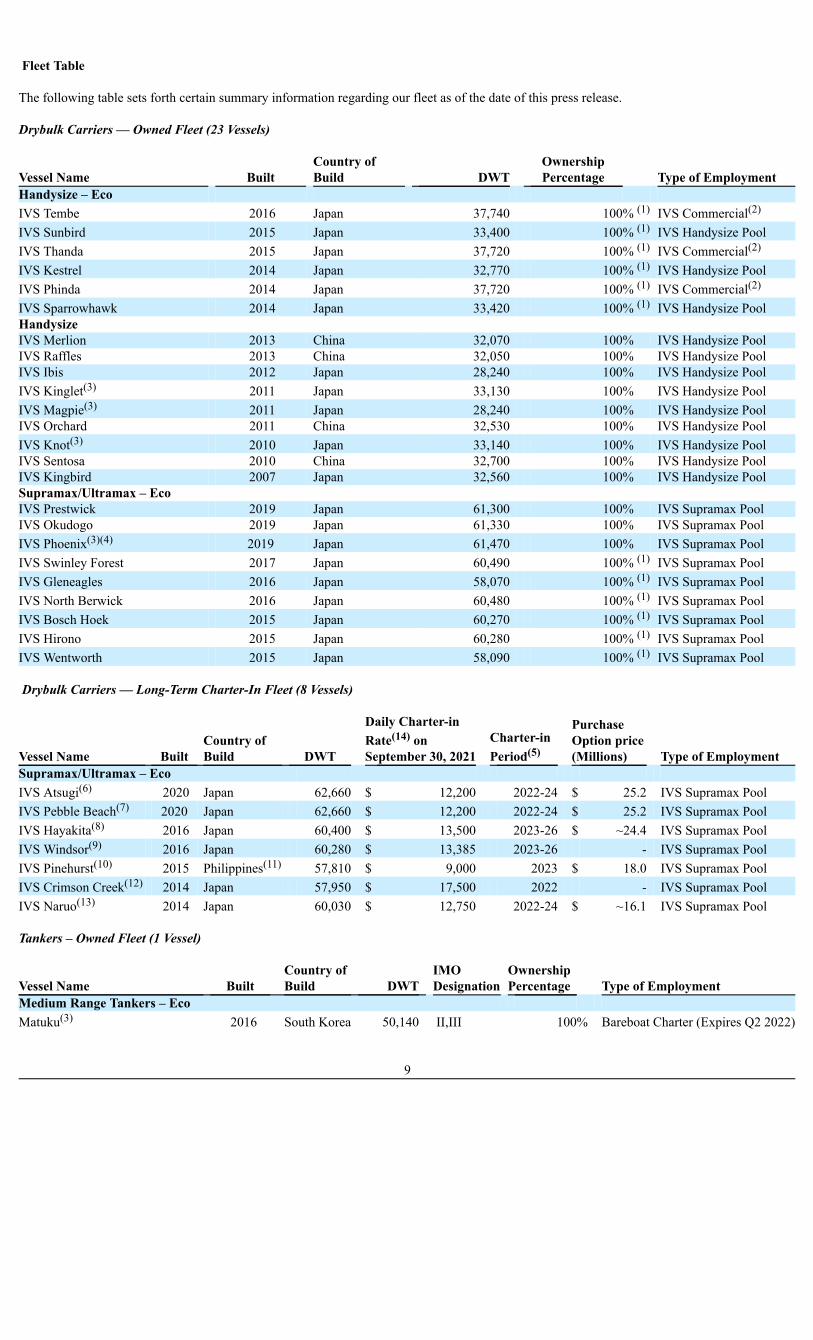
Fleet Table The following table sets forth certain summary information regarding our fleet as of the date of this press release. Drybulk Carriers — Owned Fleet (23 Vessels)
Vessel Name Built Country of Build DWT
OwnershipPercentage Type of Employment
Handysize – Eco IVS Tembe 2016 Japan 37,740 100% (1) IVS Commercial(2)
IVS Sunbird 2015 Japan 33,400 100% (1) IVS Handysize PoolIVS Thanda 2015 Japan 37,720 100% (1) IVS Commercial(2)
IVS Kestrel 2014 Japan 32,770 100% (1) IVS Handysize PoolIVS Phinda 2014 Japan 37,720 100% (1) IVS Commercial(2)
IVS Sparrowhawk 2014 Japan 33,420 100% (1) IVS Handysize PoolHandysize IVS Merlion 2013 China 32,070 100% IVS Handysize PoolIVS Raffles 2013 China 32,050 100% IVS Handysize PoolIVS Ibis 2012 Japan 28,240 100% IVS Handysize PoolIVS Kinglet(3) 2011 Japan 33,130 100% IVS Handysize PoolIVS Magpie(3) 2011 Japan 28,240 100% IVS Handysize PoolIVS Orchard 2011 China 32,530 100% IVS Handysize PoolIVS Knot(3) 2010 Japan 33,140 100% IVS Handysize PoolIVS Sentosa 2010 China 32,700 100% IVS Handysize PoolIVS Kingbird 2007 Japan 32,560 100% IVS Handysize PoolSupramax/Ultramax – Eco IVS Prestwick 2019 Japan 61,300 100% IVS Supramax PoolIVS Okudogo 2019 Japan 61,330 100% IVS Supramax PoolIVS Phoenix(3)(4) 2019 Japan 61,470 100% IVS Supramax PoolIVS Swinley Forest 2017 Japan 60,490 100% (1) IVS Supramax PoolIVS Gleneagles 2016 Japan 58,070 100% (1) IVS Supramax PoolIVS North Berwick 2016 Japan 60,480 100% (1) IVS Supramax PoolIVS Bosch Hoek 2015 Japan 60,270 100% (1) IVS Supramax PoolIVS Hirono 2015 Japan 60,280 100% (1) IVS Supramax PoolIVS Wentworth 2015 Japan 58,090 100% (1) IVS Supramax Pool Drybulk Carriers — Long-Term Charter-In Fleet (8 Vessels)
Vessel Name Built Country ofBuild DWT
Daily Charter-inRate(14) onSeptember 30, 2021
Charter-in Period(5)
PurchaseOption price (Millions) Type of Employment
Supramax/Ultramax – Eco IVS Atsugi(6) 2020 Japan 62,660 $ 12,200 2022-24 $ 25.2 IVS Supramax PoolIVS Pebble Beach(7) 2020 Japan 62,660 $ 12,200 2022-24 $ 25.2 IVS Supramax PoolIVS Hayakita(8) 2016 Japan 60,400 $ 13,500 2023-26 $ ~24.4 IVS Supramax PoolIVS Windsor(9) 2016 Japan 60,280 $ 13,385 2023-26 - IVS Supramax PoolIVS Pinehurst(10) 2015 Philippines(11) 57,810 $ 9,000 2023 $ 18.0 IVS Supramax PoolIVS Crimson Creek(12) 2014 Japan 57,950 $ 17,500 2022 - IVS Supramax PoolIVS Naruo(13) 2014 Japan 60,030 $ 12,750 2022-24 $ ~16.1 IVS Supramax Pool Tankers – Owned Fleet (1 Vessel)
Vessel Name Built Country ofBuild DWT
IMODesignation
OwnershipPercentage Type of Employment
Medium Range Tankers – Eco Matuku(3) 2016 South Korea 50,140 II,III 100% Bareboat Charter (Expires Q2 2022)
9

(1) 100% ownership interest following the acquisition of the remaining interest in IVS Bulk (a subsidiary) on September 1, 2021.(2) Commercially managed by Grindrod Shipping alongside the IVS Handysize Pool.(3) IVS Knot, IVS Kinglet, IVS Magpie, Matuku and IVS Phoenix have each undergone separate financing arrangements in which we sold
these vessels but retained the right to control the use of these vessels for a period up to 2030, 2031, 2031, 2035 and 2036, respectively,and we have an option to acquire IVS Knot, IVS Kinglet and IVS Magpie commencing in 2021, the Matuku in 2022 and the IVS Phoenixin 2023. We regard the vessels as owned since we have retained the right to control the use of the vessels.
(4) The vessel was acquired from its owners on September 16, 2021.(5) Expiration date range represents the earliest and latest re-delivery periods due to extension options.(6) Chartered-in until Q4 2022 with two one-year options to extend, at charter-in rates of $12,950 per day for the first extension year and
$13,700 per day for the second extension year. The purchase option is exercisable beginning in Q4 2022 subject to contract terms andconditions.
(7) Chartered-in until Q3 2022 with two one-year options to extend, at charter-in rates of $12,950 per day for the first extension year and$13,700 per day for the second extension year. The purchase option is exercisable beginning in Q3 2022 subject to conditions.
(8) Chartered-in until Q3 2023 with two one-year options to extend and one nine-month option to extend, at charter-in rates of $14,000 perday for the first extension year, $14,500 per day for the second extension year, and $14,800 per day for the following nine-monthextension period. The purchase option is exercisable next in Q3 2022 subject to contract terms and conditions and includes an estimatedJapanese Yen denominated component but excludes estimated 50/50 profit sharing with vessel owner. The Japanese Yen component hasbeen converted to at a rate of 112 Yen to $1.
(9) Chartered-in until Q3 2023 with two one-year options to extend and one nine-month option to extend, at charter-in rates of $13,885 perday for the first extension year, $14,385 per day for the second extension year, and $14,885 per day for the following nine-monthextension period.
(10) Chartered-in at $9,000 per day until January 3, 2022, and thereafter at $10,000 per day until Q1 2023. The purchase option isexercisable at any time prior to Q4 2022 subject to contract terms and conditions.
(11) Constructed at Tsuneishi Cebu Shipyard, a subsidiary of Tsuneishi Shipbuilding of Japan.(12) Chartered-in at 101% of the BSI-58 index with a floor of $8,500 per day and ceiling of $17,500 per day until Q2 2022. In the current
market the ceiling rate of $17,500 is applicable.(13) Chartered-in until January 21, 2022 at $12,750 with three one-year options to extend at $13,000 per day for each extension year. The
first extension year was exercised and the second extension period will be exercisable beginning Q4 2022. The purchase option isexercisable next in Q4 2022 subject to contract terms and conditions and includes an estimated Japanese Yen denominated componentwhich has been converted to at a rate of 112 Yen to $1.
(14) Charter-in rate: The basic payment to the charterer for the use of the vessel under time charter. The amount is usually for a fixed periodof time at rates that are generally fixed, but may contain a variable component based on inflation, interest rates, or current shippingmarket rates. The rate does not include any additional costs that are specified in the contract such as address commission, brokeragecosts and victualing costs.
Unaudited Segment Information(1)
Three months ended
September 30, Nine months ended
September 30, (In thousands of U.S. dollars) 2021 2020 2021 2020 Drybulk Carriers Business Handysize Segment Revenue $ 46,551 $ 22,190 $ 107,617 $ 60,830 Cost of sales (21,403) (24,227) (62,989) (67,363)Supramax/Ultramax Segment Revenue $ 87,253 $ 26,273 $ 201,720 $ 90,031 Cost of sales (52,108) (25,757) (141,049) (89,074) Tanker Business Medium Range Tanker Segment Revenue $ - $ 1,898 $ 44,410 $ 51,101 Cost of sales - (1,454) (44,838) (42,501)Small Tanker Segment Revenue $ - $ 2,015 $ 8,150 $ 14,616 Cost of sales - (1,075) (8,295) (13,041) (1) Segment information includes the proportionate share of joint ventures, which differs from the consolidated statements of profit or loss in
our unaudited interim condensed consolidated financial statements which account for our investments in joint ventures under the equitymethod.
10
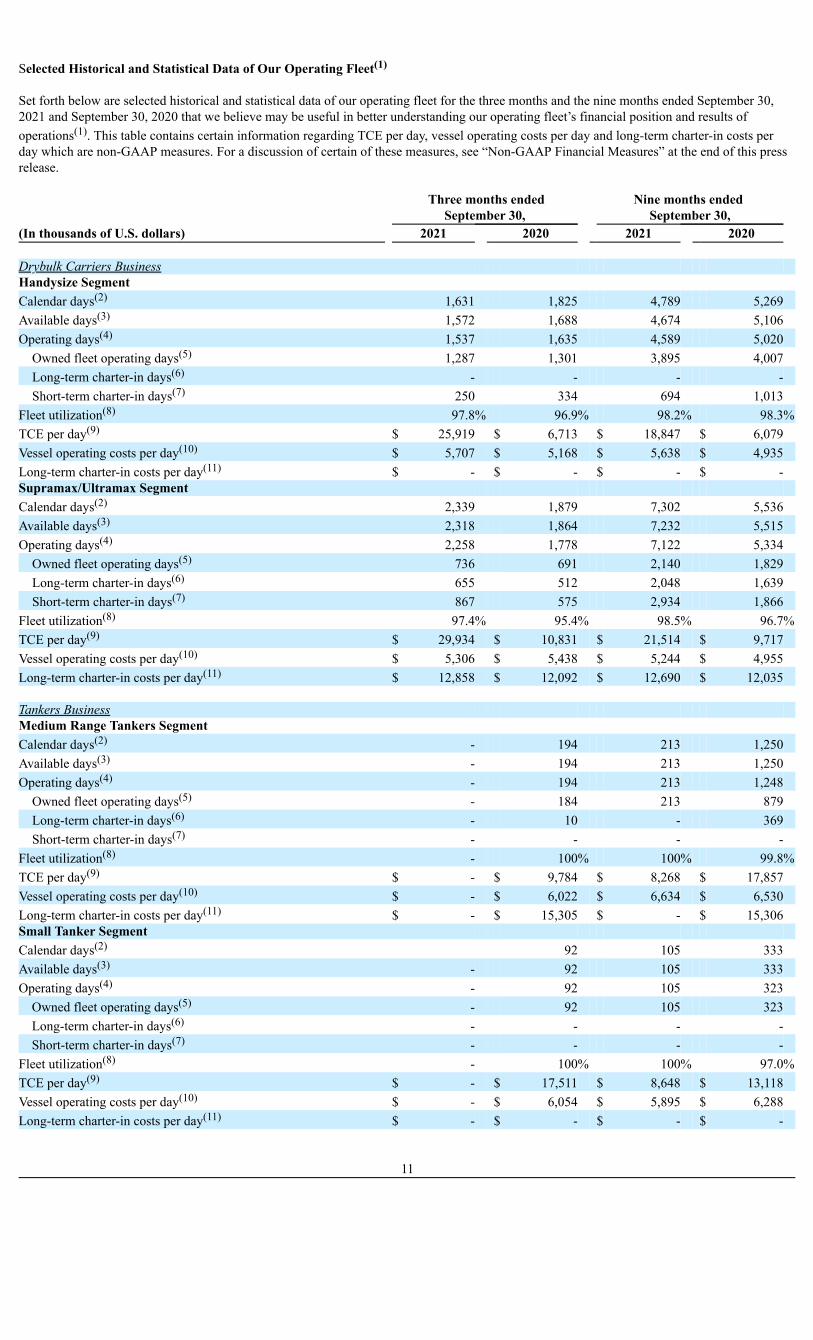
Selected Historical and Statistical Data of Our Operating Fleet(1)
Set forth below are selected historical and statistical data of our operating fleet for the three months and the nine months ended September 30,2021 and September 30, 2020 that we believe may be useful in better understanding our operating fleet’s financial position and results ofoperations(1). This table contains certain information regarding TCE per day, vessel operating costs per day and long-term charter-in costs perday which are non-GAAP measures. For a discussion of certain of these measures, see “Non-GAAP Financial Measures” at the end of this pressrelease.
Three months ended
September 30, Nine months ended
September 30, (In thousands of U.S. dollars) 2021 2020 2021 2020 Drybulk Carriers Business Handysize Segment Calendar days(2) 1,631 1,825 4,789 5,269 Available days(3) 1,572 1,688 4,674 5,106 Operating days(4) 1,537 1,635 4,589 5,020
Owned fleet operating days(5) 1,287 1,301 3,895 4,007 Long-term charter-in days(6) - - - - Short-term charter-in days(7) 250 334 694 1,013
Fleet utilization(8) 97.8% 96.9% 98.2% 98.3%TCE per day(9) $ 25,919 $ 6,713 $ 18,847 $ 6,079 Vessel operating costs per day(10) $ 5,707 $ 5,168 $ 5,638 $ 4,935 Long-term charter-in costs per day(11) $ - $ - $ - $ - Supramax/Ultramax Segment Calendar days(2) 2,339 1,879 7,302 5,536 Available days(3) 2,318 1,864 7,232 5,515 Operating days(4) 2,258 1,778 7,122 5,334
Owned fleet operating days(5) 736 691 2,140 1,829 Long-term charter-in days(6) 655 512 2,048 1,639 Short-term charter-in days(7) 867 575 2,934 1,866
Fleet utilization(8) 97.4% 95.4% 98.5% 96.7%TCE per day(9) $ 29,934 $ 10,831 $ 21,514 $ 9,717 Vessel operating costs per day(10) $ 5,306 $ 5,438 $ 5,244 $ 4,955 Long-term charter-in costs per day(11) $ 12,858 $ 12,092 $ 12,690 $ 12,035 Tankers Business Medium Range Tankers Segment Calendar days(2) - 194 213 1,250 Available days(3) - 194 213 1,250 Operating days(4) - 194 213 1,248
Owned fleet operating days(5) - 184 213 879 Long-term charter-in days(6) - 10 - 369 Short-term charter-in days(7) - - - -
Fleet utilization(8) - 100% 100% 99.8%TCE per day(9) $ - $ 9,784 $ 8,268 $ 17,857 Vessel operating costs per day(10) $ - $ 6,022 $ 6,634 $ 6,530 Long-term charter-in costs per day(11) $ - $ 15,305 $ - $ 15,306 Small Tanker Segment Calendar days(2) 92 105 333 Available days(3) - 92 105 333 Operating days(4) - 92 105 323
Owned fleet operating days(5) - 92 105 323 Long-term charter-in days(6) - - - - Short-term charter-in days(7) - - - -
Fleet utilization(8) - 100% 100% 97.0%TCE per day(9) $ - $ 17,511 $ 8,648 $ 13,118 Vessel operating costs per day(10) $ - $ 6,054 $ 5,895 $ 6,288 Long-term charter-in costs per day(11) $ - $ - $ - $ -
11

(1) Segment results of operations include the proportionate share of joint ventures, which differs from the consolidated statements of profitor loss in our unaudited interim condensed consolidated financial statements which account for our investments in joint ventures underthe equity method.
(2) Calendar days: total calendar days the vessels were in our possession for the relevant period. (3) Available days: total number of calendar days a vessel is in our possession for the relevant period after subtracting off-hire days for
scheduled drydocking and special surveys. We use available days to measure the number of days in a relevant period during whichvessels should be available for generating revenue.
(4) Operating days: the number of available days in the relevant period a vessel is controlled by us after subtracting the aggregate number
of days that the vessel is off-hire due to a reason other than scheduled drydocking and special surveys, including unforeseencircumstances. We use operating days to measure the aggregate number of days in a relevant period during which vessels are actuallyavailable to generate revenue. Comparability of operating days was affected by the consolidation of the IVS Bulk vessels in February2020.
(5) Owned fleet operating days: the number of operating days in which our owned fleet is operating for the relevant period. (6) Long-term charter-in days: the number of operating days in which our long-term charter-in fleet is operating for the relevant period. We
regard chartered-in vessels as long-term charters if the period of the charter we initially commit to is 12 months or more. Once we haveincluded such chartered-in vessels in our fleet, we will continue to regard them as part of our fleet until the end of their chartered-inperiod, including any period that the charter has been extended under an option, even if at a given time the remaining period of theircharter may be less than 12 months.
(7) Short-term charter-in days: the number of operating days for which we have chartered-in third party vessels for durations of less than
one year for the relevant period. (8) Fleet utilization: the percentage of time that vessels are available for generating revenue, determined by dividing the number of
operating days during a relevant period by the number of available days during that period. We use fleet utilization to measure acompany’s efficiency in technically managing its vessels.
(9) TCE per day: vessel revenue less voyage expenses during a relevant period divided by the number of operating days during the period.
The number of operating days used to calculate TCE revenue per day includes the proportionate share of our joint ventures’ operatingdays and includes charter-in days. Please see “Non-GAAP Financial Measures” at the end of this press release for a discussion of TCErevenue and a reconciliation of revenue to TCE revenue.
(10) Vessel operating costs per day: vessel operating costs per day represents vessel operating costs divided by the number of calendar days
for owned vessels. The vessel operating costs and the number of calendar days used to calculate vessel operating costs per day includesthe proportionate share of our joint ventures’ vessel operating costs and calendar days and excludes charter-in costs and charter-in days.Please see “Non-GAAP Financial Measures” at the end of this press release for a discussion of vessel operating costs per day.
(11) Long-term charter-in costs per day: charter costs associated with long-term chartered-in vessels divided by long-term charter-in days for
the relevant period. Please see “Non-GAAP Financial Measures” at the end of this press release for a discussion of long-term charter-incosts and its reconciliation to adjusted charter hire costs. That discussion also shows an analysis of adjusted charter hire costs splitbetween long-term charter-in costs and short-term charter-in costs. The average long-term charter-in costs per day for the supramax/ultramax fleet for the fourth quarter of 2021 is expected to beapproximately $12,890/day.
12

Unaudited Interim Condensed Consolidated Statement of Financial Position
30 September
2021 31 December
2020 US$’000 US$’000
ASSETS Current assets Cash and bank balances 78,455 41,261 Trade receivables 8,781 7,928 Contract assets 3,410 900 Other receivables and prepayments 21,410 18,740 Due from joint ventures - 1 Loans to joint ventures 798 798 Derivative financial instruments 5,831 458 Inventories 12,625 8,700 131,310 78,786 Assets classified as held for sale - 3,825 Total current assets 131,310 82,611 Non-current assets Restricted cash 6,649 9,304 Ships, property, plant and equipment 442,492 475,303 Right-of-use assets 41,151 49,062 Interest in joint ventures 15 166 Derivative financial instruments 718 - Intangible assets 269 405 Goodwill - 960 Other receivables and prepayments 157 - Other investments 3,040 3,150 Deferred tax assets 1,244 1,138 Total non-current assets 495,735 539,488 Total assets 627,045 622,099 LIABILITIES AND EQUITY Current liabilities Trade and other payables 31,490 27,355 Contract liabilities 7,416 5,094 Due to joint ventures 4 - Lease liabilities 32,486 28,120 Bank loans and other borrowings 27,705 53,394 Retirement benefit obligation 147 - Derivative financial instruments 168 - Provisions 1,612 80 Income tax payable 772 3,350 101,800 117,393 Liabilities directly associated with assets classified as held for sale - 508 Total current liabilities 101,800 117,901
13
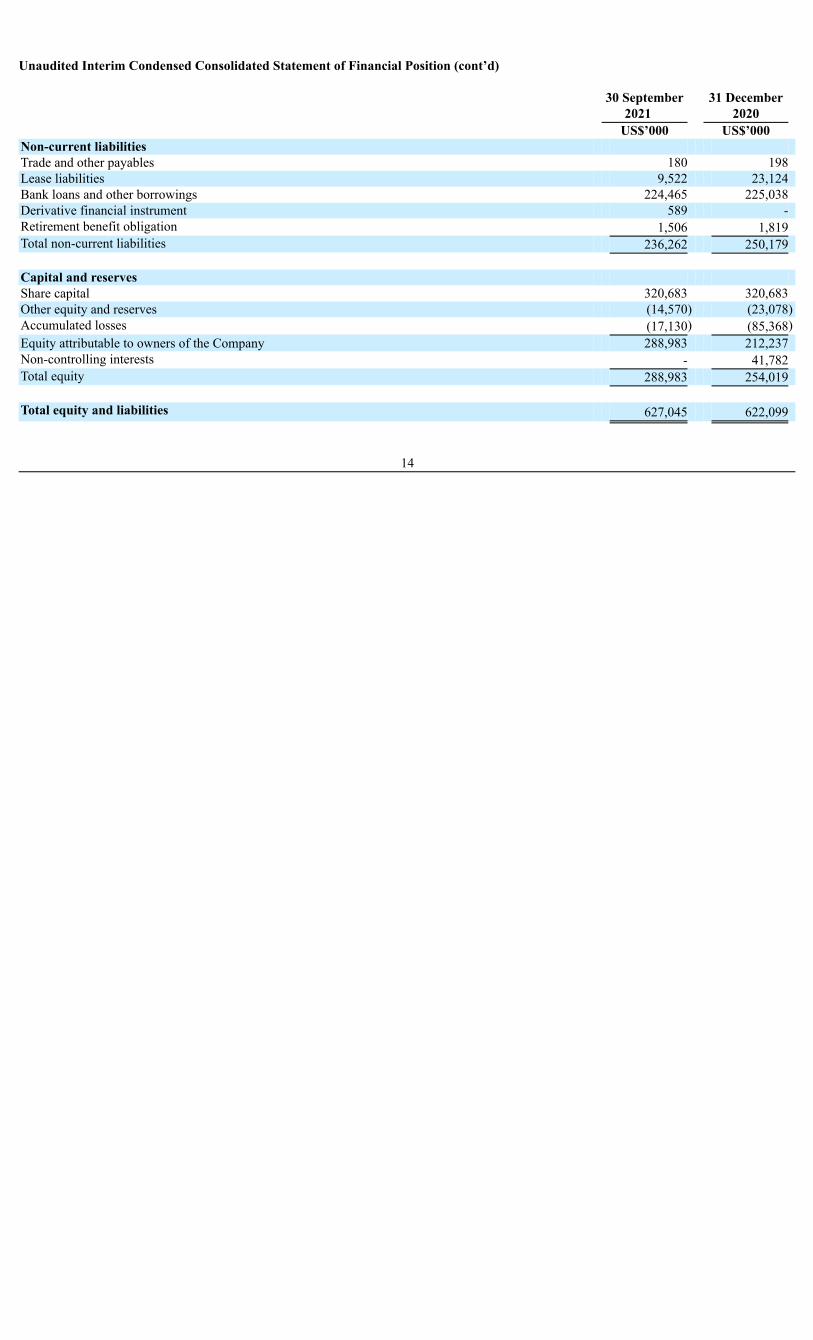
Unaudited Interim Condensed Consolidated Statement of Financial Position (cont’d)
30 September
2021 31 December
2020 US$’000 US$’000
Non-current liabilities Trade and other payables 180 198 Lease liabilities 9,522 23,124 Bank loans and other borrowings 224,465 225,038 Derivative financial instrument 589 - Retirement benefit obligation 1,506 1,819 Total non-current liabilities 236,262 250,179 Capital and reserves Share capital 320,683 320,683 Other equity and reserves (14,570) (23,078)Accumulated losses (17,130) (85,368)Equity attributable to owners of the Company 288,983 212,237 Non-controlling interests - 41,782 Total equity 288,983 254,019 Total equity and liabilities 627,045 622,099
14
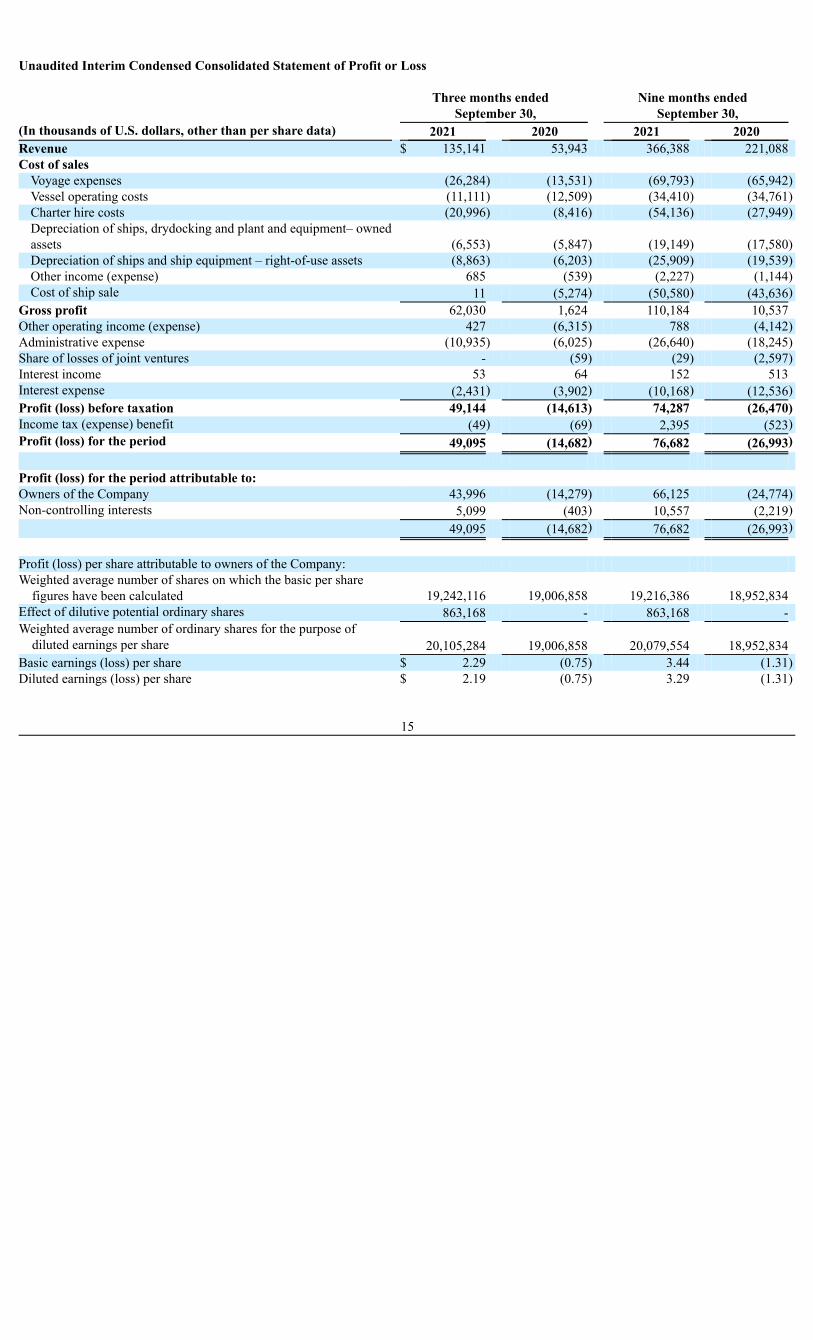
Unaudited Interim Condensed Consolidated Statement of Profit or Loss
Three months ended
September 30, Nine months ended
September 30, (In thousands of U.S. dollars, other than per share data) 2021 2020 2021 2020 Revenue $ 135,141 53,943 366,388 221,088 Cost of sales
Voyage expenses (26,284) (13,531) (69,793) (65,942)Vessel operating costs (11,111) (12,509) (34,410) (34,761)Charter hire costs (20,996) (8,416) (54,136) (27,949)Depreciation of ships, drydocking and plant and equipment– ownedassets (6,553) (5,847) (19,149) (17,580)Depreciation of ships and ship equipment – right-of-use assets (8,863) (6,203) (25,909) (19,539)Other income (expense) 685 (539) (2,227) (1,144)Cost of ship sale 11 (5,274) (50,580) (43,636)
Gross profit 62,030 1,624 110,184 10,537 Other operating income (expense) 427 (6,315) 788 (4,142)Administrative expense (10,935) (6,025) (26,640) (18,245)Share of losses of joint ventures - (59) (29) (2,597)Interest income 53 64 152 513 Interest expense (2,431) (3,902) (10,168) (12,536)Profit (loss) before taxation 49,144 (14,613) 74,287 (26,470)Income tax (expense) benefit (49) (69) 2,395 (523)Profit (loss) for the period 49,095 (14,682) 76,682 (26,993) Profit (loss) for the period attributable to: Owners of the Company 43,996 (14,279) 66,125 (24,774)Non-controlling interests 5,099 (403) 10,557 (2,219) 49,095 (14,682) 76,682 (26,993) Profit (loss) per share attributable to owners of the Company: Weighted average number of shares on which the basic per share
figures have been calculated 19,242,116 19,006,858 19,216,386 18,952,834 Effect of dilutive potential ordinary shares 863,168 - 863,168 - Weighted average number of ordinary shares for the purpose of
diluted earnings per share 20,105,284 19,006,858 20,079,554 18,952,834 Basic earnings (loss) per share $ 2.29 (0.75) 3.44 (1.31)Diluted earnings (loss) per share $ 2.19 (0.75) 3.29 (1.31)
15
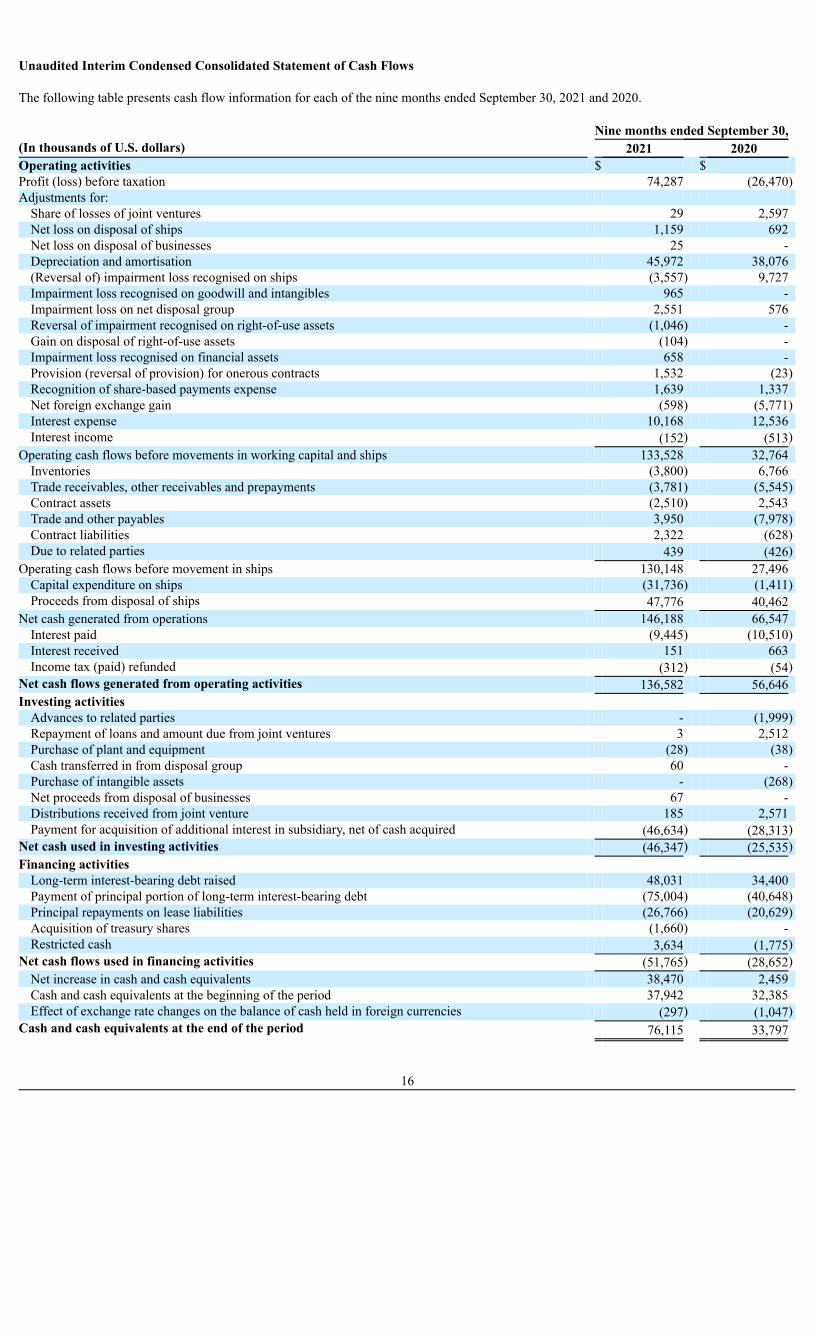
Unaudited Interim Condensed Consolidated Statement of Cash Flows The following table presents cash flow information for each of the nine months ended September 30, 2021 and 2020. Nine months ended September 30, (In thousands of U.S. dollars) 2021 2020 Operating activities $ $ Profit (loss) before taxation 74,287 (26,470)Adjustments for:
Share of losses of joint ventures 29 2,597 Net loss on disposal of ships 1,159 692 Net loss on disposal of businesses 25 - Depreciation and amortisation 45,972 38,076 (Reversal of) impairment loss recognised on ships (3,557) 9,727 Impairment loss recognised on goodwill and intangibles 965 - Impairment loss on net disposal group 2,551 576 Reversal of impairment recognised on right-of-use assets (1,046) - Gain on disposal of right-of-use assets (104) - Impairment loss recognised on financial assets 658 - Provision (reversal of provision) for onerous contracts 1,532 (23)Recognition of share-based payments expense 1,639 1,337 Net foreign exchange gain (598) (5,771)Interest expense 10,168 12,536 Interest income (152) (513)
Operating cash flows before movements in working capital and ships 133,528 32,764 Inventories (3,800) 6,766 Trade receivables, other receivables and prepayments (3,781) (5,545)Contract assets (2,510) 2,543 Trade and other payables 3,950 (7,978)Contract liabilities 2,322 (628)Due to related parties 439 (426)
Operating cash flows before movement in ships 130,148 27,496 Capital expenditure on ships (31,736) (1,411)Proceeds from disposal of ships 47,776 40,462
Net cash generated from operations 146,188 66,547 Interest paid (9,445) (10,510)Interest received 151 663 Income tax (paid) refunded (312) (54)
Net cash flows generated from operating activities 136,582 56,646 Investing activities
Advances to related parties - (1,999)Repayment of loans and amount due from joint ventures 3 2,512 Purchase of plant and equipment (28) (38)Cash transferred in from disposal group 60 - Purchase of intangible assets - (268)Net proceeds from disposal of businesses 67 - Distributions received from joint venture 185 2,571 Payment for acquisition of additional interest in subsidiary, net of cash acquired (46,634) (28,313)
Net cash used in investing activities (46,347) (25,535)Financing activities
Long-term interest-bearing debt raised 48,031 34,400 Payment of principal portion of long-term interest-bearing debt (75,004) (40,648)Principal repayments on lease liabilities (26,766) (20,629)Acquisition of treasury shares (1,660) - Restricted cash 3,634 (1,775)
Net cash flows used in financing activities (51,765) (28,652)Net increase in cash and cash equivalents 38,470 2,459 Cash and cash equivalents at the beginning of the period 37,942 32,385 Effect of exchange rate changes on the balance of cash held in foreign currencies (297) (1,047)
Cash and cash equivalents at the end of the period 76,115 33,797
16
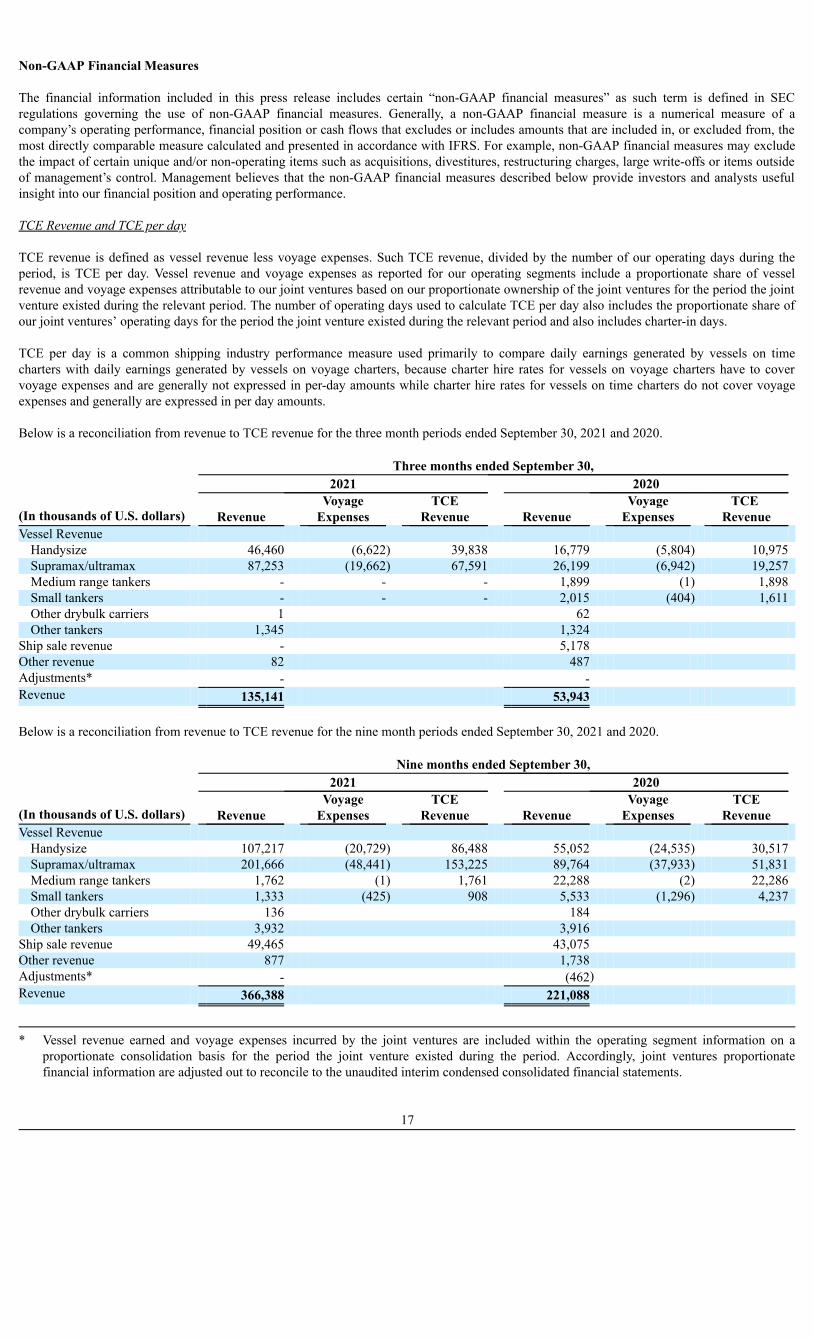
Non-GAAP Financial Measures The financial information included in this press release includes certain “non-GAAP financial measures” as such term is defined in SECregulations governing the use of non-GAAP financial measures. Generally, a non-GAAP financial measure is a numerical measure of acompany’s operating performance, financial position or cash flows that excludes or includes amounts that are included in, or excluded from, themost directly comparable measure calculated and presented in accordance with IFRS. For example, non-GAAP financial measures may excludethe impact of certain unique and/or non-operating items such as acquisitions, divestitures, restructuring charges, large write-offs or items outsideof management’s control. Management believes that the non-GAAP financial measures described below provide investors and analysts usefulinsight into our financial position and operating performance. TCE Revenue and TCE per day TCE revenue is defined as vessel revenue less voyage expenses. Such TCE revenue, divided by the number of our operating days during theperiod, is TCE per day. Vessel revenue and voyage expenses as reported for our operating segments include a proportionate share of vesselrevenue and voyage expenses attributable to our joint ventures based on our proportionate ownership of the joint ventures for the period the jointventure existed during the relevant period. The number of operating days used to calculate TCE per day also includes the proportionate share ofour joint ventures’ operating days for the period the joint venture existed during the relevant period and also includes charter-in days. TCE per day is a common shipping industry performance measure used primarily to compare daily earnings generated by vessels on timecharters with daily earnings generated by vessels on voyage charters, because charter hire rates for vessels on voyage charters have to covervoyage expenses and are generally not expressed in per-day amounts while charter hire rates for vessels on time charters do not cover voyageexpenses and generally are expressed in per day amounts. Below is a reconciliation from revenue to TCE revenue for the three month periods ended September 30, 2021 and 2020. Three months ended September 30,
2021 2020
(In thousands of U.S. dollars) Revenue Voyage
Expenses TCE
Revenue Revenue Voyage
Expenses TCE
Revenue Vessel Revenue
Handysize 46,460 (6,622) 39,838 16,779 (5,804) 10,975 Supramax/ultramax 87,253 (19,662) 67,591 26,199 (6,942) 19,257 Medium range tankers - - - 1,899 (1) 1,898 Small tankers - - - 2,015 (404) 1,611 Other drybulk carriers 1 62 Other tankers 1,345 1,324
Ship sale revenue - 5,178 Other revenue 82 487 Adjustments* - - Revenue 135,141 53,943 Below is a reconciliation from revenue to TCE revenue for the nine month periods ended September 30, 2021 and 2020. Nine months ended September 30, 2021 2020
(In thousands of U.S. dollars) Revenue Voyage
Expenses TCE
Revenue Revenue Voyage
Expenses TCE
Revenue Vessel Revenue
Handysize 107,217 (20,729) 86,488 55,052 (24,535) 30,517 Supramax/ultramax 201,666 (48,441) 153,225 89,764 (37,933) 51,831 Medium range tankers 1,762 (1) 1,761 22,288 (2) 22,286 Small tankers 1,333 (425) 908 5,533 (1,296) 4,237 Other drybulk carriers 136 184 Other tankers 3,932 3,916
Ship sale revenue 49,465 43,075 Other revenue 877 1,738 Adjustments* - (462) Revenue 366,388 221,088
* Vessel revenue earned and voyage expenses incurred by the joint ventures are included within the operating segment information on aproportionate consolidation basis for the period the joint venture existed during the period. Accordingly, joint ventures proportionatefinancial information are adjusted out to reconcile to the unaudited interim condensed consolidated financial statements.
17

Vessel operating costs per day Vessel operating costs per day represents vessel operating costs divided by the number of calendar days for owned vessels during the period. Thevessel operating costs and the number of calendar days used to calculate vessel operating costs per day includes the proportionate share of ourjoint ventures’ vessel operating costs and calendar days for the period the joint venture existed during the relevant period and excludes charter-incosts and charter-in days. Vessel operating costs per day is a non-GAAP performance measure commonly used in the shipping industry to provide an understanding of thedaily technical management costs relating to the running of owned vessels. Long-term charter-in costs and Long-term charter-in costs per day Long-term charter-in costs is defined as the charter costs relating to chartered-in vessels included in our fleet from time to time, which are vesselsfor which the period of the charter that we initially commit to is 12 months or more, even if at a given time the remaining period of their chartermay be less than 12 months (“long-term charter-in vessels”). Such long-term charter-in costs, divided by the number of operating days for therelevant vessels during the period, is long-term charter-in costs per day. Long-term charter-in costs and long-term charter-in costs per day are non-GAAP performance measures used primarily to provide anunderstanding of the total costs and total costs per day relating to the charter-in of the Company’s long-term chartered-in vessels. Below is a reconciliation from adjusted charter hire costs to long-term charter-in costs for the three month periods ended September 30, 2021 and2020.
Three months ended September 30, 2021
(In thousands of U.S. dollars) Charter hire
costs
Lease payments on
Ships
Adjusted charter hire
costs
Long-term charter-in
costs
Short-term charter-in
costs
Adjusted charter hire
costs Handysize 3,538 - 3,538 - 3,538 3,538 Supramax/ultramax 17,458 9,157 26,615 8,422 18,193 26,615 20,996 9,157 30,153 30,153
Three months ended September 30, 2020
(In thousands of U.S. dollars) Charter hire
costs
Leasepayments on
Ships
Adjustedcharter hire
costs
Long-termcharter-in
costs
Short-term charter-in
costs
Adjusted charter hire
costs Handysize 2,408 - 2,408 - 2,408 2,408 Supramax/ultramax 5,853 6,778 12,631 6,191 6,440 12,631 Medium range tankers 155 - 155 155 - 155 8,416 6,778 15,194 15,194 Below is a reconciliation from adjusted charter hire costs to long-term charter-in costs for the nine month periods ended September 30, 2021 and2020.
Nine months ended September 30, 2021
(In thousands of U.S. dollars) Charter hire
costs
Leasepayments on
Ships
Adjustedcharter hire
costs
Long-termcharter-in
costs
Short-term charter-in
costs
Adjusted charter hire
costs Handysize 8,566 - 8,566 - 8,566 8,566 Supramax/ultramax 45,570 27,410 72,980 25,989 46,991 72,980 54,136 27,410 81,546 81,546
Nine months ended September 30, 2020
(In thousands of U.S. dollars) Charter hire
costs
Leasepayments on
Ships
Adjustedcharter hire
costs
Long-termcharter-in
costs
Short-term charter-in
costs
Adjusted charter hire
costs Handysize 7,259 7,259 - 7,259 7,259 Supramax/ultramax 16,837 19,822 36,659 19,726 16,933 36,659 Medium range tankers 3,853 1,795 5,648 5,648 - 5,648 27,949 21,617 49,566 49,566
18

EBITDA and Adjusted EBITDAEBITDA is defined as earnings before income tax benefit (expense), interest income, interest expense, share of losses of joint ventures anddepreciation and amortization. Adjusted EBITDA is EBITDA adjusted to exclude the items set forth in the table below, which represent certainnon-recurring, non-operating or other items that we believe are not indicative of the ongoing performance of our core operations. EBITDA and Adjusted EBITDA are used by analysts in the shipping industry as common performance measures to compare results across peers.EBITDA and Adjusted EBITDA are not items recognized by IFRS, and should not be considered in isolation or used as alternatives to profit(loss) for the period or any other indicator of our operating performance. Our presentation of EBITDA and Adjusted EBITDA is intended to supplement investors’ understanding of our operating performance byproviding information regarding our ongoing performance that exclude items we believe do not directly affect our core operations and enhancingthe comparability of our ongoing performance across periods. Our management considers EBITDA and Adjusted EBITDA to be useful toinvestors because such performance measures provide information regarding the profitability of our core operations and facilitate comparison ofour operating performance to the operating performance of our peers. Additionally, our management uses EBITDA and Adjusted EBITDA asmeasures when reviewing our operating performance. While we believe these measures are useful to investors, the definitions of EBITDA andAdjusted EBITDA used by us may not be comparable to similar measures used by other companies. The table below presents the reconciliation between profit (loss) for the period to EBITDA and Adjusted EBITDA for the three months endedSeptember 30, 2021 and 2020 and nine months ended September 30, 2021 and 2020.
Three months ended
September 30, Nine months ended
September 30, (In thousands of U.S. dollars) 2021 2020 2021 2020 Profit (loss) for the period $ 49,095 $ (14,682) $ 76,682 $ (26,993)Adjusted for:
Income tax expense (benefit) 49 69 (2,395) 523 Interest income (53) (64) (152) (513)Interest expense 2,431 3,902 10,168 12,536 Share of losses of joint ventures - 59 29 2,597 Depreciation and amortization 15,739 12,356 45,972 38,076
EBITDA 67,261 1,640 130,304 26,226 Adjusted for
(Reversal of) impairment loss recognized on ships - 6,065 (3,557) 9,727 Impairment loss recognized on goodwill and intangibles - - 965 - Reversal of impairment loss recognized on right-of-use assets - - (1,046) - Impairment loss on net disposal group - - 2,551 576 Loss on disposal of business - - 25 - Share based compensation 1,127 382 1,639 1,337 Registration and offering related expenses 633 - 633 -
ADJUSTED EBITDA 69,021 8,087 131,514 37,866
19

Adjusted net income (loss) and Adjusted Earnings (loss) per share Adjusted net income (loss) is defined as Profit (loss) for the period attributable to the owners of the Company adjusted for (reversal of)impairment loss recognized on ships, impairment loss recognized on goodwill and intangibles, reversal of impairment loss recognized on right-of-use assets, impairment loss on net disposal group, loss on disposal of business, share based compensation and non-recurring expenditure.Adjusted Earnings (loss) per share represents this figure divided by the weighted average number of ordinary shares outstanding for the period. Adjusted net income (loss) is used by management for forecasting, making operational and strategic decisions, and evaluating current companyperformance. It is also one of the inputs used to calculate the variable amount that will be returned to shareholders in the form of quarterlydividends and/or share repurchases. Adjusted net income (loss) is not recognized by IFRS, and should not be considered in isolation or used asalternatives to profit (loss) for the period or any other indicator of our operating performance. Our presentation of Adjusted net income (loss) is intended to supplement investors’ understanding of our operating performance by providinginformation regarding our ongoing performance that exclude items we believe do not directly affect our core operations and enhancing thecomparability of our ongoing performance across periods. We consider Adjusted net income (loss) to be useful to management and investorsbecause it eliminates items that are unrelated to the overall operating performance and that may vary significantly from period to period.Identifying these elements will facilitate comparison of our operating performance to the operating performance of our peers. The definitions ofAdjusted net income (loss) used by us may not be comparable to similar measures used by other companies. The table below presents the reconciliation between profit (loss) for the period attributable to the owners of the Company to Adjusted net income(loss) for the three months ended September 30, 2021 and 2020 and nine months ended September 30, 2021 and 2020.
Three months ended
September 30, Nine months ended
September 30, (In thousands of U.S. dollars, other than per share data) 2021 2020 2021 2020 Profit (loss) for the period attributable to owners of the Company $ 43,996 $ (14,279) $ 66,125 $ (24,774)Adjusted for:
- (Reversal of) impairment loss recognized on ships - 6,065 (3,557) 9,727 - Impairment loss recognized on goodwill and intangibles - - 965 - - Reversal of impairment loss recognized on right-of-use assets - - (1,046) - - Impairment loss on net disposal group - - 2,551 576 - Loss on disposal of business - - 25 - - Share based compensation 1,127 382 1,639 1,337 - Registration and offering related expenses 633 - 633 -
Adjusted net income (loss) 45,756 (7,832) 67,335 (13,134)
Weighted average number of shares on which the per share figureshave been calculated 19,242,116 19,006,858 19,216,386 18,952,834 Effect of dilutive potential ordinary shares 863,168 - 863,168 - Weighted average number of ordinary shares for the purpose ofdiluted per share figures 20,105,284 19,006,858 20,079,554 18,952,834 Basic profit (loss) per share $ 2.29 $ (0.75) $ 3.44 $ (1.31)Diluted profit (loss) per share $ 2.19 $ (0.75) $ 3.29 $ (1.31) Basic Adjusted earnings (loss) per share $ 2.38 $ (0.41) $ 3.50 $ (0.69)Diluted Adjusted earnings (loss) per share $ 2.28 $ (0.41) $ 3.35 $ (0.69)
20

Headline earnings (loss) and Headline earnings (loss) per share The Johannesburg Stock Exchange, or JSE, requires that we calculate and publicly disclose Headline earnings (loss) per share and dilutedHeadline earnings (loss) per share. Headline earnings (loss) per share is calculated using net income which has been determined based on IFRS.Accordingly, this may differ to the Headline earnings (loss) per share calculation of other companies listed on the JSE because such companiesmay report their financial results under a different financial reporting framework such as U.S. GAAP. Headline earnings (loss) for the period represents profit (loss) for the period attributable to owners of the Company adjusted for the re-measurements that are more closely aligned to the operating or trading results as set forth below, and Headline earnings (loss) per sharerepresents this figure divided by the weighted average number of ordinary shares outstanding for the period. The table below presents a reconciliation between Profit (loss) for the period attributable to owners of the Company to Headline earnings (loss)for the three months ended September 30, 2021 and 2020 and the nine months ended September 30, 2021 and 2020.
Three months ended
September 30, Nine months ended
September 30, (In thousands of U.S. dollars, other than per share data) 2021 2020 2021 2020 Profit (loss) for the period attributable to owners of the Company $ 43,996 $ (14,279) $ 66,125 $ (24,774)Adjusted for:
- (Reversal of) impairment loss recognized on ships - 6,065 (3,557) 9,727 - Impairment loss recognized on goodwill and intangibles - - 965 - - Reversal of impairment loss recognized on right-of-use assets - - (1,046) - - Impairment loss on net disposal group - - 2,551 576 - Loss on disposal of business - - 25 -
Headline earnings (loss) 43,996 (8,214) 65,063 (14,471)
Weighted average number of shares on which the per share figureshave been calculated 19,242,116 19,006,858 19,216,386 18,952,834 Effect of dilutive potential ordinary shares 863,168 - 863,168 - Weighted average number of ordinary shares for the purpose ofdiluted per share figures 20,105,284 19,006,858 20,079,554 18,952,834 Basic profit (loss) per share $ 2.29 $ (0.75) $ 3.44 $ (1.31)Diluted profit (loss) per share $ 2.19 $ (0.75) $ 3.29 $ (1.31) Basic headline earnings (loss) per share $ 2.29 $ (0.43) $ 3.39 $ (0.76)Diluted headline earnings (loss) per share $ 2.19 $ (0.43) $ 3.24 $ (0.76)
21

Forward-Looking Statements This press release contains forward-looking statements within the meaning of the Private Securities Litigation Reform Act 1995 with respect toGrindrod Shipping’s financial condition, results of operations, cash flows, business strategies, operating efficiencies, competitive position,growth opportunities, plans and objectives of management, and other matters. These forward looking statements, including, among others, thoserelating to our future business prospects, revenues and income, are necessarily estimates and involve a number of risks and uncertainties thatcould cause actual results to differ materially from those suggested by the forward-looking statements. Accordingly, these forward-lookingstatements should be considered in light of various important factors, including those set forth below. Words such as “may,” “expects,” “intends,”“plans,” “believes,” “anticipates,” “hopes,” “estimates,” and variations of such words and similar expressions are intended to identify forward-looking statements. These forward-looking statements are based on the information available to, and the expectations and assumptions deemedreasonable by Grindrod Shipping at the time these statements were made. Although Grindrod Shipping believes that the expectations reflected insuch forward-looking statements are reasonable, no assurance can be given that such expectations will prove to have been correct. Thesestatements involve known and unknown risks and are based upon a number of assumptions and estimates which are inherently subject tosignificant uncertainties and contingencies, many of which are beyond the control of Grindrod Shipping. Actual results may differ materiallyfrom those expressed or implied by such forward-looking statements. Important factors that could cause actual results to differ materially fromestimates or projections contained in the forward-looking statements include, without limitation, Grindrod Shipping’s future operating orfinancial results; the strength of world economies, including, in particular, in China and the rest of the Asia-Pacific region; the effects of theCOVID-19 pandemic on our operations and the demand and trading patterns for both the drybulk and product tanker markets, and the duration ofthese effects; cyclicality of the drybulk and tanker markets, including general drybulk and tanker shipping market conditions and trends,including fluctuations in charter hire rates and vessel values; changes in supply and demand in the drybulk and tanker shipping industries,including the market for Grindrod Shipping’s vessels; changes in the value of Grindrod Shipping’s vessels; changes in Grindrod Shipping’sbusiness strategy and expected capital spending or operating expenses, including drydocking, surveys, upgrades and insurance costs; competitionwithin the drybulk and tanker industries; seasonal fluctuations within the drybulk and tanker industries; Grindrod Shipping’s ability to employ itsvessels in the spot market and its ability to enter into time charters after its current charters expire; general economic conditions and conditions inthe oil and coal industries; Grindrod Shipping’s ability to satisfy the technical, health, safety and compliance standards of its customers,especially major oil companies and oil producers; the failure of counterparties to our contracts to fully perform their obligations with GrindrodShipping; Grindrod Shipping’s ability to execute its growth strategy; international political and economic conditions including additional tariffsimposed by China and the United States; potential disruption of shipping routes due to weather, accidents, political events, natural disasters orother catastrophic events; vessel breakdowns; corruption, piracy, military conflicts, political instability and terrorism in locations where we mayoperate; fluctuations in interest rates and foreign exchange rates and the uncertainty surrounding the continued existence of the London InterbankOffered Rate; changes in the costs associated with owning and operating Grindrod Shipping’s vessels; changes in, and Grindrod Shipping’scompliance with, governmental, tax, environmental, health and safety regulations including the International Maritime Organization, or IMO2020, regulations limiting sulfur content in fuels; potential liability from pending or future litigation; Grindrod Shipping’s ability to procure orhave access to financing, its liquidity and the adequacy of cash flows for its operation; the continued borrowing availability under GrindrodShipping’s debt agreements and compliance with the covenants contained therein; Grindrod Shipping’s ability to fund future capital expendituresand investments in the construction, acquisition and refurbishment of its vessels; Grindrod Shipping’s dependence on key personnel; GrindrodShipping’s expectations regarding the availability of vessel acquisitions and its ability to buy and sell vessels and to charter-in vessels as plannedor at prices we deem satisfactory; adequacy of Grindrod Shipping’s insurance coverage; effects of new technological innovation and advances invessel design;; Grindrod Shipping’s ability to operate as an independent entity; and the other factors set out in “Item 3. Key Information-RiskFactors” in our Annual Report on Form 20-F for the year ended December 31, 2020 filed with the Securities and Exchange Commission onMarch 31, 2021. Grindrod Shipping undertakes no obligation to update publicly or release any revisions to these forward-looking statements toreflect events or circumstances after the date of this press release or to reflect the occurrence of unanticipated events except as required by law. Company Contact: Investor Relations / Media Contact:Martyn Wade / Stephen Griffiths Nicolas Bornozis / Paul LampoutisCEO / CFO Capital Link, Inc.Grindrod Shipping Holdings Ltd. 230 Park Avenue, Suite 1536200 Cantonment Road, #03-01 Southpoint New York, N.Y. 10169Singapore, 089763 Tel.: (212) 661-7566Email: [email protected] Fax: (212) 661-7526Website: www.grinshipping.com Email: [email protected]
22