NAURU
TECHNOLOGY NEEDS ASSESSMENT
FOR CLIMATE CHANGE
ADAPTATION AND MITIGATION
Identification and Prioritisation of Adaptation and Mitigation
Technologies for Nauru
07 APRIL, 2020

Nauru TNA Report
i
Foreword

Nauru TNA Report
ii
List of Abbreviations
AD Agriculture Division
AIT Asian Institution of Technology
CCA Climate Change Adaptation
COP Conference of Parties
DCIE Department of Commerce, Industries and Environment
DoE Department of Education
DoF Department of Finance
DRR Disaster risk reduction
GCF Green Climate Fund
GEF Global Environment Fund
GHG Greenhouse gas
LCOE Levelized Cost of Electricity
LMMA Locally managed marine area
NDC National Determine Contribution
NGO None government organisation
NPE National Policy of Energy
NSC National Steering Committee (TNA)
NSDS National Sustainable Development Strategy
NUC Nauru Utility Corporation
OTEC Ocean thermal energy conversion
PHES Pumped hydroelectric storage
PICs Pacific Island Countries
ROS Reverse Osmosis system
RONAdapt Republic of Nauru Adaptation Framework
RON Republic of Nauru
SLR Sea level rise
SOE State own Enterprise
TFS Technology Fact Sheets
TNA Technology Need Assessment

Nauru TNA Report
iii
UDP UNEP DTU Partnership
UNEP United Nation Environment Program
UNFCCC United Nation Framework for Convention on Climate Change
USP University of the South Pacific

Nauru TNA Report
iv
List of Tables
Table 1: TNA Priority sectors .................................................................................................. 5
Table 2: TNA Technologies before Prioritization ................................................................. 11
Table 3: TNA Gender Sectoral/ Technology Working Group ............................................... 14
Table 4: RO desalination units on Nauru ..................................................................... 16
Table 5: NUC water storage capacity .................................................................................... 16
Table 6: NUC water trucks .................................................................................................... 17
Table 7: Selection criteria for technologies in the water sector ............................................. 19
Table 8: Criteria scoring scales & preferred values for Water Sector ................................... 20
Table 9: Performance matrix table for water sector............................................................... 21
Table 10: Normalised scoring matrix table for water sector .................................................. 21
Table 11: Scores & equal weights combined for water sector ............................................... 22
Table 12: Scores and different weights combined for water sector ....................................... 23
Table 13: Selection criteria for technologies in coastal sector .............................................. 28
Table 14: Criteria scoring units an preferred values for Coastal Sector ................................ 28
Table 15: Performance matrix table for coastal sector .......................................................... 29
Table 16: Normalised scoring matrix table for coastal sector ............................................... 30
Table 17: Scores & equal weights combined table for coastal sector .................................... 31
Table 18: Scores & different weights combined table for coastal sector .............................. 31
Table 19: NUC diesel generating sets .................................................................................... 34
Table 20: Existing, planned and potential solar panels.......................................................... 35
Table 21: GHG emission per energy sector ........................................................................... 36
Table 22: Stakeholder prioritised ranking of identified RE technologies.............................. 38
Table 23: Selection criteria for technologies in energy sector ............................................... 41
Table 24: Criteria scoring scales and preferred values for energy sector .............................. 41
Table 25: Performance matrix table for energy sector ........................................................... 42
Nauru TNA Report
v
Table 26: Normalised scoring matrix table for energy sector ................................................ 43
Table 27: Scores & equal weights combined table for energy sector .................................... 43
Table 28: Existing composting machines with NRC ............................................................. 46
Table 29: Waste & sewerage strategy milestones .................................................................. 48
Table 30: Stakeholder selection on waste management technologies ................................... 49
Table 31: Selection criteria for technologies in waste sector ................................................ 51
Table 32: Performance matrix scoring scale and preferred values for each criteria .............. 51
Table 33: Performance matrix table for waste sector ............................................................ 52
Table 34: Normalised scoring matrix table for waste sector ................................................. 53
Table 35: Scores & weights combined table for waste sector ............................................... 53
Table 36: MCA ranking of technologies in water sector – equal criterion weights .............. 56
Table 37: MCA ranking of technologies in coastal sector – equal criterion weights ............ 57
Table 38: MCA ranking of technologies in the energy sector – equal criterion weights ...... 57
Table 39: MCA ranking of technologies in waste sector – equal criterion weights .............. 58

Nauru TNA Report
vi
List of Figures
Figure 1: National TNA Team Structure ................................................................................. 9
Figure 2: Water sector technology ranking – equal criteria weights ..................................... 24
Figure 3: Water sector technology ranking – different criteria weights ................................ 24
Figure 4: Coatal sector technology ranking – equal criteria weights ..................................... 32
Figure 5: Coastal sector technology ranking – different criteria weights .............................. 33
Figure 6: Energy sector MCA technology ranking – equal criteria weights ......................... 44
Figure 7: Energy sector MCA technology ranking – different criteria weights A ................ 44
Figure 8: Energy sector MCA technology ranking – different criteria weights B ................. 45
Figure 9: Waste sector MCA technology ranking – equal criteria weights ........................... 54
Figure 10: Energy sector MCA technology ranking – different criteria weights A .............. 54
Figure 11: Energy sector MCA technology ranking – different criteria weights B ............... 55
Nauru TNA Report
vii
Table of Contents
Foreword ................................................................................................................................... i
List of Abbreviations ............................................................................................................... ii
List of Tables .......................................................................................................................... iv
List of Figures ......................................................................................................................... vi
Table of Contents ................................................................................................................... vii
Executive Summary ............................................................................................................... xii
Need Assessment ............................................................................................................... xii
Technology Prioritisation by Stakeholders ...................................................................... xiii
Adaptation I: Water sector technologies ...................................................................... xiii
Adaptation II: Coastal sector technologies ................................................................... xiv
Mitigation I: Energy sector technologies ....................................................................... xv
Mitigation II: Waste sector technologies ...................................................................... xvi
MCA process and results ................................................................................................. xvii
Chapter 1: Introduction .......................................................................................................... 1
1. 1 About the TNA project ................................................................................................. 1
1.2 Existing national policies on climate change mitigation and adaptation, and their
development priorities ......................................................................................................... 2
1.3 An overview of Sectors, projected Climate Change and GHG emissions status and
trends of the different sectors ............................................................................................... 4
Adaptation ........................................................................................................................ 5
Mitigation ......................................................................................................................... 6
1.3.1 Process and results of sector selection for adaptation and mitigation .................... 7
Chapter 2: Institutional Arrangement for the TNA and the Stakeholder Involvement ... 9
2.1 National TNA team ........................................................................................................ 9

Nauru TNA Report
viii
2.1.1 National Steering Committee .................................................................................. 9
2.1.2 The National TNA Coordinator ............................................................................ 10
2.1.3 Sector working groups .......................................................................................... 10
2.1.4 TNA National Consultants .................................................................................... 10
2.2 Stakeholder Engagement Process followed in the TNA – Overall assessment ........... 10
2.2.1 Consultant’s capacity building workshop in Bangkok, ........................................ 10
2.2.2 Stakeholder selection process ............................................................................... 11
2.2.3 National Consultation ........................................................................................... 11
2.2.4 Bi-lateral Meetings................................................................................................ 12
2.2.5 Technology Need Assessment consultation and reporting ................................... 12
2.3 Consideration of Gender Aspects in the TNA process ................................................ 13
2.4 National Policies supporting Gender mainstreaming into the TNA process. .............. 14
Chapter 3: Technology Prioritisation for Adaptation in the Water Sector ..................... 15
3.1 Key Climate Change Vulnerabilities in the water sector ............................................. 15
3.2 Decision context........................................................................................................... 15
3.3 Overview of Existing Technologies in the water sector .............................................. 15
3.3.1 Production ............................................................................................................. 15
3.3.2 Storage .................................................................................................................. 16
3.3.3 Delivery................................................................................................................. 17
3.3.4 Rainwater harvesting from rooftop catchments .................................................... 17
3.3.5 Groundwater access and quality ........................................................................... 17
3.4 Adaptation Technology Options for water sector and their Main Adaptation benefits
............................................................................................................................................ 18
3.4.1 Rainwater harvesting ............................................................................................ 18
3.4.2 Non-potable water ................................................................................................. 18
3.4.3 Water reticulation.................................................................................................. 19
3.4.4 Water distribution ................................................................................................. 19

Nauru TNA Report
ix
3.5 Criteria and process of technology prioritisation for water sector ............................... 19
3.6 Results of technology prioritisation for water sector ................................................... 21
Reason for use of Multiple Criteria Weights Analysis (MCWA) for water technology ... 24
Chapter 4: Technology Prioritisation for Adaptation in the Coastal Sector ................... 25
4.1 Key Climate Change Vulnerabilities in the coastal sector........................................... 25
4.2 Decision context........................................................................................................... 25
4.3 Overview of Existing Technologies in the coastal sector ............................................ 25
4.4 Adaptation Technology Options for coastal sector and their Main Adaptation benefits
............................................................................................................................................ 26
4.4.1 Policy & guideline formulation ............................................................................ 26
4.4.2 Coastal vegetation restoration ............................................................................... 27
4.4.3 Construction of seawalls ....................................................................................... 27
4.4.4 LMMA .................................................................................................................. 27
4.5 Criteria and process of technology prioritisation for coastal sector ............................ 28
4.6 Results of technology prioritisation for coastal sector ................................................. 29
Chapter 5: Technology Prioritisation for Mitigation in the Energy Sector ..................... 34
5.1 Existing technologies and GHG emissions for the energy sector ................................ 34
5.1.1 Diesel Power Generation ...................................................................................... 34
5.1.2 Renewable Energy ................................................................................................ 35
5.1.3 GHG emissions ..................................................................................................... 36
5.2 Decision context........................................................................................................... 36
5.3 Possible mitigation technology options for the energy sector ..................................... 37
5.3.1 Pumped hydroelectric storage (PHES) ................................................................. 38
5.3.2 Biogas ................................................................................................................... 39
5.3.3 OTEC .................................................................................................................... 39
5.3.4 Grid-connected rooftop solar PV system .............................................................. 40
5.4 Criteria and process for technology prioritisation for renewable energy sector .......... 41

Nauru TNA Report
x
5.5 Results of technology prioritisation for renewable energy sector ............................... 42
Chapter 6: Technology Prioritisation for Mitigation in the Waste Sector ....................... 46
6.1 Existing technologies and GHG emissions for solid waste management sector ......... 46
6.1.1 Solid waste disposal .............................................................................................. 46
6.1.2 Segregation ........................................................................................................... 46
6.1.3 Composting ........................................................................................................... 46
6.1.4 Clean and green..................................................................................................... 47
6.1.5 Waste collection .................................................................................................... 47
6.1.6 GHG emissions ..................................................................................................... 47
6.2 Decision context........................................................................................................... 48
6.3 Possible mitigation technology options in solid waste management ........................... 48
6.3.1 Semi-aerobic landfill ............................................................................................. 49
6.3.2 Segregation ........................................................................................................... 49
6.3.3 Baling .................................................................................................................... 50
6.3.4 Composting ........................................................................................................... 50
6.4 Criteria and process for technology prioritisation for solid waste sector .................... 51
6.4.1 Criteria identification ............................................................................................ 51
6.4.2 Scoring Units and preferred values ....................................................................... 51
Chapter 7: Summary and Conclusions ................................................................................ 56
7.1 Adaptation ............................................................................................................... 56
7.2 Mitigation ................................................................................................................ 57
List of References .............................................................................................................. 60
Annexes.............................................................................................................................. 61
Annex 1: Technology Fact Sheets for Adaptation ............................................................. 61
Annex 2: Technology Fact Sheets for Mitigation .............................................................. 98
Annex 3: List of consultants and stakeholders involved and their contacts .................... 128

Nauru TNA Report
xi
Annex 4: First TNA Workshop Program ......................................................................... 129
Annex 5: Second TNA Workshop Program .................................................................... 132
Annex 6: The process in normalising the performance matrix table ............................... 135

Nauru TNA Report
xii
Executive Summary
The Climate Change Technology Transfer and Needs Assessment report (CCTTNAR) is in
line with the UNFCCC especially articles 4.5 and various National Climate Change enabling
activities. The aspects have been captured in the National communication and National
Sustainable Development Strategy of Nauru. The National Communication and the National
Determine Contribution which were submitted to the conference of Parties through UNFCCC
Secretariat have also provided support for this TNA process.
Nauru has already designed and established a National Policy of Energy (NPE) which will
provide a pathway towards achieving and long term sustainable renewable energy sector. The
NPE of Nauru will enhance the use and utilisation of renewable energy technologies for
sustainable development taking into account adaptation and mitigation needs to climate
change. Besides the energy sector, the country also looked at the waste management sector
which is also critical to the development, at the same time reduction of greenhouse gasses into
the atmosphere. Additionally, addressing the waste management sector will also reduce the
level of methane gas emission into the atmosphere.
With the adaptation sector, the government and stakeholders have considered water sector as
the priority area for consideration under the TNA process. This priority has strong backings
from the NSDS which promised better quality of life and livelihood for all Nauruan’s. The
second sector which was considered under the TNA process for adaptation was the coastal
area soil erosion. This second option has come about because of the increasing sea level rise,
coastal erosion and human induces anthropogenic impact of climate change at coastal areas.
This technology transfer need assessment will enable the communities to mitigate and build
resilience to impacts of climate change.
Need Assessment
In this process the assessments included development and climate change response needs and
opportunities in the country based on some of the outlined activities in both the NDCs and the
NSDS of Nauru. The need to focus on the priority area of NSDS was adopted when assessing
the various sectors. The assessment is only an initial phase and may not be very
comprehensive.

Nauru TNA Report
xiii
Technology Prioritisation by Stakeholders
Technology transfer was considered as a flow of experience, know-how, and equipment
between and within nations. Standard criteria were used such as development benefits, market
readiness, GHG emission reduction potential, environmental benefits, job creation etc. The
analysis has potential for expansion in future.
Although at this stage, there is not final decision on which technologies to prioritise, the
technologies considered by the stakeholders for this purpose under Adaptation I – water
sector, include rainwater harvesting, non-potable water access, water reticulation and water
distribution by water trucks; Adaptation II – coastal area management sector include policy
and guideline formulation, coastal vegetation restoration, construction of seawalls and locally
managed protected area. Additionally, these technologies were also considered by the
stakeholders for Mitigation I – energy sector to include pumped hydroelectric storage, biogas,
OTEC and rooftop PV; and Mitigation II – waste sector to include semi-aerobic landfill, waste
segregation, baling and composting.
Adaptation I: Water sector technologies
Rooftop rain water harvesting system
Roof top rain water harvesting technology was introduced on the Island many years ago. It is
a technique through which rainwater is captured from the roof catchment and stored in
reservoirs such as tanks by individual household units. Re-introduction of technology will see
potable water is accessible to larger households and population of the country.
Non-potable water
Brackish or underground water is a very vital source of non-potable water for non-potable use
that basically include washing and toilet flushing, thus reducing the use of potable water.
Access to underground water require excavation of a well with depths ranging from 2 to 8
meters depending on land elevation. To reticulate water within the household, a domestic
electric water pressure pump is required.
Water reticulation system
Water reticulation system was introduced at some part of the Island some years ago, during
the mining boom period. This however discontinued due to cost and service issues. This new

Nauru TNA Report
xiv
technology will see construction of reservoirs at certain locations and then distribution to
households across the Island.
Water Distribution
Currently desalinated water is being distributed around the island by using water trucks upon
request. This technology though effective, but is costly on the part of the service provider to
maintain the fleet i.e. costs of spare parts and fuel. This new technology will ensure additional
water truck suppliers are acquired to the current fleet and distribute water more frequently to
the households around the Island.
Adaptation II: Coastal sector technologies
Building of sea wall at selected sites
Construction of sea wall around the island at selected sites will provide relief to the respective
communities and help build resilience against impact of climate change especially sea level
rise and costal soil erosion. Currently there is only one sea wall structure jointly funded by
government of India and the Republic of Nauru. This technology will ensure that similar
structures will also be built at vulnerable and exposed sites around the Island.
Coastal Vegetation replenishment
Coastal vegetation replenishment is a technology that is aimed to replant trees and vegetation
at coastal areas around the Island. The native vegetation in coastal areas plays an important
role in stabilising the surface against wind erosion and provides habitat for wildlife. This
technology will prevent further washing away of land by SLR and human induced
anthropogenic activities at these coastal areas.
Locally managed marine area
Locally managed marine areas are projected areas that largely or wholly managed by coastal
communities and/ or land owning groups, with the support of government and partner
representatives. The communities impose restrictions on areas such as “no take zones” and on
certain equipment, practices, species or sizes of catches. The purpose of this technology is to
conserve the area from over fishing or harvesting but at the same time managing the coastal
beaches from soil erosion and extraction by individuals in the community.

Nauru TNA Report
xv
Formulation of coastal area management policy
The objective of this technology is to ensure that the government formulate and develop a
policy to prevent people/ individual or business houses from extraction of beaches at the
coastal area. Any person or business houses intending to do development along the beaches
must apply to an authority or government body to assess potential impact of such development
on the environment prior to approval. This body oversees approval of constructions or
structures as sea walls, building construction, wharfs, land reclamation etc.
Mitigation I: Energy sector technologies
Pumped hydroelectric storage (PHES)
PHES is a technology that would use the surplus power from a renewable source to pump
water from a lower reservoir to a second reservoir on top of the hill. This creates the potential
energy that can be released when needed through letting the water flow from the upper
reservoir through a conventional hydro turbine at sea level which generates power into the
grid. The main applications of pumped hydro are for energy management, frequency control
and provision of reserves.
Biogas
Biogas is a modern form of bioenergy that can be produced through anaerobic digestion or
fermentation of a variety of biomass sources. It is a versatile fuel that can be used for cooking,
heating, lighting, power generation and combined heat and power generation, as well as, when
upgraded to boost its methane content, in transport applications.
Ocean thermal energy conversion (OTEC)
OTEC is a proven technology that produces clean baseload electricity using the temperature
differential (>20⁰C) between warm surface water and cold deep water in the world’s tropical
oceans. The warm seawater is used to produce a vapour that acts as a working fluid to drive
turbines. OTEC can also be used for ocean water desalination. The cold water is used to
condense the vapour and ensure the vapour pressure difference drives the turbine.
Grid-connected rooftop solar PV
A grid-connected solar PV system is connected to the utility grid through an inverter. The
inverter converts the DC electricity produced by the solar panels into 240 V AC electricity,

Nauru TNA Report
xvi
which can then be used by the property/household. If a grid connect system is producing more
power than the home consumes, the surplus is fed into the power grid. The main advantage of
a grid connected PV system is its simplicity, relatively low operating and maintenance costs
as well as reduced electricity bills.
Mitigation II: Waste sector technologies
Semi-aerobic landfill
Also known as the Fukuoka method, this semi-aerobic landfill is a low cost technology that
utilizes materials and methods readily available in developing countries to install leachate
drainage pipes to prevent groundwater contamination and gas vents that enlarges the aerobic
region in the landfill waste layers. In addition the volume of methane gas emitted by the
landfill is reduced, contributing to efforts to prevent global warming.
Segregation
Waste segregation refers to the separation of wet waste and dry waste where the purpose is to
recycle dry waste easily and to use wet waste as compost. When waste is segregated, there is
reduction of waste that gets landfilled and occupies space, air and water pollution rates are
considerably lowered. Segregation at the source reduces the amount of recyclable wastes
ending up at the landfill where it usually becomes impractical to sort.
Baling
Baling is a process that compresses mainly recyclable wastes into a block (bale) which is
secured by plastic or wire strapping. Baling reduces the volume of waste product and has a
number of benefits that include (i) reduction of space taken up by waste on site; (ii) easier to
store due to regular shape; (iii) ease of transportation; (iv) reduced storage, transportation and
waste disposal costs; and (v) increased revenue as some baled materials can be sold to
recyclers. Installing balers at the source of waste generation is highly recommended for
Nauru.
Composting
Composting is an aerobic method (meaning that it requires the presence of air) of
decomposing organic solid wastes. It can therefore be used to recycle organic material. The

Nauru TNA Report
xvii
process involves decomposition of organic material into a humus-like material, known as
compost, which is a good fertilizer for plants.
Household waste consists of organic waste and compostable materials. If everyone on Nauru
starts composting at home, tons of organic waste would be diverted from landfills, reducing
GHG from hitting the atmosphere. Hence, encouraging and implementing home composting
will not only improve and sustain kitchen gardening crops but will also help save the
environment.
MCA process and results
The technology fact sheets together with the MCA spreadsheet were prepared by the national
consultants and emailed to all stakeholders. Stakeholders were advised and encouraged to
review the fact sheets and MCA spreadsheet results and to provide feedbacks on whether
agreeable or not on the outcome of the TNA process. The outcome of the multi-criteria
analysis (MCA) rankings is presented below.
Water sector (Adaptation)
Rainwater harvesting 1st
Water reticulation 2nd
Non-potable water 3rd
Water distribution 4th
Coastal sector (Adaptation)
Coastal vegetation restoration 1st
LMMA 2nd
Policy & guideline formulation 3rd
Construction of seawalls 4th
Energy sector (Mitigation)
OTEC 1st
Rooftop PV 2nd
Biogas 3rd
PHES 4th
Waste sector (Mitigation)
Composting 1st
Segregation 2nd
Semi-aerobic landfill 3rd
Baling 4th

Nauru TNA Report
1
Chapter 1: Introduction
1. 1 About the TNA project
It is unequivocal that the increasing amount of greenhouse gases (GHGs) into the atmosphere
will have adverse effects on the global weather systems. The warming is not expected to be
globally uniform but could differ significantly between geographical regions and vary
between seasons (Xia, et al., 2014). This will negatively affect the scarce natural resources,
particularly within the small island islands states (SIDS) that are heavily depended on for their
sustenance and livelihoods. The primary natural resource sectors that might be susceptible to
changes in climate include agricultural crops, livestock, forests, water resources, coastal
resources, fisheries, and wildlife (Huq, et al, 2015). SIDS, especially the Pacific Island
countries are more vulnerable than industrialized countries to the effects of climatic change
for several reasons. First, they have relatively weaker economic base that weakened the
capacity of many developing countries in the region to adjust to drastic economic changes.
Second, most of the people depend on agriculture and fisheries for their subsistence, and
agriculture including fisheries depend on a great deal on climatic and weather patterns, thirdly
mostly of these countries are aid dependent and thus when priorities of donors divert from
climate change focus to other emerging issues these countries are left with none but have to
improvise their strategies in order to support their vast populations.
Nauru ratified the UN Framework Convention on Climate Change (UNFCCC) on 11
November 1993 and has submitted its Initial National Communication (INC) to the
UNFCCC on 30 October 1999.
Article 4.5 of the UNFCCC states that developed countries who are members of the UNFCCC
“shall take all practicable steps to promote facilitate , and finance , as appropriate , the transfer
of, or access to, environmentally sound technologies and knowledge to other parties,
particular developing country parties, to enable them implement the provisions of the
convention”.
Nauru TNA Report
2
Prior to the UNFCCC era, technology transfer had occurred in all socio-economic sectors but
the focus was not to address climate change through adaptation and mitigation of climate
change, although indirectly some of them were met by climate change needs.
With the above backdrop, the Republic of Nauru (RON) seek the opportunity from the United
Nation Environment Program (UNEP) to participate in the third phase of the Technological
Need Assessment (TNA) process. The purpose of this exercise is to identify and align
potential technologies (adaptation and mitigation) to the national development priorities of
the country. The government could then use those identified technologies to seek funding
from potential investors or financial institutions such as Green Climate Fund (GCF), Global
Environment Facility (GEF).
The inception workshop which facilitated the above process took place in March 2019 in
Nauru and was facilitated by the representatives of UNEP, Asia Institute of Technology (AIT)
and the University of the South Pacific (USP) together with government officials of Nauru
and relevant stakeholders.
1.2 Existing national policies on climate change mitigation and adaptation, and
their development priorities
The Department of Commerce, Industries and Environment (DCIE) has undertaken a desktop
review on existing policies and documents to identify potential areas for inclusion into the
TNA process. The purpose of this review is to identify relevant priority areas and develop
ideas from those identified sectors into potential technologies under adaptation or mitigation
in the country.
The government of Nauru has established its National Sustainable Development Strategy
(NSDS) (2005-2025) as the founding policy to facilitate adaptation and mitigation activities
in the country. One of the primary objectives of the Nauru NSDS is to achieve quality life to
all Nauruan’s across the country. The objective is to maximised benefit from resources but at
the same time ensures that those limited natural resources are sustainably managed for future
generations. This implies, great care must be taken while government, investors and
households extract or harvest its limited resources.
Nauru TNA Report
3
Beside the NSDS, the Nationally Determined Contribution (NDC) also set the priorities for
both the public and private sectors to reduce their anthropogenic emission of GHG into the
atmosphere. This calls for investment in clean and renewable energy across the country. As
noted, the country depends heavily on diesel oil for energy and thus any investment in energy
sector would go a long way in meeting their international obligation to reduce the level of
their emission as stated in the NDC.
The Republic of Nauru (RON) has also developed and implemented a National Policy of
Energy (NPE) in 2014. The objective of this NPE is to provide clear practical pathway towards
achieving sustainable development across the country. The following strategic policy areas
and policy statements have been identified as critical to achieving the overall vision of the
NPE – “Reliable, affordable and sustainable energy, enabling the socio-economic
development of Nauru”.
(i) Power – A reliable, affordable and safe power supply and services.
(ii) Petroleum – A reliable and safe supply of fossil fuels.
(iii) Renewable Energy – 50% of energy used in Nauru comes from renewable sources
by 2020.
(iv) Customers – Universal access to reliable and affordable energy services.
(v) Finance – Financial sustainability of the energy sector.
(vi) Institutional Strengthening and Capacity Building – Efficient, robust and well-
resourced institutions for energy planning and implementation.
(vii) Energy Efficiency and Conservation – An efficient supply and use of energy.
Additionally, the RON government has also established a Framework for Climate Change
Adaptation and Disaster Risk Reduction (RONAdapt) in 2015. The document - represents the
Government of Nauru's response to the risks to sustainable development posed by climate
change and disasters. It aims to do two things.
First, it identifies immediate priorities relating to climate change adaptation (CCA) and
disaster risk reduction (DRR), in order to clearly articulate these for all government ministries,
state owned enterprises (SOE), the private sector, civil society, communities and development
partners to engage with.
Nauru TNA Report
4
Second, it provides a general framework for longer term planning and programming of CCA
and DRR activities, including guidance on their mainstreaming in national and sectoral
development policies. This includes setting out the key principles that are expected to guide
CCA and DRR planning in Nauru, as well as clarity on the roles and responsibilities of
different stakeholders. The priority areas of the RONAdapt are also in agreement with most
of the priorities in this TNA process.
1.3 An overview of Sectors, projected Climate Change and GHG emissions status
and trends of the different sectors
The NSDS outlines the major climate change impacts and geo-hazards for Nauru. The
RONAdapt – represents the Government of Nauru’s response to the risks to sustainable
development posed by climate change and disasters. RONAdapt is intended to support
progress towards the country’s national development priorities and the goal of environmental
sustainability, by ensuring that a focus on reducing vulnerabilities and risks is incorporated
into planning and activities across all sectors of the economy and society. The priority actions
identified here are not intended to be an exhaustive list of CCA and DRR needs. The priorities
outlined in the RONAdapt are intended to contribute to the achievement of the NSDS and to
increasing Nauru’s resilience to climate change and disasters, by targeting the following
goals:
Water security
Energy security
Food security
A healthy environment
A healthy people
Productive, secure land resources
The Nauru TNA process began in March 2018. The government and various stakeholders
participated in that inception workshop as alluded to earlier. As a result of the TNA inception
workshop, the participants have agreed on the priority sectors; as listed in Table 1 for the TNA
process.
Nauru TNA Report
5
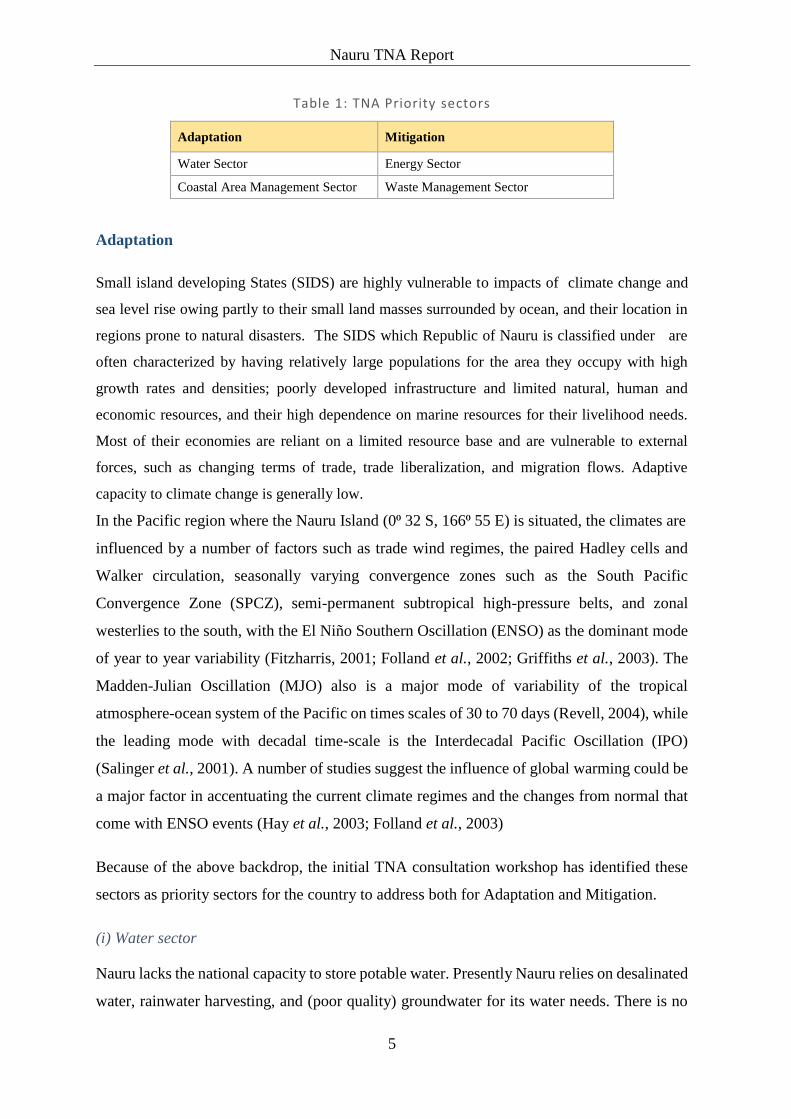
Table 1: TNA Priority sectors
Adaptation Mitigation
Water Sector Energy Sector
Coastal Area Management Sector Waste Management Sector
Adaptation
Small island developing States (SIDS) are highly vulnerable to impacts of climate change and
sea level rise owing partly to their small land masses surrounded by ocean, and their location in
regions prone to natural disasters. The SIDS which Republic of Nauru is classified under are
often characterized by having relatively large populations for the area they occupy with high
growth rates and densities; poorly developed infrastructure and limited natural, human and
economic resources, and their high dependence on marine resources for their livelihood needs.
Most of their economies are reliant on a limited resource base and are vulnerable to external
forces, such as changing terms of trade, trade liberalization, and migration flows. Adaptive
capacity to climate change is generally low.
In the Pacific region where the Nauru Island (0⁰ 32 S, 166⁰ 55 E) is situated, the climates are
influenced by a number of factors such as trade wind regimes, the paired Hadley cells and
Walker circulation, seasonally varying convergence zones such as the South Pacific
Convergence Zone (SPCZ), semi-permanent subtropical high-pressure belts, and zonal
westerlies to the south, with the El Niño Southern Oscillation (ENSO) as the dominant mode
of year to year variability (Fitzharris, 2001; Folland et al., 2002; Griffiths et al., 2003). The
Madden-Julian Oscillation (MJO) also is a major mode of variability of the tropical
atmosphere-ocean system of the Pacific on times scales of 30 to 70 days (Revell, 2004), while
the leading mode with decadal time-scale is the Interdecadal Pacific Oscillation (IPO)
(Salinger et al., 2001). A number of studies suggest the influence of global warming could be
a major factor in accentuating the current climate regimes and the changes from normal that
come with ENSO events (Hay et al., 2003; Folland et al., 2003)
Because of the above backdrop, the initial TNA consultation workshop has identified these
sectors as priority sectors for the country to address both for Adaptation and Mitigation.
(i) Water sector
Nauru lacks the national capacity to store potable water. Presently Nauru relies on desalinated
water, rainwater harvesting, and (poor quality) groundwater for its water needs. There is no

Nauru TNA Report
6
reticulated distribution system. Desalinated water is trucked to households on request. Annual
and seasonal rainfall in Nauru are not statistically significance. This means, it can change due
to looming climatic change should it arise. Furthermore, being so close to the equator, Nauru
does not experience tropical cyclones. However, the main climate extreme experienced by
Nauru is drought, which can last as long as three years. Droughts occur when La Niña events
decrease the surrounding sea-surface temperature, resulting in less cloud and rainfall.
Prolonged droughts cause a lowering of the underground freshwater lens, resulting in water
supply problems and severe stress on natural systems. When this happens it affects the
majority of population on the Island because they depend on rainwater for portable and non-
portable uses.
(ii) Coastal Area Erosion
Almost all of the population of Nauru lives on the coastline areas due to the lack of habitable
land in the interior of the island (because of extensive phosphate mining). Due to the high
population on the coast lines, households are exposed to sea-level rise (SLR) and coastal
erosion. With the looming impact of climate change, storm surges and increasingly high
projection of SLR, increase in storms intensity, duration, and frequency over the years,
communities will continue to be affected by these extreme events.
Mitigation
(i) Energy sector
Electricity on Nauru is generated by diesel generators and solar PV panels where the annual
electrical energy consumption for Nauru is approximately 28 GWh with a daily peak of 4
MW. Diesel engines generate power with an LCOE of AUD0.41. Because diesel is imported,
this poses a risk to Nauru’s generation capacity should that diesel be interrupted. In addition,
the cost of generating electricity is heavily dependent on the cost of diesel. Should that spike,
the cost of power generation will also spike. .
(ii) Waste sector
Nauru faces a range of environmental, social and economic threats from waste management
and pollution. From the environmental perspective, dumpsites threaten underground sources
of water, and air quality, and can also reduce the ability of natural systems such as coral reefs
to cope with other events such as climate change. From a public health standpoint, poor waste
Nauru TNA Report
7
disposal practices encourage mosquitoes, rodents, and other vermin populations, which can
spread diseases. Respiratory and other health problems can also arise from breathing the
fumes from dumpsite fires. Economically, poorly managed wastes affect tourism, fisheries
and agriculture.1
1.3.1 Process and results of sector selection for adaptation and mitigation
Both the National Sustainable Development Strategy (NSDS) of Nauru (2005-2025) and
various national adaptation workshops leading up to the TNA inception workshop have
concluded that water sector, coastal erosion, energy and waste management are amongst the
high priority areas for adaptation and mitigation across the country. With this backdrop, the
Republic of Nauru has requested UNEP if they could be considered as one of the recipients
of the 3rd phase of TNA assistance to the Asia Pacific region.
As part of the TNA preparatory process, the Department of Commerce, Industries and
Environment (DCIE) together with USP and stakeholders had organised an inception
workshop on the Island in March 2018. Part of the process, the DCIE had consulted several
government departments and non-government organisations (NGOs) across the island to
gauge their views on the sectors identified earlier that are vulnerable and likely to be selected
into the TNA initiative.
At the inception workshop that was held in August 2018, the National TNA Coordinator
together with UDP and USP representatives provided an introduction on the objective and
process of the TNA. The team explained the need for the process to be transparent and tailored
towards achieving national priorities and goals. The team introduced the vulnerable sectors
as discovered by desktop review and earlier consultations. The participants have deliberated
on the sectors and selected water and Coastal area management as priority sectors for
adaptation while energy and waste management as priority sectors for mitigation. According
to the participants these are priority sectors that needs urgent consideration for the TNA
process.
1 National Solid Waste Management Strategy 2017-2026 (unpublished version)

Nauru TNA Report
8
The participants who participated in the process were well represented by relevant
government departments, SOE’s, NGO’s and community representatives. Gender issues were
also discussed and considered to finally decide on the four sectors identified above.
Nauru TNA Report
9
Chapter 2: Institutional Arrangement for the TNA and the
Stakeholder Involvement
2.1 National TNA team
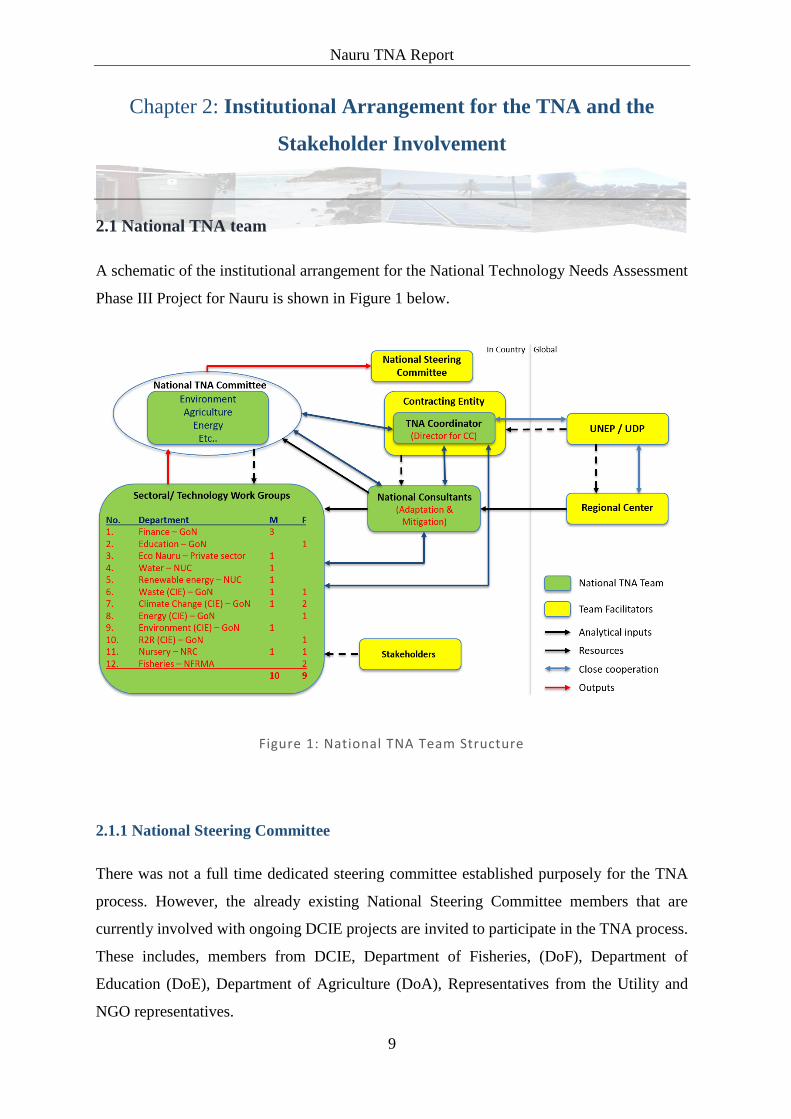
A schematic of the institutional arrangement for the National Technology Needs Assessment
Phase III Project for Nauru is shown in Figure 1 below.
Figure 1: National TNA Team Structure
2.1.1 National Steering Committee
There was not a full time dedicated steering committee established purposely for the TNA
process. However, the already existing National Steering Committee members that are
currently involved with ongoing DCIE projects are invited to participate in the TNA process.
These includes, members from DCIE, Department of Fisheries, (DoF), Department of
Education (DoE), Department of Agriculture (DoA), Representatives from the Utility and
NGO representatives.

Nauru TNA Report
10
2.1.2 The National TNA Coordinator
The Director of the Climate Change division within the DCIE assumes the responsibility as
national TNA coordinator in the country. The Director oversees the recruitment of national
consultants (adaptation and mitigation) for the TNA process and ensure that there are
consultations and workshops held to identify the priority sectors for the TNA process. The
role of the Coordinator also includes presentation of report findings to the NSC for
endorsement.
2.1.3 Sector working groups
Although there are four sectors that has been identified for the TNA process that included (i)
water and coastal area management for adaptation, and (ii) energy and waste management for
mitigation, it was deemed appropriate that the TNA national coordinator and consultants liaise
with and involve the same stakeholders across all four sectors to finalise submissions. This
arrangement is installed due to the small number of stakeholders and also to prevent
duplication of working committees as almost the same people are also responsible for the
various sectors.
2.1.4 TNA National Consultants
The Nauru government has engaged two national consultants, one for adaptation and
mitigation respectively. The roles of the two national consultant are to liaise through the TNA
Coordinator and sector working groups to assess and develop potential technologies for each
of the four identified sectors as provided in Table 1. The consultants also ensure that these
potential technologies are categorised under the priority areas of the country. Consultants will
synthesize findings from the prioritisation process using TFS and MCA for each technology
undertaken during a working group meeting into the TNA report.
2.2 Stakeholder Engagement Process followed in the TNA – Overall assessment
2.2.1 Consultant’s capacity building workshop in Bangkok,
In February 2019 the national consultants for both adaptation and mitigation together with the
designated national TNA authority representative attended a 3-day capacity building training
in Bangkok, Thailand. As part of the training the national TNA team are taught the basic
Nauru TNA Report
11
skills required for the overall planning and conducting a stakeholder’s engagement process in
their country. The national TNA team also had consultation meetings with the
UNEP/AIT/USP representatives on the progress of their TNA process.
2.2.2 Stakeholder selection process
During a bi-lateral session that was conducted during the capacity building workshop in
Bangkok, it was agreed upon by the project coordinators from UNEP DTU Partnership that
due to the small number of stakeholders, it will not be necessary for the Nauru TNA team to
form two sectoral working groups – one each for adaptation and mitigation. Hence a single
working group comprising a wider range of expertise was considered more appropriate for
Nauru’s TNA process.
2.2.3 National Consultation
A TNA inception workshop that was attended by a wide range of stakeholders was held in
March 2018. At this inception workshop, the participants have identified four potential sectors
for the technological need assessment (TNA) process to focus. Latter in June 2019, during the
initial national consultative workshop the participants have reaffirmed the earlier decision to
use the TNA process to identify most relevant potential technologies under those respective
identified sectors to adapt and mitigate the impact of climate change, at the same addressing
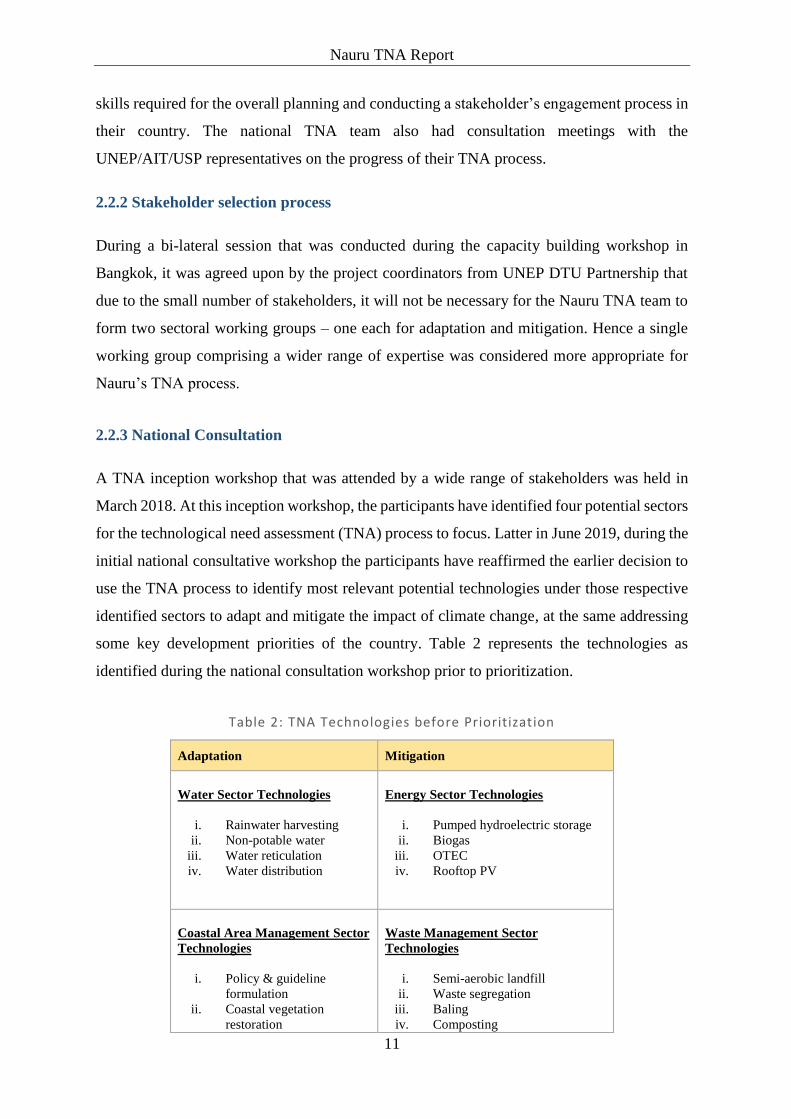
some key development priorities of the country. Table 2 represents the technologies as
identified during the national consultation workshop prior to prioritization.
Table 2: TNA Technologies before Prioritization
Adaptation Mitigation
Water Sector Technologies
i. Rainwater harvesting
ii. Non-potable water
iii. Water reticulation
iv. Water distribution
Energy Sector Technologies
i. Pumped hydroelectric storage
ii. Biogas
iii. OTEC
iv. Rooftop PV
Coastal Area Management Sector
Technologies
i. Policy & guideline
formulation
ii. Coastal vegetation
restoration
Waste Management Sector
Technologies
i. Semi-aerobic landfill
ii. Waste segregation
iii. Baling
iv. Composting

Nauru TNA Report
12
iii. Construction of seawalls
iv. LMMA
2.2.4 Bi-lateral Meetings
Besides the desktop review and national stakeholder consultations, the national consultants
also undertook a series of “one on one” bilateral meetings with relevant stakeholders across
the country. These stakeholders included some government departments, SOE’s and NGOs.
These bi-laterals were to purposely share views on the likely sectors that are critical for urgent
development or investment by the TNA process. There was not any selection done at this
stage but more awareness about the potential TNA initiative. Part of the process, the DCIE
reminds the participating members of the identified vulnerable sectors as stipulated in various
documents such as NSDS and RONAdapt etc.
2.2.5 Technology Need Assessment consultation and reporting
The national TNA team held the second consultation workshop in June 2019. The workshop
was attended by government stakeholders, representatives of the community, non-
government organizations (NGOs) and other invited members of the community. The list of
participants and their respective organizations is provided in Annex 3.
At this workshop the consultants assisted the participants to identify ideas that could
potentially build into technologies under the TNA process. The consultative workshop
produced a number of outputs vital for the technology transfer and needs assessment process
in the country. The following are some of the outputs:
Stakeholders identified and agreed on the potential technologies that should be
pursued and developed further for consideration under the TNA process;
The participants were guided; based on their general understanding of each
technology, on how to initially rank and prioritize these potential technologies under
basic criteria that basically include their viability and capital costs.
The technology taskforce team were also selected and endorsed, this is based on the
technologies that are related to expert areas of participants;
No dedicated steering committee will be formed but the TNA designated authority
with relevant government departments and NGOs will work as steering committee

Nauru TNA Report
13
when needed (this is a capacity limitation, as these are almost the same people working
in the space of climate change in the country);
The step forward for finalizing the technologies were explained to the participants that
initially included preparation of the TFS and inputting fact sheet data to the MCA
spreadsheet.
During the 2-day TNA stakeholder consultation in June 2019, the National consultants
realized that they needed more time for research to prepare realistic TFS’ for the stakeholder
prioritized technologies that were identified in day one. Stakeholders were advised that
without the TFS, the MCA cannot be carried out. This matter was discussed by both
consultants before making recommendations to the Project Coordinator that the consultants
will each need to prepare their respective TFS and have these validated by the stakeholders
prior to using in the MCA process. Unfortunately, this was not possible as very few
stakeholders turned up on the proposed workshop day to go through the MCA process.
Alternatively, due to time limitations, the MCA process was carried out by the consultants
and results; together with the TFS were emailed to all stakeholders for their comments. The
outcome of this MCA process are presented in the next four chapters and the TFS in Annex
1.
2.3 Consideration of Gender Aspects in the TNA process
Climate change affects all members of society and its impacts can be different for men and
women. Hence it is important to understand the gender dimension when working on climate
change adaptation and mitigation measures, because of the different gender roles that women
and men play in their society or community. In the Pacific region the different gender roles
are influenced by culture, social systems, local institutions and religion, and it varies across
communities. One of the vital factors in society structural system is the gender relations
between men and women, to understand the power relations between women and men through
the different gender roles they play in their families and community. In general this factor
often place a woman in a vulnerable situation compared to men even during disastrous or
important and critical events.
To rectify that imbalance between men and women in the Nauru context in this TNA
process, there is a high level of gender participation across all sectors as shown in Table 3.
This was demonstrated through the engagement of the women and girls at the consultation
stage within the community, government and private sectors. The intension to engage women

Nauru TNA Report
14
and young girls to participate in the process is to ensure that their views and concerns are
incorporated into deciding on which sector and technologies are to be selected under the TNA
process. The TNA process provides for not only engagement but allowing them to participate
in the decision making process.
Table 3: TNA Gender Sectoral/ Technology Working Group
No. Departments Gender
Male Female
1. Finance – GoN 3 -
2. Education – GoN - 1
3. Eco-Nauru - Private sector 1 -
4. Water – NUC 1 -
5. Renewable energy – NUC 1 -
6. Waste (CIE) - GoN 1 1
7. Climate Change (CIE) – GoN 1 2
8. Energy (CIE) – GoN - 1
9. Environment (CIE) – GoN 1 -
10. R2R (CIE) – GoN - 1
11. Nursery – NRC 1 1
12. Fisheries – NFRMA - 2
Total: 10 9
2.4 National Policies supporting Gender mainstreaming into the TNA process.
To support the TNA process, the Nauru National Development Strategy (2005-2025) and the
Republic of Nauru, Framework for climate change adaptation and disaster risk reduction
(2015) ensure that children and women are considered and involved in the community
development and resilience program at the local level. This set the foundation for the TNA
process to engage these vulnerable members of the community in the planning, decision
making and future management of these projects when implemented.
During the TNA inception workshop and consultations, the DCIE was vested with the
responsibility as the leading Government Department dealing with the process of TNA in the
country. The DCIE acts at the designated National Authority that will oversee the TNA
process within the next two years.
Nauru TNA Report
15
Chapter 3: Technology Prioritisation for Adaptation in the Water
Sector
3.1 Key Climate Change Vulnerabilities in the water sector
Nauru has little or no source of surface freshwater and is susceptible to extreme climate events
such as prolonged droughts, which can cause severe damage to socio-economic activities,
infrastructure, agriculture and biodiversity2. During periods where there is little or no rain for
more than 3 months, Nauru’s water supply situation deteriorates dramatically, and
production capacity becomes stressed. If the RO units break down during drought periods,
Nauru faces a social and health disaster.3
3.2 Decision context
Small island nations in the Pacific, such as Nauru, have critical water supply problems. Nauru
is a permeable island with very little surface runoff and no rivers or reservoirs. Potable water
is collected in rainwater tanks from the roofs of domestic and commercial buildings. Water
for non-potable uses is obtained from domestic bores at houses around the island. There are
four small desalination plants on the island, of which two are operating and supply Menen
Hotel and the refugee camp.4
3.3 Overview of Existing Technologies in the water sector
3.3.1 Production
Nauru currently rely on 5 reverse-osmosis units that are illustrated in Table 4. All these are
operational to produce desalinated water for potable use around the island. NUC is responsible
2 http://www.asiapacificadapt.net/adaptation-practices/piloting-climate-change-adaptation-water-resources-management-nauru
3 https://www.pacificclimatechange.net/country/nauru
4 National IWRM Diagnostic Report 2007

Nauru TNA Report
16
for maintaining all five desalination units to ensure they produce at their maximum potential.
Three of the five units are operated by the Refugee Processing Center (RPC).
Table 4: RO desalination units on Nauru
No. Reverse-osmosis brand Capacity (kL/day) Operated & serviced by
1. Osmoflo 900 NUC/ RPC
2. Avanale 800 NUC/ RPC
3. Avanale 480 NUC/ RPC
4. Hitachi 100 NUC
5. Avanale 100 NUC
In total, Nauru’s current water production capacity is 2,380 kL per day. With an estimated
population of 12,000, the water production capacity equates to approximately 200 l/ c/ d. The
WHO optimal level of water access to eliminate health concerns is 100 l/ c/ d.5
3.3.2 Storage
NUC has seven (7) water storage tanks that are currently in use; as illustrated in Table 5, with
a total storage capacity of 4,420 kL. NUC recently purchased a 300 kL tank that is yet to
arrive and to be installed next to tank B13. This additional storage will increase capacity to
4,700 kL. In comparison with water production capacity, storage capacity is almost double.
Table 5: NUC water storage capacity
No. Water storage
tank Capacity (kL) Type
1. B13 2,800 Steel
2. C1 270 Concrete (underground)
3. C2 270 Concrete (underground)
4. C3 270 Concrete (underground)
5. C4 270 Concrete (underground)
6. C5 270 Concrete (underground)
7. C6 270 Concrete (underground)
5 https://www.who.int/water_sanitation_health/diseases/WSH0302.pdf

Nauru TNA Report
17
3.3.3 Delivery
There is no potable water reticulation system on Nauru apart from a brackish or non-potable
water reticulation system that was installed in Meneng under the USP-PACE SD/ EU-GCCA
adaptation project 2013-2017. The system pumps brackish water from the coast up to to
several reservoirs which then provides gravity fed water to residential homes at Meneng
Statehouse and Terrace for non-potable use such as toilet flushing and washing.
NUC is also responsible for the delivery of water right around the island. Water delivery is
normally carried out during the week, however, during dry period’s water trucks will need to
work around the clock 7 days a week to meet the demand. NUC currently own and operate 4
water trucks with an additional 3 to be added to existing fleet. Tank capacity for these trucks
are provided in Table 6.
Table 6: NUC water trucks
No. Water delivery
truck number Capacity (L) In-service
1. AAB 487 12,000 Yes
2. AAB 488 12,000 Yes
3. AAB 135 7,000 Yes
4. AAB 466 5,000 Yes
5. N/A 8,000 Not yet
6. N/A 8,000 Not yet
7. N/A 5,000 Not yet
3.3.4 Rainwater harvesting from rooftop catchments
Rainwater is a critical resource that is captured from the rooftop and stored in storage tanks.
However, rainwater is significantly reduced during droughts or dry seasons, thus people
cannot rely on rainwater to meet their water needs.
3.3.5 Groundwater access and quality
Groundwater is available in some locations, but these supplies are contaminated and not
suitable for drinking. Domestic well depth to groundwater around the island ranges from 0.6
to 11.2m with salinity level ranging from 300 – 20,300 µS/ cm. The main use of groundwater

Nauru TNA Report
18
is for showering, washing (kitchen & laundry), toilet flushing and for lawn and garden
irrigation.
3.4 Adaptation Technology Options for water sector and their Main Adaptation
benefits
The following adaptation technologies were identified in consultation with stakeholders as
key technologies in the water resources sector in Nauru. The TFS for each of the technologies
were prepared by the National adaptation consultant and was emailed to all the stakeholders
for validation. For this process, stakeholders were given ample time for the opportunity to
provide their comments and suggestions. Main adaptation benefits for these technologies are
summarised below and fact sheets are provided in Annex 1.
3.4.1 Rainwater harvesting
Rooftop rainwater harvesting is a combination of water catchment and storage system. This
system is effective and has always been a sustainable solution for climate adaptation in Nauru
given its very limited water resource. Every building on Nauru; commercial and domestic,
have in place rooftop rainwater harvesting systems that include guttering, downpipes and
water catchment systems. With an average annual rainfall of 2,000 mm, an average roofing
footprint area of 50 m² can capture as much as 100,000 litres of rainwater per year. Rainwater
harvesting systems not only used to catch rainwater for daily consumption, but also as a source
for water storage during dry periods. The demand for rainwater harvesting systems on Nauru
is endless given the ongoing building and construction of new domestic and commercial
buildings and maintenance and repairs with aging systems.
3.4.2 Non-potable water
Nauru’s sources of non-potable water include brackish and sea water. Brackish water can
supply 80 % per capita requirements per day when based on WHO 100 L/c/d requirements.
This equates to 80 litres of brackish water that can be used for showering, washing clothes
and dishes and toilet flushing per person. While 20 litres of potable water is considered
sufficient for daily use for cooking and drinking per person. In Nauru, brackish water is
available to some 60% of domestic homes and is available to some commercial and

Nauru TNA Report
19
government buildings mainly for lavatory use. An increase in the percentage of household
access to brackish water is key to reduction of potable-water demand and hence production.
3.4.3 Water reticulation
Water reticulation system is a form or ease of water accessibility technology where water is
easily obtainable through household taps. This system is common in developed countries
where water resources are available in abundance. However, for developing countries with
limited water resources like Nauru, not only the high infrastructure costs is a concern, but
more also on the behavioural use of reticulated water can become an issue. This system if
introduced in Nauru will need to be managed properly.
3.4.4 Water distribution
Water is currently distributed to household water tanks by water trucks. These same water
tanks also serve as part or storage for rainwater harvesting systems. The demand for water
delivery is usually peak during drought periods with delivery rate restricted to the number of
water trucks available. The water production rates and storage capacity can be a contributing
factor to the restriction of water availability. One major advantage or benefit of water
distribution by water trucks is the capacity to control the frequency of deliveries while
maintaining control of water production.
3.5 Criteria and process of technology prioritisation for water sector
During this process, the multi-criteria analysis (MCA) tool is used in ranking the four (4)
identified technologies in their priority order based on a set of criteria that are relevant to
country context. A list of criteria categories, sub-categories and criterion to be considered for
the water sector technology prioritisation are provided in Table 7.
Table 7: Selection criteria for technologies in the water sector
Criteria Category Criteria Sub-Category Criterion
Cost Cost Cost to set-up & operate per
beneficiary/ year
Benefits Economic
Improving household income &
ability to re-invest
Trigger private investment
Social Poverty reduction

Nauru TNA Report
20
Gender aspects
Environment Contribution to protect & sustain
ecosystem services
Climate related Improvement of resilience to CC
Others
Institutional/ implementation Ease of implementation
Replicability
Political Coherence with national
development policies & priority
Each criterion is given a scoring range (0-100) and a preferred scoring value (0 or 100) as
shown in Table 8.
Table 8: Criteria scoring scales & preferred values for Water Sector
No. Criteria
Category
Criteria Sub-
Category Criterion Scoring Scale
Preferred
Value
1. Cost
Set-up &
operation cost/
beneficiary/year
0 = very low cost
100 = high cost
0 = very low
cost
2.
Benefits
Economic
Improving
household
income &
ability to re-
invest
0 = very low
100 = very high 100 = very high
3. Trigger private
investment
0 = very low
100 = very high 100 = very high
4.
Social
Poverty
reduction
0 = very low
100 = very high 100 = very high
5. Gender aspects
0 = no consideration
of gender issues
100= High
consideration
100=
mainstreaming
& high
consideration of
gender issues
6. Environment
Contribution to
protect &
sustain
ecosystem
services
0 = very low
100 = very high 100 = very high
7. Climate related Improvement of
resilience to CC
0 = very low
100 = very high 100 = very high
8.
Others
Institutional/
implementation
Ease of
implementation
0 = very difficult
100 = very easy 100 = very easy
9. Replicability 0 = very difficult
100 = very easy 100 = very easy
10. Political
Coherence with
national
development
policies &
priority
0 = very low
100 = very high 100 = very high

Nauru TNA Report
21
3.6 Results of technology prioritisation for water sector
At the beginning of the MCA process, scores (1-100) are manually inputted for each
technology criterion in the Excel performance matrix table as illustrated in Table 9. These
scores are automatically calculated and displayed in the Normalised scoring matrix (Table 10)
and the scores and weights combined tables (Table 11).
Table 9: Performance matrix table for water sector
No. Criteria
Technology
Rainwater
harvesting
Non-potable
water
Water
reticulation
Water
distribution
1. Cost to set-up & operate per
beneficiary/ year 85 65 45 75
2. Improving household income &
ability to re-invest 85 80 80 60
3. Trigger private investment
60 40 80 60
4. Poverty reduction
100 100 100 80
5. Gender aspect 100 80 100 100
6. Contribution to protect &
sustain ecosystem services 100 100 60 80
7. Improvement of resilience to
CC 100 60 100 60
8. Ease of implementation
100 80 80 80
9. Replicability
80 60 70 80
10. Coherence with national
development policies & priority 100 100 100 80
The normalised scoring results in Table 10 are obtained from the equations provided in Annex
6. At this stage, no ranking is provided.
Table 10: Normalised scoring matrix table for water sector
No. Criterion
Technology
Rainwater
harvesting
Non-potable
water
Water
reticulation
Water
distribution
1. Cost to set-up & operate per
beneficiary/ year 0 50 100 25
2. Improving household income &
ability to re-invest 100 80 80 0
3. Trigger private investment
50 0 100 50
4. Poverty reduction
100 100 100 0
5. Gender aspects 100 0 100 100

Nauru TNA Report
22
6. Contribution to protect &
sustain ecosystem services 100 100 0 50
7. Improvement of resilience to CC
100 0 100 0
8. Ease of implementation
100 0 0 0
9. Replicability
100 0 50 100
10. Coherence with national
development policies & priority 100 100 100 0
In Table 11, the scores are obtained by multiplying the scores in the normalised scoring matrix
table by the applied criterion weight. In this case the criterion weights are all the same and
add up to 100.
Table 11: Scores & equal weights combined for water sector
No. Criterion
weight Criterion
Technology
Rainwater
harvesting
Non-
potable
water
Water
reticulation
Water
distribution
1. 10 Cost to set-up & operate per
beneficiary/ year 0 500 1,000 250
2. 10 Improving household income &
ability to re-invest 1,000 800 800 0
3. 10 Trigger private investment
500 0 1,000 500
4. 10 Poverty reduction
1,000 1,000 1000 0
5. 10 Gender aspects 1,000 0 1,000 1,000
6. 10 Contribution to protect &
sustain ecosystem services 1,000 1,000 0 500
7. 10 Improvement of resilience to
CC 1,000 0 1,000 0
8. 10 Ease of implementation
1,000 0 0 0
9. 10 Replicability
1,000 0 500 1,000
10. 10 Coherence with national
development policies & priority 1,000 1,000 1,000 0
100 Total scores 8,500 4,300 7,300 3,250
Ranking 1 3 2 4
For equal criterion weights, rainwater harvesting was awarded the highest score with water
reticulation in second.
Because the criteria that are selected for evaluating the usefulness of each technology may not
be equally important to the decision, or to the achievement of the overall goal, different
Nauru TNA Report
23
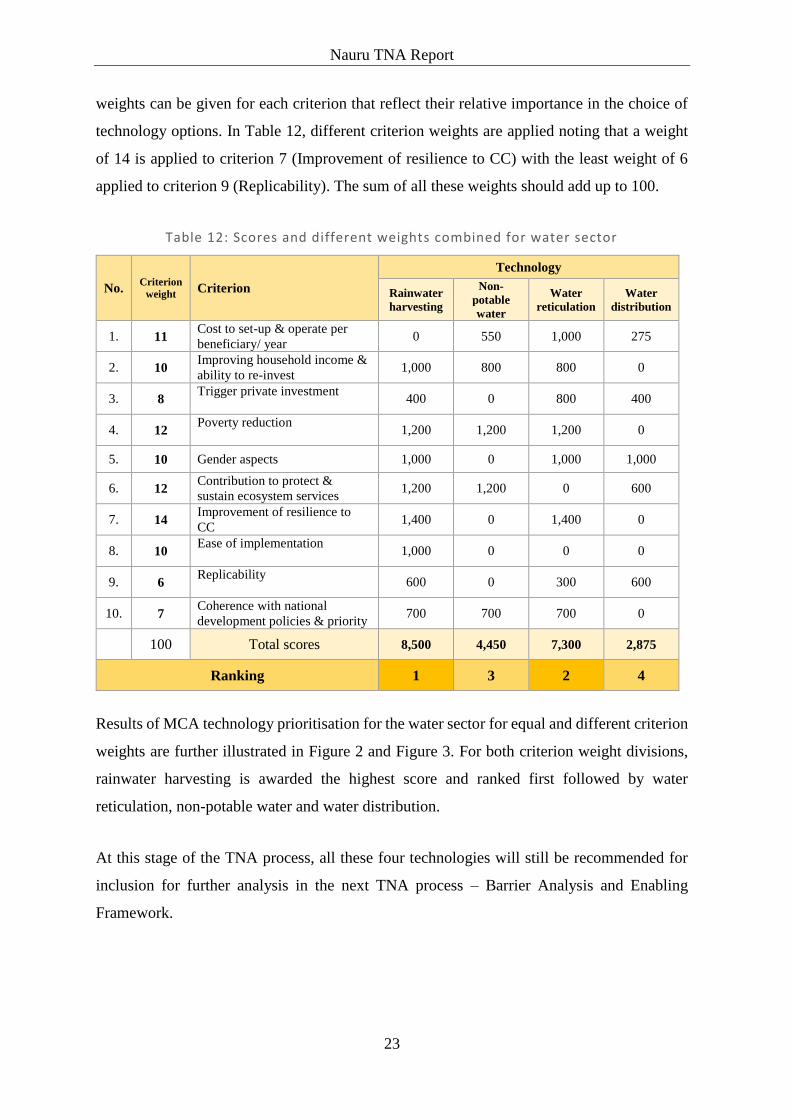
weights can be given for each criterion that reflect their relative importance in the choice of
technology options. In Table 12, different criterion weights are applied noting that a weight
of 14 is applied to criterion 7 (Improvement of resilience to CC) with the least weight of 6
applied to criterion 9 (Replicability). The sum of all these weights should add up to 100.
Table 12: Scores and different weights combined for water sector
No. Criterion
weight Criterion
Technology
Rainwater
harvesting
Non-
potable
water
Water
reticulation
Water
distribution
1. 11 Cost to set-up & operate per
beneficiary/ year 0 550 1,000 275
2. 10 Improving household income &
ability to re-invest 1,000 800 800 0
3. 8 Trigger private investment
400 0 800 400
4. 12 Poverty reduction
1,200 1,200 1,200 0
5. 10 Gender aspects 1,000 0 1,000 1,000
6. 12 Contribution to protect &
sustain ecosystem services 1,200 1,200 0 600
7. 14 Improvement of resilience to
CC 1,400 0 1,400 0
8. 10 Ease of implementation
1,000 0 0 0
9. 6 Replicability
600 0 300 600
10. 7 Coherence with national
development policies & priority 700 700 700 0
100 Total scores 8,500 4,450 7,300 2,875
Ranking 1 3 2 4
Results of MCA technology prioritisation for the water sector for equal and different criterion
weights are further illustrated in Figure 2 and Figure 3. For both criterion weight divisions,
rainwater harvesting is awarded the highest score and ranked first followed by water
reticulation, non-potable water and water distribution.
At this stage of the TNA process, all these four technologies will still be recommended for
inclusion for further analysis in the next TNA process – Barrier Analysis and Enabling
Framework.
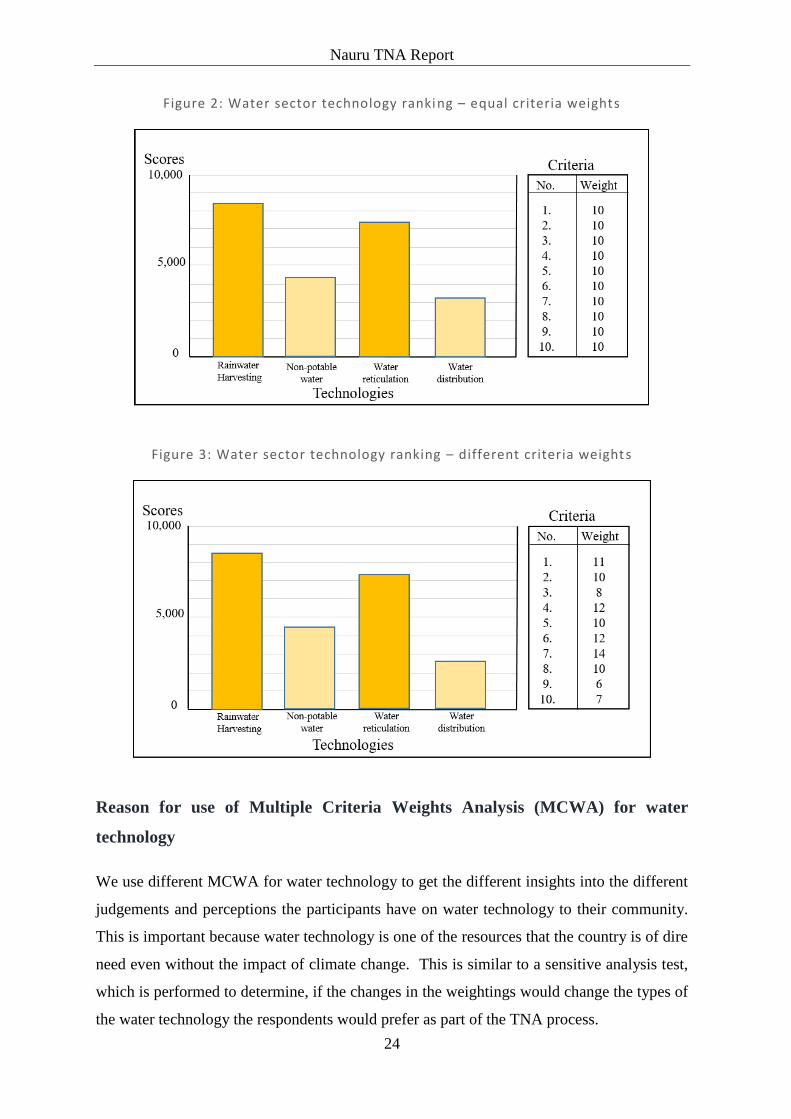
Nauru TNA Report
24
Figure 2: Water sector technology ranking – equal criteria weights
Figure 3: Water sector technology ranking – different criteria weights
Reason for use of Multiple Criteria Weights Analysis (MCWA) for water
technology
We use different MCWA for water technology to get the different insights into the different
judgements and perceptions the participants have on water technology to their community.
This is important because water technology is one of the resources that the country is of dire
need even without the impact of climate change. This is similar to a sensitive analysis test,
which is performed to determine, if the changes in the weightings would change the types of
the water technology the respondents would prefer as part of the TNA process.

Nauru TNA Report
25
Chapter 4: Technology Prioritisation for Adaptation in the
Coastal Sector
4.1 Key Climate Change Vulnerabilities in the coastal sector
At the national and community scale in Nauru, some of the factors that create vulnerability
are; scare water resources, limited land soil resources, environmental degradation, and high
concentration on income activities, dependent on imports, geographical isolation, low human
capacity, chronic health problems and recently sea level rise and coastal erosions. Sea level
rise was estimated to be 5mm average mean per annum which was more than the average
global mean of about 3.2mm. This challenge embedded with high population density along
the coast line area, there is virtually the risk of coastal erosion and land degradation at these
vulnerable zones.
4.2 Decision context
The increasing coastal erosion, soil inundation and SLR surrounding the inhabited areas on
the Island makes communities resort to options aimed to prevent them from impacts of these
climate induced events and disasters. The communities resort to participating in preventive
options such as replenishment of vegetation along the coast line area, building sea walls,
reclaiming of land and potential establishment of locally management marine protected area
(LMPA) as means of costal area management at designated sites.
4.3 Overview of Existing Technologies in the coastal sector
Sea walls – There are several location along the coast line which the government, aid donor
partners and communities have invested in building of sea walls and barriers against the
coastal erosion and SLR. The barriers are costly but provide the short term solutions to the
increasing impact of climate change especially salt water inundation, coastal soil erosion, and
land degradation along the coast lines.
Coastal line revegetation -The communities also participate in coastal line revegetation at
various locations around the island. This is aimed to restore the natural vegetation that were

Nauru TNA Report
26
removed along the coast line area due to over population or human anthropogenic activities
over the past years.
4.4 Adaptation Technology Options for coastal sector and their Main Adaptation
benefits
The stakeholders consultations has overwhelmingly identify and agreed that these are the
potential technologies that should be pursuit through the TNA process. These technologies
would benefit the communities in many ways.
4.4.1 Policy & guideline formulation
The consultation process has agreed that there should be a development of Policy and
guideline formulation to oversee future coastal line area development across the Island. The
participants have pointed out during the consultation process that currently there is no policy
or framework to provide guidance on coast line area development so there is penalty imposed
on developers who destroy the coast line area during development.
The consultation process also agreed that there should be a vulnerability assessment (V&A)
done across the country to identify vulnerable zones or areas so that future sea walls or soil
erosion barriers should be erected at these identified sites. The benefit from this strategy is to
ensure that sea walls and barriers are built at areas that are mostly vulnerable and needs urgent
preventive measure against further erosions.
Besides this, the country should also develop a policy to ensure that any development
initiative along the coast line must undergo an Environment Impact Assessment (EIA)
requirement. The EIA process should be a compulsory requirement for granting permit to
potential developers along the coastline areas. The benefit of this procedural policy
requirement is that developers identify potential damage to the environment and proper
measures are taken prior to such development is initiated to minimise and mitigate such
potential loss to the environment.
Nauru TNA Report
27
4.4.2 Coastal vegetation restoration
There are handful of coastal vegetation restoration along the coast line areas across the island.
This initiative needs to be enhanced and advocated nation-wide as these communities are
exposed to increasing impacts of climate change and soil erosion.
The benefit of these coast revegetation is that it will bring back the much needed coast
vegetation such as local mangroves and trees along the coast against SLR but also help to
hold the soil together from being washed away by land degradation and erosion.
4.4.3 Construction of seawalls
Sea wall construction is potentially seeing as the short to medium term solution to the impact
of climate change, especially against soil erosion and sea level rise around the island. The
benefit of this technology is that it provide refuge immediately to the low lying communities
(since about 90% of the houses are built at the coast areas). The down side to this technology
is that, there are no policy surrounding construction of these structures and no V&A, EIA or
even cost benefit analysis (CBA) made before committing to such development.
Going forward, the responsible authority must ensure that such structure (sea wall) is assessed
well before any decision to invest into it. The collateral costs on vegetation and other habitat
in the area must also be assessed.
4.4.4 LMMA
The fourth technology is the introduction of locally managed marine protected area (LMMA)
at selective sites around the island. The benefit of this LMMA is that community participate
in protecting their marine resources from depletion as part of food security but at the same
time participate in managing the coastal areas from soil erosion and land degradation. For this
technology the communities have to identify potential sea area (preferably coral reef area)
and declare this location as “taboo” place not to fish but at the same time protect its adjacent
beaches from extraction as well.
This could be seen as integrated approach towards conservation as and resource management
as the beaches and marine resources are protected from exploitation. The downside of this
could be the complexity of land ownership and sometimes individuals or tribal groups who
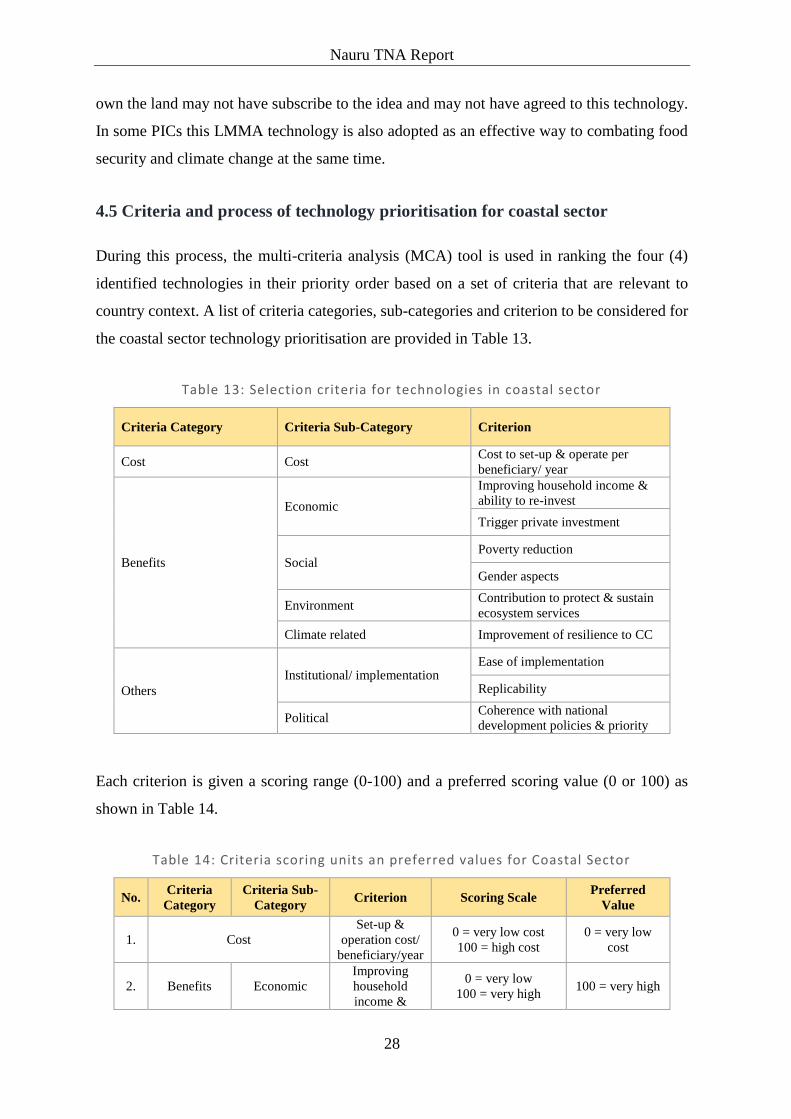
Nauru TNA Report
28
own the land may not have subscribe to the idea and may not have agreed to this technology.
In some PICs this LMMA technology is also adopted as an effective way to combating food
security and climate change at the same time.
4.5 Criteria and process of technology prioritisation for coastal sector
During this process, the multi-criteria analysis (MCA) tool is used in ranking the four (4)
identified technologies in their priority order based on a set of criteria that are relevant to
country context. A list of criteria categories, sub-categories and criterion to be considered for
the coastal sector technology prioritisation are provided in Table 13.
Table 13: Selection criteria for technologies in coastal sector
Criteria Category Criteria Sub-Category Criterion
Cost Cost Cost to set-up & operate per
beneficiary/ year
Benefits
Economic
Improving household income &
ability to re-invest
Trigger private investment
Social Poverty reduction
Gender aspects
Environment Contribution to protect & sustain
ecosystem services
Climate related Improvement of resilience to CC
Others
Institutional/ implementation Ease of implementation
Replicability
Political Coherence with national
development policies & priority
Each criterion is given a scoring range (0-100) and a preferred scoring value (0 or 100) as
shown in Table 14.
Table 14: Criteria scoring units an preferred values for Coastal Sector
No. Criteria
Category
Criteria Sub-
Category Criterion Scoring Scale
Preferred
Value
1. Cost
Set-up &
operation cost/
beneficiary/year
0 = very low cost
100 = high cost
0 = very low
cost
2. Benefits Economic
Improving
household
income &
0 = very low
100 = very high 100 = very high

Nauru TNA Report
29
ability to re-
invest
3. Trigger private
investment
0 = very low
100 = very high 100 = very high
4.
Social
Poverty
reduction
0 = very low
100 = very high 100 = very high
5. Gender aspects
0 = no consideration
of gender issues
100= High
consideration
100=
mainstreaming
& high
consideration of
gender issues
6. Environment
Contribution to
protect &
sustain
ecosystem
services
0 = very low
100 = very high 100 = very high
7. Climate related Improvement of
resilience to CC
0 = very low
100 = very high 100 = very high
8.
Others
Institutional/
implementation
Ease of
implementation
0 = very difficult
100 = very easy 100 = very easy
9. Replicability 0 = very difficult
100 = very easy 100 = very easy
10. Political
Coherence with
national
development
policies &
priority
0 = very low
100 = very high 100 = very high
4.6 Results of technology prioritisation for coastal sector
At the beginning of the MCA process, scores are manually inputted for each criterion in the
performance matrix table as illustrated in Table 15. These scores are based on the TFS. These
scores are automatically calculated and displayed in the Normalised scoring matrix (Table
16). The results in Table 16 are further calculated with results produced in the Scores and
weights combined tables (Table 17).
Table 15: Performance matrix table for coastal sector
No. Criterion
Technology
Policy &
guideline
formulation
Coastal
vegetation
restoration
Construction
of seawalls LMMA
1. Set-up & operation cost/
beneficiary/ year 15 25 90 25
2. Improving household income &
ability to re-invest 65 60 40 65
3. Trigger private investment 75 65 55 60

Nauru TNA Report
30
4. Poverty reduction
45 55 35 60
5. Gender aspects 85 100 85 85
6. Contribution to protect &
sustain ecosystem services 100 100 95 100
7. Improvement of resilience to
CC 95 95 85 90
8. Ease of implementation
50 55 35 85
9. Replicability
65 75 45 85
10. Coherence with national
development policies & priority 100 100 85 95
The normalised scoring results in Table 16 are obtained from the equations provided in Annex
6.
Table 16: Normalised scoring matrix table for coastal sector
No. Criterion
Technology
Policy &
guideline
formulation
Coastal
vegetation
restoration
Construction
of seawalls LMMA
1. Set-up & operation cost/
beneficiary/ year 100 87 0 87
2. Improving household income &
ability to re-invest 100 80 0 100
3. Trigger private investment
100 50 0 25
4. Poverty reduction
40 80 0 100
5. Gender aspects 0 100 0 0
6. Contribution to protect &
sustain ecosystem services 100 100 0 100
7. Improvement of resilience to
CC 100 100 0 50
8. Ease of implementation
30 40 0 100
9. Replicability
50 75 0 100
10. Coherence with national
development policies & priority 100 100 0 67
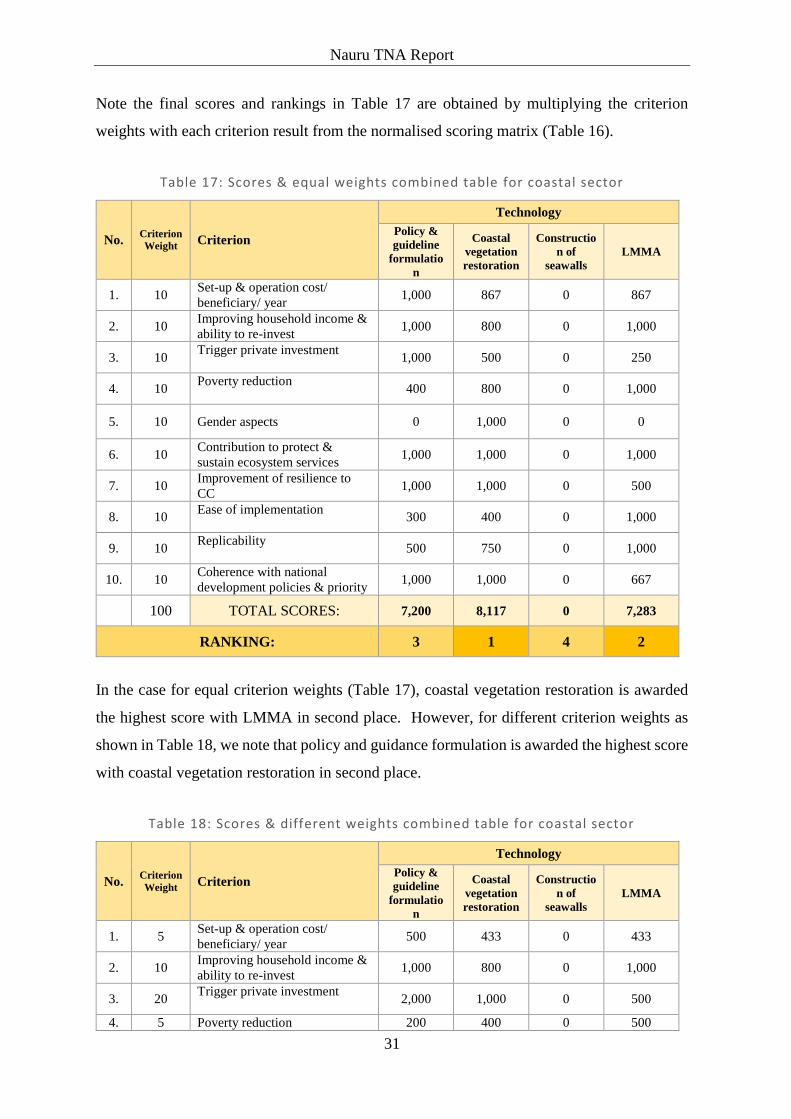
Nauru TNA Report
31
Note the final scores and rankings in Table 17 are obtained by multiplying the criterion
weights with each criterion result from the normalised scoring matrix (Table 16).
Table 17: Scores & equal weights combined table for coastal sector
No. Criterion
Weight Criterion
Technology
Policy &
guideline
formulatio
n
Coastal
vegetation
restoration
Constructio
n of
seawalls
LMMA
1. 10 Set-up & operation cost/
beneficiary/ year 1,000 867 0 867
2. 10 Improving household income &
ability to re-invest 1,000 800 0 1,000
3. 10 Trigger private investment
1,000 500 0 250
4. 10 Poverty reduction
400 800 0 1,000
5. 10 Gender aspects 0 1,000 0 0
6. 10 Contribution to protect &
sustain ecosystem services 1,000 1,000 0 1,000
7. 10 Improvement of resilience to
CC 1,000 1,000 0 500
8. 10 Ease of implementation
300 400 0 1,000
9. 10 Replicability
500 750 0 1,000
10. 10 Coherence with national
development policies & priority 1,000 1,000 0 667
100 TOTAL SCORES: 7,200 8,117 0 7,283
RANKING: 3 1 4 2
In the case for equal criterion weights (Table 17), coastal vegetation restoration is awarded
the highest score with LMMA in second place. However, for different criterion weights as
shown in Table 18, we note that policy and guidance formulation is awarded the highest score
with coastal vegetation restoration in second place.
Table 18: Scores & different weights combined table for coastal sector
No. Criterion
Weight Criterion
Technology
Policy &
guideline
formulatio
n
Coastal
vegetation
restoration
Constructio
n of
seawalls
LMMA
1. 5 Set-up & operation cost/
beneficiary/ year 500 433 0 433
2. 10 Improving household income &
ability to re-invest 1,000 800 0 1,000
3. 20 Trigger private investment
2,000 1,000 0 500
4. 5 Poverty reduction 200 400 0 500

Nauru TNA Report
32
5. 5 Gender aspects 0 500 0 0
6. 25 Contribution to protect &
sustain ecosystem services 2,500 2,500 0 2,500
7. 10 Improvement of resilience to
CC 1,000 1,000 0 500
8. 5 Ease of implementation
150 200 0 500
9. 5 Replicability
250 375 0 500
10. 10 Coherence with national
development policies & priority 1,000 1,000 0 667
100 TOTAL SCORES: 8,600 8,208 0 7,100
RANKING: 1 2 4 3
The tabulated results for coastal sector are reproduce in graph form in Figure 4 and Figure 5.
However, at this stage the ranking is not final as all these four technologies will be
recommended for inclusion for further analysis in the next TNA process – Barrier Analysis
and Enabling Framework.
Figure 4: Coatal sector technology ranking – equal criteria weights

Nauru TNA Report
33
Figure 5: Coastal sector technology ranking – different criteria weights

Nauru TNA Report
34
Chapter 5: Technology Prioritisation for Mitigation in the Energy
Sector
5.1 Existing technologies and GHG emissions for the energy sector
5.1.1 Diesel Power Generation
The NUC power station has 13 diesel generators with design capacities ranging from 1 MW
to 2.8 MW as illustrated in Table 19. Six of these generators are medium speed sets used
mainly for base and continuous load while the high speed generator sets are for standby
emergency power.
Table 19: NUC diesel generating sets
No. Generator Speed
Design
Capacity
(MW)
Operation
al
Capacity
(MW)
Status
1. G1 – Ruston Medium 2.8 2.4
Not in service.
To be refurbished & commissioned Nov.
2018.
2. G2 – MAN
Diesel Medium 2.8 2.8
In service/ Standby
Operational
3. G3 – MAN
Diesel Medium 2.8 2.8
In service/ Standby
Operational
4. G4 – Ruston Medium 2.8 2.6 Not in service.
Commissioning planned for Aug. 2018
5. G5 – Ruston Medium 1.0 0.8
Not in service.
Major overhaul planned for completion by
March 2019
6. G6 – Ruston Medium 2.0 2.0
Not in service.
Major refurbishment in progress. Planned
commissioning by July 2018
7. G2A –
Cummins High 1.0 0.8
In service/ Stand-by
Operational.
8. G2B –
Cummins High 1.0 0.8
In service/ Stand-by
Operational.
9. G3 – Cummins High 1.0 0.8 In service/ Stand-by
Operational
10. G4 – Cummins High 1.0 0.8 In service/ Stand-by
Operational
11. G5 – Cummins High 1.0 0.8 In service/ Standby
Operational
12. G7A – MTU High 1.0 0.8 In service/ Stand-by
Operational.
13. G7B –
Cummins High 1.0 0.8
In-service/ Stand-by
Operational.

Nauru TNA Report
35
Nauru currently has an installed design capacity of 21.2 MW with an operational capacity of
19 MW. However, out of the 13 generators that are installed, 9 of these are operational with
total capacity of 11.2 MW.
5.1.2 Renewable Energy
There are also a number of existing solar systems in Nauru that are monitored by NUC.
Currently, there is an installed solar panel capacity of 807 kW that represents 5% of the
island’s current energy demand. The planned Meneng (MFAT) 1,000 kW solar farm project
is in its final construction stages and is scheduled for commissioning in late August 2019.
This will increase the installed solar panel capacity to 1,807 kW.
Site clearing is in progress for the installation of a 6 MW grid-connected solar farm that is
being funded by ADB. There are also potential installations of 2,030 kW. More information
on these solar panels are provided in the Table 20.
Table 20: Existing, planned and potential solar panels
Name Connection System Capacity
(kW)
Existing 807
Buada (UAE) Grid connected Ground-mounted 500
Noddy Building Grid connected Roof-mounted 138
Government Building Grid connected Roof-mounted 52
NUC Office Grid connected Roof-mounted 20
NGH (Hospital) Behind the meter Roof-mounted 22
Od-N-Aiwo Hotel Behind the meter Roof-mounted 5
Nauru College Behind the meter Roof-mounted 40
Capelle Apartments Behind the meter Roof-mounted 30
Angelique Ika Behind the meter Roof-mounted N/A
Menen Disabled School Behind the meter Roof-mounted N/A
Planned 7,100
Meneng (MFAT) Grid connected Ground-mounted 1,000
Capelle & Partner Behind the meter Roof-mounted 100
Meneng – (ADB) Grid connected Ground-mounted 6,000
Potential 2,030
Capelle & Partner Behind the meter Roof-mounted 200
Prison Grid connected Roof-mounted 300
Sports Centre Grid connected Roof-mounted 330
Hospital Grid connected Roof-mounted 200
Civic Centre Grid connected Roof-mounted 500
Private property Behind the meter Roof-mounted 500
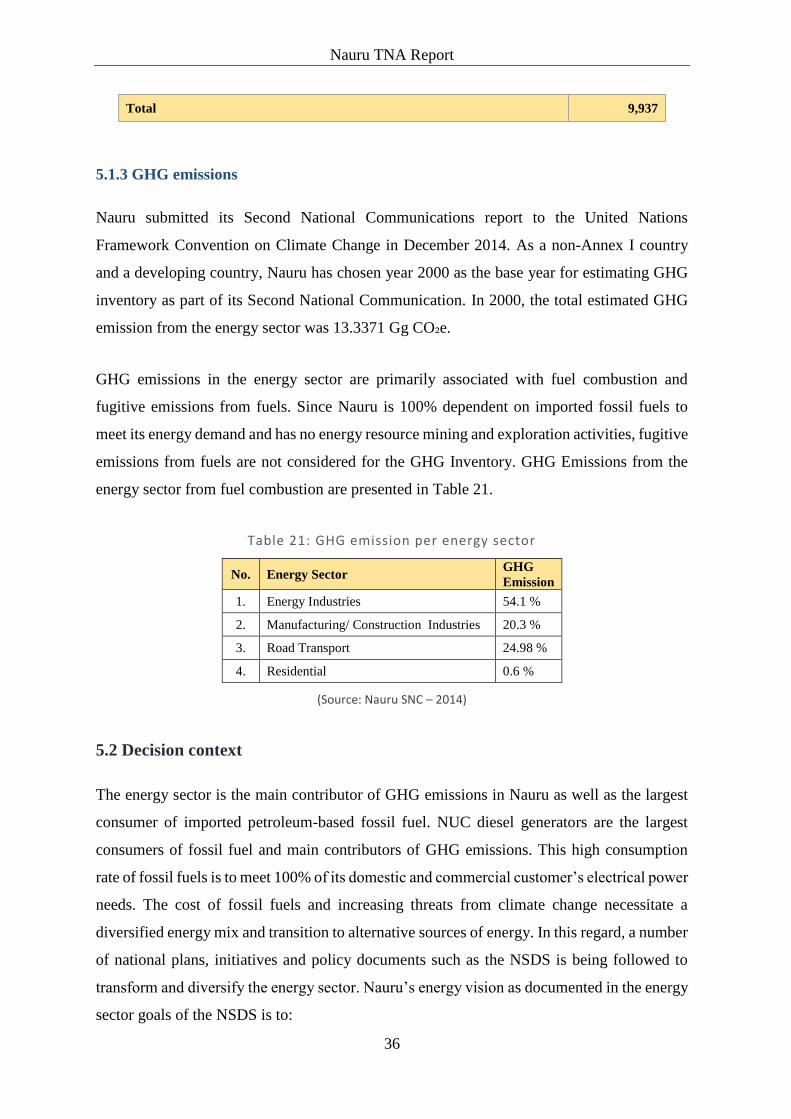
Nauru TNA Report
36
Total 9,937
5.1.3 GHG emissions
Nauru submitted its Second National Communications report to the United Nations
Framework Convention on Climate Change in December 2014. As a non-Annex I country
and a developing country, Nauru has chosen year 2000 as the base year for estimating GHG
inventory as part of its Second National Communication. In 2000, the total estimated GHG
emission from the energy sector was 13.3371 Gg CO₂e.
GHG emissions in the energy sector are primarily associated with fuel combustion and
fugitive emissions from fuels. Since Nauru is 100% dependent on imported fossil fuels to
meet its energy demand and has no energy resource mining and exploration activities, fugitive
emissions from fuels are not considered for the GHG Inventory. GHG Emissions from the
energy sector from fuel combustion are presented in Table 21.
Table 21: GHG emission per energy sector
No. Energy Sector GHG
Emission
1. Energy Industries 54.1 %
2. Manufacturing/ Construction Industries 20.3 %
3. Road Transport 24.98 %
4. Residential 0.6 %
(Source: Nauru SNC – 2014)
5.2 Decision context
The energy sector is the main contributor of GHG emissions in Nauru as well as the largest
consumer of imported petroleum-based fossil fuel. NUC diesel generators are the largest
consumers of fossil fuel and main contributors of GHG emissions. This high consumption
rate of fossil fuels is to meet 100% of its domestic and commercial customer’s electrical power
needs. The cost of fossil fuels and increasing threats from climate change necessitate a
diversified energy mix and transition to alternative sources of energy. In this regard, a number
of national plans, initiatives and policy documents such as the NSDS is being followed to
transform and diversify the energy sector. Nauru’s energy vision as documented in the energy
sector goals of the NSDS is to:
Nauru TNA Report
37
‘Provide a reliable, affordable, secure and sustainable energy supply to meet the socio
economic development needs of Nauru.’
Original NSDS energy sector targets for 2020 include:
i) 24/7 grid electricity supply with minimal interruptions.
ii) 50% of grid electricity supplied from renewable energy sources.
iii) 30% improvement in energy efficiency in the residential, commercial and
government sectors.
NUC has well achieved (i) and (iii) of the NSDS objectives above and is now well in the
process of accomplishing 50% of grid electricity to be supplied from a renewable energy
source. The 50% RE-source project is being funded by ADB who has commissioned GHD6
to assist NUC in the development of project documentations that include feasibility, tendering
and procurement. The NSDS prioritisation process is therefore being undertaken in the
context of climate change and development priorities of the Nauru.
Technology prioritisation in the energy sector is not only based on the concept that leads to
reduction of imported fossil fuel and GHG emission, but also their contribution to sustainable
development.
5.3 Possible mitigation technology options for the energy sector
During the first stakeholder consultation, a brainstorming session was conducted with
stakeholder participation to list all known or possible RE technology options that have
mitigation potential and other co-benefits. The outcome of this session resulted in six
technologies that included (i) pumped hydroelectric systems; (ii) biogas; (iii) OTEC; (iv)
rooftop PV; (v) wave energy conversion; and (vi) tidal energy conversion. Each of these
technologies were reviewed extensively with stakeholders not so much in terms of their cost
(capital, operation & maintenance) but more so on their viability given Nauru’s limited
resources. In ranking these technologies, the potentials of wave and tidal energy for Nauru
6 GHD – one of the world’s leading professional services companies operating in the global market sectors of water, energy and resources, environment, property and buildings, and transportation.

Nauru TNA Report
38
were least favourable and were excluded. The ranking of the remaining four favourable
technologies are shown in Table 22.
Table 22: Stakeholder prioritised ranking of identified RE technologies
No. Mitigation Technologies - RE Overall stakeholder ranking
1. Pumped hydroelectric storage 1st
2. Biogas 2nd
3. OTEC 3rd
4. Rooftop PV 4th
Technology fact sheets for the four RE technologies prioritised by the stakeholders are
provided in Annex 2. An overview for each of these technologies are presented below.
5.3.1 Pumped hydroelectric storage (PHES)
A PHES system is the most developed energy storage technology, with facilities dating from
the 1890s in Italy and Switzerland. PHES is a technology that would use the surplus power
from a renewable source to pump water from a lower reservoir to a second reservoir on top
of the hill. This creates the potential energy that can be released when needed through letting
the water flow from the upper reservoir through a conventional hydro turbine at sea level
which generates power into the grid.
PHES systems are GHG emission free that operates freely from a RE source that operates the
pump, and gravity to turn the turbine to generate power.
PHES has the potential to significantly contribute towards Nauru’s long-term energy storage
needs and as an alternative for BESS (battery energy storage system) to facilitate the
increasing number of grid-connected solar panels as shown in Table 20. The main applications
of pumped hydro are for energy management, frequency control and provision of reserves.
The advantages that a PHES system has over battery storage is that the pumped hydro
installation is generally less expensive and expected to have a lifespan of over 50 years,
whereas battery modules are limited in their lifespan to around 10 years.
Nauru has the potential of developing this energy storage technology given its highest point
at 70 meters is located at the Command Ridge. A reservoir at Command Ridge can also serve

Nauru TNA Report
39
as a fire hydrant source for the nearby fuel tank farm and as a source for non-potable use like
toilet flushing at nearby residences that do not have access to brackish water.
A pre-feasibility study was recently carried out by GHD in New Zealand in 2019 through NZ
MFAT funding which fully supported its potential on Nauru. A feasibility study is now being
considered to be completed in 2020.
5.3.2 Biogas
Biogas is a modern form of bioenergy that can be produced through anaerobic digestion or
fermentation of a variety of biomass sources. These include, but are not limited to, livestock
manure, food waste, agricultural residues, energy crops, sewage and organic waste from
landfills. It is a versatile fuel that can be used for cooking, heating, lighting, power generation
and combined heat and power generation, as well as, when upgraded to boost its methane
content, in transport applications. It also can provide dispatchable energy to power grids so
that a higher share of electricity can be generated from variable wind and solar energy. Biogas
typically consists of 50–75% methane, which provides its energy content, and 25–50% carbon
dioxide, which potentially can be captured and stored.
5.3.3 OTEC
OTEC is another proven technology that produces clean baseload electricity; 24/7 using the
temperature differential (>20⁰C) between warm surface water and cold deep water in the
world’s tropical oceans. The warm seawater is used to produce a vapour that acts as a working
fluid to drive turbines. The cold water is used to condense the vapour and ensure the vapour
pressure difference drives the turbine. OTEC technologies are differentiated by the working
fluids that can be used. Open Cycle OTEC uses seawater as the working fluid, Closed Cycle
OTEC uses mostly ammonia. A variation of a Closed Cycle OTEC, called the Kalina Cycle,
uses a mixture of water and ammonia. The use of ammonia as a working fluid reduces the
size of the turbines and heat exchangers required.
OTEC can also be used for ocean water desalination. Ocean thermal energy can easily provide
40 MJ of thermal energy to get 1 cubic meter of fresh water. System analysis indicate that a
Nauru TNA Report
40
2 MW plant can produce 4,300 cubic meter desalination water each day7. The cost of
desalinated ocean water can be less than 10 cents for each cubic meter.
Nauru is considered an excellent location for an OTEC plant because the temperature
differences between the surface warm waters and the deeper cool waters surrounding Nauru
are relatively great and because the seabed nearby has a steep inclination. One of the first
small-scale and operational OTEC pilot plants was built in Nauru in 1981. This plant was
rated at 100 kW and produced 31.5 kW of OTEC net power continuously to the grid for 10
days. However, the intake pipes that were mounted over the reef were damaged during a storm
which resulted in the system being dismantled. For future OTEC development proposals on
Nauru, the coral reef must be cut and excavated for laying of the intake pipes.
General perceptions of OTEC applicable to SIDS apart from being very expensive are; (i)
major technical barriers have been removed; (ii) design studies have been performed to show
techno-economic viability; (iii) competitive to petroleum liquid-fueled power generation in
the island states; (iv) co-production of power and desalinated water favourable to island states
that have limited or no water resources like Nauru.
5.3.4 Grid-connected rooftop solar PV system
Solar PV (photovoltaic) refers to the technology of using solar cells to convert solar radiation
directly into electricity. The technology has been developed steadily since the 1960s and is
now seeing a period of very rapid commercialization.
A rooftop solar PV system is a photovoltaic system that has its electricity-generating solar
panels mounted on the rooftop of a residential or commercial building or structure. The two
solar PV connection systems include grid interconnection and stand-alone.
Stand-alone systems have no interconnection to the grid but rely on energy storage devices
such as batteries to store energy during the day for use at night.
A grid connected PV systems is connected to the utility grid through an inverter. The inverter
converts the DC electricity produced by the solar panels into 240 V AC electricity, which can
then be used by the property/household. If a grid connect system is producing more power
than the home consumes, the surplus is fed into the power grid.
7 https://www.slideshare.net/naveen1nk/ocean-thermal-energy-conversion-systems

Nauru TNA Report
41
The main advantage of a grid connected PV system is its simplicity, relatively low operating
and maintenance costs as well as reduced electricity bills.
5.4 Criteria and process for technology prioritisation for renewable energy sector
During this process, the multi-criteria analysis (MCA) tool is used to rank the four (4)
identified technologies in their priority order based on a set of criteria that are relevant to
country context. A maximum of 10 criterions have been selected by the consultant that come
under two major criteria catogories that include (i) technology diffusion and (ii) sustainable
development impacts and benefits as shown in Table 23
Table 23: Selection criteria for technologies in energy sector
Criteria Category Criteria Sub-Category Criterion
Technology diffusion
Cost Capital cost
O&M
Implementation potential Maturity
Stakeholder acceptability
Institutional Capacity
Sustainable development
impacts/ benefits
Economic Energy saving
Social
Potential to create job
Scale/ size of beneficiary group
Gender aspects
Environmental Reduction in GHG emissions
Each criterion is given a scoring range (0-100) and a preferred scoring value (0 or 100) as
shown in Table 24 except for the capital cost. The unit for capital cost is provided in USD per
kilowatt with a low cost technology as the most preferred.
Table 24: Criteria scoring scales and preferred values for energy sector
No. Criteria
Category
Criteria Sub-
Category Criterion Scoring Scale/ Unit
Preferred
Value
1.
Technology
diffusion Cost
Capital cost USD/ kW Low cost
2. O&M 0 = very low
100 = very high 0 = very low

Nauru TNA Report
42
3.
Implementation
potential
Maturity 0 = not mature
100 = very mature
100 = very
mature
4. Stakeholder
acceptability
0 = not accepted
100 = highly accepted
100 = highly
accepted
5. Institutional Capacity
0 = no-one trained
100 = high number
trained
100 = high
number trained
6.
Sustainable
development
impacts/
benefits
Economic Energy saving
0 = no energy saved
100 = very high
energy saved
100 = very high
energy saved
7.
Social
Potential to
create job
0 = very low
100 = very high 100 = Very high
8.
Scale/ size of
beneficiary
group
0 = very low
100 = very high 100 = Very high
9. Gender aspects 0 = very low
100 = very high 100 = Very high
10. Environmental Reduction in
GHG emissions
0 = very low
100 = very high 100 = Very high
5.5 Results of technology prioritisation for renewable energy sector
At the beginning of the MCA process, scores are manually inputted; based on data from TFS,
for each technology criterion in the performance matrix table as illustrated in Table 25. These
scores are automatically calculated and displayed in the Normalised scoring matrix (Table 26)
and the Scores and weights combined tables (Table 27).
Table 25: Performance matrix table for energy sector
No. Criterion Technology
PHES Biogas OTEC Rooftop PV
1. Capital cost (USD/ kW) 17,700 4,500 14,000 1,800
2. O&M 60 5 100 5
3. Maturity 100 90 70 100
4. Stakeholder acceptability 100 80 60 40
5. Capacity 5 0 0 20
6. Energy saving 30 10 100 25
7. Potential to create job 15 30 90 15
8. Scale/ size of beneficiary group 30 5 100 25
9. Gender aspects 10 25 30 10
10. Reduction in GHG emissions 20 15 100 40

Nauru TNA Report
43
The normalised scoring results in Table 26 are obtained from the equations provided in Annex
6. These scores are further multiplied by criterion weights and produced in Table 27
Table 26: Normalised scoring matrix table for energy sector
No. Criterion Technology
PHES Biogas OTEC Rooftop
PV
1. Capital cost 0 83 23 100
2. O&M 42 100 0 100
3. Maturity 100 67 0 100
4. Stakeholder acceptability 100 67 33 0
5. Capacity 25 0 0 100
6. Energy saving 22 0 100 17
7. Potential to create job 0 20 100 0
8. Scale/ size of beneficiary group 26 0 100 21
9. Gender aspects 0 75 100 0
10. Reduction in GHG emissions 6 0 100 29
Each criterion is provided with a weight as shown in column 2 of Table 27. Note that for this
scoring table, the criterion weights are all equal. A bar graph for Table 27 is shown in Figure
6.
Table 27: Scores & equal weights combined table for energy sector
No. Criterion
Weight Criterion
Technology
PHES Biogas OTEC Rooftop PV
1. 10 Capital cost 0 830 233 1,000
2. 10 O&M 421 1,000 0 1,000
3. 10 Maturity 1,000 500 0 1,000
4. 10 Stakeholder acceptability 1,000 667 333 0
5. 10 Capacity 250 0 0 1,000
6. 10 Energy saving 222 0 1,000 167
7. 10 Potential to create job 0 200 1,000 0
8. 10 Scale/ size of beneficiary group 1263 0 1,000 211
9. 10 Gender aspects 0 750 1,000 0
10. 10 Reduction in GHG emissions 59 0 1,000 294
100 TOTAL SCORES: 3,215 4,114 5,566 4,671
RANKING: 4 3 1 2
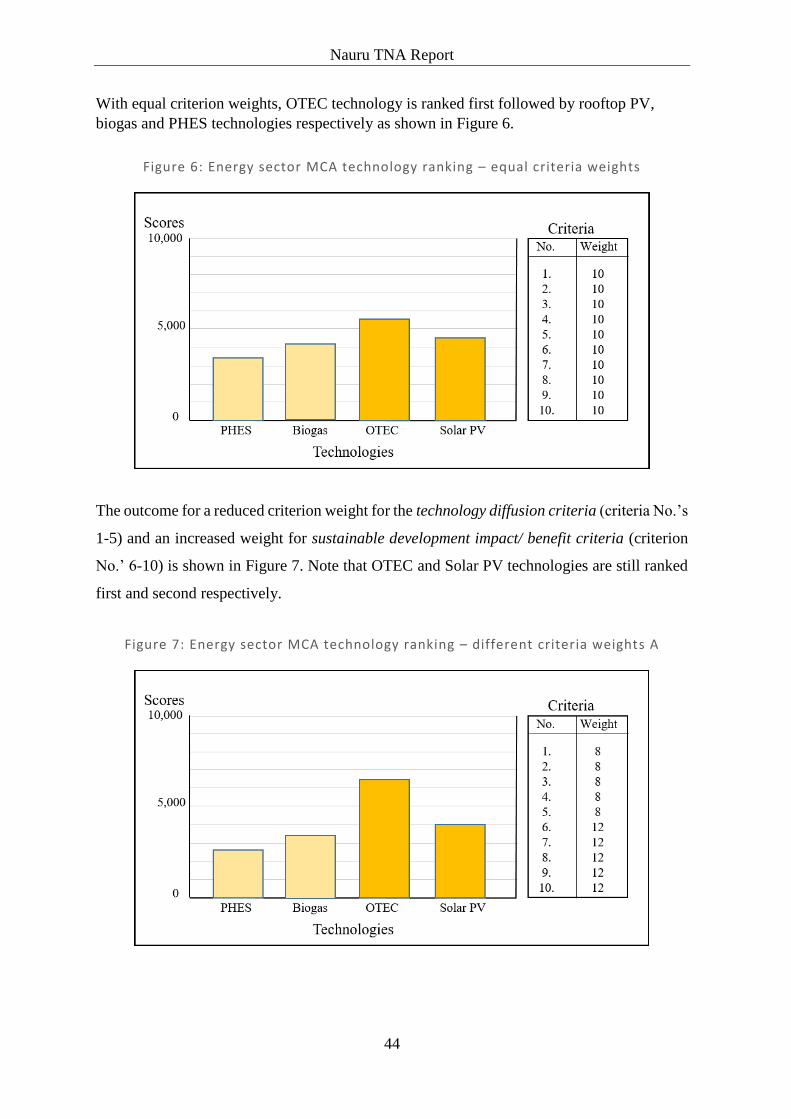
Nauru TNA Report
44
With equal criterion weights, OTEC technology is ranked first followed by rooftop PV,
biogas and PHES technologies respectively as shown in Figure 6.
Figure 6: Energy sector MCA technology ranking – equal criteria weights
The outcome for a reduced criterion weight for the technology diffusion criteria (criteria No.’s
1-5) and an increased weight for sustainable development impact/ benefit criteria (criterion
No.’ 6-10) is shown in Figure 7. Note that OTEC and Solar PV technologies are still ranked
first and second respectively.
Figure 7: Energy sector MCA technology ranking – different criteria weights A
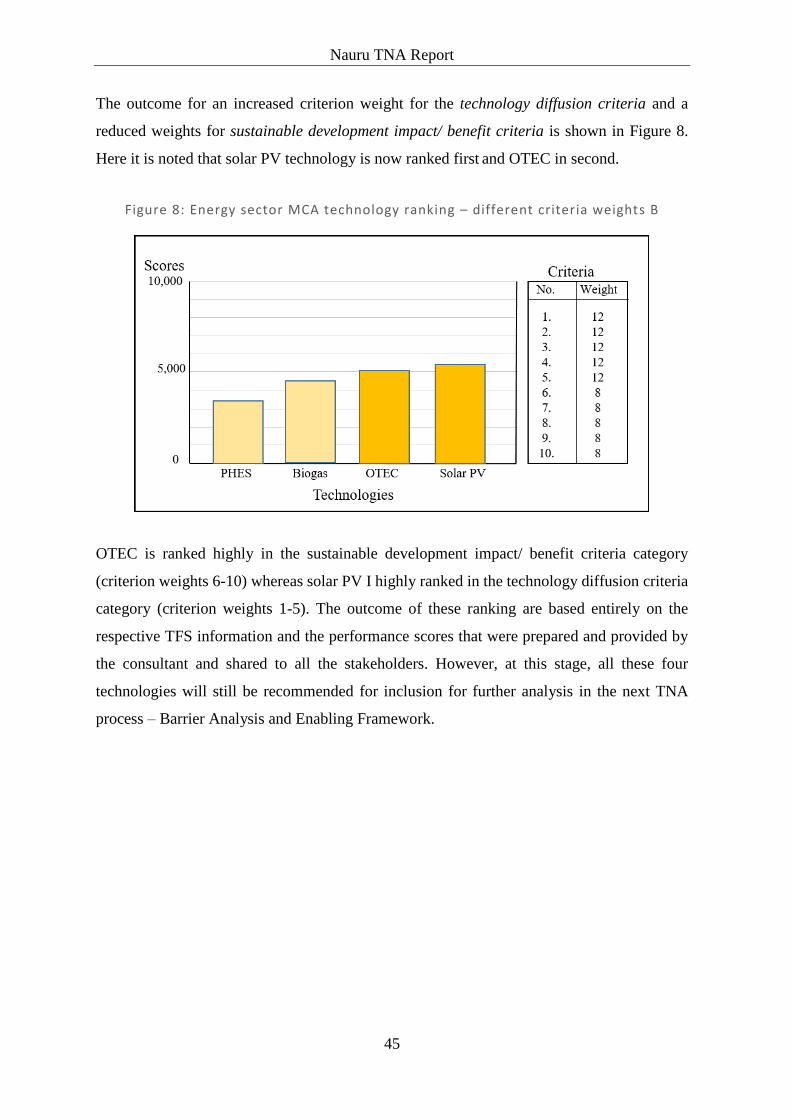
Nauru TNA Report
45
The outcome for an increased criterion weight for the technology diffusion criteria and a
reduced weights for sustainable development impact/ benefit criteria is shown in Figure 8.
Here it is noted that solar PV technology is now ranked first and OTEC in second.
Figure 8: Energy sector MCA technology ranking – different criteria weights B
OTEC is ranked highly in the sustainable development impact/ benefit criteria category
(criterion weights 6-10) whereas solar PV I highly ranked in the technology diffusion criteria
category (criterion weights 1-5). The outcome of these ranking are based entirely on the
respective TFS information and the performance scores that were prepared and provided by
the consultant and shared to all the stakeholders. However, at this stage, all these four
technologies will still be recommended for inclusion for further analysis in the next TNA
process – Barrier Analysis and Enabling Framework.
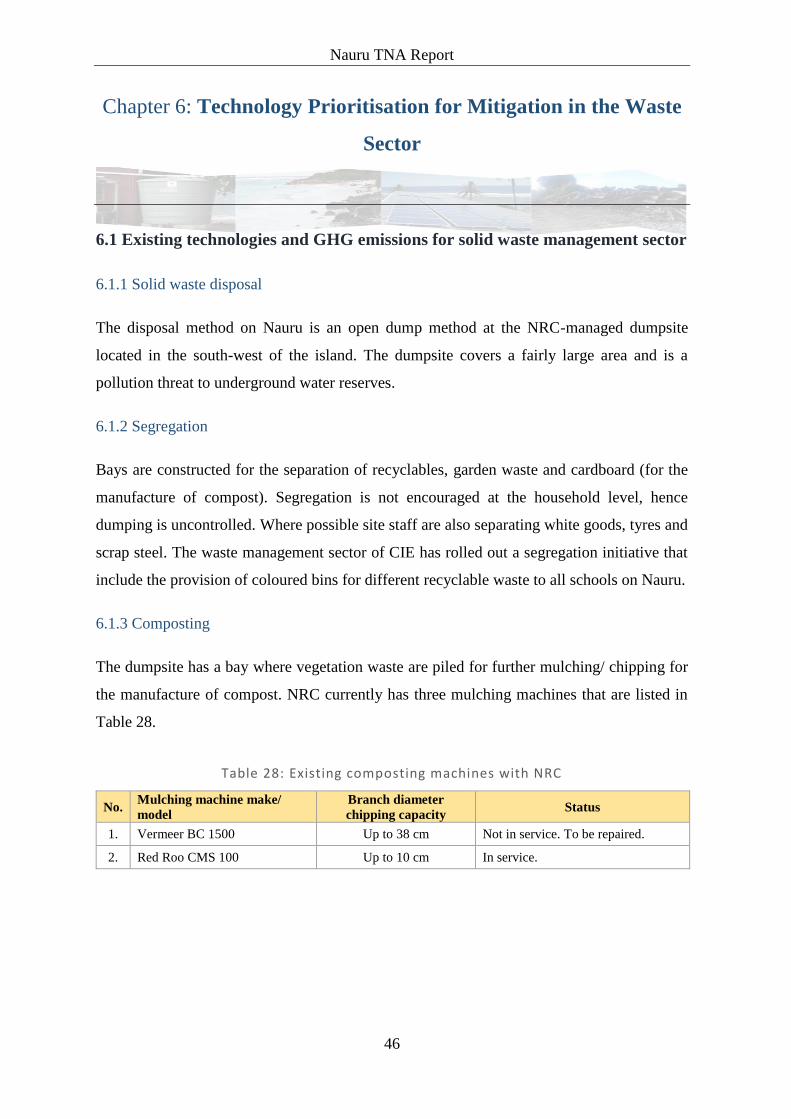
Nauru TNA Report
46
Chapter 6: Technology Prioritisation for Mitigation in the Waste
Sector
6.1 Existing technologies and GHG emissions for solid waste management sector
6.1.1 Solid waste disposal
The disposal method on Nauru is an open dump method at the NRC-managed dumpsite
located in the south-west of the island. The dumpsite covers a fairly large area and is a
pollution threat to underground water reserves.
6.1.2 Segregation
Bays are constructed for the separation of recyclables, garden waste and cardboard (for the
manufacture of compost). Segregation is not encouraged at the household level, hence
dumping is uncontrolled. Where possible site staff are also separating white goods, tyres and
scrap steel. The waste management sector of CIE has rolled out a segregation initiative that
include the provision of coloured bins for different recyclable waste to all schools on Nauru.
6.1.3 Composting
The dumpsite has a bay where vegetation waste are piled for further mulching/ chipping for
the manufacture of compost. NRC currently has three mulching machines that are listed in
Table 28.
Table 28: Existing composting machines with NRC
No. Mulching machine make/
model
Branch diameter
chipping capacity Status
1. Vermeer BC 1500 Up to 38 cm Not in service. To be repaired.
2. Red Roo CMS 100 Up to 10 cm In service.

Nauru TNA Report
47
6.1.4 Clean and green
Clean and green is a government funded community-based initiative where 4 to 6 members
of each district apply to sweep the road kerbside and trim off any overgrown vegetation next
to the footpaths within their respective district boundaries. This campaign keeps the road and
kerbside clean and also clears the rainwater drainage system. Community leaders are
responsible for delegating community groups who take turns in this weekly clean-up
campaign. This however is not a permanent post, rather it is targeted for those in need of
financial assistance.
6.1.5 Waste collection
Waste collection services using garbage trucks is currently being provided by the private
sector. The frequency of waste collection differs for each district. In Boe District, waste is
collected on the kerbside three times a week, whereas waste collection for most other districts
is done once a week.
6.1.6 GHG emissions
Nauru submitted its Second National Communications report to the United Nations
Framework Convention on Climate Change in December 2014. As a non-Annex I country
and a developing country, Nauru has chosen year 2000 as the base year for estimating GHG
inventory as part of its Second National Communication. In 2000, the total estimated GHG
emission from the waste sector; excluding removals was 4.5460 Gg CO₂e.
Methane is the most prominent gas emitted from the waste sector. Unmanaged solid waste
(SW) and waste water sites, lead to methane emissions. The methane emissions so emitted
are estimated using the quantity of waste generated the management of the waste, the
proportion of carbon that may be transformed into methane etc.

Nauru TNA Report
48
6.2 Decision context
The main decision context for solid waste management on Nauru is founded on the NSDS
where the vision for the waste and sewerage sector is:
“Effective management of waste and pollution that minimizes negative impacts on public
health and environment”.
Key Performance Indicators include:
(i) Proportion of waste effectively and sustainably managed.
(ii) Number of national and sector policies, plans and programs in which waste and
pollution issues have been integrated.
The NSDS also provides a set of waste and sewerage strategy milestones and responsible
departments as illustrated in Table 29.
Table 29: Waste & sewerage strategy milestones
Strategies Short-term
Milestones 2012
Medium-term
Milestones 2015
Long-term
Milestones 2025 Responsibility
Strengthen the
waste and
sewerage sector by
enhancing the
capacity to manage
solid and
hazardous waste
and
sewerage
National solid
waste management
strategy
finalized and
implemented
Hazardous waste
management
strategy
developed
(Waigani
Convention)
National
implementation
plan (NIP)
developed
(Stockholm
Convention) and
implemented
Pollution and
waste management
efforts
become sustainable
Department of
Environment and
Nauru Rehab
Corporation
6.3 Possible mitigation technology options in solid waste management
Mitigation technology options in solid waste management that are being considered for Nauru
are not only based on current proven technologies and their effectiveness but more so on their
potential contribution to reducing GHG emissions and other co-benefits. Although some
technologies may have already been considered and being practiced like baling and
composting, it is important that the technologies used and their effectiveness are examined.
The approaches to baling and composting can either be implemented at community or
Nauru TNA Report
49
household level or on a more centralised location. During an initial TNA consultation with
stakeholders, the four (4) technologies that were identified for further prioritisation are shown
in Table 30.
Table 30: Stakeholder selection on waste management technologies
Mitigation Technologies – Solid waste management Stakeholder ranking
1. Semi-aerobic landfill 1st
2. Waste segregation at household level 2nd
3. Baling at commercial level 3rd
4. Composting at household level 4th
6.3.1 Semi-aerobic landfill
Also known as the Fukuoka method, this semi-aerobic structured landfill is a technology
offering improved landfill sites simply and at low cost utilizing materials and methods readily
available in developing countries to install leachate drainage pipes and gas vents, thereby
enlarging the aerobic region in the landfill waste layers. This technology also minimizes
impact on the environment surrounding the site because it promotes the degradation of
landfilled waste, rapid landfill stabilization and leachate is drained promptly from the landfill.
In addition the volume of methane gas emitted by the landfill is reduced, contributing to
efforts to prevent global warming. A semi-aerobic landfill is a landfill where waste goes
through a decomposition process in the presence of oxygen. This type of landfilling method
has several advantages including reduction in the amount of landfill gas produced, faster
stabilisation of the waste landfilled and eliminates leachate from soaking through the ground
and contaminating ground water resources.
6.3.2 Segregation
Waste segregation refers to the separation of wet waste and dry waste where the purpose is to
recycle dry waste easily and to use wet waste as compost. When waste is segregated, there is
reduction of waste that gets landfilled and occupies space, air and water pollution rates are
considerably lowered. Segregation at the source reduces the amount of recyclable wastes
ending up at the landfill where it usually becomes impractical to sort. Segregation at the
community level can be achieved with the support of the GoN through consultations,
Nauru TNA Report
50
workshops and the provision of proper colour coded bins for specific types of recyclable
wastes.
CIE is currently promoting segregation practices in schools by providing them with the proper
bins with pictures of recyclable wastes pasted on the side. This segregation campaign is aimed
to encourage school children to carry out the same at home.
6.3.3 Baling
Baling is a process that compresses mainly recyclable wastes into a block (bale) which is
secured by plastic or wire strapping. Baling reduces the volume of waste product and has a
number of benefits that include (i) reduction of space taken up by waste on site; (ii) easier to
store due to regular shape; (iii) ease of transportation; (iv) reduced storage, transportation and
waste disposal costs; and (v) increased revenue as some baled materials can be sold to
recyclers. Installing balers at the source of waste generation is recommended for Nauru.
Baling of aluminium cans at domestic level is a common practice in the past, however
exporting of these never eventuated due to strict quarantine regulations.
Medium sized balers should be installed at sources of waste generations that may include the
government offices; main shopping complexes like Civic Centre and Capelle and Partners;
hotels and hospitals. The dumpsite should also have a baling machine of bigger size to
compact household recyclable wastes before they end up in the landfills.
6.3.4 Composting
Composting is an aerobic method (meaning that it requires the presence of air) of
decomposing organic solid wastes. It can therefore be used to recycle organic material. The
process involves decomposition of organic material into a humus-like material, known as
compost, which is a good fertilizer for plants.
Household waste consists of organic waste and compostable materials. If everyone on Nauru
starts composting at home, tons of organic waste would be diverted from landfills, reducing
GHG from hitting the atmosphere. Hence, starting a backyard compost pile will help save the
environment.

Nauru TNA Report
51
As in the past, NRC provides a mulching and chipping services to the community as required
where wood chips and mulched leaves can either be left at the site for community or household
composting or these can be transported back to the dumpsite for compost production.
6.4 Criteria and process for technology prioritisation for solid waste sector
During this process, the multi-criteria analysis (MCA) tool is used in ranking the four (4)
identified technologies in their priority order based on a set of criteria that are relevant to
country context. The criteria are provided in Table 31. Each criterion is given a scoring range
(0-100) and a preferred scoring value (0 or 100) as shown in Table 32.
6.4.1 Criteria identification
Table 31: Selection criteria for technologies in waste sector
Criteria Category Criteria Sub-Category Criterion
Technology diffusion
Cost Capital cost
O&M
Implementation potential Maturity
Stakeholder acceptability
Institutional Capacity
Sustainable development
impacts/ benefits
Economic Energy saving
Social
Potential to create job
Scale/ size of beneficiary group
Gender aspects
Environmental Reduction in GHG emissions
6.4.2 Scoring Units and preferred values
Table 32: Performance matrix scoring scale and preferred values for each criteria
Criteria
Category
Criteria Sub-
Category Criterion Scoring Scale/ Unit
Preferred
Value
1.
Technology
diffusion Cost
Capital cost 0 = very low
100 = very high 0 = Low cost
2. O&M 0 = very low
100 = very high 0 = very low

Nauru TNA Report
52
3.
Implementation
potential
Maturity 0 = not mature
100 = very mature
100 = very
mature
4. Stakeholder
acceptability
0 = not accepted
100 = highly accepted
100 = highly
accepted
5. Institutional Capacity
0 = no-one trained
100 = high number
trained
100 = high
number trained
6.
Sustainable
development
impacts/
benefits
Economic
Waste reduction
reaching
landfill
0 = no reduction
100 = very high
reduction
100 = very high
reduction
7.
Social
Potential to
create job
0 = very low
100 = very high 100 = Very high
8.
Scale/ size of
beneficiary
group
0 = very low
100 = very high 100 = Very high
9. Gender aspects 0 = very low
100 = very high 100 = Very high
10. Environmental Reduction in
GHG emissions
0 = very low
100 = very high 100 = Very high
6.5 Results of technology prioritisation for waste sector
At the beginning of the MCA process, scores are manually inputted for each technology
criterion in the Excel performance matrix table as illustrated in Table 33Table 15. Results are
automatically calculated and displayed in the Normalised scoring matrix (Table 34) and the
scores and weights combined tables (The criterion weights are provided in column 2 of Table
35. Note that for this scoring table, the criterion weights are all equal. Household composting
is ranked first followed by waste segregation, landfilling and baling. A bar graph for Table 35
is shown in Figure 9.
Table 35).
Table 33: Performance matrix table for waste sector
No. Criterion
Technology
Semi-aerobic
landfill
Household
waste
segregation
Commercial
level baling
Household
composting
1. Capital cost (USD) 100 60 20 0
2. O&M 100 20 40 5
3. Maturity 100 50 100 100
4. Stakeholder acceptability 100 80 60 40
5. Capacity 30 10 5 25

Nauru TNA Report
53
6. Reduced waste reaching landfill 0 80 75 70
7. Potential to create job 100 5 20 5
8. Scale/ size of beneficiary group 20 90 30 100
9. Gender aspects 20 50 50 90
10. Reduction in GHG emissions 90 80 70 60
The normalised scoring results in Table 34 are obtained from the equations provided in Annex
6. These scores are further multiplied by criterion weights and produced in The criterion
weights are provided in column 2 of Table 35. Note that for this scoring table, the criterion
weights are all equal. Household composting is ranked first followed by waste segregation,
landfilling and baling. A bar graph for Table 35 is shown in Figure 9.
Table 35.
Table 34: Normalised scoring matrix table for waste sector
No. Criterion
Technology
Semi-aerobic
landfill
Household
waste
segregation
Commercial
level baling
Household
composting
1. Capital cost 0 40 80 100
2. O&M 0 84 63 100
3. Maturity 100 0 100 100
4. Stakeholder acceptability 100 67 33 0
5. Capacity 100 20 0 80
6. Reduced waste reaching landfill 0 100 94 88
7. Potential to create job 100 0 16 0
8. Scale/ size of beneficiary group 0 88 13 100
9. Gender aspects 0 43 43 100
10. Reduction in GHG emissions 100 67 33 0
The criterion weights are provided in column 2 of Table 35. Note that for this scoring table,
the criterion weights are all equal. Household composting is ranked first followed by waste
segregation, landfilling and baling. A bar graph for Table 35 is shown in Figure 9.
Table 35: Scores & weights combined table for waste sector
No. Criterion
Weight Criterion
Technology
Semi-
aerobic
landfill
Household
waste
segregation
Commercia
l level
baling
Household
composting
1. 10 Capital cost 0 400 800 1,000
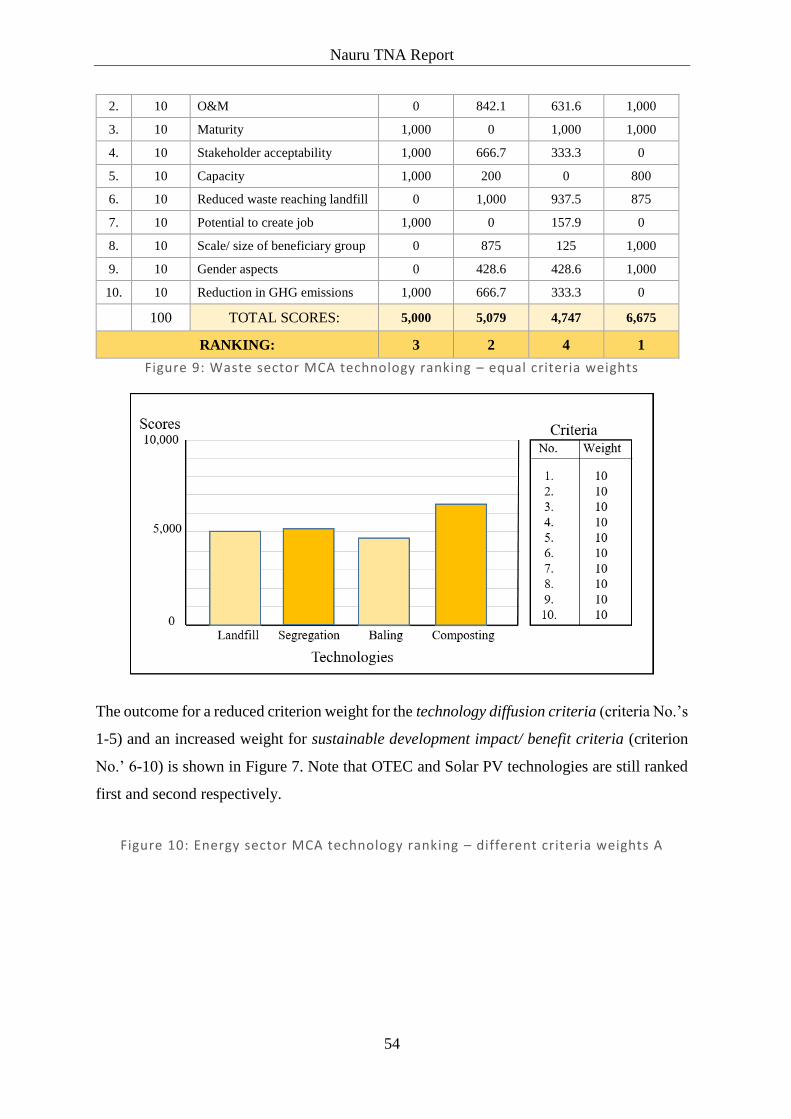
Nauru TNA Report
54
2. 10 O&M 0 842.1 631.6 1,000
3. 10 Maturity 1,000 0 1,000 1,000
4. 10 Stakeholder acceptability 1,000 666.7 333.3 0
5. 10 Capacity 1,000 200 0 800
6. 10 Reduced waste reaching landfill 0 1,000 937.5 875
7. 10 Potential to create job 1,000 0 157.9 0
8. 10 Scale/ size of beneficiary group 0 875 125 1,000
9. 10 Gender aspects 0 428.6 428.6 1,000
10. 10 Reduction in GHG emissions 1,000 666.7 333.3 0
100 TOTAL SCORES: 5,000 5,079 4,747 6,675
RANKING: 3 2 4 1
Figure 9: Waste sector MCA technology ranking – equal criteria weights
The outcome for a reduced criterion weight for the technology diffusion criteria (criteria No.’s
1-5) and an increased weight for sustainable development impact/ benefit criteria (criterion
No.’ 6-10) is shown in Figure 7. Note that OTEC and Solar PV technologies are still ranked
first and second respectively.
Figure 10: Energy sector MCA technology ranking – different criteria weights A

Nauru TNA Report
55
The outcome for an increased criterion weight for the technology diffusion criteria and a
reduced weights for sustainable development impact/ benefit criteria is shown in Figure 11.
Here it shows that composting technology is still ranked first with landfilling in second.
Figure 11: Energy sector MCA technology ranking – different criteria weights B
Therefore composting technology is considered most favourable within waste sector with the
other three technologies having very close scoring differences. The outcome of these ranking
are based entirely on the respective TFS information and the performance scores that were
prepared and provided by the consultant and shared to all the stakeholders. However, at this
stage, all these four technologies will still be recommended for inclusion for further analysis
in the next TNA process – Barrier Analysis and Enabling Framework.
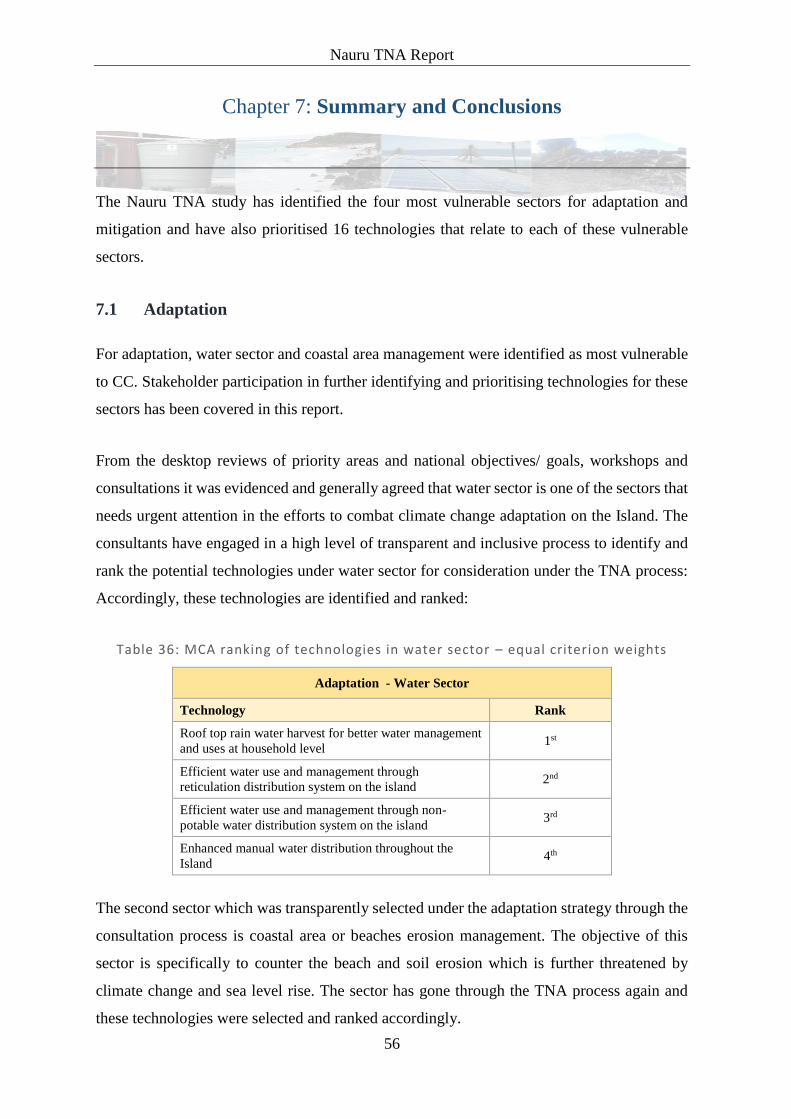
Nauru TNA Report
56
Chapter 7: Summary and Conclusions
The Nauru TNA study has identified the four most vulnerable sectors for adaptation and
mitigation and have also prioritised 16 technologies that relate to each of these vulnerable
sectors.
7.1 Adaptation
For adaptation, water sector and coastal area management were identified as most vulnerable
to CC. Stakeholder participation in further identifying and prioritising technologies for these
sectors has been covered in this report.
From the desktop reviews of priority areas and national objectives/ goals, workshops and
consultations it was evidenced and generally agreed that water sector is one of the sectors that
needs urgent attention in the efforts to combat climate change adaptation on the Island. The
consultants have engaged in a high level of transparent and inclusive process to identify and
rank the potential technologies under water sector for consideration under the TNA process:
Accordingly, these technologies are identified and ranked:
Table 36: MCA ranking of technologies in water sector – equal criterion weights
Adaptation - Water Sector
Technology Rank
Roof top rain water harvest for better water management
and uses at household level 1st
Efficient water use and management through
reticulation distribution system on the island 2nd
Efficient water use and management through non-
potable water distribution system on the island 3rd
Enhanced manual water distribution throughout the
Island 4th
The second sector which was transparently selected under the adaptation strategy through the
consultation process is coastal area or beaches erosion management. The objective of this
sector is specifically to counter the beach and soil erosion which is further threatened by
climate change and sea level rise. The sector has gone through the TNA process again and
these technologies were selected and ranked accordingly.

Nauru TNA Report
57
Table 37: MCA ranking of technologies in coastal sector – equal criterion weights
Adaptation - Coastal area Erosion Management Sector
Technology Rank
Coastal beaches and vegetation replenishment for
community resilience against soil erosion. 1st
Integrated locally managed marine areas, coastal area
revegetation and beach nourishment resilience for food
security and adaptation against soil erosion.
2nd
Establishment of National Policy and guideline on
coastal area development 3rd
Construction of sea wall structures at selective sites
around the Island 4th
7.2 Mitigation
For mitigation, energy and waste management were identified as most vulnerable sectors to
CC. Stakeholder participation in further identifying and prioritising technologies for these
sectors has been covered in this report using the MCA process.
Nauru is committed to formulating strategies, national policies and best practices for
addressing GHG emissions and making a practical contribution to the global mitigation
efforts. Since Nauru’s primary energy needs are mainly met by imported petroleum fuel, it is
now exploring potential technology opportunities through this TNA process to further expand
its current renewable energy sources. The outcome of the MCA ranking for the energy sector
is shown in the table below.
Table 38: MCA ranking of technologies in the energy sector – equal criterion weights
Mitigation – Energy Sector
Technology Rank
Ocean thermal energy conversion (OTEC) 1st
Grid-connect rooftop solar PV 2nd
Biogas 3rd
Pumped hydroelectric storage (PHES) system 4th
The method of solid waste disposal on Nauru is uncontrolled open dumping. Although Nauru
has a National Solid Waste Management Strategy (2017-2026) that contains a range of actions
intended to improve solid waste management in Nauru, these have not yet been enforced.
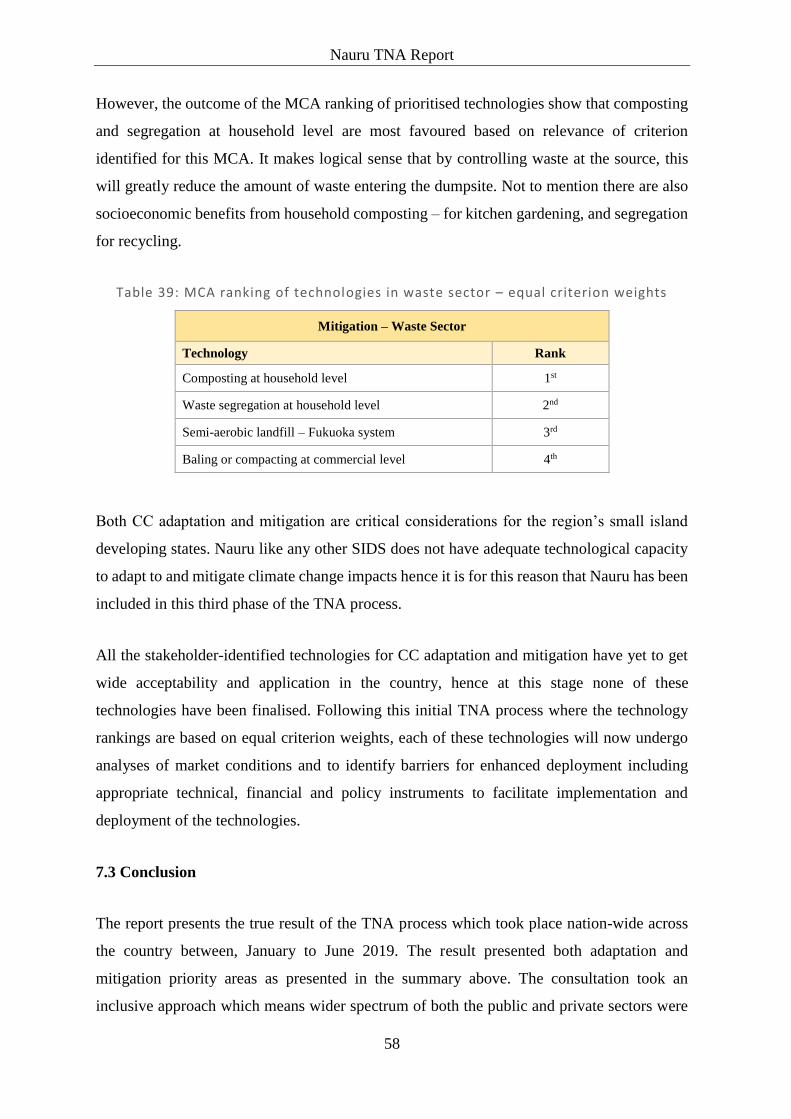
Nauru TNA Report
58
However, the outcome of the MCA ranking of prioritised technologies show that composting
and segregation at household level are most favoured based on relevance of criterion
identified for this MCA. It makes logical sense that by controlling waste at the source, this
will greatly reduce the amount of waste entering the dumpsite. Not to mention there are also
socioeconomic benefits from household composting – for kitchen gardening, and segregation
for recycling.
Table 39: MCA ranking of technologies in waste sector – equal criterion weights
Mitigation – Waste Sector
Technology Rank
Composting at household level 1st
Waste segregation at household level 2nd
Semi-aerobic landfill – Fukuoka system 3rd
Baling or compacting at commercial level 4th
Both CC adaptation and mitigation are critical considerations for the region’s small island
developing states. Nauru like any other SIDS does not have adequate technological capacity
to adapt to and mitigate climate change impacts hence it is for this reason that Nauru has been
included in this third phase of the TNA process.
All the stakeholder-identified technologies for CC adaptation and mitigation have yet to get
wide acceptability and application in the country, hence at this stage none of these
technologies have been finalised. Following this initial TNA process where the technology
rankings are based on equal criterion weights, each of these technologies will now undergo
analyses of market conditions and to identify barriers for enhanced deployment including
appropriate technical, financial and policy instruments to facilitate implementation and
deployment of the technologies.
7.3 Conclusion
The report presents the true result of the TNA process which took place nation-wide across
the country between, January to June 2019. The result presented both adaptation and
mitigation priority areas as presented in the summary above. The consultation took an
inclusive approach which means wider spectrum of both the public and private sectors were

Nauru TNA Report
59
thoroughly consulted and views taken on board. Gender issues were also taken on-board to
reflect the wider consultation and participation of female, youth and older people in the
process. There is no undue influence by any party or person involved in the process to
influence the final result of the technologies presented. The consultants therefore recommend
the report for your consideration and further perusal.
Nauru TNA Report
60
List of References
Huq, N., Hugé, J., Boon, E., & Gain, A. (2015). Climate change impacts in agricultural
communities in rural areas of coastal Bangladesh: A tale of many
stories. Sustainability, 7(7), 8437-8460.
Nauru NDC (2018). Nationally Determined Contribution, Department of Commerce,
Industry and Environment, Nauru.
National Sustainable Development Strategy (2005). Nauru National Development
Strategy – Department of Commerce, Industry, Environment (2005-2025),
Nauru.
National Energy Policy Framework (2014). National Policy of Energy – Department
of Commerce, Industry and Environment, Nauru.
Republic of Nauru, Framework for Climate Change Adaptation and Disaster Risk
Reduction (2015). Department of Commerce, Industry and Environment,
Nauru.
Republic of Nauru, Second National Communication (2016). Republic of Nauru,
Second National Communication, Nauru.
Xia, J., Chen, J., Piao, S., Ciais, P., Luo, Y., & Wan, S. (2014). Terrestrial carbon
cycle affected by non-uniform climate warming. Nature Geoscience, 7(3),
173.

Nauru TNA Report
61
Annexes
Annex 1: Technology Fact Sheets for Adaptation
A.1.1 Adaptation Technology # 1 – Water Sector
Rooftop rainwater harvest for better water management and uses
1. Sector Water
2. Technology Characteristics
2.1 Technology Name :
Rainwater harvesting
2.2 Introduction:
Water is a scarce resource on the Island and due to
climate change impact, its consequences will be
aggravated more in years to come. Besides potential
water reticulation systems and manual water
distribution, rooftop rain water harvesting is a
supportive method that can be used to increase the
water use efficiency and reduce wastage and ensure
that effective use of water by households, business
houses, and government departments including
essential services like health centers, schools and
general populace around the Island.
A well design roof top rain water harvesting system
at household level is vital in getting water to all
households on the Island effectively. This however
would be a challenging technology as it benefits
more on individual households as opposed to the
potential reticulation system and manual water
distributions where it focusses on the benefit of all in
the community.
The population on the Island is more than 12,000
people and the demand for potable water is
increasing steadily over the years. The current
situation is that water is supplied to households,
government ministries and business houses around
the country by manual delivery. The water
department has three water-trucks and dispatches
water around the country on a daily basis which is
deemed expensive. This proposed technology would
enable the households to take ownership and
implement their own water use and management.
2.3 Technology
Characteristics/ Highlights:
medium cost (potentially high initial cost)
Low technology ( requires roofing, gutters, pipes
and tanks)
Hard Technology

Nauru TNA Report
62
Few bullet points, i.e. low/high cost;
advance technology; low
technology.
2.4 Institutional and Organizational
Requirement :
3.0 Operations and maintenance
3.1 Endorsement by Experts:
To increase water use and management at household
level roof top rain water harvesting systems must be
introduced across the island. This would ensure that
households take ownership on their effective
management and use of their rooftop rain water
harvesting system. The challenge would be each
home must ensure that they have a proper roof top
structure to facilitate installation of water harvesting
units. This will provide the much needed potable
water at lower price since the households now owns
and manage the unit themselves.
Such reliable water supply at household’s level
would allow households to participate even in
agricultural ventures as home or backyard farming.
The NUC -water department will focus only on their
current manual distribution and may further extend
into water investment opportunities if these
households could now have access to rain water
harvesting.
3.2 Adequacy for current climate:
Are there negative consequences of
the adaptation option in the current
climate? Some adaptation may be
targeted at the future climate but
may have costs and consequences
under the current climate.
This technology fits well for both the current and
future expected climate change across the Island.
Since the forecasts are predicting future draught and
long period of low precipitation such household
roof-top rain water harvesting systems would allow
communities the potential opportunity to manage
and use their water effectively at household level.
3.3 Size of beneficiaries group:
Technology that provides small
benefits to larger number of people
will often be favored over those that
provide larger benefits, but to fewer
people.
Beneficiaries of the technology will mainly the
household sectors and some business houses. The
government departments will likely to be serviced by
the NUC including schools, health and police force.
4. Costs
4.1 Cost to implement adaptation
options : Cost measures
Initial cost includes; the cost of guttering system,
pipes, tanks and additional plumbing related
expenses.
The cost of pipes, guttering and tanks for 1,600
households would roughly estimate USD1.7m
And related costs USD 1.8 = Total cost USD3.5m

Nauru TNA Report
63
4.2 Additional costs to implement
adaptation option, compared to
“business as usual”
The households would need additional adaptation
technology, compared to “business as usual” to
operate the roof top rain water harvesting system
effectively.
Among the additional costs we mention: cost of
designing the roof top rain water harvesting system
itself, cost of training to community members and
employees on how to use this technology, and cost
of monitoring and maintaining the piping system.
Each household is responsible for providing a space
for the construction of tanks for water storage at the
household level.
5.0 Benefits
5.1 Development impact, indirect
Roof top rain water harvesting system would relief
the households’ budget on water utility. Currently
the NUC distribute water by using load trucks and
tanks around the Island and transferring the cost to
households and consumers. The new initiative would
reduce costs and bring new benefits to the
community especially household income.
Below would likely be some of the major benefits
for consumers.
Saving cost on water expenses at household level by
producing it at home. It is the primary motivator for
the implementation of the roof top rain water system.
The rain water collected on rooftops could be used
to improve vegetation on the ground meaning more
plant/household uses and hygienic environment for
less water on the Island.
Rooftop rain water harvesting system could reach an
overall efficiency of almost 95% compared to
manual distribution currently practiced on the island.
Contributing to food security by increasing crop
yields for households who participate in backyard
gardening since they now have access to water their
gardens or crops, one of the supplementary sources
of growing their own food crops.
Efficient production of water may now see reduction
in in water bills and thus increase savings by
households and business consumers alike to free
some expenses and invest in options to benefit
households/business houses respectively.
5.2 Economic:
Employment –Jobs
Construction of the rooftop rainwater harvesting
system around the Island would create tens of jobs to
Nauruan for the next 12 to 24 months.
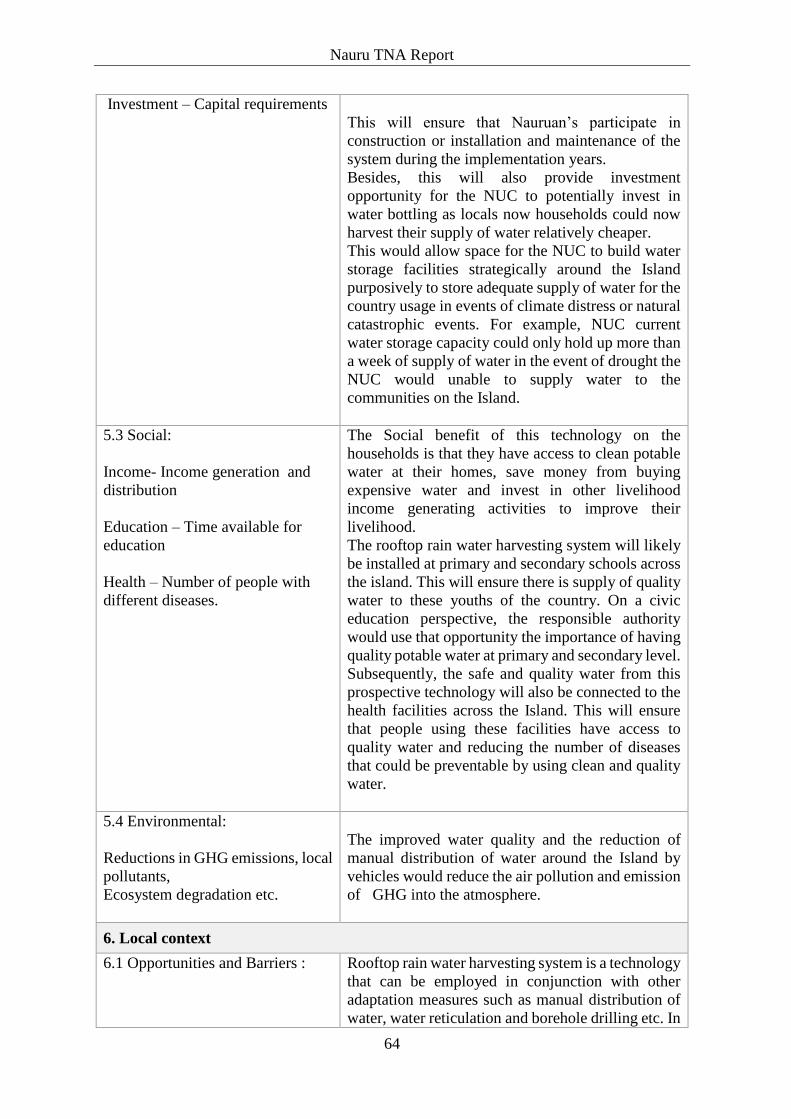
Nauru TNA Report
64
Investment – Capital requirements
This will ensure that Nauruan’s participate in
construction or installation and maintenance of the
system during the implementation years.
Besides, this will also provide investment
opportunity for the NUC to potentially invest in
water bottling as locals now households could now
harvest their supply of water relatively cheaper.
This would allow space for the NUC to build water
storage facilities strategically around the Island
purposively to store adequate supply of water for the
country usage in events of climate distress or natural
catastrophic events. For example, NUC current
water storage capacity could only hold up more than
a week of supply of water in the event of drought the
NUC would unable to supply water to the
communities on the Island.
5.3 Social:
Income- Income generation and
distribution
Education – Time available for
education
Health – Number of people with
different diseases.
The Social benefit of this technology on the
households is that they have access to clean potable
water at their homes, save money from buying
expensive water and invest in other livelihood
income generating activities to improve their
livelihood.
The rooftop rain water harvesting system will likely
be installed at primary and secondary schools across
the island. This will ensure there is supply of quality
water to these youths of the country. On a civic
education perspective, the responsible authority
would use that opportunity the importance of having
quality potable water at primary and secondary level.
Subsequently, the safe and quality water from this
prospective technology will also be connected to the
health facilities across the Island. This will ensure
that people using these facilities have access to
quality water and reducing the number of diseases
that could be preventable by using clean and quality
water.
5.4 Environmental:
Reductions in GHG emissions, local
pollutants,
Ecosystem degradation etc.
The improved water quality and the reduction of
manual distribution of water around the Island by
vehicles would reduce the air pollution and emission
of GHG into the atmosphere.
6. Local context
6.1 Opportunities and Barriers :
Rooftop rain water harvesting system is a technology
that can be employed in conjunction with other
adaptation measures such as manual distribution of
water, water reticulation and borehole drilling etc. In

Nauru TNA Report
65
Barriers to implementation and
issues such as the need to adjust
other policies.
our local context there has to be a lot of investment
in these options to make them viable - Water savings
through roof top rain water harvesting system
increase the opportunities of better using water
reserves for different purposes (domestic,
agriculture use, etc.) - Barriers include lack of
access to finance for purchasing the materials needed
and installation of rooftop rain water harvesting
water system on every homes on the Island - A
higher amount of initial investment may be required
at household level with some technical requirement
to solve.
Each household must take the initiative to replace
their roofing structure so that the system could be
easily installed at their homes.
At schools and other public areas the government or
respective community must build in new roof
structures to accommodate and facilitate rooftop rain
water harvesting system at their areas.
Where there is not place available the government
has to intervene with landowners to ensure that
proper arrangement are reached to ensure tanks or
rooftop rainwater harvesting facilities are stationed
to serve the community.
6.2 Status: Status of technology in
the country
Some private homes and business houses are
currently producing their own potable water through
rooftop rain water harvesting. Although the country
depends on salt water desalination it is still an
expensive option at domestic level on the Island.
Currently the NUC produce about 70% of potable
water and distribute for commercial and domestic
use in the country. Timeframe is continuous.
6.3 Timeframe :
Specify timeframe for
implementation
Life time
6.4 Acceptability to local
stakeholders :
Where the technology will be
attractive to stakeholders
Yes
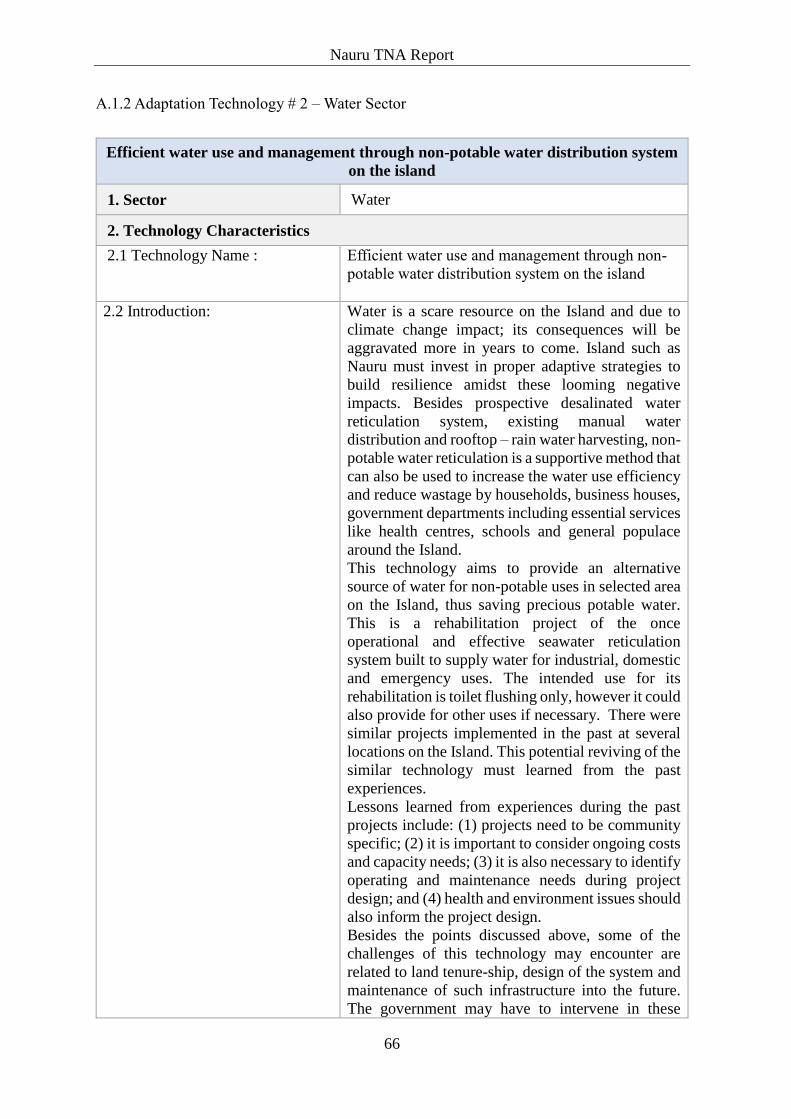
Nauru TNA Report
66
A.1.2 Adaptation Technology # 2 – Water Sector
Efficient water use and management through non-potable water distribution system
on the island
1. Sector Water
2. Technology Characteristics
2.1 Technology Name :
Efficient water use and management through non-
potable water distribution system on the island
2.2 Introduction:
Water is a scare resource on the Island and due to
climate change impact; its consequences will be
aggravated more in years to come. Island such as
Nauru must invest in proper adaptive strategies to
build resilience amidst these looming negative
impacts. Besides prospective desalinated water
reticulation system, existing manual water
distribution and rooftop – rain water harvesting, non-
potable water reticulation is a supportive method that
can also be used to increase the water use efficiency
and reduce wastage by households, business houses,
government departments including essential services
like health centres, schools and general populace
around the Island.
This technology aims to provide an alternative
source of water for non-potable uses in selected area
on the Island, thus saving precious potable water.
This is a rehabilitation project of the once
operational and effective seawater reticulation
system built to supply water for industrial, domestic
and emergency uses. The intended use for its
rehabilitation is toilet flushing only, however it could
also provide for other uses if necessary. There were
similar projects implemented in the past at several
locations on the Island. This potential reviving of the
similar technology must learned from the past
experiences.
Lessons learned from experiences during the past
projects include: (1) projects need to be community
specific; (2) it is important to consider ongoing costs
and capacity needs; (3) it is also necessary to identify
operating and maintenance needs during project
design; and (4) health and environment issues should
also inform the project design.
Besides the points discussed above, some of the
challenges of this technology may encounter are
related to land tenure-ship, design of the system and
maintenance of such infrastructure into the future.
The government may have to intervene in these

Nauru TNA Report
67
matters for the benefit of the community.
Nevertheless, the technology should benefit more
households and not only certain individuals in the
community.
The population on the Island is more than 12,000
people and the demand for potable water is
increasing steadily over the years. The current
situation is that water is supplied to households,
government ministries and business houses around
the country by manual delivery. The water
department has three trucks and dispatches water
around the Island on daily basis which is deemed
expensive. This propose technology would ensure
there is less pressure on the potable water usage on
the Island.
2.3 Technology
Characteristics/ Highlights:
Few bullet points, i.e. low/high cost;
advance technology; low
technology.
high cost (potentially high initial cost)
Low technology ( requires only pipes and tanks)
Hard Technology
2.4 Institutional and Organizational
Requirement :
3.0 Operations and Maintenance
3.1 Endorsement by Experts:
To increase water use and management at household
level reticulation of non-potable water must also be
introduced across the island. This would ensure that
households have access to both potable and non-
potable water and use the potable water more
effectively. Currently households have no option but
use their scarce potable water for all other domestic
uses including toilet flushing etc.
The challenge would be each home must have the
facility and the capacity to store both potable and
non-potable water at the same time and ensuring to
use them more effectively. When both potable and
non-potable water supplies are available, households
would be able to participate even in agricultural
ventures as home or backyard farming which is
critical to improving their livelihoods.
The NUC -water department will at the same work
towards reticulation of potable water to ensure all
households have access to both potable and non-
potable water thus improving the quality of life on
the Island.
3.2 Adequacy for current climate:
Are there negative consequences of
the adaptation option in the current
This technology fits well for both the current and
future expected climate change across the Island.
Since the forecasts are predicting future draught and
long period of low precipitation, reticulation of non-
Nauru TNA Report
68
climate? Some adaptation may be
targeted at the future climate but
may have costs and consequences
under the current climate.
potable water is critical to allow households
opportunity to manage and use their potable water
effectively.
3.3 Size of beneficiaries group:
Technology that provides small
benefits to larger number of people
will often be favored over those that
provide larger benefits, but to fewer
people.
Beneficiaries of the technology will mainly the
household sectors and some business houses. The
government departments will likely to be serviced by
the NUC including schools, health and police force.
4. Costs
4.1 Cost to implement adaptation
options : Cost measures
Initial cost includes; the cost of pipes, tanks and
additional plumbing related expenses.
The cost of pipes for 1,600 households would
roughly estimate USD2.5
And related costs USD 1.5 = Total cost USD4m
4.2 Additional costs to implement
adaptation option, compared to
“business as usual”
The households would need additional adaptation
technology, compared to “business as usual” to
operate the non-potable water reticulation system
effectively.
Among the additional costs we mention: cost of
designing the reticulation system itself, cost of
training of community members and employees on
how to use this technology, and cost of monitoring
and maintaining the piping system.
5.0 Benefits
5.1 Development impact, indirect
/benefits
Non-potable water reticulation system would relief
the households’ budget on potable water utility bills.
Currently the NUC distribute water by using load
trucks and tanks around the Island and transferring
the cost to households and consumers. The new
initiative would reduce costs on potable water and
bring new benefits to the community especially
household income.
Below are likely be some of the major benefits for
consumers.
Saving cost on water bills at household level by
using the non-potable water which should be
relatively cheaper and at the same time relieving the
dependency on potable water also for toilet flashing
and other household uses. It is the primary motivator
for the implementation of the non-potable water
reticulation system.
The potable water saved from this process could be
used to improve vegetation on the ground meaning

Nauru TNA Report
69
more plant/household uses and hygienic
environment for less water on the Island.
Potable water accessed through manual distribution
could be effectively managed and even stored for
uses during drought and other catastrophic events.
Contributing to food security by increasing crop
yields for households who participate in backyard
gardening since the potable water saved could now
use to water their gardens or crops, one of the
supplementary sources of growing their own food
crops.
Effective potable water use may now see reduction
in water bills and thus increase savings by
households and business consumers alike to free
some expenses and invest in options to benefit
households/business houses respectively.
5.2 Economic benefits :
Employment –Jobs
Investment – Capital requirements
Construction of non-potable water reticulation
system around the Island would create tens of jobs to
Nauruan for the next 12 to 24 months.
This will ensure that Nauruan’s participate in
construction or installation and maintenance of the
system during the implementation years.
Besides, this will also provide investment
opportunity for the NUC to potentially invest in
water bottling as there will be now more supply of
potable water available on the Island.
This would allow space for the NUC to build potable
water storage facilities strategically around the
Island purposively to store adequate supply for the
country usage in events of climate distress or natural
catastrophic events. For example, NUC current
water storage capacity could only hold up more than
a week of supply of water in event of drought the
NUC would unable to supply water to the
communities on the Island.
5.3 Social benefits :
Income- Income generation and
distribution
Education – Time available for
education
Health – Number of people with
different diseases.
The Social benefit of this technology on the
households is that they have access to clean potable
water at their homes, save money from buying
expensive water and invest in other livelihood
income generating activities to improve their
livelihood.
The non-potable water harvesting system will also
connected to primary and secondary schools across
the island. This will ensure there is supply of non-
potable water to the youths of the country. On a civic
education perspective, the responsible authority
Nauru TNA Report
70
would use that opportunity the importance of having
non-potable water at primary and secondary levels.
Subsequently, the non-potable water reticulation
system will also be connected to the health facilities
across the Island. This will ensure that people using
these facilities have access to non-potable water and
allow less dependency on potable water reducing the
number of diseases that could be preventable by
using clean and quality water.
5.4 Environment benefits:
Reductions in GHG emissions, local
pollutants,
Ecosystem degradation etc.
The improved non-potable water reticulation system
would reduce the manual water distribution around
the Island by vehicles thus reduce the air pollution
and emission of GHG into the atmosphere.
6. Local context
6.1 Opportunities and Barriers :
Barriers to implementation and
issues such as the need to adjust
other policies.
Non-potable reticulation system is a technology that
can be employed in conjunction with other
adaptation strategies such as manual water
distribution system, water reticulation and borehole
drilling etc. In our local context there has to be a lot
of investment in these options to make them viable –
Potable water savings through non-potable water
reticulation system increase the opportunities of
better usage of water reserves for different purposes
(domestic, agriculture use, etc.) - Barriers include
lack of access to finance for purchasing the materials
needed and installation of non-potable water
reticulation harvesting water system on induvial
house level on the Island - A higher amount of initial
investment may be required at household level with
some technical requirement to solve.
Land owning groups must collaborate with the
government to allow storage facilities and pipes to
run through their land and connect to homes and
public amenities across the Island. At schools and
other public areas the government or respective
communities must build in new accommodate and
facilitate rooftop rain water harvesting system at
their areas.
6.2 Status: Status of technology in
the country
Some private homes and business houses are
currently producing their own potable water through
rooftop rain water harvesting. Although the country
depends on salt water desalination it is still an
expensive option at domestic level on the Island.
Nauru TNA Report
71
Currently the NUC produce about 70% of potable
water and distribute for commercial and domestic
use in the country. Timeframe is continuous.
6.3 Timeframe :
Specify timeframe for
implementation
Life time
6.4 Acceptability to local
stakeholders :
Where the technology will be
attractive to stakeholders
Yes

Nauru TNA Report
72
A.1.3 Adaptation Technology # 3 – Water Sector
Reticulation distribution system for efficient water and management on the islands
1.0 Sector Water
2.0 Technology Characteristics
2.1 Technology Name :
Reticulation distribution system for efficient water
use and management on the Islands
2.2 Introduction:
Water is a scare resource on the Island and due to
climate change impact; its consequences will be
aggravated more than the past. Reticulation
distribution is a supportive method that can be used
to increase the water use efficiency and reduce
wastage , reduce evaporation, runoff and ensure that
effective use of water by households, essential
services like clinics, schools and general businesses
populace around the Island.
A water reticulation system is vital in getting water
all the way from the source i.e. desalination plants to
the consumer around the island. Working together
with water department, communities and business
houses water could be effectively distributed to the
consumers.
Water reticulation distribution system would enable
the domestic water department to establish dedicated
storage facility strategically around the Island. These
dedicated storage facilities (tanks) could be used as
reservoir and should be used only during drought
period or unexpected catastrophic situations.
The population on the Island is more than 12,000
people and the demand for potable water is
increasing steadily over the years. The current
situation is that water is supplied to households,
government ministries and business houses around
the country by manual delivery. The water
department has three trucks and dispatches water
around the country on daily basis which is deemed
expensive.
2.3 Technology
Characteristics/ Highlights:
Few bullet points, i.e. low/high
cost; advance technology; low
technology.
High cost (potentially high initial cost)
Low technology ( requires only pipes and
tanks)
Hard Technology
2.4 Institutional and Organizational
Requirement :

Nauru TNA Report
73
3.0 Operations and maintenance
3.1 Endorsement by Experts:
To increase water use efficiency and effectively
water saving technologies including piping system,
water storage reservoir and reticulation must be
introduced across the island. This would ensure
continuity of supply even during drought and
catastrophe events. Business houses would
concentrate on business operations and not have to
worry about the water reliability on the Island.
Such reliable water supply to households and
business would allow households to participate even
in agricultural ventures as home or backyard
farming.
The Water Utility department will ensure that such
system is fully established and operative on the
Island.
3.2 Adequacy for current climate:
Are there negative consequences
of the adaptation option in the
current climate? Some adaptation
may be targeted at the future
climate but may have costs and
consequences under the current
climate.
Fits well for both the current and future expected
climate change across the Island. Since the forecasts
are predicting future draught and long period of law
precipitation such reticulation and storage facility
around the island would be beneficial to the
communities.
3.3 Size of beneficiaries group:
Technology that provides small
benefits to larger number of people
will often be favored over those
that provide larger benefits, but to
fewer people.
Beneficiaries include the household sectors,
business houses, government departments, schools,
health and private sectors.
The water reticulation system will ensure that water
is pumped up from the desalination plant and is
stored uphill around the Island at two to three
locations before distributing to consumers around
the islands.
The benefits are distributed and shared among
almost everyone on the Islands.
4. Costs
4.1 Cost to implement adaptation
options : Cost measures
Initial cost includes the cost of the reticulation
system, pipes, storage facilities (tanks), land
acquisition and design of the project.
Meanwhile, the NUC has the capacity to produce
the volume of water needed to distribute on the

Nauru TNA Report
74
Islands but is constraint by no proper storage facility
to store water before distribution on the Island either
for normal consumption or for use during disaster
periods.
The cost of pipe would roughly estimate USD1.2m
while storage facility would cost additional
USD.6m.
And related costs USD 1.2m = Total cost USD3m.
4.2 Additional costs to implement
adaptation option, compared to
“business as usual”
The NUC would need additional adaptation
technology, compared to “business as usual” to
operate the reticulation system effectively.
Among the additional costs we mention: cost of
designing the reticulation system, the energy
(electricity/diesel to pressurize water), cost of the
training to NUC employees on how to use this
technology, and cost of monitoring and maintaining
the piping system. Nevertheless, if the project is to
be given priority the government through NUC may
have to obtain lease or some agreement on the plots
of land by which the storage facilities would have to
locate before distribution to households and public
users around the Island.
5.0 Benefits
5.1 Development impact, indirect
/benefits
Reticulation system would enable reduction in the
cost of operation to distribute water around the
Island. Currently the NUC distribute water by using
load trucks and tanks around the Island a costly
exercise. The new initiative would reduce costs and
bring new benefits to the community.
Below would likely be some of the major benefits
for consumers.
Saving water by improving water delivery
efficiency: it is the primary motivator for the
implementation of the reticulation system, meaning
more plant/household uses and hygienic
environment for less water on the Island.
Water reticulation system could reach an overall
efficiency of almost 90% compared to manual
distribution currently practiced on the island.
Contributing to food security by increasing crop
yields for households who participate in backyard
gardening since they now have access to water their
gardens or crops, one of the supplementary sources
of growing their own food crops.

Nauru TNA Report
75
With the Water storage system the NUC now be able
to treat the water appropriately before distribution to
the households for consumption around the Island.
This may prevent any water related dieses or
negative impact on the communities.
Efficient production of water may now see reduction
in in costs and thus increase savings by the NUC and
consumers alike to free some expenses and invest in
options to benefit the corporation and
households/business houses respectively.
5.2 Economic benefits :
Employment –Jobs
Investment – Capital requirements
Construction of the reticulating system and water
tank bulk storage facilities around the Island would
create tens or more than a hundred jobs to Nauruan
for the next 12 to 24 months.
This will ensure that Nauruan’s participate in
construction, maintenance and manning of the
reticulation system during the construction to
operation years ahead.
Besides, this will also provide investment
opportunity for private sector to potentially
investment in water bottling by locals or joint
ventures which ultimately will increase the quality
and supply of water to the people of Nauru.
The water storage facilities build around the Island
as part of this technology could be able to store
adequate supply of water for the country usage up to
one month in time of climate distress of natural
catastrophic event. This is enough time for the NUC
to find alternate solution to rectify such situation. For
example, NUC current water storage capacity could
only hold up more than a week of supply of water.
The country would run out of water if current
productions shuts down for more than 2 weeks.
5.3 Social benefits :
Income- Income generation and
distribution
Education – Time available for
education
Health – Number of people with
different diseases.
The Social benefit of this technology on the
households is that they have access to clean potable
water at their homes, save money from buying
expensive water and invest in other livelihood
income generating activities to improve their
livelihood.
The reticulation system will also be connected to
primary and secondary schools across the island.
This will ensure there is supply of quality water to
these youths of the country. On a civic education
perspective, the responsible authority would use that
opportunity the importance of having quality potable
water at primary and secondary level.

Nauru TNA Report
76
Subsequently, the safe and quality water from this
prospective technology will also be connected to the
health facilities across the Island. This will ensure
that people using these facilities have access to
quality water and reducing the number of diseases
that could be preventable by using clean and quality
water.
5.4 Environment benefits:
Reductions in GHG emissions,
local pollutants,
Ecosystem degradation etc.
The improved water quality and the reduction of
manual distribution of water around the Island by
vehicles would reduce the air pollution and emission
of GHG into the atmosphere.
6. Local context
6.1 Opportunities and Barriers :
Barriers to implementation and
issues such as the need to adjust
other policies.
Water reticulation is a technology that can be
employed in conjunction with other adaptation
measures such as rooftop- rainwater harvesting and
borehole drilling etc. In the case of Nauru there has
to be a lot of investment in these options to make
them viable - Water savings through reticulation
system increase the opportunities of better using
water reserves for different purposes (domestic,
agriculture use, etc.) - Barriers include lack of
access to finance for purchasing the equipment, and
the procurement of energy source. - A higher amount
of initial investment involved than other systems. -
Technical conditions such as proper calculations of
pressure, land tenure ship, community politics can
further complicate and increase implementation and
maintenance costs or affect system efficiency. - The
manual distribution of water as of the existing
system can be costly and expensive exercise on the
longer term. - A low level of public awareness for
the importance of sustainable water management and
use, and the lack of technicians providing monitoring
of water needs and reticulation system is critical for
the island community.
The government has to intervene with landowners to
ensure that proper arrangement are reached to ensure
tanks or water storage facilities are stationed
strategically around the island to ease access by the
community once needed.
6.2 Status: Status of technology in
the country
Some private homes and business houses are
currently producing their own water through rain
water harvesting. Desalination of salt water is still an
expensive option at domestic level on the Island.
Currently the NUC produce about 70% of potable
water and distribute for commercial and domestic
use in the country. Timeframe is continuous.

Nauru TNA Report
77
6.3 Timeframe :
Specify timeframe for
implementation
Life time
6.4 Acceptability to local
stakeholders :
Where the technology will be
attractive to stakeholders
Yes
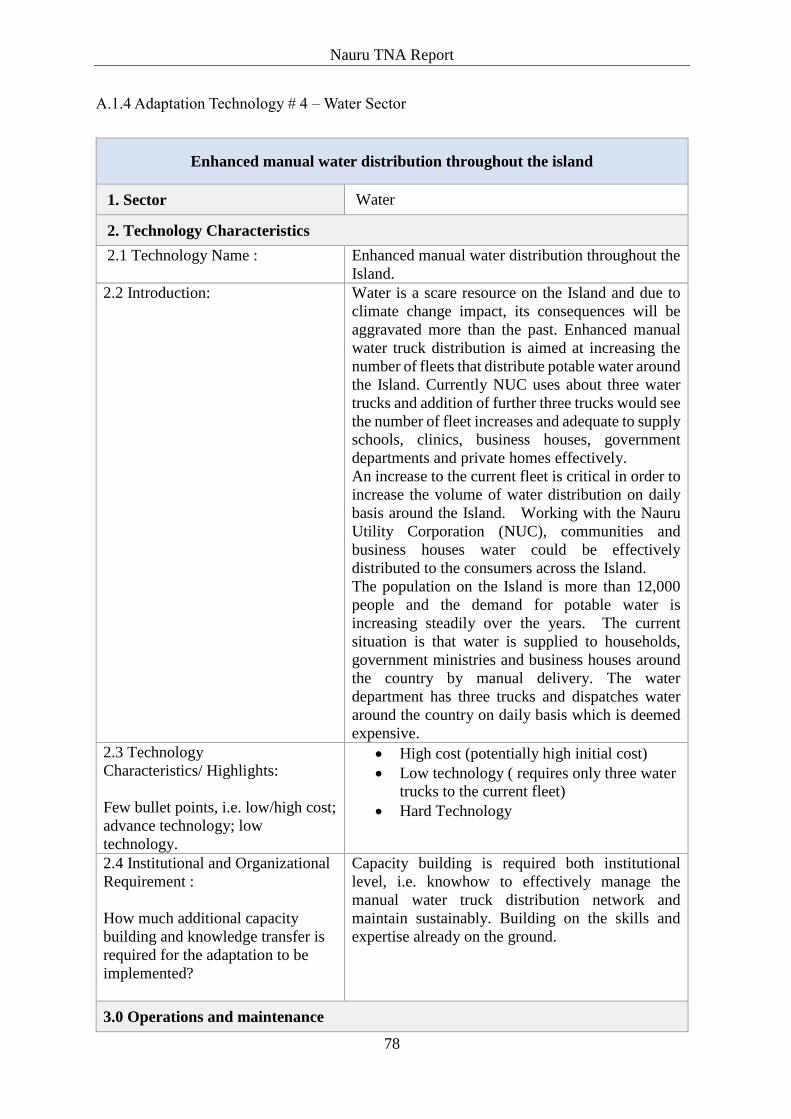
Nauru TNA Report
78
A.1.4 Adaptation Technology # 4 – Water Sector
Enhanced manual water distribution throughout the island
1. Sector Water
2. Technology Characteristics
2.1 Technology Name :
Enhanced manual water distribution throughout the
Island.
2.2 Introduction:
Water is a scare resource on the Island and due to
climate change impact, its consequences will be
aggravated more than the past. Enhanced manual
water truck distribution is aimed at increasing the
number of fleets that distribute potable water around
the Island. Currently NUC uses about three water
trucks and addition of further three trucks would see
the number of fleet increases and adequate to supply
schools, clinics, business houses, government
departments and private homes effectively.
An increase to the current fleet is critical in order to
increase the volume of water distribution on daily
basis around the Island. Working with the Nauru
Utility Corporation (NUC), communities and
business houses water could be effectively
distributed to the consumers across the Island.
The population on the Island is more than 12,000
people and the demand for potable water is
increasing steadily over the years. The current
situation is that water is supplied to households,
government ministries and business houses around
the country by manual delivery. The water
department has three trucks and dispatches water
around the country on daily basis which is deemed
expensive.
2.3 Technology
Characteristics/ Highlights:
Few bullet points, i.e. low/high cost;
advance technology; low
technology.
High cost (potentially high initial cost)
Low technology ( requires only three water
trucks to the current fleet)
Hard Technology
2.4 Institutional and Organizational
Requirement :
How much additional capacity
building and knowledge transfer is
required for the adaptation to be
implemented?
Capacity building is required both institutional
level, i.e. knowhow to effectively manage the
manual water truck distribution network and
maintain sustainably. Building on the skills and
expertise already on the ground.
3.0 Operations and maintenance

Nauru TNA Report
79
3.1 Endorsement by Experts:
To increase water use efficiency and
effectively, this water saving technologies
including additional trucks and water
storage facility must be introduced across
the island.
This would ensure continuity of supply even
during drought and catastrophe events.
Business houses would concentrate on
operations and not have to worry about the
water reliability on the Island.
Such reliable water supply to households
and business would allow households to
participate even in agricultural ventures as
home or backyard gardening or farming.
The Water Utility department will ensure
that such system is fully established and
operative on the Island.
3.2 Adequacy for current climate:
Are there negative consequences of
the adaptation option in the current
climate? Some adaptation may be
targeted at the future climate but may
have costs and consequences under
the current climate.
Adaptation of this technology non-related to
adaptation can be reaped even in the current climate
thereby making its early adoption economically and
socially desirable. Under conditions of increased
water stress resulting from climate change the
benefits of the technology rises quite significantly.
3.3 Size of beneficiaries group:
Technology that provides small
benefits to larger number of people
will often be favored over those that
provide larger benefits, but to fewer
people.
The scale of the enhanced manual distribution
technology is relatively high making it beneficial to
all and less individual.
4. Costs
4.1 Cost to implement adaptation
options : Cost measures
USD$3 M
Cost of three additional water loading trucks and
construction of two reserve water facilities at
selected sites on the Island.
4.2 Additional costs to implement
adaptation option, compared to
“business as usual”
This is not a relatively new technology on the Island
as the NUC is already distribution water on the
ground. Perhaps construction of new water tanks
strategically around the Island is a new component
of this technology.
5.0 Development impact, indirect /benefits
5.1 Economic benefits :
Employment –Jobs
Increase productivity and reduced running
cost of current manual distribution of water
around the island.

Nauru TNA Report
80
Investment – Capital requirements
Reduced costs of production and higher
prices enabled realizing nominal income for
running of the essential service
Cost effective –since investing in capital
expenditure will last for the next 25 to 35
years.
5.2 Social benefits :
Income- Income generation and
distribution
Education – Time available for
education
Health – Number of people with
different diseases.
Gender - considerations
Cost of water should be stabled or even
reduced on the Island saving the much
needed disposable income of households to
spend on other family commitments.
Storage of water will allow for better
treatment of the water before supplying for
households
Students may have accessible and treated
water at home and school and other learning
centres
Improved personal hygiene,
Women could now have access to water at
home easily and participate in other
communal or development matters
5.3 Environment benefits:
Reductions in GHG emissions, local
pollutants,
Ecosystem degradation etc.
Use of manual distribution from water
storage facilities is being one of the most
environmentally friendly alternatives. It
reduces or zero the gas emission made from
manual distribution mode on daily basis.
Effective use of water also allow households
to use water domestically for agriculture
which is beneficial to the environment.
6. Local context
6.1 Opportunities and Barriers :
Barriers to implementation and
issues such as the need to adjust
other policies.
Manual distribution of water is a technology that is
being used on the Islands for the past decades. This
technology could be used conjunction with other
adaptation measures such as rooftop- rainwater
harvesting and borehole drilling etc. In the case of
Nauru borehole drilling has to be done at selective
areas as there is a huge problem with sewage
contamination. But there is opportunity to invest in
other systems such as water reticulation on the
Island. Water savings through manual distribution
system increase the opportunities of better using
water reserves for different purposes (domestic,
agriculture use, etc.) - Barriers include lack of
access to finance for purchasing the equipment, and
the construction of water reserves at strategic
locations around the Island. - A relatively high
amount of initial investment involved if we
construct water storage facilities as well at 2 or 3
locations around the Island- Technical conditions
Nauru TNA Report
81
such as, land tenure ship, community politics can
further complicate and increase implementation and
maintenance costs or affect system efficiency. - The
manual distribution of water as of the existing
system can be costly and expensive exercise on the
longer term but it is the technology we could
manage to implement at the moment. - A low level
of public awareness for the importance of
sustainable water management and use, and the lack
of technicians providing monitoring of water needs
and water storage facility is critical for the Island in
times of disasters and long term effects of climate
change.
The government has to intervene with landowners
to ensure that proper arrangement are reached to
ensure tanks or water storage facilities are stationed
strategically around the island to ease access by the
community once needed.
6.2 Status: Status of technology in
the country
Manual distribution of water is an old technology on
the Island but the safe water storage facilities at
strategic locations on the Island would be new and
critical to counter water crisis during future
catastrophe events.
6.3 Timeframe : Specify timeframe
for implementation
Life time
6.4 Acceptability to local
stakeholders :
Where the technology will be
attractive to stakeholders
Yes
Nauru TNA Report
82
A.1.5 Adaptation Technology # 5 – Coastal Sector
Coastal beaches and vegetation replenishment for community resilience against
social erosion.
1.0 Sector Coastal areas management - soil erosion
2.0 Technology Characteristics
2.1 Technology Name :
Coastal beaches and vegetation replenishment for
community resilience against social erosion.
2.2 Introduction:
Nauru’s coast, the only habitable area, is threatened
by sea level rise (SLR) and steadily erosion. Soil
erosion is the displacement of the upper layer of soil
either into the ocean or downhill depending on the
location, it is a form of soil degradation. There are
many reasons for this soil erosion across the Island.
These include human activities such as digging of
beaches and destroying the natural habitat in name
of development, sea level rise, coastal flooding and
storm surges. With the melting of the glaciers and
ice sheet continues to accelerate the warming of the
ocean, the negatively impact this may have on the
Pacific Island countries will also continue because
of their proximity to coastal areas. Satellite data
indicates that Nauru experienced SLR by about 5
mm per year since 1993. This is larger than the
global average of 2.8–3.6 mm per year. This higher
rate of SLR may also be related to natural
fluctuations that take place year to year or decade to
decade caused by phenomena such as the El Niño-
Southern Oscillation. Due to increasing impact of
climate change, it is unequivocal that its
consequences will be aggravated more than the past,
particularly on these coastal communities along the
Island. Replanting of vegetation and beach
nourishment is therefore seen as supportive strategy
that can be used to increase resilience and adaptation
around the Island. Replanting of vegetation and
beach nourishment is therefore critical to protect
communities including facilities such as clinics,
schools, homes and general businesses populace.
Beach vegetation replanting strategy may also
provide opportunity for the communities to re
nourish the beaches, replant vegetation as form of
natural re-enforcement against coastal erosion and
SLR. Working together with Department of
Commerce, Industry and Environment (CIE), the
participating communities would identify the coastal
areas which are in urgent need to restore their
beaches from coastal erosion.

Nauru TNA Report
83
The population on the Island is more than 12,000
people and the destruction of the coastal areas
through human actions are also increasing. This
calls for this technology to include civic component
– i.e. ensure awareness of general public on the need
to look after the beaches and not to destroy them as
the island faces the reality of climate change across
the country.
2.3 Technology
Characteristics/ Highlights:
Few bullet points, i.e. low/high
cost; advance technology; low
technology.
medium cost (potentially high initial cost)
Low technology ( requires landfills,
grasses,)
Hard Technology
2.4 Institutional and Organizational
Requirement :
3.0 Operations and maintenance
3.1 Endorsement by Experts:
To increase community resilience and prevent
coastal erosion, the replanting of vegetation and
refurbishment of coastal areas at selected vulnerable
sites across the island is important. This would
prevent soil erosion and ensure continuity of
business along the coastal areas even during strong
winds, storm surges and catastrophic events. Coastal
communities would felt protected against the
exposure and vulnerability that climate change and
extreme storm events brought if there is no buffer of
vegetation and natural beaches these identified sites.
Households and business houses would concentrate
on their normal day to day operations and not have
to worry about their homes and businesses been
carried away in the next disaster events.
3.2 Adequacy for current climate:
Are there negative consequences of
the adaptation option in the current
climate? Some adaptation may be
targeted at the future climate but
may have costs and consequences
under the current climate.
Fits well for both the current and future expected
climate change across the Island. Since the forecasts
are predicting future SLR with increasing intensity
and frequency of storm surges which may cause
further coastal erosion and washing away of
beaches, such beach vegetation replanting and
nourishment at identified vulnerable locations
around the island would be beneficial to the
communities at large.
3.3 Size of beneficiaries group:
Technology that provides small
benefits to larger number of people
will often be favored over those
that provide larger benefits, but to
fewer people.
Beneficiaries include the household sectors,
business houses, government departments, schools,
health and private sectors. The beach vegetation and
nourishment would ensure the general community at
large is protected. There will be no individual or
group of people who would be primary beneficiaries
of such developments. While homes located closer
to the identified locations may directly benefit from
Nauru TNA Report
84
such undertakings, the positive externalities to the
community at large is immeasurable. The benefits
are distributed and shared among almost everyone
on the Islands.
4.0 Costs
4.1 Cost to implement adaptation
options :
Cost measures
Initial cost includes the cost “grounds work’
(landfills), cost of V&A reports and beach
replenishment or nourishment.
The CIE although over sees the environment
management in the country, it does not have the
capacity to provide some of the costs as mentioned
above. Therefore the technology would requires the
following costs to fully implement this adaptation
option:
The cost of groundworks ( landfills) USD 3m
Additional costs (V&A, EIA, & beach nourishment)
1.5
Total cost = USD4.5m
4.2 Additional costs to implement
adaptation option, compared to
“business as usual”
The additional costs which may be required to
implement this technology includes cost for beach
nourishment and replanting of trees to ensure long
term resilience is achieved at these coastal areas. The
cost is factored into the initial costs above.
5.0 Benefits
5.1 Development impact, indirect
/benefits
The new initiative would reduce coastal erosion and
bring confidence in the communities along the
coastal areas that their properties are safe and can
continue with development initiatives at these sites.
Below would likely be some of the major benefits
on the communities.
Safety and security of the community alone
the coast lines: it is the primary motivator for
the implementation the beach vegetation
replenishment and nourishment, meaning
more households/ public depends on the
secure and safer environment from coastal
erosion.
Contributing to food security by households
participating in backyard gardening since
they now have access to safer land, growing
some of their basic crops supplementing
their budgets.
There wouldn’t be disruptions on major
infrastructures such as roads, electricity and
perhaps water supply manual distribution on
the Island.
More funding will spend on economic
development by the government rather than
Nauru TNA Report
85
just building a seawall or barriers which
would be seen uneconomical to this cash
trapped nation.
5.2 Economic benefits :
Employment –Jobs
Investment – Capital requirements
Investment into coastal area vegetation and
replenishment around selected areas around the
Island would create tens of jobs to Nauruan for the
next 12 to 16 months.
This will ensure that Nauruan’s participate in
landfilling, soil nourishment and
rehabilitation of the beaches during the
implementation and maintenance stages of
the technology.
The general community will continue to live
and operate their business at the coastal areas
thus contributing to the economic growth of
the country.
Nauruan’s that participate in this technology
would earn the income and support their
families to meet school fees and other
livelihood expenses.
5.3 Social benefits :
Income- Income generation and
distribution
Education – Time available for
education
Health – Number of people with
different diseases.
The Social benefit of this technology on the
households is that they are secured and
protected from impact of SLR and coastal
erosion. The little money they earn could
now be invested in other income generating
activities to improve their livelihood rather
than worrying about the coastal erosion.
The coastal areas which are vulnerable to
coastal erosion and SLR will now have some
buffer against salt water intrusion. The
responsible authorities must ensure that
primary and secondary schools across the
island are safe and secure from such impact
of SLR. This will ensure the youths and the
weak are protected from the SLR and soil
erosion.
Subsequently, health and gender issues will
be considered and filtered through every
process of decision making in this project.
5.4 Environment benefits:
Reductions in GHG emissions,
local pollutants,
Ecosystem degradation etc.
Soil erosion caused by SLR will be controlled and
managed at these sites because of coastal land
vegetation and beach nourishment etc. Replanting of
vegetation at these sites may also contribute towards
reduction of the GHG and pollution into the
atmosphere.

Nauru TNA Report
86
6.0 Local context
6.1 Opportunities and Barriers :
Barriers to implementation and
issues such as the need to adjust
other policies.
Coastal land vegetation and beach nourishment is a
technology that can be employed in conjunction with
other adaptation measures such as coastal zone
management – Locally managed protected area
including and sea wall construction etc. In the case
of Nauru there has to be a lot of investment and
commitment into these options to make them viable.
Coastal land vegetation and beach nourishment
would increase the opportunities for effective
resilience with different purposes (domestic,
agriculture use, etc.) - Barriers include lack of
access to finance to invest in land fillings along the
vulnerable coastal areas, policies by the National
government surrounding management of beaches
and awareness by communities on the devastation
impact of climate change etc. This option would be
relatively cheaper compare to other adaptations
options. - Technical requirements such as V&A, EIA
and structural design may increase implementation
and maintenance costs. Although coastal land
vegetation and beach nourishment may be accrue
some initial costs, it is cheaper on the longer run. -
A low level of public awareness is critical to support
the technology.
6.2 Status:
Status of technology in the country
Certain communities have already participated in
programs design to protect coastal soil erosion
around the Island. However, the rate of soil erosion
is worrisome and thus calls for prioritizing of this
technology at selected vulnerable sites across the
Island. Timeframe is continuous.
6.3 Timeframe :
Specify timeframe for
implementation
Life time
6.4 Acceptability to local
stakeholders :
Where the technology will be
attractive to stakeholders
Yes

Nauru TNA Report
87
A.1.6 Adaptation Technology # 6 – Coastal Sector
Construction of sea wall for resilience at selective sites around the Island
1. Sector Coastal areas management - soil erosion,
2. Technology Characteristics
2.1 Technology Name :
Construction of sea wall for resilience at selective
sites around the Island
2.2 Introduction:
The melting of the glaciers and ice sheet together
with the warming of the ocean will continue to
negatively impact the Pacific Island countries
because of their proximity to coastlines. As ocean
water warms it expands causing the sea level rise
(SLR), salt water inundation and coastal area
erosion. Satellite data indicates that Nauru
experienced SLR by about 5 mm per year since
1993. This is larger than the global average of 2.8–
3.6 mm per year. This higher rate of SLR may also
be related to natural fluctuations that take place year
to year or decade to decade caused by phenomena
such as the El Niño-Southern Oscillation. Due to
increasing impact of climate change, it is
unequivocal that its consequences will be
aggravated more than the past, particularly on these
coastal communities along the Island. Sea wall
construction is therefore seen as supportive strategy
that can be used to increase resilience and adaptation
around the Island. Sea wall construction is therefore
critical to protect communities including facilities
such as clinics, schools, homes and general
businesses populace.
Sea wall construction may also provide opportunity
for the communities to replenish the beaches, replant
vegetation as form of natural re-enforcement against
coastal erosion. Working together with Department
of Commerce, Industry and Environment (CIE),
participating communities would identify the sites
which are in urgent need to restore by building these
structured sea walls.
The population on the Island is more than 12,000
people and the destruction of the coastal areas
through human actions are also increasing. Thus
through this technology, they should also include a
civic component which responsible authorities
would do awareness on the need to look after the
beaches and not to destroy them as we face the
reality of climate change across the region and
particularly this the country.

Nauru TNA Report
88
2.3 Technology
Characteristics/ Highlights:
Few bullet points, i.e. low/high
cost; advance technology; low
technology.
High cost (potentially high initial cost)
Low technology ( requires cements,
concretes,etc )
Hard Technology
2.4 Institutional and Organizational
Requirement :
The CIE together with Department of Lands &
Management will provide the Institutional and
organizational support to the formulation and
implementation of this project.
3.0 Operations and maintenance
3.1 Endorsement by Experts:
To increase community resilience and prevent
coastal erosion, the use of sea wall structures and
refurbishment of coast line areas at selected
vulnerable sites across the island is important. This
would ensure continuity of business along the
coastal areas even during strong winds, storm surges
and catastrophic events. Coastal communities would
felt protected against the exposure and vulnerability
that climate change and extreme storm events
brought if there is no wall build at these identified
sites. Business houses would concentrate on
business operations and not have to worry about
their homes been carried away in the next few years.
3.2 Adequacy for current climate:
Are there negative consequences of
the adaptation option in the current
climate? Some adaptation may be
targeted at the future climate but
may have costs and consequences
under the current climate.
Fits well for both the current and future expected
climate change across the Island. Since the forecasts
are predicting future SLR with increasing intensity
and frequency of storm surges which may cause
further coastal erosion and washing away of
beaches, such sea wall constructions at identified
vulnerable locations around the island would be
beneficial to the communities at large.
3.3 Size of beneficiaries group:
Technology that provides small
benefits to larger number of people
will often be favored over those
that provide larger benefits, but to
fewer people.
Beneficiaries include the household sectors,
business houses, government departments, schools,
health and private sectors. The sea wall structure
build would ensure the general community at large
is protected. There will be no individual or group of
people who would be primary beneficiaries of such
developments. While homes located at the
identified locations may directly benefit from such
undertakings, the positive externalities to the
community at large is immeasurable. The benefits
are distributed and shared among almost everyone
on the Islands.
4. Costs
4.1 Cost to implement adaptation
options :
Initial cost includes the cost of the sea wall structure,
cost of design, cost of EIA, cost of V&A reports and
beach replenishment or nourishment.

Nauru TNA Report
89
Cost measures
The CIE although over sees the environment
management in the country, it does not have the
capacity to provide some of the costs as mentioned
above. Therefore the technology would requires the
following costs to fully implement this adaptation
option:
The cost of Sea wall structures USD4.5
Additional costs (V&A, EIA, Design, & beach
nourishment) 1.5
Total cost = USD6.0m
4.2 Additional costs to implement
adaptation option, compared to
“business as usual”
The additional costs which may be required to
implement this technology includes cost for beach
nourishment and replanting of trees to ensure long
term resilience is achieved at these coastal areas.
The cost is factored into the initial costs above.
5.0 Benefits
5.1 Development impact, indirect
/benefits
The new initiative would reduce coastal erosion and
bring confidence in the communities along the coast
lines areas that their properties are safe and can
continue with development initiatives at these sites.
Below would likely be some of the major benefits
on the communities.
Safety and security of the community alone
the coast lines: it is the primary motivator for
the implementation this sea wall structure,
meaning more households/ public depends
on the secure and safer environment from
coastal erosion.
Contributing to food security by households
participating in backyard gardening since
they now have access to safer land growing
some of their basic crops supplementing
their budgets.
There wouldn’t be disruptions on major
infrastructures such as roads, electricity and
perhaps water when it is reticulated.
More funding will spend on economic
development by the government rather than
just building a seawall or barriers which
would be seen uneconomical to this cash
trapped nation.
5.2 Economic benefits :
Employment –Jobs
Investment – Capital requirements
Construction of the sea wall around the Island would
create tens of jobs to Nauruan for the next 12 to 16
months.
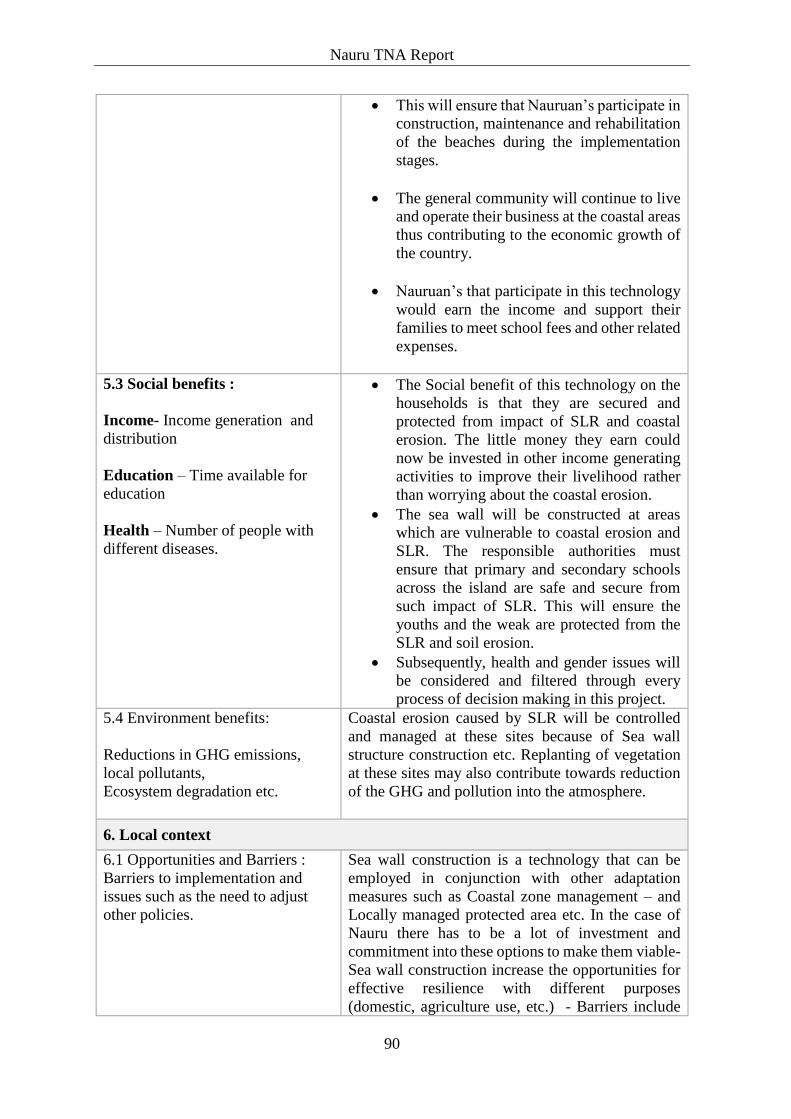
Nauru TNA Report
90
This will ensure that Nauruan’s participate in
construction, maintenance and rehabilitation
of the beaches during the implementation
stages.
The general community will continue to live
and operate their business at the coastal areas
thus contributing to the economic growth of
the country.
Nauruan’s that participate in this technology
would earn the income and support their
families to meet school fees and other related
expenses.
5.3 Social benefits :
Income- Income generation and
distribution
Education – Time available for
education
Health – Number of people with
different diseases.
The Social benefit of this technology on the
households is that they are secured and
protected from impact of SLR and coastal
erosion. The little money they earn could
now be invested in other income generating
activities to improve their livelihood rather
than worrying about the coastal erosion.
The sea wall will be constructed at areas
which are vulnerable to coastal erosion and
SLR. The responsible authorities must
ensure that primary and secondary schools
across the island are safe and secure from
such impact of SLR. This will ensure the
youths and the weak are protected from the
SLR and soil erosion.
Subsequently, health and gender issues will
be considered and filtered through every
process of decision making in this project.
5.4 Environment benefits:
Reductions in GHG emissions,
local pollutants,
Ecosystem degradation etc.
Coastal erosion caused by SLR will be controlled
and managed at these sites because of Sea wall
structure construction etc. Replanting of vegetation
at these sites may also contribute towards reduction
of the GHG and pollution into the atmosphere.
6. Local context
6.1 Opportunities and Barriers :
Barriers to implementation and
issues such as the need to adjust
other policies.
Sea wall construction is a technology that can be
employed in conjunction with other adaptation
measures such as Coastal zone management – and
Locally managed protected area etc. In the case of
Nauru there has to be a lot of investment and
commitment into these options to make them viable-
Sea wall construction increase the opportunities for
effective resilience with different purposes
(domestic, agriculture use, etc.) - Barriers include

Nauru TNA Report
91
lack of access to finance for purchasing of these
structures and awareness by communities etc. - A
higher amount of initial investment may involve
compare to other adaptations options. - Technical
requirements such as V&A, EIA and structural
design may increase implementation and
maintenance costs. – Although sea wall structural
construction may be costly and expensive, it is
cheaper on the longer run. - A low level of public
awareness is critical to support the technology.
6.2 Status:
Status of technology in the country
Certain communities have already constructed some
structures of sea wall around the Island. However,
the rate of soil erosion is worrisome and thus calls
for prioritizing of this technology at selected
vulnerable sites across the Island. Timeframe is
continuous.
6.3 Timeframe :
Specify timeframe for
implementation
Life time
6.4 Acceptability to local
stakeholders :
Where the technology will be
attractive to stakeholders
Yes
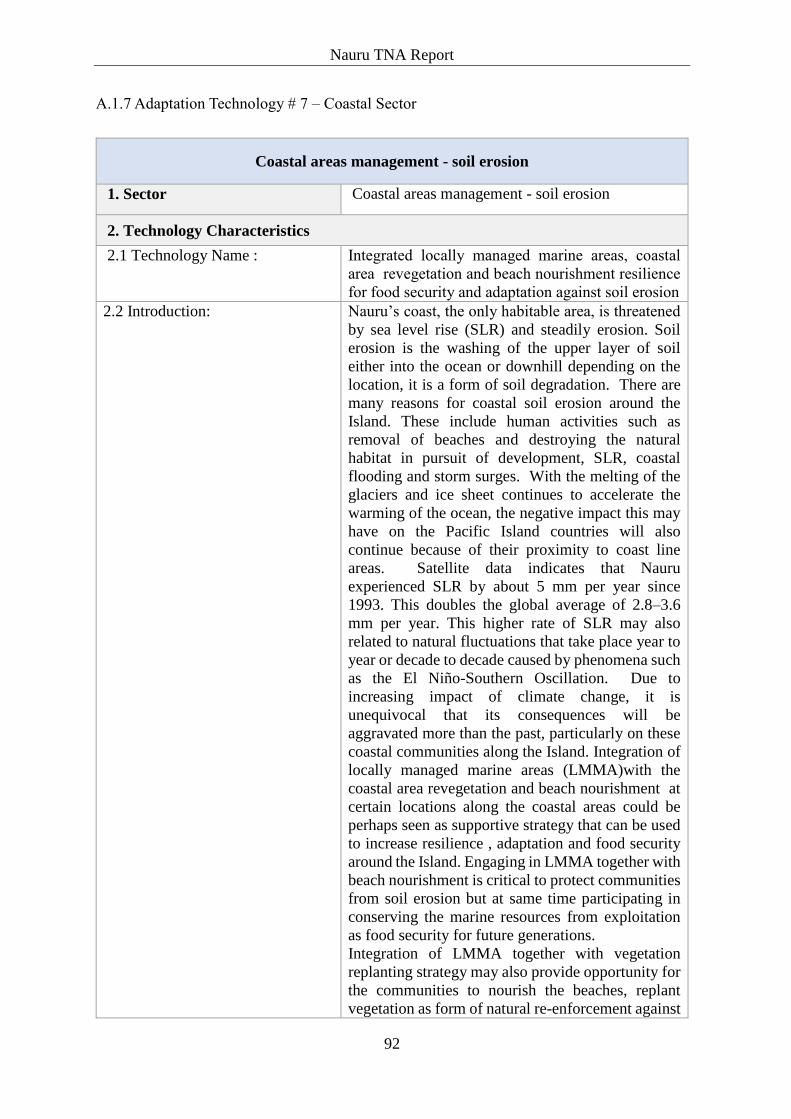
Nauru TNA Report
92
A.1.7 Adaptation Technology # 7 – Coastal Sector
Coastal areas management - soil erosion
1. Sector Coastal areas management - soil erosion
2. Technology Characteristics
2.1 Technology Name :
Integrated locally managed marine areas, coastal
area revegetation and beach nourishment resilience
for food security and adaptation against soil erosion
2.2 Introduction:
Nauru’s coast, the only habitable area, is threatened
by sea level rise (SLR) and steadily erosion. Soil
erosion is the washing of the upper layer of soil
either into the ocean or downhill depending on the
location, it is a form of soil degradation. There are
many reasons for coastal soil erosion around the
Island. These include human activities such as
removal of beaches and destroying the natural
habitat in pursuit of development, SLR, coastal
flooding and storm surges. With the melting of the
glaciers and ice sheet continues to accelerate the
warming of the ocean, the negative impact this may
have on the Pacific Island countries will also
continue because of their proximity to coast line
areas. Satellite data indicates that Nauru
experienced SLR by about 5 mm per year since
1993. This doubles the global average of 2.8–3.6
mm per year. This higher rate of SLR may also
related to natural fluctuations that take place year to
year or decade to decade caused by phenomena such
as the El Niño-Southern Oscillation. Due to
increasing impact of climate change, it is
unequivocal that its consequences will be
aggravated more than the past, particularly on these
coastal communities along the Island. Integration of
locally managed marine areas (LMMA)with the
coastal area revegetation and beach nourishment at
certain locations along the coastal areas could be
perhaps seen as supportive strategy that can be used
to increase resilience , adaptation and food security
around the Island. Engaging in LMMA together with
beach nourishment is critical to protect communities
from soil erosion but at same time participating in
conserving the marine resources from exploitation
as food security for future generations.
Integration of LMMA together with vegetation
replanting strategy may also provide opportunity for
the communities to nourish the beaches, replant
vegetation as form of natural re-enforcement against

Nauru TNA Report
93
coastal erosion and SLR. Working together with
Department of Commerce, Industry and
Environment (CIE) and the Department of Fisheries
and Marine resources (FMR), the participating
communities would identify the coastal areas which
are in urgent need to restore their beaches from
coastal erosion and at the same protecting the sea
boundary from fishing and over harvesting.
The population on the Island is more than 12,000
people and the destruction of the coastal areas
through human actions are also accelerating. This
calls for civic awareness on this integration approach
to be inserted as part of this technology – i.e. ensure
awareness of general public on the need to look after
the beaches including designated LMMAs and as
food security for future generations.
2.3 Technology Characteristics/
Highlights:
Few bullet points, i.e. low/high
cost; advance technology; low
technology.
medium cost (potentially high but medium
initial cost)
Low technology ( requires landfills on
beaches and revegetation )
Soft and Hard Technology
Soft technology includes the policies
surrounding LLMA
2.4 Institutional and Organizational
Requirement :
There needs to be soft technology- Regulation about
the LMMA and coastal area removal of beaches
The responsible authorities includes: CIE , MFR and
respective communities
3.0 Operations and maintenance
3.1 Endorsement by Experts:
To increase community resilience and prevent
coastal erosion, replanting of vegetation
refurbishment of coastal areas and establishment of
LMMAs at selected vulnerable sites across the
island is important. This would ensure integrated
strategies against soil erosion and marine resource
management. It further ensure continuity of business
along the coastal areas even during strong winds,
storm surges and catastrophic events and also food
security at these locally managed marine areas.
Coastal communities would felt protected against
the exposure and vulnerability that climate change
and extreme storm events brought if there is no
buffer of vegetation and natural beaches at these
identified sites. Both private and business houses
would concentrate on their normal day to day
operations and not have to worry about their homes
and businesses been carried away in the next disaster
events, and at the same time conservation of marine
resources for future uses.
3.2 Adequacy for current climate:
Fits well for both the current and future expected
climate change across the Island. Since the forecasts
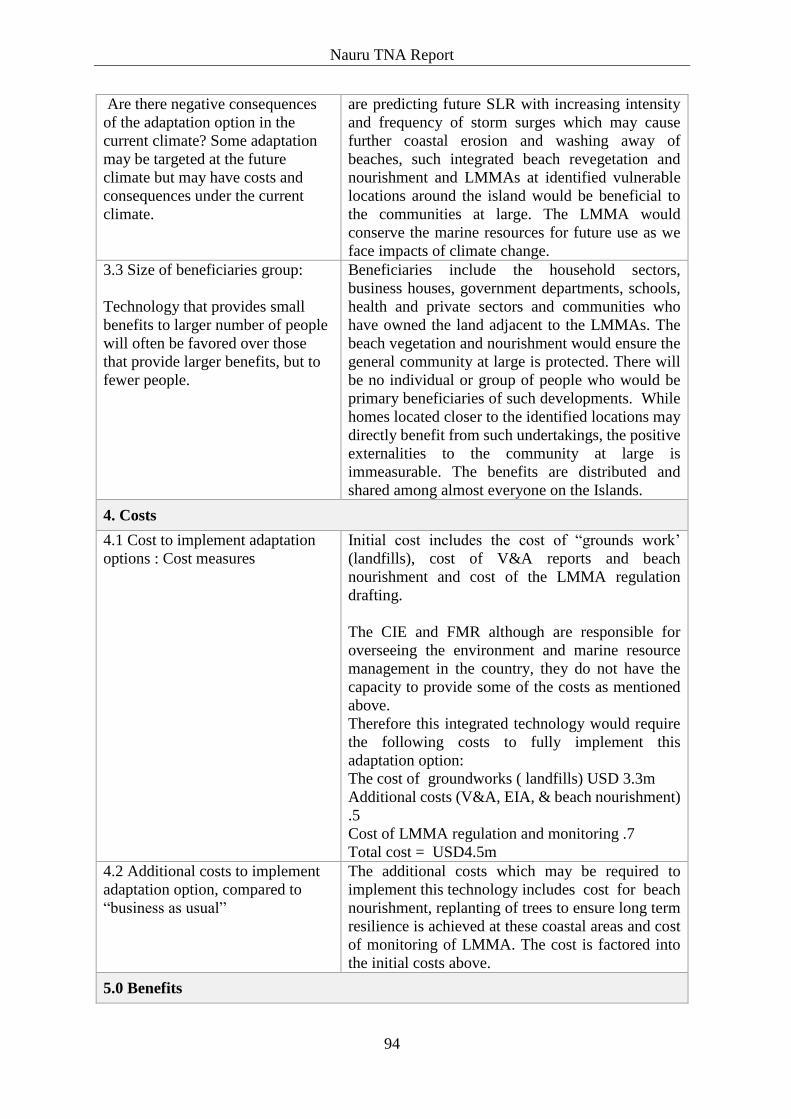
Nauru TNA Report
94
Are there negative consequences
of the adaptation option in the
current climate? Some adaptation
may be targeted at the future
climate but may have costs and
consequences under the current
climate.
are predicting future SLR with increasing intensity
and frequency of storm surges which may cause
further coastal erosion and washing away of
beaches, such integrated beach revegetation and
nourishment and LMMAs at identified vulnerable
locations around the island would be beneficial to
the communities at large. The LMMA would
conserve the marine resources for future use as we
face impacts of climate change.
3.3 Size of beneficiaries group:
Technology that provides small
benefits to larger number of people
will often be favored over those
that provide larger benefits, but to
fewer people.
Beneficiaries include the household sectors,
business houses, government departments, schools,
health and private sectors and communities who
have owned the land adjacent to the LMMAs. The
beach vegetation and nourishment would ensure the
general community at large is protected. There will
be no individual or group of people who would be
primary beneficiaries of such developments. While
homes located closer to the identified locations may
directly benefit from such undertakings, the positive
externalities to the community at large is
immeasurable. The benefits are distributed and
shared among almost everyone on the Islands.
4. Costs
4.1 Cost to implement adaptation
options : Cost measures
Initial cost includes the cost of “grounds work’
(landfills), cost of V&A reports and beach
nourishment and cost of the LMMA regulation
drafting.
The CIE and FMR although are responsible for
overseeing the environment and marine resource
management in the country, they do not have the
capacity to provide some of the costs as mentioned
above.
Therefore this integrated technology would require
the following costs to fully implement this
adaptation option:
The cost of groundworks ( landfills) USD 3.3m
Additional costs (V&A, EIA, & beach nourishment)
.5
Cost of LMMA regulation and monitoring .7
Total cost = USD4.5m
4.2 Additional costs to implement
adaptation option, compared to
“business as usual”
The additional costs which may be required to
implement this technology includes cost for beach
nourishment, replanting of trees to ensure long term
resilience is achieved at these coastal areas and cost
of monitoring of LMMA. The cost is factored into
the initial costs above.
5.0 Benefits

Nauru TNA Report
95
5.1 Development impact, indirect
/benefits
The new integrated LMMA and coastal area
revegetation and beach nourishment would reduce
coastal erosion and bring confidence in the
communities along the coastal areas that their
properties are safe and can continue with
development initiatives at these sites. At the same
time provide food security and conservation of
marine resources.
Below are likely be some of the major benefits on
the communities from the technology.
Safety and food security of the community
alone the coast lines: it is the primary
motivator for the implementation the beach
vegetation replenishment and nourishment,
meaning more households/ public depends
on the secure and safer environment from
coastal erosion.
Contributing to food security by households
participating in backyard gardening since
they now have access to safer land, growing
some of their basic crops supplementing
their budgets. Reallocate funding to spend on
other economic development by the
government rather than just building a
seawall or barriers which would be seen
uneconomical to this cash trapped nation.
The marine resources and environment are
also protected with the inclusion of LMMA
into this integrated approach of conservation
around the Island. This investing in resources
for future generations.
5.2 Economic benefits :
Employment –Jobs
Investment – Capital requirements
Investment into coastal area vegetation and
replenishment around the Island would create tens
and hundreds of jobs to Nauruan for the next 12 to
24 months.
This will ensure that Nauruan’s participate in
landfilling, soil nourishment, rehabilitation
of the beaches and monitoring and
surveillance over LMMA during the
implementation and monitoring stages of the
technology.
The general community will continue to live
and operate their business at the coastal areas
thus contributing to the economic growth of
the country.
Nauruan’s that participate in this technology
would earn the income and support their
families to meet school fees and other
livelihood expenses.
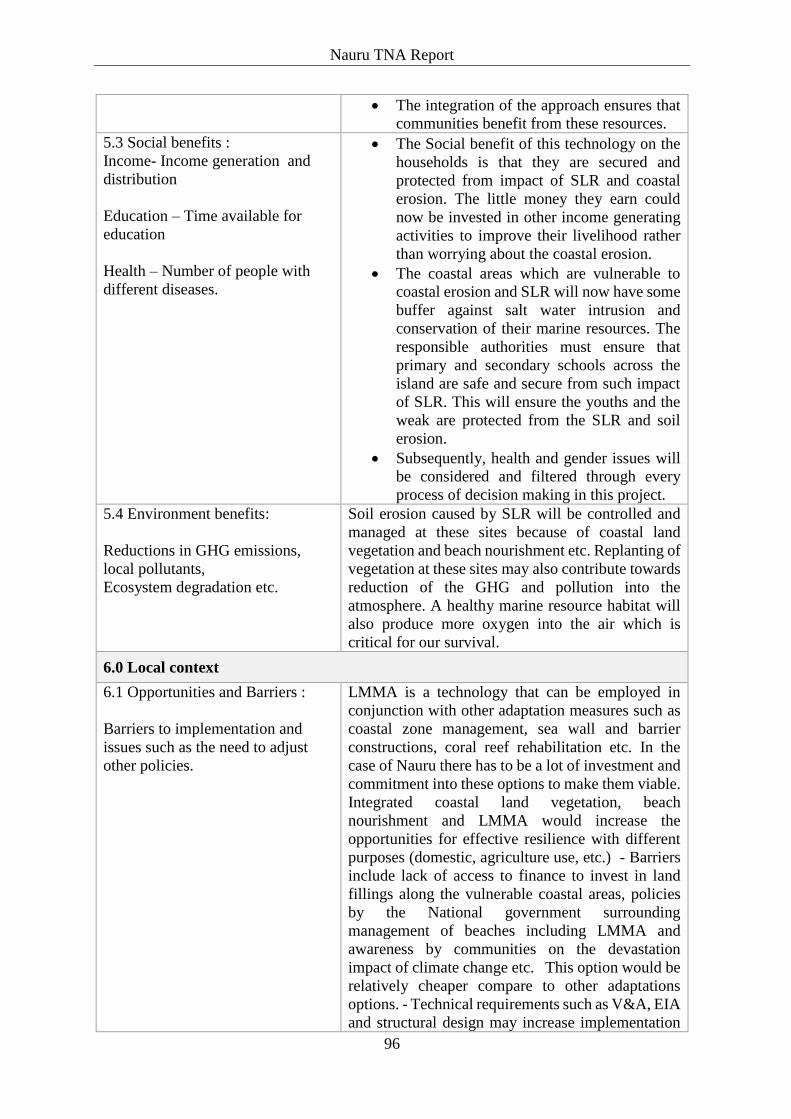
Nauru TNA Report
96
The integration of the approach ensures that
communities benefit from these resources.
5.3 Social benefits :
Income- Income generation and
distribution
Education – Time available for
education
Health – Number of people with
different diseases.
The Social benefit of this technology on the
households is that they are secured and
protected from impact of SLR and coastal
erosion. The little money they earn could
now be invested in other income generating
activities to improve their livelihood rather
than worrying about the coastal erosion.
The coastal areas which are vulnerable to
coastal erosion and SLR will now have some
buffer against salt water intrusion and
conservation of their marine resources. The
responsible authorities must ensure that
primary and secondary schools across the
island are safe and secure from such impact
of SLR. This will ensure the youths and the
weak are protected from the SLR and soil
erosion.
Subsequently, health and gender issues will
be considered and filtered through every
process of decision making in this project.
5.4 Environment benefits:
Reductions in GHG emissions,
local pollutants,
Ecosystem degradation etc.
Soil erosion caused by SLR will be controlled and
managed at these sites because of coastal land
vegetation and beach nourishment etc. Replanting of
vegetation at these sites may also contribute towards
reduction of the GHG and pollution into the
atmosphere. A healthy marine resource habitat will
also produce more oxygen into the air which is
critical for our survival.
6.0 Local context
6.1 Opportunities and Barriers :
Barriers to implementation and
issues such as the need to adjust
other policies.
LMMA is a technology that can be employed in
conjunction with other adaptation measures such as
coastal zone management, sea wall and barrier
constructions, coral reef rehabilitation etc. In the
case of Nauru there has to be a lot of investment and
commitment into these options to make them viable.
Integrated coastal land vegetation, beach
nourishment and LMMA would increase the
opportunities for effective resilience with different
purposes (domestic, agriculture use, etc.) - Barriers
include lack of access to finance to invest in land
fillings along the vulnerable coastal areas, policies
by the National government surrounding
management of beaches including LMMA and
awareness by communities on the devastation
impact of climate change etc. This option would be
relatively cheaper compare to other adaptations
options. - Technical requirements such as V&A, EIA
and structural design may increase implementation
Nauru TNA Report
97
and maintenance costs. Although coastal land
vegetation and beach nourishment may be accrue
some initial costs, it is cheaper on the longer run. -
A low level of public awareness is critical to support
the technology.
6.2 Status:
Status of technology in the country
Certain communities have already participated in
programs design to protect coastal soil erosion
around the Island. However, the rate of soil erosion
is worrisome and thus calls for prioritizing of this
technology at selected vulnerable sites across the
Island. LMMA will be the drivers to protect the
coastal areas from erosion. Timeframe is
continuous.
6.3 Timeframe :
Specify timeframe for
implementation
Life time
6.4 Acceptability to local
stakeholders :
Where the technology will be
attractive to stakeholders
Yes

Nauru TNA Report
98
Annex 2: Technology Fact Sheets for Mitigation
A.2.1 Mitigation Technology # 1 – Energy Sector
Pumped hydroelectric storage (PHES) system
1.0 Sector Energy
2.0 Technology Characteristics
2.1 Technology Name : Pumped hydroelectric storage (PHES) system
2.2 Introduction:
Pumped hydro is the most developed energy storage
technology, with facilities dating from the 1890s in
Italy and Switzerland. Currently, there is over 90
GW of pumped storage capacity in operation
worldwide, which is about 3% of global generation
capacity. The main applications of pumped hydro
are for energy management, frequency control and
provision of reserves. Pumped storage plants are
characterized by long construction times and high
capital expenditure. However, with rising electricity
prices and increasing use of intermittent energy
sources, it can be very economic to store electricity
for later use8.
The advantages that a PHES system has over battery
storage is that the pumped hydro installation is
generally less expensive and expected to have a
lifespan of over 50 years, whereas battery modules
are limited in their lifespan to around 10 years.
2.3 Brief Technology Description
PHES is a technology that would use the surplus
power from a renewable source to pump water from
a lower reservoir to a second reservoir on top of the
hill. This creates the potential energy that can be
released when needed through letting the water
flow from the upper reservoir through a
conventional hydro turbine at sea level which
generates power into the grid.
The majority of modern pumped storage
hydropower projects use reversible pump/turbine
units that act as both a pump and a turbine. See
Figure 1.
3.0 Cost
3.1 Capital cost
Looking purely at capital costs for longer term,
pumped hydro has lower capital costs due to the
8 http://climatetechwiki.org/category/energy-services/electricity?page=1

Nauru TNA Report
99
lower storage costs while for shorter periods
batteries are lower due to the lower power costs9.
Capital cost of PHES is around USD17,700/ kW10.
3.2 Operations and maintenance
While initial capital costs are high for pumped
storage hydropower projects, they typically have
long project lives of up to 100 years and low
operation and maintenance costs. Similar to initial
capital costs, operation and maintenance costs can be
highly site specific, and depend on a number of
factors11.
4.0 Application Potential in Nauru
4.1 Energy Storage By 2022, Nauru will have reached its 50%
renewable energy goal which will be produced by
approximately 8MWac of grid-connected solar PV
with 5MW/ 2.5MWh of battery storage. However,
the risk with exceeding 50% renewable penetration
is that the Levelised Cost of Energy (LCOE) of the
generated power will increase. At some level of solar
penetration, it will become more expensive to
generate power through solar and battery than it will
to generate power through diesel generators as
battery stored power is significantly more expensive
than solar power or diesel generation.
4.2 Feasibility Nauru enjoys some fortunate pump storage
advantages. Command Ridge is 70m above sea level
and already has the facility to store a capacity of
1,200 m³. The site has seawater concrete tanks each
with a storage capacity of 400 m³ and have a
relatively short pipeline distance to the sea. Seawater
is the assumed medium due to the scarcity of bulk
water on the island.
5.0 Gender Aspects
5.1 Employment Opportunity for women technicians in the field
electrical, mechanical and civil engineering.
6.0 Impacts/ Benefits
6.1 Mitigation:
There is a big necessity of mitigating global
warming, and reducing the burning of fossil fuels is
the major mean to achieve this final goal. This
burning of fossil fuels may only be reduced if some
9 https://arena.gov.au/assets/2018/10/ANU-STORES-STORES-Storage-Comparison-.pdf
10 MFAT GHD. Nauru Pumped Hydroelectric Energy Storage Pre-feasibility Study – Final Report. Nov. 2019
11 Antal. B . A., 2014. Pumped Storage Hydropower: A Technical Review. MSc. University of Colorado, Denver.

Nauru TNA Report
100
kind of energy exists to replace it. The option of
renewable energy is a very popular one, but in order
to be competitive and available at all time, it needs
to be stored. Pumped-storage is therefore a piece of
high importance in the puzzle of the mitigation of the
global warming.
6.2 Social:
Social benefits may include:
Standard of living;
Education;
Community;
Equal Opportunity.
6.3 Economics:
Refurbishment of the three existing concrete
seawater tanks at Command Ridges requires no
initial investment apart from building new layers
within the tanks and installing new pipelines.
Pumped storage hydropower projects are a net
consumer of electricity. During periods of the day
when there is excess low cost energy generated from
solar, this energy is used to pump water from the
lower reservoir to the upper reservoir. During high
value peak power or sudden drop in solar generation,
water from the upper reservoir is released back down
to the lower reservoir, via the turbine to provide
energy.
Economic benefits may include:
Profit Cost Savings;
Economic growth;
Research and Development.
6.4 Environmental: Although overseas PHES systems causes destruction
of their soil’s physical and chemical characteristics,
and therefore with higher risks of erosion and soil
contamination, the existing top reservoirs on Nauru
are built with concrete foundations and walls.
Environmental benefits may include:
Natural resources use (seawater);
Environmental Management (soil erosion
and contamination;
Pollution Prevention (no GHG emission).
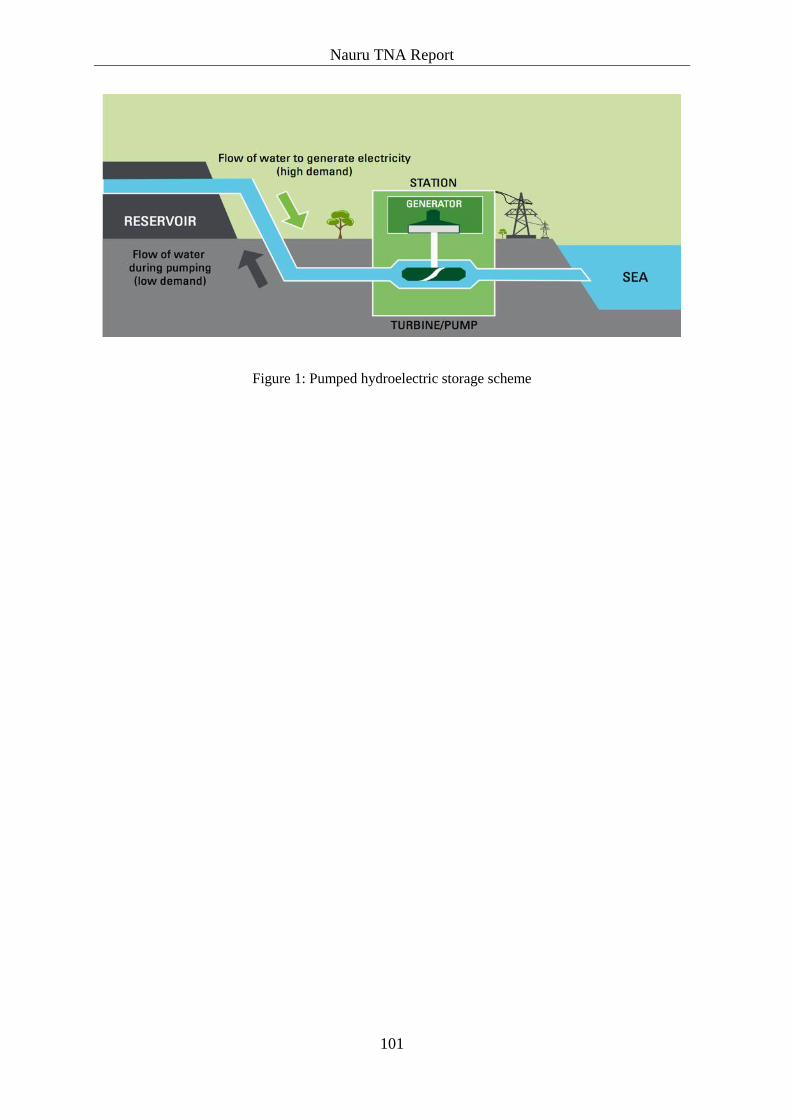
Nauru TNA Report
101
Figure 1: Pumped hydroelectric storage scheme

Nauru TNA Report
102
A.2.2 Mitigation Technology # 2 – Energy Sector
Small-scale Biogas Digester
1.0 Sector Energy
2.0 Technology Characteristics
2.1 Technology Name : Small-scale Biogas Digester
2.2 Introduction:
The first digestion plant was built at a leper colony
in Bombay, India in 1859. AD reached England in
1895 when biogas was recovered from a "carefully
designed" sewage treatment facility and used to
fuel street lamps in Exeter.12
Biogas digester is any structure that converts
organic material (waste) into energy in the absence
of oxygen.
• Various materials and geometric configuration
have been used for the design of biogas digester
system.
• Examples of the geometric configuration are
horizontal, spherical, cylindrical and dome shape
• Examples of common materials used are brick,
cements, fiber glass for the dome shape and metal
(stainless steel and mild steel).
• Biogas is a good source of renewable energy,
composing of 50-70% of methane and 30-50% of
carbon dioxide with other traces of gases.
2.3 Brief Technology Description Biogas is the mixture of gases produced by the
breakdown of organic matter in the absence of
oxygen. Biogas can be produced from raw materials
such as agricultural waste, manure, municipal waste,
plant material, sewage, green waste or food waste.
Biogas is a renewable energy source.
Biogas is produced by anaerobic digestion with
methanogen or anaerobic organisms, which digest
material inside a closed system, or fermentation of
biodegradable materials. This closed system is
called an anaerobic digester, biodigester or a
bioreactor.
Biogas is primarily methane (CH4) and carbon
dioxide (CO2) and may have small amounts of
hydrogen sulfide (H2S), moisture and siloxanes. The
gases methane, hydrogen, and carbon monoxide
(CO) can be combusted or oxidized with oxygen.
12 https://extension.psu.edu/a-short-history-of-anaerobic-digestion
Nauru TNA Report
103
This energy release allows biogas to be used as a
fuel; it can be used for any heating purpose, such as
cooking. It can also be used in a gas engine to
convert the energy in the gas into electricity and
heat.
Biogas is primarily methane (CH4) and carbon
dioxide (CO2) and may have small amounts of
hydrogen sulfide (H2S), moisture and siloxanes. The
gases methane, hydrogen, and carbon monoxide
(CO) can be combusted or oxidized with oxygen.
This energy release allows biogas to be used as a
fuel; it can be used for any heating purpose, such as
cooking. It can also be used in a gas engine to
convert the energy in the gas into electricity and
heat.13
3.0 Cost
3.1 Capital cost
The capital cost of a 1 m³ compact biogas plant is
US$ 500. This unit will generate equivalent of
182.5 kg of LPG. = 8413.25 MJ = 8413.25 x 4.18
Mcal = 35167.385 Mcal = 3.5167 toe.
Hence the capital cost required to generate 1 toe =
500/3.5167 = USD 142.18/toe/y.
The capital costs for a digester-generator with a
capacity of about 100-kW would be about
USD450,000 (USD4,500/kW) (without NOx
controls), exclusive of land costs.14
3.2 Operations and maintenance
Minimal cost. If operated and maintained properly,
this technology can have a life-span of at least 20
years.
4.0 Application Potential in Nauru
4.1 Feasibility Although there is no record of any installed or
operable biogas digesters on island nor any
feasibility studies, there is a great interest from
stakeholders to include this technology amongst
other renewable energy technologies for further
analysis.
Although not favorable to be fueled by toilet run-
offs, it is favored more to be fueled by kitchen waste,
pig manure and garden clippings.
5.0 Gender Aspects
5.1 Potential Impact Yes
6.0 Benefits
13 https://en.wikipedia.org/wiki/Biogas#Biogas_plants
14 http://www.suscon.org/pdfs/cowpower/biomethaneSourcebook/Chapter_8.pdf

Nauru TNA Report
104
6.1 Mitigation:
The 1 m³ biogas unit introduced through this
technology is capable of generating biogas which is
equivalent to 0.5 kg of LPG per day. On a yearly
basis this would replace182.5 kg of LPG with a
calorific value of 46.1 MJ/kg. The emission factor
for LPG is 63.1 tCO2/TJ. Hence each biogas unit
introduced with this technology would reduce
emission by 0.530 tCO2/y. On a national basis, in
the short term of say 1,000 households in the
country, if 10% of the households resort to this
technology, the emission reduction would be 0.530
x 100 = 53 tCO2/y.
6.2 Social: Employment opportunities for the supply
and installation of biogas digesters.
Skill and capacity development.
6.3 Economics:
Reduction in cost of fuel used for cooking by
switching from expensive LPG to cheap
biomass feed materials.
Biogas provides a potential needs to provide
sustainable, affordable and reliable energy
sources for domestic cooking.
6.4 Environmental: A reduction in emission by 0.53 tCO2/y for
every 1 m³ of biogas digester installed.
Reduced environmental problems associated
with pig waste disposal;
Increased agriculture production.
Biogas digester
Figures 1 & 2: Biogas digesters can be built and buried in the ground or used on ground surface.
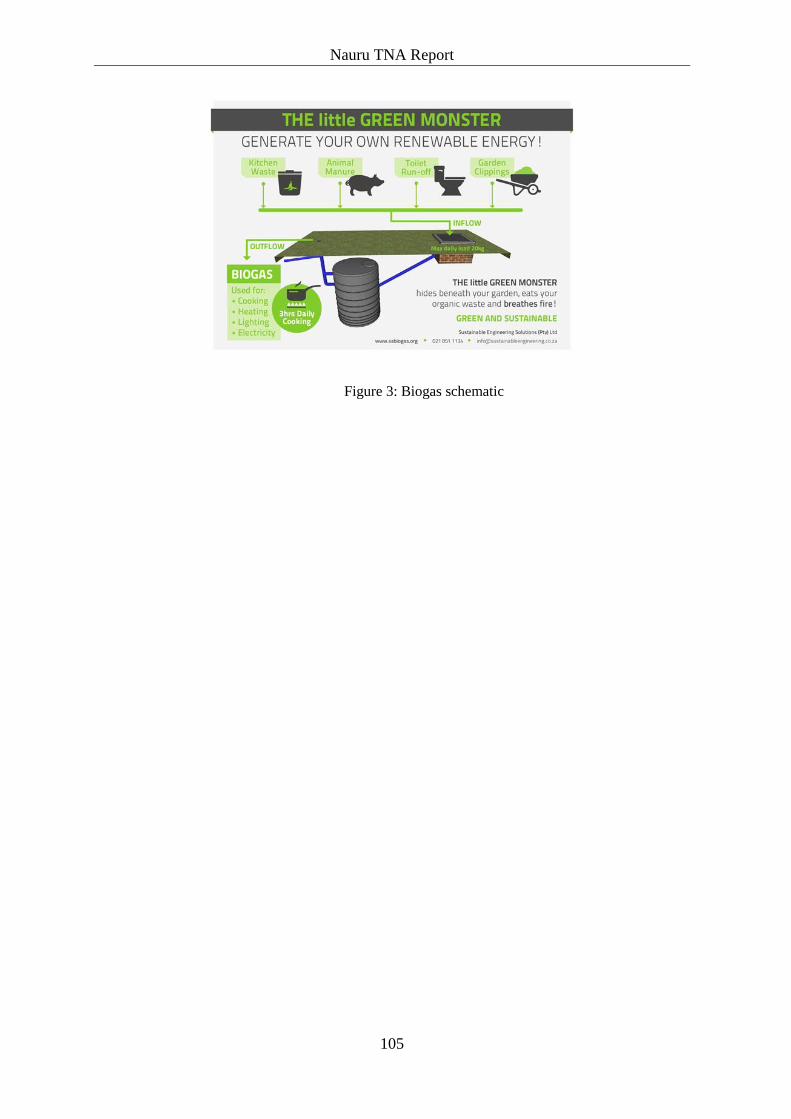
Nauru TNA Report
105
Figure 3: Biogas schematic

Nauru TNA Report
106
A.2.3 Mitigation Technology # 3 – Energy Sector
OTEC plant
1.0 Sector Energy
2.0 Technology Characteristics
2.1 Technology Name :
OTEC (Ocean Thermal Energy Conversion)
2.2 Introduction
In 1870, Jules Verne introduced the concept of
ocean thermal energy conversion (OTEC) in
Twenty Thousand Leagues Under the Sea. Within
a decade, American, French and Italian scientists
are said to have been working on the concept but
the Frenchman, physicist Jacques-Arsene
d’Arsonval, is generally credited as the father of
the concept for using ocean temperature differences
to create power.
D’Arsonval’s student, Georges Claude, built the
first OTEC power plant in 1930 in Cuba, which
produced 22 kilowatts of electricity. This led to an
on-shore open cycle plant, with a pipe extending
out to sea. Despite initial problems, power was
generated.15
French research continued in earnest through the
1940s and into the 1950s. Research also began in
California in the 1940s. In all cases, work was
slowed or halted by cheaper alternatives to power
generation.
OTEC is a proven technology that produces clean
baseload (24/7) electricity using the temperature
differential (>20⁰C) between warm surface water
and cold deep water in the world’s tropical oceans.
OTEC can also be used for ocean water
desalination. The dominant natural desalination is
the evaporation/condensation distillation process.
The theoretical energy requirement for making 1
cubic meter of fresh water from ocean water is 1
kwh (3,6 MJ). Even though reverse osmosis is able
to get 1 cubic meter of fresh water from ocean
water at 3 kwh energy. The energy need to be in the
form of electrical energy or some mechanical form.
A better desalination procedure using the ocean is
to use ocean thermal energy directly. The warm
ocean surface water can provide the thermal energy
to generate water vapor at the evaporator. The
15 http://www.oteci.com/otec-at-work/test-page/

Nauru TNA Report
107
cooler deep ocean water can condense the vapor
into water. The energy required to move the heating
and cooling ocean water through the heat
exchangers can be much less than the theoretical
energy requirement of 1 kwh for each cubic meter.
Ocean thermal energy can easily provide 40 MJ of
thermal energy to get 1 cubic meter of fresh water.
The cost of desalinate ocean watercan be less than
10 cents for each cubic meter.16
2.3 Brief Technology Description
The warm seawater is used to produce a vapour that
acts as a working fluid to drive turbines. The cold
water is used to condense the vapour and ensure the
vapour pressure difference drives the turbine. OTEC
technologies are differentiated by the working fluids
that can be used. Open Cycle OTEC uses seawater
as the working fluid, Closed Cycle OTEC uses
mostly ammonia. A variation of a Closed Cycle
OTEC, called the Kalina Cycle, uses a mixture of
water and ammonia. The use of ammonia as a
working fluid reduces the size of the turbines and
heat exchangers required.
2.4 CO2 Emission Comparison The amount of CO2 released from electricity-
producing plants (expressed in gr of CO2 per kWh)
ranges from 1000 for coal fired plants, to 700 for
fuel-oil plants, while for OTEC plants it is at most ∼
1 % of the amount released by fuel oil plants.
3.0 Cost
3.1 Capital cost
The cost of a proposed 50 megawatt (MW, net
power) OTEC plant is approximately 75 million
dollars. The Moody graph can be used to support the
design of smaller scale 7 MW or 140 KW models at
cost of 20 and 2 million dollars or USD3,000/kW (7
MW plant) to approximately USD14,000/kW (140
kW plant). Note a smaller scale OTEC plant has very
high capital cost.
4.0 Application Potential in Nauru
4.1 Background Nauru relies greatly on fossil fuel for electricity
generation and potable water production. Electricity
is generated by medium-speed diesel generators and
since 1995, potable water was produced by a 1.2
ML/ day multiple-effect distillation (MED)
desalination plant. This cost-effective desalination
plant operated from steam that was produced by
waste-heat boilers that were coupled to the diesel
generator exhaust system. A minimum of 4MW of
16 https://www.climatecolab.org/contests/2015/harnessing-the-power-of-mit-alumni/c/proposal/1325332
Nauru TNA Report
108
electrical power generation was needed to
effectively operate the desalination plant. However,
during the economic downturn in 2005, GoN was
barely able to supply diesel fuel to generate
sufficient electrical power for the island. The
desalination plant on the other hand could not be
maintained nor operated due to the low generating
capacity of the generators.
Since 2003, reverse-osmosis technology was
introduced to produce water. The capital, operating
and maintenance cost of RO plants are quite
substantial compared to MED plants.
With the very rapid increase in depth that occurs
beyond the reef, there is an opportunity for OTEC
energy development on Nauru.
OTEC technology utilizes the temperature
difference between the warm ocean surface water
and the deep cold ocean water at depth between 600-
1,000 meters to generate electricity.
Tropical waters, defined as extending from the
equatorial region boundary to, respectively, 20°N
and 20°S, are adequate.
4.2 OTEC Demonstration Plant The government of the Republic of Nauru along with
engineers of the Tokyo Electric Power Co. and the
Toshiba Corporation constructed a closed-cycle
OTEC plant at a site on the island of Nauru in 1980.
The Nauru Island is a high coral reef surrounded by
a lagoon of 50-150m wide. Where the plant is
located, the seabed is irregular up to 50 m deep from
the coast and after that leans at an angle of 40-45
degrees up to 700 m deep. Although the seabed
become porous further from the coast, the bearing
capacity is sufficient for seabed emplacements. A
schematic of the Japanese Shore-Based OTEC is
shown below, demonstrating the depth of the CWP
to be about 670 m.
This plant was the first OTEC with power connected
to the utility grid. It was also the first OTEC located
on land that generated net power and hit a record in
total production of net power 31.5 kW, with a
corresponding gross power of 120 MW (Avery and
Wu, 1994). From this data, the total power
generation efficiency was calculated to be 31.5/120
= 26%.
5.0 Gender Aspects
6.0 Impacts/ Benefits

Nauru TNA Report
109
6.1 Mitigation:
OTEC systems directly contribute to climate change
mitigation by providing a completely renewable
energy source free of GHG emissions17.
6.2 Social:
Reduced cost of electricity and water.
Employment opportunities for plant operations and
maintenance.
6.3 Economics:
One of the main benefits of OTEC systems is that
they could potentially be used to provide baseload as
there is no intermittency associated with their
resource18.
OTEC systems produce electricity and fresh water as
well, which is highly beneficial for island regions
where fresh water availability is limited. It also helps
reduce the country’s dependence on imported fossil
fuel19.
(Reduce national expenditure on importation of
petroleum-based products.)
6.4 Environmental: OTEC makes use of renewable, clean, natural
resources. Fossil fuels are replaced by warm surface
seawater and cold water from deep sea to generate
electricity. OTEC plants do not pollute the
environment by releasing carbon dioxide emissions
or other polluting substances.
17 https://www.ctc-n.org/technologies/ocean-thermal-energy-conversion
18 https://www.ctc-n.org/technologies/ocean-thermal-energy-conversion
19 https://www.azocleantech.com/article.aspx?ArticleID=343s

Nauru TNA Report
110
Figure 1: Deployment procedure for the CWP installation for the Japanese Shore-Based OTEC on
the Island of Nauru (Avery and Wu, 1993, p. 292).

Nauru TNA Report
111
A.2.4 Mitigation Technology # 4 – Energy Sector
Household Grid-connected Rooftop Solar PV System
1.0 Sector Energy
2.0 Technology Characteristics
2.1 Technology Name :
Grid-connected Rooftop Solar PV System
2.2 Introduction: In 1839 Alexandre Edmond Becquerel discovered
the photovoltaic effect which explains how
electricity can be generated from sunlight. He
claimed that “shining light on an electrode
submerged in a conductive solution would create an
electric current.” However, even after much research
and development subsequent to the discovery,
photovoltaic power continued to be very inefficient.
People mainly used solar cells for the purpose of
measuring light. Over 100 years later, in 1941,
Russell Ohl invented the solar cell, shortly after the
invention of the transistor.20
Solar photovoltaic, or simply photovoltaic (SPV or
PV), refers to the technology of using solar cells to
convert solar radiation directly into electricity.
Solar energy is one of the cleanest sources of energy,
and it’s an extremely effective way of making your
household more efficient and sustainable. Solar
panels don’t use any water to generate electricity,
they don’t release harmful gases into the
environment, and the source of their energy is
abundant and, best of all, free.
2.3 Brief Technology Description
Grid interconnection of PV systems is accomplished
through the inverter, which convert dc power
generated from PV modules to ac power used for
ordinary power supply to electric equipment. See
Figure 1.
3.0 Cost
3.1 Capital cost
For the purpose of this fact sheet, the following
quotation for Nauru will be used that comprise of:
6 x Suntech 260W (1.56 kW) solar PV modules with
components for installation and grid connection.
Quote for this kit as provided in 2017 is
approximately USD2,956 which include cost of
freight to Nauru. Capital cost per kW is therefore
20 https://www.energymatters.com.au/panels-modules/

Nauru TNA Report
112
approximately USD1,800/ kW. Note installation
cost is not included.
3.2 Operation and maintenance Rooftop solar pv systems have very minimal cost to
operate and maintain. Panels are self-cleaned
whenever it rains.
4.0 Application Potential in Nauru
4.1 Feasibility Measurements show an average of over 6 kWhr/m2
/day (with solar panels tilted to the angle that
maximises energy input) with a seasonal variation of
around 10–15%. Although solar PV offers electricity
generation that can supplement the existing diesel
generation, the variable nature of solar energy will
require energy storage systems for it to be connected
to the grid at high levels of penetration. A dynamic
model has not yet confirmed the maximum possible
level of solar penetration before grid stability issues
occur, but it is likely to be limited to around 20–30%
of midday demand. Above this threshold, storage
and control systems will have to be introduced to
ensure grid stability. (Isaka, Mofor, & Wade, 2013)
5.0 Gender Aspects
5.1 Potential impact Yes
6.0 Benefits
6.1 Mitigation: Generating electricity from solar panels produce no
harmful emissions, and the more homes and
businesses that rely on solar power means less toxic
emissions from fossil fuels into our air.
6.2 Social: Reduced electricity bills.
Very minimal maintenance.
6.3 Economics: The chief factor that accentuates the importance of
rooftop solar panels is that they require very less
maintenance. They come with a service life of over
20 years if maintained properly.
Reduces electricity bills.
6.4 Environmental: Solar power systems derive clean, pure energy from
the sun. Installing solar panels on your home helps
combat greenhouse gas emissions and reduces our
collective dependence on fossil fuel.

Nauru TNA Report
113
Figure 1: Grid-tied solar PV system diagram
(Source: http://www.progenenergy.com/products/residential-solar/grid-connected-roof-top-systems)
Nauru TNA Report
114
A.2.5 Mitigation Technology # 5 – Waste Sector
Semi-aerobic Landfill – Fukuoka System
1.0 Sector Solid Waste Management
2.0 Technology Characteristics
2.1 Technology Name Semi-aerobic Landfill
2.2 Introduction The semi-aerobic landfill method was first tested at
Shin-Kamata Landfill with close collaboration
between Fukuoka University and Fukuoka City in
1975. After proving its positive effect on the
environment, it was officially accepted in Japan as
the ‘Fukuoka Method’ and was adopted as a national
standard technology by the Ministry of Health and
Welfare.
2.3 Brief Technology Description
A semi-aerobic landfill is a landfill where waste
goes through a decomposition process in the
presence of oxygen. This type of landfilling method
has several advantages including reduction in the
amount of landfill gas produced and faster
stabilisation of the waste landfilled.
In a semi-aerobic landfill, the leachate collection
system consists of a central pipe (main collection
pipe) with branch pipes on either side of it laid at a
suitable spacing (holes with approximately one inch
in diameter are cut into the pipe to allow leachate to
enter).
The leachate collection pipes offer a number of
advantages:
a) Leachate is drained out as quickly as possible,
preventing it from fouling in the waste material and
making it easier for fresh air to enter. This assists
aerobic conditions in the waste layers.
b) By creating aerobic conditions, microbial activity
is enhanced and the decomposition of waste is
increased.
c) By laying the collection pipes in the rocks, the
collection pipes are protected from clogging
(blockage of the pipes from dirt) and damage during
operation.
d) By quickly draining out the leachate, there is
reduced pressure caused by water on the bottom

Nauru TNA Report
115
ground/liner, leading to a reduced risk of leachate
seepage21. See Figure 1.
3.0 Subsector GHG Emission
4.0 Cost
4.1 Capital cost
Existing dumpsite upgrade = AUD 1.3M – 2.25M
This include operation of heavy equipment to (i)
construct new 0.5 Ha cell and (ii) to consolidate 15-
20,000m³ of waste material.
Cost of equipment (purchase only) = AUD 1.1M22
4.2 Operations and maintenance
In order to keep proper operations, landfill facilities
must be regularly inspected and maintained in a
good condition. Facilities to be maintained include
access roads, landfill slopes, drainage, and leachate
collection and the gas venting facility.
5.0 Application Potential in Nauru
5.1 Background • The current dump site operation involves
open dumping at several locations on site resulting
in a large ‘active’ tipping area. This in turn results in
most of the rain water falling on the site percolating
through exposed refuse, creating leachate.
• With no leachate collection any leachate
generated will percolate through the underlying soil
and rock to groundwater .
• Periodic fires have been addressed through
excavation of waste resulting a number of stockpiles
of exposed material around the site.
• There is no liner system, leachate collection
or separation of stormwater in place.
• Waste is compacted using an excavator
bucket when suitable equipment is available,
nominally twice a week but often much less
frequently.
• General waste material entering the site is
typical municipal solid waste from a Pacific Island
community with a relatively low organic material
content.
• Waste entering the site from community or
business collections is recorded and billed each
month. Communities are billed $2.50 per cubic
meter, businesses are charged $20 per cubic metre.
• There is no detailed information available on
waste quantity or composition. Based on materials
21 Amano. S., (2005). A Practical Guide to Landfill Management in Pacific Island Countries. SPREP. JICA.
22 Tonkin and Taylor (2018). Waste Management System Operations and Policy – Preliminary Advice
Nauru TNA Report
116
received at the dump site in the week of 26 February
2018, an estimated 26,000 m3 or 4 to 5,000 tonnes1
of material is received each year.
Open dumping creates a lot of problems, not only to
the surrounding environment but more critically to
public health and safety.
6.0 Gender Aspects
6.1 Potential Impact Yes
7.0 Benefits
7.1 Mitigation: GHG emissions from semi-aerobic landfill are
estimated as being half as much as that in anaerobic
landfills. This effect on the reduction of GHG
emissions by semi-aerobic landfills is greatly
influenced by the amount of passive air introduction
into the waste layer.
7.2 Social: • Employment opportunities.
• Skill and capacity development.
• Potential for gender impacts.
7.3 Economics:
Reconfiguring the dump site to make provision for
resource recovery (sorting and stockpiling),
management of garden waste and cardboard is
anticipated to increase reuse and recycling of
materials from across Nauru.
7.4 Environmental: Implementing controlled disposal of residual waste
with limited active dumping area, control of leachate
and capping of previously dumped waste will
significantly reduce the environmental risks posed
by the dump site. Controlled dumping and capping
of placed materials and will also reduce the potential
for landfill fires23.
23 Tonkin and Taylor (2018). Waste Management System Operations and Policy – Preliminary Advice

Nauru TNA Report
117

Nauru TNA Report
118
A.2.6 Mitigation Technology # 6 – Waste Sector
Waste segregation
Sector Solid Waste Management
2.0 Technology Characteristics
2.1 Technology Name Household Waste Sorting (Segregation)
2.2 Introduction Waste poses a threat to public health and the
environment if it is not stored, collected, and
disposed of properly.
Waste sorting or separation at the source, also called
source separation, is the process of separating
different fractions of waste at the place where it is
generated, i.e., at home.
Waste sorting is the process by which waste is
separated into different elements. Waste sorting can
occur manually at the household and collected
through curbside collection schemes, or
automatically separated in materials recovery
facilities or mechanical biological treatment
systems24.
2.3 Brief Technology Description
Onsite handling, storage, and processing are the
activities at the point of waste generation which
facilitate easier collection. For example, waste bins
are provided at the sites which generate sufficient
waste. See Figure 1.
3.0 Subsector GHG Emission
3.1 EPA’s WARM model. For every ton of mixed paper or cardboard that is
recycled rather than landfilling avoids 3.61 metric
tons of CO2 emission or equivalent to 9.37 cars
taken off the road.25
4.0 Cost
4.1 Capital cost
The price of 240 L wheelie bins ranges between
AUD 50 to AUD 100 each. Capital cost will be
dependent on the number and types of bins required
per household multiplied (x) by number of
households on Nauru multiplied (x) by the cost of
each bin. Cost of freight is not included. Eg. For
every 100 homes would require a capital investment
of $10,000 for the supply of one recycle bin.
24 https://en.wikipedia.org/wiki/Waste_sorting
25 http://www.stopwaste.co/calculator/

Nauru TNA Report
119
5.0 Application Potential in Nauru
5.1 Solid Waste Sorting Status at
Community Level
Color-coded 240 L wheelie bins are being used
effectively in developed countries for domestic solid
waste segregation. CIE are currently promoting this
concept to all schools on the island which is a great
approach in educating our children first hand before
it is disseminated at the community level.
Solid waste separation at community level will
reduce waste going into landfills. These separated
solid waste can be further sorted at the dumpsite
using mechanical-biological treatment (MBT)
machines.
6.0 Gender Aspects
6.1 Potential impact Yes.
7.0 Benefits
7.1 Mitigation:
Reduction in uncontrolled solid waste disposal at the
dumpsite thus reducing GHG emissions.
7.2 Social:
Proper waste management at the source of
generation is a public benefit.
Employment opportunities.
Educating
7.3 Economics: Reduced solid waste for landfill.
Reduction in heavy equipment use for landfilling.
7.4 Environmental: Controlling what goes into the landfills in terms of
household solid waste segregation can significantly
reduce the emission of GHG.

Nauru TNA Report
120
The Australian three-bin system
Figure 1: Colored waste bins for different wastes as illustrated below in Table 1.

Nauru TNA Report
121
A.2.7 Mitigation Technology # 7 – Waste Sector
Commercial baling
1.0 Sector Solid Waste Management
2.0 Technology Characteristics
2.1 Technology Name :
Commercial Baling Machine
2.2 Introduction:
Industrial balers form an integral part of waste
disposal systems for various industries, since they
can easily compress and bind waste materials into
compact bales for easier handling and
transportation. These denser bales take up less space
and are also more likely to be sent to a recycling
center or purchased by businesses that use recycled
materials, rather than ending up in a landfill.
They are most often used in industries like
agriculture, retail, oil, automotive and plastic
products manufacturing, as well as restaurants,
schools, recycling centers and junk yards. Garbage
that cannot be recycled or reused is compacted to
reduce the volume of trash in landfills, but balers
also increase the convenience of handling and
transportation for recyclable materials like plastic
bottles, metal cans, cardboard boxes and paper
products.
The use of commercial balers allows companies to
reduce the amount of labor, time and energy spent in
the recycling process, since they can be operated by
a single person in most cases or even automated
completely. Balers can form the central point for the
waste management processes in any business, by
compacting and reducing the volume of materials
that need to be recycled or disposed.26
Balers are brilliant for segregating waste types.
Cardboard and plastic are baled separately so
recyclers do not need to segregate at the depot. Dry
mixed recycling bins contain an array for different
materials, which need to be segregated. This is
additional labour hours for staff at the waste
management depot, the cost of which will be passed
on to the hotel.27
26 https://www.norcalcompactors.net/industrial-commercial-balers/
27 https://www.cardboardbalers.org/how-can-hotels-benefit-from-using-balers-over-recycling-bins/

Nauru TNA Report
122
2.3 Brief Technology Description
Industrial and commercial balers are available in a
variety of different models that are designed for
dealing with various kinds of waste material like
cardboard, plastic and textile. Most commonly, they
are classified according to the type of input and
direction of material flow, i.e. vertical baler and
horizontal baler.
Vertical Cardboard Balers are perfect for
manufacturing plants, hotels, restaurants, retailers,
supermarkets, hospitals, distribution places,
recycling stations, and other similar places. We
make it possible for you to process and bale paper,
cardboard, rags, aluminum, plastic, plastic bottles,
shrink wrap, rags, and similar stuff. These balers are
perfect for reducing labor expenses and generating
extra revenue from recycling operations.
These balers are known for their customization with
hand fed tray, conveyor belt, air system and loader.
They are designed to reduce labor expenses and aid
the recycling process through increased payload.
These machines are capable of baling newspapers,
tin, paper, cardboard, plastic, shrink wraps,
aluminum, foam, coated book stocks, rags, plastic
bottles, steel, and other recyclable stuff. This makes
them perfect for manufacturing plants, printing
presses, recycling stations, distribution centers and
other places with similar operations.
3.0 Cost
3.1 Capital cost The cost of the baler itself can run anywhere
between $5,000 for a low-end vertical baler to more
than $1 million for a top-of-the-line ferrous baler.
Shear/baler/loggers can even cost as much as $1.5
million.
3.2 Operations and maintenance
Baler operators need to be trained on how to safely
operate these machines. However, maintenance
costs are very low.
4.0 Application Potential in Nauru
4.1 Balers can be installed at government offices where
the main source of wastes are papers and cardboards.
Other recyclable wastes may include plastic bottles
and aluminum cans.
5.0 Gender Aspects
5.1 Potential impacts Yes
6.0 Benefits
6.1 Mitigation: Reduces GHG emission by reducing recyclable
waste ending up in landfills.
6.2 Social: Job creation.

Nauru TNA Report
123
6.3 Economics: Balers reduce shipping costs by densifying
materials, improving the efficiency of each haul.
Because of this, for many businesses (including
manufacturers, distributors and retail stores),
investing in baling equipment for recyclables can
lead to significant economic benefits.
Cost reduction in waste management.
6.4 Environmental: Balers reduce a great amount of recyclable waste
ending up in the landfills. Baling keeps all recyclable
waste together unlike bins which can potentially
make cardboard and plastic overflow into the
general waste stream. Bales will stay compacted
together, ensuring it is 100% recycled. This is where
balers heavily defeat recycling bins in terms of green
credentials.

Nauru TNA Report
124
A.2.8 Mitigation Technology # 8 – Energy Sector
Composting at household level
1.0 Sector Solid Waste Management
2.0 Technology Characteristics
2.1 Technology Name
Composting
2.2 Introduction
The term composting is defined as biological
degradation of waste under controlled aerobic
conditions. The waste is decomposed into CO2,
water and the soil amendment or mulch. In addition,
some carbon storage also occurs in the residual
compost. Today many developed and developing
countries practice composting of mixed waste or
biodegradable waste fractions (kitchen or restaurant
wastes, garden waste, sewage sludge). It is best
suited for source segregated biodegradable waste28.
See Figure 1.
Composting is one of the simplest ways to prevent
emissions of methane because the organic fraction
of the waste stream is diverted from landfill. While
composting does release carbon dioxide, it is
currently considered to be a neutral process since the
removal of carbon dioxide from the atmosphere by
photosynthesis to produce organic matter is also not
considered.
Compositing can be divided into home compositing
and industrial compositing. Essentially, the same
biological processes are involved in both scales of
compositing. Different materials are suitable for
decomposition, but carbon and nitrogen containing
materials are normally preferred. These include
green plant material, dry straw, leaves, paper and
wood chips29.
2.3 Brief Technology Description
Composting is a natural aerobic (with oxygen)
process where microorganisms break down organic
material producing stabilised material (compost),
CO2, water and heat30.
Generally there are two major approaches to
compositing. Active and passive. Active (hot)
28 TNA Factsheet – Mitigation for Bhutan – Composting
29 TNA Factsheet – Mitigation for Kenya - Composting
30 Tonkin and Taylor (2018). Waste Management System Operations and Policy – Preliminary Advice
Nauru TNA Report
125
compositing is compositing close to ideal conditions
allowing aerobic bacteria to thrive. To achieve good
results the composite material must be kept warm,
insulated and moist.
Passive composition is compositing in which the
level of physical intervention is kept to a minimum.
Most industrial compositing operations use active
compositing techniques while home compositing
operations use passive techniques.
Waste compositing involves, waste collection,
segregation/sorting, piling and sprinkling with
water31.
3.0 Subsector GHG Emission
3.1 EPA’s WARM model CO2
emission calculator
For every ton of food scraps/ organics recycled or
composted rather than landfilling avoids 0.88 metric
tons of CO2 emissions. This is equivalent to 2.28
cars taken off the road.32
4.0 Cost
4.1 Capital cost
The capital requirement for waste compositing
depends on the scale of operations. At home
compositing, the operation can be undertaken
through household labor thereby minimizing costs.
Commercial compositing can be undertaken at small
scale or medium scale. In most operators using basic
equipment that do not require large capital outlay.
4.0 Application Potential in Nauru
4.1 Home vs Dumpsite composting Home composting will require a compost bin that
are available in stores or these can be home made.
(See Figure 2). Promoting home composting for
kitchen gardening provides a number of benefits in
terms of organic waste management, sustainable
kitchen gardening and healthy livelihood. Dumpsite
composting on the other hand may restrict people
from accessing compost for their kitchen gardening.
Home composting should be integrated with kitchen
gardening through CIE.
This does not stop dumpsite composting initiatives
as commercial and industrial organic wastes are in
abundance.
5.0 Gender Aspects
5.1 Potential impact High
6.0 Benefits
31 TNA Factsheet – Mitigation for Kenya - Composting
32 http://www.stopwaste.co/calculator/

Nauru TNA Report
126
6.1 Mitigation: Waste compositing replace natural decomposition
which takes place under anaerobic conditions that
would result in emissions of methane gas. The
carbon dioxide that is emitted during the de-
compositing process is of lower global warming
potential than methane and therefore contributor to
climate change mitigation33.
This directly prevents the emissions of methane
(which is 25 times a more potent GHG than CO2)
that would have occurred from waste disposal on
land.
6.2 Social: Composting provides benefits for waste handling
agencies. Composting part of the waste the agency
receives increases the landfill lifetime and provides
the waste handling agency with a marketable
product in the form of compost.
The technology is applicable for both small scale
and large scale applications. Either of these will
support local employment generation34.
6.3 Economics: Composting programs launched by small
communities can provide benefits to the local
community in the form of increased local
employment and reduced costs for waste removal.
Producing compost is found to be a profitable
business in many parts of the world if implemented
in public private partnerships models and right
choice of centralized and decentralized composting
units35.
6.4 Environmental: Composting directly leads to avoidance of methane
emissions thereby improving the air quality.
Composting results in a reduced waste volume going
into landfills.
33 TNA Factsheet – Mitigation for Kenya – Composting
34 TNA Factsheet – Mitigation for Bhutan – Composting
35 TNA Factsheet – Mitigation for Bhutan – Composting

Nauru TNA Report
127
Figure 1: The composting process
Figure 2: Examples of DIY compost bins.

Nauru TNA Report
128
Annex 3: List of consultants and stakeholders involved and their contacts
Name Gender Department Position E-mail
1. Reagan Moses M CIE-CC Director for CC/ TNA
Project Coordinator [email protected]
2. Dr. Michael
Ha’apio M CIE-CC
TNA Adaptation
Consultant [email protected]
3. Abraham
Aremwa M CIE-CC
TNA Mitigation
Consultant [email protected]
4. John Limen M Finance Director of Planning [email protected]
5. Sereana
Tagivakatini F Education
Strat. Plan
Implement’n Manager [email protected]
6. Haseldon
Buraman M ECO Nauru Director [email protected]
7. Mark Hiram M NUC Water Manager [email protected]
8. Apenisa
Manuduitagi M NUC
RE & Metering
Manager [email protected]
9. Ricky Starr M CIE-Env. OD5 [email protected]
10. Samuel
Grundler M Finance Director of AIDs [email protected]
11. Godwin Koroa M CIE-Env. Environment Officer [email protected]
12. Fine Olsson M NRC Nursing Supervisor [email protected]
13. Delvina Thoma F NRC A/ Services Manager [email protected]
14. Darice Bari F CIE-CC TNC Projector
Coordinator [email protected]
15. Miniva Harris F CIE-Energy Project Coordinator [email protected]
16. Lola Adeang F CIE-CC CC Officer [email protected]
17. Thorndon Scotty M CIE-CC TNC Project Admin.
Assistant [email protected]
18. Justin Togoran M Finance PAD Officer [email protected]
19. Grace Garabwan F CIE-Env. Waste Officer [email protected]
20. Zeth Jose F NFRMA Officer [email protected]
21. Beuloria Derog F NFMRA Officer [email protected]
22. Evayne Gaubidi F CIE IW R2R Officer [email protected]

Nauru TNA Report
129
Annex 4: First TNA Workshop Program
NAURU TNA WORKSHOP PROGRAM 23 & 24 May, 2019
Venue: CIE Conference Room
Thursday 23 May, 2019
9.00am: Registration 9.30am: Opening prayer 9.35am: First National TNA Workshop Opening & Welcoming Speech Speaker: Reagan Moses – Director for Climate Change; TNA Nauru Project Coordinator
9.45am Overview of Workshop Sessions & Learning Outcomes Session 1: TNA Project Overview
Learning Outcome 1:
To understand the basis, objective & process of a National TNA Project. Session 2: Mitigation & Adaptation Sectors & Technologies
Learning Outcome 2:
To be able to define, explain & differentiate mitigation & adaptation in terms of climate change.
To be able to define, explain & identify sectors & their associated technologies in the context of climate change mitigation & adaptation.
Session 3: Multi-Criteria Analysis Tool Learning Outcome 3:
To be able to identify & categorise the selected technologies before applying them to the MCA.
The purpose & how to implement a sensitivity analysis to the MCA.
Session One – TNA Project Overview 10.00am TNA Project Introduction
TNA origin, definition, objectives & deliverables, anticipated outcomes Presenter: Reagan Moses – National TNA Coordinator & Director for Climate Change
10.20am: Morning Tea 10.40am: TNA Project Institutional Structure & Work Plan
National TNA Team structure, roles & responsibilities
Work plan Presenter: Abraham Aremwa – National Mitigation Consultant
11.10am: TNA Project Process - Identification & Prioritization of Technologies
Technology definition, selection process.
MCA Presenter: Michael Ha’apio – National Adaptation Consultant

Nauru TNA Report
130
11.40am: Learning Outcome 1 Evaluation 12 – 1.00pm: LUNCH Session Two – Mitigation & Adaptation Sectors & Technologies 1.00pm: Mitigation Sectors & Technologies
Sectors identified for Mitigation
National Planning & Strategy Documents reviewed
Mitigation Technologies identified
Fact sheets presentation Presenter: Abraham Aremwa – National Mitigation Consultant
2.00pm: Adaptation Sectors & Technologies
Sectors identified for Adaptation
National Planning & Strategy Documents reviewed
Adaptation Technologies identified
Fact sheets presentation Presenter: Michael Ha’apio – National Adaptation Consultant
3.00pm: Afternoon Tea 3.20pm: Methodology Overview
Tool introduction – MCA (Multi-Criteria Analysis)
MCA for Mitigation example
MCA for Adaptation example
4.30 -5.00pm: Learning Outcome 2 Evaluation
Friday 24 May, 2019
Session Three – Multi-Criteria Analysis Tool 9.00am: MCA for Mitigation 10.00am: Morning Tea 10.20am: MCA for Mitigation (continue) 12 – 1.00pm: LUNCH 1.00pm: MCA for Adaptation 3.00pm: Afternoon Tea 3.20pm: MCA for Adaptation (continue) 4.00pm: Technologies Identified & Prioritised through MCA
Mitigation & Adaptation

Nauru TNA Report
131
Presenters: Mitigation & Adaptation Consultants
4.30pm: Nauru TNA Project Schedule
Preparation & submission of 1st Report – Technical Needs Assessment due June 2019
2nd Nauru TNA Working Group Workshop on Barrier Analysis &Enabling Framework – November 2019
3rd Nauru TNA Working Group Workshop on Technology Action Plan (TAP) Q2 2020 Presenter: Reagan Moses – National TNA Coordinator & Director for Climate Change
Nauru TNA Report
132
Annex 5: Second TNA Workshop Program
NAURU TNA WORKSHOP Identification & Prioritization of Sectors & Technologies
Friday 14 June, 2019 Venue: CIE Conference Room
The main aim for this one-day workshop is to conclude; using the MCA tool, the climate technologies that were initially prioritized during our recent two-day workshop back in May 2019. Activities for the day will include:
(i) validating of the technology fact sheets; and (ii) applying data from the fact sheets to the Multi-Criteria Analysis (MCA) tool
for scoring. Stakeholders are encouraged to bring along their laptops to load copy of the MS Excel-based MCA Tool.
Friday 14 June, 2019
9.00am: Registration 9.30am: Opening prayer 9.35am: Recap of topics discussed and the outcomes from our recent two-day TNA
Workshop that was held on 23 & 24 May, 2019.
Previous Workshop Sessions & Learning Outcomes
Session 1: TNA Project Overview Learning Outcome 1:
Understand the basis, objective & process of a National TNA Project.
Session 2: Mitigation & Adaptation Sectors & Technologies Learning Outcome 2:
To be able to define, explain & differentiate mitigation & adaptation in terms of climate change.
To be able to define, explain & identify sectors & their associated technologies in the context of climate change mitigation & adaptation.
Session 3: Multi-Criteria Analysis Tool
Learning Outcome 3:
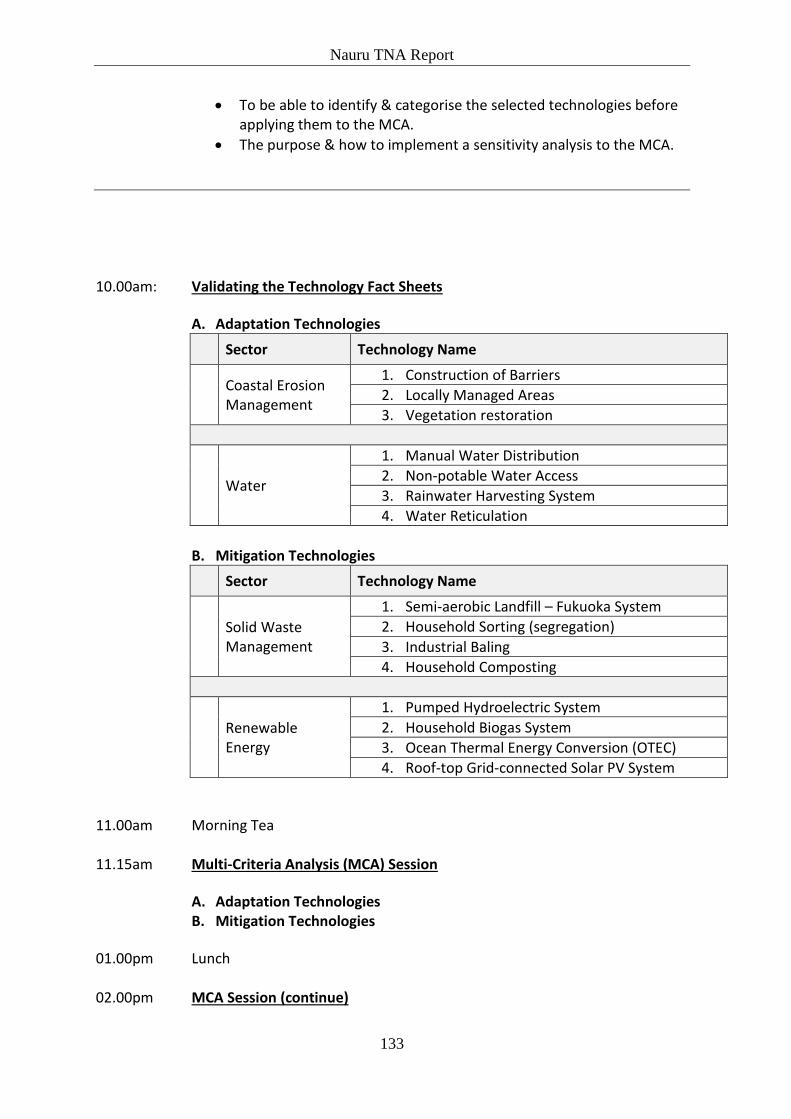
Nauru TNA Report
133
To be able to identify & categorise the selected technologies before applying them to the MCA.
The purpose & how to implement a sensitivity analysis to the MCA.
10.00am: Validating the Technology Fact Sheets
A. Adaptation Technologies
Sector Technology Name
Coastal Erosion Management
1. Construction of Barriers
2. Locally Managed Areas
3. Vegetation restoration
Water
1. Manual Water Distribution
2. Non-potable Water Access
3. Rainwater Harvesting System
4. Water Reticulation
B. Mitigation Technologies
Sector Technology Name
Solid Waste Management
1. Semi-aerobic Landfill – Fukuoka System
2. Household Sorting (segregation)
3. Industrial Baling
4. Household Composting
Renewable Energy
1. Pumped Hydroelectric System
2. Household Biogas System
3. Ocean Thermal Energy Conversion (OTEC)
4. Roof-top Grid-connected Solar PV System
11.00am Morning Tea 11.15am Multi-Criteria Analysis (MCA) Session
A. Adaptation Technologies B. Mitigation Technologies
01.00pm Lunch 02.00pm MCA Session (continue)

Nauru TNA Report
134
03.00pm Afternoon Tea 03.15pm MCA Session (continue) 04.30pm Discuss the outcome of the analysis (MCA) Nauru TNA Project Schedule
Barrier Analysis and Enabling Framework Identification (Oct-Nov 2019)
Technology Action Plan (Apr-May 2019)

Nauru TNA Report
135
Annex 6: The process in normalising the performance matrix table
The process in normalising the performance scoring matrix table results is achieved by
utilising either one of the following equations. Where ‘100’ is regarded as the most preferred
value for a certain criteria then the Eq. 1 below is used.
Yi = Xi – Xmin x 100 (Eq.1)
Xmax – Xmin
Where ‘0’ is regarded as the most preferred value for a certain criteria, Eq. 2 is used.
Yi = Xmax – Xi x 100 (Eq.2)
Xmax – Xmin
Here: Yi – score of option i; Xi – performance of option i; Xmax, Xmin – the highest and the
lowest performance among all the options. This process is automatically calculated (in the
actual MCA spreadsheet) for each criterion and results entered into the Normalised scoring
matrix table
Recommended