Embed Size (px)
Citation preview

EUROPEAN COMMISSION
Integrated Pollution Prevention and Control
Reference Document onBest Available Techniques in
Common Waste Water and Waste GasTreatment / Management Systems in
the Chemical Sector
February 2003


Executive Summary
Waste Water and Waste Gas Treatment i
EXECUTIVE SUMMARY
INTRODUCTION
The BREF (Best Available Techniques reference document) on waste water and waste gastreatment and management in the chemical sector reflects an information exchange carried outunder Article 16(2) of Council Directive 96/61/EC. This Executive Summary – which isintended to be read in conjunction with the BREF Preface’s explanations of objectives, usageand legal terms – describes the main findings, the principal BAT conclusions and the associatedemission levels. It can be read and understood as a stand-alone document but, as a summary, itdoes not present all the complexities of the full BREF text. It is therefore not intended as asubstitute for the full BREF text as a tool in BAT decision making.
Waste water and waste gas handling has been identified as a horizontal issue for the chemicalsector as it is described in Annex I, 4 of the Directive. It means that the term “Best AvailableTechniques (BAT)” is assessed in this document for the entire chemical sector, independently ofthe particular production process(es) and the kind or size of the chemical enterprise(s) involved.It also means that the term BAT needs to include, apart from treatment technologies, amanagement strategy to achieve optimal waste prevention or control.
Thus the scope of the document comprises:
• the application of environmental management systems and tools• the application of the treatment technology for waste water and waste gas as it is commonly
used or applicable in the chemical sector, including the treatment technology for wastewater sludge, as long as it is operated on the chemical industry site
• the identification of or conclusion on best available techniques based on the two precedingitems, resulting in a strategy of optimum pollution reduction and, under appropriateconditions, in BAT-associated emission levels at the discharge point to the environment.
Only commonly applied or applicable techniques for the chemical industry are dealt with in thisdocument, leaving process-specific techniques or process-integrated techniques (i.e. non-treatment techniques) to the vertical process BREFs. Though restricted to the chemical industry,it is recognised that the document might also contain valuable information for other sectors (e.g.the refinery sector).
GENERAL ISSUES (CHAPTER 1)
Discharges to air and water are the main environmental impacts caused by releases fromchemical installations.
The main sources of waste water in the chemical industry are:
• chemical syntheses• waste gas treatment systems• conditioning of utility water• bleed from boiler feed water systems• blowdown from cooling cycles• backwashing of filters and ion exchangers• landfill leachates• rainwater from contaminated areas, etc.,

Executive Summary
ii Waste Water and Waste Gas Treatment
their main impact being characterised by:
• hydraulic load• content of pollutant substances (expressed as load or concentration)• effect or hazardous potential on the receiving water body, expressed as surrogate or sum
parameters• effect on organisms in the receiving water body, expressed as toxicity data.
Waste gas emissions appear as:
• ducted emissions, which are the only emissions that can be treated• diffuse emissions• fugitive emissions.
The main air pollutants are:
• VOCs• sulphur compounds (SO2, SO3, H2S, CS2, COS)• nitrogen compounds (NOx, N2O, NH3, HCN)• halogen compounds (Cl2, Br2, HF, HCl, HBr)• incomplete combustion compounds (CO, CxHy)• particulate matter.
MANAGEMENT SYSTEMS AND TOOLS (CHAPTER 2)
Environmental management is a strategy for dealing with waste releases (or their prevention)from (chemical) industry activities, taking local conditions into account, thereby improving theintegrated performance of a chemical site. It enables the operator to:
• gain insight into the pollution-generating mechanisms of the production processes• make balanced decisions about environmental measures• avoid temporary solutions and no-return investments• act adequately and proactively on new environmental developments.
An environmental management system (Section 2.1) normally follows a continuous loopprocess, the various steps supported by a number of management and engineering tools(Section 2.2), which are roughly categorised as:
• inventory tools providing, as a starting point, detailed and transparent information for thenecessary decisions on waste prevention, minimisation and control. They include:- site inventory, giving detailed information on the location, the production processes and
the respective plants, the existing sewerage system, etc.- stream (waste water and waste gas) inventory, giving detailed information on the waste
streams (amount, pollutant content, their variability, etc.), their sources, quantification,evaluation and validation of the causes of emissions, ending in a ranking of the variousstreams to identify options and a priority listing for future improvements. A WholeEffluent Assessment and an assessment of the reduction of water usage and waste waterdischarge are also parts of a stream inventory
- energy and material flow analysis, which aims to improve the operating efficiency ofprocesses (as regards consumption of energy, raw material, waste release)

Executive Summary
Waste Water and Waste Gas Treatment iii
• operational tools for turning environmental management decisions into action. Theyinclude:- monitoring and regular maintenance- setting and regular review of internal targets or programmes for continuous
environmental improvement- choice of treatment options and collection systems, based on the result of, e.g.,
inventory tools, and their implementation- quality control methods, used as ‘trouble shooters’ when an existing treatment process
runs out of control or cannot fulfil set requirements. Such methods are, e.g., cause-effectdiagram, Pareto analysis, flow diagram or statistical process control
• strategic tools, comprising the organisation and operation of waste handling on the entirechemical site in an integrated manner, evaluating environmental and economic options.They include:- risk assessment as a common methodology to calculate human and ecological risk as a
result of activities of production processes- benchmarking as a process of comparison of the achievements of one plant or site with
those of others- life cycle assessment as a process of comparison of the potential environmental effects
of different ways of operating• safety and emergency tools, necessary in the case of unplanned events such as accidents,
fires or spillages.
TREATMENT TECHNIQUES (CHAPTER 3)
The techniques identified by the Technical Working Group and described in this document arethose that are common in the chemical sector as a whole. They are introduced in a logical order,which follows the pollutant path.
The described WASTE WATER treatment techniques are:
• separation or clarification techniques, which are mainly used in combination with otheroperations, either as a first step (to protect other treatment facilities against damage,clogging or fouling by solids) or a final clarification step (to remove solids or oil formedduring a preceding treatment operation):- grit separation- sedimentation- air flotation- filtration- microfiltration / ultrafiltration- oil-water separation
• physico-chemical treatment techniques for non-biodegradable waste water, mainly usedfor inorganic or hardly biodegradable (or inhibitory) organic contaminants, often as apretreatment upstream of a biological (central) waste water treatment plant:- precipitation/sedimentation/filtration- crystallisation- chemical oxidation- wet air oxidation- super-critical water oxidation- chemical reduction- hydrolysis- nanofiltration / reverse osmosis- adsorption- ion exchange

Executive Summary
iv Waste Water and Waste Gas Treatment
- extraction- distillation / rectification- evaporation- stripping- incineration
• biological treatment techniques for biodegradable waste water:- anaerobic digestion processes, such as anaerobic contact process, UASB process, fixed-
bed process, expanded-bed process, biological removal of sulphur compounds andheavy metals
- aerobic digestion processes, such as complete-mix activated sludge process, membranebioreactor process, trickling filter process, expanded-bed process, biofilter fixed-bedprocess
- nitrification / denitrification- central biological waste water treatment.
The described WASTE WATER SLUDGE treatment techniques can be seen as single options or as acombination of single options. The following list is by no means intended to indicate a ranking.The availability (or non-availability) of a disposal route, however, can be a strong driver, at leastat a local level, in the choice of an appropriate waste water control technique. The describedwaste water sludge treatment techniques are:
• preliminary operations• sludge thickening operations• sludge stabilisation• sludge conditioning• sludge dewatering techniques• drying operations• thermal sludge oxidation• landfilling of sludge on site.
The described WASTE GAS treatment techniques cannot simply be classified as recovery orabatement techniques. Whether contaminants are recovered depends on the application ofadditional separation stages. Some of the techniques can be used as individual final operations,others only as a pretreatment or final polishing step. Most waste gas control techniques requirefurther downstream treatment for either waste water or waste gas generated during the treatmentprocess. The techniques are:
• for VOC and inorganic compounds:- membrane separation- condensation- adsorption- wet scrubbing- biofiltration- bioscrubbing- biotrickling- thermal oxidation- catalytic oxidation- flaring

Executive Summary
Waste Water and Waste Gas Treatment v
• for particulate matter:- separator- cyclone- electrostatic precipitator- wet dust scrubber- fabric filter- catalytic filtration- two-stage dust filter- absolute filter (HEPA filter)- high-efficiency air filter (HEAF)- mist filter
• for gaseous pollutants in combustion exhaust gases:- dry sorbent injection- semi-dry sorbent injection- wet sorbent injection- selective non-catalytic reduction of NOx (SNCR)- selective catalytic reduction of NOx (SCR).
CONCLUSIONS ON BEST AVAILABLE TECHNIQUES (CHAPTER 4)
The chemical industry covers a wide range of enterprises: at one end the one-process-few-products small enterprises with one or few waste release sources and, at the other, the multi-production-mix enterprises with many complex waste streams. Although there are probably notwo chemical sites that are totally comparable in production range and mix, environmentalsituation and the quantity and quality of their waste emissions is it possible to describe BAT forwaste water and waste gas treatment for the chemical sector as a whole.
The implementation of BAT in new plants is not normally a problem. In most cases it makeseconomic sense to plan production processes and their waste releases to minimise emissions andmaterial consumption. With existing sites, however, the implementation of BAT is not generallyan easy task, because of the existing infrastructure and local circumstances. Nevertheless, thisdocument does not distinguish between BAT for new and existing installations. Such adistinction would not help to improve the environmental situation of industrial sites towardsadopting BAT and it would not reflect the commitment of the chemical industry to continuousimprovement of environmental conditions.
Management
As the detailed description of environmental management in Chapter 2 indicates, theprerequisite of good environmental performance is an Environmental Management System(EMS). In the final analysis, the proper and consistent execution of a recognised EMS will leadto the optimum environmental performance of a chemical industry site, thus achieving BAT.
On this premise, it is BAT to implement and adhere to an EMS that could include:
• implementation of a transparent hierarchy of personnel responsibility, the persons in chargereporting directly to the top management level
• preparation and publication of an annual environmental performance report• setting internal (site- or company-specific) environmental targets, reviewing them regularly
and publishing them in the annual report• holding a regular audit to secure compliance with the principles of EMS• regular monitoring of performance and progress towards the achievement of EMS policy

Executive Summary
vi Waste Water and Waste Gas Treatment
• practising risk assessment on a continuous basis to identify hazards• practising benchmarking on a continuous basis and challenging the processes (production
and waste treatment) on their water and energy consumption, waste generation and cross-media effects
• implementation of an adequate training programme for staff and instructions for contractorsworking on the site on Health, Safety and Environment (HSE) and emergency issues
• application of good maintenance practices.
It is further BAT to implement a waste water / waste gas management system (or waste water /waste gas assessment), as a subsystem to the EMS, using an appropriate combination of:
• site inventory and stream inventory• checking and identifying the most relevant emission sources for each medium and listing
them according to their pollutant load• checking the receiving media (air and water) and their tolerance of the emissions, using the
results to determine the extent to which stronger treatment requirements are needed or if theemissions can be accepted at all
• performing assessment of toxicity, persistence and potential bioaccumulation of waste waterto be discharged into a receiving water body and sharing the results with the competentauthorities
• checking and identifying relevant water-consuming processes and listing them according totheir water usage
• pursuing options for improvement, focusing on streams with higher concentrations andloads, their hazard potential and impact on the receiving water body 1
• assessing the most effective options by comparing overall removal efficiencies, overallbalance of cross-media effects, technical, organisational and economic feasibility etc.
Further BAT are to:
• assess impact on the environment and the effects on treatment facilities when planning newactivities or alterations to existing activities
• practise emission reduction at source• link production data with the data on emission loads to compare the actual and calculated
releases• treat contaminated waste streams at source in preference to dispersion and subsequent
central treatment, unless there are good reasons against it• use quality control methods to assess the treatment and/or production processes and/or
prevent them running out of control• apply good manufacturing practice (GMP) for equipment cleaning to reduce emissions to
water and to air• implement facilities / procedures to enable timely detection of a deviation that could affect
the downstream treatment facilities, so as to avoid an upset of those treatment facilities• install an efficient central warning system that will give notice of failures and malfunctions
to all concerned• implement a monitoring programme in all waste treatment facilities to check that they are
operating properly• put in place strategies for dealing with fire-fighting water and spillages• put in place a pollution incident response plan• allocate costs of waste water and waste gas treatment associated with production.
Process-integrated measures are not within the scope of the document, but they are an importantmeans of optimizing environmental performance of production processes. Thus, it is BAT to:
1 One Member State wants a more precise definition of ‘streams with higher concentration’ that includes values for loads and/or
concentrations. A split view is reported. Further details are given in Chapter 4.

Executive Summary
Waste Water and Waste Gas Treatment vii
• use process-integrated measures in preference to end-of-pipe techniques when there is achoice
• assess existing production installations for options of retrofitting process-integratedmeasures and implement them when feasible or at latest when the installation undergoesmajor alterations.
Waste Water
An adequate WASTE WATER COLLECTION SYSTEM plays an essential role in effectivewaste water reduction and/or treatment. It ducts the waste water streams to their appropriatetreatment device and prevents mixing of contaminated and uncontaminated waste water. Thus,BAT is to:
• segregate process water from uncontaminated rainwater and other uncontaminated waterreleases. If existing sites do not yet operate water segregation, it can be installed – at leastpartially – when major alterations are made to the site
• segregate process water according to its contamination load• install a roof over areas of potential contamination wherever feasible• install separate drainage for areas of contamination risk, including a sump to catch leakage
or spillage losses• use overground sewers for process water inside the industrial site between the points of
waste water generation and the final treatment device(s). If climatic conditions do not allowoverground sewers (temperatures significantly below 0 °C), systems in accessibleunderground ducts are a suitable replacement. Many chemical industry sites are stillprovided with underground sewers and the immediate construction of new sewer systems isnormally not viable, but work can be done in stages when major alterations to productionplants or the sewer system are planned
• install retention capacity for failure events and fire-fighting water in the light of a riskassessment.
WASTE WATER TREATMENT in the chemical sector follows at least four differentstrategies:
• central final treatment in a biological WWTP on site• central final treatment in a municipal WWTP• central final treatment of inorganic waste water in a chemical-mechanical WWTP• decentralised treatment(s).
None of these four is preferred to the others, as long as an equivalent emission level isguaranteed for the protection of the environment as a whole and provided this does not lead tohigher levels of pollution in the environment [Article 2(6) of the Directive].
It is assumed at this stage that the appropriate effluent management decisions have been made,the impact on the receiving water body has been assessed, all practical options for preventionand reduction of waste water have been exploited and all safety measures have been taken intoaccount, i.e. from this point on, only end-of-pipe solutions are considered.

Executive Summary
viii Waste Water and Waste Gas Treatment
For rainwater, it is BAT to:
• duct uncontaminated rainwater directly to a receiving water, by-passing the waste watersewerage system
• treat rainwater from contaminated areas before discharging it into a receiving water.
In some cases the use of rainwater as process water to reduce fresh water consumption may beenvironmentally beneficial.
Appropriate treatment facilities are:
• grit chamber• retention pond• sedimentation tank• sand filter.
It is BAT to remove oil and/or hydrocarbons when they appear as large slugs or where theyare incompatible with other systems, with the aim of maximising recovery, by applying anappropriate combination of:
• oil/water separation by cyclone, microfiltration or API (American Petroleum Institute)separator, when large slugs of free oil or hydrocarbons can be expected, otherwise theparallel plate interceptor and the corrugated plate interceptor are alternatives
• microfiltration, granular media filtration or gas flotation• biological treatment.
BAT-associated emission levels
Parameter Concentration a[mg/l]
total hydrocarbon content b 0.05-1.5BOD5 2-20COD 30-125a monthly averageb There is disagreement on the analytical methods to assesshydrocarbons which could not be solved within the TWG.
It is BAT to break and/or remove emulsions at source.
For suspended solids (TSS) (TSS that include heavy metal compounds or activated sludge needother measures), it is BAT to remove them from waste water streams when they could causedamage or failure to downstream facilities or before they are discharged into a receiving water.Common techniques are:
• sedimentation / air flotation to catch the main TSS load• mechanical filtration for further solids reduction• microfiltration or ultrafiltration when solid-free waste water is required.
Techniques that enable recovery of substances are preferred.

Executive Summary
Waste Water and Waste Gas Treatment ix
It is further BAT to
• control odour and noise by covering or closing the equipment and ducting the exhaust air tofurther waste gas treatment if necessary
• dispose of the sludge, either by handing it to a licensed contractor or by treating it on site(see section on sludge treatment).
As heavy metals are chemical elements that cannot be destroyed, recovery and re-use are theonly ways to prevent them being released into the environment. Any other option causes themto be transferred between the different media: waste water, waste air and landfilling.
Thus, for heavy metals, it is BAT to do all of the following:
• segregate waste water containing heavy metal compounds as far as possible and• treat the segregated waste water streams at source before mixing with other streams and• use techniques that enable recovery as widely as possible and• facilitate further elimination of heavy metals in a final WWTP as a polishing step, with
subsequent treatment of sludge, if necessary.
The appropriate techniques are:
• precipitation / sedimentation (or air flotation instead) / filtration (or microfiltration orultrafiltration instead)
• crystallisation• ion exchange• nanofiltration (or reverse osmosis instead).
Because the emission levels that can be achieved by these control techniques are stronglydependent on the source process from which the heavy metals are released, the TWG foundthemselves unable to identify BAT-associated emission levels that would be valid for thechemical sector as a whole. It was recommended that this subject be dealt with in theappropriate process BREFs.
The inorganic salt (and/or acid) content of waste water can influence both the biosphere of areceiving water, e.g. small rivers when they are confronted with high salt loads, and theoperation of sewerage systems, e.g. corrosion of pipes, valves and pumps or malfunction ofdownstream biological treatment. In the case of one or both of these possibilities, it is BAT tocontrol the inorganic salt content, preferably at source and preferably with control techniquesthat enable recovery. Appropriate treatment techniques (not including techniques for treatingheavy metals or ammonium salts) are:
• evaporation• ion exchange• reverse osmosis• biological sulphate removal (used only for sulphate, but when heavy metals are present,
they are also removed).
Pollutants unsuitable for biological treatment are, e.g. recalcitrant TOC and/or toxicsubstances that inhibit the biological process. Thus their discharge into a biological treatmentplant needs to be prevented. It is not possible to forecast which contaminants are inhibitors for
Executive Summary
x Waste Water and Waste Gas Treatment
biological processes in a WWTP, because this depends on the adaptation to specialcontaminants of the micro-organisms working in the particular plant. Thus, it is BAT to avoidthe introduction of waste water components into biological treatment systems when they couldcause a malfunction of such systems and to treat tributary waste water streams with relevantnon-biodegradable part by adequate techniques.2
• choice 1: techniques that enable substance recovery:- nanofiltration or reverse osmosis- adsorption- extraction- distillation / rectification- evaporation- stripping
• choice 2: abatement techniques without need of additional fuel, when recovery is notfeasible:- chemical oxidation, but care must be taken with chlorine-containing agents- chemical reduction- chemical hydrolysis
• choice 3: abatement techniques entailing considerable energy consumption, when there isno other choice to abate toxicity or inhibitory effects or when the process can beoperated on a self-sustaining basis:- wet air oxidation (low-pressure or high-pressure variant)- waste water incineration
• in cases where water supply and consumption is an environmental issue, techniquesrequiring considerable amounts of cooling water or wet scrubber systems for exhaust airtreatment need to be assessed, such as:
- extraction- distillation / rectification- evaporation- stripping.
Biodegradable waste water can be treated in biological control systems, either as tributarystreams in specially designed (pre)treatment systems, e.g. anaerobic or aerobic high loadsystems, or as mixed waste water in a central biological waste water treatment plant, or as apolishing step behind the central waste water treatment plant. Thus, it is BAT to removebiodegradable substances by using an appropriate biological treatment system (or an appropriatecombination of them), such as:
• biological pretreatment to relieve the final central biological waste water treatment plantfrom high biodegradable load (or as a final polishing step). Appropriate techniques are:- anaerobic contact process- upflow anaerobic sludge blanket process- anaerobic and aerobic fixed-bed process- anaerobic expanded-bed process- complete-mix activated sludge process- membrane bioreactor- trickling (percolating) filter- biofilter fixed-bed process
• nitrification / denitrification when the waste water contains a relevant nitrogen load• central biological treatment, avoiding the introduction of non-biodegradable waste water
pollutants, when they can cause malfunction of the treatment system and when the plant isnot suitable to treat them. In general the BAT-associated emission level for BOD aftercentral biological treatment is < 20 mg/l. In the case of activated sludge a typical applicationis a low-loaded biological stage with a daily COD load of ≤ 0.25 kg/kg sludge.
2 One Member States insists on a more close definition of the criterion ‘relevant non-biodegradable part’. A split view is
reported. Details in Chapter 4.

Executive Summary
Waste Water and Waste Gas Treatment xi
BAT-associated emission levels for the final discharge into areceiving water body 3:
Parameter aPerformance
rates[%]
Emissionlevels
[mg/l] b
TSS 10-20 c
COD 76-96 d 30–250total inorganic N e 5-25total P 0.5-1.5 f
AOXa for BOD see preceding section on central biological treatmentb daily average, exception TSSc monthly averaged low performance rates for low contaminant concentrationse sum of NH4-N, NO2-N and NO3-N (a more recommendable parameter would be total N. Because of the lack of information on total N, total inorganic N is used here)f lower range from nutrient feed in biological WWTP, upper range from production processes
Waste Water Sludge
When waste water sludge is handled on the chemical industry site it is BAT to use one orseveral of the following options (without preference):
• preliminary operations• sludge thickening operations• sludge stabilisation• sludge conditioning• sludge dewatering techniques• drying operations• thermal sludge oxidation• landfilling of sludge on site.
Off-site treatment is not taken into account because it is not within the scope of the document.This is by no means a BAT conclusion against off-site treatment by third-party contractors.
Waste Gas
WASTE GAS COLLECTION SYSTEMS are installed to route gaseous emissions to treatmentsystems. They consist of the emission source enclosure, vents and pipes. It is BAT to:
• minimise the gas flow rate to the control unit by encasing the emission sources as far asfeasible
• prevent explosion risk by:- installing a flammability detector inside the collection system when the risk of
occurrence of a flammable mixture is significant- keeping the gas mixture securely below the lower explosion limit or above the higher
explosion limit• install appropriate equipment to prevent the ignition of flammable gas-oxygen mixtures or
minimise its effects.
3 One Member State insists on also including BAT-associated emission levels for AOX and heavy metals at the final discharge
point. A split view is reported. Details of the state of discussion are given in Chapter 4.

Executive Summary
xii Waste Water and Waste Gas Treatment
The sources of waste gases are distinguished in this document as:
• low-temperature sources, such as production processes, handling of chemicals, work-up ofproducts
• high-temperature sources, such as combustion processes, which include facilities such asboilers, power plants, process incinerators and thermal and catalytic oxidisers.
Low-temperature sources
Pollutants to be controlled in waste gases released from low-temperature sources (productionprocess gases) are dust (particulate matter), VOCs and inorganic compounds (HCl, SO2, NOxetc.).
It is BAT to remove dust/particulate matter from waste gas streams, either as final treatmentor as pretreatment to protect downstream facilities, using material recovery whenever it isfeasible. The energy and water consumption of treatment techniques needs to be borne in mind.Appropriate control techniques are:
• pretreatment techniques with potential recovery:- separator- cyclone- mist filter (also as polishing filter for aerosols and droplets)
• final treatment techniques- wet scrubber- electrostatic precipitator- fabric filter- various high efficiency filters, dependent on kind of particulate matter.
It is BAT to remove VOCs from waste gas streams. The control technique to apply dependsstrongly on the process from which they are released and the degree of hazard they represent.
• choice 1: techniques to recover raw material and/or solvents, often applied as pretreatmentto recover the main VOC load before downstream abatement facilities or toprotect downstream facilities as a safety issue. Appropriate techniques are:- wet scrubbing- condensation- membrane separation- adsorption
or combinations thereof:- condensation / adsorption- membrane separation / condensation
• choice 2: abatement techniques when recovery is not feasible, giving preference to low-energy techniques
• choice 3: combustion techniques (thermal or catalytic oxidation), when other equallyefficient techniques are not available.
When combustion techniques are applied, it is BAT to implement combustion exhaust gastreatment when considerable amounts of exhaust gas contaminants are to be expected.It is further BAT to use flaring only to dispose safely of surplus combustible gases from, e.g.maintenance events, upset systems or remote vents not connected to abatement systems.

Executive Summary
Waste Water and Waste Gas Treatment xiii
For other compounds than VOCs, it is BAT to remove these pollutants, applying theappropriate technique:
• wet scrubbing (water, acidic or alkaline solution) for hydrogen halides, Cl2, SO2, H2S, NH3
• scrubbing with non-aqueous solvent for CS2, COS• adsorption for CS2, COS, Hg• biological gas treatment for NH3, H2S, CS2
• incineration for H2S, CS2, COS, HCN, CO• SNCR or SCR for NOx.
When feasible, recovery techniques are preferred to abatement techniques, e.g.:
• recovery of hydrogen chloride when using water as scrubbing medium in the first scrubbingstage to produce a solution of hydrochloric acid
• recovery of NH3.
The TWG has not been able to come to a conclusion on BAT-associated emission levels forwaste gases from production processes that would apply to the chemical industry as a whole.BAT-associated emission levels for process gases are strongly dependent on the actualproduction process and it was recommended to deal with this subject in the appropriate processBREFs.
High-temperature sources
Pollutants to be controlled in waste gases from high-temperature processes (combustion exhaustgases) are dust (particulate matter), halogen compounds, carbon monoxides, sulphur oxides,NOx and possibly dioxins.
It is BAT to remove dust / particulate matter by the implementation of one of the following:
• electrostatic precipitator• bag filter (after heat exchanger at 120-150 °C)• catalytic filter (comparable conditions as bag filter)• wet scrubbing.
It is BAT to recover HCl, HF and SO2 by using two stage wet scrubbing or to remove them bydry, semi-dry or wet sorption injection, although wet scrubbing is normally the most efficienttechnique for abatement as well as for recovery.
For NOx, it is BAT to implement SCR instead of SCNR (at least for larger installations) becauseit has better removal efficiency and environmental performance. For existing installations whichoperate SNCR devices, the time to consider changing might be when major alterations areplanned for the incineration plant. Although SCR is BAT in the general sense, there areindividual cases (typically smaller installations) where SNCR is the technically andeconomically best solution. Other measures need to be assessed for their ability to delivergreater overall improvement than retrofitting SNCR.

Executive Summary
xiv Waste Water and Waste Gas Treatment
BAT-associated emission levels of combustion exhaust gas treatment
Parameter Emission levels[mg/Nm3] 1
dust <5-15HCl <10HF <1SO2 <40-150 2
NOx (gas boilers/heaters) 20-150 3
NOx (liquid boilers/heaters) 55-300 3
NH3 4 <5 5
dioxins 0.1 ng/Nm3 TEQ1 ½ hourly average, reference oxygen content 3 %2 lower range for gaseous fuel, upper range for liquid fuel3 higher value for small installations using SNCR4 NH3 slip with SCR5 value for new catalysts, but higher NH3 emissions occur as the catalyst ages
CONCLUDING REMARKS AND RECOMMENDATIONS (CHAPTER 6)
There were four split views expressed by one Member State following the second TWGmeeting.
1. they expressed the opinion that the statements on BAT for waste water and waste gasmanagement are partly too general and they refer to examples for streams with higherconcentrations and loads (as mentioned in Section 2.2.2.3.1).
2. they expressed a view that the criterion ‘relevant non-biodegradable part’ needs to be moreclosely defined by giving a set of indicative values for recalcitrant TOC to waste waterstreams.
3. they insist on naming BAT-associated emission levels for heavy metals based on theexamples given in Annex 7.6.4. In their view, when following the strategy of prevention,pretreatment and central treatment as outlined above (see section on heavy metals), it ispossible to name BAT-associated emission values for heavy metals which are valid formany chemical sites. They further state that the values are influenced by the portion ofproductions relevant to heavy metals and hence are dependent on the production mix, whichcan cause higher values in special cases, especially in fine chemicals production. Withregard to releases into public sewerage systems, the effect of the WWTP would have to betaken into account in so far as it would be ensured that the heavy metals are not shifted toother media.The TWG did not follow this request, stating that it would not be useful to name BAT-associated emission levels which are influenced by particular combinations of waste waterstreams on individual production sites, resulting in values which might or might not be validin real-life cases. A split view is therefore recorded.

Executive Summary
Waste Water and Waste Gas Treatment xv
4. they insist on naming BAT-associated emission levels for AOX based on the examplesgiven in Annex 7.6.2. They state that BAT-associated emission levels can be given,although the emission values for AOX are strongly influenced by the portion and kind ofchlororganic syntheses on a chemical site, when waste water treatment is operatedaccording to the BAT-conclusions given above (see section on pollutants unsuitable forbiological treatment).The TWG did not follow this request. The examples presented (see Annex 7.6.2) wereinterpreted as consisting of different statistical data sets which did not allow naming BAT-associated emission levels. It was even mentioned that one of the lowest AOX emissionlevles reported as examples represented poor performance, whereas the highest emissionlevel within the data set came from a site with very good performance. Under theseconditions the TWG saw it to be unsuitable to give BAT-associated emission levels forAOX. A split view is therefore recorded.
The exchange of information itself has been considerably less than complete. It is difficult tounderstand why this should have been so, given the chemical industry’s past efforts andachievements in the management of waste water and waste gas releases. Equally difficult wasthe exchange of information with a number of Member States.
As to reviewing the BREF, the recommendation is to fill the existing gaps. The review shouldwait until all the vertical BREFs in the chemical sector are finalised. For such a review to makesense, however, it will be necessary to focus more on the information that is useful for a permitwriter. Further detail can be found in Chapter 6.
The EC is launching and supporting, through its RTD programmes, a series of projects dealingwith clean technologies, emerging effluent treatment and recycling technologies andmanagement strategies. Potentially these projects could provide a useful contribution to futureBREF reviews. Readers are therefore invited to inform the EIPPCB of any research resultswhich are relevant to the scope of this document (see also the preface of this document).


Preface
Waste Water and Waste Gas Treatment xvii
PREFACE
1. Status of this document
Unless otherwise stated, references to “the Directive” in this document means the CouncilDirective 96/61/EC on integrated pollution prevention and control. As the Directive applieswithout prejudice to Community provisions on health and safety at the workplace, so does thisdocument.
This document forms part of a series presenting the results of an exchange of informationbetween EU Member States and industries concerned on best available technique (BAT),associated monitoring and developments in them. It is published by the European Commissionpursuant to Article 16(2) of the Directive, and must therefore be taken into account inaccordance with Annex IV of the Directive when determining “best available techniques”.
2. Relevant legal obligations of the IPPC Directive and the definition of BAT
In order to help the reader understand the legal context in which this document has been drafted,some of the most relevant provisions of the IPPC Directive, including the definition of the term“best available techniques”, are described in this preface. This description is inevitablyincomplete and is given for information only. It has no legal value and does not in any way alteror prejudice the actual provisions of the Directive.
The purpose of the Directive is to achieve integrated prevention and control of pollution arisingfrom the activities listed in its Annex I, leading to a high level of protection of the environmentas a whole. The legal basis of the Directive relates to environmental protection. Itsimplementation should also take account of other Community objectives such as thecompetitiveness of the Community’s industry thereby contributing to sustainable development.
More specifically, it provides for a permitting system for certain categories of industrialinstallations requiring both operators and regulators to take an integrated, overall look at thepolluting and consuming potential of the installation. The overall aim of such an integratedapproach must be to improve the management and control of industrial processes so as to ensurea high level of protection for the environment as a whole. Central to this approach is the generalprinciple given in Article 3 that operators should take all appropriate preventative measuresagainst pollution, in particular through the application of best available techniques enablingthem to improve their environmental performance.
The term “best available techniques” is defined in Article 2(11) of the Directive as “the mosteffective and advanced stage in the development of activities and their methods of operationwhich indicate the practical suitability of particular techniques for providing in principle thebasis for emission limit values designed to prevent and, where that is not practicable, generallyto reduce emissions and the impact on the environment as a whole.” Article 2(11) goes on toclarify further this definition as follows:
“techniques” includes both the technology used and the way in which the installation isdesigned, built, maintained, operated and decommissioned;
“available” techniques are those developed on a scale which allows implementation in therelevant industrial sector, under economically and technically viable conditions, taking intoconsideration the costs and advantages, whether or not the techniques are used or producedinside the Member State in question, as long as they are reasonably accessible to the operator;
“best” means most effective in achieving a high general level of protection of the environmentas a whole.

Preface
xviii Waste Water and Waste Gas Treatment
Furthermore, Annex IV of the Directive contains a list of “considerations to be taken intoaccount generally or in specific cases when determining best available techniques ... bearing inmind the likely costs and benefits of a measure and the principles of precaution and prevention”.These considerations include the information published by the Commission pursuant toArticle 16(2).
Competent authorities responsible for issuing permits are required to take account of the generalprinciples set out in Article 3 when determining the conditions of the permit. These conditionsmust include emission limit values, supplemented or replaced where appropriate by equivalentparameters or technical measures. According to Article 9(4) of the Directive, these emissionlimit values, equivalent parameters and technical measures must, without prejudice tocompliance with environmental quality standards, be based on the best available techniques,without prescribing the use of any technique or specific technology, but taking into account thetechnical characteristics of the installation concerned, its geographical location and the localenvironmental conditions. In all circumstances, the conditions of the permit must includeprovisions on the minimisation of long-distance or transboundary pollution and must ensure ahigh level of protection for the environment as a whole.
Member States have the obligation, according to Article 11 of the Directive, to ensure thatcompetent authorities follow or are informed of developments in best available techniques.
3. Objective of this Document
Article 16(2) of the Directive requires the Commission to organise “an exchange of informationbetween Member States and the industries concerned on best available techniques, associatedmonitoring and developments in them”, and to publish the results of the exchange.
The purpose of the information exchange is given in recital 25 of the Directive, which statesthat “the development and exchange of information at Community level about best availabletechniques will help to redress the technological imbalances in the Community, will promotethe world-wide dissemination of limit values and techniques used in the Community and willhelp the Member States in the efficient implementation of this Directive.”
The Commission (Environment DG) established an information exchange forum (IEF) to assistthe work under Article 16(2) and a number of technical working groups have been establishedunder the umbrella of the IEF. Both IEF and the technical working groups includerepresentation from Member States and industry as required in Article 16(2).
The aim of this series of documents is to reflect accurately the exchange of information whichhas taken place as required by Article 16(2) and to provide reference information for thepermitting authority to take into account when determining permit conditions. By providingrelevant information concerning best available techniques, these documents should act asvaluable tools to drive environmental performance.
4. Information Sources
This document represents a summary of information collected from a number of sources,including in particular the expertise of the groups established to assist the Commission in itswork, and verified by the Commission services. All contributions are gratefully acknowledged.
5. How to understand and use this document
The information provided in this document is intended to be used as an input to thedetermination of BAT in specific cases. When determining BAT and setting BAT-based permitconditions, account should always be taken of the overall goal to achieve a high level ofprotection for the environment as a whole.

Preface
Waste Water and Waste Gas Treatment xix
The rest of this section describes the type of information that is provided in each section of thedocument.
Chapter 1 provides a general description of waste water and waste gas, including generalinformation on management and treatment systems.
Chapter 2 describes environmental and effluent management and appropriate tools to implementthem.
Chapter 3 provides a description of treatment techniques for waste water and waste gas that arecommon in the chemical sector. The techniques include recovery and abatement processes.Chapters 2 and 3 are the core of this Reference Document to provide the necessary informationto come to the BAT conclusions of Chapter 4.
Chapter 4 presents the techniques and the associated emission levels that are considered to becompatible with BAT in a general sense. In finding the most suitable treatment techniques forspecific situations, the term ‘techniques’ in the context of this horizontal document embracesmore than just technology; it also includes management strategies. The purpose is thus toprovide general indications regarding the emission and consumption levels that can beconsidered as an appropriate reference point to assist in the determination of BAT-based permitconditions or for the establishment of general binding rules under Article 9(8). It should bestressed, however, that this document does not propose emission limit values. Thedetermination of appropriate permit conditions will involve taking account of local, site-specificfactors such as the technical characteristics of the installation concerned, its geographicallocation and the local environmental conditions. In the case of existing installations, theeconomic and technical viability of upgrading them also needs to be taken into account. Eventhe single objective of ensuring a high level of protection for the environment as a whole willoften involve making trade-off judgements between different types of environmental impact,and these judgements will often be influenced by local considerations.
Although an attempt is made to address some of these issues, it is not possible for them to beconsidered fully in this document. The techniques and levels presented in Chapter 4 willtherefore not necessarily be appropriate for all installations. On the other hand, the obligation toensure a high level of environmental protection including the minimisation of long-distance ortransboundary pollution implies that permit conditions cannot be set on the basis of purely localconsiderations. It is therefore of the utmost importance that the information contained in thisdocument is fully taken into account by permitting authorities.
Since the best available techniques change over time, this document will be reviewed andupdated as appropriate. All comments and suggestions should be made to the European IPPCBureau at the Institute for Prospective Technological Studies at the following address:
Edificio Expo, Inca Garcilaso s/n, E-41092 Seville, SpainTelephone: +34 95 4488 284Fax: +34 95 4488 426e-mail: [email protected]: http://eippcb.jrc.es


Waste Water and Waste Gas Treatment xxi
Reference Document on Best Available Techniques in CommonWaste Water and Waste Gas Treatment / Management Systems
in the Chemical Sector
EXECUTIVE SUMMARY ........................................................................................................................ I
PREFACE ............................................................................................................................................XVII
SCOPE............................................................................................................................................... XXVII
1 GENERAL DESCRIPTION .............................................................................................................11.1 Waste Water and Waste Gas in the Chemical Industry .....................................................................1
1.1.1 Waste Water..............................................................................................................................11.1.2 Waste Gas .................................................................................................................................3
1.2 Environmental Management with Regard to Waste Water and Waste Gas ......................................41.3 Treatment Technology ......................................................................................................................6
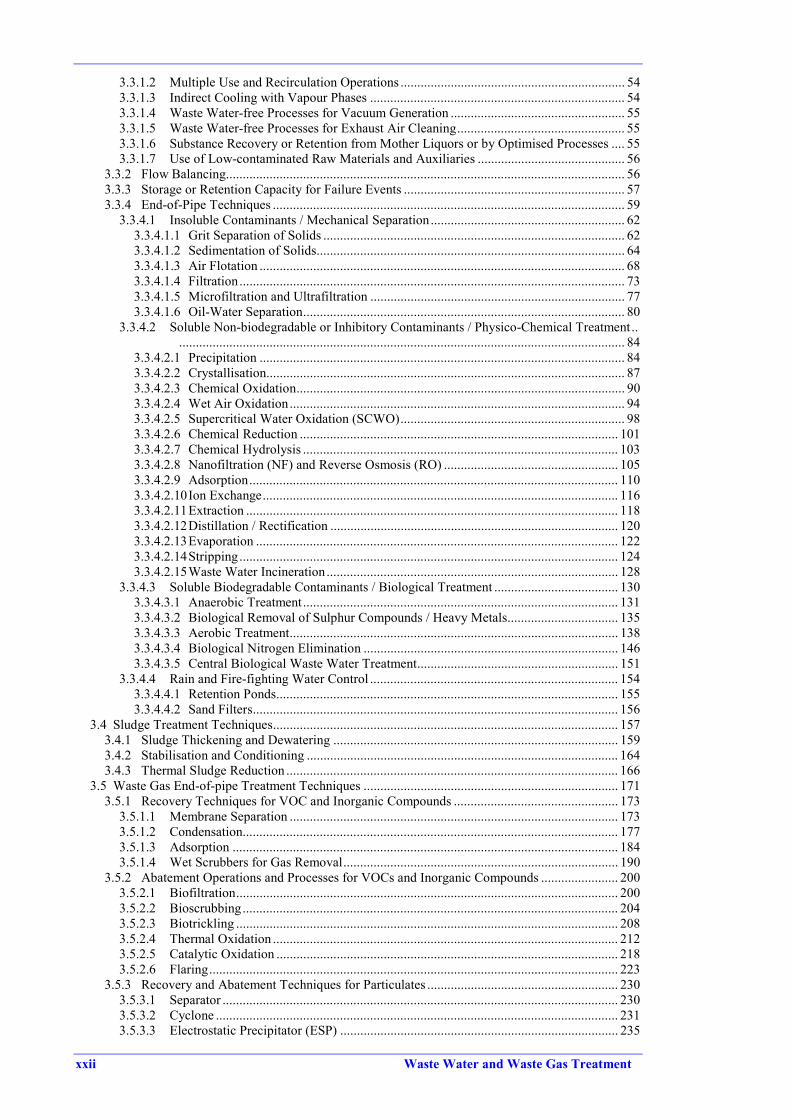
1.3.1 Process-Integrated Measures.....................................................................................................71.3.2 End-of-Pipe Techniques............................................................................................................8
1.3.2.1 Waste Water Treatment....................................................................................................81.3.2.2 Waste Gas Treatment .....................................................................................................10
1.4 Environmental Impact of Waste Water and Waste Gas Treatment and their Interdependencies ....12
2 WASTE WATER/WASTE GAS MANAGEMENT......................................................................152.1 Environmental Management System (EMS) ...................................................................................152.2 Management Tools..........................................................................................................................19
2.2.1 Inventory Management Tools .................................................................................................192.2.1.1 Site Inventory .................................................................................................................192.2.1.2 Stream Inventory or Register..........................................................................................20
2.2.1.2.1 Whole Effluent Assessment (WEA) .........................................................................212.2.1.2.2 Reduction of Water Usage and Waste Water Discharge...........................................252.2.1.2.3 Waste Gas Emission Quantification .........................................................................26
2.2.1.3 Energy and Material Flow Analysis (EMFA) ................................................................282.2.2 Operational Management Tools..............................................................................................29
2.2.2.1 Monitoring......................................................................................................................292.2.2.2 Setting and Regular Review of Internal Targets or Programmes ...................................292.2.2.3 Choice of Treatment Options .........................................................................................31
2.2.2.3.1 Selection of Waste Water Control System................................................................322.2.2.3.2 Selection of Waste Gas Control System ...................................................................36
2.2.2.4 Choice of Collection System ..........................................................................................382.2.2.4.1 Selection of Waste Water Collection and Segregation System.................................382.2.2.4.2 Choice of Waste Gas Collection Systems.................................................................39
2.2.2.5 Implementation of the Selected Emission Control Options............................................402.2.2.6 Quality Control Methods................................................................................................40
2.2.3 Strategic Management Tools ..................................................................................................432.2.3.1 Risk Assessment.............................................................................................................432.2.3.2 Benchmarking ................................................................................................................442.2.3.3 Life Cycle Assessment (LCA)........................................................................................44
2.2.4 Safety and Emergency Tools ..................................................................................................452.2.4.1 Managing Fire-fighting Water and Major Spillages.......................................................452.2.4.2 Pollution Incident Response Planning............................................................................47
3 APPLIED TREATMENT TECHNOLOGY..................................................................................493.1 Information Presented in this Chapter .............................................................................................493.2 Information on Costs in this Horizontal Document.........................................................................50
3.2.1 Total Installed Costs vs Supplier Equipment Costs ................................................................503.2.2 Greenfield Costs vs Retrofitting Costs....................................................................................513.2.3 Capital Costs vs Operating Costs............................................................................................523.2.4 Initial Emission Control Costs vs Incremental Control Costs.................................................53
3.3 Waste Water Treatment Techniques................................................................................................533.3.1 Process-Integrated Measures...................................................................................................53
3.3.1.1 Counter-current Extraction as an Example of Water-saving Processes..........................53
xxii Waste Water and Waste Gas Treatment
3.3.1.2 Multiple Use and Recirculation Operations ................................................................... 543.3.1.3 Indirect Cooling with Vapour Phases ............................................................................ 543.3.1.4 Waste Water-free Processes for Vacuum Generation .................................................... 553.3.1.5 Waste Water-free Processes for Exhaust Air Cleaning.................................................. 553.3.1.6 Substance Recovery or Retention from Mother Liquors or by Optimised Processes .... 553.3.1.7 Use of Low-contaminated Raw Materials and Auxiliaries ............................................ 56
3.3.2 Flow Balancing....................................................................................................................... 563.3.3 Storage or Retention Capacity for Failure Events .................................................................. 573.3.4 End-of-Pipe Techniques ......................................................................................................... 59
3.3.4.1 Insoluble Contaminants / Mechanical Separation.......................................................... 623.3.4.1.1 Grit Separation of Solids .......................................................................................... 623.3.4.1.2 Sedimentation of Solids............................................................................................ 643.3.4.1.3 Air Flotation ............................................................................................................. 683.3.4.1.4 Filtration................................................................................................................... 733.3.4.1.5 Microfiltration and Ultrafiltration ............................................................................ 773.3.4.1.6 Oil-Water Separation................................................................................................ 80
3.3.4.2 Soluble Non-biodegradable or Inhibitory Contaminants / Physico-Chemical Treatment....................................................................................................................................... 84
3.3.4.2.1 Precipitation ............................................................................................................. 843.3.4.2.2 Crystallisation........................................................................................................... 873.3.4.2.3 Chemical Oxidation.................................................................................................. 903.3.4.2.4 Wet Air Oxidation.................................................................................................... 943.3.4.2.5 Supercritical Water Oxidation (SCWO)................................................................... 983.3.4.2.6 Chemical Reduction ............................................................................................... 1013.3.4.2.7 Chemical Hydrolysis .............................................................................................. 1033.3.4.2.8 Nanofiltration (NF) and Reverse Osmosis (RO) .................................................... 1053.3.4.2.9 Adsorption.............................................................................................................. 1103.3.4.2.10Ion Exchange.......................................................................................................... 1163.3.4.2.11Extraction ............................................................................................................... 1183.3.4.2.12Distillation / Rectification ...................................................................................... 1203.3.4.2.13Evaporation ............................................................................................................ 1223.3.4.2.14Stripping................................................................................................................. 1243.3.4.2.15Waste Water Incineration....................................................................................... 128
3.3.4.3 Soluble Biodegradable Contaminants / Biological Treatment ..................................... 1303.3.4.3.1 Anaerobic Treatment.............................................................................................. 1313.3.4.3.2 Biological Removal of Sulphur Compounds / Heavy Metals................................. 1353.3.4.3.3 Aerobic Treatment.................................................................................................. 1383.3.4.3.4 Biological Nitrogen Elimination ............................................................................ 1463.3.4.3.5 Central Biological Waste Water Treatment............................................................ 151
3.3.4.4 Rain and Fire-fighting Water Control .......................................................................... 1543.3.4.4.1 Retention Ponds...................................................................................................... 1553.3.4.4.2 Sand Filters............................................................................................................. 156
3.4 Sludge Treatment Techniques....................................................................................................... 1573.4.1 Sludge Thickening and Dewatering ..................................................................................... 1593.4.2 Stabilisation and Conditioning ............................................................................................. 1643.4.3 Thermal Sludge Reduction ................................................................................................... 166
3.5 Waste Gas End-of-pipe Treatment Techniques ............................................................................ 1713.5.1 Recovery Techniques for VOC and Inorganic Compounds ................................................. 173
3.5.1.1 Membrane Separation .................................................................................................. 1733.5.1.2 Condensation................................................................................................................ 1773.5.1.3 Adsorption ................................................................................................................... 1843.5.1.4 Wet Scrubbers for Gas Removal.................................................................................. 190
3.5.2 Abatement Operations and Processes for VOCs and Inorganic Compounds ....................... 2003.5.2.1 Biofiltration.................................................................................................................. 2003.5.2.2 Bioscrubbing................................................................................................................ 2043.5.2.3 Biotrickling .................................................................................................................. 2083.5.2.4 Thermal Oxidation ....................................................................................................... 2123.5.2.5 Catalytic Oxidation ...................................................................................................... 2183.5.2.6 Flaring.......................................................................................................................... 223
3.5.3 Recovery and Abatement Techniques for Particulates ......................................................... 2303.5.3.1 Separator ...................................................................................................................... 2303.5.3.2 Cyclone ........................................................................................................................ 2313.5.3.3 Electrostatic Precipitator (ESP) ................................................................................... 235

Waste Water and Waste Gas Treatment xxiii
3.5.3.4 Wet Dust Scrubber .......................................................................................................2403.5.3.5 Fabric Filter ..................................................................................................................2463.5.3.6 Catalytic Filtration........................................................................................................2503.5.3.7 Two-Stage Dust Filter ..................................................................................................2533.5.3.8 Absolute Filter (HEPA-Filter) ......................................................................................2563.5.3.9 High Efficiency Air Filter (HEAF) ..............................................................................2583.5.3.10 Mist Filter .....................................................................................................................259
3.5.4 Recovery and Abatement Techniques for Gaseous Pollutants in Exhaust Gases .................2613.5.4.1 Sorbent Injection as FGD Techniques..........................................................................2623.5.4.2 Selective Reduction of NOx (SNCR and SCR) ............................................................268
4 BEST AVAILABLE TECHNIQUES FOR WASTE WATER / WASTE GAS TREATMENT /MANAGEMENT IN THE CHEMICAL SECTOR ....................................................................271
4.1 Introduction ...................................................................................................................................2714.2 General BAT .................................................................................................................................2734.3 Specific BAT.................................................................................................................................276
4.3.1 Waste Water Section.............................................................................................................2764.3.2 Waste Gas Section ................................................................................................................295
5 EMERGING TECHNIQUES........................................................................................................305
6 CONCLUDING REMARKS.........................................................................................................307
REFERENCES .......................................................................................................................................311
7 ANNEXES.......................................................................................................................................3217.1 Annex I. Joint Operation of Industrial and Municipal WWTP......................................................3217.2 Annex II. Example of EFMA: Pinch Technology .........................................................................3227.3 Annex III. Monitoring of a Central Biological WWTP.................................................................3277.4 Annex IV. Monitoring Standards ..................................................................................................3287.5 Annex V. Pollution Incident Response Plan .................................................................................3327.6 Annex VI. Examples of Waste Water and Waste Gas Treatment .................................................333
7.6.1 Technical Information on Waste Water Treatment Plants (Examples).................................3337.6.2 Information on Waste Water Discharges (Examples)...........................................................3387.6.3 Information on Complete-Site Waste Water Treatment Systems (Examples) ......................3417.6.4 Examples of Heavy Metal Discharges ..................................................................................3457.6.5 Examples of Waste Gas Treatment Plants ............................................................................348
7.7Annex VII. Member States’ Legislation on Waste Water and Waste Gas in the Chemical Sector.....................................................................................................................................................350
GLOSSARY OF TERMS AND ABBREVIATIONS...........................................................................435

xxiv Waste Water and Waste Gas Treatment
List of figures
Figure 1.1: Waste Water Handling Techniques ........................................................................................... 6Figure 1.2: Waste Gas Handling Techniques ............................................................................................... 6Figure 2.1: The Environmental Management System (EMS) Loop........................................................... 16Figure 2.2: Strategy of a Site-Oriented EMS ............................................................................................. 17Figure 2.3: Complexity of a Site-Oriented EMS........................................................................................ 18Figure 2.4: General Procedure to reduce Water Consumption and Waste Water Arising.......................... 26Figure 2.5: Decision Diagram for Appropriate Waste Water Control System........................................... 33Figure 2.6: Cause Effect Diagram of Poor Quality Effluent ...................................................................... 42Figure 3.1: Self-Contained Buffer with Alternative Filling ....................................................................... 58Figure 3.2: Connected Buffer, Discontinuously Flooded........................................................................... 58Figure 3.3: Connected Buffer, Continuously Flooded ............................................................................... 59Figure 3.4: Leakage Buffer System............................................................................................................ 59Figure 3.5: Range of Waste Water Treatment Techniques in Relation to Type of Contaminants ............. 60Figure 3.6: Channel-Shaped Horizontal-Flow Grit Chamber .................................................................... 62Figure 3.7: Circular Grit Chamber ............................................................................................................. 62Figure 3.8: Aerated Grit Chamber.............................................................................................................. 63Figure 3.9: Sedimentation or Settler Tank ................................................................................................. 65Figure 3.10: Hopper Bottom Tank ............................................................................................................. 65Figure 3.11: Lamina or Tube Settler .......................................................................................................... 66Figure 3.12: DAF System: ......................................................................................................................... 69Figure 3.13: Comparison of Separation Efficiency of DAF versus Sedimentation ................................... 70Figure 3.14: Conventional Downflow Multi-Medium Sandfilter .............................................................. 74Figure 3.15: Pressure Filter ........................................................................................................................ 74Figure 3.16: Rotary Vacuum Filter ............................................................................................................ 75Figure 3.17: American Petroleum Institute Separator (API Separator)...................................................... 81Figure 3.18: Parallel Plate Interceptor (PPI) .............................................................................................. 82Figure 3.19: Corrugated Plate Interceptor (CPI) ........................................................................................ 82Figure 3.20: Principle of Crystallisation Process ....................................................................................... 87Figure 3.21: Multi Purpose Application of Crystallisation in a Chemical Production............................... 88Figure 3.22: Flow Diagram of a Loprox Facility ....................................................................................... 95Figure 3.23: Simplified Flowsheet of the SCWO Process ......................................................................... 99Figure 3.24: RO Arrangement.................................................................................................................. 107Figure 3.25: Operation of 2 Adsorption Columns Connected in Series ................................................... 111Figure 3.26: Stripping of Ammonia, Air and Steam Stripping ................................................................ 125Figure 3.27: Carbon Balances in the Aerobic (A) and Anaerobic (B) Microbiological Degradation of
Organic Compounds............................................................................................................. 131Figure 3.28: Anaerobic Contact Process .................................................................................................. 132Figure 3.29: Schematic Representation of the UASB Process................................................................. 132Figure 3.30: Schematic Presentation of a Two-Stage Anaerobic Treatment Process............................... 133Figure 3.31: Process Diagram of Biological Metal and Sulphate Reducing Plant ................................... 136Figure 3.32: Example of Tower Biology.................................................................................................. 140Figure 3.33: Variants of Membrane Bioreactor, compared with Conventional Activated Sludge Process
.............................................................................................................................................. 141Figure 3.34: Schematic View of a Trickling Filter................................................................................... 141Figure 3.35: Biofilter Process in Comparison to Conventional Activated Sludge Process ...................... 142Figure 3.36: Nitrification/Denitrification in Series .................................................................................. 149Figure 3.37: Nitrification/Denitrification with Denitrification as First Stage .......................................... 149Figure 3.38: Example of a Central WWTP (Mechanical-Biological-Chemical)...................................... 152Figure 3.39: Centrifugal Sludge Thickener .............................................................................................. 159Figure 3.40: DAF Thickener for Waste Activated Sludge ....................................................................... 160Figure 3.41: Belt Filter Press ................................................................................................................... 160Figure 3.42: Fixed Volume Recessed Plate Filter Press........................................................................... 161Figure 3.43: Fluidised-Bed Incinerator [cww/tm/4]................................................................................. 167Figure 3.44: Deep-Shaft Oxidation Reactor [cww/tm/4] ......................................................................... 168Figure 3.45: Range of Waste Gas End-of-pipe Treatment Techniques in Relation to Type of Contaminants
.............................................................................................................................................. 171Figure 3.46: Typical Membrane Capillary Module.................................................................................. 173Figure 3.47: Schematic Sketch of a Common Membrane Separation Facility......................................... 174Figure 3.48: Application of a Membrane Separation Process as Vapour Recovery Unit (VRU)............. 175Figure 3.49: Two-Stage Condensation System ........................................................................................ 178

Waste Water and Waste Gas Treatment xxv
Figure 3.50: Cryogenic Condensation Recovery System Integral with a Typical Nitrogen BlanketingOperation ..............................................................................................................................178
Figure 3.51: Cryogenic Recovery System under Inert Atmosphere .........................................................179Figure 3.52: Typical Closed-cycle Inert Gas Condensation System.........................................................180Figure 3.53: Typical Twin Bed Adsorption Process.................................................................................184Figure 3.54: Fluidised-Bed Adsorption ....................................................................................................185Figure 3.55: Continuous Moving Bed Adsorption and Desorption ..........................................................186Figure 3.56: Moving-bed Scrubber...........................................................................................................191Figure 3.57: Packed-bed Scrubber............................................................................................................192Figure 3.58: Impingement Plate Scrubber ................................................................................................193Figure 3.59: Spray Tower, (a) Counter-Current, (b) Co-Current..............................................................194Figure 3.60: Typical Absorption / Desorption System .............................................................................195Figure 3.61: Biofilter Construction...........................................................................................................200Figure 3.62: Typical Biofilter Process......................................................................................................201Figure 3.63: Typical Bioscrubber .............................................................................................................204Figure 3.64: Typical Bioscrubbing Process..............................................................................................205Figure 3.65: Flow Sheet of Biotrickling Process ......................................................................................208Figure 3.66: Typical Biotrickling Facility ................................................................................................209Figure 3.67: Schemes of Various Regenerative Combustion Systems .....................................................213Figure 3.68: Principle of Catalytic Oxidation...........................................................................................218Figure 3.69: Regenerative Catalytic Oxidiser...........................................................................................220Figure 3.70: Typical Elevated Flare System [cww/tm/143] .....................................................................223Figure 3.71: Principal Components of the Enclosed Burner ....................................................................224Figure 3.72: Injector Rod Flare ................................................................................................................225Figure 3.73: Shielded Flare ......................................................................................................................226Figure 3.74: Muffle Flare .........................................................................................................................226Figure 3.75: Reverse Flow Cyclone .........................................................................................................232Figure 3.76: Straight Through Cyclone ....................................................................................................232Figure 3.77: Wire-Plate ESP ....................................................................................................................236Figure 3.78: Wire-Pipe ESP .....................................................................................................................236Figure 3.79: Schematic Diagram of Single-Stage and Two-Stage ESP....................................................237Figure 3.80: Impingement Entrainment Scrubber ....................................................................................241Figure 3.81: Venturi Scrubber ..................................................................................................................242Figure 3.82: Catalytic Filter Baghouse, including Sampling Trains.........................................................251Figure 3.83: Two-stage Dust Filter...........................................................................................................253Figure 3.84: Metal Mesh Filter With Recaking Process...........................................................................254Figure 3.85: Dry Sorbent Injection for Sulphur Dioxide Removal (Injection Positions) .........................262Figure 3.86: Spray or Semi-dry FGD System...........................................................................................263Figure 3.87: Wet FGD System: Lime Milk Scrubber...............................................................................264Figure 4.1: Decision Pathway for Waste Water Treatment on a Chemical Industry Site: Basis for BAT
Conclusions...........................................................................................................................278Figure 7.1: Cooperation Between an Industrial and a Municipal WWTP: Situation Before ....................323Figure 7.2: Cooperation Between an Industrial and a Municipal WWTP: New Situation .......................324Figure 7.3: Pinch Technology – Analysis, Source and Sink Curves ........................................................325Figure 7.4: Example of Water Conservation Strategy before and after Pinch Analysis ...........................326Figure 7.5: Situation of Complex-site Chemical Production (Example XXI) ..........................................342Figure 7.6: Central Waste Water Treatment for a Chemical Site Producing Pharmaceuticals, Pesticides
..............................................................................................................................................344

xxvi Waste Water and Waste Gas Treatment
List of tables
Table 1.1: Major Waste Water Contaminants and their Respective Treatment Techniques ........................ 8Table 1.2: Selection of Techniques for Waste Gas Emission Reduction in Relation to the Pollutant to be
removed.................................................................................................................................. 11Table 1.3: Selection of Techniques for Waste Gas Emission Reduction in Relation to Waste Gas Flow
Rate ........................................................................................................................................ 12Table 1.4: Potential Impact of Waste Water Treatment Facilities.............................................................. 13Table 1.5: Potential Impact of Waste Gas Treatment Facilities ................................................................. 13Table 3.1: Example of Costs of an Actual Project ..................................................................................... 51Table 3.2: Removal of Waste Water Contaminants under Influence of Coagulation ................................ 64Table 3.3: Characteristics of Microfiltration (MF) and Ultrafiltration (UF) .............................................. 77Table 3.4: COD Elimination of Various Substances as a Function of H2O2 Utilisation [cww/tm/132]..... 92Table 3.5: Characteristics of Nanofiltration (NF) and Reverse Osmosis (RO) ........................................ 105Table 3.6: Commonly Used Adsorbents and their Properties .................................................................. 110Table 3.7: Typical Performance Characteristics of GAC Adsorption with Feed Concentrations of about
1000 mg/l.............................................................................................................................. 113Table 3.8: Specific Process Parameters normally associated with Anaerobic, Anoxic and Aerobic Biology
.............................................................................................................................................. 130Table 3.9: Threshold Concentration of Representative Substances Toxic to Activated Sludge............... 139Table 3.10: Comparison of the Volumetric Loads Treated by Various Aerobic Processes ..................... 143Table 3.11: Substantial Inhibitors to Nitrification.................................................................................... 148Table 3.12: Typical Lime Dosages for Stabilising Liquid Sludge ........................................................... 165Table 3.13: Typical Levels of Polymer Addition for Various Types of Sludge and for Various Methods of
Dewatering ........................................................................................................................... 166Table 3.14: Typical Bioscrubber Applications......................................................................................... 206Table 3.15: Types of Burner .................................................................................................................... 214Table 3.16: Application and Application Limits and Restrictions of Different Wet Dust Scrubbers ...... 243Table 3.17: Performance Rates, Consumables and Costs of the Wet Dust Scrubber Variants ................ 245Table 3.18: Commonly Used Fabrics....................................................................................................... 246Table 3.19: Dry Sorption Performance Rates for Lime as Sorbent with Different Temperatures and Dust
Abatement Systems .............................................................................................................. 266Table 3.20: Dry Sorption SOx Abatement Rates for Lime with Different Temperature Ranges and Ca/S
Molar Ratios......................................................................................................................... 266Table 3.21: Semi-dry Sorption SOx Abatement Rates for Lime with Different Ca/S Molar Ratios ........ 266Table 3.22: Abatement Rates for Dry and Semi-dry Sorption with Sodium Carbonate........................... 266Table 4.1: Rainwater Treatment Techniques as Described in Chapter 3 ................................................. 280Table 4.2: BAT-associated Emission Levels for Free Oil / Hydrocarbons Discharged into a Receiving
Water .................................................................................................................................... 281Table 4.3: Treatment Techniques Associated with BAT for Suspended Solids....................................... 283Table 4.4: Treatment Techniques Associated with BAT for Heavy Metals............................................. 285Table 4.5: Treatment Techniques Associated with BAT for Inorganic Salts (Heavy Metals not Included)
.............................................................................................................................................. 286Table 4.6: Treatment Techniques Associated with BAT for Contaminants Unsuitable for Biological
Treatment ............................................................................................................................. 289Table 4.7: Treatment Techniques Associated With BAT for Biological Treatment Techniques............. 292Table 4.8: BAT-associated Emission Levels for Final Waste Water Discharge into a Receiving Water 293Table 4.9: Treatment Techniques Associated With BAT for Particulate Treatment from Normal Waste
Gas Streams.......................................................................................................................... 299Table 4.10: Treatment Techniques Associated With BAT for Treatment of VOC and Inorganic
Compounds from Normal Waste Gas Streams..................................................................... 301Table 4.11: BAT-associated Emission Levels and Performance Rates for Combustion Exhaust Gas
Treatment in the Chemical Sector ........................................................................................ 303Table 7.1: Monitoring of a WWTP .......................................................................................................... 327Table 7.2: Waste Water Flows and Treatment Details on Complex Chemical Site (Example XXI) ....... 342Table 7.3: Emission Levels of Heavy Metals at the Final Discharge Point ............................................. 347

Scope
Waste Water and Waste Gas Treatment xxvii
SCOPE
This horizontal BAT Reference Document (BREF), entitled “Common Waste Water and WasteGas Treatment/Management Systems in the Chemical Sector” (CWW), covers the entirechemical sector and is intended as support and guidance to a regulator reaching a decision on apermit relating to aqueous and/or gaseous releases from chemical installations. It is one of aseries of BREFs relating to the chemical industry, all of which are designed to be read together.They are:
• Chlor-Alkali Manufacture• Large Volume Organic Chemicals (LVOC)• Large Volume Inorganic Chemicals (LVIC)• Polymers• Organic Fine Chemicals (OFC)• Speciality Inorganic Chemicals (SIC)
and the horizontal BREFs
• Industrial Cooling Systems• Emissions from Storage of Bulk or Dangerous Materials• Monitoring Systems• Economic and Cross-media Issues.
The refinery industry also sees this BREF as relevant to the refinery sector.
Since there are numerous options for waste water and/or waste gas treatment in the chemicalindustry, this document must restrict itself to those techniques that are ‘commonly’ used orapplicable in the sector. Even with this restriction the BREF can deal with only some of thetechniques used. This means that treatment methods applied at only one site and/or designedonly for one special production process are not covered by this document. They fall within thescope of appropriate vertical documents. On the other hand, treatment techniques that have notyet been operated in the chemical industry, but that are successfully in use in other sectors, arecovered when they are expected to be usefully applicable.
Process-integrated techniques are touched on in this document when they can be used in severalprocesses, or when their application is generally acknowledged. Typically site-specific orprocess-specific issues concerning waste water / waste gas treatment are not covered here butare considered in a general approach explaining how to deal with specific conditions.
Another main topic in this Reference Document is waste water and waste gas management aspart of operational management. Management means the adaption of local conditions (such asproduction specifics, legislation, local environmental situation, availability and quality of rawmaterial and/or auxiliaries and climate issues) to the economically and ecologically efficientrunning of an industry site as a whole. The task of this document is to describe the approach orapproaches to making management decisions to minimise the overall environmental impact ofwaste water and waste gas emissions.
The term ‘impact on the environment’ as used throughout this BREF includes, e.g.:
• resource consumption such as water from natural water bodies, energy, raw material,chemical substances, etc.; this is of greater significance when limited resources areinvolved, e.g. water under unfavourable climatic conditions or non-renewable energy
• emissions to water and/or air, including noise and odour• generation of waste• emissions arising from events such as start-up / shutdown.

Scope
xxviii Waste Water and Waste Gas Treatment
The organisation of the disposal of sludge or solid residues from waste water and waste gastreatment is part of the operator’s decision for a chemical site. Since there are sites that areequipped with appropriate treatment facilities for waste water sludge, its treatment is dealt within this document. The treatment of waste apart from waste water sludge is within the scope ofother vertical documents for other sectors of Annex 1 of the Directive. This BREF, however,will not anticipate the BREF on waste incineration, which is still to be written.
To avoid as far as possible duplication of work and overlap of topics with the relevant verticaland horizontal BREFs, boundaries need to be drawn. As an example, the boundary between thevertical chemical BREFs and this horizontal document is explained for the waste water part byFigure I, with a comparable situation for the waste gas part.
ChemicalReaction
Work-up
ProductIsolation
Recovery
AqueousResidue
TributaryStream
Treatment
Waste Water
CentralTreatmentSystems
ReactionMixture
Auxiliaries,Solvents,Water
Product
PRODUCTION
CONTROL
horizontal
vertical
Figure I: Borderline between Relevance to Production and Control, or between Vertical andHorizontal BREF

Scope
Waste Water and Waste Gas Treatment xxix
Thus, the scope of this horizontal Reference Document comprises:
• the presentation of environmental management concerning waste water and waste gas andhow to apply it to a site in the most advantageous way for the environment
• the description of generally applicable process-integrated measures (i.e. applicable with anidentical purpose in distinct production processes)
• the description of treatment techniques applied to waste water and waste gas with regard totheir impact on the environment, their treatment efficiency/performance, their limitationsand advantages, and their costs
• the description of treatment techniques for waste water sludge, as far as they are operatedon chemical sites
• based on the information given above, the description of schemes with options to ensurethat waste water and waste gas treatment techniques and/or combinations thereof contributeto the application of BAT to the operation of a chemical site as a whole.
Illustrative examples naming achievable performance data to support the BAT conclusion arenot meant to imply that the stated values can be achieved with each individual application underall working conditions, but that recommendations or proposals given are generally valid.
The document is particularly valid for the chemical sector. It is, however, recognised by theTWG that the items described - management systems and tools, waste water and waste gastreatment techniques - contain valuable information for other sectors too. But the application ofthis information by other sectors needs careful assessment in each case.


Chapter 1
Waste Water and Waste Gas Treatment 1
1 GENERAL DESCRIPTION
General scientific laws such as chemical and/or physical equilibrium make the occurrence ofwaste inevitable during chemical processes (syntheses), so that unwanted by-products have tobe expelled. The character and scale of these emissions are highly variable and depend on thecomposition of raw materials, products, intermediates, auxiliaries, process conditions, etc.
The waste occurring during these processes can be divided into:
• waste water• waste gas• liquid and solid residues.
Liquid (non-aqueous) and solid residues originating from chemical production and producthandling are to be dealt with separately – usually in vertical BREFs – and are not the subject ofthis document.
Chapter 1 gives an overview of the general aspects of:
• waste water and waste gas• environmental management• treatment technology• environmental impact of waste water and waste gas treatment,
without going into specifics.
1.1 Waste Water and Waste Gas in the Chemical Industry
1.1.1 Waste Water
From the qualitative point of view, the majority of waste water in the chemical industry doesnot usually originate directly from chemical reaction steps. Though waste water can arisedirectly from reactions, e.g. as condensate or reaction water, the aqueous discharges fromsubsequent physico-chemical work-up of synthesis mixtures are generally greater. Productsand/or intermediates from each synthesis or each synthesis stage are isolated and purified byoperations such as filtration and centrifugation from aqueous reaction solutions, or by work-upof reaction mixtures via, e.g., extraction or distillation.
Such waste water streams arising in direct association with chemical syntheses – ‘processwater’ – are, for example:
• mother liquors• washing water from purification of products• vapour condensates• quench water• waste water from exhaust air / flue gas clean-up• waste water from equipment cleaning• waste water from vacuum generation.
Tributary waste water streams from other on-site sources, such as:

Chapter 1
2 Waste Water and Waste Gas Treatment
• scrubbing of exhaust gases from incineration and combustion• conditioning of utility water• bleed from boiler feed water systems (probably containing corrosion inhibitors, biocides,
scale)• blowdown from cooling cycles• back-washing of filters• laboratory and pilot-scale plants• workshops• sanitation waste water collection• collection of rainwater from contaminated areas• landfill leachates,
contribute to the overall water pollution as well. So waste water generally contains ascontaminants almost every compound present or arising during the reaction, such as:
• non-reacted starting material• production residues• auxiliaries, to the extent that they are not recovered from the aqueous discharges• intermediate compounds• unwanted by-products.
If syntheses are carried out using organic solvents and other auxiliaries, these regularly make upthe majority of the organic pollutant load emitted to the waste water treatment facilities. On theother hand, by-products and starting compounds can often be responsible for the poorlybiodegradable part of the total waste water load.
The majority of process waste water (70–90 %) consists of tributary streams with a lowpollution level [cww/tm/82], e.g.:
• cleaning water• waste water from vacuum generation• washing water from exhaust air clean-up• waste water originating from equipment such as product pumps.
Tributary streams such as mother liquors, initial aqueous discharges, blowdown from cleaningcycles and vapour condensates make up the remaining 10–30 % [cww/tm/82].
When considering pollution loads, the ratio is reversed. The more highly concentrated tributarywaste water streams (10–30 % of the total waste water) generally contain up to 90 % of therelevant contaminant loads [cww/tm/82].
The consequences of contaminants of complex waste water streams, however, are notsufficiently expressed by their loads or concentrations. The impact of hazardous and toxiccontaminants with concentrations close to the detection limit can be significant in contrast tohigh concentrations of non-toxic substances. Thus, waste water from chemical industry sitesmight show toxic effects. Alternatively, synergetic effects of different individual streams,having no toxic effects themselves, might be observed when they are mixed together either inthe sewerage system or in the receiving water.

Chapter 1
Waste Water and Waste Gas Treatment 3
Waste water and its impact on the environment are normally characterised by:
• the content and emission of pollutants, expressed by load and/or concentration of singlesubstances, such as NH4
+-ions, NO3--ions, NO2
--ions, PO43--ions, each of the heavy metals,
inorganic acids and salts, oil• the effect and/or hazardous potential on the receiving water body, expressed by surrogate or
sum parameters such as TSS, BOD, COD, AOX/EOX, VOX, pH, conductivity andtemperature
• the effect on organisms in the receiving water, expressed by toxicity data such as acutetoxicity, chronic toxicity or mutagenity
• properties such as hydraulic load.
1.1.2 Waste Gas
Waste gas streams can roughly be divided into ducted and non-ducted (diffuse, fugitive)emissions. Only ducted emissions can be treated. As far as diffuse and fugitive emissions areconcerned the objective of waste gas management is their prevention and/or minimisation (e.g.by capturing them in a ducted system).
Waste gas and exhaust air emissions in the chemical industry are:
• ducted emissions, such as:- process emissions released through a vent pipe by the process equipment and inherent
to the running of the plant- flue gases from energy-providing units, such as process furnaces, steam boilers,
combined heat and power units, gas turbines, gas engines- waste gases from emission control equipment, such as filters, incinerators or adsorbers,
likely to contain unabated pollutants or pollutants generated in the abatement system- tail gases from reaction vessels and condensers- waste gases from catalyst regeneration- waste gases from solvent regeneration- waste gases from vents from storage and handling (transfers, loading and unloading) of
products, raw materials and intermediates- waste gases from purge vents or pre-heating equipment, which are used only on start-up
or shutdown operations- discharges from safety relief devices (e.g. safety vents, safety valves)- exhaust from general ventilation system- exhaust from vents from captured diffuse and/or fugitive sources, e.g. diffuse sources
installed within an enclosure or building.
• diffuse emissions (see Glossary), arising from point, linear, surface or volume sources undernormal operating circumstances [cww/tm/158]:- process emissions from the process equipment and inherent to the running of the plant,
released from a large surface or through openings, etc.- non-ducted emissions (e.g. working losses and breathing losses, when not captured and
ducted) from storage equipment and during handling operations (e.g. filling of drums,trucks or containers)
- non-routine emissions, resulting from operations other than the routine processing ofthe facility, including emissions during start-up or shutdown, and during maintenance
- emissions from flares- secondary emissions, resulting from the handling or disposal of waste (e.g. volatile
material from sewers, waste water handling facilities or cooling water).
• fugitive emissions (see Glossary), such as:- equipment leaks from pump and compressor seals, valves, flanges, connectors and other
piping items, or other equipment items, such as drain or vent plugs or seals.

Chapter 1
4 Waste Water and Waste Gas Treatment
The main air pollutants from chemical processes and energy supply are:
• carbon dioxide• sulphur oxides (SO2, SO3) and other sulphur compounds (H2S, CS2, COS)• nitrogen oxides (NOx, N2O) and other nitrogen compounds (NH3, HCN)• halogens and their compounds (Cl2, Br2, HF, HCl, HBr)• incomplete combustion compounds, such as CO and CxHy
• volatile organic compounds (VOC) and organosilicon compounds, which might encompasscompounds with carcinogenic potential
• particulate matter (such as dust, soot, alkali, heavy metals) with possible carcinogenicproperties.
1.2 Environmental Management with Regard to Waste Waterand Waste Gas
Environmental management as part of the overall management system is becoming increasinglyimportant. It includes the organisational structure, responsibilities, practices, procedures,processes and resources to develop, implement, achieve, review and monitor the environmentalpolicy of the industrial company. With regard to waste water and waste gas it sets the rules forthe involvement in concept finding, planning, evaluation, design, construction, operation andmaintenance of a chemical site, i.e. a strategy to meet all objectives connected with waste waterand/or waste gas. It gives assistance to, e.g.:
• consideration of possible environmental impact when planning new production lines, orplanning enlargement of existing lines
• decisions on the planned production process• decisions on the implementation of process-integrated measures• decisions on the production path• decisions on the choice of the discharge path• decision on the implementation of central or decentralised treatment or control• decisions on the method for minimising contamination• decisions on the creation of an appropriate infrastructure, or the alteration of an existing
one, for the purposes of improving waste water and/or waste gas quality• evaluation of the cross-media effects of the different treatment strategies• decisions on the prevention of fugitive emissions by replacing or modifying older
equipment which tends to have a high leakage rate• decisions on the implementation of a Leak Detection and Repair (LDAR) programme.
As can be seen from the few examples above, the rationale of environmental management hasmuch to do with decision making between several options in light of the particular situation.And it has – of course – to do with economics and competitiveness. The main questionenvironmental management helps to answer is: How can one operate a complex site and manageits demands for a supply of resources and discharge of waste with the least possible impact onthe environment as a whole, with the highest economic efficiency and without any loss ofproduct quality? Answering this question is one of the issues in Chapter 4 on BAT conclusions.
To keep the environmental impact caused by waste water and/or waste gas to a minimum, anoverall and integrated environmental strategy should be developed by operators. It is importantfor this strategy to reflect the following items:
• Water is increasingly becoming a valuable resource, and recycling of treated effluent water,when possible and necessary in special situations, is of increasing importance. Thus, thepurpose of effluent treatment is to achieve recycling or water recovery, as well as toimprove discharge quality. The result of such an overall waste water strategy might be, inthe final analysis, site-specific, applicable only to this particular situation. The approach tothis result, however, normally follows the pathway described in Chapters 2 and 4.

Chapter 1
Waste Water and Waste Gas Treatment 5
• Though air is not a diminishing resource, its purity is essential for life (with key issues suchas climate change and ozone layer depletion) so that more efforts have to be taken to avoidthe release of pollutants to the atmosphere and recycle them instead to the productionprocess or use them elsewhere on the site.
• In contrast to waste water, there are substantial components of waste gas – namely non-ducted waste gas – that are not susceptible to treatment. They have to be dealt with byprevention techniques. The management of fugitive emissions relates to detection,quantification methods, equipment selection, housekeeping and preventive maintenancemeasures.
• When planning and designing a production process, the first aim should be the preventionof waste to be discharged to the environment. Selecting clean technologies and clean rawmaterials supports this aim.
• When planning and designing a waste gas treatment system, deciding whether to usetechniques with or without water consumption (e.g. wet scrubbing, biofiltration,refrigeration through water cooling) is a major issue, most of all for regions with a shortageof water.
• If – as is usually the case – complete prevention of waste is not practicable, the next step isminimisation, not only of volume, but also of impact caused by hazardous substances thatmight be replaced in the production process.
• If all measures for minimisation are taken, the next step is controlling the inevitabledischarge by implementing the most effective treatment system possible, so as to minimisethe total environmental impact. The choice of this treatment system is based on anevaluation of:- its control efficiency- its energy needs- its space requirement- the possible generation of waste gases or waste water, waste and noise- its consumption of resources- its capital costs- its interference with other units and safety issues- its maintenance requirements.
• The quality of the receiving medium into which the industrial site is going to discharge itswaste may be such as to impose special and more stringent requirements of the waste waterand/or waste gas quality.
Planning of action is only one part of environmental management. The next and more importantstep is a process of continuous improvement of a given situation, i.e. all the different stages andsteps have to be done and redone repeatedly over time. This is usually supported by companypolicy on environmental issues for all their sites and by Member State legislation.
The basis for environmental management – or waste water and waste gas management – appliedto waste control is that the introduction of pollutants into final treatment systems not suitable fortheir removal should be avoided or at least minimised.
Opportunities to introduce or apply environmental management are different for new andexisting plants. In new plants, preventive control measures, in-plant segregated waste streamtreatment and/or process-integrated measures can be effectively taken into account in the designstage of the plant. For existing plants, retrofitting to existing installations and infrastructure mayinvolve technical and organisational constraints and will generally be more expensive.However, the approach and principle – but probably not the result – of environmentalmanagement as proposed in this document are basically the same for new and existing plants.

Chapter 1
6 Waste Water and Waste Gas Treatment
A detailed description of environmental management systems and tools to implement them isgiven in Chapter 2.
1.3 Treatment TechnologyThe different sources of emissions (aqueous and/or gaseous) and the variety of the contaminantsand their load make the implementation of a more or less – according to the complexity of theproduction – complex system of handling techniques (prevention and/or control), based onmanagement decisions, inevitable for the operation of a chemical industry site. Such a handlingsystem consists of:
• process-integrated measures, such as water re-use, water saving and pollution prevention• end-of-pipe treatment (individual and/or central facilities).
How the kinds of handling techniques fit within the scope of this document is illustrated inFigure 1.1 for waste water and in Figure 1.2 for waste gas. The vertical bars signify theboundaries of this horizontal BREF.
W aste w a ter tech n iq u es
P roc ess -in te grate dm ea sures
E n d -of-p ipe tre atm en t
In div idu al treatm en t C en tra l tre atm en t
F in a ltrea tm e nt
P re-tre atm en t
R ec ip ie n t
Figure 1.1: Waste Water Handling Techniques
The arrows in Figure 1.1 symbolise the waste water flow. This illustration, however, does notsuggest that pretreatment facilities must always exist if a central treatment facility is used.
W a s t e g a s t e c h n iq u e s
f o r f u g i t iv ea n d d i f f u s ee m is s io n s
f o r d u c t e de m is s io n s
C a p t u r e
P r o c e s s -in t e g r a t e dm e a s u r e s
E n d - o f - p ip et r e a t m e n t
In d iv id u a lT r e a t m e n t
( w i t h o rw i t h o u t
p r e t r e a t m . )
G r o u pT r e a t m e n t
(w i th o rw i t h o u t
p r e t r e a t m . )
C e n t r a lT r e a t m e n t
( w i th o rw i t h o u t
p r e t r e a t m . )
S T A C K
Figure 1.2: Waste Gas Handling Techniques

Chapter 1
Waste Water and Waste Gas Treatment 7
Figure 1.2 shows that fugitive and diffuse emissions are outside of the scope of this document.When fugitive and diffuse emissions can be captured, they enter the area of treatmenttechniques for ducted emissions.
1.3.1 Process-Integrated Measures
Though, strictly speaking, process-integrated measures for waste prevention or reduction of thepollutant discharge via waste water and waste gas are part of the scope of vertical BREFs, theyare nevertheless mentioned in this horizontal document as long as they are generally applicablein chemical production processes. They are in any case items of good management practice andfor consideration when implementing a waste water and waste gas management system on asite.
Advanced environmental protection is more and more shifting from end-of-pipe methods toprocess-integrated – or production-integrated – measures. Process-integrated measures are asource of significant environmental improvement in both new and existing plants. They areintended to reduce – or even avoid – the production of residues directly at source before theybecome a discharge. Often these ‘process improvements’ help to decrease costs for additionaltreatment measures, as well as increase economic efficiency by increasing production yieldand/or decreasing input of raw material. Disposal costs and the limitations of end-of-pipetreatment can influence this shift toward process-integrated measures. Although the preventionof waste, and thus the implementation of process-integrated measures, is becoming increasinglysignificant, waste treatment techniques will remain essential contributors to the control ofemissions into the environment, mainly when process-integrated measures are not feasible forexisting production.
Proper process-integrated environmental protection uses all possible physical, chemical,biological and engineering techniques for the prevention, reduction and recycling of residues.Examples are:
• new synthesis pathways• use of purer or even different feedstock and process agents• use of purer or different fuels• optimisation of process steps• improved plant technology, process control and reaction sequence• technical adaptations to the process• improved use of catalysts and/or solvents• recycling of auxiliaries (e.g. washing water, inert gases, solvents, catalysts)• recycling of residues immediately during the process• use of residues as raw material for other productions (product integration within and/or
outside the location)• use of residues for energy generation.
Obviously the development of completely new pathways for syntheses in existing plants will –mostly for economic reasons – remain an exception, and will be restricted to bulk products orproducts of high economic value. In practice, production-integrated environmental protectionwill progress continuously as the sum of many individual – and maybe tiny – improvementsover time.
Chapter 1
8 Waste Water and Waste Gas Treatment
1.3.2 End-of-Pipe Techniques
End-of-pipe techniques are those that treat the waste stream arising from a process or storageunit, or an area – or part thereof – to reduce its pollutant content (see Figure 1.1 and Figure 1.2).
1.3.2.1 Waste Water Treatment
Since process-integrated measures are preferably implemented in newly built plants orproduction processes because of economic limitations due to high capital costs or retrofittinglimitations (e.g. lack of space) in existing ones, the chemical industry and most other industrialsectors resort to end-of-pipe treatment techniques to reduce waste water and the pollutants itcarries. They encompass pretreatment or final treatment of segregated waste water streams aswell as the central treatment of collected waste water before discharge into a receiving water.The different waste water end-of-pipe treatment techniques and their applicability to control themain contaminants in the chemical industry are shown in Table 1.1.
Technique TSSBODCODTOC
Refrac-toryCOD
AOXEOX
N-total
NH4-N(NH3) PO4-P Heavy
metalsPhe-nols Oil
Sedimentation X (X) a (X) j
Air flotation X X b (X) j XFiltration X (X) a (X) j
MF / UF (X) c (X) a
Oil separation X XPrecipitation X XCrystallisation X XChemical oxidation X X XWet air oxidation X X X XSCWO X X X XChemical reductionChemical hydrolysisNF / RO X X X XAdsorption X X X XIon exchange (X) d XExtraction X X XDistillation / rectification X X XEvaporation (X) e XStripping (X) f X XIncineration X X (X) g X (X) k X XAnaerobic biological X (X) h (X) h X l
Aerobic biological X (X) h X XNitri / denitrification X Xa only solidb undissolved organic contentc finely dispersed and low concentrationd ionic organic speciese non-volatile organic contentf volatile organic contentg special incinerator equipment requiredh only biodegradable partj undissolved heavy metal compoundsk transferred to ash or waste water originating from incineratorl in combination with sulphate precipitated as sulphides
Table 1.1: Major Waste Water Contaminants and their Respective Treatment Techniques
Complex chemical production sites normally have an extensive system for the collection andtreatment of process water. There are several approaches to waste water treatment, each of themhaving its advantages and disadvantages, depending on the situation:
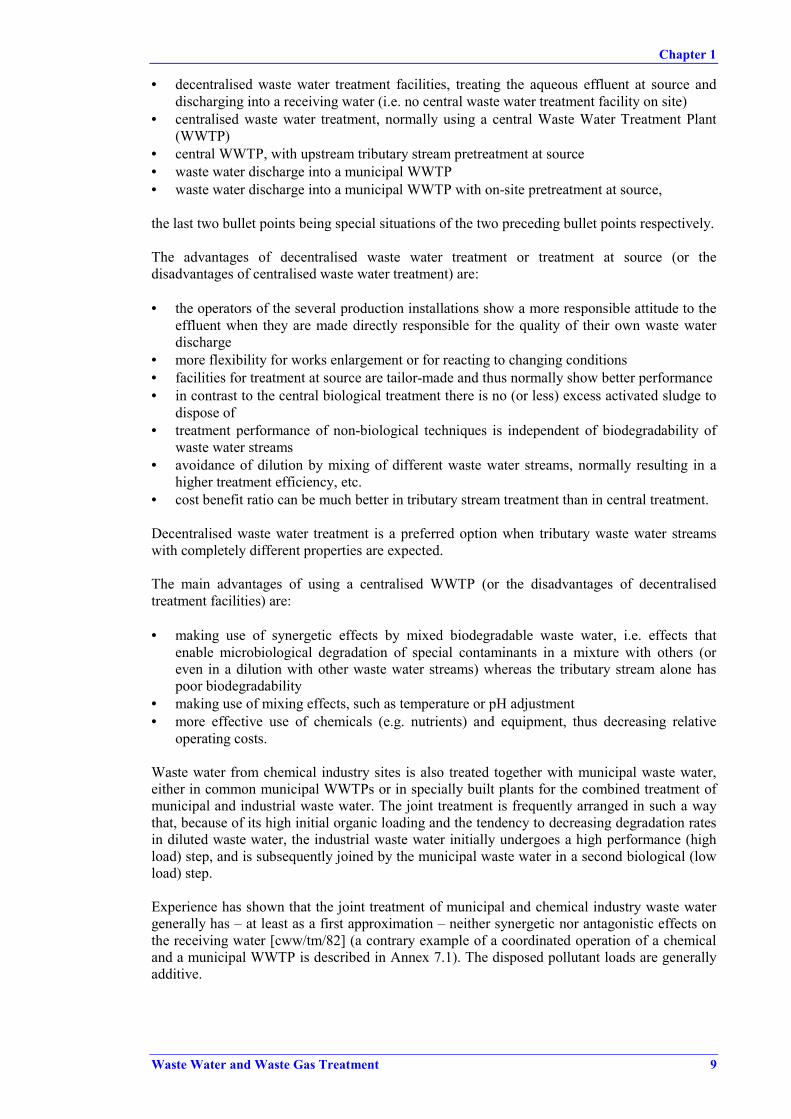
Chapter 1
Waste Water and Waste Gas Treatment 9
• decentralised waste water treatment facilities, treating the aqueous effluent at source anddischarging into a receiving water (i.e. no central waste water treatment facility on site)
• centralised waste water treatment, normally using a central Waste Water Treatment Plant(WWTP)
• central WWTP, with upstream tributary stream pretreatment at source• waste water discharge into a municipal WWTP• waste water discharge into a municipal WWTP with on-site pretreatment at source,
the last two bullet points being special situations of the two preceding bullet points respectively.
The advantages of decentralised waste water treatment or treatment at source (or thedisadvantages of centralised waste water treatment) are:
• the operators of the several production installations show a more responsible attitude to theeffluent when they are made directly responsible for the quality of their own waste waterdischarge
• more flexibility for works enlargement or for reacting to changing conditions• facilities for treatment at source are tailor-made and thus normally show better performance• in contrast to the central biological treatment there is no (or less) excess activated sludge to
dispose of• treatment performance of non-biological techniques is independent of biodegradability of
waste water streams• avoidance of dilution by mixing of different waste water streams, normally resulting in a
higher treatment efficiency, etc.• cost benefit ratio can be much better in tributary stream treatment than in central treatment.
Decentralised waste water treatment is a preferred option when tributary waste water streamswith completely different properties are expected.
The main advantages of using a centralised WWTP (or the disadvantages of decentralisedtreatment facilities) are:
• making use of synergetic effects by mixed biodegradable waste water, i.e. effects thatenable microbiological degradation of special contaminants in a mixture with others (oreven in a dilution with other waste water streams) whereas the tributary stream alone haspoor biodegradability
• making use of mixing effects, such as temperature or pH adjustment• more effective use of chemicals (e.g. nutrients) and equipment, thus decreasing relative
operating costs.
Waste water from chemical industry sites is also treated together with municipal waste water,either in common municipal WWTPs or in specially built plants for the combined treatment ofmunicipal and industrial waste water. The joint treatment is frequently arranged in such a waythat, because of its high initial organic loading and the tendency to decreasing degradation ratesin diluted waste water, the industrial waste water initially undergoes a high performance (highload) step, and is subsequently joined by the municipal waste water in a second biological (lowload) step.
Experience has shown that the joint treatment of municipal and chemical industry waste watergenerally has – at least as a first approximation – neither synergetic nor antagonistic effects onthe receiving water [cww/tm/82] (a contrary example of a coordinated operation of a chemicaland a municipal WWTP is described in Annex 7.1). The disposed pollutant loads are generallyadditive.

Chapter 1
10 Waste Water and Waste Gas Treatment
Advantages [cww/tm/82] of joint waste water treatment can be:
• the operational stability of joint biological treatment can be favourably influenced by:- improving the nutrient conditions- optimizing the waste water temperature and thus the degradation kinetics- equalizing the feed load, as long as the daily progress lines of the two waste water
streams are correspondingly structured, or can be matched to one another- suppressing the toxic and inhibitory effects of waste water constituents by lowering the
concentrations below the critical thresholds,• the joint treatment of waste water and excess activated sludge can, in individual cases,
realise savings in capital and operating costs.
Disadvantages can be:
• systems with mixed drainage and without appropriate buffer tanks for excess rain can sufferfrom hydraulic overload in the event of heavy rainfall, which might lead to increasedpollutant discharge accompanied by loss of bacteria from the activated sludge compartmentof the central WWTP [cww/tm/82]
• reduced cleaning performance due to production-related operation disturbances, whichleads to increased water pollution because of insufficient treatment of both municipal andindustrial waste water streams [cww/tm/82]
• quite a number of chemicals can, even at lower concentrations, hinder nitrification. If thenitrification step collapses, it might take several weeks to recover and ensure sufficientnitrogen elimination again. So, to minimise the risk for joint waste water treatment, it iscrucial to study and monitor carefully the waste water streams coming from the industrialpart for any inhibiting or disturbing factors [cww/tm/82]
• combined treatment of waste water streams from different origins bears the risk thatpersistent contaminants, such as heavy metals and non-biodegradable compounds, canescape control – and sometimes even detection – because of dilution. These contaminantsdischarge without degradation into a receiving water, adsorb onto the activated sludge orare stripped into the atmosphere during aeration. This would counteract the obligation toprevent or control these substances at source. This disadvantage affects all treatment actionson combined waste water streams
• combined treatment may result in sludge too contaminated for further usage or furthertreatment by, e.g., anaerobic digestion.
Another important aspect of the waste water system is the handling of rainwater and rinsingwater. In a number of older chemical complexes in Europe, only one sewer system is presentand rainwater, rinsing water, cooling water and process water are collected in this system anddirected to the waste water treatment facilities. Especially during periods of heavy rainfall, thismight lead to upsets of the WWTP and lead to increased discharges. Advanced chemical sitesusually have a separate sewer system for the collection of uncontaminated rainwater andcooling water. Details are given in Section 3.3.4.4.
1.3.2.2 Waste Gas Treatment
Waste gas treatment techniques in general are concerned with the reduction of:
• particulate matter• vapours of volatile liquid substances• gaseous air contaminants.

Chapter 1
Waste Water and Waste Gas Treatment 11
Waste gas treatment normally takes place directly at source. Only rarely can waste gas streamswith different characteristics be treated simultaneously in one central treatment unit. One mainreason is that treatment units are normally specifically designed for a particular waste gascomposition. Another important reason is that special attention must be paid to the release oftoxic and hazardous components and their impact on the surroundings as well as on the safety ofthe plant. In the chemical industry, given the toxicity and/or hazardous characteristics of manycomponents and the generally large volumes that are handled and processed, safety is a crucialissue.
A selection of techniques by pollutant is given in Table 1.2, and by waste gas flow rate in Table1.3 [both cww/tm/70].
odourorganic gaseous or vapourous components
inorganic gaseous or vapourous componentsorganic particulates
inorganic particulateswet matter
dry matterTechnique
Dust recovery and abatement Separator (pre) x x x x Cyclone (pre) x x x x Wet dust scrubber (FT) x x x x Electrostatic precipitator (FT) x x x x (x) (x) Fabric filter (incl. ceramic filter) (FT)
x x x
Catalytic filtration (FT) x x x x x Two-stage dust filter (pol) x x x Absolute (HEAP) filter (pol) x x x HEAF (pol) x Mist filter (pre, pol) x (x)
Gas recovery Membrane separation (pre) x Condenser (pre) (x) x Cryocondensation (pre, FT) (x) x (x) Adsorption (FT) x x x Wet gas scrubber (water) (FT) (x) (x) (x) (x) x x x Wet gas scrubber (alkaline) (FT) (x) (x) (x) (x) x x x Wet gas scrubber (alkaline- oxidation) (FT)
(x) (x) (x) (x) x
Wet gas scrubber (acidic) (FT) (x) (x) (x) (x) x x xGas abatement
Biofiltration (FT) x x x Bioscrubbing (FT) x x x Biotrickling (FT) x x x Thermal oxidation (FT) x x x Catalytic oxidation (FT) x x Flaring (FT) x x
Combustion gas treatment Dry alkali injection (FT) x Semi-dry alkali injection (FT) x Wet lime injection (FT) x SNCR (FT) x SCR (FT) x (x)x = primary application(x) = secondary application(pre): mainly as pretreatment facility(FT): treatment technique used as final treatment technique(pol): mainly as polishing technique after standard technique
Table 1.2: Selection of Techniques for Waste Gas Emission Reduction in Relation to the Pollutantto be removed

Chapter 1
12 Waste Water and Waste Gas Treatment
Technique 100[Nm3/h]
1000[Nm3/h]
10000[Nm3/h]
100000[Nm3/h]
Dust recovery and abatement Separator x x xx xx Cyclone x xx xx x Wet dust scrubber x xx xx Electrostatic precipitator (1-stage) x x Fabric filter x x xx xx Ceramic filter xx x x Catalytic filtration x x x 2-stage dust filter x x Absolute (HEAP) filter x x HEAF xx xx x Mist filter x xx xx
Gas recovery Membrane filtration Condenser x x xx x Cryocondensation x x Adsorption x xx xx x Wet gas scrubber (water) x x xx xx Wet gas scrubber (alkaline) x x xx xx Wet gas scrubber (alkaline-oxidation) x x xx x Wet gas scrubber (acidic) x x xx xx
Gas abatement Biofiltration x xx xx xx Bioscrubber x x x x Biotrickling x x x x Thermal oxidation x xx Catalytic oxidation x xx
Combustion exhaust gas treatment Dry alkali injection xx x Semi-dry alkali injection x xx Wet lime injection x x x SNCR x x x x SCR x xx xxx = applicationxx = most common applications
Table 1.3: Selection of Techniques for Waste Gas Emission Reduction in Relation to Waste GasFlow Rate
1.4 Environmental Impact of Waste Water and Waste GasTreatment and their Interdependencies
Although waste water treatment systems generally reduce emissions to water, the operation ofthese systems has its own environmental effect. Especially relevant with regard to emissions toair from waste water treatment are those water streams which are polluted with volatile organiccompounds (VOC) and volatile inorganic compounds (e.g. ammonia, hydrogen sulphide orhydrogen chloride). Whenever these water flows are in open connection to the atmosphere,(odorous) emissions of these components may occur. Special attention should be paid toaeration of biological waste water treatment basins, stirring operations, open buffer tanks,settling tanks and waste water stripping facilities. In all these cases, the emission of pollutantscan be shifted from the water compartment to the air. Thus additional waste gas treatment canbe necessary. Air emissions may also evolve from the mixing of water flows with differenttemperatures or the addition of acids or alkalis for pH-adjustment.
The potential impact of waste water treatment plants on the environmental compartments isbriefly reviewed in Table 1.4 [cww/tm/84].

Chapter 1
Waste Water and Waste Gas Treatment 13
Environmental compartment Potential effect/emissionAir • Evaporation/formation of odour (e.g. H2S, NH3, mercaptans etc.).
• Formation of aerosols.• Drift of potentially hazardous micro-organisms from the treatment
plant.• VOC emissions (evaporating or stripped from the water).• If biogas is generated and not used as fuel for energy supply, it is
normally flared, resulting in emissions to the air.Water • In principle, significant reduction of water emission.
• When rainwater is treated together with process water, thetreatment system might get overloaded in the event of heavy rainfall, which can cause additional pollutant emission because thetreatment system cannot function properly.
Waste • Waste water treatment sludge and scrubber solutions.Other • The central WWTP plant consumes energy. In some cases, biogas
is generated and can be used as a source of energy.
Table 1.4: Potential Impact of Waste Water Treatment Facilities
Other relevant points of concern are the energy consumption and sludge generation of the wastewater treatment techniques. The generation and handling of sludge (e.g. dewatering,incineration) account for a significant part of the energy requirement and the environmentalimpact of a WWTP. On the other hand, treatment systems with a beneficial energy balance doexist. In anaerobic biological waste water treatment units, for example, the gas generated bytreatment (biogas) can be used as a fuel. Otherwise it needs to be flared, causing untreateddischarges to the air.
What has been said about waste water treatment systems in the preceding paragraphs is alsovalid for waste gas treatment technologies. Their relevant environmental impacts are emissionsto the water and air compartments. Wet scrubbing procedures, for example, mean that wastewater has to be treated in a subsequent treatment step. Waste gas oxidation discharges a flue gascontaining gaseous contaminants not present in the original input, that might require furtherwaste gas treatment. As with waste water treatment, the operation of waste gas treatmentfacilities is connected with energy and water consumption, the latter being an essential issueunder special climatic conditions. This is briefly reviewed in Table 1.5.
Environmental compartment Potential effect / emissionAir • In principle (and primarily), significant reduction of contaminant
emissions.• Replacement of VOCs by flue gas contaminants, such as carbon
oxides, hydrogen halides, sulphur dioxide, nitrogen oxides, dioxins,in the case of thermal/catalytic oxidation.
• Emissions from flares.Water • Scrubbing/absorption processes transfer contaminants from air into
water compartment.• Some treatment processes need excessive water (e.g. scrubbing,
water-run condensation).Waste • Sludge from secondary treatment of waste water originating from
waste gas treatment.• Residues from waste gas treatment facilities (e.g. separated solids,
condensed liquid not recycled, spent adsorbent, spent catalyst).Other • Waste gas treatment facilities normally consume energy.
Table 1.5: Potential Impact of Waste Gas Treatment Facilities

Chapter 1
14 Waste Water and Waste Gas Treatment
In addition to flares and thermal/catalytic oxidisers, a large number of environmental and safetyfacilities can be found in the chemical industry. The main purpose of these facilities is to reducethe environmental impact or increase the safety of the plant operation. The facilities vary fromvery simple measures to complex treatment units.
In general, the overall effects of the environmental and safety facilities should be positive. Thatis the reason for installing them in the first place. However, because of fundamentalconservation laws, most treatment technologies can have, in addition to their purging abilities,negative impacts on the environment. Examples of these cross-media effects are wastegenerated by filters, waste water generated by scrubbers and increased energy consumptionbecause of the operation of treatment systems. It is hard to give an indication of the break-evenpoint, where the positive effects outweigh the negative effects of a treatment measure, since thisis strongly influenced by local conditions. As a rule of thumb one could say that localenvironmental quality and safety should have priority. Furthermore, it is generally consideredpreferable for pollutants to be in the most concentrated and controllable state. This offers thebest opportunities for recycling, further treatment or controlled disposal.
To sum up, waste water and waste gas treatment, in addition to their individual impacts on theenvironment, affect each other in different ways:
• several waste water treatment techniques result in gaseous emissions, which need to beducted to downstream waste gas treatment facilities, often entailing complex constructionsteps
• waste gas treatment technologies result in gaseous and/or aqueous releases, which needfurther waste gas and/or waste water treatment.
Each item (gaseous releases to waste gas treatment facilities or aqueous ones to waste watertreatment facilities) can normally influence existing downstream facilities though in most casesthey lead only to a low load increase. Contrary examples are wet scrubbing of exhaust gases orstripping of volatile material from WWTPs.

Chapter 2
Waste Water and Waste Gas Treatment 15
2 WASTE WATER/WASTE GAS MANAGEMENT
Chapter 2 adds detail to the general description in Chapter 1 and describes the aspects of wastewater and waste gas management in the context of IPPC. It emphasises the significance ofmanagement in achieving a high level of protection of the environment as a whole whenoperating a chemical plant or site. Where possible, the joint approach to aqueous and gaseousemissions is maintained; references to the medium are only made when media-specificstrategies or tools are involved.
This chapter describes environmental management as the interplay between managementsystems and management tools and is not strictly restricted to waste water and waste gas issues,but to the involvement with IPPC requirements. Otherwise it would not meet the objective of anintegrated approach.
The implementation of an environmental management system at a given site depends on theenvironmental impact of the activities carried out there, and has to take into account the specificenvironmental situation at and around the site. This chapter presents the general schedule andthe relevant tools to implement an environmental management system valid for chemical sites.
2.1 Environmental Management System (EMS)
As briefly mentioned in Chapter 1, the importance of environmental management, often referredto as ‘Health, Safety and Environmental’ (HSE) management, cannot be overestimated. It hasmany advantages, such as:
• improved insight into the environmental aspects of the company• improved basis for decision making• improved motivation of personnel• additional opportunities for reducing operating costs and improving product quality• improved environmental performance• improved company image• reduced liability, insurance costs, non-compliance• increased attractiveness for employees, customers and investors• improved relationship with authorities and environmental groups.
In general, an EMS consists of a loop of strategic items as shown in Figure 2.1 [cww/tm/132]These items are [cww/tm/132]:
• environmental policy, which means a public statement - approved and endorsed by thehighest level of management - of the intentions, principles of action and objectives thatgovern the management of a company with respect to the environment
• organisation and structure to implement the company’s environmental policy• comprehensive register of applicable legislation and company standards• regular sampling and monitoring programme with data collected in registers• establishing an individual environmental programme for the site, on the basis of global,
long-term targets, set at the highest achievable level, together with data from the register ofenvironmental effects
• environmental auditing• regular review and assessment of the suitability and effectiveness of the EMS, the result
having influence on the environmental policy, thus closing and starting the loop again.

Chapter 2
16 Waste Water and Waste Gas Treatment
Figure 2.1: The Environmental Management System (EMS) Loop
This ‘loop’ signifies that EMS is not a once-through process but an iterative way of optimisingthe environmental situation or attitude of a company or a site of industrial activities.
There are accepted standards for an EMS, such as:
• ISO 9001 / 14001 (International Organisation for Standardisation)• EMAS (European Commission, Council Regulation 761/2001 – Eco-Management and
Audit Scheme), which took on board the requirements of ISO 14001• Responsible Care® (Chemical Industry)• ICC Business Charter for Sustainable Development (International Chamber of Commerce)• CEFIC Guidelines for Protection of the Environment (European Chemical Industry
Council).
It is not within the scope of this document to give a detailed overview of the entire EMS for achemical site, therefore in the following the term ‘EMS’ is restricted to its involvement withwaste water and waste gas management in the context of IPPC issues.
The EMS is an excellent item to improve the integrated environmental performance of anindustrial site. It offers the management of a company the possibility to:
• gain insight into the pollution-generating mechanisms of the production processes• make balanced decisions about environmental measures• avoid temporary solutions and no-return investments• act adequately and pro-actively on new environmental developments.
The EMS regularly follows the strategy of a cyclic process of:
• analysis or pollution characterisation / evaluation of the manufacturing processes tounderstand how pollution is generated, using tools that are detailed in Section 2.2.1.
• identification of the possibility of pollution reduction by measures such as:

Chapter 2
Waste Water and Waste Gas Treatment 17
- consideration of environmental impact when planning new production lines or whenplanning enlargement of existing production lines
- re-thinking on and re-designing the process technology, e.g. change to cleaner processtechnology, cleaner raw material and/or improved process equipment
- process-integrated prevention measures- possibilities to recycle or recover waste content- options to improve emission collection and control, e.g. optimising releases by
pretreatment- end-of-pipe measures- assessment of centralised vs decentralised end-of-pipe treatments;
• assessment of the most effective options, taking into consideration:- environmental benefits and impact, such as overall removal efficiency, overall balance
of cross-media effects- technical, organisational and financial feasibility- site-specific constraints and options (such as space requirements vs existing space
limitations, quality of the receiving media)- safety issues- required resources and utilities;
• execution of the goal and monitoring its achievement according to an action plan, whichcontains items such as:- schedule of action- responsibility for action- data to be assessed- monitoring method and frequency- guidelines on which the monitoring process and evaluation process are based,and which is followed by evaluation of the results.
The cycle is illustrated in Figure 2.2. Evaluation re-starts the whole cycle since – as statedabove – the EMS is an iterative process.
Pollutioncharacterisationand evaluation
Assessmentof mosteffectiveoptions
Execution,monitoring
and evaluation
Identification ofoptions for
improvement
Figure 2.2: Strategy of a Site-Oriented EMS
Part of EMS is the environmental impact assessment at early planning stages of processdevelopment and/or new activities. It is to decide (using the cycle of Figure 2.2):

Chapter 2
18 Waste Water and Waste Gas Treatment
• what is – or might be – their impact?• what becomes of wastes?• can they be treated in existing facilities?• are they toxic (acutely toxic) with regard to the receiving media or existing treatment
facilities?• can they – or must they – be avoided?
The operation of an EMS is a complex procedure because the cycle in Figure 2.2 needs to befollowed for all individual process units with all relevant environmental aspects in respect of theresult for the whole site. Figure 2.3 gives a rough impression of this complexity, noting thatonly some main environmental aspects – a plant orientated pollution treatment strategy – andtwo individual units are included. Steps 1 to 4 correspond with those in Figure 2.2.
Individual processunit 1
Individual processunit 2
Characterisationof off-gas
Characterisationof WW
Characterisationof waste
Characterisationof WW
Characterisationof off-gas
Preventiveapproach &
identify options
Preventiveapproach &
identify options
Preventiveapproach &
identify options
Preventiveapproach &
identify options
First step
Identify off-gastreatment
opportunities
Identify wastetreatment
opportunities
Identify WWtreatment
opportunities
Identify off-gastreatment
opportunities
Second step
Assessment of off-gas treatment
scenarios
Assessment of WWtreatment scenarios
Assessment ofwaste treatment
scenarios
Third step
Evaluation
Fourth step
Step 1
Preventiveapproach &
identify options
Identify WWtreatment
opportunities
Characterisationof Waste
Preventiveapproach &
identify options
Identify wastetreatment
opportunities
etc.
Figure 2.3: Complexity of a Site-Oriented EMS
The EMS is accomplished by expert judgement supported by management tools. The differentkinds of tools are presented and explained in Section 2.2.

Chapter 2
Waste Water and Waste Gas Treatment 19
2.2 Management Tools
To operate an EMS around the loop of strategic items (see Figure 2.1), several kinds of(management and engineering) tools are used. These can be roughly categorised as:
• inventory tools, giving detailed information on the location, the production, theenvironmental circumstances, the emissions etc. of the chemical site and thereby helping todetect emissions that can be prevented or reduced
• operational tools, helping to decide upon planning, designing, installing, operating andimproving pollution prevention and/or treatment facilities
• strategic tools, comprising the organisation and operation of release handling on the entirechemical industry site in an integrated manner
• safety or emergency tools, necessary for troubleshooting in the case of unplanned events.
2.2.1 Inventory Management Tools
To operate an industrial site in accordance with a good EMS, it is essential to have detailed andtransparent information on:
• the site and its environmental circumstances• the production processes• pollutant characteristics of the individual production processes• the characteristics of the emitted streams• the local situation.
Without this knowledge it is not possible to develop a coherent, efficient and cost effectivestrategy to prevent or reduce emissions. Though it is often virtually impossible to quantify theemissions of each contaminant present in each emitted stream, a way can normally be found toreduce the necessary parameters (e.g. number of measurements) without relevant loss ofinformation.
2.2.1.1 Site Inventory
A site inventory consists of information on:
• location (map, plot plan)• climate, geography, quality of soil and groundwater, neighbourhood, receiving water• size of the site (total area, built-up area, drained area, covered area)• number of employees• production units• list of production plants comprising, for each one, data on:
- classification of production plants according to the Directive, Annex I, 4. ChemicalIndustry, 4.1 – 4.6
- typical production plant data,• information on the production processes, for each process giving:
- a brief description- simplified process scheme(s) with sources of waste streams- details of the chemical reactions (main and side reactions) and supporting operations- information on operating material, intermediate and final products- operating mode (continuous or batch process or campaign operation)- potential emergency situations (spills, leakages)
• sewerage system (sewer, WWTP, rainwater drainage).

Chapter 2
20 Waste Water and Waste Gas Treatment
2.2.1.2 Stream Inventory or Register
The compilation of relevant basic data on the composition and quantity of waste water andwaste gas streams – each one individually – is done in a stream inventory or register (wastewater register, waste gas register). The emitted streams are listed respective to their source, i.ethe production process from which they originate. This is a key element in assessing theirdegree of contamination and the nature of the contaminants, as well as the reduction-at-sourcepossibilities. The sources of waste water are listed in Section 1.1.1, those for waste gas inSection 1.1.2.
A stream register consists of:
• information about the chemical production process, such as:- chemical reaction formula including starting compounds, products and by-products- simplified process flow-sheet of the corresponding production unit, showing reactor,
work-up and product isolation, and showing the exact origin of the various emissioncontributions,
• information about the emitted streams, such as:- components and their variability- relevant data on concentration and load of significant components and their variability
(including monitoring method and frequency)- stream flow rate and its variability (e.g. pulse dose, continuous flow or batch-wise)- temperature- pH (for waste water)- conductivity (for waste water)- flammability (for waste gas)- explosion limits (lower explosion limit – LEL – and higher explosion limit – HEL)- reactivity (for waste gas)- relevant contaminants and/or parameters, such as:
COD/TOC, NH4-, NO3- and NO2-N, phosphorus, heavy metals, halogenatedhydrocarbons, persistent organic pollutants (POP) – when expected – and toxicity inwaste water
chlorine, bromine, fluorine, hydrogen chloride, sulphur oxides (SOx), hydrogensulphide, mercaptans, carbon monoxide, nitrogen oxides (NOx), particulate matter,heavy metals and their compounds, volatile organic compounds (VOC) in waste gas
- data on biodegradability (for waste water) such as: BOD-concentrations results from modified Zahn-Wellens-Test refractory COD/TOC loads denitrification inhibition potential
- presence of other substances (for waste gas), which may have an impact on thetreatment system or may be safety topics, such as oxygen, nitrogen, water vapour, dust.
The purpose of a stream inventory is to identify the most relevant emission sources (for eachmedium, waste water and waste gas) and to allow a prioritisation of the emission reduction stepsto be taken. Generally speaking, this is a four-step operation:
• listing of the sources• evaluation of the causes of emissions from each source• quantification of the amount of emission from each source• validation of the results through a material balance.
An appropriate ranking of the distinctive tributary streams (i.e. individually for waste water andwaste gas), corresponding to the characteristics and load of contaminants, is a decisive part ofthe inventory and an attractive basis for identification of further release reduction potential (seeSection 2.2.1.3), the respective streams at the top of each ranking list being prime candidates fora most effective emission reduction.

Chapter 2
Waste Water and Waste Gas Treatment 21
On chemical sites, measures for the reduction of emissions are best realised for those chemicalprocesses where an optimum ratio of environmental benefit to cost is achievable. For existinginstallations, non-optimum elimination rates for minor emitted streams not carrying a significantload might be tolerated, when efforts are instead concentrated on streams containing significantloads, thereby reducing overall emissions and environmental impact.
2.2.1.2.1 Whole Effluent Assessment (WEA)
Effluent discharges have largely been assessed and regulated on the basis of physical andchemical properties, such as COD, BOD, TSS, pH and concentrations of specific hazardoussubstances. These properties provide a sound basis for controlling effluents containing relativelyfew and well characterised contaminants with well defined and understood toxicologicalproperties. It is, however, sometimes very difficult to assess the environmental significance ofcomplex and variable effluents on the basis of their composition and physico-chemicalproperties.
Whole effluent assessment is a methodology to evaluate complex waste water streams and isadditional to the use of surrogate and sum parameters such as COD, AOX or EOX. The aim isto assess the possible hazardous character of effluents, which would be insufficiently controlledwhen relying only on the chemical indications provided by those sum parameters or by limitsset on individual chemicals. Whole effluent assessment provides an additional and perhaps evenmore direct means of assessing the potential impact of effluents on the aquatic environment andis likely to play an increasing part in the regulation of discharges, supplementing and perhapsreplacing the traditional measures of effluent quality in environmental monitoring and riskassessment. Co-operation and mutual understanding between regulator and discharger will beessential to ensure appropriate and suitable control of complex effluent discharges.
Biological test methods, bioassay methods, are used for whole effluent toxicity assessment, e.g.fish, algae, bacteria and crustaceans bioassays. Their advantage over chemical analyses ofsingle substances is that the toxic properties of the water samples are determined in anintegrated manner and interactive effects, which may occur in the presence of several pollutants,are directly accounted for. With biological test methods the environmental significance of acomplex effluent can be determined. This is usually quicker and cheaper than extensivechemical characterisation and thereby simplifies regulation. They cover a range of substancesand produce results that can be interpreted fairly easily. In addition, they allow conclusions tobe drawn on the efficiency of waste water treatment plants in eliminating toxic substances.
The choice of bioassay methods and the choice of experimental design depends on theapplication, i.e. whether results are to be used for hazard assessment, monitoring or compliance.Bioassay methods for different applications will have different requirements.
There is a lot of experience of acute toxicity measurements and there are two procedurescommonly used for the evaluation of toxicity data:
• ECx/LCx approach using statistical data analysis where at least five data pairs ofconcentration / response between 0 and 100 % response are needed
• LID (Lowest Ineffective Dilution) approach resulting in the dilution of the original wastewater stream until no effects are observed, i.e. equivalent to 1/NOEC. It does not need aconcentration / response relationship and thus the whole test procedure is simpler, but nostatistical evaluation and confidence limits are available.
Whole effluent assessment (WEA) provides information on effluents by using a range ofchemical, physical and/or biological methods to examine their potential for biological effects.The methodology of WEA is aimed at determining possible adverse effects of effluents andaddresses basically the same effect parameters, which are used in a substance-orientatedapproach:

Chapter 2
22 Waste Water and Waste Gas Treatment
• acute toxicity• mutagenicity, or (preferably) genotoxicity• chronic toxicity• bioaccumulation• persistence, or (bio)degradability.
Chemicals which are persistent (P), toxic (T) and/or liable to bioaccumulation (B) are ofspecific concern to the aquatic environment. The chemical-orientated approach focuses onmeasuring hazardous substances that have been selected and prioritised using the P-T-B criteria.A well-designed WEA programme can provide environmental management with integratedmeasures with regard to complex effluents. The advantages of using biological effectparameters are:
• WEA considers all waste water compounds regardless of their origin and detectability bychemical analysis. The compounds do not necessarily need to be identified. By-productsand metabolites are assessed as well
• toxic effects on aquatic organisms are directly displayed; combined effects are alsoconsidered
• the sources of hazardous effluents (production steps or hot-spots) inside industrial areas canbe identified in many cases (backtracking)
• the effort required to perform tests in WEA is comparable with a comprehensive analysis ofsingle substances in a complex effluent.
The advantages mentioned above are more or less scientific ones, but WEA may also supporteveryday production practices:
• a combination of direct and indirect measures of a range of potential effects can be used byenvironmental management, particularly when effluents contain substances which arepoorly understood with respect to their persistence, bioaccumulation and toxicity
• whereas toxicity results can be readily applied, e.g. in dilution calculations,bioaccumulation and persistence of an effluent are not indicative of effects by themselves,they rather relate to a chronic exposure assessment
• it provides information on potential risks for the environment, delivering proactiveinformation to operators and regulators
• with specific techniques, it can be used to identify hazardous components in the effluent andaid operators to reduce the discharge of such components.
The application of WEA faces challenges addressed by the scientific community. They include:
• a continuous focus on the toxicity component of P-T-B in combination with a lack ofagreement on standardised tests for bioaccumulation and persistence
• WEA itself generally does not take into account the protection of sediment and thepathways of food chain exposure, which can be examined, however, in a broader ecologicalrisk assessment process
• it is important to communicate the results of WEA testing in the context of temporal andspatial effluent sampling, applied test methods, the assumptions made and the statisticalanalyses applied to the data. Further agreement and international standardisation on suchissues are required.
Generally, WEA can be used as a tool within an EMS to give detailed information on thepollutant characteristics of an effluent. As noted in Section 2.2.1, it is virtually impossible toquantify the emissions of each contaminant present in an effluent stream. However, a well-designed WEA programme can provide operators with integrated measures of effluent quality.WEA can be one of the measures used in an effluent stream register as described inSection 2.2.1.2.

Chapter 2
Waste Water and Waste Gas Treatment 23
Potential applications of WEA include:
• Regulations or guidance on effluent toxicitySome jurisdictions set numerical toxicity criteria in discharge permits, while others usetoxicity data as a planning and assessment tool. Establishing toxicity criteria ensuresconsistent evaluation of effluents: enforcement or management action is usually taken onlywhen the effluent repeatedly fails the toxicity criteria. Alternatively, less formal approachesto using toxicity data can reduce uncertainties about the risks of effluent discharge bycomplementing conventional chemical effluent data. In addition to toxicity data, evaluationsof persistence and bioaccumulation can be used in the same way. 4
• Ranking the environmental risk of discharges to an aquatic systemWEA can be used to evaluate relative risks posed by multiple dischargers with the objectiveof prioritising attention where it is needed.
• Toxicity identification / reduction evaluations (TIE/TRE)TIE / TRE are used to determine why an effluent is toxic and what can be done to reducethat toxicity to an acceptable level (see http://www.setac.org/wettre.html). TRE can bedefined as a site-specific study conducted in a step-wise procedure 5 designed to:
• identify the agent causing effluent toxicity• isolate the source of toxicity• evaluate the effectiveness of toxicity control options and• confirm the reduction in effluent toxicity.
TIE are defined as a set of procedures that identify the specific agent responsible foreffluent toxicity (and that might be a subset of tools used in TRE). Reduction of toxicity toan acceptable level may be accomplished through the identification and control of thesource of the toxicity or identification and implementation of a treatment strategy thatreduces toxicity to an acceptable degree. TIE/TRE can range from very simple to highlycomplex means and they provide a logical process for operators to address a significanttoxicity issue. TRE can guide the efforts of treatment engineers to focus on theminimisation of costs for effluent improvements. This kind of study, however, needs to bedone by experienced personnel with good laboratory support (chemical and toxicitycapabilities). By convention, TIE/TREs evaluate “toxicity”, but elements of bothpersistence and bioaccumulation could be an addition to the process (e.g. PIE/PRE orBIE/BRE).
• Prioritisation of waste treatment measuresIdentification/reduction evaluations (as described above) can be used to predict theeffectiveness of various waste treatment measures and rank their contribution to a reductionof effluent hazards. For example, toxicity test data can give an integrated measure ofproposed waste treatment improvements (e.g. toxicity testing of effluents from pilot-scaletreatment plants). This kind of information helps decision-makers to get the most value fortheir investment in waste (water) treatment.
• Judging effectiveness of treatment improvementsOnce a facility has upgraded its waste (water) treatment system, toxicity and other testing ofthe effluent over a period of operation can be used to evaluate the improvements to wastetreatment over time. A comparative study on the toxicity of different effluents showed thattreatment improvements using conventional approaches do not guarantee the absence ofacute toxicity 6.
4 Approaches described in: de Maagd, R.G.-J. 2000. Bioaccumulation tests applied in whole effluent toxicity testing. Env.
Toxicol. & Chem. 19(1): 25-35.5 USEPA. 1991. Technical support document for water quality based toxics control. Washington DC: Office of Water.
EPA/505/2-90-001.6 Tonkes, M., P.J. F. de Graaf and J. Graansma. 1999. Assessment of complex industrial effluents in the Netherlands using a
whole effluent toxicity (or wet) approach. Water Science and Technology 39 (10-11): 55.
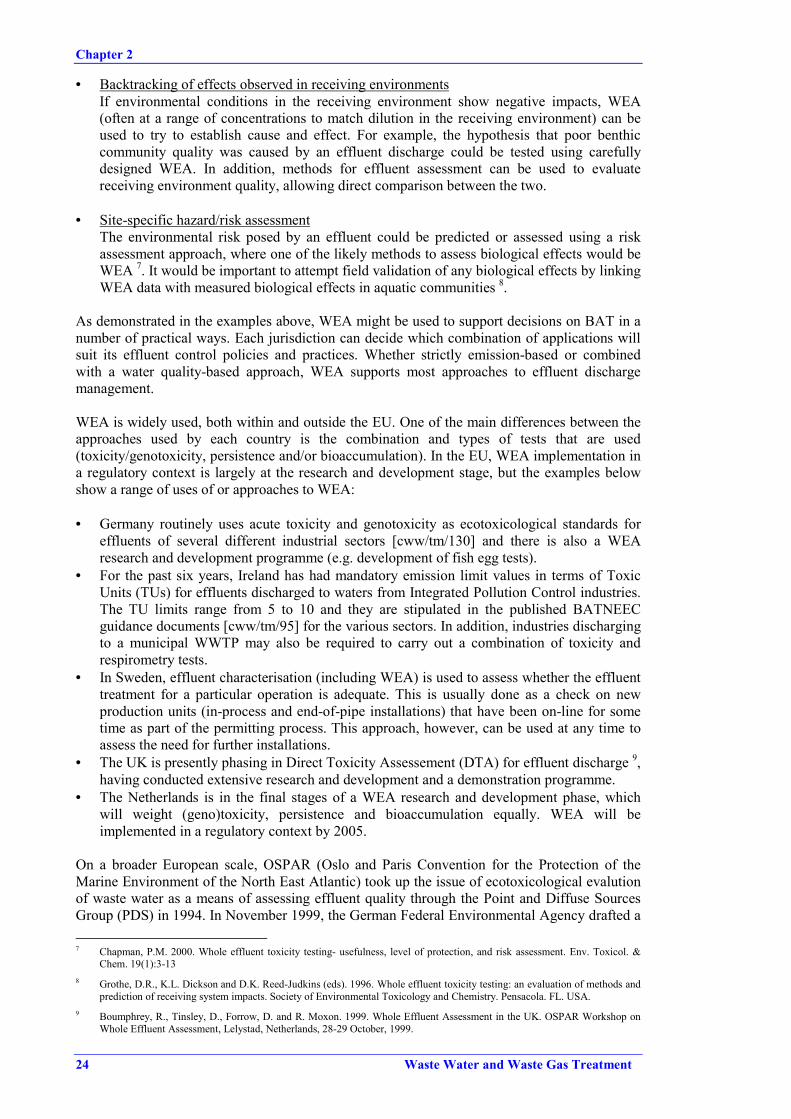
Chapter 2
24 Waste Water and Waste Gas Treatment
• Backtracking of effects observed in receiving environmentsIf environmental conditions in the receiving environment show negative impacts, WEA(often at a range of concentrations to match dilution in the receiving environment) can beused to try to establish cause and effect. For example, the hypothesis that poor benthiccommunity quality was caused by an effluent discharge could be tested using carefullydesigned WEA. In addition, methods for effluent assessment can be used to evaluatereceiving environment quality, allowing direct comparison between the two.
• Site-specific hazard/risk assessmentThe environmental risk posed by an effluent could be predicted or assessed using a riskassessment approach, where one of the likely methods to assess biological effects would beWEA 7. It would be important to attempt field validation of any biological effects by linkingWEA data with measured biological effects in aquatic communities 8.
As demonstrated in the examples above, WEA might be used to support decisions on BAT in anumber of practical ways. Each jurisdiction can decide which combination of applications willsuit its effluent control policies and practices. Whether strictly emission-based or combinedwith a water quality-based approach, WEA supports most approaches to effluent dischargemanagement.
WEA is widely used, both within and outside the EU. One of the main differences between theapproaches used by each country is the combination and types of tests that are used(toxicity/genotoxicity, persistence and/or bioaccumulation). In the EU, WEA implementation ina regulatory context is largely at the research and development stage, but the examples belowshow a range of uses of or approaches to WEA:
• Germany routinely uses acute toxicity and genotoxicity as ecotoxicological standards foreffluents of several different industrial sectors [cww/tm/130] and there is also a WEAresearch and development programme (e.g. development of fish egg tests).
• For the past six years, Ireland has had mandatory emission limit values in terms of ToxicUnits (TUs) for effluents discharged to waters from Integrated Pollution Control industries.The TU limits range from 5 to 10 and they are stipulated in the published BATNEECguidance documents [cww/tm/95] for the various sectors. In addition, industries dischargingto a municipal WWTP may also be required to carry out a combination of toxicity andrespirometry tests.
• In Sweden, effluent characterisation (including WEA) is used to assess whether the effluenttreatment for a particular operation is adequate. This is usually done as a check on newproduction units (in-process and end-of-pipe installations) that have been on-line for sometime as part of the permitting process. This approach, however, can be used at any time toassess the need for further installations.
• The UK is presently phasing in Direct Toxicity Assessement (DTA) for effluent discharge 9,having conducted extensive research and development and a demonstration programme.
• The Netherlands is in the final stages of a WEA research and development phase, whichwill weight (geno)toxicity, persistence and bioaccumulation equally. WEA will beimplemented in a regulatory context by 2005.
On a broader European scale, OSPAR (Oslo and Paris Convention for the Protection of theMarine Environment of the North East Atlantic) took up the issue of ecotoxicological evalutionof waste water as a means of assessing effluent quality through the Point and Diffuse SourcesGroup (PDS) in 1994. In November 1999, the German Federal Environmental Agency drafted a 7 Chapman, P.M. 2000. Whole effluent toxicity testing- usefulness, level of protection, and risk assessment. Env. Toxicol. &
Chem. 19(1):3-138 Grothe, D.R., K.L. Dickson and D.K. Reed-Judkins (eds). 1996. Whole effluent toxicity testing: an evaluation of methods and
prediction of receiving system impacts. Society of Environmental Toxicology and Chemistry. Pensacola. FL. USA.9 Boumphrey, R., Tinsley, D., Forrow, D. and R. Moxon. 1999. Whole Effluent Assessment in the UK. OSPAR Workshop on
Whole Effluent Assessment, Lelystad, Netherlands, 28-29 October, 1999.

Chapter 2
Waste Water and Waste Gas Treatment 25
background document on the use of WEA in waste water evaluation [cww/tm/130]. AnIntersessional Expert Group (IEG) was formed in 1999 specifically to develop WEA within thecontext of OSPAR’s Hazardous Substances Strategy (OSPAR, 2000, http://www.ospar.org).The OSPAR-IEG examined the use of WEA for different industries (to date, pulp and paper andpharmaceutical manufacturing industries). In addition, the IEG has undertaken a review of testmethods for persistence and bioaccumulation and also for genotoxicity and endocrine disruption(both in preparation).
In conclusion, WEA is a useful tool for integrated pollution prevention and control, but willcomplement traditional chemical-based controls, rather than replace them. Experience showsthat when measures of P-T-B within a well-designed WEA programme are implemented, theyresult in reductions of releases of hazardous substances into waste water. The key is to designWEA to complement other control measures within an effective environmental managementsystem.
2.2.1.2.2 Reduction of Water Usage and Waste Water Discharge
Because of its increasing importance in many areas of the European Union, it is appropriate todevote an extra paragraph to water conservation (i.e. reduction of water usage and waste waterarising) and/or re-use as a water management tool. Water conservation, for example, often helpsto reduce the negative impact of pollutant transfer from the gaseous medium to the aqueous. Itis probably not an exaggeration to state that the extent of water re-use and recycling is limitedby the creativity and willingness of the people involved rather than by technical barriers. Thisdepends, however, on local circumstances. Items to consider are, e.g.:
• develop strategies to minimise (fresh) water consumption and waste water arising in theproduction process(es) [cww/tm/67d], such as:- process alteration, which might lead to a reduction of water required, e.g. substitution of
air cooling for water cooling- direct waste water recycling, i.e. re-use of slightly contaminated waste water in other
processes not influenced by these contaminants, which results in a reduction of freshwater and waste water without changing the contaminant load
- pretreatment of waste water and subsequent re-use (same or other process), whichresults in the reduction of fresh water, waste water and load of contaminants;
• challenge waste gas abatement techniques (e.g. wet scrubbers, bioscrubbers, refrigeratorswith water cooling, wet cyclones, wet electrostatic precipitators) on their fresh waterconsumption and, if possible, avoid them, when the availability of fresh water is a limitingfactor or when the receiving water is sensitive to disturbances.
The procedure for the reduction of water consumption and waste water generally follows thepathway illustrated in Figure 2.4 [cww/tm/67d].
As a first step, a balance of water and the main contaminants that might prevent its direct re-useis carried out. When the data collection for the waste water register has not delivered consistentdata, a subsequent data reconciliation is necessary, combined with additional elaboratedmeasurement.
Based on the stationary mass balances, various options to minimise water consumption can bedeveloped and evaluated for operability. To minimise the amount of (waste) water, it might beuseful to collect and mix streams from several different production processes and recycle thecomplete mixture, increasing the potential for precipitation and corrosion. Tools to administerthese process developments are described in Section 2.2.1.3.
It must, however, not be overlooked that enrichment of pollutants that cannot be removed byinternal abatement or purification techniques may confine water re-use in water cycles.

Chapter 2
26 Waste Water and Waste Gas Treatment
Collection andreconciliation
of dataContaminant
balance
Information onwaste watertreatment
techniques
Specificationof waterquality
Chemicalmodelling
Generation ofoptions
Operationoptimisation
Developmentof economical
solution
Figure 2.4: General Procedure to reduce Water Consumption and Waste Water Arising
2.2.1.2.3 Waste Gas Emission Quantification
The waste gas emissions from some sources may have different causes, and therefore theemission resulting from each cause may need to be evaluated separately to quantify theaggregate emissions through this source. Furthermore, source reduction will mean concentratingon the cause of emissions rather than on the source through which they are emitted.
Emission quantification by source
Emissions can be quantified by source in a way that is adopted in Council Directive 1999/13/EC(VOC-Directive) [cww/tm/88].
To prepare a waste gas inventory, emissions from all potential sources have to be quantified.This can be done either by estimation, calculation or measurement according to the type ofemission and its relative importance to total waste gas emissions. Some emissions are bestestimated by output source, others by cause of emissions. In particular, uncaptured emissionsare very difficult to measure. They require quantification by contributing cause.
The following examples are offered by way of illustration:
• The emission from product (normally VOC) can be estimated, when the gaseous content ofthe product is known. The amount of solvent contained in the product, for example, is welldefined, and quantities sold or recovered are also known.
• If gaseous substances are contained in waste, their content needs to be measured, orotherwise be defined to calculate the quantity that could be emitted. This will also dependon the method used for the disposal of the waste.

Chapter 2
Waste Water and Waste Gas Treatment 27
• Ducted emissions to the atmosphere can be quantified by adequately measuring the air flowrate and waste gas concentration (preferably at different stages of the process). Thismeasurement can, however, be relatively expensive to make and can be complicated byaccess difficulties, presence of water vapour or particulate matter, or other circumstances,and may represent only a snapshot of a situation which is often variable with time. Acalculation method is therefore usually preferred, where measurement is not feasible. Thispossibility depends on the cause of the emission. For example, if a ducted emission isproduced by evaporation of a solvent in a drying operation (VOC emission), it is normallyeasier to calculate the quantity of solvent evaporated by measuring the solvent content inthe product before drying, whereas pollutants in combustion exhaust gases (NOx, SOx, etc.)or hazardous pollutants require measurement in the stack.
• Quantities not abated in an abatement system can be calculated if the quantities sent to theabatement system are known and the abatement efficiency is known.
• Uncaptured emissions are by nature difficult and often expensive to measure and often needto be evaluated by considering the causes of the emissions and the related evaluationmethods detailed below. Nevertheless, before abandoning the possibility of measuring, anevaluation of its feasibility should be done.
Emission quantification by cause
A quantification of the emissions based on their cause might often prove to be the only practicalsolution, particularly for uncaptured emissions, but often also for ducted emissions. Severalmethods exist to perform these calculations. All calculation methods provide estimates, whichin some cases indicate only the order of magnitude.
Examples are:
• Process emissions quantification needs to be based on a detailed understanding of theprocess that is taking place. In many cases this provides a fairly accurate evaluation of theemitted quantity, which may sometimes need to be confirmed by measurements. Inperforming these calculations and measurements, care should be taken to account for thevariability that may be inherent in the process. This may be a time variability – in batchprocesses the amount emitted typically varies as the batch processing progresses – or agrade variability – different grades of products emit different quantities. Calculations needto reflect these, and when measurements are performed, the operating conditions duringeach measurement have to be recorded carefully, and also measurements in sufficientnumber have to be made to account for the full range of variability. A yearly materialbalance needs to take the actual yearly production into account to reflect properly the gradeslate effect.
• Storage tank emission calculations can be based on the methodology developed by theUnited States Environmental Protection Agency (USEPA) [cww/tm/89]. The calculationsare cumbersome and require knowledge of some meteorological data that can be obtainedfrom the local meteorological institute. Significant storage emissions can be generated fromabove-ground atmospheric tanks. However, breathing losses from underground tanks ortanks with a set pressure higher than atmospheric are significantly reduced. Working lossesdepend on the number of turnovers per year (i.e. how many times the volume of the tankwas filled/emptied during the year) and are low for low turnover. If vapour balancing isapplied during tank filling, the working losses are eliminated. Therefore in many facilitiesthe storage emissions are low compared with the other emissions. It is advisable to evaluatethe storage losses based on material balance before embarking on detailed calculations. Ifdetailed calculations are required, it is strongly advised to use the TANKS computer tool[cww/tm/90] developed by the USEPA, which is a computerised version of the USEPAcalculation method.

Chapter 2
28 Waste Water and Waste Gas Treatment
• Handling emissions can be calculated assuming a vapour content of the air being exhaustedfrom the container being loaded corresponding to the vapour pressure of the product beingloaded at the loading temperature, multiplied by a saturation factor. The saturation factordepends on the method of loading, and represents the degree of saturation achieved onaverage in the vapour space during the loading. Saturation factors for road tankers of BLCsare [cww/tm/72]:- submerged loading in a clean cargo tank: 0.5- submerged loading in a wet cargo tank (dedicated service): 0.6- splash loading: 1.45
(a factor greater than 1 represents over-saturation caused by liquid droplets beingexpelled with the vapour).
• Equipment leak emission calculations rely on methods developed by the USEPA and varyfrom simple (based on counts of leak points and average emissions per point) to complex(based on correlations between a measured ppm concentration at the leak interface and aleak rate specific to the type of equipment considered). Additional description is provided inthe USEPA-453 Protocol [cww/tm/152], which is also detailed within the IMPEL project“Diffuse VOC Emissions” [cww/tm/154]. These calculation methods provide roughestimates of actual emissions, and usually a more sophisticated calculation method willyield lower results. Calculations based on equipment counts are the only ones not requiringmeasurements with an organic vapour analyser at each potential leak point. If thesecalculations provide a satisfactory result for the purpose, no further analysis is required. Ifthe equipment leak emissions become significant, a Monitoring and Maintenanceprogramme [also called Leak Detection and Repair (LDAR)] should be implemented,entailing measurement of each potential leak point and opportunity for repair of leaks beingdiscovered. This work requires skill in performing the measurements and recording them ina database and is therefore best carried out by specialised contractors.
• Non-routine emissions caused by start-up, shutdown and maintenance operations need to betaken into account. These depend heavily on the operating methodology. No widelyaccepted method exists to estimate these emissions. They can, however, become significantin batch operations with frequent opening/closing of vessels. In these cases the bestpractical approach is to set up a measurement campaign to quantify the emissions linked toeach operating step.
• Accidental emissions should not occur. Since they happen, however, the related solvent lossshould be reflected in a material balance. It is recommended that these incidents be trackedand a record kept of the estimated quantity emitted during each event.
2.2.1.3 Energy and Material Flow Analysis (EMFA)
EMFA comprises a whole family of tools to optimise the consumption of energy, raw material,water and the discharge of effluent by pursuing systematically the internal streams of energyand mass in production processes. As such it is either part or extension of a stream inventory,using the obtained data to draw the necessary conclusions. To support this task, computersoftware of a different degree of complexity is available. The normal procedure of EMFA is:
• starting with input-output analysis of the process• iteratively repeating the procedure to identify improvement potential by quantitative
comparison of input and output data with target values• simulation of different scenarios (process design) with individual evaluation of their
environmental impact• identifying the ‘best’ solution according to set targets (cost effectiveness, waste prevention,
resource saving etc.).

Chapter 2
Waste Water and Waste Gas Treatment 29
The goal for implementing an EMFA tool is to operate processes more efficiently and lowertheir impact on the environment (e.g. reduce waste discharge and/or water consumption),eventually saving costs.
An example of an EMFA approach is detailed in Appendix 7.2.
2.2.2 Operational Management Tools
Whereas the inventory management tools provide all the necessary information without whichno decisions about effective waste prevention, minimisation and/or treatment are imaginable,the operational management tools provide the basis to put these decisions into action.
2.2.2.1 Monitoring
Monitoring forms a bridge between inventory and operational tools, but is also connected withstrategic and safety tools. The bulk of the information provided by inventory tools, e.g. thestream register(s), is collected with the help of monitoring systems and programmes. Probablythe most important issue is controlling the proper operation of production and treatmentprocesses, to check if the set environmental targets are met and to identify and help to trackaccidents (incidents).
“You can’t manage what you can’t measure.” Therefore, to measure the effectiveness of anEMS, real data are required on the precise effects of the activities of the industrial site on theenvironment as well as on individuals. It is thus necessary to conduct a planned, regularsampling and monitoring programme. The parameters to be monitored should include[cww/tm/132]:
• point sources, diffuse and fugitive emissions to the atmosphere, water or sewer• wastes, particularly hazardous wastes• contamination of land, water and air• use of water, fuels, energy, oxygen, nitrogen and other gases (e.g. argon)• discharge of thermal energy, noise, odour and dust• effects on specific parts of the environment and ecosystems (see e.g. Section 2.2.1.2.1)• on-site accidents and near-misses• staff injuries• transport accidents• complaints from community residents.
Monitoring, however, is not restricted to analytical measuring. It also includes regularmaintenance, visual and safety checks.
Parallel to this document, a BREF on Monitoring is being produced to which the reader isreferred for further information. Monitoring in the context of waste water and waste gas isfurther dealt with in Chapter 3; standards for analytical parameters are listed in Annex 7.4.
2.2.2.2 Setting and Regular Review of Internal Targets or Programmes
An EMS needs to establish an environmental programme where global, long-term and internal,site-specific targets are set. The global and long-term targets are part of company policy andthus not included in this BREF, but it is stated that such a policy is a necessary item.
The parameters for which internal targets are set should be selected according to their relevance.In order to limit the number of these parameters, the purpose of the target setting should be kept

Chapter 2
30 Waste Water and Waste Gas Treatment
in mind, i.e. an optimum running of production and abatement operations should be ensured,thereby minimising the impact on the environment as a whole. It is usually not necessary to settarget levels for each and every parameter involved, but to use surrogate parameters to describethe emissions. The measurable target levels need to be set in such a way that the permit level ofthe final outfall as well as the specific local conditions can be readily met.
There are several classes of targets, one class given as general standards, another as site-specificstandards. Examples of general standards are:
• the requirements of Environmental Quality Objectives (EQO) or Environmental QualityStandards (EQS) as well as technology standards and ‘Good Manufacturing Practice’(GMP)
• the general requirements for River Basin Quality (‘Water Framework Directive’ or nationalregulations on water quality)
• the general requirements for emissions to air, international or national programmes• requirements of internal company standards issued for all their sites, independent of local
permit demands.
Examples of site-specific standards are:
• requirements of permit conditions (e.g. ensuring continuous compliance with emission limitvalues)
• specific limitations on the ecotoxic content of any final outfall in accordance with the limitsset for the receiving medium (surface water, air), e.g. in Germany the achievable values forfinal discharge into a water body are 10:- TF = 2 (fish test)- TD = 4 (daphniae test)- TA = 8 (algae test)- TL = 16 (luminescent bacteria test)- TM = 1.5 (mutagenity).
As a long-term target for the future, German chemical industry (according to VCIdeclaration May 2000 [cww/tm/166]) aims to further reduce the toxic impact of their wastewater discharge, taking into consideration:- acute toxicity to fish, daphniae and bacteriae- chronic toxicity to algae- mutagenicity.They finally seek to achieve that their effluents into receiving water bodies do not exceeddilution factors of Tx = 2 (TM = 1.5); toxicities caused by salt concentrations are notincluded.
When targets are being set, a plan should also be drawn up for actions to be taken when a targetlevel of one or more tributary streams, or of the final outfall, is exceeded for a certain amount oftime. These actions have to be clearly defined and the responsibilities and competence for theseactions have to be assigned.
Examples of internal targets are:
• continuous reduction of pollution loads• compliance with permit requirements• reduction of eco-toxic effects (see Section 2.2.1.2.1).
The role of monitoring in target setting is mentioned in Section 2.2.2.1.
10 The toxicity units (T-values or sometimes G-values) are expressed as ‘dilution factors’, TX = 2 means the waste water stream
has to be diluted to half of its original concentration for the test organisms to survive. See also Section 2.2.1.2.1.

Chapter 2
Waste Water and Waste Gas Treatment 31
The dynamic process of target setting, given that the chemical industry and the conditions inwhich it operates are subject to continuous development and constant change, implies a regularreview, regardless of whether new legal requirements have been introduced. Thus, a programmeto meet these changes needs to be set up. The goal of this regular review is the continuousimprovement of the environmental performance of a chemical industry site as a whole. Toachieve this permanent goal, a reduction programme should be established that contains thefollowing elements:
• a periodic evaluation of environmental management practices associated with operationsand equipment, taking into account:- environmental impacts- changing legislation- public concerns- implementation of ongoing improvement;
• incentives for the implementation of cost-effective actions and recognition for significantcontributions to emission reduction targets, such as:- cost allocation of waste water and waste gas treatment by introducing a pricing system,
e.g. the introduction of an internal ‘Polluter Pays Principle (PPP)’, for discharge fromthe individual production units, which are charged internally with the costs of thetreatment facilities according to their share of pollutant input; this is a good incentive tominimise emissions and thereby reducing the shared treatment costs of the productionunit
- internal awards (bonus payment) for operational improvement proposals by staff- internal competition for reducing process disturbances and accidents;
• inclusion of objectives for release prevention in design of new or modified facilities andprocesses, such as:- introduction of recycling of starting compounds or products, when modifications of the
installation are planned- introduction of water conservation measures, under the same conditions as above;
• preventive maintenance and appropriate control technology to minimise emissions andlosses
• implementation of engineering and operating controls and procedures, with operatingcriteria, to improve prevention, early detection and containment of spills/releases either by- monitoring surveillance or- organisational measures, using personnel power, such as regular control rounds, or
installing containment systems with sufficient collecting volume;• investigation and evaluation of spills/releases that have occurred, to identify corrective
actions to prevent a recurrence• communication with employees and members of the public regarding information on
emissions, the progress in achieving reductions and future plans, which should include astructured dialogue on the concerns and ideas of both employees and members of thepublic.
This review may lead to decisions to modify or even adapt the environmental objectives,programme or policy.
2.2.2.3 Choice of Treatment Options
With the necessary information concerning emissions arisings on a chemical site and theenvironmental targets and demands defined, the next step is the selection of appropriate controloptions. Usually the goal is to find a cost-effective treatment method offering an optimumenvironmental performance. An appropriate choice normally requires treatability and/or pilotstudies.
Available control options are generally evaluated and selected according to:

Chapter 2
32 Waste Water and Waste Gas Treatment
• the characteristics of the emitted stream, e.g.:- flow rate- concentration and properties of contaminants- presence of impurities- temperature- pressure
• the amount of the part that needs treatment• the targets and goals to be achieved, pollutant recovery being the first choice• legal requirements• the control options that exist for a given case.
This evaluation and selection process – the necessary data obtained by stream inventory (seeSection 2.2.1.2) – always results in additional site-specific conclusions to be taken into account,the key factors varying from site to site, e.g.:
• plant location• size and layout of the site• current environmental and economic performance of the installations in question, their age,
design and anticipated life time• potential and degree of process integration within an installation and between installations• type and quality of receiving medium• impact on the environment as a result of an actual or foreseen emission• remaining life time and performance of existing pollution abatement equipment• availability of resources• safety• limitations and constraints on an installation imposed by other legislation• results of cross-media analysis (water consumption, waste production, energy consumption)• capital and operating costs.
When final or central treatment facilities are involved, source reduction options should beconsidered. As a result of the considerations mentioned above, the appropriate treatment systemwill be selected by considering the options for:
• source reduction• collection (drainage) system• treatment methods.
Special issues for waste water and waste gas are dealt with in Sections 2.2.2.3.1 and 2.2.2.3.2respectively.
2.2.2.3.1 Selection of Waste Water Control System
Figure 2.5 illustrates a decision path for finding the appropriate waste water treatment systemfor the individual waste water streams [cww/tm/132]. Dotted lines symbolise alternativeoptions.
The following questions, which contain the main objectives of the Directive – prevention,minimisation and control – should be addressed for each type of waste water.
• Can the amount and contamination level be reduced or eliminated by process-integrated orother means?
• Does the waste water stream in total require treatment, or would a segregation system beuseful?
• Is the waste water stream suitable for biological treatment, or should it be subjected todecentralised pretreatment?

Chapter 2
Waste Water and Waste Gas Treatment 33
Productionprocess
Wastewater?
Minimisa-tion or
avoidance?
Biologically non-degradable?Containing
POPs?
Organiccontami-nants?
Conta-minated?
Pretreatment
Pretreatment
Central ormunicipal WWTP
YES
YES
YES
YESNO
NO
NO
NO
YES
NO
RECIPIENT WATER
Figure 2.5: Decision Diagram for Appropriate Waste Water Control System
As an example criterion for prioritising a more thorough examination of tributary waste waterstreams, the presence of recalcitrant TOC load in the order of 20 – 50 kg/d has been used inparts of Germany. Other relevant parameters in this context are heavy metals, halogenatedorganic compounds and toxicity.
The selection procedure follows the steps mentioned in Section 2.2.2.3:
• Source reductionThe options for waste water reduction at source should be considered first. In manyinstances, these will result from process considerations described in the related verticalBREF. Suggestions for frequently occurring causes of contamination are:

Chapter 2
34 Waste Water and Waste Gas Treatment
Process water usage depends on the manufacturing process. Its contaminant concentrationdepends mainly on the solubility of the process stream in water. The following suggestionsshould be taken into account:
- the segregation of process water from rainwater and other water effluent, to allow re-use or recycling, as well as to minimise the amount of water which requires treatment,the installation of a roof over certain process areas, loading and unloading bays etc.being an option to consider
- the use of process water in a recycle mode, whenever it is economically feasible, with amaximum number of recycles before discharge
- the avoidance of direct contact cooling systems whenever feasible- a critical review of the need for water scrubbing systems or, when they are used, the
investigation of the potential for water regeneration and re-use (see Section 2.2.1.2.2)- the minimisation of water flow for water flushing and sealing systems, which are
frequently needed for safety reasons but should not be allowed to flow without controlor restriction
- the removal of free oil to a slop oil system before its discharge to the sewer- an effective water / hydrocarbon separation as far as practicable in the process
equipment before discharging the water to the sewer- if feasible, the use of a process fluid instead of steam in Venturi jet devices, or of a
liquid ring pump, preferably using a process fluid as seal liquid, or of a dry vacuumpump, to minimise the contamination generated by vacuum devices
- as far as possible the capture of the discharge from safety valves, thermal relief valves,bleeds from double block isolation or twin seal valves, because it is not recommendableto discharge them to areas where clean rainwater is collected
- laboratory effluent collection to a slop tank.
Unintended operational releases to the sewer can generally be avoided through enhancedoperator attention. Additional instrumentation or slop collection will often be helpful toenable operators to perform their task efficiently. Also, slop collection facilities arerecommended wherever hydrocarbon liquid releases frequently occur. To reduceunintended operational releases, the following suggestions should be taken into account:
- to plug or cap vents and drains whenever they are not in use- to allow flush collection in a slop system rather than to send it to the sewer, preferably
using closed loop sample systems or sampling valves that require no flushing (e.g. ramtype sampling valves), the sample bottles sized in such a way that overfilling is avoidedand the sampling frequency and sample kept to the minimum required
- to avoid the overfilling of vessels or tanks by installation of an adequate level ofinstrumentation or adequate procedures
- to minimise the use of hoses- to consider facilities to collect hose drips- to consider roofs over loading racks- to install kerbs to ensure containment of spills- to consider adequate instrumentation to protect against overfilling of road tankers- to avoid product loss during water draw-off from tank bottoms- to consider the installation of reliable interface detection instruments- to consider the pigging of lines instead of flushing and draining, whenever applicable- to vacuum-clean spills whenever possible rather than to hydrojet or steam them to the
sewer- to leave water hoses to run only when attended, which is good management /
manufacturing practice.
Conservation of water by process-integrated and other measures, however, leads to morehighly concentrated water streams that might be profitably recycled or exploited for higherproduction yields or be treated with higher efficiency. So, any means to reduce waterconsumption might directly lead to a reduction in the quantity of contaminants evacuatedthrough the sewer.

Chapter 2
Waste Water and Waste Gas Treatment 35
Turnaround and other maintenance activities often result in significant watercontamination. To minimise this requires careful planning well in advance, such as:
- to define a dedicated equipment cleaning site, equipped with adequate facilities torecover hydrocarbons and solid waste, making this the obligatory location forequipment cleaning as far as possible (e.g. exchanger bundle cleaning)
- to plan carefully the draining of equipment to avoid undesirable releases to the sewer- to evaluate carefully the equipment cleaning needs and methods- to define a disposal route for all cleaning effluent.
Releases resulting from equipment failure are by nature unpredictable. Preventivemaintenance for equipment and implementation of a monitoring programme are ways toensure that these are minimised, e.g.:
- to avoid as far as possible pump seal failure- to consider the installation of seal-less pumps, vibration monitoring or leak alarms on
seals- to detect leaks to cooling water resulting from exchanger failure by periodically
checking the hydrocarbon content, pH and electrical conductivity of the cooling waterreturn
- to repair detected leaks as soon as possible- to analyse frequently leaking systems to define the most suitable type of equipment,
packing, gasket, etc.
Background contamination from foul sewer systems can be minimised by, e.g.:
- periodically checking sewer inspection chambers for the presence of, e.g., freehydrocarbons, to vacuum pump them, if needed, to the slop
- cleaning of dirty sewers that might cause a significant level of backgroundcontamination.
• Selection of Drainage Systems (see Section 2.2.2.4.1)
• Installation of Buffer CapacityThe installation of buffer capacity is beneficial for particular waste water streams atproduction plants as well as for collected waste water streams before they enter the centralWWTP, in case of an operating failure. Further details in Section 3.3.3.
• Treatment MethodsTreatment options to consider are:
- pretreatment for an individual waste water stream with downstream central biologicaltreatment, e.g. a stream containing heavy metals or refractory COD, to reducecontaminants at source, which prevents undesired dilution and dispersion ofcontaminants that otherwise would escape undetected and untreated into a receivingwater
- final treatment for an individual waste water stream with direct discharge into thereceiving water
- treatment for distributed waste water, as pretreatment or final treatment- central treatment for a whole site, e.g. mechanical/biological treatment plant (central
biological WWTP), precipitation/flocculation/sedimentation plant or a treatment plantfor contaminated rainwater
- no treatment for low-contaminated individual waste water streams or non-contaminatedrainwater.
The various treatment techniques are described in Chapter 3.

Chapter 2
36 Waste Water and Waste Gas Treatment
2.2.2.3.2 Selection of Waste Gas Control System
The selection procedure follows the sequence mentioned in Section 2.2.2.3. When planning themodifications entailed in either source reduction or end-of-pipe treatment, it should always bekept in mind that all changes can have significant safety implications, particularly when dealingwith flammable substances. Therefore it is absolutely essential to assess thoroughly the effect ofany change on the safety of the installation.
• Source ReductionControlling emissions at a cost-effective level requires, firstly, investigation of sourcereduction opportunities. Careful planning is needed to optimise the pollutant recovery and,consequently, the related capital and operating costs.
Investigation can reveal further opportunities for source reduction of emissions. In mostcases the related investment is lower than for an end-of-pipe treatment. A thoroughinvestigation of the source reduction possibilities is therefore highly recommended. Itshould be based on the causes for emissions. Therefore a good knowledge of the relativeimportance of each cause will be essential for prioritisation purposes. Once all feasiblesource reduction possibilities have been exhausted, an end-of-pipe treatment may still berequired.
• Emission Collection (see Section 2.2.2.4.2)
• Treatment technology selectionWhen source reduction measures do not lead to the required emission reduction, an end-of-pipe treatment is required. All treatment devices can handle only ducted emissions.Therefore, if uncaptured emissions have to be abated by means other than source reduction,collection hoods and a ventilation system (including the necessary safety facilities) arerequired upstream of the end-of-pipe abatement system. Installation costs for theseventilation systems can be significant. Therefore these systems need to be designed withcost effectiveness in mind. The investment required for the end-of-pipe treatment itself willgenerally be a function of the total gas flow rate to be treated, therefore efforts to minimisethis flow rate will pay off. Finally, selecting a suitable treatment technology will have asignificant impact on the required capital and operating costs.
The key design issues for waste gas treatment systems are the flow rate of the gas stream,its contaminant concentrations and, in addition to the maximum values, their degree ofvariability. The nature – or ‘chemistry’ – of the contaminants is of primary importance sinceall treatment systems are limited in this respect, e.g.:
- only flammable vapours are suitable to be incinerated- contaminants containing halogen and/or sulphur may require flue gas treatment
downstream of thermal and catalytic oxidation- the efficiency of condensation depends on the vapour pressure of the contaminants at
condensation temperature, therefore substances with higher vapour pressure are lesssuited to condensation
- only compounds of small molecular size can be effectively adsorbed and desorbed- biofiltration of non-biodegradable compounds will not be effective- membranes work better on specific compounds- the efficiency of wet scrubbing depends on the solubility and vapour pressure of the
contaminants.The value of emitted product will determine the incentive to recover it from the off-gas, sothe more valuable the product the more the use of techniques allowing recovery (e.g.adsorption, condensation, membranes) will be preferred to destruction (abatement)techniques (e.g. thermal and catalytic oxidation, biofiltration).

Chapter 2
Waste Water and Waste Gas Treatment 37
The presence of impurities in the off-gas affects the design of the system. Sometimes theseimpurities have to be removed in a pre-treatment step, e.g.:
- water vapour, which affects the adsorption efficiency, condensation systems,particularly refrigerated or cryogenic systems, or filter systems
- dust, which causes trouble for adsorption, absorption or catalytic oxidation where dustparticulates plug the packing or adsorbent bed
- catalyst poisons, which destroy the efficiency of a catalytic incinerator or a catalyticfilter
- acids, which affect the biofilter / bioscrubber activity.
The permitted exhaust concentration needs to be considered. Most technologies are limitedin removal efficiency, and in particular condensation, absorption and biofiltration achievefar from 100 % removal efficiency. This is an advantage of thermal or catalytic oxidationsystems, which reach very high destruction efficiencies of about 99 %, but on the otherhand the additional consumption of energy and fuel and discharge of flue gas have to beconsidered. Adsorption systems are also very efficient, as long as care is taken to avoidsaturating the adsorbent.
Safety issues are particularly important for thermal and catalytic oxidation systems. MostVOC / air mixtures are flammable at VOC concentrations above 40 g/m3 at 20 ºC andatmospheric pressure. In order to avoid flashback, i.e. propagation of a flame in the inletducts to an incinerator, one has to ensure that the inlet concentration is always well belowthe LEL. The opposite option – VOC concentration well above the HEL – has to ensure thatthe VOC concentration does not under any circumstance fall below this higher limit. Adetonation arrestor or a seal drum can be provided to prevent the risk of flashback forunexpectedly high concentrations. Besides this, the incinerator has to be installed at alocation where there is no risk of presence of flammable vapours, and a detailed analysis isrequired to ensure safety of the installation. Also systems using other technologies have tobe subject to a detailed safety review. Many systems (e.g. adsorption, membranes) willresult in more concentrated streams, possibly producing concentrations within theflammable range. For adsorption systems, bed overheating risks have to be evaluated. Manysystems include compressors or blowers which may have safety implications. Generally, adetailed safety review of each installation is required and it may have a significant impacton the selection of the system. Thus, safety issues are important for electrostaticprecipitators (de-dusting of flammable gases should be avoided) and fabric filters (ignitionpossible because of hot gases, pyrophoric powders and sparks).
The investment required for the system is obviously also of primary importance. Whenevaluating the required investment, care should be taken to include the costs of all therequired facilities. In particular, utility supply, vent collection ducting to the abatement unitand requirements in ancillary equipment (e.g. a seal drum for an incinerator, watertreatment unit for a condenser) may have a significant cost impact.
Although the initial investment is important, the operating costs may be even moreimportant. These include utility consumption, replacement of catalyst, adsorption media ormembranes, costs of chemicals, operations and maintenance, by-product disposal, pre- andpost-treatment, etc. When evaluating these, care should be taken to quantify the costsassociated with each stage of the operations (normal operations, regeneration, idling). As anexample, thermal oxidisers are normally fitted with refractory lining. This refractory issensitive to humidity and therefore has to be kept warm at all times. The amount of fuelrequired to keep it warm during idling times is an important consideration for systems notoperating 24 hours per day 7 days per week. Keeping a regenerative or a flameless systemat temperature requires a fraction of the fuel needed for a simple thermal oxidiser.

Chapter 2
38 Waste Water and Waste Gas Treatment
Layout constraints may play an important role. Incineration systems have to be locatedoutside of locations where flammable vapours could be present. The installation of a systemwithin a hazardous area will require designing the electrical and instrumentation systemsaccordingly, which may affect the cost of the unit significantly. Access requirements to theunit should be considered as well.
Availability of utilities is yet another key aspect in the selection of the most appropriateabatement technology. Availability of a suitable fuel is required for an incineration system,and the fuel costs may have a big impact on the operating costs. Fixed bed adsorptionsystems normally use steam for desorption; however, if steam is not available in sufficientquantity, the design has to be adapted accordingly. Sufficient power supply is required forcondensation systems and sufficient water for water scrubbing systems.
Treatment systems are dealt with in Chapter 3.
2.2.2.4 Choice of Collection System
The choice of an adequate collection system is influenced by the choice of the treatmentsystems and thus depends on the task and target of the waste water and waste gas treatment. Theselection methodology is described in the following sections for waste water drainage and wastegas ducting.
2.2.2.4.1 Selection of Waste Water Collection and Segregation System
Taking into account the results of the waste water register, the choice of a suitable waste watercollection system ensures the optimum discharge of waste water entailing the least possibleimpact on the environment. Depending on the downstream treatment requirements, a drainagesystem needs to be installed that meets the needs of:
• rainwater drains• cooling water drains, according to the grade of pollution• drains for waste water suitable for direct discharge without any treatment• drains for sanitary waste water• drains for process waste water according to its origin• drains for decentralised or centralised (on-site or off-site) treatment facilities• separate drains for organic waste water and inorganic waste water without relevant organic
load, thus avoiding dilution of both parts, entailing loss of treatment efficiency.
Those prerequisites, as well as economic factors, require the implementation and maintenanceof waste water separation/segregation systems. Waste water that does not need treatment – e.g.uncontaminated cooling water or uncontaminated rainwater – is segregated from waste waterthat has to undergo treatment, thus reducing the hydraulic load on the drainage and treatmentsystem.
Waste water streams that fail to meet the quality requirement for central treatment are subject tospecial pretreatment operations. Thus, for each waste water stream, the decision processillustrated in Figure 2.5 should be followed and the appropriate sewer system designedaccordingly.
The waste water can be collected either by underground or overground sewers or drainage.Existing plants are often equipped with underground systems because they can be operated asgravity sewers, saving power for pumping, and the pipelines are out of the way of processinstallations. Overground collectors have the advantage that leaks or breaches can easily bedetected before much damage is done to the groundwater reservoir. If the groundwater level atan industrial site is near to zero, as happens with sites near embankments, estuaries or coastalareas, there is usually no choice other than ducting the sewers overground. Advancedtechnology uses overground sewers because maintenance, retrofitting and repairs are easier to

Chapter 2
Waste Water and Waste Gas Treatment 39
perform and thus their operation is economic. A disadvantage is the need for pressure ducts andthe risk of formation of emulsions because of pumping. Climatic situations, however, might bea problem for overground sewers (e.g. areas with long periods of frost).
2.2.2.4.2 Choice of Waste Gas Collection Systems
Waste gas collection systems are often far less extensive than waste water collection systems.They are installed mainly:
• as vent collection systems, routing several vents to a common treatment system• to capture diffuse and/or fugitive emissions by extraction hoods and duct them to a
treatment unit• as flaring systems, which are primarily installed to allow safe disposal of off-gas in
emergency situations.
In order to minimise the air flow rate to the control unit, it is recommendable to encase theemission sources as much as possible by means of partitions separating the sources of emissionfrom their surroundings. This, however, presents operability (access to equipment), safety(avoiding concentrations too close to the LEL) and hygiene concerns (where people access isrequired inside the enclosure). The enclosure needs to be designed in such a way that vapoursare prevented from escaping by ensuring sufficient air velocity through the openings (0.5 m/sminimum recommended). The total flow rate should be sufficient to ensure dilution of vapoursto a value well below the LEL. Where this concentration is likely to be exceeded, theinstallation of an LEL detector inside the enclosure is required, including appropriate controlequipment.
In most cases, the emission treatment system will be installed on existing ducted emissionpoints or vent collection systems. A critical review of these existing systems is warranted beforedetermining the total flow rate of the treatment system. This review is required for two basicreasons:
• Actual flow rates delivered by blowers may be significantly different from the blowerdesign flow rate, because of pressure drop upstream and downstream. Actual flow rates atless than 50 % of the blower design capacity are not infrequent. Therefore basing thetreatment system flow rate on the sum of design blower flow rates delivering to the controlunit may lead to a significantly oversized end-of-pipe treatment. Measurement of the actualflow rates is therefore recommended. Allowance has to be made in the final system designto account for a change in flow rates (increases or decreases) which may be caused by theinstallation of the treatment unit. In the case of a decrease in flow rate, the safetyimplications must be checked as well.
• The existing vents or fume extraction systems may not have been designed with flow rateminimisation in mind. Small adjustments to the design may lead to significant reductions inflow rate and consequently significant savings on the end-of-pipe treatment cost.
For VOC collecting systems the most important issues are personnel safety and hygiene.Devices that can be installed to prevent the ignition of flammable gas-oxygen mixtures orminimise its effect by preventing explosions are, e.g.:
• detonation arrestor• seal drum• water seals.
The concentration in VOC collection systems must be kept well below or above the explosiverange, which means that the correct mixture of waste gases is crucial.

Chapter 2
40 Waste Water and Waste Gas Treatment
2.2.2.5 Implementation of the Selected Emission Control Options
Once emission control measures have been selected, their implementation must be planned indetail, regardless of whether they are of an organisational or hardware nature. When unexpectedproblems are identified during the detailed planning and/or review, the selection of the emissioncontrol options may need to be revised. It is fully understood that successful implementation ofcontrol techniques requires a good design stage. Otherwise the performance of the controloption would show a low environmental standard and a poor cost-benefit ratio of theenvironmental investment.
The time required to implement emission control measures depends very much on the nature ofthe measures and the type of facility where they need to be implemented:
• organisational measures, e.g. revision of operating procedures or scheduling practices, canusually be implemented relatively quickly
• control measures, e.g. computer control optimisation routines, may take several months (oreven more) to develop and test in the operating environment
• hardware measures, e.g. implementation of control devices or process modifications aimedat source reduction, may require from several months to several years, depending upon thesize of the projects and the ability to implement them in a running plant environment. Thisduration includes the design of the facilities, permitting, detailed engineering, procurementof the equipment, installation and start-up. In many cases a full plant shutdown (turnaround)is required to make plant modifications, and in large chemical or petrochemical operationsthis may happen only once every few years.
2.2.2.6 Quality Control Methods
Quality control methods are tools which are used as a ‘trouble shooter’ when an existingtreatment process runs out of control or cannot fulfil permit requirements. The releases from atreatment plant are a function of its influent characteristics and the efficiency of the treatmentoperation. To check whether the treatment process runs properly, the quality of the output isjudged against a set of standards. If these standards are not met, there is an immediate need tore-establish performance within the standards by [cww/tm/129]:
• detecting the change• identifying the cause of the change• taking corrective action to restore the system to the status quo.
The problem solving and system improvement require the entire plant or site to be looked at,and corrective action requires the cooperation of several departments. In the following, thesemethods are illustrated for waste water treatment, the control method for waste gas treatmentbeing adequate.
Exerting control [cww/tm/129]Some variables can be controlled by an operator of a WWTP, such as clarifier blowdown,dissolved oxygen and chemical feed, which can be adjusted when circumstances dictate it.Others are out of his/her control, e.g. waste water flow rate and characteristics. These variablescan severely influence the operation of the WWTP and ultimately have an impact on the qualityof the discharged water.
The controllable aspects are all adjusted in reaction to a change in the system. Adjusting tooperating conditions is a feedback activity that attempts to produce a constant output in light oferratic inputs. The variables that cannot be controlled are handled in a predictive or feed-forward fashion. On-line testing and monitoring will give the WWTP advance warning of stepchanges that occur to its input.

Chapter 2
Waste Water and Waste Gas Treatment 41
Control / improvement [cww/tm/129]The common mode of operating a WWTP is that of process control. Only those operations thatneed to be done to meet standards and stay within control regarding effluent quality areperformed, thus losing a part of system control. The steps to regain control when it has been lostare the well-known ones of detection, identification and corrective action (see above). The easyoption of doing nothing is in most cases not acceptable.
In quality terms ‘in control’ means that the system is handling the variations the best it can, butthe process may not be capable of statistically complying with the imposed effluent standards,because either there are new standards or the input has changed. A new set of standards requiresimprovement, which results from a remedial journey to reach a new zone of control, which lieswithin the new standards.
Quality improvement tools [cww/tm/129]The goal of quality improvement is to reject the typical standards and reach a level ofperformance never achieved before, extending the scope of problem solving beyond thecorrection of obvious problems. While it is important to make the system work, it might bemore important to review the entire system and identify areas of potential improvement. Theway to do this is a three-step-process:
• identification of causes of potential problems• acquisition of data and analysis• statistical process control.
The first step in problem solving and quality improvement is to focus on a limited number ofpotential problems and attempt to identify their root causes. A cause effect diagram in the formof an ISHIKAWA Fishbone Diagram, as shown in Figure 2.6, provides an effective way toorganise and display the various ideas about what those root causes might be.
Another tool is the Pareto analysis, which is a ranked comparison of factors related to aproblem. It is a graphical means of identifying and focusing on the vital few factors orproblems.
A flow diagram provides the steps required to produce a desired result and may be used toclarify the procedures used and give a common understanding of the overall process.
The second step of problem solving and quality improvement is acquisition of accurate andreliable data and their analysis by gathering the necessary information and preparing the data forbetter usage, e.g. as histograms and/or trend charts. These allow a visualisation of the degree ofprocess variation and identification of special problems.
The third step on the way to improve the performance of a WWTP is the use of statisticalprocess control (SPC). SPC uses statistical methods to study, analyse and control the variationin a process. It is a vehicle through which one can extract meaningful information about aprocess so that corrective action, where necessary, can be implemented. SPC is used to quantifydata variation and determine mathematically whether a process is stable or unstable, predictableor erratic. An SPC chart is a tool that can answer the following questions:
• Is the WWTP producing the same results it always has?• Is it in a state of statistical control or are special causes of nonconformance evident?• Is it operating as well as can be expected, given its physical constraints?• Exactly when is corrective action required and when should the system be left alone?• Should corrective action be taken by changing the process or changing procedures?

Chapter 2
42 Waste Water and Waste Gas Treatment
PEOPLE MATERIALS METHODS
MEASUREMENTSMACHINES
Poor maintenance
Lack of attention
Lack of training
Insufficient staff
Insufficient mixing
Poorqualityeffluent(permit
violations)
Wrong product
Wrong feed rate
Wrong feedpoint
Poor influent
Wrong equip-ment settings
Improper pro-duct makedown
Incorrectprocedures
Wrong equip-ment readings
Insufficiently dissolved oxygen
Insufficient waste/recycle
Excessive hydrau-lic loading
Not enough nutrients
Poor control
Poor SVI
SVI: Sludge Volume Index
Effect
Figure 2.6: Cause Effect Diagram of Poor Quality Effluent
In constructing an SPC chart, upper and lower statistical limits are calculated from the data.These limits are set by the process and are based on earlier performance. They are not to beconfused with the operating control limits, i.e. the limits used to operate the WWTP or meet thepermit limits. The operating control limits need to be inside the statistical limits (upper andlower).
Immediate attention or action is required, when:
• data fall outside the statistical limits and thus are considered to be a special cause ofvariation, e.g. a sampling procedure, a liquor spill or an instrument requiring calibration
• the statistical limits are too wide and actual values will eventually fall outside of the controlrange or permit limits.
When the statistical limits defined by the process fall outside of the operating standards orrequirements, the operator is probably reacting properly to changes he notices in the process. Heis wrestling with a system that is expected to operate within a range, within which it isstatistically not capable of operating consistently. The data indicate that there is too muchvariation to operate the WWTP consistently and that system changes need to be implemented togain control.

Chapter 2
Waste Water and Waste Gas Treatment 43
2.2.3 Strategic Management Tools
Strategic management tools are described when they apply to the organisation and operation ofrelease handling. Their application to process management might belong to the scope of therespective vertical BREFs or the BREF on economic and cross-media issues. Such tools thatevaluate environmental and economic options, are, e.g.:
• risk assessment• benchmarking• life cycle assessment (LCA),
2.2.3.1 Risk Assessment
Risk assessment is a common methodology to calculate human and ecological risks as a resultof activities of production processes. It may take into account continuous and discontinuousemissions, leakage losses, accidental emissions. It is a stepwise and iterative process,comprising at least the first of five steps [cww/tm/132]:
• hazard identification, i.e. identification of the capacity of a substance to cause adverseeffects
• concentration-effect assessment, i.e. estimation of the relationship between the level ofexposure to a substance and the incidence and severity of its effects
• exposure assessment, i.e. estimation of concentrations or doses to which environmentalcompartments (including human population) may be exposed
• risk characterisation, i.e. estimation of incidence and severity of the adverse effects likely tooccur
• risk estimation, i.e. quantification of the estimated likelihood in a risk characterisation.
When the first step does not identify any hazard in the discharge stream, the application of aniterative process is obsolete.
The iterative process mentioned above characterises the risk, identifies who or what is at risk aswell as the levels, sources and pathways of exposure. The next stage is – as a result of the riskassessment process – to reduce the risk and to mitigate the consequences of an adverse event[cww/tm/132]. Thus, risk assessment can give valuable recommendations on the requirementsfor treatment facilities as well as for the development of preventive and minimisation measures.Risk assessment might find that, e.g.:
• an emitted stream possesses toxic properties that do not allow its exposure to theenvironment at all, with the effect that complete abatement or recycling is required
• the installation of a process might not be possible, because the receiving medium is alreadypre-contaminated to such a degree that additional contamination would result in hazardousexposure
• a different kind of treatment might be advantageous when compared with a more commonone
• a change in the production process might be required to meet environmental qualitydemands.
The decision process of appropriate measures falls outside the scope of risk assessment. Socio-economic and political considerations may influence these decisions. It is therefore important toseparate the risk assessment based solely on technical data from this policital process[cww/tm/132], which normally includes risk-benefit considerations including cost allocation,and often entails subjective judgement. These thoughts will be taken into account in the BREFon economics and cross-media issues.
Computer programs exist for the application of risk assessment processes [cww/tm/84].

Chapter 2
44 Waste Water and Waste Gas Treatment
2.2.3.2 Benchmarking
Benchmarking is a process of comparison of the achievements of one plant or site with those ofothers. It is a tool for the operator to evaluate his/her way of performing, e.g. his/her way ofwaste water and waste gas management or treatment, by reference to similar activitieselsewhere. Central elements are the calculation method of the ranking and the verification of theperformances provided. Benchmarking can be an instrument to improve the environmentalsituation at a site.
2.2.3.3 Life Cycle Assessment (LCA)
LCA involves the comparison of the potential environmental effects of different ways ofoperating. The main objects of investigation are products and services, but it can also betransferred to facilities and disposal routes and thus bear on the subject of this document. TheLCA consists of the phases [cww/tm/132]:
• goal definition and scoping• inventory analysis, including material and energy flow as input and output over the entire
life cycle• impact assessment, entailing a determination of potential environmental impacts• interpretation of the results, which are used to select the ecologically most favourable
variants.
The LCA is still under development, with inventory analysis as the most and interpretation asthe least advanced part. In spite of the partly subjective evaluation method, LCA is a very gooddecision tool, because complex relationships can be systematically reduced to comparably fewdata sets. LCA is performed under recognised rules, such as [cww/tm/132]:
• ISO 14040: Environmental management – life-cycle assessment – principles and guidelines• ISO 14041: Environmental management – life-cycle assessment – life-cycle inventory
analysis• ISO 14042: Environmental management – life-cycle assessment – life-cycle impact
assessment• ISO 14043: Environmental management – life-cycle assessment – life-cycle improvement
assessment.
LCA considers only environmental aspects, just one element for decision-making, whereaseconomic and social aspects are additive rather than integral, built up on the results of the LCA.With the help of LCA, the environmental relevance of the objects of investigation, e.g.production lines and treatment services, can be determined in a clear and reproducible way,which is the basis for ecological optimisation, i.e the selection of ecologically “better”alternatives. LCA can be used to determine the following items:
• the ecologically optimum disposal routes• the ecological breakeven point for recycling and other environmental protection practices• weak points in the life-cycle of the object of investigation• priorities of necessary actions. [cww/tm/132].
Because of the methodology involved in LCA, there are limitations such as [cww/tm/132]:
• environmental burdens due to an object of investigation cannot be determined in absoluteterms, but only relatively, because the true impact on the environment is not accessible
• no generally valid inferences can be made about the environmental compatibility ofmaterials, auxiliaries and media, because neither their intended use nor their anticipatedbenefit is known
• general statements about disposal routes can only be derived when the reference values forthe arisen waste are known (which is normally not the case).

Chapter 2
Waste Water and Waste Gas Treatment 45
LCA cannot dictate decisions, it can merely aid in making them. Thus it is insufficient to basean environmentally orientated decision on the result of the LCA alone, if the way in which theresult is achieved has not been considered.
2.2.4 Safety and Emergency Tools
Since all chemical industry sites have the potential to cause significant environmental harm andto threaten water supplies and public health, measures have to be taken to avoid the risks as faras possible or to react to accidents in such a way as to minimise their effects. Though it is thetask of engineers to construct equipment and run a plant so that no accidents can occur, it iscommon experience that this is not successful in all cases.
Spillages of chemicals and oil are obvious threats on chemical sites. However, materials non-hazardous to humans may also cause serious environmental problems, as can the run-offgenerated in the event of a fire. The environmental damage may be long term and, in the case ofgroundwater, may persist for decades or even longer. Rivers, sewers, culverts, drains, waterdistribution systems and other services all present routes for the conveyance of pollutants off-site and the effects of a discharge may be evident some distance away. In many cases, majorpollution incidents can be prevented if appropriate pollution prevention measures are in place orimmediately available. Contingency planning is the key to success and both preventivemeasures and incident response strategies as management tools need to be carefully addressed[cww/tm/147].
Accidental gas releases to air normally need to be prevented by appropriate safety equipmentand proper operation of the installations, because in most cases gaseous releases cannot becaught. Exceptions are gases mixable with water such as acids or ammonia, which can bedowsed by a water curtain and thus become an item for waste water treatment.
Pollutants may escape from the site into the water environment by a number of pathways, suchas [cww/tm/147]:
• the surface water drainage system of the site, either directly or via off-site surface watersewers
• direct run-off into nearby watercourses or onto ground, with potential risk to groundwater• via the foul drainage system, with pollutants either passing unaltered through a sewage
treatment works or affecting the performance of the works, resulting in furtherenvironmental damage
• through atmospheric deposition, such as vapour plumes.
2.2.4.1 Managing Fire-fighting Water and Major Spillages
The main focus of fire-fighting water and spillage management is on containment strategies andequipment to handle these spillages. Other management tools, however, such as operational andstrategic tools, should also be considered and supported by contingency or pollution incidentresponse plans (see Section 2.2.4.2) to reduce the impact of any unplanned event that does occur[cww/tm/147].
The first step, however, is to consider the fire-fighting strategies and possible methods to reducethe amount of fire-fighting water run-off generated, e.g. by the use of sprays rather than jets,controlled burn and the possible recycling of fire-fighting water, where safe and practicable[cww/tm/147].
Containment SystemsThere will be one or maybe more levels of containment on chemical sites. In deciding theappropriate level of containment, a risk assessment (see Section 2.2.3.1) is helpful. The operatorshould consider the hazardous materials on site, the risks posed by accidents, fire, flooding andvandalism, likely failure mode of the primary containment (i.e. the tank or vessel in which the

Chapter 2
46 Waste Water and Waste Gas Treatment
material is stored), the sensitivity of the receiving environment and the importance ofpreventing any resultant discharge to it.
In many cases, primary and local containment (bunding) will prevent an incident from causingpollution. However, where local containment is not provided, or risk assessment indicates thatadditional security is required, e.g. to contain fire-fighting water run-off, which may amount tothousands of cubic metres, then remote containment systems may be employed. These may beused in isolation, or in combination with local containment, for anything from a small area,covering part of a site, to a number of large individual installations. They may be required toprotect both surface and foul water drainage systems [cww/tm/147].
The capacity needed for remote containment systems has to take into account:
• the potential harm of the contaminated fire-fighting water (evaluation methods based on R-phrases can be used as well as systems like the German VCI-concept on fire-fighting waterretention capacity, where hazard classes are defined)
• the primary capacity (i.e. the capacity of the vessel in which the material is stored orhandled)
• the potential amount of rainfall during the emergency event• fire-fighting and cooling water• foam (as fire-fighting medium)• dynamic effects, such as initial surge of liquid or wind-blown waves.
Remote containment systems can consist of:
• containment lagoons (or earth-banked containment basins), if the site topography and theground and soil conditions are suitable, the lagoons being substantially impermeable
• tanks, built for the purpose, their actual size, design standards and protective finishesinfluenced by the risk rating of the site, the retention time, the quantity and the nature of thematerials stored
• shut-off valves and penstocks, operated manually or triggered by means of automaticsensors, to isolate part or the whole of a site
• oil separators.
Although permanent containment facilities should be provided at many sites, there may becircumstances where a spillage cannot be dealt with by such facilities, e.g. if it occurs outside abunded area. In other cases, particularly at smaller sites, fire-fighting water containmentfacilities may be impracticable because of cost and space considerations. In such cases,temporary containment systems or pollution control materials should be considered[cww/tm/147].
Examples of emergency containment measures include [cww/tm/147]:
• sacrificial areas, designed to allow infiltration and to prevent run-off, equipped with animpermeable lining system to prevent dispersal into other strata or groundwater
• bunding of vehicle parking and other hard standings• pits and trenches, equipped with a liner, particularly in areas of high groundwater
vulnerability• portable tanks, overdrums and tankers.
Emergency Materials and EquipmentA variety of products are available to deal with spillages or to contain spills in emergencycontainment areas. Any materials or equipment used must be well maintained and strategicallyplaced at accessible locations which are clearly marked with notices explaining their use. Thepollution incident response plan (see Section 2.2.4.2) should identify pollution preventionequipment and materials and their location. Such materials and equipment are [cww/tm/147]:

Chapter 2
Waste Water and Waste Gas Treatment 47
• sand and earth to soak up spillages of oil and chemicals and to use in sand bags• proprietary absorbents• sealing devices and substances for damaged containers• drain seals• booms.
Measures should be in place to dispose of, as soon as possible, any spillage, contaminatedmaterial or fire-fighting water. Where re-use is possible, the spilled material should be returnedto storage on site. If off-site disposal is required, it can be done by [cww/tm/147]:
• an ordinary waste carrier• discharge to a foul sewer with the approval of the sewerage operator• treatment of hydrocarbon-contaminated water with site oil separators.
2.2.4.2 Pollution Incident Response Planning
A pollution incident response plan, as mentioned several times in Section 2.2.4.1, is mainly astrategy to spread all information needed in a most efficient way to all those who may beconcerned. The general way to implement such a plan is [cww/tm/148]:
• providing details of the site and of those for whom the plan is relevant• listing key contact numbers, such as emergency services, relevant environmental regulators,
local water supply and sewerage operators, HSE executive etc., key-holder and contactstaff, specialist advisers
• having ready a site drainage plan, containing a clear diagram of the site, showing layout andaccess details, off-site discharge points for surface water and trade effluent, etc.
• providing a site oil, chemical and product inventory of all substances stored on site, givingthe maximum quantity likely to be stored, with data sheets attached
• detailing emergency procedures, defining the scope of activities covered, staffresponsibilities and the procedures for dealing with events such as spillages and leakingcontainers
• giving rules on staff training and exercises to be carried out periodically.
All staff and contractors working on the site should be made aware of the plan and should knowtheir role if an incident occurs.
An exemplary form of such a pollution incident response plan is given in Annex 7.5.


Chapter 3
Waste Water and Waste Gas Treatment 49
3 APPLIED TREATMENT TECHNOLOGY
This chapter gives more detail on the considerations introduced in Sections 1.3 and 2.2.2.3 anddescribes the treatment techniques for waste water and waste gas according to theirenvironmental performance and impact as well as to their economic viability. However, variantsof well-known technologies with only slight variations to the general process are not mentionedseparately.
The physical and chemical background of the treatment techniques can easily be found inavailable textbooks and is therefore not repeated in this BREF. The operations and processesdealt with in this chapter are end-of-pipe techniques that are commonly used in the chemicalindustry, so common treatment techniques for releases from power stations and wasteprocessing are included, since large chemical sites are often equipped with their own energyproduction (power, steam) and waste incineration. For more details, however, the relevantBREFs on large combustion plants and waste incineration need to be consulted. Process-integrated measures are described when they are generally in use and not related to specialproduction processes.
The systematic overview in this chapter follows the pollutant path and presents the techniquesin relation to their application on a chemical site. Further details can be found in Sections 3.3.4and 3.5.
3.1 Information Presented in this Chapter
The description of treatment techniques follows a fixed order to provide the necessaryinformation to assist a permit writer in implementing BAT for an installation in the chemicalsector. The information is also intended to help an operator to fulfil the BAT requirements andwrite a good permit application. This structure is chosen to make sure that for all treatmentoperations and processes the same kind of information is collected and presented and acomparison between different treatment options is feasible.
The description of treatment operations and processes is subdivided into the paragraphs:
• description• application• advantages/disadvantages• achievable emission levels / performance rates• cross-media effects• monitoring• economics.
The first paragraph, headed description, outlines the fundamentals of a treatment techniquewithout going into detail. Theoretical physical and chemical background is left out deliberately.This information can be found in a variety of good textbooks. The use of chemical andmathematical formulae and equations is avoided wherever possible without loss of information.This paragraph also gives an overview of what equipment is involved in this technique and howthe technique is operated. Whenever graphical information is available, either as a sketch or aflow diagram, it is used to replace verbal explanations, provided there is no loss of necessaryinformation.
The second paragraph, headed application, describes how and where the technique in questioncould be commonly applied, also taking into account its use in related sectors, when it can beexpected to be useful in the chemical sector as well. It also includes the related pollutants to betreated. Part of this paragraph is a listing of possible application limits and restrictions.

Chapter 3
50 Waste Water and Waste Gas Treatment
The third paragraph, headed advantages/disadvantages, tries to outline some benefits andproblems associated with each technique, bearing in mind that some fundamental laws of massand energy conservation prevent us controlling or abating anything without leaving any tracesin the environment.
The fourth paragraph headed achievable emission levels / performance rates, shows theperformance of the technique. It lists the achievable emission levels and/or removalperformance. The values listed are those that can be expected under regularly good workingconditions. They do not, however, imply that these values are achievable under allcircumstances and with all applications. The explanation of the term “achievable emissionlevels” is given in Section 4.1. Performance rates are quoted relative to the feed load, with theresult that low feeds give low performance (percentage) rates, whereas high feeds give highperformance rates, though the residual concentration may still be high.
The fifth paragraph, headed cross-media effects, shows the impact on the environment arisingfrom the action of this technique, e.g. generation of sludge, waste heat, gaseous releases, noise,odour etc. as well as the input of consumables, such as water, energy and auxiliary substances.
The sixth paragraph, headed monitoring, describes the examination of the input, the output andthe regular working of the technical devices in compliance with best monitoring practice.
The seventh paragraph deals with economics. It tries to give information on costs of the saidtechnique, as far as this information has been made available. To clarify what is meant by costsin this horizontal document, Section 3.2 gives some explanations without claiming to presentspecial economic issues, for which reference to the BREF on economics and cross-media effectsis recommended.
3.2 Information on Costs in this Horizontal Document
Costs of erecting a new emission control technology, retrofitting existing technologies orimplementing process-integrated measures, are largely dependent on site-specific andproduction-specific issues. Thus, the absolute costs of actually building or installing a treatmenttechnology have no real information value for a horizontal approach, because they are notcomparable with anything. The costs to implement the appropriate and necessary infrastructureare not included either. Another important factor in the selection of a suitable treatmenttechnique is the payback period for a process-integrated measure. Since the costs involved willalways be plant- and/or process-specific, this horizontal document cannot consider thatadequately. It does, however, point out the supplier equipment costs relative to a productioncapacity, waste water / waste gas stream or pollutant amount (i.e. costs per tonne of product, m3
of waste water or 1000 Nm3 of waste gas or kg of a pollutant). Items to consider whenevaluating cost data that are not generally included in this document because of their site- andprocess-specific characteristics are explained in the following paragraphs [cww/tm/48].
3.2.1 Total Installed Costs vs Supplier Equipment Costs
When trying to determine the cost of emission control techniques, it is often thought easiest toselect a technique that appears to suit the requirements at hand, and solicit a cost quotation froma supplier. While fast and convenient, this approach can lead to vastly inaccurate estimates ofthe actual cost of the emission control technique. This occurs on an absolute basis, like cost pertonne of emission reduced, and on a relative basis when comparing technology options.Different techniques can often have very different distributions of individual cost elementsbetween the various types of costs that make up their total installed cost. Typically 20-30 % ofthe total erected cost is for major equipment purchase, but can also be as low as 10 %.

Chapter 3
Waste Water and Waste Gas Treatment 51
Operating costs must also be critically considered when making the absolute and/or relative costcomparisons of various control techniques. These can be overlooked when taking a hardwareview of control technology, as is often done when considering the implementation oftechniques. It is important to take account of the fact that operating costs can vary greatlybetween technologies, depending on utilities usage, auxiliary chemicals consumption, labourrequirements, waste generation potential and the cost of its disposal, etc.
Supplier costs will typically include only the cost of the specific equipment supplied. Often thisis a relatively small fraction of the overall cost of a project. Additionally, the engineering costsassociated with project design and supervision are often ignored, but can easily equal the cost ofthe supplier equipment. Expenditure often not thought of when estimating the cost of a projectincludes items such as the need to:
• relocate existing facilities• stop production during retrofitting• enlarge and/or move existing sewer lines• perform soil investigations• develop new as-built drawings, process and instrumentation diagrams• modify existing piping and facilities such as blowers, pumps, etc.
An example is given in Table 3.1 [cww/tm/48] for a tail gas clean-up unit at a refinery with totalerected costs, prices from 1997 given in euros. The direct equipment costs – or supplier costs –are EUR 7.9 million, compared with the total costs of EUR 29.4 million, i.e. just 27 % of theoverall erected costs.
Description EUR millionEquipment costs (vendor costs)
MaterialsCatalysts and chemicals
7.30.6
Subtotal 7.9Indirect costs
Detailed engineeringField supervision
Owner
8.01.62.4
Subtotal 12.0Direct costs – non equipment
SubcontractsTemporary construction and consumables
8.60.4
Subtotal 9.0Total capital 28.9
ExpenseLicensing fee 0.5
Subtotal 0.5Final total 29.4
Table 3.1: Example of Costs of an Actual Project
3.2.2 Greenfield Costs vs Retrofitting Costs
Greenfield installations and existing operations and units require essentially the sametechnology to improve environmental performance (e.g. control of specified pollutants andmeeting specified emission limit values). The differences between these two types ofinstallations are essentially driven by the fact that on a greenfield site it is possible to ensure thatall the essential requirements are explicitly considered when the facility is designed. In the caseof a retrofit (or revamp), the original design choices may result in otherwise available or evenpreferred control techniques being of limited applicability or possibly even unfeasible.
Specific assessment of the suitability of a technique for retrofitting is required, but many of thetechniques mentioned in the following sections of this chapter have already been successfully

Chapter 3
52 Waste Water and Waste Gas Treatment
retrofitted to chemical installations and deliver an environmental performance equivalent to thatwhich could be expected from new plants. Revamp projects on existing installations or sitesencounter a variety of technical and managerial issues, the most common of which are outlinedbelow. These issues are not excuses to avoid the adoption of environmental improvementtechniques, but are some of the factors pertinent to a revamp:
• a more complex and time-consuming project definition phase• test runs or pilot studies to assess the impact of a change on the whole process• consideration at the design stage of the knock-on effects on all existing facilities• surveys of the existing facilities at the detailed engineering stage to define the exact location
of all interfaces. Space availability may introduce constraints (e.g. equipment placed in anelevated structure, pipe routing, need to relocate some existing facilities, construction oftemporary facilities)
• special precautions so that works can be carried out safely, and without damage, even whilethe plant continues to operate
• taking advantage of a planned shutdown (turnaround) to carry out any construction workthat cannot be done during normal operations. These multi-year events may dictate revamptiming
• a longer, or earlier, shutdown than planned (with commercial and financial implications)• the decommissioning and dismantling of old, redundant equipment• staff training in the operation of new equipment• revised plant documentation (e.g. operating instructions, permit revision, manuals for
maintenance, inspection and safety).
In addition to the prime purpose of improved environmental performance, the retrofitting ofchemical installations can confer other significant benefits. Some techniques (e.g. pretreatmenttechniques with recovery potential, process-integrated measures) bring major economic returnsin the form, for example, of increased efficiency and higher yields or of cost reductionsassociated with savings of energy and water (or reduced charges for discharges, where such aregime applies), that can offset the investment and operating costs of the retrofit. Retrofittingcan also bring competitive advantage by showing product buyers and stakeholders (e.g.shareholders, local communities, regulators and environmental groups) that the company hasadopted cutting edge technology.
Considerations of whether a technology constitutes an appropriate technique for a retrofitapplication deal primarily with the ability of the existing installation to meet the process,physical and structural requirements of the control facility. This distinction in availabletechnology being applicable to new and existing facilities is a crucial one to include in anydeterminations of techniques. Where information is available, this chapter gives informationabout the potential retrofittability of a technique.
3.2.3 Capital Costs vs Operating Costs
Different control techniques (equipment-based controls and procedural techniques) can be verydifferent in terms of the distribution of costs between capital and operating expenses. Someexpensive equipment has low running costs, while other very low-cost equipment involvessevere increases in operating costs such as labour, utilities or consumable chemicals. It isgenerally easier to quantify the cost of hardware than the full implications of the likely expensesincurred by a technique. Also equipment items will become more costly over time due toinflation, etc.
Labour costs are an important element in operating costs and can have different consequenceson a decision in favour of or against a technique, depending on the different wage rates in theMember States. So, if labour costs are referred to in this document, labour hours are given –when available – as well (or instead).

Chapter 3
Waste Water and Waste Gas Treatment 53
3.2.4 Initial Emission Control Costs vs Incremental Control Costs
An important consideration of the cost of a technique relates to the changing cost effectivenessof a given technology depending on the point of control from which one starts the costeffectiveness calculation. Usually the costs and effectiveness – given as a percentage emissionreduction, or tonnes of emissions reduced – of installing or implementing a technique arepresented against an uncontrolled baseline operation. In such a case one calculates the costeffectiveness easily by dividing the costs by the emission reduction achieved.
There are many situations where certain levels of control already exist within specific industrysites. In these cases the costs to achieve a given emission reduction target are significantlyincreased over the initial cost effectiveness values for an uncontrolled baseline operation. Thisneeds to be accounted for in determining the cost effectiveness of a technology or technique.
So, for incremental control costs, the cost effectiveness Keff [kg reduction/currency unit] can becalculated as:
Keff = (B – A)/C
B: emission reduction for technique considered [kg]A: emission reduction for technique already installed [kg]C: costs for technique considered
3.3 Waste Water Treatment Techniques
3.3.1 Process-Integrated Measures
Some important – and normally easily retrofittable – production-integrated measures relevant towaste water are described below. Some illustrative examples are mentioned in Section 3.3.1.3.Their introduction, e.g. as water saving measures, however, has to be carefully assessed.Though their influence is normally environmentally beneficial, they might under specificcircumstances lead to negative impacts in other environmental compartments that might over-shadow the benefits of water conservation or pollutant decrease.
3.3.1.1 Counter-current Extraction as an Example of Water-saving Processes
Conventional product washing processes are multiple extractions working batchwise by treatingthe product phase with water in order to remove salts or other soluble minor components. Theamount of water used is generally several times the amount of product to be washed. At eachindividual extraction step there are unavoidable losses of product caused by its solubility,emulsification and the formation of solid layers at the phase boundary, etc.
By optimising the extraction process, and/or introducing advanced extraction processes, such ascounter-current extraction, a considerable reduction of waste water (and waste) can be achieved.A simultaneous increase of pollutant concentration might allow an easier and/or more effectivetreatment, or, under special circumstances, recycling of material. The degree and method ofoptimisation depends on the production capacity and on having frequent production runs.Counter-current extraction is economic specifically for large-scale plants. There it can betailored to a particular production process. For plants dealing with small outputs, pilot-scaleproductions or seldom-used campaign productions, other processes are more suitable.

Chapter 3
54 Waste Water and Waste Gas Treatment
3.3.1.2 Multiple Use and Recirculation Operations
A distinction has to be made here between:
• waste water originating directly from production (e.g. reaction water, distillates, washingwater, filtrates)
• waste water originating from equipment cleaning (e.g. during maintenance, rinsing ofblockages or product caking, cleaning of multi-purpose equipment because of campaign orproduct change).
Specific treatment steps to remove interfering constituents can improve the efficiency of arecirculation operation. Thus, for example, neutralisation, stripping or filtration of process waterstreams can enable water to be re-used, e.g. as raw water or utility water supply. The re-use ofprocess water (make-up water, mother liquors) is possible, when constituents such as by-products or salts will not adversely affect the quality of downstream productions. In fact, inmultiple stage product washing, washing water streams can frequently be used as make-upwater, or as input water into a preceding washing step.
The re-use of water from washing, rinsing and equipment cleaning, has, in addition to thereduction of waste water load, the advantage of product recovery and increase of product yield,provided the water is recirculated into the production process itself. This requires facilities forcollection, buffering or storage of waste water, which might be a limiting factor.
3.3.1.3 Indirect Cooling with Vapour Phases
The injection of water into a gaseous phase is used to cool or condense vapours. The directcontact of water with vapour phases, however, generates large amounts of waste water pollutedby the vaporous contaminants. Introduction of surface heat exchangers instead of injectioncondensers / coolers avoids the generation of polluted cooling water streams, the pollutantsremaining in the condensate. So, indirect cooling / condensing leads to water saving. To givesome idea of the potential savings, it takes approximately 27 m3 of water to cool one tonne ofsteam down to 35 ºC (the temperature generally accepted as an upper limit for discharge). Withindirect cooling this amount is run in a cooling cycle [cww/tm/82] replacing only water lost byevaporation.
Water saving effects are decreased when entrained particles, sublimating material, crystals orcaked matter coat the heat exchange surfaces, or plug the spaces between the exchange surfaces,so they need regular maintenance.
There are, however, processes where a conversion to indirect cooling is not appropriate[cww/tm/82]:
• It can be necessary for crystallisation to stir a liquid organic phase vigorously together withwarm or hot water, and then to bring down the temperature rapidly below solidificationtemperature by adding ice or cold water (‘temperature shock’). The goal of this procedure isto get a filterable suspension without lumps or clots.
• Another example is the diazotization of amines. In this process, temperature is kept at aconstantly low level by the addition of ice, to prevent thermal decomposition of thediazonium compound as well as its deposition on equipment, which otherwise would meana considerable risk of explosion.
• One further example is the quenching of hot gas streams, where cold water is injected intothe gas stream to decrease its temperature so effectively and rapidly that reactions ofcomponents in the gas stream are prevented (e.g. recombination reactions in flue gas fromcombustion processes resulting in generation of PCDDs and PCDFs) and simultaneously toabate one of its pollutants (e.g. HCl).

Chapter 3
Waste Water and Waste Gas Treatment 55
3.3.1.4 Waste Water-free Processes for Vacuum Generation
Owing to their almost undisturbed operation, their low maintenance requirement and their lowcosts, water jet and vapour jet vacuum pumps are used universally.
Waste water-free vacuum generation can be achieved by using mechanical pumping systems ina closed circuit procedure, discharging only a small amount of water as blowdown, or by meansof dry-running pumps. This discharge amounts to less than 5 % of that of the once-throughsystem [cww/tm/82]. In some cases, waste water-free vacuum generation can be achieved byuse of the product as barrier liquid in a mechanical vacuum pump, or by use of a gas stream outof the production process.
Whether waste water-free vacuum generation is possible has to be determined in each particularcase. In selecting the proper process, account needs to be taken of the potential problems,particularly with respect to corrosion, tendency to caking, explosion risk, plant safety andoperational reliability. Appropriate limitations have to be considered, especially in the case ofmechanical vacuum pumps with a closed cycle, such as liquid ring pumps, rotary sliding-vanepumps or diaphragm vacuum pumps. Here, for example, vapours can decrease the lubricity ofthe oil.
Provided that gas condensation in the pump is prevented by, e.g., high gas outlet temperature,dry-running pumps are an attractive option when solvents are to be recovered, or when a highvacuum is necessary. These pumps cannot be employed if the gas stream contains largeamounts of condensable, dust-forming or coating material.
3.3.1.5 Waste Water-free Processes for Exhaust Air Cleaning
About one third of the exhaust air cleaning systems in the chemical industry work with a water-based or alkaline (caustic) scrubbing process. This particularly captures inorganic compoundssuch as hydrogen chloride, sulphur dioxide and water-soluble organic substances.
Waste water-free technologies for exhaust air cleaning are used, in particular, when hazardoussubstances or non-degradable organic substances would otherwise enter a biological wastewater treatment plant, where they might cause disturbances or be discharged untreated into thereceiving water.
Examples of waste water-free techniques for exhaust air cleaning are:
• collection and subsequent thermal or catalytic oxidation of calorific waste gas streams,preferably with energy recovery
• application of appropriate dry de-dusting equipment (e.g. demisters, cyclones, electrostaticprecipitators, fabric filters) to separate particulates and aerosols
• use of dry / semi-dry gas treatments (e.g. activated carbon adsorption, lime/sodiumbicarbonate injection) for waste gas streams loaded with organic or inorganic gaseouscontaminants
• use of regenerative organic solvents (or oils) instead of water as scrubbing liquid forspecific gaseous contaminants.
3.3.1.6 Substance Recovery or Retention from Mother Liquors or by OptimisedProcesses
Substance recovery of waste water constituents with reasonable expenditure is normally onlyfeasible for concentrated waste water streams. So it is usually limited to mother liquors.Depending on the method of synthesis, mother liquors are generally aqueous solutions kept afterproduct separation, or washing water. Recovery might comprise, e.g.:

Chapter 3
56 Waste Water and Waste Gas Treatment
• removal of utilisable individual compounds, such as starting materials, products, solvents orcatalysts
• material conversion with subsequent substance recovery, e.g. thermal or catalytic oxidationwith recovery of chlorine (from organic chlorides) as hydrochloric acid.
Substance recovery is viable for higher waste water concentrations (e.g. 10 g/l or more). Ifeasily removable components are involved, e.g. volatile, solid, precipitable or extractablecompounds, recovery processes might be viable even at lower concentrations.
Substance retention by way of optimised processes encompasses the modification of processsteps as well as additional measures, such as improvement of mother liquor work-up.
Substance retention – aside from pollutant prevention such as modification of formulation orimprovement of production yield – can also be achieved by pollutant removal, e.g. adsorption orextraction, or by conversion, e.g. oxidation or incineration.
3.3.1.7 Use of Low-contaminated Raw Materials and Auxiliaries
Contaminated raw materials and/or auxiliaries can import pollutants into the production chainand thus into the waste water system. Examples are:
• metals from crude vegetable fats• chloro-organic compounds (AOX/EOX) and other impurities from technical-grade
hydrochloric acid• mercury as contamination in sodium hydroxide from chlor-alkali electrolysis using the
amalgam process• contaminants of, in particular, intermediates and externally acquired precursors.
The operator’s ability to influence this situation is limited by:
• insufficient information from suppliers• increase of contaminant importation because of recycled materials• transferring emission problems to other locations by work-up of the raw material.
Purification of raw material can be implemented by manufacturers who have technical facilitiesto reduce and dispose correctly of the removed contaminants, such as resin exchange forhydrochloric acid or filtration/adsorption for crude sodium hydroxide.
3.3.2 Flow Balancing
In general, waste water treatment plants operate most effectively at reasonably constantconditions of hydraulic load (or flow rate) and contaminant load. In practice, however, bothflow rate and contaminant load can fluctuate markedly due to factors such as:
• process conditions• use of water for washing• ballast water treatment• maintenance times• rainfall.
To buffer the production against short-term (e.g. daily) and long-term (e.g. weekly) variations,equalisation facilities should be considered, either decentralised at the various production sitesor centrally in or near the WWTP. Sometimes they can also be installed downstream of aWWTP. The appropriate capacity of the buffer containment is a function of the anticipated

Chapter 3
Waste Water and Waste Gas Treatment 57
fluctuations [cww/tm/132]. The buffer containment may be installed either in-line or as a side-stream to which the flow can be diverted at peak periods or in case of production disturbances,and run down at a controlled rate when the flow has moderated. For process waters which canemit to the environment, tanks are used for this purpose, whereas for surface water drainage,open lagoons or retention ponds are used (see Section 3.3.4.4.1) [cww/tm/48].
The result of buffering and equalising is, e.g.:
• equalisation of loads, such as:- organic load- salt concentrations- nitrogen load, e.g. as a prerequisite, together with TOC load, for optimum
denitrification• adjustment of the required C : N : P ratio• neutralisation of acidic and alkaline waste water streams• equalisation of waste water flow rate• fulfilment of legal requirements by cutting peaks of the waste water discharge.
Flow balancing or buffering might also be used as a control facility for unusual influx events tothe WWTP, and so the capacity of the buffering containment might be determined not only bythe fluctuations, as mentioned above, but also by the extent of the hazard potential. Details areillustrated in Section 3.3.3.
3.3.3 Storage or Retention Capacity for Failure Events
Operational failures, equipment leakage, unintentional contamination of cooling water or otherdisturbances in production or storage units can lead either to an increased discharge ofpollutants into the receiving water via the WWTP, or to its malfunction. The risk of such eventscan create the need for centralised or decentralised receiving (or buffer) facilities. For theoperation of a barrier or buffer system, timely detection of the failure event is crucial. Thisdetection can be ensured by both analytical and organisational means [cww/tm/132].
There are several buffer devices used for this purpose. Their capacity has to be sufficient tostore all waste water, probably including rainwater, incurred during a production failure. Theycan be combined with flow balancing tanks.
One device (see Figure 3.1), the self-contained buffer, contains two buffer tanks that receive thewaste water stream alternately. While one tank is filled the other is checked and then released tothe waste water discharge or downstream WWTP or disposed of as waste, depending on theresults of the check. The receiving capacity of each containment needs to be sufficient to takethe entire amount of waste water arising during the period of analysis and depletion of one tank.For complex and large chemical sites with large amounts of waste water, this is often an optionfor selected waste water streams, because otherwise the requirement for tank volume isimmense. The larger the tank the longer the depletion time and vice versa, which might result ina circle with no exit.
Another device is the connected buffer, either discontinuously (see Figure 3.2) or continuouslyflooded (see Figure 3.3). The discontinuously operated buffer is disconnected when not in use,i.e. when there is no failure reported by the control and alarm system. During normal operationthe waste water circumvents the buffer system, and only when the control system detects anunusual event is the buffer tank filled. The required tank capacity is the amount of waste waterarising during the time of malfunction. This device is used with single production installations,a collection of selected waste water streams and with the total amount of waste water. Therequired volume is normally much less than with the self-contained buffer mentioned above.

Chapter 3
58 Waste Water and Waste Gas Treatment
Sewer system
Alternate filling
Dischargeafter Check
Disposal pathway
Waste water pathway
no segregation
Process water
Figure 3.1: Self-Contained Buffer with Alternative Filling
Sewer system
Dischargeafter check
Disposal pathway
Waste water pathway
Process water
Figure 3.2: Connected Buffer, Discontinuously Flooded
The continuously flooded connected buffer can also be used as an equalisation or flowbalancing tank. A control and alarm system has to ensure that the outlet to the WWTP isimmediately closed in the case of an unusual event. The capacity of the tank must be sufficientto receive all the incoming waste water until the failure is remedied, so this system might berecommendable only for tributary streams. Before the operation can continue with the input ofroutine waste water, the tank has to be depleted.

Chapter 3
Waste Water and Waste Gas Treatment 59
Sewer system
Disposal pathway
Waste water pathway
Process water
Figure 3.3: Connected Buffer, Continuously Flooded
A further system (see Figure 3.4) is suited to receive and buffer leakage losses, when leakagesare collected in a separate sewer. Such a sewer is used as a drainage system for potentiallypolluted outdoor areas with, e.g. production installations or tank fields. The capacity of the tankmatches the largest possible leakage loss and the amount of rainwater to be expected. Thisbuffer system is applicable to installations with separated sewers for process water and drainageof risk areas. Events that might influence the process water stream cannot be controlled. Itsadvantage is the ability to collect leakage losses in a concentrated state to enable recycling.
Sewer system
Dischargeafter check
Disposal pathway
Waste water pathway
Process water
Sewer system (only process water)
Figure 3.4: Leakage Buffer System
3.3.4 End-of-Pipe Techniques
To introduce a logical order in the description of treatment techniques, the relationship betweenpollutant and respective typical treatment technology is taken as reference, as pointed out inSection 1.3.2.1 and illustrated in Figure 3.5.
The first treatment step for waste water and rainwater – and often also the final step – is theseparation of suspended solids and immiscible liquids (with regard to water) from the mainwater stream. Separation or clarification techniques are:

Chapter 3
60 Waste Water and Waste Gas Treatment
• Gravity Separation [Grit Separation (see Section 3.3.4.1.1), Sedimentation (seeSection 3.3.4.1.2), Oil-Water Separation (see Section 3.3.4.1.6)]
• Air Flotation (see Section 3.3.4.1.3)• Filtration [Filtration (see Section 3.3.4.1.4), Membrane Filtration (see Section 3.3.4.1.5)].
They are mainly used in combination with other operations, either as a first or a finalclarification step. As a first step they, for example, protect other treatment facilities againstdamage, clogging or fouling by solids. As a final step they remove solids formed during apreceding treatment operation or process, or remove oil before further biological treatment.They often follow treatment techniques applied to soluble pollutants, when these are transferredinto solids. Examples are given later in this chapter.
Waste waterrelease
Suspended solids andinsoluble liquids
Grit separationSedimentation (incl. coa-
gulation/flocculation)Air flotationFiltration
Membrane filtration (MF, UF)Oil-water separation
Inorganic / non-biode-gradable / poorly de-
gradable soluble contentPrecipitation
CrystallisationChemical oxidationWet air oxidation
Supercritical water oxidationChemical reductionChemical hydrolysis
Nanofiltration/reverse osmosisAdsorption
Ion exchangeExtraction
Distillation / rectificationEvaporation
StrippingIncineration
Biodegradable soluble contentAnaerobic treatment
- Anaerobic contact process- UASB process
- Fixed bed (or filter) process- Expanded bed process
Biological removal of sulphur and heavymetals
Aerobic treatment- Complete-mix activated sludge process
- Trickling (percolating) filter process- Expanded bed process
- Biofilter fixed-bed processBiological nitrogen elimination
Sludge treatmentThickeningDewateringStabilisationConditioning
Thermal reduction
RECIPIENT
Figure 3.5: Range of Waste Water Treatment Techniques in Relation to Type of Contaminants

Chapter 3
Waste Water and Waste Gas Treatment 61
Solid-free waste water can either be segregated into a biodegradable and a non-biodegradablepart, or the contaminants responsible for the non-biodegradability may be separated beforefurther treatment. The treatment techniques for the non-biodegradable waste water part arebased on physical and/or chemical operations, such as:
• Precipitation / sedimentation / filtration (see Section 3.3.4.2.1)• Crystallisation (see Section 3.3.4.2.2)• chemical reactions [Chemical oxidation (see Section 3.3.4.2.3), Wet air oxidation (see
Section 3.3.4.2.4, Supercritical water oxidation (see Section 3.3.4.2.5), Chemical reduction(see Section 3.3.4.2.6) and Chemical hydrolysis (see Section 3.3.4.2.7)]
• Membrane ‘filtration’ (Nanofiltration and Reverse osmosis) (see Section 3.3.4.2.8)• Adsorption (see Section 3.3.4.2.9)• Ion exchange (see Section 3.3.4.2.10)• Extraction (see Section 3.3.4.2.11)• Distillation / rectification (see Section 0)• Evaporation (see Section 3.3.4.2.13)• Stripping (see Section 3.3.4.2.14)• Incineration (see Section 3.3.4.2.15).
After adequate treatment, the waste water stream can either be discharged into a receiving waterbody, into a subsequent central biological WWTP or a municipal WWTP.
Biodegradable waste water – or the remaining waste water part after elimination of the cause ofthe non-biodegradability – normally undergoes treatment techniques, either centralised ordecentralised, that are based on biological processes, such as:
• anaerobic digestion [Anaerobic contact process (ACP), UASB process, Fixed-bed process,Expanded-bed process (see Section 3.3.4.3.1) and Biological removal of sulphurcompounds and heavy metals (see Section 3.3.4.3.2)]
• aerobic digestion, [Complete-mix activated sludge process, Membrane bioreactor process,Trickling filter process, Expanded-bed Process, Biofilter fixed-bed process (see Section3.3.4.3.3)]
• Nitrification / denitrification (see Section 3.3.4.3.4)• Central biological waste water treatment (see Section 3.3.4.3.5).
The degraded waste water leaves the biological treatment plant and is piped to a clarificationstage.
Many waste water treatment techniques require – or optionally use – treatment aids, which inmost cases are chemicals, or the treatment media / equipment need regeneration, which cancause the release of chemicals. These aids or process steps might generate, generally dependingon local conditions, a pollution that needs to be taken into account when considering the use ofa treatment technique. Thus, an assessment of treatment aids and chemicals released fromregeneration facilities and their fate during the whole process might be necessary in specificsituations.
Almost all waste water treatment techniques have one thing in common: the production ofsolids during the process, which enables the pollutant to be separated from the aqueous medium,such as excess activated sludge or filtered or settled residue from filtration or sedimentationoperations. If sludge is not recycled, it needs to be disposed of – i.e. external treatment anddisposal – or treated on the site. Sludge treatment techniques are e.g.:
• Thickening (see Section 3.4.1)• Dewatering (see Section 3.4.1)• Stabilisation (see Section 3.4.2)• Conditioning (see Section 3.4.2)• Thermal sludge reduction (see Section 3.4.3).

Chapter 3
62 Waste Water and Waste Gas Treatment
3.3.4.1 Insoluble Contaminants / Mechanical Separation
Insoluble content in the chemical industry waste water may consist of inert substances such asdust from rainwater drainage or sand (as ballast in raw materials such as lime). But it may alsoconsist of hazardous materials such as heavy metals and their compounds, originating fromprecipitation processes of preceding treatment operations or production processes usingcatalysts. Even dioxins can be adsorbed to solid contents (e.g. catalyst of vinyl chlorideproduction via oxychlorination). On the other hand, insoluble contaminants need not necessarilybe solid particulates. Liquids immiscible with water, such as oil, substances of oily consistency,grease and colloids belong to this category as well. Waste water containing insolublecontaminants usually has to get rid of them by separation processes as described below.
3.3.4.1.1 Grit Separation of Solids
Description
Grit separation is the removal of sand from rainwater. Grit chambers are used for this purposebecause the sand might otherwise be deposited in inconvenient places, disturbing the treatmentprocess and leading to rapid abrasion in the pumps [cww/tm/132].
Grit chambers are part of the WWTP and usually situated immediately downstream from thescreen installed as protection from coarse and fibrous material. They are designed to handle therequired horizontal flow rate (about 0.3 m/s), i.e. only sand is separated whereas the lightersolids are carried on with the waste water stream.
There are three different types of grit chambers [cww/tm/132]:
• channel-shaped horizontal-flow chamber, which maintains the required flow rate incombination with a venturi flume, suitable for highly fluctuating waste water streams(Figure 3.6) [cww/tm/132]
Figure 3.6: Channel-Shaped Horizontal-Flow Grit Chamber
• circular chamber, where the water is introduced tangentially, causing the content tocirculate and the sand to be washed to the centre to be removed by air-jet lift; this chambertype being less suitable for highly fluctuating flow rates, (Figure 3.7) [cww/tm/132]
Figure 3.7: Circular Grit Chamber

Chapter 3
Waste Water and Waste Gas Treatment 63
• aerated chamber, where the circulation of the content is caused by air injection in a way thatachieves the required flow rate at the bottom of the chamber; this type causing no problemswith fluctuating flow rates (Figure 3.8) [cww/tm/132].
Figure 3.8: Aerated Grit Chamber
Storage facilities for the separated sand are necessary until its discharge.
Application
Grit chambers are used when the WWTP also has to deal with rainwater, which normallyentrains a considerable amount of sand [cww/tm/132].
Application limits and restrictions:
Limits / restrictionsFlow rate flow rate of about 0.3 m/s required to make sure that only sand is
separatedFlow rate fluctuation restrictions to flow rates, dependent on chamber type
Advantages and Disadvantages
Not relevant – essential equipment.
Achievable Emission Levels / Performance Rates
Grit chambers are not installed for environmental protection reasons but as protection fordownstream equipment.
Cross-media Effects
The separated sand has to be discharged or otherwise used, depending on the contamination.
Consumable is the electric energy for the waste water pumps and the air-jet.
The grit chamber, being part of the WWTP, contributes to the emissions of noise and odour forthe main plant, depending on the kind of waste water being treated. Enclosing the equipmentmight be necessary.
Monitoring
The necessary waste water flow rate of 0.3 m/s needs to be controlled.

Chapter 3
64 Waste Water and Waste Gas Treatment
3.3.4.1.2 Sedimentation of Solids
Description
Sedimentation – or clarification – means the separation of suspended particles and floatingmaterial by gravitational settling. The settled solids are removed as sludge from the bottom,whereas floated material is skimmed from the water surface. When the particles cannot beseparated by simple gravitational means, e.g. when they are too small, their density is too closeto that of water or they form colloids, special chemicals are added to cause the solids to settle,e.g.:
• aluminium sulphate (alum)• ferric sulphate• ferric chloride• lime• poly aluminium chloride• poly aluminium sulphate• cationic organic polymers.
These chemicals cause the destabilisation of colloidal and small suspended particles (e.g. clay,silica, iron, heavy metals, dyes, organic solids, oil in waste water) and emulsions entrappingsolids (coagulation) and/or the agglomeration of these particles to flocs large enough to settle(flocculation). In the case of flocculation, anionic and non-ionic polymers are also used.
The influence of coagulation is shown as an example in Table 3.2 [cww/tm/27]. The removallevels in this table, however, should not be confused with achievable performance rates of atreatment technique.
Substance Removal[%]
Inorganic mercury 70
Cadmium and compounds 98DDT [1,1,1-trichloro-2,2-bis-(p-chloro-phenyl)ethane] 75-80
HCB (hexachlorobenzene) 59
Aldrin 100
Dieldrin 50
Endrin 43
PCBs (polychlorinated biphenyls) 30–40
Tributyltin compounds >90
Trichloroethene 36
Perchloroethene 30
Table 3.2: Removal of Waste Water Contaminants under Influence of Coagulation
The sedimentators (or settlers) commonly operated are:
• sedimentation or flat tanks, either rectangular or circular, both equipped with an appropriatescraper and of such a size as to provide a necessary residence time of about 1½ to 2½ hours(see Figure 3.9 as example of a circular tank [cww/tm/4])

Chapter 3
Waste Water and Waste Gas Treatment 65
Figure 3.9: Sedimentation or Settler Tank
• hopper-bottom tank, with vertical flow, usually not equipped with mechanical sludgeremoval system (see Figure 3.10 [cww/tm/132])
Figure 3.10: Hopper Bottom Tank
• lamina or tube settlers, where plates are used to enlarge the sedimentation surface (seeFigure 3.11 [cww/tm/91]).
The equipment for coagulation and/or flocculation is installed as part of the tank. The need forrapid mixing with coagulation is fulfilled by:
• simultaneous dosing of coagulants via multiple injection points• preference for plug flow systems, where applicable• flash mixer or mixing where the coagulant is added at or before the flash mixer, static
mixers or orifices.
With flocculation, a mixing chamber is added. Picket fence or low-speed mixers are used,causing hydraulic mixing within the fluid as it flows through the tank. Partial recycling of thefloc back into the flocculator can result in a better floc structure and optimum exploitation offlocculant.
To ensure optimum settling operation, an upstream oil separation or emulsion decompositionstage, etc., is normally installed to remove interfering substances.

Chapter 3
66 Waste Water and Waste Gas Treatment
The equipment of the sedimentation facilities needs to be such that there is no waste watertransference into the ground, at least when the tank might contain substances hazardous togroundwater. Storage facilities for the coagulant / flocculant chemicals and the sedimentedsludge need to be equipped to suit the characteristics of the sludge.
Figure 3.11: Lamina or Tube Settler
Application
Sedimentation is a separation technique widely used for many purposes and usually not usedalone. The main examples are:
• clarifying collected rainwater from solid content such as sand or dust in a sedimentationtank
• clarifying process waste water from inert contents such as sand or comparable particles• clarifying process waste water from reaction material such as emulsified metal compounds,
polymers and their monomers, supported by addition of appropriate chemicals• separation of heavy metals or other dissolved components after preceding precipitation (see
Section 3.3.4.2.1), often with chemical support, followed at the end by filtration processes(see Sections 3.3.4.1.4 and 3.3.4.1.5)
• removal of activated sludge in a primary or secondary clarifier of a biological WWTP (seeSection 3.3.4.3.5), often supported chemically.

Chapter 3
Waste Water and Waste Gas Treatment 67
Application limits and restrictions:
Limits / restrictionsParticle size particles must be large enough to be settleable, otherwise
coagulation and/or flocculation chemicals need to be appliedPresence of volatilesubstances
volatile substances need to be avoided because of the long residencetime in the tank (as well as the mixing action when coagulationand/or flocculation are used) and thus the potential release of VOC
Solid concentration no limits, provided the aqueous phase is still separablepH (in the case ofcoagulation / floccu-lation)
controlled pH range is essential during operation, otherwise poorclarification performance
Emulsions stable emulsions cannot be separated and broken by coagulation /flocculation; preceding emulsion breaking is required
Advantages and Disadvantages
Advantages Disadvantages• Simplicity of the installation, and thus not
tending to failure.• Removal efficiency can be increased by
addition of coagulation and/or flocculationchemicals.
• Unsuitable for fine material and stableemulsions, even with coagulants andflocculants.
• Floc can embed other contaminants that mightcause problems in disposing of the sludge.
Achievable Emission Levels / Performance Rates
When sedimentation is used upstream of subsequent treatment steps, its purpose is to protectdownstream facilities, so its removal efficiency needs to be high enough to achieve that. Whenit is used as a final treatment, its performance depends on the properties of the particles to beremoved.
Reported achievable emission levels are:
ParameterPerformance
rate[%]
Emissionlevel[mg/l]
Remarks
60–90TSS <10 1 after final clarifier of central WWTPSettleable solids 90–95
Heavy metals in particulate form,see Section 3.3.4.2.1
1 [cww/tm/67c]
TSS can also include particulate organics, i.e. sedimentation will reduce TOC / COD as well, aslong it is present as insoluble solid material. Its removal efficiency, however, depends on theproportion of solid TOC in total TOC.
Cross-media Effects
Sedimented sludge and skimmed scum, if not suitable to recycle or use otherwise, need to bedisposed of as waste. Depending on the waste water origin, this waste might contain hazardouscompounds to be treated accordingly. These compounds can be carbonates, fluorides, sulphidesor hydroxides (or oxides) of heavy metals, oily scum, etc. and under certain circumstances evendioxins.
Sources of noise are the pumps that can be enclosed and the sludge / scum removal system.
When the waste water contains odorous substances, it might be necessary to cover thesedimentation tank – or at least the coagulation or flocculation unit – and to duct the arising

Chapter 3
68 Waste Water and Waste Gas Treatment
waste gas, if necessary, to a treatment system. The necessary equipment – ducts and vents –probably needs to be provided with an appropriate safety system, e.g. a pressurised nitrogen gasflow system, to avoid explosion risk.
Consumables can be:
Consumable Amount53–93 [kg/t oil, solid] 1
Chemicals (coagulant / flocculant) a 0.5–100 [g/m3 waste water] 2
Electric energy [kW] b 0.5–1.5Nitrogen for inert atmospherea organic polymerb for tank diameter of 25–35 m1 [cww/tm/96]2 [cww/tm/128]
Monitoring
The effluent needs to be regularly monitored for solid content, i.e. suspended solids, settleablesolids or turbidity. When chemicals (e.g. coagulants, flocculants) are used to improve thesettling process, the pH needs to be controlled as the main operational parameter.
Economics
Capital costs[million]
Operating costs
EUR 1.2 aSedimentation tank BEF 4.8 b 1
Laminar or tube settler 1 BEF 4 c BEF 20–100 per m3
a per 1000 m3 tank volumeb capacity of 100 m3/hc capacity of 25 m3/h1 [cmm/tm/128]
3.3.4.1.3 Air Flotation
Description
Flotation is a process where solid or liquid particles or particulates are separated from the wastewater phase by attaching to air bubbles. The buoyant particles accumulate at the water surfaceand are collected with skimmers [cww/tm/4].
Flocculant additives, such as aluminium and ferric salts, activated silica and various organicpolymers, are commonly used to support the flotation process. Their function, besidescoagulation and flocculation, is to create a surface or a structure able to absorb or entrap the airbubbles.
There are three methods of flotation, distinguished by the way air is added:
• vacuum flotation, where air is dissolved at atmospheric pressure, followed by a pressuredrop to allow the formation of bubbles
• induced air flotation (IAF), where fine bubbles are drawn into the waste water via aninduction device such as a venturi or orifice plate
• dissolved air flotation (DAF), where pressurised air (0.4–0.8 MPa, or 1.0–1.2 MPa foraluminium compounds) is dissolved into the waste water – or a part of the total waste water– and subsequently released to form small bubbles.
A typical DAF device is presented in Figure 3.12 [cww/tm/4].

Chapter 3
Waste Water and Waste Gas Treatment 69
Depending on the waste water content, it might be necessary to cover the flotation basin andduct the exhaust air to a gas abatement device. Facilities are necessary to store theflocculant/coagulant chemicals and the skimmed material.
Figure 3.12: DAF System:a) with Recycle, b) without Recycle
Application
Flotation is applied when sedimentation is not appropriate, e.g. when:
• the particulates have poor settling characteristics (in the case of a poor sludge volumetricindex (SVI), however, there is no advantage over sedimentation)
• the density difference between the suspended particles and the waste water is too low• there is a space constraint at the actual site• oil and grease are to be removed.

Chapter 3
70 Waste Water and Waste Gas Treatment
Examples are:
• in refineries and petrochemical sites as a subsequent treatment downstream of oil separationand prior to a biological WWTP
• removal of dyes and pigments from respective production waste water• recovering product or raw material, e.g. toluene from toluene/water emulsions
[cww/tm/132], silver halides from production of photographic chemicals, butylthion orpolysilan from waste water streams
• separation of heavy metals from waste water• separation of activated sludge from biological waste water treatment, either after final
clarification [cww/tm/67b] or replacing it• thickening of activated sludge from a biological WWTP.
Application limits and restrictions:
Limits / restrictionsPresence of substances foaming detergents need to be excludedOil though very efficient to remove free oil from waste water,
gross free oil cannot be handled
Advantages and Disadvantages
Advantages Disadvantages• Less volume and thus lower capital costs
required than with sedimentation.• Removal efficiency unaffected by changes of
flow rate and thus superior to sedimentation,see Figure 3.13 [cww/tm/132]
• Material recovery possible.• High separation efficiency, higher dry-matter
content than with sedimentation.
• Clogging of valves is possible.• High potential for odour release, so a cover
normally required.• Higher operational costs than sedimentation.
Figure 3.13: Comparison of Separation Efficiency of DAF versus Sedimentation 11
11 Insolubles content 90 – 450 mg/l, pressurised water addition for flotation 20 %

Chapter 3
Waste Water and Waste Gas Treatment 71
Achievable Emission Levels / Performance Rates
Parameter Performance[%]
Emission level[mg/l] Remarks
90–98 see Figure 3.13TSS
85–96 1 10–20 1activated sludge after finalclarifier, input 20–250 mg/l
10–20 ppm 2 refinery, IAF and DAFtreatmentOil
2–10 3 chemical production, afterseveral APIs
Metal sulphides 95 2 refinery, IAF and DAFtreatment
1 [cww/tm/67b]2 [cww/tm/131]3 [cww/tm/93]
COD/TOC are removed to the extent that they are present as solids or a suspension of droplets.
Cross-media Effects
The separated material, if not recyclable, is disposed of as waste. The amount depends on thematerial to be removed and the amount of coagulant and flocculant chemicals. Those can bequite different, according to the respective application of air flotation.
Consumables are:
Consumable DAF-treatment ofactivated sludge 1
Air flotation forrefinery waste
water 2
Compressed air a 0.53–0.55
Flocculant dose mg/l b kg/t c
0.6–1.22.4–4.7
3.753-93
Energy [kWh/1000 m3] 20.6a expressed as compressed air relative to pressurised water [m3/m3]b flocculant concentration in waste waterc amount of flocculant relative to mass of suspended solid in waste water1 [cww/tm/67b]2 [cww/tm/96]
Sources of noise are the pumps, mixer and compressor, which have to be equipped withadequate noise containment measures.
The release of odorous or other volatile substances – if these are to be expected – can beprevented by covering the vessel or operating in a closed tank and ducting the exhaust air to agas abatement system.
Monitoring
To ensure reliable operation, the turbidity of the effluent has to be monitored for disturbances.Any foam arising has to be detected in good time. Effluent detection of COD/TOC and TSS isobligatory.

Chapter 3
72 Waste Water and Waste Gas Treatment
Economics
The costs of a flotation unit vary widely, depending on the purpose:
Flow rate[m3/h]
Capital costs[million]
Annual operatingcosts [thousand]
DAF / activated sludge 1 1200 DEM 5.0 DEM 800
DAF / refinery 2 300–800 EUR 1.6–1.8 EUR 20–130
IAF / refinery 2 400–820 EUR 0.5–2.1 EUR 55–130
DAF / as decentralisedfinal treatment 3 50 DEM 4500
DAF 4 100 m3/h100 m3/day
BEF 40BEF 4
1 [cww/tm/67b] incl. capital costs, engineering design, civil engineering works, site preparation, etc.2 [cww/tm/48]3 [cww/tm/132] total operating costs, incl. chemicals for neutralisation, precipitation and flocculation,dewatering of flotate, incineration of sludge4 [cww/tm/128]
Indicative capital and operating costs for a DAF plant are given as relative to the flow rate.Though these values are not very near the actual figures, they estimate the degree of costincrease with increasing plant size [cww/tm/92]:
Flow rate[m3/h]
Capital costs[GBP, million]
Annual operating costs[GBP, thousand]
10100
100010000
0.10.10.51.0
1020–3050–80
500-800
The cost of flotation, which is the most widespread approach to solid-liquid separation indecentralised waste water treatment, is lower than that of evaporation or incineration (by afactor of approximately 10). But the benefits of evaporation and incineration are greater, sincethey result in complete disposal of highly contaminated effluent, whereas the precipitation andflotation processes achieve only partial treatment of a moderately contaminated split stream.Since the value of this partial treatment is also a subject of some dispute, it remains an openquestion whether it is wise to spend DEM 10 per cubic metre of waste water (or DEM 4.5million per year for a 50 m3/h tributary waste water stream) as operating costs for thepretreatment of a stream that comprises only a small fraction of the total amount of waste waterfrom a large chemical plant [cww/tm/132].
Compared with sedimentation, flotation offers considerable advantages in many cases, not onlyin water treatment and recovery of valuable materials but also in the separation and thickeningof sludge. As a rule, it leads to a higher dry-matter content of the resulting concentrate. Becauseof higher hydraulic load rates and shorter residence times, smaller apparatus volumes arerequired as well. This in turn generally implies lower capital costs, albeit at the expense ofhigher operating costs. A comparison may yield a space requirement for sedimentation 50 timesgreater than that for flotation. On the other hand, energy costs for flocculation / flotation can beabout 50 times greater than for flocculation / sedimentation. Better opportunities exist withflotation than with sedimentation for control and adaptation to fluctuating operating conditions,although taking advantage of these opportunities requires the availability of more highly trainedpersonnel [cww/tm/132].

Chapter 3
Waste Water and Waste Gas Treatment 73
3.3.4.1.4 Filtration
Description
Filtration describes the separation of solids from waste water effluents passing through a porousmedium. Filters typically require a cleaning operation – backwashing – with reverse flow offresh water and the accumulated material returned to the sedimentation tank (Section 3.3.4.1.2).
Commonly used types of filter systems are, e.g.:
• the granular-medium filter, or sand filter, which is widely used as a waste water treatmentdevice (the medium of sand filters need not be literally sand), mainly used with low solidcontent
• the gravity drum filter, used for sewage treatment and removal of activated sludge flocs, itsefficiency dependent on the screen fabric
• rotary vacuum filter, well-suited to precoat filtration, which is used for oily sludgedewatering and slop de-emulsification
• membrane filter (see Section 3.3.4.1.5)• the belt filter press, which is largely used for sludge dewatering, but also for liquid/solid
separation operations• filter presses, which are usually used for sludge dewatering, but also for liquid/solid
operations, suitable for high solid content.
Sand filters consist of a granular-medium filter bed with either downward or upward flow. Thefilter bed can be mono- or multi-medium. The operation can be semi-continuous – filtration andbackwashing occur sequentially – or continuous – filtration and backwashing operatesimultaneously. The main difference between the two operation modes is:
• semi-continuously operated sand filters are run up to turbidity breakthrough, when the solidcontent in the effluent starts to increase, or to limiting headloss
• continuously operated sand filters have no turbidity breakthrough or terminal headloss.
Sand filters work either by the force of gravity or an applied pressure force. Examples are givenin Figure 3.14 [cww/tm/4] for the conventional downflow multi-medium, gravity-flow filter andin Figure 3.15 [cww/tm/4] for the pressure filter.
Drum filters consist of a cylinder on which the filtration surface is wrapped. They are eitheroperated as a gravitational drum filter that can be charged on the inside or the outside, or as arotatory vacuum filter with the inside or outside of the drum enclosed and connected to avacuum pump. The filter cake is removed from the drum by different means. An example isgiven in Figure 3.16 [cww/tm/132].
Belt filter press and filter press as typical sludge dewatering facilities are described inSection 3.4.1.
Filter media can be characterised in terms of criteria, such as [cww/tm/132]:
• cut size, i.e. the particle size that can just pass through the filter medium• permeability, high permeability characterised by low pressure drop• chemical stability with respect to the filtrate• blocking tendency, particularly for fabrics in cake filtration• mechanical strength in relation to loads imposed in back-blowing or the movement of filter
cloths• smooth surface to promote cake removal.

Chapter 3
74 Waste Water and Waste Gas Treatment
Figure 3.14: Conventional Downflow Multi-Medium Sandfilter
Figure 3.15: Pressure Filter

Chapter 3
Waste Water and Waste Gas Treatment 75
Figure 3.16: Rotary Vacuum Filtera Dewatering zone, b Rotary valve, c Settling zone, d Suction zone
Suspensions made up of relatively fine, soft or compressible solids often fill or block the filtermedium, unless this blocking is prevented by filter aids, i.e. inert, readily filterable granularmaterial. These filter aids form a layer permeable to the filtrate and at the same time carry outthe functions of a loose filter cake. The retained particles are deposited on the filter aid.Examples of filter aids are [cww/tm/132]:
• diatomaceous earths• perlites• Fuller’s earths• powdered glass• coal preparations• cellulose fibres• wood pulp• paper stock• bagasse• talc• plastics.
Filter aids are used in pre-coating, i.e. a layer of filter aid is deposited on the filter mediumbefore filtration starts. During filtration it is added continuously to the slurry to maintain thenecessary ratio for proper and efficient filtration.
Application
In waste water treatment, filtration is frequently used as the final separation stage aftersedimentation processes (see Section 3.3.4.1.2) or flotation (see Section 3.3.4.1.3), if lowemissions of particulates are wanted, e.g.:
• separation of floc, heavy metal hydroxides etc. after sedimentation, to cope with dischargerequirements
• removal of activated sludge after the central WWTP, in addition to sedimentation, toimprove the quality of biologically treated waste water effluent
• dewatering of sludge, flotate etc.• recovery of free oil, with rotary drum filters and the help of polymer addition.

Chapter 3
76 Waste Water and Waste Gas Treatment
Application limits and restrictions:
Limits / restrictionsColloids, emulsions cannot be separated without additional chemical treatmentFinely dispersed or slimysolids
can block the filter medium, if filter aids not used
Advantages and Disadvantages
Advantages Disadvantages• High separation efficiency.• Pollutants other than suspended solids can be
removed under certain circumstances, such asoil.
• Operation under a wide range of conditions.
• Clogging and fouling processes are possiblewith semi-continuous sandfilters.
• Breakthrough can cause additional pollution ofthe effluent.
Achievable Emission Levels / Performance Rates
Parameter Performance[%]
Emission level[mg/l] Remarks
<10 mg/l activated sludge flocTSS
50–99.99 1 sand filter, dependent onfilter aids
Free oil <5 mg/l
Heavy metals after precipitation,see Section 3.3.4.2.1
1 [cww/tm/128]
Cross-media Effects
When a granular filter, e.g. a sand filter, is used, the backwashed material is normallyrecirculated to the process from where it originated, e.g. to the sedimentation tank or theactivated sludge basin of the biological WWTP. The residue from other kinds of filters (drumfilter, belt filter etc) can either be recycled or needs to be discharged of as waste or undergofurther treatment.
Sand filtration, as an example of deep-bed filtration, entails less frequent backwashing thancake filtration (e.g. belt or drum filtration) and thus a lower requirement for backwash water.For this reason, cake filtration is applied only in exceptional cases in waste water treatment(examples above in this chapter) [cww/tm/132].
Consumables are:
Consumable Sand filter Drum filterWater for backwashing –Water for vacuum generation –Filter aidsEnergy [kWh/1000 m3]Pressure drop
The operating equipment can be a relevant noise source which can be controlled by enclosingthe main sources.
If odorous substances may be released, closed devices might be necessary. Pressure filters andfilter presses are placed in closed vessels and the exhaust air is ducted to a gas abatementsystem.

Chapter 3
Waste Water and Waste Gas Treatment 77
Monitoring
To ensure reliable operation, the turbidity of the filter effluent has to be monitored to recognizedisturbances, or a breakthrough with the semi-continuous sandfilter. The pressure drop has to beregistered to indicate clogging and barring.
Economics
Flow rate[m3/h]
Capital costs[million] Operating costs
Sand filter 1 100 BEF 4 BEF 2/m3
1 [cmm/tm/128]
3.3.4.1.5 Microfiltration and Ultrafiltration
Description
Microfiltration (MF) and Ultrafiltration (UF) are membrane processes that segregate a liquidthat permeates through a membrane into permeate, which passes the membrane, andconcentrate, which is retained. The driving force of the process is the pressure difference acrossthe membrane. Both are special and elaborate filtration techniques, already mentioned in thepreceding chapter.
Membranes used for MF and UF are 'pore type' membranes which operate like sieves. Thesolvent and particles of molecular size can pass the pores, whereas suspended particles,colloidal particles, bacteria, viruses, and even larger macromolecules are held back.
Typical characteristics are shown in Table 3.3.
Parameter Microfiltration Ultrafiltration
Pore diameter [µm] 1 0.1-1 0.001–0.1
Operating pressure [MPa] 2 0.02–0.5 0.2–1
Cut-off size [nm] >100, includes bacteria10-100, includes macromolecules,
viruses, colloidal particles1000–100000 g/mol for solutions
Permeate flow[l m-2 h-1] 50–1000 <100
Cross flow speed[m/s] 2 2-6 1-6
Membrane type 3 symmetrical polymeric or ceramic,10–150 µm thick polymeric, or ceramic asymmetric
Membrane configuration 3spiral-woundhollow-fibre
tubular
spiral-woundhollow-fibre
tubular1 [cww/tm/27]2 [cww/tm/132]3 [cww/tm/93]
Table 3.3: Characteristics of Microfiltration (MF) and Ultrafiltration (UF)
Membranes for MF and UF are available in several materials and configurations. The optimummodification for a particular application will depend on the nature of the waste water, since thedifferent materials have varying resistances to dissolved substances. Membrane materials forMF are, e.g.:

Chapter 3
78 Waste Water and Waste Gas Treatment
• glass fibre• polycarbonate• PVDF (poly vinylidenfluoride)• cellulose acetate• polyamide.
Suitable materials for UF are normally organic polymers, e.g.:
• cellulose acetate• polyamide• polyimide• polycarbonate• polyvinylchloride• polysulphone• polyethersulphone• polyacetal• copolymers of acrylonitrile and vinyl chloride• polyelectrolyte complexes• cross-linked polyvinyl alcohol or polyacrylates.
PVDF membranes have the advantage that they can be cleaned with strong acids, caustic sodaand bleaches.
The membrane filter process is usually run cross-flow, i.e. the permeate flow is directedperpendicular to the feed flow. The impurities remain in the feed which, reducing in volume,leaves the membrane system as a concentrated waste stream.
Storage facilities for the concentrate should be available.
Application
Membrane filtration (MF and UF) is applied when a solid-free waste water for downstreamfacilities, e.g. reverse osmosis or the complete removal of hazardous contaminants such asheavy metals, is desired. The choice between MF and UF depends on the particle size.
Common MF applications include [cww/tm/93; cww/tm/67a]:
• degreasing processes• metal particle recovery• metal plating waste water treatment• sludge separation after activated sludge process in a central biological WWTP, replacing a
secondary clarifier (activated membrane process), though UF can also be used.
Common UF applications include:
• removal of non-toxic degradable pollutants such as proteins and other macromolecularcompounds and toxic non-degradable components, e.g. dyes and paints, with molecularweights greater than 1000
• segregation of oil/water emulsions• separation of heavy metals after complexation or precipitation• separation of components not readily degradable in sewage treatment effluents, which are
subsequently recycled to the biological stage• pretreatment step prior to reverse osmosis or ion exchange.

Chapter 3
Waste Water and Waste Gas Treatment 79
Application limits and restrictions:
Limits / restrictionsMembrane material vulnerable to chemical attacks, depending on waste water content
Advantages and Disadvantages
Advantages Disadvantages• High separation efficiency.• Modular systems, i.e. flexible in usage.
• Clogging, plugging and fouling processes arepossible.
• Compaction in the presence of softeningagents.
• High operating pressure, therefore highpumping energy.
• No mechanical stability.
Achievable Emission Levels / Performance Rates
Parameter Performance[%]
Emission level[mg/l] Remarks
TSS about 100 close to 0CODHeavy metals see Section 3.3.4.2.1
Cross-media Effects
Membrane treatment produces a residue (concentrate) of approximately 10 % of the originalfeed volume, in which the target substances are present at levels approximately 10 times theirconcentration in the original feed. An assessment should be made of whether this residue can bedisposed of.
With organic suspended substances the concentration increase might improve the conditions forsubsequent oxidative destruction processes. With inorganic suspended substances, theconcentration stage could be used as part of a recovery process. In both cases, the permeatewater from a membrane process can potentially be re-used or recycled in the industrial process,thus reducing water input and discharge.
Consumables are:
Consumables MF UFMembrane material -Chemicals (antiscaling,antifouling, backwashing etc.) -
Energy [kWh/m3] 2-20 1 1-10 1
Pressure drop see Table 3.3 see Table 3.31 It seems rather surprising that MF, the process with the lowest pressure drop, consumesmore energy than the processes with high pressure drops. The reason is the occurrence ofconcentration polarisation and fouling. In MF, and to a lesser extent in UF, this phenomenon isvery severe and it results in a drastic flux decline [cww/tm/161].
The energy consumption is directly related to the cross-flow rate and pressure requirements. Itis generally associated with maintaining a minimum velocity of about 2 m/s across themembrane surface.
A source of noise is the pumping equipment, which can be enclosed.

Chapter 3
80 Waste Water and Waste Gas Treatment
Monitoring
To ensure reliable operation, the pressure difference across the membrane has to be monitoredcontinuously.
Economics
Flow rate[m3/h] Capital costs Operating
costs Replacement costs
GBP 400–1500 1per m2 membrane a
GBP 80–350 1 perm2 membrane a
MF BEF 40000 2per m2 membrane
BEF 2-200 2 perm3 waste water
GBP 400–1500 1per m2 membrane a
GBP 80–350 1 perm2 membrane a
UF BEF 60000-200000 2per m2 membrane b
a for hollow fibre, spiral and ceramic membranesb lower figure organic membranes, higher figure inorganic membranes1 [cww/tm/93]2 [cww/tm/128]
The capital costs, including automated cleaning facilities, can be broken down approximately asfollows [cww/tm/93]:
pumps 30 %replaceable membrane components 20 %membrane modules (housings) 10 %pipework, valves, framework 20 %control system 15 %other 5 %
The operating cost [cww/tm/93] is derived from:
• energy cost of maintaining the hydrostatic pressure and flow rate of the systems• expected membrane life• cleaning regime required• site-specific factors, e.g. labour requirement.
They can be broken down approximately as follows [cww/tm/93]:
replaceable membrane components 35–50 %cleaning 12–35 %energy 15–20 %labour 15–18 %
3.3.4.1.6 Oil-Water Separation
Description
The separation of oil and water and subsequent oil removal can be divided into:
• gravity separation of free oil, using separation equipment• emulsion breaking, using emulsion breaking chemicals, such as:
- polyvalent metal salts such as alum, aluminium trichloride, ferrous chloride, ferroussulphate
- mineral acids such as sulphuric acid, hydrochloric acid, nitric acid- adsorbents such as pulverised clay, lime- organic polymers such as polyamines, polyacrylates,

Chapter 3
Waste Water and Waste Gas Treatment 81
and subsequent separation of de-emulsified oil by coagulation / flocculation and air flotation(see Section 3.3.4.1.3).
The commonly used oil-water separators are:
• the American Petroleum Institute Separator (API) as the simplest type, consisting of anopen rectangular basin and a flight scraper, the latter moving the sludge to a collection pitand the oil to the skimming device, able to intercept large slugs of oil (see Figure 3.17[cww/tm/91])
• the Parallel Plate Interceptor (PPI), equipped with plates parallel to the current whichenlarge the active surface area immensely and an oil skimming device, not suitable tointercept large slugs (see Figure 3.18 [cww/tm/91])
• the Corrugated Plate Interceptor (CPI), equipped with corrugated plate packs placedcounter current and an oil skimming device, not suitable to intercept large slugs, butpossessing a good separation efficiency (see Figure 3.19 [cww/tm/91]).
Figure 3.17: American Petroleum Institute Separator (API Separator)
To collect the oil phase and remove it either to recovery or further treatment, several kinds ofskimming equipment are used, e.g.:
• fixed pipe skimmers• rotating trough skimmers• rotating disc or drum skimmers.
Storage facilities for the skimmed oil and the sludge are necessary if the oil cannot be recycledimmediately.
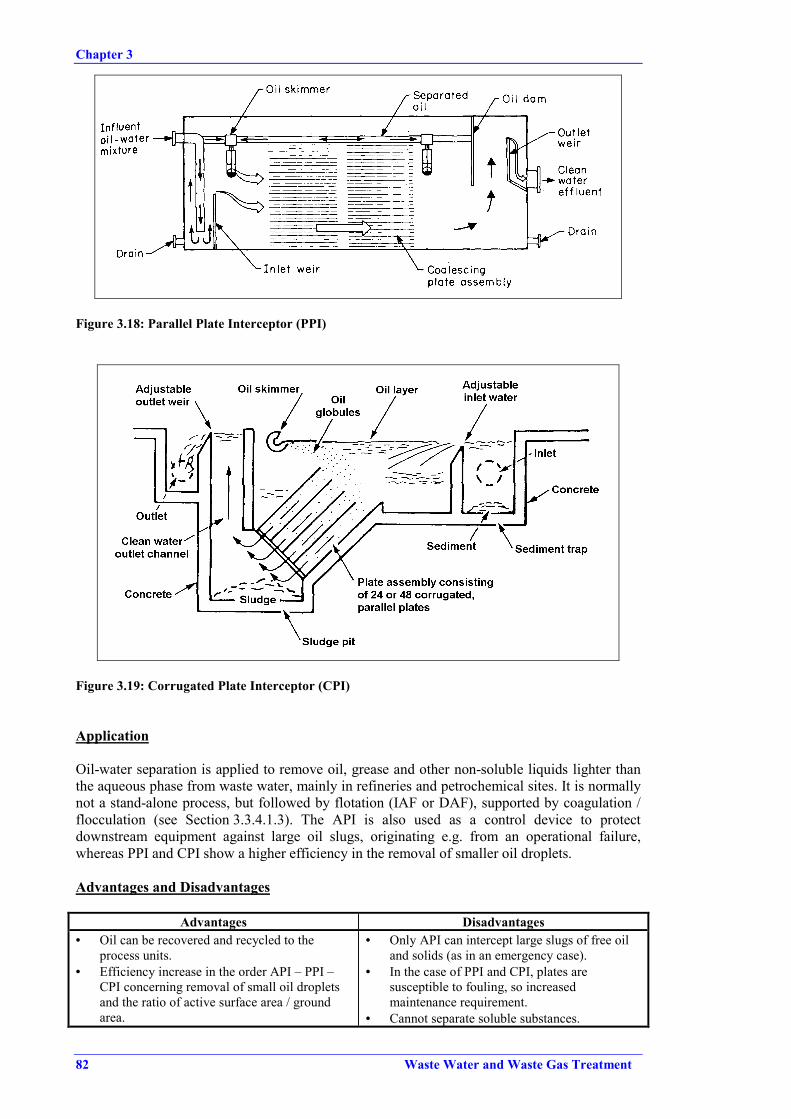
Chapter 3
82 Waste Water and Waste Gas Treatment
Figure 3.18: Parallel Plate Interceptor (PPI)
Figure 3.19: Corrugated Plate Interceptor (CPI)
Application
Oil-water separation is applied to remove oil, grease and other non-soluble liquids lighter thanthe aqueous phase from waste water, mainly in refineries and petrochemical sites. It is normallynot a stand-alone process, but followed by flotation (IAF or DAF), supported by coagulation /flocculation (see Section 3.3.4.1.3). The API is also used as a control device to protectdownstream equipment against large oil slugs, originating e.g. from an operational failure,whereas PPI and CPI show a higher efficiency in the removal of smaller oil droplets.
Advantages and Disadvantages
Advantages Disadvantages• Oil can be recovered and recycled to the
process units.• Efficiency increase in the order API – PPI –
CPI concerning removal of small oil dropletsand the ratio of active surface area / groundarea.
• Only API can intercept large slugs of free oiland solids (as in an emergency case).
• In the case of PPI and CPI, plates aresusceptible to fouling, so increasedmaintenance requirement.
• Cannot separate soluble substances.

Chapter 3
Waste Water and Waste Gas Treatment 83
Achievable Emission Levels / Performance Rates
Parameter Performance[%]
Emission level[mg/l] Remarks
90–956-90 mg/l 1 API, refineryOil
40–70 mg/l 2 API, chemical industrySolid 90–95
1 [private information]2 [cww/tm/93]
Cross-media Effects
The skimmed oil is generally sent back to the process units, where it is re-used after minorcleaning operations. Otherwise it is chemical waste and has to be adequately disposed of,together with the separated solids.
Oil-water separators, when not covered, are the main contributors to VOC releases in wastewater treatment systems of which they are part and are thus the main source of odour and healthrisks. Surface covering achieves a VOC release reduction of about 95 % [cww/tm/48]. On theother hand, covering can cause skimming problems and the operation of the equipment cannoteasily be checked. The local situation will determine which option is taken. If the separator iscovered, the waste gas needs to be ducted to an abatement system that includes an adequatesafety system, such as pressurised nitrogen, to avoid explosion risk.
Sources of noise are the pumps, which are usually enclosed, and the skimming device. Whereappropriate, control measures need to be taken.
Consumables are:
Consumables API PPI CPINitrogen from pressurisedsystem as safety device a 0.05 m/h
Energy [kWh/m3]a nitrogen gas flow relative to surface area [m3/(m2 h)]
Monitoring
The outlet has to be regularly monitored visually to ensure proper operation, e.g by oil build-upchecks. Skimmer device and oil dam have to undergo regular maintenance.
Economics
Flow rate[m3/h]
Capital costs[million] Operating costs Remarks
API 1200 EUR 2.0 1
PPI
CPI 100 BEF 2–10 2 BEF 2–4 / m3 2a
a labour costs 3 h/day1 [cww/tm/48]2 [cww/tm/128]

Chapter 3
84 Waste Water and Waste Gas Treatment
3.3.4.2 Soluble Non-biodegradable or Inhibitory Contaminants / Physico-Chemical Treatment
Soluble non-biodegradable or inhibitory waste water contaminants can be subdivided into threeclasses of compounds:
• inorganic compounds such as salts or heavy metal compounds• organic compounds as source for refractory TOC• inhibitory organic or inorganic compounds that disturb the biological process in a biological
WWTP.
Inorganic compounds are not affected by biological treatment and can, like refractory TOC,tend to disturb the biological process in a biological WWTP. Both usually need specialpretreatment upstream of a central WWTP. Pretreatment operations are:
• chemical transformations to form solid products that are separated in a follow-up process asdescribed in Section 3.3.4.1 (see Section 3.3.4.2.1 and 3.3.4.2.2)
• chemical degradation processes to form biodegradable contaminants (see Sections 3.3.4.2.3to 3.3.4.2.7)
• physical elimination processes (see Sections 3.3.4.2.9 to 3.3.4.2.14)• incineration processes to form gaseous and solid residues that can be separated from the
waste water stream (see Section 3.3.4.2.15).
On new chemical sites in Germany it is common practice to use these pretreatment operations(or process-integrated measures instead) with tributary streams carrying a relevant non-biodegradable load (e.g. TOC elimination rates below 80 % and recalcitrant TOC load of about20 kg/d, 300 kg/yr and 1 kg/tonne of product, independent of the local situation). With existingones, those measures are taken that can achieve an optimum performance, considering the ratiobetween environmental benefits and costs; for details see Section 2.2.1.2.
3.3.4.2.1 Precipitation
Description
Precipitation is a chemical way to form particulates that can be separated by an additionalprocess, such as sedimentation (Section 3.3.4.1.2), air flotation (Section 3.3.4.1.3), filtration(Section 3.3.4.1.4) and if necessary followed by MF or UF (Section 3.3.4.1.5). Fine separationby membrane techniques might be necessary to protect downstream facilities or to prevent thedischarge of hazardous particulates. It might also be a useful technique to remove colloidalprecipitates (e.g. heavy metal sulphides).
A precipitation facility usually consists of one or two stirred mixing tanks, where the agent andpossibly other chemicals are added, a sedimentation tank and storage tanks for the chemicalagents. If needed – as mentioned above – further treatment equipment is added. Thesedimentation tank might be replaced downstream by other sludge collecting systems.
Typical precipitation chemicals are:
• lime (with lime milk the preparation devices are part of the treatment unit) (for heavymetals)
• dolomite (for heavy metals)• sodium hydroxide (for heavy metals)• soda (sodium carbonate) (for heavy metals)• calcium salts (other than lime) (for sulphates or fluorides)• sodium sulphide (for mercury)• polyorganosulphides (for mercury).

Chapter 3
Waste Water and Waste Gas Treatment 85
These are often accompanied with flocculants to assist further separation, such as:
• ferrous and ferric salts• aluminium sulphate• polymers• polyorganosulphides.
Application
Precipitation can be applied at different stages of the waste water stream, e.g.:
• directly at source to remove heavy metals most effectively to avoid dilution by unloadedstreams
• as central treatment technique for the removal of phosphates, sulphates and fluorides,provided inadequate dilution is not expected
• to remove phosphate after the biological stage in a central WWTP, where the sludge iscollected in the final clarifier.
The performance of further liquid/solid separation normally depends on factors such as pH,mixing quality, temperature or residence time at the precipitation step, the actual conditions tobe found in a case by case study.
Application limits and restrictions:
Limits / restrictionspH adjustment optimum pH range for heavy metals, phosphate, fluoride:
pH 9–12,when sulphides are used, hydrogen sulphide is generated underacidic conditions
Complex-formingsubstances
can prevent precipitation of heavy metals, such as copper, nickel
Advantages and Disadvantages
Advantages DisadvantagesWith lime as agent• Prevention of increasing salt content in the
waste water.• Increase of the buffering capacity of the
central biological WWTP.• Improvement in sludge sedimentation.• Sludge thickening.• Improvement of mechanical dewaterability of
sludge.• Reduction of dewatering cycle time.• Low cost.
With lime as agent• Operating problems associated with the
handling, storage and feeding of lime[cww/tm/4].
• Increase of sludge amount due to excess ofcalcium hydroxide
• Maintenance problems [cww/tm/4].
For sodium sulphide• Decrease of amount of sludge (about 30 % in
volume compared to lime treatment).• Decrease of amount of chemicals used (about
40 %, compared to lime treatment).• Produces lower metal levels in treated effluent.• No pre- or post-treatment needed.• Highly efficient at removing suspended and
dissolved metals from a waste water stream.
For sodium sulphide• Generation of hydrogen sulphide when the
batch becomes acidic by failure.• Odour problems associated with sodium
sulphide.
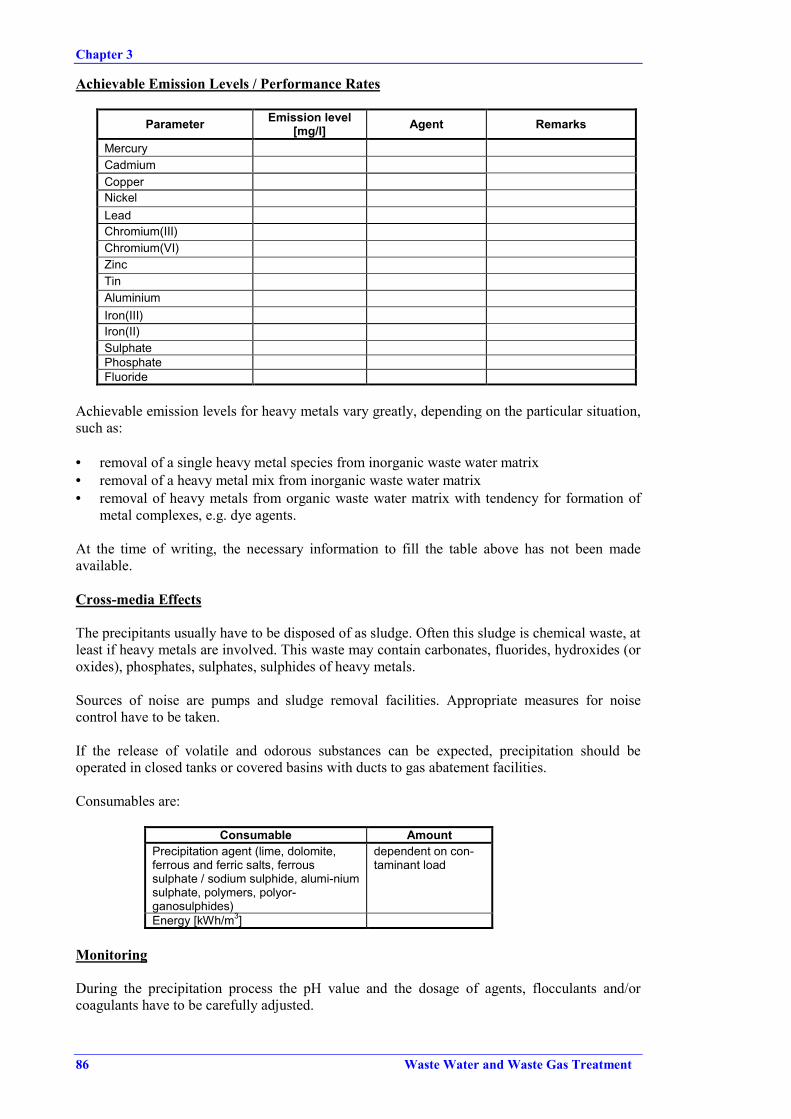
Chapter 3
86 Waste Water and Waste Gas Treatment
Achievable Emission Levels / Performance Rates
Parameter Emission level[mg/l] Agent Remarks
MercuryCadmiumCopperNickelLeadChromium(III)Chromium(VI)ZincTinAluminiumIron(III)Iron(II)SulphatePhosphateFluoride
Achievable emission levels for heavy metals vary greatly, depending on the particular situation,such as:
• removal of a single heavy metal species from inorganic waste water matrix• removal of a heavy metal mix from inorganic waste water matrix• removal of heavy metals from organic waste water matrix with tendency for formation of
metal complexes, e.g. dye agents.
At the time of writing, the necessary information to fill the table above has not been madeavailable.
Cross-media Effects
The precipitants usually have to be disposed of as sludge. Often this sludge is chemical waste, atleast if heavy metals are involved. This waste may contain carbonates, fluorides, hydroxides (oroxides), phosphates, sulphates, sulphides of heavy metals.
Sources of noise are pumps and sludge removal facilities. Appropriate measures for noisecontrol have to be taken.
If the release of volatile and odorous substances can be expected, precipitation should beoperated in closed tanks or covered basins with ducts to gas abatement facilities.
Consumables are:
Consumable AmountPrecipitation agent (lime, dolomite,ferrous and ferric salts, ferroussulphate / sodium sulphide, alumi-niumsulphate, polymers, polyor-ganosulphides)
dependent on con-taminant load
Energy [kWh/m3]
Monitoring
During the precipitation process the pH value and the dosage of agents, flocculants and/orcoagulants have to be carefully adjusted.

Chapter 3
Waste Water and Waste Gas Treatment 87
Economics
Type of costs Costs Flow rate[m3/h] Remarks
Capital costsOperating costs
3.3.4.2.2 Crystallisation
Description
Crystallisation is closely related to precipitation. In contrast to precipitation, the precipitate isnot formed by chemical reaction in the waste water, but is produced on seed material such assand or minerals, working in a fluidised-bed process – a pellet reactor system. The pellets growand move towards the reactor bottom. The driving force of the process is the reagent dosage andpH-adjustment. No waste sludge arises. The principle of a crystallisation device is illustrated inFigure 3.20 [cww/tm/97].
Figure 3.20: Principle of Crystallisation Process
The crystallisation device consists mainly of:
• the cylindrical reactor with bottom influent and top effluent• seed material, i.e. pellets of filter sand or minerals, kept in a fluidised-bed condition• the circulation system with recirculation pump.
The velocity of the influent waste water (40–120 m/h) keeps the pellets in a fluidised state[cww/tm/97]. The process conditions at the bottom of the reactor are chosen in such a way thata relatively high supersaturation of the desired salts occurs. The fluidised bed provides a verylarge crystallisation surface (5000–10000 m2/m3) so that, in a fast and controlled reaction,almost all the anion or metal content crystallises on the pellets. Periodically, a part of the pelletsis discharged and replaced by new seed material. Typically this takes place once a day.

Chapter 3
88 Waste Water and Waste Gas Treatment
The principle of the circulation system is to mix the influent waste water with the circulationstream of lower anion or metal concentration. Because of the circulation system the reactor canwork more flexibly, e.g.:
• fluctuations in the influent flow and composition are easily eliminated• all kinds of waste water with concentrations in the range of 10–100000 ppm can be treated
by simply adapting the circulation ratio (more highly concentrated waste water requires alarger circulation ratio)
• fluidisation of pellets is also maintained if no waste water is fed.
If very strict demands have to be met, the effluent can be polished by conventional orcontinuous sand filtration or membrane filtration. This filtration stage can be situated eitherinside the circulation loop or at the effluent flow. The effluent is used for back-washing ofconventional sand filters. The carry-over removed by the filter is re-dissolved by mixing withthe acid feed or acidified and returned to the reactor. An example of a crystallisation process ina chemical production is given in Figure 3.21 [cww/tm/97].
Rubber additives
Pesticides
Crystalli-sationdevice
Waste water
Containing: ①①①① only zinc ②②②② only nickel ③③③③ only tellurium
①①①①②②②②
Na2CO3
③③③③MnSO4
Pellet bunkers
ZnCO3 NiCO3 MnTeO3
①①①① ②②②② ③③③③
NaOH
Figure 3.21: Multi Purpose Application of Crystallisation in a Chemical Production

Chapter 3
Waste Water and Waste Gas Treatment 89
Application
In most cases, crystallisation is applied to remove heavy metals from waste water streams and torecover them subsequently for further usage, but fluoride, phosphate and sulphate can also betreated. Examples of usage in the chemical industry are [cww/tm/97]:
• recovery of zinc, nickel and/or tellurium in the production of rubber additives, with feedconcentrations between 50 and 250 ppm
• recovery of nickel and aluminium in the production of elastomers, the crystallisation deviceworking prior to a central biological WWTP, with feed concentrations between 50 and 400ppm for nickel and aluminium respectively.
In principle, almost all heavy metals, metalloids and anions can be removed from all kinds ofwaste water by crystallisation. The formation of salt pellets is feasible when the solubility of thegenerated salt is low and the metal or anion crystallises quickly into a stable crystal lattice.Whereas metals are normally abstracted as carbonates, hydroxy carbonates, hydroxides,sulphides, phosphates, sulphates, fluorides etc, anions are generally removed as calcium salts[cww/tm/97].
Application limits and restrictions:
Limits / restrictionsFlow rate 0.1–10000 m3/hPollutant content 10 mg/l–100 g/lRemoval capacity up to 100 kg metal/anion per hour per unit
Advantages and Disadvantages
Advantages Disadvantages• Compact and flexible units, thus enabling
modular set-up and tailor-made materialsselection.
• No sludge production.• Water-free pellets with high purity which
enables recycling or further usage of the metalcontent in other sectors.
• Raw material recovery / recycling.• Nearly waste-free process.
• Only applicable to ionic constituents forminginsoluble or hardly soluble salts.
• Reagents restricted to non-hazardoussubstances.
• Total salt content of waste water is notdecreased.
Achievable Emission Values / Performance Rates
The main purpose of crystallisation is the abatement or recovery of heavy metals. Achievableeffluent emissions are:
Parameter Emission level[mg/l] Agent Remarks
Zinc 1 1 soda, causticsoda feed 50-250 mg/l, pH 10
Nickel 1 1 soda, causticsoda feed 50-250 mg/l or 1000 mg/l, pH 10
Tellurium 1 1manganesesulphate,caustic soda
pH 9, after filtration
Aluminium 20 1 sulphate,caustic soda feed 50-400 mg/l
1 [cww/tm/97]

Chapter 3
90 Waste Water and Waste Gas Treatment
Cross-media Effects
To achieve good removal results, the reagents necessary to form the precipitates are normallyadded in an over-dosage. This means that the removal of one substance has as a consequencethe addition of another compound not present in the original waste water stream.
Normally no waste or sludge arises, since the precipitated salts are attached to the pellets. Theyare almost free of impurities and their moisture content is only up to 5–10 % after atmosphericdrying [cww/tm/97]. Thus the pellets can be used to recover the abated pollutant substances.
Sources of noise are the pumps, which may need to be housed for noise abatement.
Consumables are:
Consumable AmountCrystallisation chemicalsEnergy [kWh/m3]
Monitoring
Important parameters to control are:
• water flow, to keep the fluidised bed working• the concentration / load of the metal or anion in question in the influent• the reagent dosage, to maintain the optimum conditions for crystallisation• pH, for the same reason• the concentration of the metal or anion in the effluent.
Economics
The economic situation is [cww/tm/97]:
Type of costs Costs a[USD/kg] Remarks
Capital costsOperating costs:
Depreciation 3–25 depending on capacityChemicals 0.50–2.50 depending on concentration
Energy 0.25Staff 1 hour per day
Maintenance 3-5 % of investmentBenefits:
Re-use 0–14.50 depending on anion or metalReduction of chemical waste 2–8 depending on concentration in sludge
Reduction of operatingcost for precipitation 0.50–3 in the case of pretreatment
Saving on investmentfor precipitation plant 3–12 in the case of final treatment
Reduction of discharge fee 30-40 in the case of final treatmenta per kg recovered anion or metal
3.3.4.2.3 Chemical Oxidation
Description
Chemical oxidation is the conversion of pollutants by chemical oxidation agents other thanoxygen/air or bacteria to similar but less harmful or hazardous compounds and/or to short-chained and easily biodegradable organic components. Chemical oxidation agents are, e.g.:

Chapter 3
Waste Water and Waste Gas Treatment 91
• chlorine• sodium or calcium hypochlorite• chlorine dioxide• ozone (with or without UV irradiation)• hydrogen peroxide / UV irradiation• hydrogen peroxide / ferrous salts (Fenton’s agent).
Frequent operations in connection with chemical oxidation are:
• oxidation with ozone• oxidation with hydrogen peroxide• oxidation with ozone / UV irradiation• oxidation with hydrogen peroxide / UV irradiation• oxidation with ozone, hydrogen peroxide and UV irradiation• oxidation with chlorine, hypochlorite.
The design of an oxidation reactor depends on its special purpose:
• Oxidation processes are normally operated at pressures of up to 0.5 MPa [cww/tm/82].Depending on whether UV irradiation is acting as an accelerator, the equipment of thereactor has to provide for the radiation source, e.g. a low-pressure mercury lamp. In such acase the reactor usually consists of quartz tubes, transparent to UV rays, confining the wastewater, and the UV lamps outside, or the UV lamps inside the quartz tubes that are enclosedby the waste water.
• If ozone is involved in the process, an ozone generator is part of the equipment, becauseozone as an unstable compound cannot be transported and has to be generated in situ. Aftertreatment, surplus ozone has to be eliminated. Safety requirements to handle ozone arestrict.
• With hydrogen peroxide as oxidation agent, a GAC adsorber (see Section 3.3.4.2.9) isnecessary to eliminate surplus agent.
• Application of chlorine entails special equipment, such as titanium manufactured vessels.Additional installations should be provided that can eliminate surplus chlorine orhypochlorite by, e.g., sulphite.
Storage facilities have to be provided for the oxidation agents, bearing in mind the hazardouspotential of these substances.
Application
Chemical oxidation is normally applied when the waste water contains contaminants that arenot readily biodegradable, or not biodegradable at all (e.g. inorganic components), might disturbthe biological or physico-chemical process in a downstream WWTP or have properties tooharmful to allow them to be released into a common sewer system. Examples of suchcontaminants are:
• oil and grease• phenols• polycyclic aromatic hydrocarbons (PAHs)• organic halides• dyes (with Fenton’s agent)• pesticides• cyanides• sulphides• sulphites• heavy metal complexes.

Chapter 3
92 Waste Water and Waste Gas Treatment
Some of these contaminants are biodegradable to a certain extent and can alternatively betreated with specially adapted micro-organisms. In these cases, whether chemical oxidation ispreferred to biological oxidation depends on the local situation. When small quantities of wastewater are involved or when there is no biotreatment available at a site, chemical oxidation mightbe a recommendable treatment option instead of installing a central biological WWTP.
Oxidation reactions with active oxygen (ozone, hydrogen peroxide), often accompanied by UVirradiation, are used, e.g., to treat leachates from landfills or remove refractory COD, odorouscomponents or colour pigments.
Oxidation with chlorine or sodium chlorite can be used under special conditions to removeorganic contaminants, even organic halides. An example is the SOLOX®-Process to eliminate(at elevated pressure and temperature) COD/TOC and AOX from waste water originating fromepichlorohydrin production. But the use of chlorine, hypochlorite and chlorite (or the respectivehalogen compounds) has to be carefully examined in each case, because of the risk ofgenerating organic halides from organic content in the waste water stream.
Application limits and restrictions:
Limits / restrictionsUV irradiation • high turbidity results in poor transmission of UV
• ammonia content needs to be low, competes with the organics consumingradicals [cww/tm/27]
• substances that tend to fouling will decrease the efficiency• incomplete oxidation or formation of intermediate contaminants can hamper
the effectiveness of the process
Advantages and Disadvantages
Advantages Disadvantages• Waste water with refractory COD
concentrations over a range of some g/l downto less than 1 µg/l can be treated [cww/tm/77].
• Inorganic substances can be treated.• Large fluctuations can be managed.• Small residence time and thus small tank
volume required (H2O2 oxidation proceeds atatmospheric pressure and room temperaturewithin 60–90 minutes [cww/tm/132])
• Process can be combined with any other toachieve optimum results (GAC adsorption,stripping, activated sludge biology).
• High energy consumption: ozone generation,UV generation, pressure and heating forchlorine oxidation.
• High feed quality demands.• Generation of organic halides possible, when
halogen compounds are used as oxidationagent.
Achievable Emission Levels / Performance Rates
For hydrogen peroxide as oxidation agent the COD elimination of various organic substances asa function of hydrogen peroxide utilisation is illustrated in Table 3.4.
Substance DosageH2O2 / COD [%] a
CODelimination [%] b
H2O2utilisation [%]
Morpholine 100 20 202-Aminoethanol 100 37 37Diethyleneglycol 100 45 45Polyethyleneglycol 100 35 35Hexamethylenetetramine 100 32 322,4-Difluoro-5-chloro-6-methylpyrimidine 100 30 30Phenyltrifluoroethylcarbamide 80 75 94Ammonium trifluorothyldithiocarbamate 80 79 99a percentage of stoichiometric amountb percentage of initial value
Table 3.4: COD Elimination of Various Substances as a Function of H2O2 Utilisation [cww/tm/132]

Chapter 3
Waste Water and Waste Gas Treatment 93
Further achievable performance rates are:
ParameterPerformance
rate[%]
Oxidationagent Remarks
TOC >90 1 chlorine / hypo-chlorite feed about 1 g/l TOC
AOX 80 1 chlorine / hypo-chlorite feed about 40 mg/l AOX
OilPhenolsPAHCyanideSulphideSulphite1 [cww/tm/82], SOLOX process
When waste water with refractory organic contents is treated, the main task is to break thesecomponents into more easily degradable / less harmful compounds. Bearing that in mind, themost practical source of performance evidence might not be just the removal efficiency of theoxidation process itself, but rather the overall reduction of these contaminants, achieved in co-operation with preceding and subsequent treatment processes.
Cross-media Effects
Whereas oxidation with ozone and/or hydrogen peroxide does not normally create a problemtransfer from the water to the air and/or the disposal section, the use of chlorine or hypochloritehas to be validated critically for each application. As already mentioned, chlorine andhypochlorite might – in contrast to the example of the SOLOX-process – generate chlorinatedorganic compounds that are poorly degradable and/or toxic. This can also be detected whenwaste water loaded with organic compounds is mixed with other streams that contain surplushypochlorite from preceding oxidation steps. Waste water treated by chlorine oxidation has tobe relieved of surplus chlorine or hypochlorite before it is discharged into the general sewersystem.
Consumables are:
Consumable AmountOxidation agentAgent to destroy surplus oxidantEnergy [kWh/m3]
for ozone production [kWh/kg O3] 9-12 (1-3 wt-% ozone from oxygen;double value with dry air)
Monitoring
During the oxidation process a thorough monitoring of operation parameters is crucial, e.g.:
• pH• redox potential• ozone concentration (ozone concentrations of 15-20 % in air are very unstable and tend to
decompose [cww/tm/27])• oxygen concentration (for safety reasons)• content of surplus oxidant in the effluent• AOX content in the effluent, if chlorine base agents are used.
Chapter 3
94 Waste Water and Waste Gas Treatment
Economics
Chemical oxidation does not operate cost-effectively when high contaminant concentrations areexpected, because large amounts of agent are then required. Advanced oxidation processes suchas:
• UV / hydrogen peroxide• UV / ozone• UV / hydrogen peroxide / ozone
entail high capital and operating costs and require more extensive waste water pretreatment thanirradiation-free processes.
Type of costs Costs RemarksCapital costsOperating costs
3.3.4.2.4 Wet Air Oxidation
Description
Wet air oxidation is the reaction with oxygen in the aqueous phase under high pressure andtemperature. The reaction often takes place in the presence of catalysts. Reaction products are,dependent on the waste water content:
• carbon monoxide from organic content• carbon dioxide from organic content• water from organic content• nitrogen from hydrazine, or from ammonia / ammonium and N-containing organics, if a
catalyst is used• nitrate from nitrite and N-containing organics• ammonium, in the absence of a catalyst• (hydrogen) chloride from organic chlorides• sulphate from sulphides, sulphites and thiocyanates• phosphate from phosphorous-containing compounds.
For a better assessment of the potential range of applications for wet oxidation, it has provenadvantageous to develop two process variants with differing reaction conditions:
• low-pressure wet oxidation• high-pressure wet oxidation.
The corresponding distinctions in temperature and pressure are also associated with majordifferences in process engineering factors, material considerations and plant safety requirements[cww/tm/132].
Typical properties of the two variants are:
Low-pressure High-pressureTemperature range [°C] 30–200 150–340Pressure range [MPa] 0.5–2 >2Residence time [h] 0.5–3 0.5-3
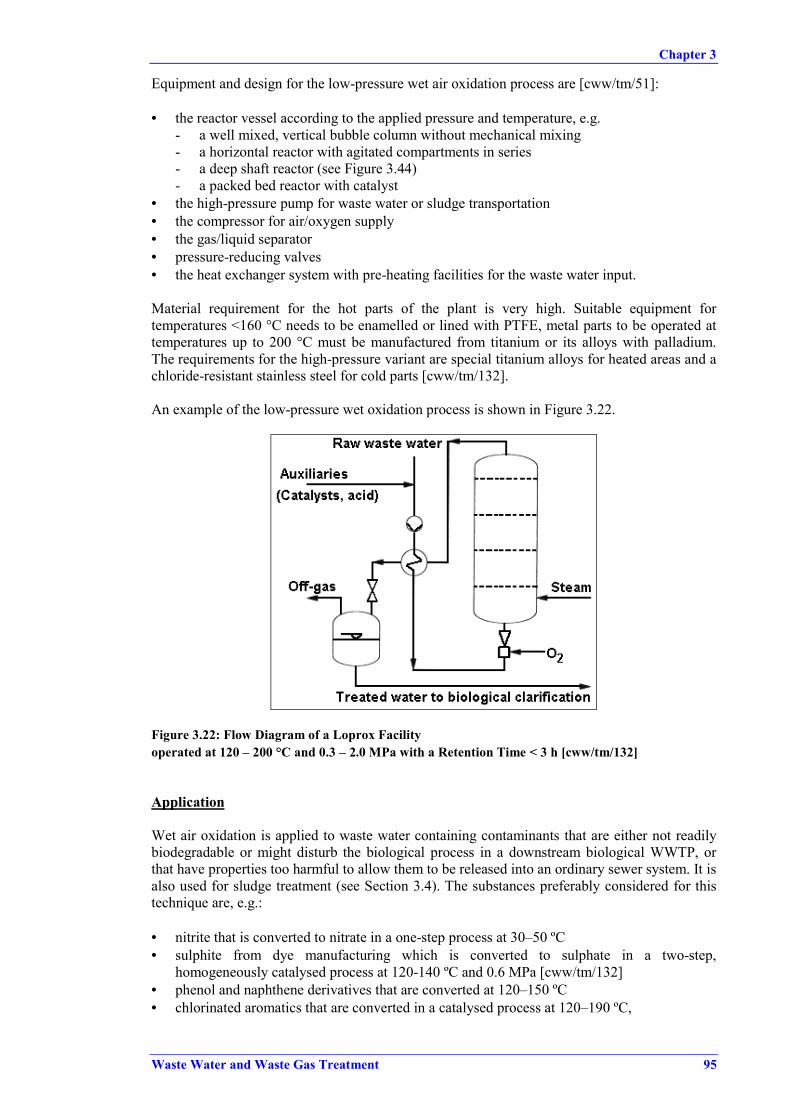
Chapter 3
Waste Water and Waste Gas Treatment 95
Equipment and design for the low-pressure wet air oxidation process are [cww/tm/51]:
• the reactor vessel according to the applied pressure and temperature, e.g.- a well mixed, vertical bubble column without mechanical mixing- a horizontal reactor with agitated compartments in series- a deep shaft reactor (see Figure 3.44)- a packed bed reactor with catalyst
• the high-pressure pump for waste water or sludge transportation• the compressor for air/oxygen supply• the gas/liquid separator• pressure-reducing valves• the heat exchanger system with pre-heating facilities for the waste water input.
Material requirement for the hot parts of the plant is very high. Suitable equipment fortemperatures <160 °C needs to be enamelled or lined with PTFE, metal parts to be operated attemperatures up to 200 °C must be manufactured from titanium or its alloys with palladium.The requirements for the high-pressure variant are special titanium alloys for heated areas and achloride-resistant stainless steel for cold parts [cww/tm/132].
An example of the low-pressure wet oxidation process is shown in Figure 3.22.
Figure 3.22: Flow Diagram of a Loprox Facilityoperated at 120 – 200 °C and 0.3 – 2.0 MPa with a Retention Time < 3 h [cww/tm/132]
Application
Wet air oxidation is applied to waste water containing contaminants that are either not readilybiodegradable or might disturb the biological process in a downstream biological WWTP, orthat have properties too harmful to allow them to be released into an ordinary sewer system. It isalso used for sludge treatment (see Section 3.4). The substances preferably considered for thistechnique are, e.g.:
• nitrite that is converted to nitrate in a one-step process at 30–50 ºC• sulphite from dye manufacturing which is converted to sulphate in a two-step,
homogeneously catalysed process at 120-140 ºC and 0.6 MPa [cww/tm/132]• phenol and naphthene derivatives that are converted at 120–150 ºC• chlorinated aromatics that are converted in a catalysed process at 120–190 ºC,

Chapter 3
96 Waste Water and Waste Gas Treatment
using the low-pressure variant, and
• organic nitro compounds that are converted to nitrogen• organic amino compounds or aromatics containing nitrogen hetero atoms that are converted
to ammonia• organic sulphur compounds that are converted to sulphate• organic phosphorous compounds that are converted to phosphate• chlorinated organic compounds that are converted to hydrochloric acid,
using the high-pressure-variant.
Examples for production processes where wet air oxidation is applied are, e.g. [cww/tm/160]:
• production of dyes and intermediates• oxidation of aromatic sulphonates• production of derivatives of phenol or naphthol• production of aromatic hydrocarbons.
Wet air oxidation might also replace a central biological WWTP, if the amount of waste wateris too small to warrant such a plant or if there is no biotreatment available.
Application limits and restrictions:
Limits / restrictionsContaminantconcentration
• no advantage for low COD concentrations; recommendable forCOD concentrations between 5000 and 50000 mg/l [cww/tm/160],concentrations between 6000 and 8000 mg/l being autothermal[cww/tm/132]
• concentrations over 100000 mg/l demanding dilution [cww/tm/27]• with the high-pressure variant, COD concentrations above
50000 mg/l are required to equal the total energy demand of theprocess [cww/tm/132]
• fluoride concentrations <10 mg/l (low-pressure variant)[cww/tm/160], higher concentrations to be pretreated, e.g. byprecipitation with calcium salt and subsequent filtration; <5 mg/l(high-pressure variant) [cww/tm/160]
• fluoride concentrations consistent with the solubility product ofcalcium fluoride are sufficient to initiate corrosions at pH <5 (high-pressure variant) [cww/tm/132]
• salt loads have to be minimised as far as possible, at least with thehigh-pressure variant, because of corrosion [cww/tm/82], e.g.[cww/tm/160]:salt <150 g/lchloride <50 g/lphosphate <400 mg/lNH4-N <2.5 mg/lCa, Fe, Al, Cu <100 mg/l
Waste waterfluctuations
waste water needs to be collected and equalised upstream of theoxidation facilities
Advantage and Disadvantage
Advantages Disadvantages• Waste water with relatively high refractory
COD concentrations can be treated.• Inorganic contaminants can either be
eliminated or transferred to less hazardoussubstances.
• Can be combined with other treatments.
• Dioxins can be generated [cww/tm/82].

Chapter 3
Waste Water and Waste Gas Treatment 97
Achievable Emission Levels / Performance Rates
When the elimination of refractory organic contents and/or inhibitors to subsequent biologicaltreatment is the main goal, this is normally done in a two-step approach:
• break the refractory components into short chain or easily degradable compounds• then send this waste water to a downstream (central) biological WWTP.
Thus performance evidence is not assessed by looking just at the efficiency of the oxidationprocess, but also by taking into account the efficiency of the subsequent biological process.
For the low-pressure variant, the following data are reported:
Parameter Performance Remarks
60–90 % 1example: 85 % reduction by wet oxidation (190 °C, 2 MPa),followed by 90 % reduction after biological clarificationstep, in total 98 % COD reduction 3COD
50 % 2 90 % after biological treatment
AOX 60–>90 1,3 reaction temperature of 190 °C
BOD/COD increase from0.1 to 0.5 3 reaction temperature of 190 °C
Sodium sulphide <1 mg/l 4 initial concentration 30 g/l, 160 °C, 0.9 MPa1 [cww/tm/82]2 [cww/tm/160]3 [cww/tm/132]4 [cww/tm/149]
For the high-pressure variant, the following data are reported:
ParameterPerformance
rate[%]
Remarks
COD 99 1 initial concentration 30 g/l, 250 °C, 7 MPa
TOC 95 2 280 °C, 12 MPa
AOX 80 2 280 °C, 12 MPa
Aromatic amines 76–83 3 initial TOC 14.6 g/l, pH 1.1-10, 280-300 °C
Nitrogen heterocycles 77–92 3 initial TOC 1.1-14.3 g/l, pH 1.1-10, 280-300 °C
Azo compounds 97–99 3 initial TOC 13.1 g/l, pH 1.5-10, 280-300 °C
Nitrosulphonic acids 76–84 3 initial TOC 14.0 g/l, pH 1.5-10, 280-300 °C
Oxygen heterocycles 80–87 3 initial TOC 52 g/l, pH 11.5, 280-300 °C
Cl-containing sulphonic acids 90–93 3 initial TOC 3.5 g/l, pH 1.6, 280-300 °C
Aminosulphonic acids 80–88 3 initial TOC 20-24 g/l, pH 1.4-2.2, 280-300 °C
Aminopolysulphonic acids 64–65 3 initial TOC 47.6 g/l, pH 0.5, 280-300 °C
Nitro compounds 93–94 3 initial TOC 6 g/l, pH 9.3, 280-300 °C
Oxy compounds 75–81 3 initial TOC 9.2 g/l, pH 2.2, 280-300 °C
Mixed waste water 77–81 3 initial TOC 11.4 g/l, pH 1.9, 280-300 °C1 [cww/tm/149]2 [cww/tm/160]3 [cww/tm/132]

Chapter 3
98 Waste Water and Waste Gas Treatment
As an example of the application of high-pressure wet air oxidation to low TOC concentrations,the removal of pesticides is reported as [cww/tm/27]:
ContaminantInfluent
concentration[µg/l]
Effluentconcentration
[µg/l]Remarks
Aldrin 500 <50DDT 21000 <300Endosulfan 18400 291Endrin 3600 <1002,4-Dichlorophenol 180 <3.1
Cross-media Effects
Under adverse conditions, generation or regeneration of dioxins can occur, so residues mightneed further treatment. The effluents from this process – aqueous and off-gas (carbonmonoxide, lower hydrocarbons) – have to undergo downstream treatment, e.g. biologicaltreatment, adsorption or stripping of waste water, and gas scrubbing, biofiltration orthermal/catalytic oxidation of waste gas.
Consumables are:
Consumable AmountAir, oxygenEnergy [kWh/m3]
The energy consumption depends on the TOC load. When the TOC content exceeds theautothermal range, the generated heat can be used by means of installed heat exchangers.
Monitoring
During the whole process a thorough monitoring of operation parameters such as pressure,temperature and oxygen content is vital to ensure faultless working.
Economics
Type of costs Costs RemarksCapital costs
DEM 5/m3 1 at 100 °CDEM 20–40/m3 1 at 200 °COperating costs
EUR 1.5/kg TOC 21 [cww/tm/132]2 [cww/tm/160]
3.3.4.2.5 Supercritical Water Oxidation (SCWO)
Description
SCWO is a special application of the high-pressure variant of wet air oxidation (seeChapter 3.3.4.2.4). The oxidation reaction takes place in the supercritical region of water, i.e.temperatures over 374 °C and pressures above 22.1 MPa. The process is illustrated in Figure3.23.
Waste water is brought to the supercritical pressure by a high-pressure pump before it enters theeconomiser, where the feed is preheated by the reactor effluent. At start-up, or if the organicconcentration in the waste water is less than 4 %, the feed has to be heated further to reach thesupercritical temperature range. When oxygen is added to the feed the temperature in the reactorwill rise to about 600 °C.

Chapter 3
Waste Water and Waste Gas Treatment 99
Waste water
High-pressure pump
27.5 MPa
Steam boiler
Cooler
Pressurerelease
CO2, O2, N2
Gas/liquidseparator
Pure water
Gas-firedheater
Gas
Oxygen
Oxygen pump
Oxygenvaporiser
Reactor
400 ° C
600 °C
Feed water
Feed water pump
Steam 1 MPa
Economiser
Tank
Figure 3.23: Simplified Flowsheet of the SCWO Process
The reactor effluent flows into the economiser, then through a heat recovery steam generatorand through an effluent cooler. Finally a control valve drops the effluent pressure toatmospheric conditions and the liquid and gas phases are separated.
The organic waste water content is reduced to carbon dioxide, water and nitrogen.
Characteristics of SCWO are:
• complete solubility of organic compounds in supercritical water• complete precipitation of inorganic solids, such as salts• reaction time for complete destruction between 30 and 60 seconds, strongly dependent on
the reaction temperature• reaction at about 25 MPa and 400–600 °C• complete conversion of the organic content, i.e.
- organic carbon is converted to carbon dioxide- organic and inorganic nitrogen are converted to nitrogen gas- organic and inorganic halogens are converted to the corresponding acid- organic and inorganic sulphur are converted to sulphuric acid.
• destruction of volatile solids• oxidation of heavy metals to their highest oxidation state• separation of all inerts as fine, non-leachable ash.
Application
SCWO is applied to contaminants with low biodegradability and/or high toxicity in thechemical, petrochemical and pharmaceutical industry. It also destroys dioxins and PCB,whereas the relatively low temperature range of 400–600 °C makes it unlikely to produce NOx(i.e. nitrogen oxides, excluding N2O).
Another application field for SCWO is the treatment of industrial and municipal sludge todestroy toxic organic compounds, including dioxins.

Chapter 3
100 Waste Water and Waste Gas Treatment
Advantages / Disadvantages
Advantages Disadvantages• All organic content, irrespective of its
properties, is destroyed.• Very high destruction efficiency at relatively
low temperatures achieved, resulting in NOx-free emissions.
• No dioxins generated.• Very short reaction time necessary, resulting in
short residence time and thus in low reactorvolume.
• Can be combined with other downstreamtreatments.
• Traces of laughing gas (N2O) and acetic acidare likely to be found.
• Inorganic solids precipitate and might causecorrosion.
Achievable Emission Levels / Performance Rates
ParameterPerformance
rate[%]
Remarks
Organic compounds >991,2,4-Trichlorobenzene 99.99 1 495 °C, 3.6 min4,4-Dichlorobiphenyl >99.99 1 500 °C, 4.4 minDDT >99.99 1 505 °C, 3.7 minPCB 1234 99.99 1 510 °C, 3.7 minPCB 1254 99.99 1 510 °C, 3.7 minDioxin >99.99 1 574 °C, 3.7 min1 [cww/tm/27]
Cross-media Effects
Depending on the waste water influent, the gaseous effluent contains traces of laughing gas andacetic acid generated by the process, but also hydrogen halides as a degradation product oforganic halides, which need to be treated in downstream waste gas facilities. Inorganic solidsneed to be discharged if they cannot be recycled or used elsewhere.
The installation is a source of noise, relating to the pressure generation. To abate noise theequipment needs to be closed.
Consumables are:
Consumable AmountAir, oxygenEnergy [kWh/m3]
Monitoring
During the whole process a thorough monitoring of operating parameters such as pressure,temperature and oxygen content will inform about faultless working.
Economics
Type of costs Costs RemarksCapital costsOperating costs

Chapter 3
Waste Water and Waste Gas Treatment 101
3.3.4.2.6 Chemical Reduction
Description
Chemical reduction is the conversion of pollutants by chemical reduction agents to similar butless harmful or hazardous compounds. Common chemical reducing agents are, e.g.:
• sulphur dioxide• sodium hydrogen sulphite/metabisulphite• ferrous sulphate• sodium sulphide and sodium hydrogen sulphide• urea or amidosulphonic acid (at low pH).
They are brought into contact with the waste species under appropriate pH and concentrationconditions. Chemical reduction normally results in products that can be treated more easily indownstream treatment facilities such as chemical precipitation.
The design of the treatment reactor depends on its special purpose. The basic facility is acontinuously stirred tank reactor (CSTR), tailor-made according to the process requirements,e.g. corrosion- and pressure-resistant material or cover and ducts for gases arising. Additionalinstallations should be provided to eliminate surplus reducing agent, e.g. hypochlorite orhydrogen peroxide to oxidise sulphite to sulphate. Adjustments to the design and operatingparameters, e.g. by pH and redox potential (ORP) control, may alleviate this problem. Chemicalreduction plants need not be especially sophisticated and costly. Where continuous / automaticprocessing is appropriate, the capital cost might be higher, but is normally compensated bylower operating costs. The process is performed in fully automatic units operated by monitoringa surrogate indicator parameter, typically the ORP.
Storage facilities need to be provided for the reduction agents, bearing in mind the hazardouspotential of these substances.
Application
Chemical reduction is applied to waste water that contains contaminants that are not readilyremovable or have properties too harmful to allow them to be released into a common sewersystem. The target contaminants are inorganic compounds: it is less effective with organiccompounds.
Examples of such contaminants are:
• chromium(VI), which is reduced to chromium(III)• chlorine or hypochlorite, which are reduced to chloride• hydrogen peroxide, which is reduced to water and oxygen• nitrite, using urea or amidosulphonic acid at low pH.
The frequent downstream operation in connection with chemical reduction is chemicalprecipitation.
Application limits and restrictions:
Limits / restrictionsSubstances the number of affected inorganic substances is limitedpH, ORP performance highly dependent on pH and ORP, thus strict control of
these parameters essentialReaction conditions good stirring is required

Chapter 3
102 Waste Water and Waste Gas Treatment
Advantages and Disadvantages
Advantages Disadvantages• Waste water over a large concentration range
can be treated (from some g/l down to less than1 mg/l).
• Gas formation is common; with sulphide, thegeneration of hydrogen sulphide is possible.
Achievable Emissions Levels / Performance Rates
Reported removal efficiencies are very high.
ParameterPerformance
rate[%]
Reductionagent Remarks
Chromium(VI)ChlorineHypochloriteHydrogen peroxide
Cross-media Effects
No particular environmental problems are to be considered. The arising gases are captured andducted to downstream waste gas treatment facilities.
Consumables are:
Consumable AmountReduction agentChemical agent to destroy surplusreaction agentsEnergy [kWh/m3]
The consumption of reduction agent depends on the contaminant load; the consumption ofchemicals to destroy surplus reactants depends on the processing quality.
Monitoring
The reaction is monitored and controlled by independent control loops:
• caustic/acid addition by pH control• reducing agent addition by ORP control.
The effluent needs to be checked for surplus reduction agents.
Economics
Combined with high contaminant concentrations and the large amount of reducing agent theremight be other treatment techniques that are more cost-effective.
Type of costs Costs RemarksCapital costsOperating costs

Chapter 3
Waste Water and Waste Gas Treatment 103
3.3.4.2.7 Chemical Hydrolysis
Description
Basically, hydrolysis is a destructive technology. It is a chemical reaction in which organic andinorganic constituents react with water, breaking into smaller compounds. In some cases, thereaction continues and other products – usually short-chained and easily biodegradablecompounds – are formed. Downstream treatment of the chemically hydrolysed stream isgenerally required, e.g. in a central biological WWTP.
The design of a hydrolysis reactor depends on its purpose. Normally, hydrolysis processes areoperated at ambient pressure and temperature. When high temperature is required, the reactorhas to be fitted with a heat exchanger system with pre-heating facilities for the waste waterinput. In some cases, autoclaves may be required, thus ensuring temperatures well above 100 °Cand pressures up to 0.5–1 MPa. Processes are batch-based and require staff to charge and emptythe vessel. If low(er) boiling compounds are obtained from the chemical degradation of thepollutants, the plant may also be provided with vacuum facilities to remove contaminated liquidand vapour and enable the application of more than one temperature and pressure cycle withoutthe need to open the vessel.
Since surplus acid or base has to be neutralised after the treatment operation, additionalinstallations need to be provided. Safety requirements to handle strong acids and bases are strict.Their use entails special corrosion-resistant equipment.
Storage facilities need to be provided for acids and bases, bearing in mind the hazardouspotential of these substances.
Application
Chemical hydrolysis is applied to waste water streams containing contaminants not readilybiodegradable, or that might disturb the biological process in a downstream biological WWTPor have properties too harmful to allow them to be released into a common sewer system.Examples of such contaminants are:
• organic halides• pesticides• organic cyanides• organic sulphides• organophosphates• carbamates• esters• amides.
Frequent operations in connection with chemical hydrolysis are:
• chemical neutralization• chemical oxidation• precipitation.
The reaction is highly dependent on chemical structure, pH and temperature:
• increase of temperature entails increase of hydrolysis rate• low or high pH can increase the reaction rate, depending on the reagent, e.g. phosphoric
acid esters and organic chlorides are preferably hydrolysed under alkaline conditions• catalysts can increase the reaction rate.

Chapter 3
104 Waste Water and Waste Gas Treatment
Application limits and restrictions:
Limits / restrictionspH either acidic or alkalineTemperature 15–80 °C, up to 120 °C under pressureConcentration range 1 mg/l–100 g/lSubstance properties substances requiring too drastic operating conditions are unsuitableWater solubility low solubility in aqueous media can limit the applicability
Advantages and Disadvantages
Advantages Disadvantages• Waste water with a large range of refractory
COD can be treated.• Process can be combined with many
downstream treatment operations, such as GACadsorption, air/vapour stripping, activatedsludge biology.
• Chemical neutralisation of the hydrolysedstream is usually needed, thus entailingadditional salt load to the recipient and/oradditional sludge to be disposed of.
• Gases and vapours may be released.• High pressure and / or heating are often
needed, resulting in considerable energyconsumption.
Achievable Emission Levels / Performance Rates
Removal efficiencies are strongly dependent on the compound’s chemical structure, pH andtemperature. Quantitative degradation can be achieved, but pilot studies are required to get theindividual treatment conditions.
ParameterPerformance
rate[%]
Reactionconditions Remarks
CODAOX
Since the elimination of refractory organic contents and/or inhibitors of subsequent biologicaltreatment is the main goal, the performance evidence is not assessed by looking just at theefficiency of the hydrolysis process, but also by taking into account the efficiency of thesubsequent biological process.
Cross-media Effects
Chemical hydrolysis with strong alkalis – NaOH and Ca(OH)2 – or acids – H2SO4 – does notusually create cross-media transfer, e.g. from water to air and/or waste, to be disposed of.
Releases of odorous and/or volatile substances – if any are expected – are normally preventedby covering the vessel or operating in a closed tank and ducting the exhaust air to a waste gasabatement system.
Consumables are:
Consumable AmountChemicalsSteam / hot water for heatingEnergy [kWh/m3]

Chapter 3
Waste Water and Waste Gas Treatment 105
Monitoring
During the hydrolysis process a thorough monitoring of operating parameters, such as:
• temperature• pH• pressure• residence time
is crucial. The effluent should be checked for specific compounds degraded and surplus acid /base agents.
Economics
The costs are:
Type of costs Costs RemarksCapital costsOperating costs
3.3.4.2.8 Nanofiltration (NF) and Reverse Osmosis (RO)
Description
A membrane process is the permeation of a liquid through a membrane, to be segregated intopermeate that passes the membrane and concentrate that is retained. The driving force of thisprocess is the pressure difference across the membrane.
NF and RO membranes can hold back all particles down to the size of organic molecules andeven ions. Provided that the feed is particle-free, these membranes are mainly used whencomplete recycling of permeate and/or concentrate is desired.
The typical characteristics of NF and RO membranes are illustrated in Table 3.5.
Parameter Nanofiltration Reverse osmosis
Pore diameter [µm] 1 0.01–0.001 <0.001
Operating pressure[MPa] 0.5-3 2 2-100 3
Cut-off size [nm] 2 >1200–1000 g/mol <1000 g/mol
Permeate flow[l m-2 h-1] <100 10–35
Cross flow speed[m/s] 2 1-2 <2
Membrane type polymeric asymmetric or composite polymeric asymmetric or composite
Membrane configuration spiral-woundtubular
spiral-woundtubular
1 [cww/tm/27]2 [cww/tm/132]3 [cww/tm/159]
Table 3.5: Characteristics of Nanofiltration (NF) and Reverse Osmosis (RO)

Chapter 3
106 Waste Water and Waste Gas Treatment
Membranes are available in several materials and configurations. The optimum modification fora particular application will depend on the nature of the waste water, since the differentmaterials have varying resistances to dissolved substances. Membrane materials for NF are,e.g.:
• cellulose acetate• polyamide.
Membrane materials for RO are organic polymers, such as:
• cellulose acetate• polyamide• polyimide• polycarbonate• polyvinylchloride• polysulphone• polyethersulphone• polyacetal• copolymers of acrylonitrile and vinyl chloride• polyelectrolyte complexes• cross-linked polyvinyl alcohol• polyacrylates.
The polyamide-based membranes are normally superior to cellulose acetate-based membranesfor the removal of trace organic molecules.
NF and RO processes are usually operated cross-flow, i.e. the permeate flow is directedperpendicular to the feed flow. The impurities remain in the feed which, reducing in volume,leaves the membrane system as a concentrated waste stream.
Even under the best pretreatment regimes and programmes, membranes will foul and deterioratein performance if cleaning is not ensured. So membrane systems should be designed in such away that those modules can be taken offline and cleaned mechanically or chemically.
An industrial membrane plant usually consists of three separate sections:
• the pretreatment section where the feed is treated by chemical clarification (precipitation,coagulation/flocculation or flotation) and subsequent filtration, or by filtration andsubsequent UF
• the membrane section where high pressure is applied and the waste water cross-flowedacross the membrane
• the post-treatment section where the permeate is prepared for re-use or discharge, and theconcentrate brine collected for further work-up or disposal.
As an example a typical RO arrangement is illustrated in Figure 3.24 [cww/tm/4].
Membrane units are arranged as modules either in parallel – to provide the necessary hydrauliccapacity – or in series – to increase the degree of efficiency.

Chapter 3
Waste Water and Waste Gas Treatment 107
Figure 3.24: RO Arrangement
Application
NF and RO have different applications because of the different properties they exhibit in themigration of molecular particles through their surface.
NF is applied to remove larger organic molecules and multivalent ions in order to recycle andre-use the waste water or reduce its volume and simultaneously increase the concentration ofcontaminants to such an extent that subsequent destruction processes are feasible.
RO is a process to separate water and the dissolved constituents down to ionic species. It isapplied when a high grade of purity is required. The segregated water phase is recycled and re-used. Examples are:
• desalination• final removal of, e.g.:
- degradable components if biological treatment is not available- heavy metals- toxic components
• segregation of pollutants with the aim of concentrating or further processing them.
NF and RO are often used in combination with post-treatment techniques for the permeate, e.g.ion exchange or GAC adsorption.

Chapter 3
108 Waste Water and Waste Gas Treatment
Application limits and restrictions:
Limits / restrictions
NF Particle size restricted capacity to retain suspended particles withmolecular weight <200
Concentration concentrated solutions with osmotic pressure so high that iteither exceeds available operating pressure or is noteconomically viable
Salt solubility salt solutions with low solubility tend to precipitate andthus cause fouling
RO
Polymerisationmonomers contaminants tending to polymerisation cause fouling
Both membrane material low thermal and chemical resistance limits their applicationto a restricted pH and temperature range (18-30 °C)
Advantages and Disadvantages
Advantages Disadvantages• High separation efficiency.• Modular systems, i.e. flexible in usage.• Recycling of permeate and concentrate is
possible.• Low operating temperatures.• Possibility of fully automatic operation.
• Clogging, plugging and fouling processes arepossible.
• Compaction in the presence of softeningagents.
• High pressures required. Low permeate fluxes.
Achievable Emission Levels / Performance Rates
Performance rate[%]Parameter
NF RORemarks
Inorganic mercury >90 1
Organic mercury >90 1
Cadmium compounds >90 1
Tetrachloromethane 96 1
1,2-dichloroethane 71 1
Trichlorobenzene 96 1
Perchloroethene 90–92 1
Atrazine >70 1 84–97 1
γ-Hexachlorocyclohexane 99 1
DDT 100 1
Aldrin 100 1
Dieldrin 100 1
Dichlorvos 98 1
Simazine 95 1
Trifluralin 99 1
Fenitrothion 99 1
Azinphos-methyl 98 1
Malathion 99 1
TOC 80-90 21 [cww/tm/27]2 [cww/tm/160]
Cross-media Effects
Membrane treatment produces a waste stream (concentrate) of approximately 10 % of theoriginal feed volume, in which the target substances are present at levels approximately10 times their concentration in the waste water. An assessment needs to be made as to whetherthis residue can be recycled, disposed of or needs further treatment, e.g. wet oxidation(concentrate from dye production [cww/tm/132]).

Chapter 3
Waste Water and Waste Gas Treatment 109
With organic substances the concentration increase might improve the conditions forsubsequent oxidative destruction processes. With inorganic substances the concentration stagecould be used as part of a recovery process. In both cases, the permeate water from a membraneprocess could potentially be re-used or recycled in the industrial process, thus reducing waterinput and discharge.
Consumables are:
AmountConsumable NF ROMembrane materialChemicals for cleaningEnergy [kWh/m3] 1-3 a 1 1-3 a 1
a low-pressure application, <2.5 MPa1 [cww/tm/161]
The energy consumption is directly related to the flow rate and pressure requirements. It ismainly associated with maintaining a minimum velocity of about 2 m/s across the membranesurface.
Monitoring
To ensure reliable operation, the pressure difference and flow across the membrane have to bemonitored continuously.
Economics
Flow rate[m3/h] Capital costs Operating costs Replacement
costsGBP 350–1100 1 per m2
membrane aGBP 60–140 1 per
m2 membrane aNFEUR 3.3/kg TOC 2
GBP 350–1100 1 per m2
membrane aGBP 60–140 1 per
m2 membrane aRO EUR 10–12 million per
1000 m3/h waste watera for spiral and tubular membranes1 [cww/tm/93]2 [cww/tm/160]
The capital costs, including automated cleaning facilities, can be broken down approximately asfollows [cww/tm/93]:
pumps 30 %replaceable membrane components 20 %membrane modules (housings) 10 %pipework, valves, framework 20 %control system 15 %other 5 %
The operating cost [cww/tm/93] is derived from:
• energy cost of maintaining the hydrostatic pressure and flow rate of the systems• expected membrane life• cleaning regime required• site-specific factors, e.g. labour requirement.

Chapter 3
110 Waste Water and Waste Gas Treatment
They can be broken down approximately as follows [cww/tm/93]:
replaceable membrane components 35–50 %cleaning 12–35 %energy 15–20 %labour 15–18 %
3.3.4.2.9 Adsorption
Description
Adsorption is the transfer of soluble substances (solutes) from the waste water phase to thesurface of solid, highly porous, particles (the adsorbent). The adsorbent has a finite capacity foreach compound to be removed. When this capacity is exhausted, the adsorbent is ‘spent’ andhas to be replaced by fresh material. The spent adsorbent either has to be regenerated orincinerated.
Potential adsorbents for adsorptive waste water purification are listed in Table 3.6[cww/tm/132].
Adsorbent FormSpecific
surface area[m2/g]
Pore volume[cm3/g]
Bulk density[g/l]
granular 500–1000 0.3–0.8Activated carbon powder 600–1500 0.3-1.0 300–550
Lignite coke granular, powder 200–250 <0.1 about 500γ-Aluminium oxide granular, powder 300–350 0.4–0.5 700–800
Adsorber resins granules 400-1500 porosity35–65 v-% 650-700
Table 3.6: Commonly Used Adsorbents and their Properties
Adsorption processes are divided into [cww/tm/132]:
• mixing, usually used for batchwise treatment• percolation, applicable to continuous treatment, normally with fixed-bed adsorber packed in
two columns that are alternatively used on duty and backwashing• pulse-bed or moving-bed process, as continuous percolation, waste water and adsorbent led
in counter-current through the column.
Since the adsorbent active surface is often liable to clogging and blockage, the waste waterneeds to be free from solid content as completely as possible, which often makes an upstreamfiltration step necessary.
An example of the operating stages of a two-column fixed bed adsorber connected in series isillustrated in Figure 3.25 [cww/tm/132].
Adsorber vessels are usually built of corrosion-resistant material, e.g. lined carbon-steel,stainless steel or fibreglass-reinforced plastic (FRP).
Storage facilities for the adsorbent are necessary.

Chapter 3
Waste Water and Waste Gas Treatment 111
Figure 3.25: Operation of 2 Adsorption Columns Connected in SeriesA) Sequence I →→→→ II, early in the process,B) Sequence I →→→→ II, when filter I is due to be replaced,C) Sequence II →→→→ I′′′′ , shortly after the replacement of I,D) Sequence II →→→→ I′′′′ , when filter II is due for replacement
Application
The adsorbent most commonly used in the chemical sector is activated carbon. It is used asgranulate (GAC) in columns or as powder (PAC) dosed to a treatment tank or basin. Othercommonly used adsorbents are lignite coke, activated aluminium oxide, adsorber resins andzeolites.
• GAC Adsorption is applied to remove organic contaminants, mainly those with refractory,toxic, coloured and/or odorous characteristics, and residual amounts of inorganiccontaminants, such as nitrogen compounds, sulphides and heavy metals. Granular mediumfilters, e.g. sand filters, are commonly used upstream of the GAC adsorber to remove thesuspended solids present.
Representative applications are [cww/tm/92]:
- textiles and dyestuffs: removal of TOC, colour, dyes- oil refinery and petrochemical: removal of COD, BOD- detergents, resins, chemicals: removal of TOC, COD, xylene,
alcohols, phenols, resin intermediates,resorcinol, nitrated aromatics, polyols
- herbicides, insecticides: removal of chlorophenols, cresol- pharmaceuticals: removal of phenol- explosives: removal of nitrated phenols
GAC is normally regenerated by thermal reactivation at temperatures of about 900-1000 °C.

Chapter 3
112 Waste Water and Waste Gas Treatment
• PAC Adsorption is applied to the same contaminants as GAC. It is dosed to the wastewater to be treated as a slurry and subsequently removed by separation processes such assedimentation and filtration. PAC can also be added to the waste water stream at the samepoint as the inorganic coagulants and removed by existing sedimentation and filtrationdevices. It is usually preferred where the requirement for adsorptive removal of organics isintermittent or variable. It can be dosed individually as and when it is needed. Anotherapplication is its use in emergency cases to remove refractory, hazardous or toxicsubstances that have escaped into a sedimentation tank, activated sludge tank or othervessel. PAC can also be added to the aeration basin of an activated sludge system, wherethe microbiological processes are enhanced by the adsorption process. PAC adsorbents aretypically used with a mixer-settler or slurry adsorber arrangement in combination withcoagulation/flocculation agents, with the PAC being added in the flocculation,sedimentation or filtration step.
Normally PAC is not regenerated but becomes part of the sludge to be disposed of.
• Lignite Coke is processed and applied like GAC and might replace it when lower cleaningeffects are sufficient. Its lower price is set against its lower adsorption efficiency, thusrequiring larger amounts of adsorbent or more frequent regeneration cycles.
• Activated aluminium oxide is used to adsorb hydrophilic substances, e.g. fluoride andphosphate. When it is contaminated with organic substances, it is regenerated thermally at atemperature of about 750 °C. If it is contaminated with inorganic substances, it isregenerated chemically.
• Adsorber resins are applied for the targeted removal of both hydrophobic and hydrophilicorganic contaminants, e.g. to facilitate the recovery of the organic compounds. The resinstend to swell in the course of time by taking up the organic compounds.
Adsorber resins are regenerated chemically with solvents such as methanol or acetone.
• Zeolites are applied to remove ammonia or heavy metals, e.g. cadmium. When applied toammonia removal, they are only effective on very weak streams (up to 40 mg/l). They areregenerated by elution with solutions of sodium chloride with caustic soda or lime.
Application limits and restrictions:
Limits / restrictions
TSS <20 mg/l with fixed bed adsorbers 1<10 mg/l with moving bed adsorbers 2
Pollutant concentration <100 g/l (without adsorbent recovery) 2<500 g/l (with adsorbent recovery) 2
Molecular mass decreased efficiency with low molecular massLength of carbon chain decreased efficiency with increasing carbon chainBranching of carbon chain decreased efficiency with increasing branchingPolarity decreased efficiency with high polaritySolubility in water decreased efficiency with high solubilityDegree of dissociation decreased efficiency with increase of dissociationMacromolecules decreased efficiency with macromolecular structure1 [cww/tm/4]2 [cww/tm/51]

Chapter 3
Waste Water and Waste Gas Treatment 113
The influence of polarity is demonstrated in Table 3.7 [cww/tm/91]
Substance Removal[%]
Capacity[mg/g]
Benzene 95 80Ethylbenzene 84 19Butyl acetate 84 169Ethyl acetate 51 100Phenol 81 161Methyl ethyl ketone (MEK) 47 94Acetone 22 43Pyridine 47 95Diethanol amine 28 57Monoethanol amine 7 15Acetaldehyde 12 22Formaldehyde 9 18Isopropyl alcohol 22 24Methyl alcohol 4 7
Table 3.7: Typical Performance Characteristics of GAC Adsorption with Feed Concentrations ofabout 1000 mg/l
Advantages and Disadvantages
Advantages Disadvantages• High removal efficiency (not lignite coke).• Enables removal of refractory and/or toxic
organic compounds (GAC, PAC, lignite coke,resins).
• Usually low extra space requirement.• Systems automated.• Recovery of compounds possible (preferably
with zeolites).
• Mixtures of organic compounds may cause asignificantly reduced adsorption capacity.
• High content of macromolecular compoundsdecreases efficiency and may causeirreversible blockage of active sites.
• Scouring effect in the activated sludge unitcausing major erosion problem (PAC).
• Spent adsorbent has to be regenerated (highenergy consumption) or disposed of (causingwaste to be incinerated).
Achievable Emission Values / Performance Rates
The efficiency of adsorption processes varies widely with waste water composition and feedconcentration, which should be borne in mind when references to achievable emissions orremoval efficiencies are cited.
Achievable performance rates are:
Performance Rate[%]Parameter
GAC PAC Lignite Al2O3 Resin ZeoliteRemarks
Inorganic Hg 80 1 feed 29 µg/lOrganic Hg 80 1 low feed
93 1 feed 7.7 µg/lγ-Hexa-chloro-cyclo-hexane 99 1 feed 10 µg/l
PAC 85 mg/lDDT 97 1-99.9
88-93 1Aldrin 90-99 1 PAC 5-20 mg/l86-98 1
Dieldrin 99 1[0.1 µg/l]
feed 10 µg/l,PAC 126 mg/l
Atrazin 84 1 feed 0.61 µg/l

Chapter 3
114 Waste Water and Waste Gas Treatment
Performance Rate[%]Parameter
GAC PAC Lignite Al2O3 Resin ZeoliteRemarks
Endrin <0.1 µg/l 1 feed 10 µg/l,PAC 70 mg/l
Dichlorvos 99 1
TCB 70-93 1 feed 200 µg/lPAC 20 mg/l
Fenitrothion 99 1
Azinphos-methyl 99 1
Ammonia 98 1[0.5 mg/l] feed 25 mg/l
50 2 moving bed,feed 5 g/lCOD 67-75 3
[<100 mg/l]feed concentra-tion 300-400 mg/l
75 2 moving bed,feed 70 mg/lPhenols 60-80 3
[1-2 mg/l]feed concentra-tion 5 mg/l
AOX >90 2 moving bed,feed 60 mg/l
1 [cww/tm/27]2 [cww/tm/82]3 [cww/tm/96]
PAC treatment systems are reported [cww/tm/77] to treat waste water with a COD higher than60000 mg/l, including toxic volatile organic compounds higher than 1000 mg/l with a reductionof specific toxic organic chemicals to below the detection limit, i.e. about 100 % reduction.
Cross-media Effects
When the adsorptive capacity of the adsorbent has been exhausted it will be replaced andsubsequently regenerated (with the exception of PAC which is disposed of together with otherwaste water sludge). As mentioned above, the adsorbents have their own different regenerationmethods. Common to these methods is, however, that they need energy and/or chemicals fortheir operation.
GAC, lignite and activated aluminium oxide (when carrying organic load) are thermallyregenerated at temperatures up to 750–1000 °C. Resins, zeolites and activated aluminium oxidecarrying inorganic load are eluted with chemicals, either organic solvents or inorganic solutions.
For example, the regeneration process of GAC releases off-gases that contain the thermal andchemical decomposition products of the adsorbed compounds. With each regeneration aproportion of about 10 % will be lost [cww/tm/27] and has to be replaced by fresh GAC. Thiscontinuous renewal should be adequate to maintain the overall quality of the GAC in the bed.The regeneration of GAC would normally be carried out by specialist companies, which operateregeneration furnaces. These companies will transport GAC from the consuming treatment plantto the regeneration furnaces and vice versa. As regeneration is relatively expensive, plants areusually designed to give a period of at least six months between regeneration cycles.
The generation of off-gases with regeneration causes subsequent waste gas treatment, if not atthe chemical site itself, then at the site of the regenerating company.
If the GAC cannot be regenerated, it has to be disposed of as chemical waste and incinerated.This might be the case if the GAC is contaminated with PCBs, dioxins, heavy metals ordichlorobromopropane (DCBP) [cww/tm/77].
The regeneration of the zeolite adsorbent generates a concentrated stream of ammonia, which isducted to a conventional waste water treatment plant for biological treatment or, alternatively,

Chapter 3
Waste Water and Waste Gas Treatment 115
undergoes a treatment comprised of air stripping to recover ammonia, followed by adsorption indilute acid to form a fertiliser which can be sold.
Consumables are:
Consumable GAC PAC Lignite Al2O3 Resin Zeolite
Adsorbent 10 % loss perregeneration
0.5-1.0 kg/m3
waste water 1
Chemicals forregeneration
NaCl/NaOHor lime10-30 bedvolumes 2
Energy[kWh/m3]1 [cww/tm/128]2 [cww/tm/27]
Further impacts on the environment are:
• the transport of spent GAC to and from regeneration• the regeneration operation itself at the site of a specialist company• the energy consumption for the regeneration process• the release of contaminants to water and/or air during this regeneration process• sources of noise, e.g. the pumps, which can be enclosed.
Monitoring
Input and output of the adsorber device has to be monitored according to the compounds inquestion. Normally a TOC measurement (for organic contaminants) or a conductivitymeasurement for inorganic contaminants would be the method of choice for a breakthroughwarning.
Economics
Costs GAC PAC Lignite Al2O3 Resin ZeoliteGBP 30000 1
[14 m3/h]GBP 75000 1
[60 m3/h]GBP 110000 1
[120 m3/h]
Capital
FIM 20-30 million 3[350 m3/h]
GBP 1000-2000 1per tonne GAC a
BEF 200000 2per tonne GAC bOperating
FIM 0.7/m3 wastewater 3
a regeneration cost of GACb cost of GAC inclusive regeneration1 [cww/tm/92]2 [cww/tm/128]3 [cww/tm 96]

Chapter 3
116 Waste Water and Waste Gas Treatment
3.3.4.2.10 Ion Exchange
Description
Ion Exchange is the removal of undesired or hazardous ionic constituents of waste water andtheir replacement by more acceptable ions from an ion exchange resin, where they aretemporarily retained and afterwards released into a regeneration or backwashing liquid.
The equipment of an ion exchanger usually consists of:
• a vertical cylindrical pressure vessel with corrosion-resistant linings that contains the resin,usually as a packed column with several possible configurations
• a control valves and piping system, directing the flow of waste water and regenerationsolution to the proper locations
• a system to regenerate the resin, consisting of salt-dissolving and dilution controlequipment.
An inlet distribution system is located at either the top or the bottom of the vessel and provideseven distribution of the influent waste water, to prevent hollowing out flow channels in the resinbed. It also acts as collector for backwash water.
Ion exchangers commonly in use are macroporous granule resins with cationic or anionicfunctional groups, such as:
• strong acid cation exchangers (SAC), neutralising strong bases and converting neutral saltsinto their corresponding acids
• weak acid cation exchangers (WAC), able to neutralise strong bases and used fordealkalisation
• strong base anion exchangers (SBA), neutralising strong acids and converting neutral saltsinto their corresponding bases
• weak base anion exchangers (WBA), neutralising strong acids and used for partialdemineralisation.
The ion exchange operation cycle comprises:
• the actual ion exchange operation• the backwash stage, including removal of accumulated particles and reclassification of the
ion exchange resin bed• the regeneration stage, using a low volume/high concentration solution, reloading the ion
exchange resin with the respective ion, and releasing the unwanted ion species to theregeneration solution
• the displacement, or slow rinse, with a slow water-flow displacing the regeneration solutionthrough the bed
• the fast rinse, removing the remaining traces of the regeneration solution, including anyresidual hardness, from the resin bed.
Storage facilities for the regeneration chemicals are necessary.
Application
Ion exchange is applied to remove unwanted ionic and ionisable species from waste water, e.g.:
• heavy metal ions – cationic or anionic, e.g. Cr3+ or cadmium and its compounds, with lowfeed concentrations, CrO4
2- also with high feed concentrations• ionisable inorganic compounds, such as H3BO3
• soluble, ionic or ionisable organic compounds, e.g. carboxylic acids, sulphonic acids, somephenols, amines as acid salt, quaternary amines, alkylsulphates and organic mercury can beremoved.

Chapter 3
Waste Water and Waste Gas Treatment 117
Ion exchange is feasible as an end-of-pipe treatment, but its greatest value lies in its recoverypotential. It is commonly used as an integrated operation in waste water treatment, e.g. torecover rinse water and process chemicals. Typical influent concentrations are between 10 and1000 mg/l. Suspended particles in the feed should be less than 50 mg/l to prevent plugging, thusgravity or membrane filtration are appropriate pretreatments.
Application limits and restrictions:
Limits / restrictionsIon concentration high ionic strength can cause swelling of resin particlesTemperature thermal limits of anion resins generally in the vicinity
of about 60 °CCorrosive agents nitric acid, chromic acid, hydrogen peroxide, iron,
manganese, copper can damage the resinsInterfering compounds inorganic compounds such as iron precipitates, or
organic compounds such as aromatics, can causeirreversible adsorption to the resin
Advantages and Disadvantages
Advantages Disadvantages• In principle all ions and ionisable species can
be removed from aqueous liquids.• It operates on demand, relatively insensitive to
flow variations.• High efficiency possible.• Recovery of valuable species is possible.• Water recovery possible.• A large variety of specific resins are available.
• Pre-filtration is required.• Bacteria growth on the resin surface and
fouling caused by precipitation or adsorption.• Interference of competing ions in the waste
water.• Attrition of resin particles, due to regeneration
or mechanical impacts.• The brine and sludge resulting from
regeneration has to be treated or disposed of.
Achievable Emission Levels / Performance Rates
Typical effluent ion concentrations that can be achieved are in the range of 0.1–10 mg/l withinfluent concentrations of 10–1000 mg/l.
Parameter Concentration[mg/l]
Performancerate[%]
Remarks
Effluent ion 0.1–10 80–99 1 influent concentrations of10–1000 mg/l
CopperNickelCobaltZincChromium(III)Chromium(VI)IronSulphateNitrate1 [cww/tm/128]
Cross-media Effects
The regeneration of ion exchange resins results in a small volume of concentrated acid or saltsolution, containing the removed ions originating from the resin. This enriched liquid has to betreated separately to remove these ions, e.g. heavy metals by precipitation.

Chapter 3
118 Waste Water and Waste Gas Treatment
The rinsing water from regeneration contains the same ions as the brine, but in relatively lowconcentrations. Whether this part can be discharged directly or has to undergo treatmentdepends on the actual concentrations.
Consumables are:
Consumable AmountIon exchange resinRegeneration liquid (hydrochloric acid,sulphuric acid, sodium chloride, sodiumhydroxide, etc.
depends on amount of resin
Chemicals, e.g. microbiological foulingsuppressorsBackwash and rinsing waterEnergy [kWh/m3]
Sources of noise are the pumps, which can be enclosed.
Monitoring
Influent and effluent of the ion exchange vessel have to be carefully monitored for theoccurrence of breakthrough. The parameters that need to be controlled are:
• pressure drop• electrical conductivity• pH• effluent concentration of the ion(s) to be controlled.
Economics
Capital and operating costs depend on the nature of the feed stream.
Type of costs Costs RemarksGBP 60000 1
+ GBP 20000 1
packed height of 1 m and diameter of 1 m,vessel, valves and resin included;for additional 0.5 m of diameter
BEF 80000/m3 2 cationic ion exchangerCapital costs
BEF 200000/m3 2 anionic ion exchanger
Operating costs BEF 200/m3 2
1 [cww/tm/92]2 [cww/tm/128]
3.3.4.2.11 Extraction
Description
Extraction means transferring soluble contaminants from the waste water phase into a solvent.Desirable properties for suitable solvents are:
• low solubility and miscibility in water; examples are light crude oil, toluene, pentane andhexane
• greater dissolution capacity of the contaminant than water• easy separation of solvent and waste water, e.g. because of large density difference

Chapter 3
Waste Water and Waste Gas Treatment 119
• easy separation of contaminants, e.g. because of low evaporation heat when distillation isapplied
• low toxicity• thermal stability.
Extraction is operated in columns where the waste water is brought into contact with the organicsolvent in different ways, e.g.:
• counter-current cascades• mixer-settler contactors• sieve plate columns• packed columns• spray towers• rotating disc contactors• centrifugal contactors for low density differences.
Downstream facilities are operated for liquid/liquid separation and distillation of the solventfraction. The remaining waste water phase normally has to get rid of the dissolved extractionsolvent, e.g. by stripping or GAC adsorption.
Storage facilities for the extraction solvent and the residue have to be provided for, equippedwith the necessary safety items to prevent emissions to air and soil.
Application
Solvent extraction is used with a variety of organic contaminants and metal complexes, when asuitable solvent is available and if the contaminant concentration is not too low. At lowconcentrations, extraction is not compatible with adsorption or biological treatment. It is oftenused as a pretreatment to adsorption and/or biological treatment units.
Examples are [cww/tm/82]:
• removal of phenol (phenosolvan process)• recycling of metals, such as zinc• recycling of substances from mother liquors• removal of phosphoric acid esters• removal of chloro-aromatics• pretreatment concentration of aromatic sulphonic acids.
Application limits and restrictions:
Limits / restrictionsSuspended solids waste water should preferably be almost free of
suspended solids and/or emulsionsSolvent suitability of the solvent (see above);
solvent loss entails costs and environmental impact;solvent regeneration can be very complicated and cost-intensive
Advantages and Disadvantages
Advantages Disadvantages• Enables removal and recycling of refractory
and/or toxic organic compounds and somemetals.
• Residues have to be disposed of or incinerated.• Limited application because of solvent
characteristics.

Chapter 3
120 Waste Water and Waste Gas Treatment
Achievable Emission Levels / Performance Rates
ParameterPerformance
rate[%]
Emission level[mg/l] Remarks
Phenols 99 <1 feed 10 g/lCODAOXZincPhosphoric acid esters
Cross-media Effects
The loss of organic solvent during operation causes emissions of waste gas or of solvent residueto waste water. The latter usually requires additional treatment, e.g. stripping, the former aducted removal to, e.g., thermal/catalytic oxidation or adsorption.
After solvent recovery (distillation or rectification) the bottom residue that contains theextracted contaminants has to be disposed of as chemical waste, normally by incineration.
Consumables are:
Consumable AmountSolvent, replacement of lossesEnergy [kWh/m3]Energy of subsequent treatment[kWh/m3]
Monitoring
The input to the extraction unit has to be checked to prevent unwanted solids entering, whichmight cause disturbance to the process or destruction to the plant. Regular maintenance isnecessary in order to prevent or detect solvent losses to the environment.
Economics
The costs are:
Type of costs Costs RemarksCapital costsOperating costs
3.3.4.2.12 Distillation / Rectification
Description
Distillation or rectification is the separation of waste water from its contaminants bytransferring them into the vapour phase. The enriched vapour phase is condensed afterwards.
Operating the process under vacuum conditions lowers the boiling temperature and allows theseparation of vulnerable substances.
Distillation and rectification are performed in columns, equipped with plates or packingmaterial, and a downstream condenser device. The heating is often done by direct steaminjection to avoid local overheating.
Storage facilities equipped with the necessary safety items have to be provided for distillate andresidue.

Chapter 3
Waste Water and Waste Gas Treatment 121
Application
Waste water distillation or rectification has a limited application. It is often used as a process-integrated measure to recover starting material and/or product from mother liquors. As a wastewater treatment operation it is applied, e.g.:
• to recover solvent after waste water extraction• to recover solvent from waste water, e.g. separation of alcohols from methyl cellulose
production• to treat oil emulsions• as a pretreatment to remove the main contaminant content from the waste water stream to
recover it and afterwards discharge the waste water to further downstream treatment• to recover organics from scrubbing liquors.
Application limits and restrictions:
Limits / restrictionsFeed concentration needs to be large enough for distillation to become
economically feasibleBoiling temperature sufficient difference between boiling temperatures of
waste water and contaminants;azeotropic mixtures need auxiliaries, or distillativeseparation is not possible
Advantages and Disadvantages
Advantages Disadvantages• Material recovery is possible.• Enables removal of refractory and/or toxic
organic compounds.
• Residues have to be disposed of, usually byincineration.
• High energy consumption.
Achievable Emission Levels / Performance Rates
Parameter Performance rate[%]
Emission level[mg/l] Remarks
Phenols 96 1 2000 feed 50 g/lMethanol 97.5 1 2000 feed 80 g/lEpichlorohydrine (ECH) 90 1 700 feed 7 g/lAniline 97.5 1 100 feed 4 g/lChlorobenzene 90 1 10 feed 100 mg/l1 [cww/tm/82]
Cross-media Effects
Consumables are:
Consumable AmountSteam (for heating)Energy [kWh/m3]Energy of subsequent treatment[kWh/m3]
Monitoring
The input to the distillation/rectification unit has to be checked to prevent the entrance ofunwanted solids that might cause disturbance to the process or damage to the plant. Regularmaintenance is necessary so that solvent losses to the environment do not occur or can bedetected in time.

Chapter 3
122 Waste Water and Waste Gas Treatment
Economics
The costs are:
Type of costs Costs RemarksCapital costsOperating costs
3.3.4.2.13 Evaporation
Description
Evaporation of waste water is a distillation process where water is the volatile substance,leaving the concentrate as bottom residue to be disposed of. The aim of this operation is toreduce the volume of waste water or to concentrate mother liquors. The volatile steam iscollected in a condenser and the condensed water is, if needed after subsequent treatment,recycled.
Operating under vacuum decreases the boiling temperature and enables recycling of substancesthat would otherwise decompose.
There are many types of evaporators. Their suitability depends on the individual requirements.Examples of evaporators are:
• natural-circulation evaporators, suitable for material not sensitive to heat• short-tube vertical evaporators, suitable for non-corrosive or non-crystallising liquors• basket-type evaporators, same application as short-tube evaporators• falling film evaporators, used in fertiliser industry to concentrate urea, phosphoric acid,
ammonium nitrate etc.• agitated thin film evaporators, used for concentrating, fractionating, deodorizing and
stripping in the production of pharmaceuticals, polymers, organic and inorganic chemicals.
Evaporators are usually operated in series, where the condensation heat of one stage heats thecondensate (i.e. waste water) of the preceding stage. Operation under vacuum minimises energydemand. Normal operation conditions are 12–20 kPa and 50–60 °C.
Storage facilities have to be provided for residues before their disposal (or recycling).
Application
Evaporation is applied when concentrated waste water streams are wanted or recommended,e.g.:
• to concentrate mother liquors and liquors from waste gas scrubbing to recycle valuablesubstances
• to evaporate and crystallise solids, either to recover or remove them from the waste watereffluent
• as pretreatment in order to concentrate the waste stream before thermal exploitation, wastewater incineration or disposal as hazardous waste.
Evaporation units should be operated in such a way that the necessary thermal energy isdelivered by exploiting the waste heat of production processes [cww/tm/82].
When material recovery is the main purpose, a pretreatment operation is required beforeevaporation can be started. Examples of pretreatment are:
Chapter 3
Waste Water and Waste Gas Treatment 123
• addition of acids, bases etc. to lower the volatility of molecular compounds• separation of insoluble, free liquid phases, e.g. oil• chemical/physical operations to separate heavy metals and/or other solids.
Further treatment, e.g. incineration, after evaporation is required, if the concentrate is notrecycled.
Application limits and restrictions:
Limits / restrictionsFouling heat exchangers tend to foulingCorrosion the evaporator body and the heat exchanger(s) are
vulnerable to corrosive substancesSubstances foam generating substances and colloidal and
suspended particles disturb the process;volatile inorganic / organic substances evaporate aswell
Advantages and Disadvantages
Advantages Disadvantages• Material recovery possible.• Enables removal of refractory and/or toxic
organic compounds from waste water.• Reduces waste water amount.• Reduces amount and volume of hazardous
waste.
• Residues have to be disposed of, normally byincineration, if not suitable for recycling.
• Volatile contaminants pollute the condensate(entailing subsequent treatment) or are emittedas waste gas.
• Vulnerable to fouling, corrosion and foaming.• High energy consumption.
Achievable Emission Levels / Performance Rates
Parameter Performance rate[%] Remarks
Contaminants 99 1 condensate not recycled1 [cww/tm/128]
Cross-media Effects
Evaporation is normally a ‘waste water-free’ process, because the condensate will be recycled –with or without further treatment – and the concentrate will be recycled or disposed of as waste,e.g. by incineration.
Consumables are:
Consumable AmountChemicals for pretreatmentSteam (for heating) 5–16 kg water/kg steamEnergy [kWh/m3]
Monitoring
Proper maintenance of the heat exchangers is a crucial point. Encrustations, fouling andcorrosion disturb the heat transfer to the liquid and decrease the energy efficiency. Theconcentration of contaminants, or surrogate parameters (TOC, pH, conductivity etc.) in thecondensate need continuous monitoring to prevent the transfer of pollutants.

Chapter 3
124 Waste Water and Waste Gas Treatment
Economics
The costs are:
Type of costs Costs RemarksCapital costs
Operating costs BEF 100-2000 per m3
condensate 11 [cww/tm/128]
3.3.4.2.14 Stripping
Description
Waste water stripping is an operation in which waste water is brought into contact with a highflow of a gas current in order to transfer volatile pollutants from the water phase to the gasphase. The pollutants are removed from the stripping gas so it can be recycled into the processand re-used. Volatile organics and inorganics are transferred from waste water to waste gas,greatly increasing the surface area of the contaminated water exposed. Water evaporation,however, decreases the temperature of the waste water, thus decreasing the volatility of thecontaminants.
The gases in use are air and steam:
• air stripping can be operated with or without heating the stripping column, the latter usedwith highly volatile or vulnerable compounds. The necessary heating energy is usuallysupplied by exploiting process heat.
• steam stripping as an alternative to air stripping is applied to compounds that are lessvolatile and/or less vulnerable. Steam is normally delivered by the steam generationequipment already existing on the site or by exploited waste heat. If there is no existingsteam generation equipment, steam stripping might not be economically feasible.
The most common stripping facilities are:
• packed tower stripper, with spray nozzles at the top to distribute waste water over thepacking, the stripping gas led counter-current through the packing, a sump at the bottom tocollect the decontaminated water, additionally equipped with an air heater (for airstripping), automated control system and air emission control system (GAC unit, catalyticoxidiser or incinerator)
• stripping tank, in which volatile compounds are stripped by bubbling gas (air, steam) into awaste water ducting tank.
The equipment consists of:
• a buffer tank for waste water• a pretreatment tank for pH adjustment• stripping column(s), operated counter-flow• feed preheater, recovering heat from the subsequent strip steam condenser• condenser, air or water cooled• downstream facilities for gas treatment.
Strippers can be operated continuously or batchwise, the latter ensuring consistent performanceand higher energy efficiency than continuously operated units.
The subsequent removal of the volatile pollutants from the gas phase can be accomplished by:

Chapter 3
Waste Water and Waste Gas Treatment 125
• adsorption on GAC, zeolite or synthetic resins• absorption by non-aqueous solvent and subsequent desorption• absorption by aqueous solutions, such as strong acids (to absorb ammonia)• condensation or partial condensation and subsequent further treatment• thermal or catalytic oxidation.
An example of a stripping process, the air / steam stripping of ammonia, is illustrated in Figure3.26 [cww/tm/78].
Figure 3.26: Stripping of Ammonia, Air and Steam Stripping
Application
Stripping is applied to separate volatile contaminants from water, e.g.:
• chlorinated hydrocarbons, such as trichloroethene, perchloroethene, trichloromethane,dichloroethane, trichloroethane
• ammonia and hydrogen sulphide, their volatility strongly dependent on temperature and pH,thus pH control is essential (pH >9.5 with ammonia, pH 2-3 with hydrogen sulphide)
• ammonia and hydrogen sulphide together in a two-stage steam stripping unit [cww/tm/149]• organic solvents, petrol, diesel fuel, low aromatics, phenol, mercaptanes.
Whether air stripping or steam stripping is applied depends on:
• the vulnerability of the contaminants• whether the contaminants are to be recovered• the availability of steam• safety conditions (only an issue for high loads of VOCs), etc.
Application limits and restrictions:
Limits / restrictionsFouling heat exchangers tend to foulingSuspended solids <5 ppm

Chapter 3
126 Waste Water and Waste Gas Treatment
Advantages and Disadvantages
Advantages Disadvantages• High removal efficiency.• Material recovery is possible.• Low pressure drop.• Low energy consumption.
• Under certain conditions (iron >5 mg/l, waterhardness >800 mg/l) high capacity for fouling(e.g. sour water strippers in refineries) andtherefore injection of anti-fouling agentsnecessary.
• Stripping gas has to be treated.• Frequent column cleaning required.
Achievable Emission Levels / Performance Rates
Performance rate[%]
Emission level[mg/l]Parameter
Air Steam Air SteamRemarks
<5 1refinery: low feed concentrationsand optimum conditions(examples: sour water stripping)
99 2 <50 2 feed 10 g/lAmmonia
>92 4 70 4filtrate from treatment of activatedsludge, feed 500-1200 mg/l, feedrate 19-24 m3/h
NH4-N 5 3 refinery: 2-stage process, feed1372 mg/l NH4-N a
Total inorganic N 7 3 refinery: 2-stage process, feed1373 mg/l total inorg. N
Volatile organics 99 1feed rate 1 m3/h, concentration2 g/l (dichloromethane, trichloro-methane, benzene, toluene,xylene, esters, ethers
Methanol 97 feed rate 3.4 m3/h, concentration36 g/l
Chloromethane <1 1 feed rate 6 m3/h, concentration>200 mg/l
Dichloromethane 99 1 feed rate 4 m3/h, concentration5 g/l
Tetrachloromethane 90-98 2 packed tower, air/water 5-35:11,2-Dichloroethane 65 2 packed tower, air/water 35:1
69-92 2 packed tower, air/water 4-30:1Trichloroethene 90 2 spray aeration95 2 packed tower, air/water 5:1Perchloroethene 90 2 spray aeration
Methylal 99 1 feed rate 4 m3/h, concentration30 g/l
Hydrocarbons 1.1 3 refinery: 2-stage process, feed98 mg/l hydrocarbons
BTX >99 1 feed 400 m3/h, concentration500-1000 mg/l BTX
Hydrogen sulphide <20 refinery: sour gas strippingMercaptans <20 refinery: sour gas stripping
99-99.6 5 50-200 5 feed 7-8 m3/h, concentration20-40 g/lPhenols
0.1 3 refinery: 2-stage process, feed182 mg/l phenols
Sulphide 0.5 3 refinery: 2-stage process, feed1323 mg/l sulphide
COD 37 3 refinery: 2-stage process, feed14400 mg/l COD
a stripped ammonia concentrated to 10 % solution and used for de-NOx process in another plant1 [cww/tm/82]2 [cww/tm/27]3 [cww/tm/149]4 [cww/tm/146]5 [cww/tm/96]

Chapter 3
Waste Water and Waste Gas Treatment 127
Cross-media Effects
Stripping is not used as an individual process. It needs at least downstream gas treatment. Theremoved volatiles are either recycled to a production process or treated (scrubbing, adsorption,thermal or catalytic oxidation). Generally speaking, the treatment of the stripping gas is anessential process step and sometimes more complicated than the stripping operation itself. Toobtain an efficient treatment in total, both the stripping stage and the stripping gas treatmenthave to be carefully adjusted to each other.
If the achieved emission level for waste water is not sufficient (see the achievable emissionlevels), further treatment downstream needs to be available.
Consumables are:
AmountConsumable Air stripping Steam strippingChemicals to adjust pH(acid, caustic soda, lime) stoichiometric stoichiometric
Anti-fouling agentsSteam 0.1-0.3 tonne/m3 1,2,
Energy [kWh/m3] 680 3 b
electrical 1.8 4 a
gas (heating)[m3 gas/m3 water] 0.5 4
a engine driven equipment such as pumps and ventsb including steam generation1 [cww/tm/27]2 [cww/tm/82]3 [cww/tm/96]4 [cww/tm/146]
Monitoring
The parameters to control are:
• pH, in particular if ammonia or hydrogen sulphide is involved• feed• pressure• temperature• liquid level control• column reflux ratio.
Economics
CostsType of costs Air Steam Remarks
BEF 4 million 1 100 m3/hBEF 80 million 1 50 m3/h
EUR 4.0–5.3 million2 refinery sour waterstripper, 30-32 m3/h
Capital cost
GBP 200–300 thousand 3 50 m3/hOperating cost BEF 200/m3 1 BEF 200/m3 11 [cww/tm/128]2 [cww/tm/48]3 [cww/tm/92]
Chapter 3
128 Waste Water and Waste Gas Treatment
3.3.4.2.15 Waste Water Incineration
Description
Waste water incineration is the oxidation with air of organic and inorganic waste watercontaminants and the simultaneous evaporation of the aqueous part at normal pressure and atemperature range between 730 and 1200 ºC, or below that range when catalysts are used. In thechemical industry, waste water incineration is often operated centrally or, as co-incineration, inwaste combustion plants. Reaction products are carbon dioxide, water and other inorganiccompounds (nitrogen oxides, sulphur oxides, hydrogen halides, phosphates, heavy metalcompounds), depending on the contaminants present.
Waste water incineration is only self-sustaining if the organic load is sufficient to ensureadequate energy support for vaporisation and heating of the water (COD >50 g/l). With a loworganic load the incineration plant needs to be operated with supporting fuel. The amount ofadditional energy is reduced by lowering the water content, e.g. by upstream evaporation (seeSection 3.3.4.2.13), making use of waste heat. The installation of a boiler may be a convenientway of generating steam from the heat of combustion, which might be used for evaporation[cww/tm/132].
Devices for waste water incineration can be constructed as ordinary combustion chambers orfluidised-bed incinerators. There is a high demand on the stability and corrosion resistance ofthe plant material. Combustion chambers are often built in ceramics.
Waste water incineration can also be operated in an ordinary waste combustion plant, withwaste water as an additional input. Pretreatment might be necessary to eliminate particulatesexceeding a maximum size to prevent jet blockage.
Application
Incineration is applied to waste water containing compounds that are either not readilybiodegradable or might disturb the biological process in a downstream biological WWTP, orthat have properties too harmful to be released into an ordinary sewer system. Such contents aree.g.:
• aqueous residues from dye production• aqueous residues from rubber production, containing extremely large loads of salt• aqueous extracts from pesticide productions• aqueous residues from polyester production.
Waste water incineration is preferred to other treatment techniques that serve the same purposewhen these fail or prove to be uneconomic. It is particularly suitable, when [cww/tm/132]:
• the organic constituents cannot be re-used or when recycling them is unprofitable• the contaminants constitute a multi-component mixture in which both the concentration and
the mixing ratio vary continuously• apart from the organic content, there is a considerable amount of inorganic material• waste water is poorly biodegradable or toxic• the salt content is too high for biological treatment, or only after considerable dilution• incineration allows the recycling of indestructible feed material, e.g. salts, or produces
valuable products.
Waste water streams suitable to be incinerated generally cover a range between 2 and 30 m3/hwith COD concentrations between 50000 and 100000 mg/l. Lower concentrations requiresupporting fuel.
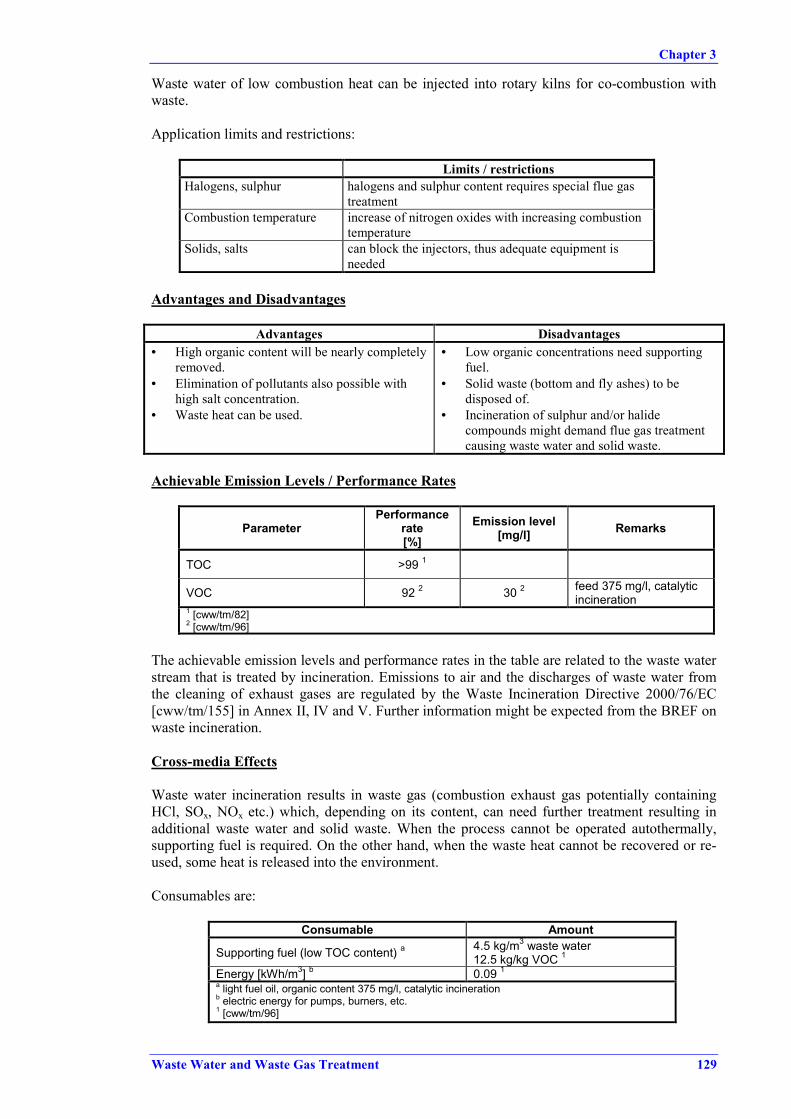
Chapter 3
Waste Water and Waste Gas Treatment 129
Waste water of low combustion heat can be injected into rotary kilns for co-combustion withwaste.
Application limits and restrictions:
Limits / restrictionsHalogens, sulphur halogens and sulphur content requires special flue gas
treatmentCombustion temperature increase of nitrogen oxides with increasing combustion
temperatureSolids, salts can block the injectors, thus adequate equipment is
needed
Advantages and Disadvantages
Advantages Disadvantages• High organic content will be nearly completely
removed.• Elimination of pollutants also possible with
high salt concentration.• Waste heat can be used.
• Low organic concentrations need supportingfuel.
• Solid waste (bottom and fly ashes) to bedisposed of.
• Incineration of sulphur and/or halidecompounds might demand flue gas treatmentcausing waste water and solid waste.
Achievable Emission Levels / Performance Rates
ParameterPerformance
rate[%]
Emission level[mg/l] Remarks
TOC >99 1
VOC 92 2 30 2 feed 375 mg/l, catalyticincineration
1 [cww/tm/82]2 [cww/tm/96]
The achievable emission levels and performance rates in the table are related to the waste waterstream that is treated by incineration. Emissions to air and the discharges of waste water fromthe cleaning of exhaust gases are regulated by the Waste Incineration Directive 2000/76/EC[cww/tm/155] in Annex II, IV and V. Further information might be expected from the BREF onwaste incineration.
Cross-media Effects
Waste water incineration results in waste gas (combustion exhaust gas potentially containingHCl, SOx, NOx etc.) which, depending on its content, can need further treatment resulting inadditional waste water and solid waste. When the process cannot be operated autothermally,supporting fuel is required. On the other hand, when the waste heat cannot be recovered or re-used, some heat is released into the environment.
Consumables are:
Consumable Amount
Supporting fuel (low TOC content) a 4.5 kg/m3 waste water12.5 kg/kg VOC 1
Energy [kWh/m3] b 0.09 1a light fuel oil, organic content 375 mg/l, catalytic incinerationb electric energy for pumps, burners, etc.1 [cww/tm/96]

Chapter 3
130 Waste Water and Waste Gas Treatment
Monitoring
Throughout the process, thorough monitoring is needed of operating parameters, such as oxygencontent, temperature, content of sulphur oxides, nitrogen oxides, hydrogen halides, dust toensure faultless working.
Economics
Type of costs Costs Remarks
Capital costs
Operating costs FIM 2.4/m3
FIM 6.6/kg VOC 18 m3/h, VOC concentration 375 mg/l,catalytic incineration
1 [cww/tm/96]
3.3.4.3 Soluble Biodegradable Contaminants / Biological Treatment
The main production line in the chemical industry is the production and handling of organicsubstances. Thus the major part of chemical industry waste water is loaded with organiccontaminants which are more or less biodegradable and suitable for biological treatmenttechniques. Substances that can disturb biological degradation need to be removed earlier (seeSection 3.3.4.2).
Biological treatment is the degradation of dissolved organic substances with micro-organisms –bacteria – as oxidation agents. Organic nitrogen and phosphorous transform into ammoniumand phosphate respectively. The biodegradability of a waste water stream can, by rule of thumb,be estimated by its BOD/COD ratio (before treatment):
• BOD/COD <0.2 relatively undegradable waste water• BOD/COD 0.2–0.4 well-to-moderately degradable• BOD/COD >0.4 well degradable
There are three types of metabolic processes:
• aerobic processes, using dissolved oxygen• anoxic processes, using the biological reduction of oxygen donors• anaerobic processes without oxygen supply.
The main properties of these three metabolic processes in connection with waste watertreatment are listed in Table 3.8 [cww/tm/132].
Parameter Anaerobic Anoxic AerobicDissolved oxygen (DO) [mg/l] 0 0 >0Energy consumption low low highSludge production low high highSensitivity to toxic substances high low low
COD removal efficiency <85 % a varying, depending ondenitrification >85 %
Nitrogen removal efficiency 0 45-90 % (nitrificationrequired as first stage) 0
Suitability as pretreatment yes yes yesSuitability for last stage treatment no no yesa normal value, can be higher for special applications (see Section 3.3.4.3.1, Achievable emission levels /performance rates)
Table 3.8: Specific Process Parameters normally associated with Anaerobic, Anoxic and AerobicBiology

Chapter 3
Waste Water and Waste Gas Treatment 131
A comparison of carbon balance of aerobic and anaerobic processes is illustrated in Figure 3.27[cww/tm/132].
Figure 3.27: Carbon Balances in the Aerobic (A) and Anaerobic (B) Microbiological Degradation ofOrganic Compounds
One advantage of biological waste water treatment – independent of the kind of metabolicprocess – is the more or less rapid adaptability of microorganisms to a wide variety of nutrientmedia.
Biological treatment techniques common in the chemical industry are dealt with in thefollowing sections.
3.3.4.3.1 Anaerobic Treatment
Description
Anaerobic waste water treatment converts the organic content of waste water, with the help ofmicroorganisms and without entry of air, to a variety of products such as methane, carbondioxide, sulphide etc. The biogas consists of about 70 % methane, 30 % carbon dioxide andother gases such as hydrogen and hydrogen sulphide [cww/tm/128]. The process is carried outin an airtight stirred tank reactor, the microorganisms retained in the tank as biomass (sludge).
There are several reactor types available. The most commonly used are:
• anaerobic contact reactor (ACR)• upflow anaerobic sludge blanket (UASB)• fixed-bed reactor• expanded-bed reactor.

Chapter 3
132 Waste Water and Waste Gas Treatment
In the anaerobic contact process (ACP) waste water is mixed with recycled sludge anddigested in a sealed reactor, the waste water / sludge mixture externally separated(sedimentation, Section 3.3.4.1.2, or vacuum flotation 3.3.4.1.3) and the supernatant dischargedfor further downstream treatment. The anaerobic sludge is recycled to the reactor. [cww/tm/4].A schematic overview is given in Figure 3.28.
feed
gas
Sludgesettling
Figure 3.28: Anaerobic Contact Process
In the UASB process, waste water is introduced at the bottom of the reactor, from where itflows upward through a sludge blanket composed of biologically formed granules or particles.The produced gases cause mixing of the bulk waste water. The waste water phase passes into asettling chamber where the solid content is separated; the gases are collected in domes in the topof the reactor [cww/tm/4]. The principle is illustrated in Figure 3.29 [cww/tm/132].
Figure 3.29: Schematic Representation of the UASB Processa) sludge – liquid inletb) gas screensc) settled sludge return opening
In the fixed-bed or anaerobic filter process, waste water flows upward or downward(depending on the solids content of the influent) through a column with various types of solidmedia on which anaerobic micro-organisms grow and are retained. [cww/tm/4].

Chapter 3
Waste Water and Waste Gas Treatment 133
In the expanded-bed process, waste water is pumped upward through a bed of an appropriatemedium (sand, coal, polythene, etc.) on which a biological growth has been developed in abiofilm. The effluent is recycled to dilute the incoming waste water and to provide an adequateflow to maintain the bed in the expanded condition [cww/tm/4].
Excess biomass is worn off from the surface and treated after the bioreactor. There is no sludgerecirculation needed, the biofilm carrier ensuring a high biomass concentration inside thereactor. The advantage of this version of anaerobic treatment is the reduced space requirementwith the same performance. The system is more resistant to temporary load peaks, whichotherwise might cause toxic discharges.
To increase the efficiency of anaerobic treatment, a two-stage variant is introduced as shown inFigure 3.30.
Fatty acidsSugarAmino acids
AlcoholsLactic acid
Small fatty acids Outlet
CH4, CO2
Acidogenicbacteria
Acetogenic, methanogenicbacteria
pH 4 - 7 pH 6.5 - 7
Figure 3.30: Schematic Presentation of a Two-Stage Anaerobic Treatment Process
Application
Anaerobic waste water treatment is essentially used only as pretreatment for waste water, whichis characterised by a high organic load (>2 g/l) and a more or less constant quality[cww/tm/132]. It is applicable mostly in sectors with consistent effluents of high BOD loads.
The anaerobic treatment of industrial waste water has become increasingly important in recentyears as a result of rising energy costs and problems with the disposal of excess sludge formedin aerobic treatment processes. Efforts are now being made to remove organic contaminants asfar as possible without external sources of energy, taking advantage of the biogas produced,where the desired level of purity is ultimately achieved with the aid of a subsequent aerobicbiological clarification step [cww/tm/132].
Application limits and restrictions are:
Limits / restrictionsTemperature 20–40 °CpH 6.5–7.5, pH >8 stops methane-forming
processToxic substances prevention of toxic substances, because
process is sensitive

Chapter 3
134 Waste Water and Waste Gas Treatment
Advantages and Disadvantages
Advantages Disadvantages• Low energy consumption, compared to aerobic
process.• Production of an energy-rich gas, probably
amenable to further use as a low-quality fuelreserved for local use.
• Comparatively (to aerobic process) lowamount of clarification sludge (one tenth of theaerobic process) (see Figure 3.27).
• In the presence of sulphate or organic sulphurcompounds, heavy metal compounds areconverted to sulphides and precipitated.
• No aerosol formation and stripping of volatilesubstances (compared to aerobic process).
• High sensitivity to toxic substances, whichmight lead to an increased discharge ofactivated sludge, when toxic substances enter.
• Production of toxic, flammable and odorousoff-gases possible.
• Very slow start-up.• Performance rate not sufficient for final
treatment stage (COD removal normally<85 %), thus requiring further treatment.
Achievable Emission Levels / Performance Rates
Process Input COD[g/l]
Detention time[h]
Organic loading[kg/(m3 d)]
COD removal[%]
ACP 1 1.5–5 2–10 0.48–2.40 75–90UASB 1 5–15 4–12 4.00–12.0 75–85Fixed-bed 1 10–20 24–48 0.96–4.81 75–85Expanded-bed 1 5-10 5-10 4.81–9.62 80–851 [cww/tm/4]
The performance rate of COD removal is highly dependent on the biodegradability of theorganic substances responsible for the COD content. Thus the main requirement for anaerobictreatment – and for all biological treatment – is to avoid the introduction of undegradable wastewater streams as far as possible.
In combination with downstream aerobic treatment the total performance rates are:
Parameter Performance rate[%]
BOD 99–99.8COD 95–97
Cross-media Effects
Normally anaerobic processes are run as biological high load stages that need an additionaldownstream biological (aerobic) treatment. The advantage of anaerobic pretreatment is the lowamount of excess activated sludge produced during the process, about 10 % in comparison tothe aerobic activated sludge process. In this way the main part of degradable organic load(75-85 %) is removed with one tenth of the normal (i.e. aerobic) formation of excess sludge, i.e.compared with aerobic techniques only 10 % of waste needs to be disposed of.
The anaerobic degradation process results in a mixture of methane and carbon dioxide in a ratioof 1-3 : 1, thus producing a combustible gas of high energy content which is normally used forfuel replacement or other energy supply facilities. Compared with aerobic processes the energyconsumption is considerably less, because there is no energy need for air or oxygen supply tothe reactor, but only for efficient stirring. Overall, it contributes to the reduction of carbondioxide.
The arising of combustible gases and the formation of metabolites such as low chain carboxylicacids make the use of closed equipment unavoidable to prevent the efflux of odour. Odourabatement is an essential downstream treatment necessity.

Chapter 3
Waste Water and Waste Gas Treatment 135
Consumables are:
Consumable AmountAuxiliaries (for sedimentation, flotation, etc.)Energy [kWh/m3]
Monitoring
Monitoring of a biological waste water treatment plant is illustrated in Annex 7.3.
Economics
Type of costs Costs Remarks
BEF 120 million 1 UASB reactor, 25 m3/h, rawCOD 30 g/lCapital costs
NLG 3.5 million 2 206 m3/d, raw COD load7300 kg/d or 35 g/l
BEF 40/m3 1 UASB reactor, 25 m3/h, rawCOD 30 g/lOperating costs NLG 0.3/m3 2
[NLG 20000/yr]206 m3/d, raw COD load7300 kg/d or 35 g/l
NLG 210000/yr 2 206 m3/d, raw COD load7300 kg/d or 35 g/lBenefit (biogas)
NLG 1.5 million/yr 2 compared to incineration ofexcess sludge
1 [cww/tm/128]2 [cww/tm/100]
The effective reduction of organic contaminants goes together with the production of biogas –usable as fuel – and a considerable reduction of excess activated sludge. Provided that thebiogas can be used, ecology and economics become mutually interdependent, i.e. a win-winsituation over a longer period of time, when anaerobic treatment / final low-load aerobictreatment is compared with high-load final aerobic treatment and its associated costs (sludgeincineration or landfilling).
3.3.4.3.2 Biological Removal of Sulphur Compounds / Heavy Metals
Description
Biological removal of heavy metals and sulphur compounds is a special application ofanaerobic treatment. It is a three-step process that consists of:
• the biological reaction of sulphate or other oxidised sulphur compounds to sulphide bymeans of sulphate-reducing bacteria
• the subsequent reaction of heavy metal ions with sulphide and the precipitation of the heavymetal sulphides
• a second biological reaction to remove excess sulphide and convert it to sulphur.
The process takes advantage of the much lower solubility of metal sulphides compared to theirhydroxides.
An example of a treatment installation is given in Figure 3.31.

Chapter 3
136 Waste Water and Waste Gas Treatment
UASBreactor
FFRTPS
Influent
Bio-gashandling Ventilation
air handlingSF
Air
Zinc sulphide Sulphur
Solids tozinc plant
EffluentEthanol
+Nutrients
UASB: Up-flow Anaerobic Sludge BlanketFFR: Fixed-Film ReactorTPS: Tilted-Plate SettlerSF: Sand Filter
Flocculant
Figure 3.31: Process Diagram of Biological Metal and Sulphate Reducing Plant
The main components are:
• the UASB reactor, where the biological reduction of sulphate into sulphide takes place• the bio-gas handling system to use or control the waste gas originating from the UASB• the fixed-film reactor, where sulphide is aerobically converted into sulphur, the bacteria
attached to a carrier material• the tilted-plate settler to separate the sulphur• the final polishing facility, e.g. a continuously cleaned sand filter.
The biological process needs electron donors, which are normally provided by the COD contentin the waste water. If the COD content is not sufficient, electron donors have to be added.Possible electron donors are, e.g.:
• hydrogen• starch• ethanol• formic acid• acetate esters or salts• propionate esters or salts• lactate.
Besides these chemical substances, residues can be used as electron donors, such as:
• wood dust• molasses.

Chapter 3
Waste Water and Waste Gas Treatment 137
If the influent requires neutralisation, a part of the waste water behind the tilted-plate settler orthe sand filter can be recirculated, since the conversion of sulphide into sulphur increases thealkalinity.
The handling of bio-gas from the UASB reactor and of ventilation air from the fixed-filmreactor enable odourless operation.
Application
This biological treatment operation is applicable to all waste water streams that contain aconsiderable amount of sulphate. While the removal of sulphate is possible without the presenceof heavy metal compounds, the abatement of heavy metals needs enough sulphate to deliver thenecessary amount of sulphide for the precipitation reaction. The presence of sufficient CODcontent favours the performance. A possible application is, for example, waste water fromviscose fibre production, where zinc, sulphate and sulphide are the main pollutants.
Application limits and restrictions are:
Limits / restrictionsResidence time 6 h for UASB reactor 1
COD/sulphate rate 1 : 1, if COD content is too low, electrondonor needs to be added
Flocculant dosage in thetilted-plate settler (removalof sulphur)
flocculant dosage needs to be optimallyadjusted to the settler to achieve stableoperation
1 [cww/tm/101]
Advantages and Disadvantages
Advantages Disadvantages• Treatment of sulphate without addition of
precipitant chemicals.• Simultaneous removal of heavy metals and
sulphate possible.• Heavy metals are separated from waste water
as sulphides that may be re-used.• Metal sulphides have lower solubility than the
respective hydroxides, so higher demands oneffluent can be met.
• At the end of the chain is sulphur that can beused as starting material in productions (e.g.production of sulphuric acid) or for recovery.
• COD and nitrate can also be removed.• Stable process, so fluctuations and
disturbances in the waste water stream hardlyinfluence the efficiency.
• Often additional COD content is necessary aselectron donor, which enlarges the operationalcosts.
• Metal sulphides mix with the biological sludgein the UASB reactor.
• Removal of heavy metals without sulphate isnot possible.
Achievable Emission Levels / Performance Rates
ParameterPerformance
rate[%]
Emission level[mg/l] Remarks
Zinc 99.8 1 0.05-0.15 influent 100 mg/lCadmium >99 1 <0.01 influent 1 mg/lSulphate 94 2 75 influent 1170 mg/l, presence of heavy metals1 [cww/tm/102]2 [cww/tm/101]

Chapter 3
138 Waste Water and Waste Gas Treatment
Cross-media Effects
Residues of the treatment process are:
• heavy metal sulphides, if heavy metals are present in the waste water stream, mixed withexcess sludge from the UASB reactor
• sulphur, probably mixed with solid matter, from the tilted-plate settler.
The sulphides can, depending on the type of metal, be re-used to recover the metal. The sulphurfraction, when recovered separately, is produced as a sulphur cake, consisting of 60 % drysolids with a purity up to 95 %. It can be used for the production of sulphuric acid at sulphuricacid plants with the facilities for burning ‘waste-acid’ or slurries.
Because of the bio-gas and ventilation air handling, which is necessary for safety reasons, theprocess operates without odour emissions. As far as noise generation is concerned, the regularsources are pumps and vents that are enclosed.
Consumables are:
Consumable AmountNeutralising agentsElectron donorFlocculantEnergy [kWh/m3]
Monitoring
The right alkalinity and optimum COD/sulphate ratio (minimum 1 : 1) influence the efficiencyof the treatment process, so monitoring the influent waste water stream for pH and COD contentis an important issue. It is also essential that the influent be free of substances that can destroythe sulphur-active bacteria or inhibit their growth. So the influent has to be protected from suchsubstances. The effluent is monitored for the pollutants treated, such as heavy metals, sulphate,COD, etc.
Economics
Type of costs Costs RemarksCapital costsOperating costs
3.3.4.3.3 Aerobic Treatment
Description
Aerobic treatment is the biological oxidation of dissolved organic substances with oxygen usingthe metabolism of microorganisms. In the presence of dissolved oxygen – injected as air or pureoxygen – the organic components are converted (mineralised) into carbon dioxide, water orother metabolites and biomass, the activated sludge.
Toxic waste water content can inhibit the biological process. Some of these toxic substances areshown in Table 3.9 [cww/tm/132].

Chapter 3
Waste Water and Waste Gas Treatment 139
Substance Inhibiting concentration[mg/l]
Cadmium (Cd2+ ) 2–5Bichromate (CrO4
2-) 3–10Copper (Cu2+) 1–5Nickel (Ni2+) 2–10Zinc (Zn2+) 5–20Chlorine (Cl2) 0.2–1Cyanide (CN-) 0.3–2Mineral oils >25Phenols 200–1000Hydrogen sulphide / sulphide 5–30
Table 3.9: Threshold Concentration of Representative Substances Toxic to Activated Sludge
The potential toxicity of a substance within a biological WWTP is not a predetermined constantbut a function of the exposure conditions and the organisms present. The term toxicity refers toan interaction between substance and organism. With continuous feeding of low concentrationsof toxic substances, the inhibitory effect soon diminishes due to adaptation, leading to thegrowth of micro-organisms displaying increased resistance and a higher degradation potential[cww/tm/132].
Common aerobic biological treatment techniques are:
• complete-mix activated sludge process• membrane bioreactor process• trickling or percolating filter process• the expanded-bed process• biofilter fixed-bed process.
Today the complete-mix activated sludge process is a method often used within the chemicalindustry and as such the most common treatment technique for biodegradable waste water. Themicro-organisms are maintained as suspension in the waste water and the whole mixture ismechanically aerated. The activated sludge mixture is ducted to a separation facility from whichthe sludge is recycled to the aeration tank. The separation facility can be:
• sedimentation or settling tank• air flotation facility• MF or UF membrane (membrane bioreactor, see paragraph below).
The complete-mix process is operated with several variants, depending on the amount of wastewater, the availability of space, the air emissions requirements etc. Examples of variants are:
• the oxidant agent: air or pure oxygen, the latter having the advantage of less strippingeffects and less odorous release, because less gas is blown through the waste water, and offaster and more effective biological reaction
• the aeration chamber: a more or less flat tank biology or a tower biology, the latter takinginto account the higher degradation efficiency because of smaller air bubbles ascending in ahigh column of waste water and thus considerably increasing the air / waste water masstransfer, see Figure 3.32 [cww/tm/132]
• the clarification step: sedimentation or membrane filtration (membrane bioreactor, seebelow), the latter with less space requirement, the former probably supported by a finalflotation stage

Chapter 3
140 Waste Water and Waste Gas Treatment
Figure 3.32: Example of Tower Biology
The membrane bioreactor process, as a combination of biological activated sludge treatmentand membrane separation, is a biological treatment process used for urban and industrial wastewater. The different variations of this process are:
• external recirculation loop between activated sludge tank and membrane module• immersion of the membrane module in the aerated activated sludge tank, where the effluent
is filtered through the hollow fibre membrane, the biomass remaining in the tank; thisvariant is less energy consuming and resulting in more compact plants.
These variants together with the conventional activated sludge process are shown in Figure3.33.
Fouling, as a major problem for membranes, is diminished by:
• aeration• backwashing of the membrane,
with the specific conditions being adapted for each treatment facility.
As a physical barrier, membranes allow the biomass in the tank to be maintained, resulting in:
• high sludge concentrations (TSS 10-20 g/l)• high sludge age (or mean cell residence time, MCRT).
A membrane bioreactor is a compact facility (up to 5 times more compact than a conventionalactivated sludge plant, the membrane module replacing the clarification tank) that producessignificantly less excess sludge. On the other hand, however, may the energy consumption,because of pumping, be significantly higher than with a conventional activated sludge process.
In the trickling or percolating filter process the microorganisms are attached to a highlypermeable medium through which the waste water is trickled – or percolated. The filter mediumnormally consists of rock or various types of plastic. A schematic view is given in Figure 3.34[cww/tm/132].
The liquid is collected in an underdrain system and passed to a settling tank and part of theliquid is recycled to dilute the strength of the incoming waste water.
The expanded-bed process is operated as described for anaerobic treatment (seeSection 3.3.4.3.1) with the distinction that air or oxygen is introduced and aerobic instead of

Chapter 3
Waste Water and Waste Gas Treatment 141
anaerobic bacteria are fixed in the biofilm. The advantage of this version of aerobic treatment isthe reduced space requirement with the same performance.
Membrane bioreactor: external loopRecycled sludge
MF or UF modules
Effluent
Aerationtank
Waste water
Waste water
Membrane bioreactor: immersed membranes
Excess Sludge
Effluent
Aerationtank
EffluentClarifier
Waste water
Recycled sludge
Conventional activated sludge
Excess sludge
Figure 3.33: Variants of Membrane Bioreactor, compared with Conventional Activated SludgeProcess
Figure 3.34: Schematic View of a Trickling FilterQ: Waste waterQR: Recycle water

Chapter 3
142 Waste Water and Waste Gas Treatment
In the biofilter fixed-bed process the biofilm is maintained at the surface of a carrier. Thewaste water stream is treated when passing through this biofilm; suspended solids are retainedin the filter, from where they are backwashed regularly. This technology has been developed asa compact (high turnover rate per volume and omission of a secondary clarifier) and odourlessalternative to the conventional activated sludge process (see Figure 3.35).
Primary settling Activated sludge
processClarification
Waste water Treated waste water
Conventional activated sludge process
Primarysettling
BiofilterWaste water Treated waste water
Biofilter process
Figure 3.35: Biofilter Process in Comparison to Conventional Activated Sludge Process
Most submerged biofilters are based on one single filter medium. The water flow in a filter isupflow or downflow and with either sinking or floating medium. Biofilters can have mono ormultilayer construction. Whereas multilayer biofilters are fed with raw water without primarysettling, monolayer filters are usually used after a primary treatment to remove suspendedsolids.
The backwash frequency depends on the characteristics of the effluent. A normal frequency isflushing once a day with a large amount of water, but this has to be adapted on a case-by-casebasis. The backwash operates with different steps:
• water only• air only• water and air.
A variation of carrier material is lignite coke because of its ability to adsorb in its pores theorganic contaminants, the oxygen and the bacteria material, which extends the reaction time farlonger than the normal residence time. Thus, refractory COD is more reduced than in acomplete-mix activated sludge process, as result of a combination of enhanced biodegradationand adsorption on the carrier material. The lignite coke covers the surface of the tank and servesas an exhaust air filter which considerably reduces the odorous emissions.
Application
Aerobic waste water treatment generally represents the final biological step. It offers theadvantage of a high rate of sludge growth that not only enables the handling of the variouscomponents of toxic waste water but also provides an efficiency of COD removal that isnormally superior to anaerobic treatment.

Chapter 3
Waste Water and Waste Gas Treatment 143
In general, the complete-mix activated sludge process is applicable to all biodegradable wastewater streams, be it as high load pretreatment of tributary streams or as the main part of acentral WWTP.
The membrane bioreactor is used to treat municipal and industrial waste water, the latteroriginating, for example, from the chemical industry, the food processing industry or the pulpand paper industry, as well as landfill leachate. It is particularly suitable for:
• effluents with high COD and/or ammonium loads• recycling of waste water• stringent discharge regulations• sensitive receiving water bodies• sludges which are hard to settle• upgrading existing plants• compact installations• nuisance (e.g. odour) problems• disinfection of water.
When trickling filters are used in the chemical industry they are operated as part of a centralWWTP to reduce the most easily degradable contaminants and to improve the sludge quality inthe subsequent aeration stage.
Biofilters are used to treat urban and some industrial waste water (e.g. effluent highly loadedwith COD in the pulp and paper industry), but also to upgrade an existing activated sludge plant(which is also the case with expanded-bed reactors). The advantage of the fixed biofilm oncarrier material is the lower vulnerability to high salt contents and the better conditions forslow-growing bacteria because of the long-term retention in the system. Biofilters are also usedas a direct pretreatment or final polishing step to an activated sludge process.
Biofilters can be loaded 2 to 3 times higher than a high-loaded activated sludge plant and stillremove 90 % of the COD [cww/tm/164]. A comparison of the loads treated by differentbiosystems is shown in Table 3.10 [cww/tm/164]. Biofiltration achieves the same performancewith nitrification / denitrification, but with a higher load.
COD[kg/(m3/d)]
BOD[kg/(m3/d)]
NH4-N[kg/(m3/d)]
NO3-N[kg/(m3/d)]
Activated sludge 0.4-6 0.35-3 a 0.04-0.1 0.24-0.72
Activated sludge with oxygenenriched aeration 2-5 b
Biofilter 3-25 1.3-10 a 0.4-1.5 0.7-6
Trickling filter(with plastic support) 1-5 b
Membrane bioreactor c 2-3 d 1 0.9 e 1
a BOD5b BOD7c sludge concentration 11-25 g/l 1d peaks between 1.6 and 8.5 kg COD/(m3/d)e from thermal treatment liquor1 [cww/tm/163]
Table 3.10: Comparison of the Volumetric Loads Treated by Various Aerobic Processes

Chapter 3
144 Waste Water and Waste Gas Treatment
Application limits and restrictions are:
Limits / restrictionsNutrients BOD:N:P should be 100:5:1;
critical ratios that should not be exceeded to ensureadequate operation are BOD:N 32:1 and BOD:P150:1
Concentration high substance concentrations (even of non-toxicsubstances) need to be avoided
Inhibitors see Table 3.9Temperature waste water temperatures >35 °C can be critical for
microorganismsSalt load high salt loads (>30 g/l) can disturb the biological
process by damaging the micro-organisms; fixed-film techniques are less vulnerable
Advantages and Disadvantages
Advantages Disadvantages• Cost-effective treatment of organic
contaminants.• Environmental impact lower than with other
treatment processes.• Large amount of waste water can be treated.• Relatively high energy efficiency compared
with non-biological treatment systems. Energyis mostly produced by sustainable methods(metabolism of micro-organisms with air andwater).
• Degradation mainly into harmless compounds.
• High energy consumption to supply oxygen tothe water.
• Production of a considerable amount ofclarification sludge (except with membranebioreactor or fixed-bed biofilters).
• The aeration process causes stripping effectsfor volatile compounds resulting in fugitivereleases, often the cause for odour andaerosols.
• Complete-mix processes can cause bulking,resulting in excess discharge of activated floc.
• Biological processes can be inhibited bycontaminants.
• With membrane bioreactors: fouling ofmembranes can be a problem.
• High pressure drop, equivalent with increase inelectric energy consumption.
Achievable Emission Levels / Performance Rates
The main parameter to check the performance rate or efficiency of biological treatment is BOD,whereas the degradation of COD depends on the degree of upstream pretreatment and thecontent of hardly degradable contaminants. Since refractory COD (or contaminantconcentrations that act as refractory COD) is not suitable for biological treatment, and shouldtherefore be left out as far as possible from a biological WWTP, it makes sense to listachievable COD levels.

Chapter 3
Waste Water and Waste Gas Treatment 145
Performance rates[%]
Parameter Complete-mix activated
sludgeMembranebioreactor
Tricklingfilter
Expanded-bed
Biofilterfixed-bed
TSS 99 5
Turbidity 99 5
BOD 97–99.5 1 97 5 40–90 285–95 a 2 >98 1
COD (TOC) 76–96 c 1 >90-96 5 90 b 1 26–68 d 3
Phenolindex >99 e 4 75–98 3
AOX 55–98 3
totalinorganic N 82 5 4–50 3
NH4-N 96-98 5
a two stageb 3 bioreactors in series, subsequent GAC adsorption results in TOC reduction of 98 %, COD reduction of99 %c 96 % with pure oxygend degradation of refractory COD, plant operates as polisher behind activated sludge WWTPe input phenol 30 mg/l, 2200 m3/d waste water1 [cww/tm/132]2 [cww/tm/4]3 [cww/tm/151]4 [cww/tm/96]5 [cww/tm/163]
Cross-media Effects
The main environmental issues of aerobic biological treatment are:
• the introduction of oxygen into the system and its effects• the arising of activated sludge as a result of the biological process.
Oxygen is introduced by aeration, which calls for high energy input and stripping the volatilewaste water content into the atmosphere, giving cause to odour. This impact can be controlledby various means:
• replacement of air by pure oxygen or oxygen enriched air, the gas injection reduced toabout 20 % of the necessary air injection and by this reducing the stripping effect as well asthe energy need; the advantage of this process variant, however, needs to be assessedcarefully in comparison with the impact(s) of oxygen production, e.g. energy consumption,safety issues, difficulties to strip out CO2, etc.
• covering the aeration tanks and ducting the captured exhaust air to a downstream abatementsystem (such as GAC adsorber, incinerator, biofilter or wet scrubber)
• use of carrier-based biological treatment techniques (fixed-bed biofilter) either with theequipment covered or the carrier material (lignite coke) serves as gas adsorbent.
Aerobic biological treatment produces a relatively large amount of excess activated sludge thatneeds to be disposed of. Special activated sludge treatment is involved with aerobic biologicalwaste water treatment techniques, either on site or off site, which is detailed in Section 3.4.

Chapter 3
146 Waste Water and Waste Gas Treatment
Consumables are:
Consumable Complete-mixactivated sludge
Membranebioreactor
Tricklingfilter
Expanded-bed
Biofilter fixed-bed
Oxygen (air orpure gas)Neutralisationchemicals
Flocculants 300-550 kg/tonneCOD a 1
Nutrients 23-42 kg/tonneCOD b 1
CarrierEnergy[kWh/m3]
9.5 c 10.1 kWh per p.e. 2
a flocculant: ferrosulphateb o-phosphoric acidc including sludge incineration1 [cww/tm/96]2 [cww/tm/128]
Monitoring
Monitoring of a biological waste water treatment plant is illustrated in Annex 7.3
Economics
Costs
Complete-mixactivated sludge
Membranebioreactor
Tricklingfilter
Expanded-bed
Biofilterfixed-bed
Capital costs FIM 15-20 million a 1
about 2 % of capitalcosts 2
DEM0.2/m3 3Operating
costs FIM 0.60/m3 a 1
a about 90 m3/h, COD 500-900 mg/l1 [cww/tm/96]2 [cww/tm/128]3 [cww/tm/151]
Capital and operating costs are highly dependent on hydraulic and contaminant load, necessaryimplemented facilities such as API, neutralisation step, sludge separation equipment etc. Thuscost information at this stage can only be a rough guide and needs further refining in the light ofthe equipment and load of the plant in question.
3.3.4.3.4 Biological Nitrogen Elimination
Description
Nitrogen, or more precisely ammonium, is removed by a special biological treatment thatconsists of two steps:
• the aerobic nitrification, where special micro-organisms oxidise ammonium (NH4+) to the
intermediate nitrite (NO2-) that is further converted to nitrate (NO3
-)• the anoxic denitrification, where micro-organisms convert nitrate to nitrogen gas.
Like all biological processes, nitrification/denitrification is vulnerable to toxic or inhibitingsubstances. However, as already mentioned above, cautious feeding of low concentrations ofthese toxic substances can lead to adaptation of the microorganisms and thus to the completeloss of inhibiting effects, if the concentration is not considerably increased. Substances withinhibiting effects are listed in Table 3.11 [cww/tm/27].

Chapter 3
Waste Water and Waste Gas Treatment 147
CompoundInhibition
concentration[mg/l] dissolved
Reduction inrate[%]
Thiourea 1 50Thiosemicarbazide 1 50Sodium methyldithiocarbamate 1 50Methyl isocyanate 1 50Allyl isothiocyanate 1 501,1-Dichloroethane 125 starting point1,1-Dichloroethene 751,2-trans-Dichloroethene 751-Naphthylamine 15 502,2-Bipyridine 16 / 20 50Ammonia-N 200 50Benzene 500Benzidine dihydrochloride 20-100 50Benzocaine >100 50Benzylamine >100 50Tetrachloromethane 50Chlorobenzene 100Trichloromethane 18 75Dimethylgloxime >100 50Dimethylphthalate 100Dodecylamine <1 50Ethylendiamine 17 50Hexamethyldiamine 85 50Monoethanolamine >100 50Methylamine <1 50Methyl thiouronium sulphate 10 50Skatole 10 50Sodium dimethyldithiocarbamate 20 50Sodium cyclopentamethylene-thiocarbamate 20 50
Guanidine carbonate 20 50Allyl alcohol 20 50Benzyl thiouronium chloride 20–100 50Diguanide 20–100 50Allylthiourea 1 50Thioacetamide 1 50Dithio-oxamide 1 50Mercaptobenzthiazole 1 50N-Methylalanine 1 50Naphthalene 50Naphthylethylene diaminedihydrochloride 23 50
Ninhydrin >100 50p-Aminopropiophenone 43 50p-Nitroaniline 31 50p-Nitrobenzaldehyde 87 50p-Phenylazoaniline 72 50Phenol 3 30Tannic acid >100 50Toluene 350 starting pointTriethylamine 127 50Zinc 0.08–0.5Copper 0.005–0.5 starting pointCyanide 0.34 starting pointChromium(VI) 0.25 starting pointLead 0.5 starting pointMercury 1 starting pointQuinoline 10 50p-Benzoquinone 10 50Tetramethylthiuramthiocarbamate 20 50Pyridine 20 50Cresols 20 50Cetyl trimethyl ammonium 20 50Tetramethylthiuram disulphide 20–100 50

Chapter 3
148 Waste Water and Waste Gas Treatment
CompoundInhibition
concentration[mg/l] dissolved
Reduction inrate[%]
Hydrazine 20–100 508-Hydroxy-quinoline 20–100 50Diallyl ether 20–100 50Carbon disulphide 20–100 50Dicyandiamide >100 50Strychnine hydrochloride >100 50Potassium thiocyanate 300 50EDTA (Ethylene diamine tetraacetate) 350 50
N-Methylalanine hydro-chloride 550Cetyl pyridinium chloride 20–100 50Sodium azide 20–100 50Dichlorophen 20–100 50Trimethylamine hydrochloride >100 502,4,6-Tribromophenol >100 50Methylene blue 100 50Streptomycin 400 50
Table 3.11: Substantial Inhibitors to Nitrification
When nitrification/denitrification is operated, it can typically be incorporated in a centralbiological WWTP. A vital factor for denitrification is the ratio of oxygenated nitrogen(nitrate/nitrite) and BOD (as reducing agent). There are two major layout options:
• nitrification stage as part of the aerated section; if necessary the N/BOD ratio is improvedby addition of easily biodegradable TOC, e.g. methanol, to the subsequent denitrificationstage (see Figure 3.36)
• denitrification as first stage, using the BOD-rich untreated waste water for energy supply,followed by the aeration (nitrification) section, a large part of nitrated waste water to berecycled to the denitrification zone (see Figure 3.37).
When only single tributary streams need nitrification/denitrification treatment it isrecommendable to operate it separately from central treatment.
Nitrification/denitrification might be suitably retrofitted in existing biological WWTP byconstructional alterations, such as:
• installation of separation walls• installation of return pipes for nitrate containing waste water• re-using of existent tank volume• usage of existing clarifier or• adjusting or adapting process control.

Chapter 3
Waste Water and Waste Gas Treatment 149
Nitrificationbasin
Denitrificationbasin
Intermediateaeration
Finalclarifier
Oxygen
Entry
Methanol
Excesssludge
Recycle
Discharge
Figure 3.36: Nitrification/Denitrification in Series
Nitrificationbasin
Denitrificationbasin
Finalclarifier
Oxygen
Entry
Excesssludge
Recycle
Discharge
Recirculation
Figure 3.37: Nitrification/Denitrification with Denitrification as First Stage
Application
Nitrification/denitrification is applied to waste water streams that contain a considerable amountof nitrogen compounds, in particular amines and ammonium compounds. The control ofammonium discharge is an important measure to protect the quality of surface water (e.g.rivers), because the conversion of ammonium to ammonia, dependent on pH, results in fishtoxicity.
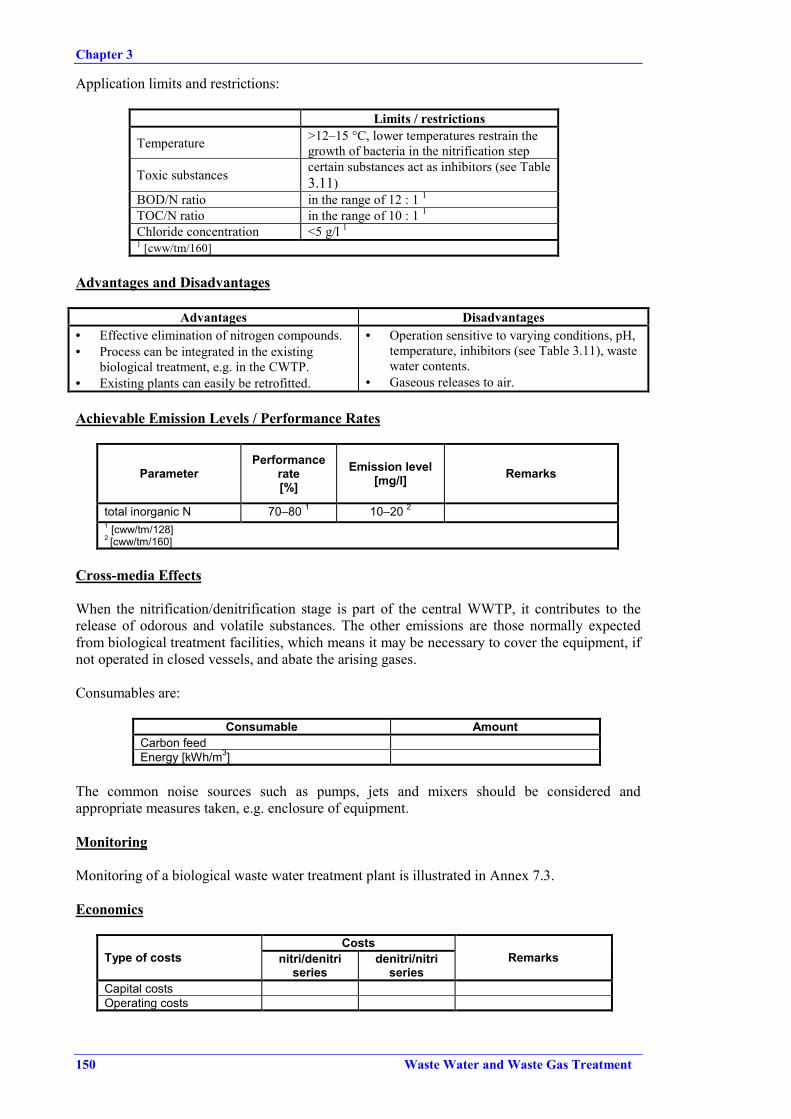
Chapter 3
150 Waste Water and Waste Gas Treatment
Application limits and restrictions:
Limits / restrictions
Temperature >12–15 °C, lower temperatures restrain thegrowth of bacteria in the nitrification step
Toxic substances certain substances act as inhibitors (see Table3.11)
BOD/N ratio in the range of 12 : 1 1
TOC/N ratio in the range of 10 : 1 1
Chloride concentration <5 g/l 11 [cww/tm/160]
Advantages and Disadvantages
Advantages Disadvantages• Effective elimination of nitrogen compounds.• Process can be integrated in the existing
biological treatment, e.g. in the CWTP.• Existing plants can easily be retrofitted.
• Operation sensitive to varying conditions, pH,temperature, inhibitors (see Table 3.11), wastewater contents.
• Gaseous releases to air.
Achievable Emission Levels / Performance Rates
ParameterPerformance
rate[%]
Emission level[mg/l] Remarks
total inorganic N 70–80 1 10–20 21 [cww/tm/128]2 [cww/tm/160]
Cross-media Effects
When the nitrification/denitrification stage is part of the central WWTP, it contributes to therelease of odorous and volatile substances. The other emissions are those normally expectedfrom biological treatment facilities, which means it may be necessary to cover the equipment, ifnot operated in closed vessels, and abate the arising gases.
Consumables are:
Consumable AmountCarbon feedEnergy [kWh/m3]
The common noise sources such as pumps, jets and mixers should be considered andappropriate measures taken, e.g. enclosure of equipment.
Monitoring
Monitoring of a biological waste water treatment plant is illustrated in Annex 7.3.
Economics
CostsType of costs nitri/denitri
seriesdenitri/nitri
seriesRemarks
Capital costsOperating costs

Chapter 3
Waste Water and Waste Gas Treatment 151
3.3.4.3.5 Central Biological Waste Water Treatment
Description
The main part of the central WWTP is the aerobic biological activated sludge process (seeSection 3.3.4.3.3). Around this central facility are grouped a complex of preparatory andsubsequent separation operations. The central waste water plant is normally equipped with:
• buffer or equalisation volumes, if not already provided by other upstream facilities• mixing station, where neutralisation and flocculation chemicals are added and mixed
(usually lime milk and/or mineral acids, ferrous sulphate); enclosed or covered if necessaryto prevent releases of odorous substances, the captured exhaust air ducted to an abatementsystem
• primary clarifier, where the floc is removed; enclosed or covered if necessary to preventfugitive releases of odorous substances, the captured exhaust air ducted to an abatementsystem
• activated sludge part, e.g.- aeration basin with nutrient feed at the entry, enclosed or covered if necessary with
exhaust air ducts to an abatement system- or closed reaction tank (e.g. tower biology) with gas duct, connected to a gas abatement
system- nitri/denitrification stage (optionally) and phosphate elimination
• optional intermediate clarifier, when a second aerobic biological stage is operated, withsludge recycling
• optional second activated sludge part, for low load biology• final clarifier with sludge recycling and transfer to sludge treatment; alternative sandfilter,
MF or UF equipment• optionally further special treatment facilities to eliminate the rest of refractory COD, e.g.
biofilter (see Section 3.3.4.3.3)• optionally further treatment facilities after the final clarifier, e.g. air flotation (see
Section 3.3.4.1.3)• optionally sludge treatment facilities, such as:
- digesters (see Section 3.4.2)- sludge thickeners (see Section 3.4.1)- sludge dewaterers (see Section 3.4.1)- sludge incinerators (see Section 3.4.3)
• waste gas (exhaust air) abatement facilities such as:- GAC adsorbers (see Section 3.5.1.3)- thermal or catalytic oxidiser (see Section 3.5.2.4 and Section 3.5.2.5)- flares (see Section 3.5.2.6).
An example is illustrated in Figure 3.38 [cww/tm/81]
Application
Central biological waste water treatment is applied to complex waste water originating from theproduction and handling of organic chemicals, provided the content is biodegradable. Thuscentral WWTP are common end-of-pipe facilities in the chemical industry. Some illustrativeexamples are given in Annex 7.6.1.
According to the description given above, the central biological WWTP is able to remove twokinds of contaminants:
• suspended solids• biodegradable compounds.

Chapter 3
152 Waste Water and Waste Gas Treatment
Waste water with a considerable amount of contaminants not belonging to these groups needseither pretreatment before being discharged into the central plant or special treatment (seeSection 3.3.4.2) and by-passing of the central plant. Waste water containing an exceedinglyhigh biodegradable load is also normally pretreated (see Sections 3.3.4.3.1 to 3.3.4.3.4).
For application limits and restrictions, see Sections 3.3.4.3.3 and 3.3.4.3.4:
Figure 3.38: Example of a Central WWTP (Mechanical-Biological-Chemical)
Advantages and Disadvantages
Advantages Disadvantages• Large amount of waste water is treated.• Synergetic effects can increase efficiency.• Energy efficiency is high compared to
processes such as GAC adsorption,incineration, wet oxidation. Energy is mainlysupplied by sustainable methods (metabolismof micro-organisms with air and water).
• Degradation normally into less harmfulcompounds (some exceptions whendegradation products react to new compoundsare known in pharmaceutical and pesticideproduction).
• Biological processes can be inhibited bycontaminants or temperatures that are too high(>35 °) or too low (<12 °C).
• High amount of excess sludge has to bedisposed of.
• The aeration process causes stripping effectsfor volatile compounds resulting in fugitiveodorous and/or aerosol releases.
Achievable Emission Levels / Performance Rates
The main parameter to check the performance rate or efficiency of biological treatment is BOD,whereas the degradation of COD depends on the degree of upstream pretreatment and thecontent of hardly degradable contaminants. Since refractory COD (or contaminantconcentrations that act as refractory COD) is not suitable for biological treatment, and shouldtherefore be left out as far as possible from a biological WWTP, it makes sense to listachievable COD levels.

Chapter 3
Waste Water and Waste Gas Treatment 153
ParameterPerformance
rate[%]
Achievableemission level
[mg/l]Remarks
TSS 10 4
97–99.5 1,4 7-10 4BOD 99–99.8 anaerobic pretreatment60–98 1,2,4 98 % with oxygen gasCOD (TOC) a 95–97 anaerobic pretreatment
AOX <1 4
Total inorganic N 70–80 3 10–20 4
Phenol >99 5 waste water rate 2200 m3/d, input30 mg/l phenol
TF 2-3 b 6 measurements in Germany c(outliers up to 24)
TD 2-4 b 6 Measurements in Germany c(outliers up to 768)
TA 1-16 b 6 Measurements in Germany c(outliers up to 1024)
TL 2-12 b 6 measurements in Germany c(outliers up to 1024)
TM 1.5 b measurements in Germanya considering that refractory COD is removed upstreamb dimensionless numbersc higher value is 90 percentile1 [cww/tm/132]2 [cww/tm/105]3 [cww/tm/128]4 [cww/tm/160]5 [cww/tm/96]6 [cww/tm/162, 165]
Cross-media Effects
As already described in Section 3.3.4.3.3 the main impact of aerobic biological treatment is theenergy need for aeration combined with mixing in the aeration basin, the arising of aconsiderable amount of excess sludge that needs to be disposed of and treated, the strippingeffect of aeration giving cause to the release of aerosols and volatile odorous substances and thenoise generated by the treatment facilities. Action against the releases is enclosing or coveringthe sensitive areas such as mixing station, primary clarifier and aeration basin and ducting theexhaust air stream to a gas abatement system. A control measure against noise is the enclosureof equipment such as pumps.
Consumables are:
Consumable Amount
Air or oxygenNeutralisation chemicals
Flocculants 300-550 kg/tonne COD a 10.5-1.9 kg/tonne COD b 2
Nutrients 23-42 kg/tonne COD c 13-5 kg/tonne COD c 2
Energy [kWh/m3]9.5 d 1
0.7–4.0 20.1 kWh per p.e. 3
a flocculant: ferrosulphateb only waste water treatment partc o-phosphoric acidd including sludge incineration1 [cww/tm/96]2 [cww/tm/105]3 [cww/tm/128]

Chapter 3
154 Waste Water and Waste Gas Treatment
The amount of sludge arising during central treatment is not easy to quantify in relation to thecontaminant load. It encompasses a large region between 34 and 2000 kg dry solid per tonneeliminated COD, averaging in the range of 250–720 kg dry solid per tonne eliminated COD[cww/tm/105].
Monitoring
Monitoring of a biological waste water treatment plant is illustrated in Annex 7.3.
Economics
Type of costs Costs RemarksCapital costs per m3
Operating costs per m3
Capital and operating costs depend strongly on the facilities surrounding the biological part.
3.3.4.4 Rain and Fire-fighting Water Control
An essential point for industrial activities is the prevention of uncontrolled effluents from thesite. For this purpose the drainage system of an industrial site can be divided into a productionsurface part, e.g.
• non-roofed production plant surfaces• areas of storage tanks• roofs exposed to effluent fallout,
and a normal traffic surface part, e.g.:
• roads inside the site• administration area• uncontaminated roof surfaces• parking areas.
Rainwater from production areas and fire-fighting water are collected either in sumps on thespot or in other central facilities to allow inspection and then a decision to be made on whetherto discharge them directly to the receiving water or to a waste treatment facility. Care needs tobe taken to prevent the collection of fire-fighting water from causing fire to spread.
The drainage system of normal traffic areas is, where appropriate, connected to extra dischargefacilities that are, e.g., installed to
• protect the receiving river against the hydraulic load of heavy rainfall from large pavedareas
• remove flushed contaminant fallout accumulated during dry periods• prevent the unintentional discharge of accidental spillage on roads or parking areas.
These facilities often include a first-flush compartment and hold-up for rainwater, to cater forthe effluent which occurs as a result of the first rain after a relatively dry period, and furthercompartments for subsequent rainfall.

Chapter 3
Waste Water and Waste Gas Treatment 155
3.3.4.4.1 Retention Ponds
Description
A retention pond retains a permanent pool of water within a designated area, and relies onphysical, biological and chemical processes to remove pollutants from rainwater run-off.Additionally, they control the rainwater flow to prevent downstream strain of the receivingriver. When the pond is full the incoming rainwater displaces the existing content. The size ofthe pond depends on the necessary hydraulic residence time. Depending on the kind ofcontaminants and the hydraulic residence time, eutrophication might occur. From time to time itwill be necessary to remove the sediment.
The water within the pond is discharged through an outlet that consists of a vertical riserattached to a horizontal barrel that conveys the rainwater flow beneath the embankment to arecipient. The outlet is designed to let excess water pass while maintaining a permanent pool.Risers are typically placed in, or on the edge of, the embankment and are capped with a rubbishrack to prevent clogging.
To prevent diffuse pollution from surface run-off or accidental spillage, retention ponds areequipped with oil separation / interception facilities.
Application
A retention pond is used to avoid hydraulic overload of downstream facilities and to separatesolid pollutants from rainwater. These pollutants can include sediment, organic matter and,under certain circumstances, dissolved metal compounds and nutrients. It can be applied toindustrial sites with lightly contaminated surfaces.
There are no application limits and restrictions.
Advantages and Disadvantages
Advantages Disadvantages• For dischargers into weak recipients retention
ponds decrease the potential for downstreamflooding and riverbank erosion.
• First flush systems provide no spillagecontainment, i.e. space required for sufficientvolumes.
Achievable Emission Levels / Performance Rates
The achievable pollutant removal depends on special conditions, such as hydraulic residencetimes (HRT) and the kind of pollutant. Thus sedimentation and biological degradation inside thepond can occur to a certain degree.
Cross-media Effects
Sedimented sludge has normally to be disposed of. Easily biodegradable substances collectedwithin the retention pond can cause odour discharge.
Consumables are:
Consumable AmountEnergy [kWh/m3]

Chapter 3
156 Waste Water and Waste Gas Treatment
Monitoring
Proper maintenance will ensure continued accurate functioning of the retention pond. Thisincludes [cww/tm/77]:
• clearing rubbish and debris• conducting routine inspections of the embankment and spillway to check structural integrity
and look for signs of erosion or animal habitation• conducting periodic repairs on the embankment, emergency spillway, inlet and outlet• removing sediment and algae• removing woody vegetation or trees from the embankment that could potentially weaken
the embankment• maintaining the outfall area.
Economics
Type of costs Costs RemarksCapital costsOperating costs labour costs 3 h/month
3.3.4.4.2 Sand Filters
Description
A special application of sand filters is their function to treat rainwater run-off and removeundissolved pollutants such as suspended solids, undissolved phosphate and solid BOD. Theyprovide a highly effective instrument to remove pollutants from rainwater while remainingflexible in application to allow for modifications in basic design structure to accommodate site-specific criteria. From time to time the filter is backwashed to remove its load of contaminants.
Sand filters for rainwater treatment are usually composed of two components:
• a sedimentation chamber, to remove floatables and heavy sediments• a filtration chamber, to remove additional pollutants.
Examples are:
• the surface sand filter basin• the underground vault sand filter• the double trench sand filter• the stone reservoir trench sand filter• the peat sand filter.
Application
The sand filter is often applied where there is not enough space to incorporate a retention pondon an industrial site. It is used to treat rainwater from lightly contaminated surfaces.
There are no application limits and restrictions.
Advantages and Disadvantages
Advantages Disadvantages• High removal efficiencies achievable.• Low space requirement.
• Substances dissolved in water are notremoved, unless by adsorption.

Chapter 3
Waste Water and Waste Gas Treatment 157
Achievable Emission Levels / Performance Rates
Parameter Performance rate[%] Remarks
TSS 80–83 11 [cww/tm/77]
Cross-media Effects
Backwashed sludge has to be disposed of as waste.
Consumables are:
Consumable AmountEnergy [kWh/m3]
Monitoring
Performance of sand filters may be sustained through frequent inspections and regularreplacement of the filter media. Accumulated rubbish and debris should be removed from thesand filter whenever necessary.
Economics
The capital costs are dependent on the chosen sand filter system and vary widely
Type of costs Costs RemarksCapital costsOperating costs
3.4 Sludge Treatment Techniques
Most waste water treatment processes result in sludge, although the amount, consistency andcontent depend on the waste water content and treatment technique. It is usually a liquid, orsemi-solid liquid, with solid contents between 0.25-12 wt-% [cww/tm/4] and contains primarilythe pollutants removed from the waste water. Excess activated sludge from a biological WWTPconsists mostly of degradation (mineralisation) products and bacterial tissue as well as attachedpollutants such as heavy metals.
Untreated sludge is not suitable to discharge or dispose of, because:
• its content of pollutants offensive to air prevents its deposition• its content of pollutants offensive to water bodies prevents its being discharged into a
receiving river• the large amount of water it contains makes incineration an unattractive option because of
the energy needed.
Sludge originating from chemical industry waste water is in general not suitable for agriculturalpurposes, but this depends on Member State legislation. A critical aspect is the content of heavymetals, AOX/EOX and other persistent sludge components.

Chapter 3
158 Waste Water and Waste Gas Treatment
The treatment operations for WWTP sludge are:
• preliminary operations (not described in this document), such as- grinding- blending or mixing- storage- degritting
• sludge thickening operations (see Section 3.4.1), such as- gravity thickening- centrifugal thickening- flotation thickening (DAF)- gravity belt thickening- rotary drum thickening
• sludge stabilisation (see Section 3.4.2), such as- chemical stabilisation (lime)- thermal stabilisation- anaerobic digestion- aerobic digestion- dual sludge stabilisation
• sludge conditioning (see Section 3.4.2), such as- chemical conditioning- thermal conditioning
• sludge dewatering techniques (see Section 3.4.1), such as- centrifugal dewatering- belt filter presses- filter presses
• drying operations (see Section 3.4.3), such as- rotary drying- spray drying- flash drying- evaporation- multiple hearth drying.
• thermal sludge oxidation (see Section 3.4.3), using techniques such as- fluidised-bed incineration- wet air oxidation- deep shaft oxidation- incineration with other (e.g. solid) waste.
• landfilling of sludge on site (not described in this document).
The treatment operations and disposal routes can be seen as single options or as a combinationof single options. The listing mainly follows the path of degree of reduction and is not meant inany case as a ranking. It needs to be mentioned that the availability (or non-availability) of adisposal route can be a strong driver, at least at a local level, for the choice of the waste watertreatment technique.

Chapter 3
Waste Water and Waste Gas Treatment 159
3.4.1 Sludge Thickening and Dewatering
Description
Sludge thickening and sludge dewatering are operations to increase the solid content of sludgeand remove a part of the water fraction. Their benefit is a manifold (about five fold or more)decrease in volume to facilitate subsequent treatment operations as well as decrease thenecessary size and capacity of treatment equipment. Both treatments differ only in the extent ofwater removal.
Common techniques are:
• gravity thickening, or sedimentation, using a settling tank• centrifugal thickening (also as dewatering technique), ideal for high solid capture, operated
either as solid bowl centrifuge or imperforate basket centrifuge, illustrated in Figure 3.39
Figure 3.39: Centrifugal Sludge Thickener(a) Solid Bowl Centrifuge, (b) Imperforate Basket Centrifuge
• flotation thickening, using DAF equipment as illustrated in Figure 3.40• gravity belt thickening, using a gravity belt moving over driven rollers, the conditioned
sludge added at one end into a feed/distribution box, the sludge ridged and furrowed by aseries of plough blades, allowing the released water to pass through the belt
• rotary drum thickening, the unit consisting of a sludge conditioning system with polymerfeed and rotating cylindrical screens where the polymer and thin sludge are mixed toflocculate and then separated from the water in the rotating screen drums
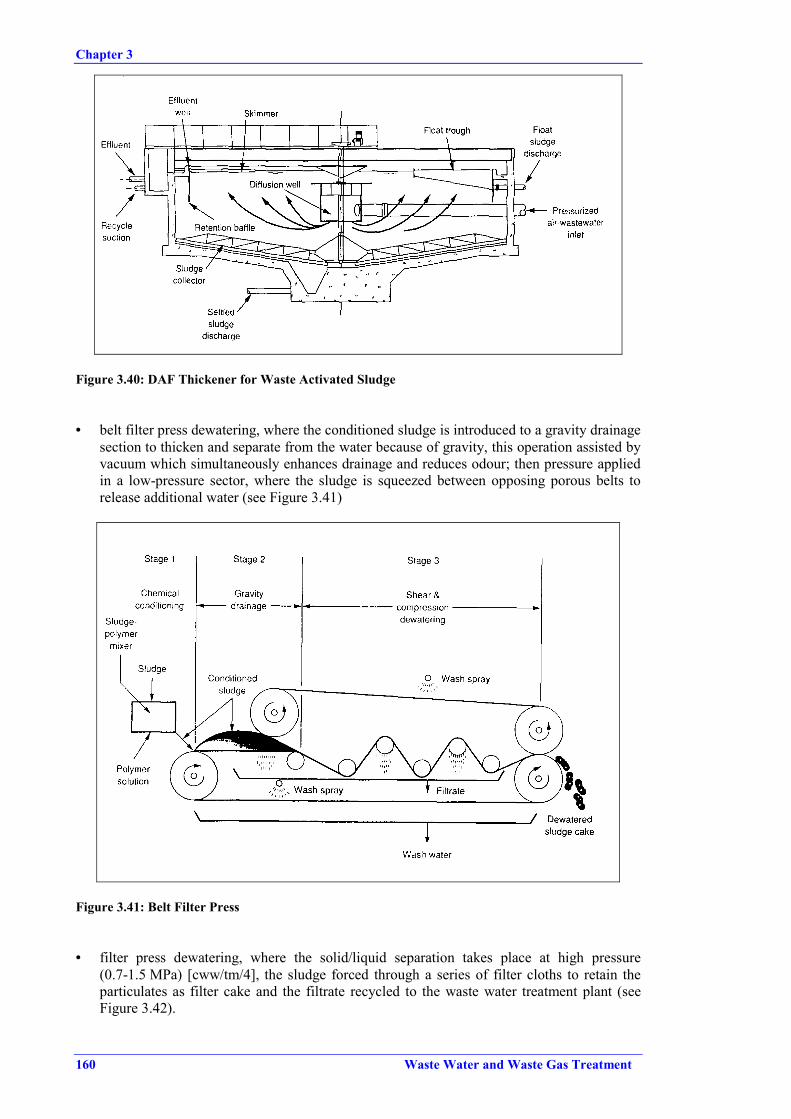
Chapter 3
160 Waste Water and Waste Gas Treatment
Figure 3.40: DAF Thickener for Waste Activated Sludge
• belt filter press dewatering, where the conditioned sludge is introduced to a gravity drainagesection to thicken and separate from the water because of gravity, this operation assisted byvacuum which simultaneously enhances drainage and reduces odour; then pressure appliedin a low-pressure sector, where the sludge is squeezed between opposing porous belts torelease additional water (see Figure 3.41)
Figure 3.41: Belt Filter Press
• filter press dewatering, where the solid/liquid separation takes place at high pressure(0.7-1.5 MPa) [cww/tm/4], the sludge forced through a series of filter cloths to retain theparticulates as filter cake and the filtrate recycled to the waste water treatment plant (seeFigure 3.42).

Chapter 3
Waste Water and Waste Gas Treatment 161
Figure 3.42: Fixed Volume Recessed Plate Filter Press
Application
The various techniques and their application to sludge properties are:
Gravity Centrifugal DAF Gravity belt Rotary drumuntreated primarysludge
waste activatedsludge
mixture of un-treated primarysludge and wasteactivated sludge
waste activatedsludge, addition offlocculant andpolymersnecessary
waste activatedsludge
mixture of un-treated primarysludge and wasteactivated sludge,addition ofpolymersnecessary
waste activatedsludge, particu-larly to solidsconcentration< 2 %
waste activatedsludge
Belt Filter Press Filter Pressall types of sludge, additionof flocculants and polymersnecessary
all types of sludge,flocculants and polymersneeded,
used when low content ofsuspended solids in thefiltrate is required

Chapter 3
162 Waste Water and Waste Gas Treatment
Advantages and Disadvantages
Advantages DisadvantagesGravity Thickening:• Excellent results with untreated primary
sludge.• Gravity thickening gets generally satisfactory
results with small plants and sludgeconcentrations between 4 and 6 %.
• Low energy consumption.
Gravity Thickening:• Only marginal results with large plants.• For waste activated sludge only poor solids
concentration.
Centrifugal Thickening:• Efficient production of dry sludge cake and
good capture of solids that are difficult tofilter.
• Space requirements relatively low comparedwith other dewatering systems.
• Easy installation.• Minimal odour problems.
Centrifugal Thickening• High consumption of energy per sludge unit
dewatered.• Produces lowest cake solids concentration of
the dewatering systems.• Vibrations and noise generation.• Skilled maintenance personnel required.
DAF Thickening:• Good efficiency for waste sludge from
biological treatment processes.
DAF Thickening:• Vulnerable to freezing (blocking of air jets).• Release of odorous substances (stripping
effect).Gravity Belt Thickening:• Good results for raw and digested sludge.Rotary Drum Thickening:• Low maintenance, energy and space
requirements.Belt Filter Presses:• High dewatering efficiency.• Easy maintenance.
Belt Filter Presses:• Hydraulic limitations.• Very sensitive to incoming sludge feed
characteristics.• Short media life compared to other dewatering
devices.Filter Presses:• High dewatering efficiency and low suspended
solids concentration in filtrate.
Filter Presses:• Batch operation.• Special requirements for support structure,
floor area, personnel skill.• Limited filter cloth life.
Achievable Emission Levels / Performance Rates
TechniqueSludge
concentration[%]
Solidscapture
[%]Remarks
Gravity thickening 2–10 1,2 80–92 1 depending on sludgequality
Centrifugal thickening 3–8 1 80–98 1
Centrifugal dewatering 10–35 1,2 85–98 1 with chemicalsDAF thickening 2–10 2 80–98 1
Gravity belt thickening 4–6 2
3–4 1Rotary drum thickening 15–30 1,2 90–98 1 with vacuumBelt filter press dewatering 15–30 1,2 85–98 1 with chemicalsFilter press dewatering 20–50 1 90–98 1 with chemicals1 [cww/tm/4]2 [cww/tm/128]

Chapter 3
Waste Water and Waste Gas Treatment 163
Cross-media Effects
Sludge thickening and dewatering are pretreatments for sludge to be handled more easily forfurther treatment, i.e. the resulting sludge after thickening and dewatering needs either finaltreatment or is disposed of in engineered landfills. The aqueous effluent (supernatant, filtrate) isrecirculated back to the WWTP.
Noise and odour are controlled by enclosure and/or housing of the equipment.
Consumables are:
Consumable Amount Remarkspolymer 0–4 kg/tonne drysolid 1 solid bowl centrifuge
polymer 1–3 kg/tonne drysolid 1 basket centrifuge
polymer 2–5 kg/tonne drysolid 1 DAF
Conditioning chemicals
polymer 3–7 kg/tonne drysolid 1 gravity belt
Washing water for filter backwashing2-6 solid bowl centrifuge2-3 belt filter pressEnergy [kWh/m3]4-5 filter press
1 [cww/tm/4]
Monitoring
To prevent disturbances the thickening process has to be examined at least visually. Sludgeinput and its consistency as well as turbidity measurements of the water discharge should befrequently monitored. The appearance of bulking sludge has to be detected to prevent itsrelease.
When sensitive equipment such as filter cloth is concerned, the input needs to be controlled toprevent the entrance of oversized or otherwise critical solids.
Economics
CostTechnique Capital Operating
Gravity thickening BEF 15 million a 1 BEF 8400/m3 a 1
Centrifugal thickening BEF 6-8000/tonne drysolid 1
DAF thickening BEF 40 million a 1BEF 4 million b 1
Gravity belt thickening
Rotary drum thickening BEF 6-8000/tonne drysolid 1
Belt filter press dewatering BEF 6-8000/tonne drysolid 1
Filter press dewatering BEF 7-10000/tonne drysolid 1
a capacity 100 m3/hb capacity 100 m3/d1 [cww/tm/128]

Chapter 3
164 Waste Water and Waste Gas Treatment
3.4.2 Stabilisation and Conditioning
Description
Stabilisation of sewage sludge is a treatment operation to [cww/tm/132]:
• reduce or eliminate the amount of odorous constituents• reduce the quantity of biodegradable sludge solids• improve dewatering• reduce pathogens• reduce or eliminate the potential for putrefaction.
Stabilisation techniques are [cww/tm/132]:
• chemical stabilisation, using chiefly lime either as pretreatment, i.e. before dewatering, or aspost-treatment, i.e. after dewatering, to raise the pH to >12 and thus kill pathogens
• thermal stabilisation, by heating the sludge in a pressure vessel at temperatures up to 260 °Cand pressures up to 2.8 MPa during approximately 30 minutes, also used as a conditioningtechnique
• aerobic digestion, working in a tank – similar to the aerobic activated-sludge process forwaste water treatment – with air or pure oxygen and adequate stirring, resulting in a75-80 % reduction of the activated sludge content [cww/tm/4]; the technique is an attractiveoption when separate sludge digestion is considered
• anaerobic digestion, working in a tank under exclusion of air either in the mesophilic(30-38 °C) or the thermophilic (49–57 °C) range and producing a combustible gas mixture(65–70 % methane, 25–30 % carbon dioxide, small amounts of nitrogen, hydrogen,hydrogen sulphide etc.) of a low heating value of about 22 MJ/Nm3
• dual sludge stabilisation, combining an upstream aerobic thermophilic and a downstreamanaerobic mesophilic digestion.
The purpose of sludge conditioning is to improve the conditions for thickening and/ordewatering. Conditioning techniques are:
• chemical conditioning, using e.g. ferric chloride, lime, alum and organic polymers(coagulants and flocculants)
• thermal conditioning, by heating the sludge in a pressure vessel at temperatures of 60-80 °C(low thermal conditioning) or 180–230 °C and 1–2.5 MPa (high thermal conditioning).
Application
Stabilisation and conditioning is applied to sludge with organic content which is going to bethickened and/or dewatered. The suitability of the various techniques depends on the specificconditions at a site, e.g.:
• available space for digester tanks• availability of energy, an important issue for thermal techniques• the amount of sludge generated• some techniques being viable only for larger plants.

Chapter 3
Waste Water and Waste Gas Treatment 165
Advantages and Disadvantages
Advantages DisadvantagesChemical stabilisation and conditioning:• Standard technique without high technological
requirements.• Effective method to improve downstream
filtration (conditioning) and to abate odoroussubstances and pathogens (stabilisation).
Chemical stabilisation and conditioning:• Considerable solid increase (except polymer
conditioning).
Thermal stabilisation and conditioning:• Only limited space requirements.• Effective treatment without use of additional
chemicals, both rendering the sludge capableof being dewatered and bacteria of beingdestroyed.
• Most applicable to biological sludges that maybe difficult to stabilise or condition by othermeans.
Thermal stabilisation and conditioning:• High capital costs compared to other
techniques.• High energy requirements.• Release of odorous substances is an important
issue.
Aerobic digestion:• Comparatively high volatile solids reduction,
comparable to anaerobic digestion.• Production of an odourless, humus-like,
biologically stable product.• Relatively easy operation.• Lower capital cost than with anaerobic
digestion.
Aerobic digestion:• High energy need for stirring and air or
oxygen supply.• Production of digested sludge with poor
mechanical dewatering characteristics.• Process significantly affected by temperature,
location and tank material.
Anaerobic digestion:• The arising gas can be used, after treatment,
e.g. with dry or wet scrubbers, as fuel forcombustion processes.
• Effective use without use of additionalchemicals.
• Because of long residence time, efficientmineralisation of the sludge.
Anaerobic digestion:• Large space requirements are an issue for
small sites.
Cross-media Effects
Chemical stabilisation and conditioning result in a considerable rise of solids content to bedisposed of, with the exception of polymer conditioning. Because lime stabilisation does notdestroy the organics necessary for bacterial growth, the sludge must be treated with an excess oflime or disposed of before the pH drops significantly. An excess dosage of lime may range up to1.5 times the amount needed to maintain the initial pH of 12 [cww/tm/4].
The necessary amount of lime for sludge stabilisation is detailed in Table 3.12 [cww/tm/4], theamount of polymer for sludge conditioning in Table 3.13 [cww/tm/4].
Sludge Solids concentration[%]
Lime dosage a[kg lime/kg dry solid]
Primary sludge 3–6 120–340Waste activated sludge 1–5 420–860Aerobically digested mixed sludge 6–7 280–500Septage sludge 1–4.5 180–1020a amount of lime required to maintain a pH of 12 for 30 minutes
Table 3.12: Typical Lime Dosages for Stabilising Liquid Sludge

Chapter 3
166 Waste Water and Waste Gas Treatment
kg dry polymer/tonne dry solidsSludge Vacuum rotary
drum filterBelt filter
pressSolid bowlcentrifuge
Primary sludge 1–5 1–4 0.5–2.5Primary and waste activated sludge 5–10 2–8 2–5Primary and trickling filter sludge 1.3–2.5 2–8 -Waste activated sludge 7.5–15 4–10 5–8Anaerobically digested primary sludge 3.5–7 2–5 3–5Anaerobically digested primary and airwaste activated sludge 1.5–8.5 1.5–8.5 2–5
Aerobically digested primary sludge and airwasted activated sludge 7.5–10 2–8 -
Table 3.13: Typical Levels of Polymer Addition for Various Types of Sludge and for VariousMethods of Dewatering
The main issue for aerobic sludge digestion is its air or oxygen need, which is about 2.3 kg O2per kg of degraded solid.
Anaerobic digestion results in a combustible gas that can be used as fuel, but because of thecontent of particulates and hydrogen sulphide it has to be cleaned before use. Appropriate wastegas treatment techniques are dry or wet scrubbing. In large plants it can be used as fuel forboiler and internal combustion engines.
Thermal stabilising and conditioning is an energy-intensive process which has to be assessed onits merits in the particular circumstances. During operation, odorous substances are generated orcan be released which have to be abated accordingly.
Economics
CostTechnique Capital OperatingChemical stabilisationThermal stabilisation / conditioningAnaerobic digestionChemical conditioning
3.4.3 Thermal Sludge Reduction
Description
Thermal sludge reduction is divided into two kinds of application:
• heat drying, reducing the water content by vaporisation of water• oxidation of the dried sludge, mineralising the organic content.
Drying facilities normally used are:
• rotary dryers• spray dryers• flash dryers• evaporators• multiple hearth driers.
The subsequent oxidation of dried sludge converts the organic solid content into oxidised end-products, primarily carbon dioxide and water discharged as gas, and leaving a reduced volumeof mostly inorganic solid. Sludges processed by thermal reduction are usually dewatered and

Chapter 3
Waste Water and Waste Gas Treatment 167
untreated, i.e. unstabilised, sludges. Stabilisation processes, e.g. anaerobic digestion, decreasethe volatile content of the sludge and consequently increase the requirement for an auxiliaryfuel. An exception is heat stabilisation ahead of incineration. Heat treated sludges dewater verywell, the sludge becoming autocombustible. [cww/tm/4]
The techniques commonly used for thermal sludge oxidation (or incineration) are:
• fluidised-bed incineration (see Figure 3.43), used for sludge incineration, consisting of acylindrically shaped steel shell, containing a sand bed and fluidising air orifices; the bedfluidised by air at a pressure of 20–35 kPa, the temperature of the sand bed controlledbetween 760 and 820 °C [cww/tm/4]; if the process is operated continuously or withshutdowns of short duration, there is no need for auxiliary fuel after start-up [cww/tm/4].This technique is expected to be dealt with in the BREF on waste incineration yet to bewritten.
Figure 3.43: Fluidised-Bed Incinerator [cww/tm/4]

Chapter 3
168 Waste Water and Waste Gas Treatment
• wet air oxidation, the system already described in Section 3.3.4.2.4, used for untreatedsludge, temperature range 175–315 °C and pressures up to 20 MPa; gases, liquid and ashleaving the reactor, the gases can be expanded to recover power
• deep-shaft oxidation (see Figure 3.44), i.e. discharging liquid sludge in the pressure andtemperature controlled environment of a tube-and-shell reactor suspended within a deepwell, oxygen or air injected into the waste sludge stream, temperature of about 290 °C,pressure range at bottom between 10–14 MPa (hydrostatic pressure); it is a specialapplication of wet air oxidation
Figure 3.44: Deep-Shaft Oxidation Reactor [cww/tm/4]
• incineration with other waste, reducing the costs by using the same facility and takingadvantage of the heat produced by waste incineration for the evaporation of the sludgewater content. This issue can be expected to be dealt with in the BREF on wasteincineration.
All techniques need further treatment of the released gases and liquids.
Application
Thermal sludge reduction is not necessarily a technology to perform at a chemical productionsite. Normally only larger sites operate sludge treatment to such an extent, others commissiontheir sludge to external discharge. The reasons are that skilled personnel are needed, the capitaland maintenance costs are considerable and the benefits from generated heat are normallyrelevant only to larger plants or where equipment is already available.

Chapter 3
Waste Water and Waste Gas Treatment 169
Incineration with other waste, for example, is an option for sites where waste incineration isalready operated – provided the incinerator is appropriately equipped – or where theconstruction of an incinerator is planned.
Advantages and Disadvantages
Advantages DisadvantagesIncineration:• Efficient destruction of organic content in
sludge.
Incineration:• Complex process requires skilled personnel.• Addition of auxiliary fuel is common.• Gaseous emissions and odour.
Incineration with other waste:• The heat for water evaporation and sludge
incineration is delivered by the incineration ofsolid waste, no auxiliary fuel required.
Incineration with other waste:• May lead to high emissions of PCDD/PCDF
and heavy metals, when combustionconditions and flue gas cleaning system are notadapted to the mixture (e.g. primary measuresfor dioxin reduction, secondary measures forreduction of both dioxins and heavy metals).
Wet air oxidation:• Process can be designed to be thermally self-
sufficient, recovering of power is sometimesavailable.
Wet air oxidation:• Production of high-strength recycle liquor.• Complex process needs skilled personnel.
Deep-shaft reactor:• Small space requirements.• High removal efficiency of suspended solids
and organic matter.• Process completely exothermal.• Little odour or objectionable air emissions.
Deep-shaft reactor• Skilled personnel required for process control.
Cross-media Effects
The main environmental issues raised by thermal sludge reduction are the gaseous and liquidemissions generated during the process.
The gaseous emissions from the fluidised-bed incinerators consist of particulates (ashes),nitrogen oxides, acid gases, hydrocarbons, heavy metals, depending on the sludge content andthe auxiliary fuel. Wet scrubbing techniques (details in Section 3.5.1.4) are used to abate the aircontaminants. The aqueous releases from wet scrubbing contain the suspended solids anddissolved waste gases that need to undergo waste water treatment. The emissions to air and thewaste water releases need to follow the requirements of the Waste Incineration Directive2000/76/EC [cww/tm/155] Annexes II, IV and V.
With the fluidised-bed incinerator no dry ash exists at the bottom of the reactor; it is entrainedin the combustion gases.
With the wet air oxidation process, gases, liquid and ash leave the reactor. The liquid and ashare returned through heat exchangers to preheat the incoming sludge, the gases are separatedfrom particulates and liquid drops in a cyclone and then released. In large installations it can beeconomical to expand the gases through a turbine to recover power [cww/tm/4]. The liquidphase is separated from the solid content and returned to the settling tank or clarifier. Therecycled liquid represents a considerable organic load. Typically ranges for COD are 10–15 g/l.
The deep-shaft oxidation process requires subsequent gas-liquid and solids-liquid separation aswell as post-treatment of the supernatant. These treatments reduce the COD content of thesludge >80 % [cww/tm/4].
The energy requirement of thermal sludge reduction techniques depends greatly on the heatvalue of the sludge, i.e. the water content and the heat value of the dry solid.

Chapter 3
170 Waste Water and Waste Gas Treatment
Monitoring
The incineration process (furnace) is normally operated by a process control system andmonitored by means of
• volume measurement• temperature measurement• pressure measurement• analyses.
Regulation mechanisms ensure that the specified temperature is maintained in the incinerationzone and the flue gas obtains the exact oxygen concentration, By ensuring optimum residencetime, excess air and temperature, a complete ash incineration is available.
Furthermore, monitoring needs to follow Articles 10 and 11 and Annex III of Directive2000/76/EC on the incineration of waste [cww/tm/155].
Economics
Technique Capital costs Operating costsFluidised-bed incinerationWet air oxidationDeep-shaft oxidationIncineration with other waste

Chapter 3
Waste Water and Waste Gas Treatment 171
3.5 Waste Gas End-of-pipe Treatment Techniques
Waste gas end-of-pipe treatment techniques are described here in a similar order to that used forwaste water end-of-pipe techniques. The relationship between pollutant and typical treatment,as pointed out in Section 1.3.2.2, is illustrated in Figure 3.45.
Waste gasrelease
Productionhandlingwork-Up
Combustion
Volatileorganiccom-
pounds
Volatileinorganic
compounds(incl. NOx,SOx, HCl,
HF)
Parti-culates
Parti-culates
NOx SOxHCl, HF
Substancerecovery
Energyrecovery
Recovery techniques
Membrane separationCondensationAdsorptionWet scrubbersSeparatorsCyclonesElectrostatic precipitatorsFabric filtersTwo-stage dust filtersAbsolute filtersHigh efficiency air filtersMist filtersDry, semi-dry and wet sorption
Abatement techniques
BiofiltrationBioscrubbingBiotricklingThermal oxidationCatalytic oxidationFlaringSeparatorsCyclonesElectrostatic precipitatorsFabric filtersCatalytic filtrationTwo stage dust filtersAbsolute filtersHigh efficiency air filtersMist filtersDry, semi-dry and wet sorptionSNCR / SCR
Figure 3.45: Range of Waste Gas End-of-pipe Treatment Techniques in Relation to Type ofContaminants

Chapter 3
172 Waste Water and Waste Gas Treatment
The sources of waste gases to be treated are:
• “normal” temperature processes, such as production, handling or work-up processes, withthe main contaminants:- volatile organic compounds, such as solvents- inorganic compounds, such as hydrogen halides, hydrogen sulphide, ammonia, carbon
monoxide- particulates in the form of dust
• incineration processes, with main contaminants:- particulates in the form of ashes and dust, containing soot, metal oxides- flue gases such as carbon monoxide, hydrogen halides, sulphur-oxygen compounds
(SOx), nitrogen-oxygen compounds (NOx).
Arising waste gases are treated by techniques where:
• the waste gas content is recovered and either recycled to the original process or used inanother process as raw product or energy carrier or
• the contaminants are abated.
Compounds, which are normally economically feasible to recover, include:
• VOC, recovered from solvent vapours or vapours of low-boiling products• VOC used as energy carrier in incinerators or boilers• hydrogen chloride, transferred into hydrochloric acid• ammonia to recycle into the production process• sulphur dioxide, transferred into sulphuric acid, sulphur or gypsum• dust containing higher amounts of solid raw products or end products.
The treatment techniques are – following Figure 3.45 – classified as:
• recovery techniques for VOC and inorganic compounds:- membrane separation (see Section 3.5.1.1)- condensation (see Section 3.5.1.2)- adsorption (see Section 3.5.1.3)- wet scrubbing (see Section 3.5.1.4).
• abatement techniques for VOC and inorganic compounds:- biofiltration (see Section 3.5.2.1)- bioscrubbing (see Section 3.5.2.2)- biotrickling (see Section 3.5.2.3)- thermal oxidation (see Section 3.5.2.4)- catalytic oxidation (see Section 3.5.2.5)- flaring (see Section 3.5.2.6).
• recovery and abatement techniques for particulates, using:- separator (see Section 3.5.3.1)- cyclone (see Section 3.5.3.2)- electrostatic precipitator (see Section 3.5.3.3)- wet dust scrubber (see Section 3.5.3.4)- fabric filter, including ceramic filter (see Section 3.5.3.5)- catalytic filter (see Section 3.5.3.6)- two stage dust filter (see Section 3.5.3.7)- absolute filter (HEPA filter) (see Section 3.5.3.8)- high efficiency air filter (HEAF) (see Section 3.5.3.9)- mist filter (see Section 3.5.3.10).

Chapter 3
Waste Water and Waste Gas Treatment 173
• recovery and abatement techniques for combustion exhaust gases:- dry sorbent injection (see Section 3.5.4.1)- semi-dry sorbent injection (see Section 3.5.4.1)- wet sorbent injection (see Section 3.5.4.1)- selective non-catalytic reduction of NOx (SNCR) (see Section 3.5.4.2)- selective catalytic reduction of NOx (SCR) (see Section 3.5.4.2).
The majority of treatment techniques cannot simply be classified as recovery or abatementtechniques, because whether the contaminants are recovered depends on the application ofadditional separation stages.
Some of the described techniques are individual operations and/or processes, others are onlyused as secondary pretreatment methods to avoid damage to the main treatment facilities or justtake the role of a pre-filter, or they are used as a final polishing step. Others can be used as both– individual or secondary technology. Examples will be given in the paragraphs that follow.
Most waste gas treatment techniques require further downstream treatment, either for arisingwaste water or waste gas generated during the process, and/or disposal of solid waste. This issuewill be discussed in the relevant chapters below.
3.5.1 Recovery Techniques for VOC and Inorganic Compounds
3.5.1.1 Membrane Separation
Description
Membrane separation of gases takes into account the selective permeability of organic vapourswhen permeating through a membrane. Organic vapours have a considerately higher permeationrate than oxygen, nitrogen, hydrogen or carbon dioxide (10 to 100 times higher [cww/tm/74]).The waste gas stream is compressed and passed over the membrane. The enriched permeate canbe recovered by methods such as condensation (see Section 3.5.1.2) or adsorption (seeSection 3.5.1.3), or it can be abated, e.g. by catalytic oxidation (see Section 3.5.2.5). Theprocess is most appropriate to higher vapour concentrations. Additional treatment is in mostcases needed to achieve concentration levels low enough to discharge [cww/tm/80].
Membrane separators are designed as modules, e.g. as capillary modules (see Figure 3.46)[cww/tm/64], manufactured as a polymer layer.
Figure 3.46: Typical Membrane Capillary Module
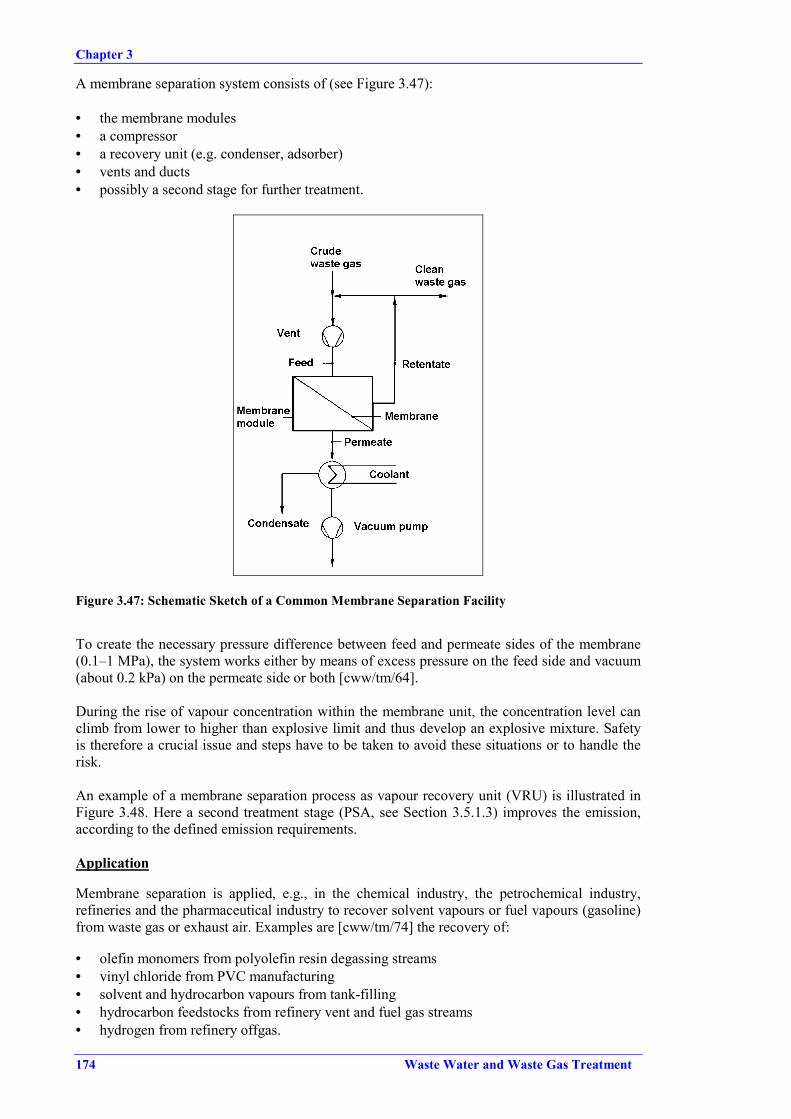
Chapter 3
174 Waste Water and Waste Gas Treatment
A membrane separation system consists of (see Figure 3.47):
• the membrane modules• a compressor• a recovery unit (e.g. condenser, adsorber)• vents and ducts• possibly a second stage for further treatment.
Figure 3.47: Schematic Sketch of a Common Membrane Separation Facility
To create the necessary pressure difference between feed and permeate sides of the membrane(0.1–1 MPa), the system works either by means of excess pressure on the feed side and vacuum(about 0.2 kPa) on the permeate side or both [cww/tm/64].
During the rise of vapour concentration within the membrane unit, the concentration level canclimb from lower to higher than explosive limit and thus develop an explosive mixture. Safetyis therefore a crucial issue and steps have to be taken to avoid these situations or to handle therisk.
An example of a membrane separation process as vapour recovery unit (VRU) is illustrated inFigure 3.48. Here a second treatment stage (PSA, see Section 3.5.1.3) improves the emission,according to the defined emission requirements.
Application
Membrane separation is applied, e.g., in the chemical industry, the petrochemical industry,refineries and the pharmaceutical industry to recover solvent vapours or fuel vapours (gasoline)from waste gas or exhaust air. Examples are [cww/tm/74] the recovery of:
• olefin monomers from polyolefin resin degassing streams• vinyl chloride from PVC manufacturing• solvent and hydrocarbon vapours from tank-filling• hydrocarbon feedstocks from refinery vent and fuel gas streams• hydrogen from refinery offgas.

Chapter 3
Waste Water and Waste Gas Treatment 175
Figure 3.48: Application of a Membrane Separation Process as Vapour Recovery Unit (VRU)
Recoverable compounds include:
• alkanes• olefins• aromatics• chlorinated hydrocarbons• alcohols• ethers• ketones• esters.
Application limits and restrictions:
Limits / restrictionsWaste gas flow dependent on membrane surface area,
capacities of 2100–3000 Nm3/h are knownTemperature ambient temperature, dependent on
membrane materialPressure dependent on membrane materialDust content very low, dust can damage the membrane
surface, thus very low dust concentrationshave to be achieved in advance
VOC concentration up to 90 %
Advantages/Disadvantages
Advantages Disadvantages• The re-use of raw material is possible.• The operation in itself is simple.• No waste generated by the process.
• Subsequent work-up and/or treatment stepnecessary.
• Explosion risk.
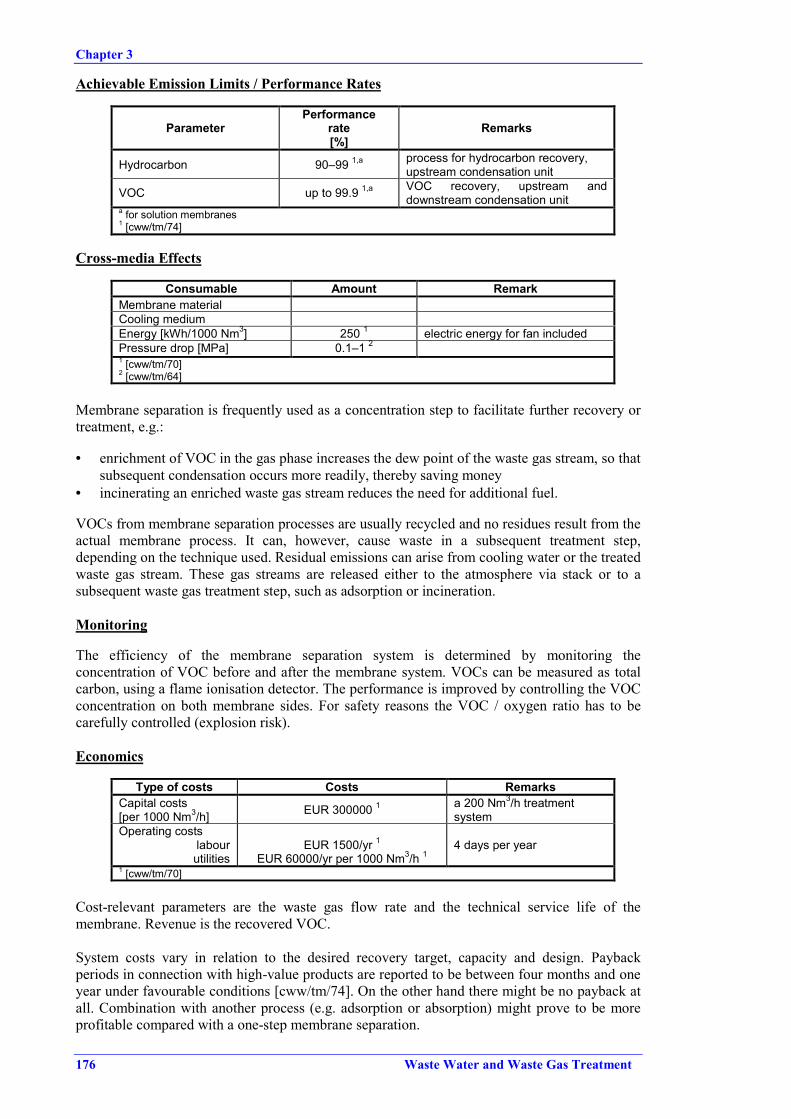
Chapter 3
176 Waste Water and Waste Gas Treatment
Achievable Emission Limits / Performance Rates
ParameterPerformance
rate[%]
Remarks
Hydrocarbon 90–99 1,a process for hydrocarbon recovery,upstream condensation unit
VOC up to 99.9 1,a VOC recovery, upstream anddownstream condensation unit
a for solution membranes1 [cww/tm/74]
Cross-media Effects
Consumable Amount RemarkMembrane materialCooling mediumEnergy [kWh/1000 Nm3] 250 1 electric energy for fan includedPressure drop [MPa] 0.1–1 21 [cww/tm/70]2 [cww/tm/64]
Membrane separation is frequently used as a concentration step to facilitate further recovery ortreatment, e.g.:
• enrichment of VOC in the gas phase increases the dew point of the waste gas stream, so thatsubsequent condensation occurs more readily, thereby saving money
• incinerating an enriched waste gas stream reduces the need for additional fuel.
VOCs from membrane separation processes are usually recycled and no residues result from theactual membrane process. It can, however, cause waste in a subsequent treatment step,depending on the technique used. Residual emissions can arise from cooling water or the treatedwaste gas stream. These gas streams are released either to the atmosphere via stack or to asubsequent waste gas treatment step, such as adsorption or incineration.
Monitoring
The efficiency of the membrane separation system is determined by monitoring theconcentration of VOC before and after the membrane system. VOCs can be measured as totalcarbon, using a flame ionisation detector. The performance is improved by controlling the VOCconcentration on both membrane sides. For safety reasons the VOC / oxygen ratio has to becarefully controlled (explosion risk).
Economics
Type of costs Costs RemarksCapital costs[per 1000 Nm3/h] EUR 300000 1 a 200 Nm3/h treatment
systemOperating costs
labourutilities
EUR 1500/yr 1EUR 60000/yr per 1000 Nm3/h 1
4 days per year
1 [cww/tm/70]
Cost-relevant parameters are the waste gas flow rate and the technical service life of themembrane. Revenue is the recovered VOC.
System costs vary in relation to the desired recovery target, capacity and design. Paybackperiods in connection with high-value products are reported to be between four months and oneyear under favourable conditions [cww/tm/74]. On the other hand there might be no payback atall. Combination with another process (e.g. adsorption or absorption) might prove to be moreprofitable compared with a one-step membrane separation.

Chapter 3
Waste Water and Waste Gas Treatment 177
3.5.1.2 Condensation
Description
Condensation is a technique that eliminates solvent vapours from a waste gas stream byreducing its temperature below its dew point.
There are different methods of condensation, depending on the operating temperature range:
• coolant condensation, down to condensation temperature of about 25 °C• refrigerant condensation, condensation temperature down to about 2 °C• brine condensation, condensation temperature down to about -10 °C• ammonia brine condensation, condensation temperature down to about -40 °C (one-stage)
or -60 °C (two-stage)• cryogenic condensation, condensation temperature down to about -120 °C, in practice often
operated between -40 and -80 °C in the condensation device• closed-cycle inert gas condensation.
Condensation is carried out by means of direct (i.e. contact between gas and cooling liquid) orindirect cooling (i.e. cooling via heat exchanger). Indirect condensation is preferred becausedirect condensation needs an additional separation stage. Recovery systems vary from simple,single condensers to more complex, multi-condenser systems designed to maximise energy andvapour recovery [cww/tm/71].
Closed-cycle inert gas condensation is designed for closed-cycle systems together with highvapour concentrations. A fixed volume of inert gas – generally nitrogen – is continuouslyrecycled around the oven and the condensation unit. A proportion of the nitrogen/vapourmixture is continuously drawn into the recovery module, where a series of heat exchangerscools and condenses the vapours [cww/tm/71].
The design and operation of condensers are highly dependent on the cooling medium used inthe process. Some examples are:
• Devices for liquid-cooled (i.e. not cryogenic) condensation are operated with two types ofheat exchangers:
Conventional shell-and-tube heat exchanger [cww/tm/71], which is either water-cooledor air-cooled. The condensation efficiency can be improved by two-stage operation, usingwater in the first stage and refrigerated liquid (water, brine etc.) as cooling medium in thesecond stage. Such a two-stage system consists of (see Figure 3.49 [cww/tm/71]):
• the recuperator, using the cold purified gas stream as chilling agent• the pre-cooler for further cooling, using chilled water or the cold purified gas stream• the main refrigerator condenser• vents and ducts.
Another option involves partial condensation at a slightly higher temperature followed byremoval of the remaining VOC from the gas stream by a different technique, such asadsorption (see Section 3.5.1.3).
To minimise fog formation, a series of condensers can be used, as well as a demistersupported by gas velocity reduction in the condenser.

Chapter 3
178 Waste Water and Waste Gas Treatment
Recuperator,using coldpurified air
Pre-coolerusing chilledwater or coldpurified air
Refrigeratedcondenser
Solvent-
laden air
Capturedsolvent
Figure 3.49: Two-Stage Condensation System
Spiral heat exchanger [cww/tm/71], basically consisting of two long strips of platewrapped to form a pair of concentric spiral passages. The cooling medium enters through aperipheral nozzle, spirals to the centre and exits, via a pipe, to a nozzle on the periphery.Process vapours enter through the bottom of the condenser and flow upwards in cross-flow.
If cooling towers are included and/or surface water is used, the heat exchangers can tend tofouling, which requires flushing programmes and/or cooling water treatment.
In the presence of acidic or alkaline components, a recirculation system containing acid oralkali dosage might be considered.
• Cryogenic condensation is operated, using the vaporisation of liquid nitrogen as coolantmedium, to condense VOC vapour at the condenser surface. The evaporated nitrogen isused to provide inert blanketing. A variant is condensation under inert atmosphere, i.e.nitrogen, to enable the gas stream to contain higher concentrations of VOC. Examples ofcryogenic condensation are given in Figure 3.50 and Figure 3.51 [cww/tm/71].
Figure 3.50: Cryogenic Condensation Recovery System Integral with a Typical NitrogenBlanketing Operation

Chapter 3
Waste Water and Waste Gas Treatment 179
Figure 3.51: Cryogenic Recovery System under Inert Atmosphere
The cryogenic condensation system consists of:
- the pre-condenser, using chilled water or glycol- the main process condenser(s)- the process economiser- the nitrogen economiser- the nitrogen vaporiser- the necessary vents and ducts.
• A typical closed-cycle inert gas condensation system consists of (see Figure 3.52[cww/tm/71]):
- the heat exchanger, pre-cooling the gas stream- the main condenser, mechanically refrigerated to as low as -40 ºC- the solvent separator, the nitrogen supply.
Application
Coolant condensation
Coolant condensation is applied to more or less saturated gas streams (i.e. high dew point) ofvolatile compounds (organic and inorganic) and odorous substances, the latter being removedfrom a water-saturated gas stream where the condensed water acts as absorbant (provided theyare soluble in water).
An essential application of coolant condensation is pretreatment or post-treatment for upstreamor downstream waste gas treatment facilities. The removal of the main VOC load relievestreatment facilities such as adsorbers (see Section 3.5.1.3), scrubbers (see Section 3.5.1.4),incinerators (see Section 3.5.2.4). On the other hand, condensation is a suitable post-treatmentfor enriched gas streams from, e.g. membrane separation (see Section 3.5.1.1) or waste waterstripping (see Section 3.3.4.2.14) and distillation (see Section 3.3.4.2.12).

Chapter 3
180 Waste Water and Waste Gas Treatment
Figure 3.52: Typical Closed-cycle Inert Gas Condensation System
Application limits and restrictions are [cww/tm/70]:
Limits / restrictionsGas flow 100–100000 Nm3/hIncoming gas temperature 50–80 °CWater content gas needs to be essentially water-free
when condensation below 0 °CPressure atmosphericDust <50 mg/Nm3 (non sticky)Odour >100000 ou/Nm3
Ammonia 200–1000 mg/Nm3
Cryogenic condensation
Cryogenic condensation can cope with all VOC and volatile inorganic pollutants, irrespective oftheir individual vapour pressures. The applied low temperatures allow very high condensationefficiencies in such a way that it is well suited as final VOC emission control. On the otherhand, temperatures below the freezing point of water require an essentially water-free gas feed.It is able to respond instantly to changes in VOC flow rate and solvent loading and can recovervirtually any VOC species even under varying conditions. This flexibility makes it particularlysuitable for VOC control in multi-product, multi-purpose plants where batch or continuousprocesses are employed [cww/tm/150].

Chapter 3
Waste Water and Waste Gas Treatment 181
Application limits and restrictions are:
Limits / restrictionsGas flow up to 5000 Nm3/hIncoming gas temperature up to 80 °CPressure 2–600 kPa 11 [cww/tm/70]
Advantages/Disadvantages
Advantages DisadvantagesCoolant condensation• Compact technology.• Good process handling, emissions can at least
be calculated approximately.• Downstream treatment facilities are relieved of
high loads and can therefore be operated moreeconomically.
• Solvent recovery, provided the gas stream doesnot contain a VOC mixture difficult toseparate.
• Heat recovery is possible.
Coolant condensation• The amount of cooling water is an issue in
regions with water deficiency.• Efficiency considerably dependent on gas flow
rate and composition.• Subsequent work-up and/or treatment step
necessary.
Cryogenic condensation• Compact technology.• Recovery of organic solvents, provided they
can be separated from the condensed mixture.• High VOC removal efficiency.• Nitrogen gas is recycled.• Good process handling possible, emissions can
at least be calculated approximately.
Cryogenic condensation• Not suitable for wet gas streams because of ice
formation that impedes heat transfer.• Need for nitrogen generation facility, or
instead external delivery of nitrogen• Coolants below 0 °C can cause ice formation
on heat exchanger.
Achievable Emission Levels / Performance Rates
Coolant condensation
ParameterPerformance
rate[%]
Emission level[mg/Nm3] Remarks
Odour 60–90 1 initially > 100000 ou/Nm3
Ammonia 20–60 1 initially 200-1000 mg/Nm3
1 [cww/tm/70]
Cryogenic condensation
ParameterPerformance
rate[%]
Emission level[mg/Nm3] Remarks
Dichloromethane <20-<40 1 at –95 °C, initially20-1000 g/Nm3
Toluene <100 1 at –65 °C, initially20-1000 g/Nm3
Methyl ethyl ketone(MEK) <150 1 at –75 °C, initially
20-1000 g/Nm3
Acetone <150 1 at –86 °C, initially20-1000g/Nm3
Methanol <150 1 at –60 °C, initially20-1000 g/Nm3
VOC 1000–5000 1 initially 200–1000 g/Nm3
1 [cww/tm/70]

Chapter 3
182 Waste Water and Waste Gas Treatment
Cross-media Effects
Coolant condensation
Consumable Amount RemarksCooling medium (air, water, brine,ammonia-brine)
highly dependent onindividual application
Energy [kWh/1000 Nm3] vents, pumps, coolingfacilities
Pressure drop [kPa] 0.1–0.2 11 [cww/tm/70]
The quantity of waste water generated by the condensation facility is directly proportional to theamount of condensate, which in turn is directly proportional to the moisture content and thechosen cooling temperature. Typical ranges of condensate contents are:
• condensation of VOC: 200–1000 mg/l COD• condensation of ammonia / amines: 400–2000 mg/l Kjeldahl-N.
Cryogenic condensation
Consumable Amount Remarks
Nitrogen as cooling medium 10–15 kg/kW cooling 1 depends on plant design,solvent type, etc.
Energy [kWh/1000 Nm3] 70 input at 80 °C, output at–70 °C
Pressure drop [kPa] 2–5 21 [cww/tm/71]2 [cww/tm/70]
Further consumables are:
• steam as thawing agent, when a condenser is frozen because of moisture in the waste gasstream
• moisture-free compressed air for pneumatic operations.
The condensate can be re-used, reprocessed or disposed of.
The consumption of liquid nitrogen is divided into:
• stand-by processing (to keep the temperature)• cooling of the incoming gas stream to condensation.
There are still moderately high VOC concentrations after condensation processes, which mayrequire further treatment (e.g. adsorption, or incineration).
Inert gas cycle condensation
Consumable Amount RemarksNitrogen as inert gas, for emer-gency purges and/or refrigeration 1–2 tonnes/day 1
Energy [kWh/1000 Nm3] vents, pumping, coolingfacilities
Pressure drop [kPa]1 [cww/tm/71]

Chapter 3
Waste Water and Waste Gas Treatment 183
Monitoring
The efficiency of the condensation system as an air cleaning system may be determined bymonitoring the concentration of the solvent vapours before and after. VOCs can be measured astotal carbon, excluding particulate matter, using a flame ionisation detector. Abatementefficiencies for odorous emissions are determined by taking grab samples at appropriatesampling points and subsequently analysing them by olfactometry. Cryogenic systems requirepressure drop monitoring.
Cryogenic systems use standard programmable logic controllers to control nitrogenrequirements for cooling. Automatic operation of the plant should be possible, provided alarmsare set as required and routine checks are carried out by operators during each shift.
Additionally, in inert gas cycle systems, oxygen analysis is carried out to ensure that an inertatmosphere of less than 5 % oxygen is maintained – for safety reasons – in the oven ventstream. If the oxygen content is too high, nitrogen is injected to restore the inert atmosphere[cww/tm/71].
Economics
CostsType of cost Coolant condensation Cryogenic
condensationClosed-cycle inertgas condensation
Capital costs a EUR 5000 b 1 EUR 500000 c 1
Operating costs:labour costs 2 hours per week
+ 1 staff-day per year 11 staff-day per week 1
a per 1000 Nm3/hb excluding pumps, pipes, cooling towerc excluding secondary techniques and nitrogen storage1 [cww/tm/70]
Revenue is the recovered VOC.
Cost factors [cww/tm/71]:
Factors Influence / resultsEmission flow rate overall size of the system,
utility requirementRequired temperature reduction, i.e. coolingload
equipment costs (directly proportional),supply of cooling agent (directly propor-tional)
Solvent mixtures complexity of downstream separationtechniques (directly proportional),energy intensity of separation techniques(directly proportional)
Solvent solubility complexity of downstream separationtechniques (directly proportional),energy intensity of separation techniques(directly proportional)

Chapter 3
184 Waste Water and Waste Gas Treatment
Retrofittability [cww/tm/71]:
Coolant condensation Cryogenic condensation Closed-cycle inert gascondensation
readily retrofittable whencooling water is available,with the heat exchangersbeing positioned nearby or ontop of the relevant piece ofequipment
can be skid-mounted,may replace any existingnitrogen vaporisers,should be installed near aliquid nitrogen source tominimise the length ofcryogenic pipeline,systems can either be retro-fitted to existing plants orintegrated into new plants
are difficult to retrofit ontoexisting production plants;they are more suited to newplants
3.5.1.3 Adsorption
Description
Adsorption is a heterogeneous reaction in which gas molecules are retained on a solid surface(adsorbent) that prefers specific compounds to others and thus removes them from effluentstreams. When the surface has adsorbed nearly as much as it can, the adsorbed content isdesorbed as part of regenerating the adsorbent. When desorbed, the contaminants are usually ata higher concentration and can either be recovered or abated (destroyed) [cww/tm/135].
Major types of adsorption systems are:
• fixed-bed adsorption• fluidised-bed adsorption• continuous moving-bed adsorption• pressure-swing adsorption (PSA).
Fixed-bed adsorption processes (see Figure 3.53 [cww/tm/71]) are widely used. Waste gas,exhausted air, etc. are conditioned upstream by cooling, partial condensation of water vapourand heating to reduce the relative humidity to minimise the co-adsorption of water. The gas isfed at about 40 °C to the adsorber, passes upwards and leaves purified. To allow regeneration,adsorbers are normally operated as multiple (2 or 3) bed facilities, i.e. one bed is loaded, theother regenerated and, optionally, a third bed is in stand-by mode. A twin bed adsorptionprocess is illustrated in Figure 3.53.
Figure 3.53: Typical Twin Bed Adsorption Process

Chapter 3
Waste Water and Waste Gas Treatment 185
Fluidised-bed processes (see Figure 3.54 [cww/tm/132]) use the gas velocity (mainly in therange of 0.8–1.2 m/s) to maintain the adsorbent in a fluidised state. These systems requireattrition-resistant adsorbent beads. They are operated with continuous adsorption / desorption,the adsorbent regenerated in a heat exchanger underneath the adsorber and subsequentlyreturned pneumatically to the fluidised bed.
With Continuous moving-bed processes (see Figure 3.55 [cww/tm/71]) the adsorbent iscontinuously fed on top of the adsorber, passing the gas stream in counter-current. The saturatedadsorbent at the bottom of the vessel is continuously transferred to a moving-bed regenerator.
Pressure-swing adsorption (PSA) can separate gases or vapours in a waste gas mixture andsimultaneously regenerate the adsorbent. It consists of four steps:
Step 1: pressure is built up by the gas streaming into the adsorberStep 2: adsorption at high pressure and hence production of pure componentsStep 3: depressurisationStep 4: purging at low pressure or under vacuum.
This four-step process causes a separation of components according to their bond strength to theadsorbent. With downstream treatment facilities this technique improves the ability of waste gasmixtures to be recovered and re-used.
Figure 3.54: Fluidised-Bed Adsorptiona) regenerated adsorbent, b) fluidised bed, c) inert gas, d) fan, e) separator
Typical adsorbents are, e.g. [cww/tm/71]:
• granular activated carbon (GAC), the most common adsorbent with a wide efficiency rangeand not restricted to polar or non-polar compounds; GAC can be impregnated with, e.g.oxidants such as potassium permanganate or with sulphur compounds (improving retentionof heavy metals) [cww/tm/70]

Chapter 3
186 Waste Water and Waste Gas Treatment
• zeolites, properties depending on its manufacture, working either as mere molecular sieves,selective ion exchanger or hydrophobic VOC adsorber
• macroporous polymer particles, which are used as granules or beads, not being highlyselective with respect to VOC
• silica gel• sodium-aluminium silicates.
Besides the continuous and simultaneous regeneration methods described above, there areseveral methods to regenerate the adsorbent of fixed-bed adsorbers:
• thermal-swing regeneration• vacuum regeneration• PSA, described above.
Figure 3.55: Continuous Moving Bed Adsorption and Desorption
Thermal-swing regeneration uses several heat sources:
• steam, as the most common• microwaves• embedded heaters• heated gas, the use of an inert hot gas for safety reasons with GAC as adsorbent.
Superheated steam is passed downward through the adsorbent and thus carries the loadedcompounds down to a condensation and separation unit, such as gravity separators or distillationfacilities. Superheated steam is the main regeneration method for GAC, but heated inert gasesare also applied. Zeolites can be regenerated by hot air streams. Polymer adsorbers allow muchlower regeneration temperatures for steam or hot gas (about 80 °C).

Chapter 3
Waste Water and Waste Gas Treatment 187
Vacuum regeneration enables desorption at ambient adsorbent temperature, which is suitableto recover and re-use vulnerable substances. This method is applied to GAC, zeolite andpolymer adsorbents.
Application
The application of adsorption encompasses:
• recovery of VOC (raw material, product, solvent, fuel from filling operations, etc.) for re-use or recirculation, probably as a concentration step to improve the viability of furtherrecovery operations such as membrane separation (see Section 3.5.1.1)
• abatement of pollutants (hazardous substances from production or treatment facilities [e.g.WWTP] such as VOC, odours, trace gases etc.) that cannot be recirculated or otherwiseused, possibly with GAC as adsorbent, not regenerated but incinerated
• as guard filter after final treatment facilities.
The application as abatement technology is not recommended for waste gases with very highVOC concentrations, because the consequent regeneration requirements would adversely affectprofitability. There are normally more suitable techniques.
Adsorption technology is applicable to control, recover, recycle or prepare (for downstreamtreatment) VOC and organic hazardous air pollutant emissions, e.g. emissions from:
• degreasing• paint spraying• solvent extraction• metal foil coating• plastic film coating• paper coating• pharmaceuticals• fuel gas, gasoline, etc.
Application limits and restrictions:
Limits / restrictionsGAC Zeolites Polymers
Gas flow [Nm3/h] 100–100000 1 <100000 1
Temperature [°C] 15–80 1 <250 1
Pressure [MPa] 0.1–2 1 atmospheric 1
VOC content maximum 25 % of LEL maximum 25 % LEL maximum 25 % LELDioxins[ng/Nm3 TEQ] 10–100 1
Relative humidity maximum <70 %as low as possible
1 [cww/tm/70]
Advantages/Disadvantages
Advantages Disadvantages• High efficiency for VOC removal and
recovery.• Simple and robust technology.• High saturation grade of the adsorbent.• Simple installation.• Simple maintenance.
• Particulates in the waste gas stream can causeproblems.
• Mixtures can cause early breakthrough.• Not suitable with wet waste gas streams.• Risk of bed fires (GAC and zeolites, whereas
polymers are operated at lower temperatures).• Potential for polymerisation of unsaturated
organic compounds on GAC.

Chapter 3
188 Waste Water and Waste Gas Treatment
Achievable Emission Levels / Performance Rates
Parameter Performance rate[%]
Emission level[mg/Nm3] Remarks
VOC 80–95 1 GACToluene 90 1 GACOdour 80–95 1 GAC, ZeoliteMercury <0.01-0.05 1 GACHydrogen sulphide 80–95 1 GACDioxins <0.1 ng/Nm3 TEQ 1 GAC1 [cww/tm/70]
Cross-media Effects
Consumables are:
AmountConsumable GAC Zeolite PolymerRemarks
Steam (desorption)[kg/kg solvent regained] 1.5-6 1
Nitrogen gas (hot gas desorp-tion) [Nm3/tonne solvent] 35 1
Cooling water (condensation)[m3/tonne solvent]
35–60 2100–150
for all 3 adsorptiontechniques
Loss of adsorbent[kg/tonne solvent] 0.5–1 2
Pressure drop [kPa] 2–5 2
Energy [kWh/tonne solvent] 35–100 2130–260
1 [cww/tm/71]2 [cww/tm/64]
Steam regeneration produces waste water with relatively high loads of contaminants which hasto be discharged to a waste water treatment. When there is no regeneration, the adsorbent has tobe disposed of, i.e. normally transferred to incineration, a route that is not suitable for mercury-loaded adsorbent. Regeneration and/or disposal of adsorbent can also be done by externalcompanies.
Further downstream gas treatment can be necessary, depending on legal requirements.
Since all adsorption processes are exothermic, they cause a temperature rise, which is notdesirable for the adsorption of organic compounds. Carbon or metals on GAC as well as zeolitescan catalyse the oxidation of some components when the adsorbent is hot, resulting in bed fireswhich also consume part or all of GAC, but not of zeolite. This is a hazard when adsorbingcertain hydrocarbons (such as ketones or comparable active compounds) at ambienttemperatures that are close to those that cause the organic compound to oxidise. Such a GACbed fire can either alter the pore size of the remainder of the bed, or oxidise the bed to ash,which means a serious incident that may burn down the whole facility. These fires may besuppressed by humidification of the air and by intentional cooling of the GAC.
Monitoring [cww/tm/79]
The abatement efficiency of the system is determined by monitoring the concentration ofVOC/odour before and afterwards. VOCs can be measured as total carbon (excludingparticulate matter), using a flame ionisation detector. A qualitative analysis of the emissions canbe carried out if grab samples of gas are taken at selected sampling points and are subsequentlyanalysed by GC/MS or GC/FID. Abatement efficiencies for odorous emissions are determinedby taking grab samples at appropriate sampling points and subsequently analysing them byolfactometry.

Chapter 3
Waste Water and Waste Gas Treatment 189
The most important measurement is the pressure drop across the dust filters and across theadsorbent bed. Across the filters the pressure should rise steadily after renewal or cleaning. Toorapid a rise gives warning of too high a pressure drop later on due to an abnormal dust load.
Across the bed the pressure should remain roughly constant. Any increase indicates either dustbypassing the dust filter or adsorbent dust from granule breakdown. There should also be analarm for high pressure.
Temperature monitoring of the gas outlet of the GAC adsorber is required to prevent fire risk.
Adsorption systems are typically controlled by a programmable logic controller, with newsystems based on breakthrough sequencing of the beds. When the emission level from anoperating bed reaches a pre-set level, the beds are switched over and regeneration starts. This isenergy efficient as desorption is always performed on a saturated bed.
Subject to consideration of flammable hazards, control systems can be designed to allow asolvent concentration of up to 25 % of the LEL. This minimises both fan power and steamconsumption. If flow rates and solvent loading are variable, power requirements can beoptimised by fitting control dampers or variable speed drives for the fan. [cww/tm/71]
Economics
Type of cost GAC Zeolite Polymer Remarks
EUR 5000-10000 1 excluding regenerationCapital[per 1000 Nm3/h] EUR 240000 1 including regeneration a
Operating costsUtilities
Consumables EUR 600–1300 pertonne GAC including disposal
a facility for 1000 Nm3/h1 [cww/tm/70]
Cost factors [cww/tm/71]:
Factors Influence / resultsEmission flow rate Overall size of the system,
utility requirementSolvent adsorption efficiency, solventconcentration
Quantity of adsorbent required
Solvent type Choice of adsorbentSolvent solubility Complexity of downstream separation
techniques (directly proportional tosolubility),energy intensity of separation techniques(directly proportional)
Solvent mixtures Complexity of downstream separationtechniques (directly proportional),energy intensity of separation techniques(directly proportional)
Solvent solubility Complexity of downstream separationtechniques (directly proportional),energy intensity of separation techniques(directly proportional)
Solvent loading Use of utilities (steam) in adsorption / de-sorption cycle and rate of adsorbent de-gradation
Presence of impurities Reducing lifetime of adsorbentEase of solvent desorption Desorption temperature

Chapter 3
190 Waste Water and Waste Gas Treatment
Retrofittability [cww/tm/71]:
GAC Zeolite PolymerProvided sufficient space is available, retrofitting an adsorption system to an existingmanufacturing process is generally straightforward. The space requirement of a continuousadsorption/desorption unit is approximately 25 % that of a two-bed adsorber system.
3.5.1.4 Wet Scrubbers for Gas Removal
Description
Wet scrubbing (or absorption) is a mass transfer between a soluble gas and a solvent – oftenwater – in contact with each other. Physical scrubbing is preferred for chemicals recovery,whereas chemical scrubbing is restricted to removing and abating gaseous compounds. Physico-chemical scrubbing takes an intermediate position. The component is dissolved in the absorbingliquid and involved in a reversible chemical reaction, which enables the recovery of the gaseouscomponent [cww/tm/132].
The major waste gas treatment applications of scrubbing processes are:
• removal of gaseous pollutants, such as hydrogen halides, SO2, ammonia, hydrogen sulphideor volatile organic solvents
• removal of SO2 or hydrogen halides• but also removal of dust with certain types of scrubbers (see Section 3.5.3.4)
Depending on the pollutants to be removed, several aqueous scrubbing liquids are used:
• water, to remove solvents and gases such as hydrogen halides or ammonia, with the mainaim to recover and re-use these contaminants
• alkaline solutions, to remove acid components such as hydrogen halides, sulphur dioxide,phenols, chlorine; also used for second-stage scrubbing to remove residual hydrogen halidesafter first-stage aqueous absorption; biogas desulphurisation
• alkaline-oxidation solutions, i.e. alkaline solutions with sodium hypochlorite, chlorinedioxide, ozone or hydrogen peroxide
• sodium hydrogensulphite solutions, to remove odour (e.g. aldehydes)• Na2S4 solutions to remove mercury from waste gas• acidic solutions, to remove ammonia and amines• monoethanolamine and diethanolamine solutions, suitable for the absorption and recovery
of hydrogen sulphide.
Various types of scrubbers are operated, e.g.:
• fibrous packing scrubber• moving bed scrubber• packed bed scrubber• impingement plate scrubber• spray tower.
Their choice depends on the
• requirement for performance efficiency• energy need• reagents• properties of the waste gas stream.

Chapter 3
Waste Water and Waste Gas Treatment 191
An optimum design of scrubbing systems to achieve low exit concentrations includes highreliability, automatic operation and counter-current flow of liquid and gas. Scrubbers arenormally operated with pre-coolers (e.g. spray chambers and quenchers) to lower the inlet gastemperature and simultaneously saturate the gas stream, thus avoiding reduced absorption ratesand solvent evaporation. Such additional devices exert low pressure drops.
• Fibrous Packing ScrubberThe fibrous packing scrubber (fibre-bed scrubber) consists of a chamber with gas inlet andoutlet, containing mats of fibrous packing material which are sprayed with liquid. The unitsmay be designed for horizontal or vertical gas flow. Typical fibre materials are glass, plasticand steel. They are used to remove acidic components (hydrogen fluoride, hydrogenchloride, sulphuric acid and chromic acid) and organic/inorganic compounds from effluentgas streams.
The blockage of nozzles, plugging of fibre beds and insufficient irrigation of fibrous matsmight cause problems.
Waste gas streams are often cooled before entering fibrous packing scrubbers to condenseas much of the liquid in the flow as possible and to increase the size of the existing aerosolparticles through condensation. A pre-filter is generally used to remove larger particles fromthe gas stream prior to its entering the scrubber [cww/tm/110].
• Moving-bed ScrubbersMoving-bed scrubbers consist of zones of mobile packing, usually plastic spheres. Thevessel shell contains support grids, on which the packing material is placed, inlets andoutlets for gas scrubbing liquor and a mist eliminator. Moving-bed scrubbers are applied toremove sulphur dioxide, hydrogen fluoride and odours. They are also used to treat wastegases that contain dust and when scale might be formed. A typical device is shown inFigure 3.56 [cww/tm/79].
Figure 3.56: Moving-bed Scrubber
Moving-bed scrubbers are packed with low-density plastic spheres that are free to movewithin the support grids. These scrubbers are less susceptible to plugging because thespherical, hollow plastic balls are kept in a constant state of agitation and fluidisation. Thecolumn mobile packing resists clogging. This constant movement and the smooth surface ofthe balls prevent scale from adhering to the packing.
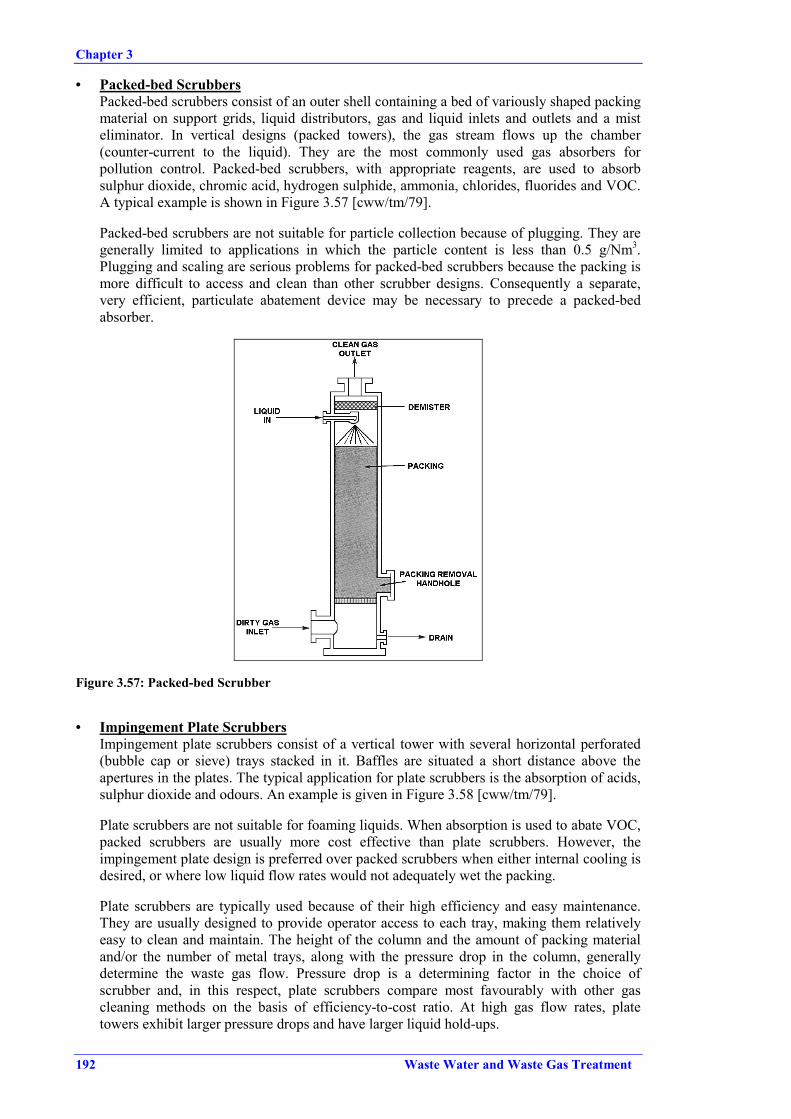
Chapter 3
192 Waste Water and Waste Gas Treatment
• Packed-bed ScrubbersPacked-bed scrubbers consist of an outer shell containing a bed of variously shaped packingmaterial on support grids, liquid distributors, gas and liquid inlets and outlets and a misteliminator. In vertical designs (packed towers), the gas stream flows up the chamber(counter-current to the liquid). They are the most commonly used gas absorbers forpollution control. Packed-bed scrubbers, with appropriate reagents, are used to absorbsulphur dioxide, chromic acid, hydrogen sulphide, ammonia, chlorides, fluorides and VOC.A typical example is shown in Figure 3.57 [cww/tm/79].
Packed-bed scrubbers are not suitable for particle collection because of plugging. They aregenerally limited to applications in which the particle content is less than 0.5 g/Nm3.Plugging and scaling are serious problems for packed-bed scrubbers because the packing ismore difficult to access and clean than other scrubber designs. Consequently a separate,very efficient, particulate abatement device may be necessary to precede a packed-bedabsorber.
Figure 3.57: Packed-bed Scrubber
• Impingement Plate ScrubbersImpingement plate scrubbers consist of a vertical tower with several horizontal perforated(bubble cap or sieve) trays stacked in it. Baffles are situated a short distance above theapertures in the plates. The typical application for plate scrubbers is the absorption of acids,sulphur dioxide and odours. An example is given in Figure 3.58 [cww/tm/79].
Plate scrubbers are not suitable for foaming liquids. When absorption is used to abate VOC,packed scrubbers are usually more cost effective than plate scrubbers. However, theimpingement plate design is preferred over packed scrubbers when either internal cooling isdesired, or where low liquid flow rates would not adequately wet the packing.
Plate scrubbers are typically used because of their high efficiency and easy maintenance.They are usually designed to provide operator access to each tray, making them relativelyeasy to clean and maintain. The height of the column and the amount of packing materialand/or the number of metal trays, along with the pressure drop in the column, generallydetermine the waste gas flow. Pressure drop is a determining factor in the choice ofscrubber and, in this respect, plate scrubbers compare most favourably with other gascleaning methods on the basis of efficiency-to-cost ratio. At high gas flow rates, platetowers exhibit larger pressure drops and have larger liquid hold-ups.

Chapter 3
Waste Water and Waste Gas Treatment 193
Figure 3.58: Impingement Plate Scrubber
The chemical absorption of noxious gaseous contaminants such as sulphur dioxide, chlorineand hydrogen sulphide can be achieved by contacting the air stream with suitable chemicalson the plates. Packed columns, however, are preferred to plate towers when acids and othercorrosive materials are involved because tower construction can then be of fibreglass, PVC,or other less costly corrosive-resistant materials.
• Spray TowersSpray towers (or spray scrubbers) consist of spray nozzles at the top of the tower, throughwhich the scrubbing liquid enters, and a gas inlet near the bottom. Generally the waste gasstream passes up the tower counter-current to the liquid flow. The typical application forspray towers is to remove acid gases and odours. An example is shown in Figure 3.59[cww/tm/79].

Chapter 3
194 Waste Water and Waste Gas Treatment
Figure 3.59: Spray Tower, (a) Counter-Current, (b) Co-Current
Plugging of spray nozzles might cause problems.
Spray towers are the traditional wet scrubber configurations used to bring waste gases intocontact with a sorbent. They exert, however, the least effective mass transfer capability andso are generally limited to the removal of highly soluble gases.
Typical pollutant concentrations range from 100 to 10000 mg/Nm3. Spray tower wetscrubbers are not as prone to fouling as packed scrubbers, but very high liquid-to-gas ratios(>3 l/m3) are required to capture fine particulate.
When absorbed gases are to be recovered, an additional desorption step is necessary. The usualmethod of desorption / regeneration of the organic content is distillation or steam stripping,transferring the gaseous content back to the gaseous phase. With stripping as regeneration, thestripped gas is subsequently condensed and collected. The condensate is either re-used directlyin the process or segregated into its components by, e.g. distillation. Stripping and distillationare carried out at reduced pressure in order to reduce the temperature and minimise thedegradation risk of the organic compounds [cww/tm/71].
A typical absorption / desorption system is shown in Figure 3.60 [cww/tm/71]. The vacuumdesorption, as described in Figure 3.60, is not the general case, but an option. It makes it easierto boil the scrubbing liquid (solvent), but makes its condensation more difficult.

Chapter 3
Waste Water and Waste Gas Treatment 195
Figure 3.60: Typical Absorption / Desorption System
Application
Absorption is widely used as a raw material and/or product recovery technique for separationand purification of gaseous streams containing high concentrations of VOC, especiallycompounds soluble in water – such as alcohols, acetone or formaldehyde. The use of absorptionas the primary control technique for organic vapours is subject to the availability of a suitablesolvent, with a high solubility for the gas, low vapour pressure and low viscosity.
As a final control technique for emissions, gas scrubbing is commonly employed for inorganiccompounds rather than for VOC. Its suitability as a pollution control method depends on:
• recovery value of the pollutant• the waste water disposal cost• the required removal efficiency• the pollutant concentration in the inlet waste gas• the availability of suitable solvent / chemical reagent.
Absorption is enhanced by:
• larger contacting surface• higher liquid-gas ratios• higher concentrations in the gas stream• lower temperature.
Low outlet gas concentrations will typically be required for hazardous VOC, leading toimpractically tall absorption towers, long contact times and high liquid-gas ratios that may notbe cost-effective. Therefore, wet scrubbers are more effective with hazardous VOC controlwhen used in combination with other control devices, such as GAC adsorbers (seeSection 3.5.1.3) or waste gas incinerators (see Sections 3.5.2.4 and 3.5.2.5).
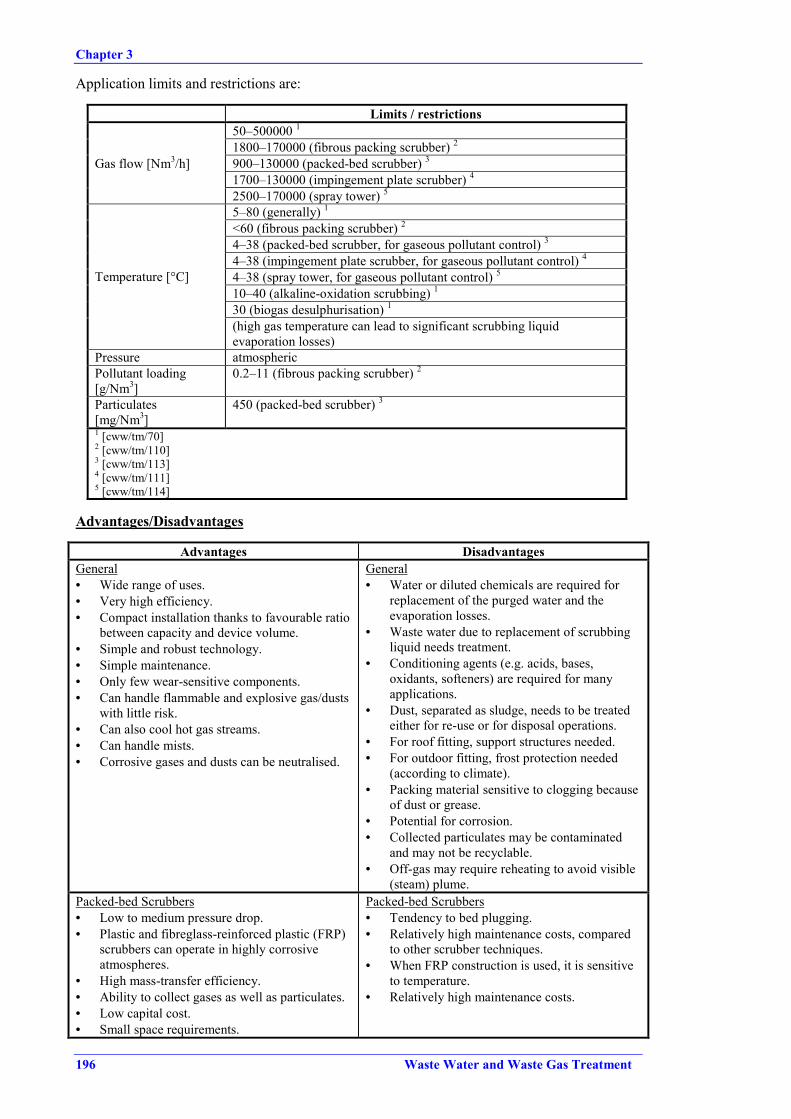
Chapter 3
196 Waste Water and Waste Gas Treatment
Application limits and restrictions are:
Limits / restrictions50–500000 1
1800–170000 (fibrous packing scrubber) 2
900–130000 (packed-bed scrubber) 3
1700–130000 (impingement plate scrubber) 4Gas flow [Nm3/h]
2500–170000 (spray tower) 5
5–80 (generally) 1
<60 (fibrous packing scrubber) 2
4–38 (packed-bed scrubber, for gaseous pollutant control) 3
4–38 (impingement plate scrubber, for gaseous pollutant control) 4
4–38 (spray tower, for gaseous pollutant control) 5
10–40 (alkaline-oxidation scrubbing) 1
30 (biogas desulphurisation) 1
Temperature [°C]
(high gas temperature can lead to significant scrubbing liquidevaporation losses)
Pressure atmosphericPollutant loading[g/Nm3]
0.2–11 (fibrous packing scrubber) 2
Particulates[mg/Nm3]
450 (packed-bed scrubber) 3
1 [cww/tm/70]2 [cww/tm/110]3 [cww/tm/113]4 [cww/tm/111]5 [cww/tm/114]
Advantages/Disadvantages
Advantages DisadvantagesGeneral• Wide range of uses.• Very high efficiency.• Compact installation thanks to favourable ratio
between capacity and device volume.• Simple and robust technology.• Simple maintenance.• Only few wear-sensitive components.• Can handle flammable and explosive gas/dusts
with little risk.• Can also cool hot gas streams.• Can handle mists.• Corrosive gases and dusts can be neutralised.
General• Water or diluted chemicals are required for
replacement of the purged water and theevaporation losses.
• Waste water due to replacement of scrubbingliquid needs treatment.
• Conditioning agents (e.g. acids, bases,oxidants, softeners) are required for manyapplications.
• Dust, separated as sludge, needs to be treatedeither for re-use or for disposal operations.
• For roof fitting, support structures needed.• For outdoor fitting, frost protection needed
(according to climate).• Packing material sensitive to clogging because
of dust or grease.• Potential for corrosion.• Collected particulates may be contaminated
and may not be recyclable.• Off-gas may require reheating to avoid visible
(steam) plume.Packed-bed Scrubbers• Low to medium pressure drop.• Plastic and fibreglass-reinforced plastic (FRP)
scrubbers can operate in highly corrosiveatmospheres.
• High mass-transfer efficiency.• Ability to collect gases as well as particulates.• Low capital cost.• Small space requirements.
Packed-bed Scrubbers• Tendency to bed plugging.• Relatively high maintenance costs, compared
to other scrubber techniques.• When FRP construction is used, it is sensitive
to temperature.• Relatively high maintenance costs.

Chapter 3
Waste Water and Waste Gas Treatment 197
Advantages DisadvantagesImpingement Plate Scrubbers• Flexibility in operating conditions (variation of
flow rate).• High versatility in case of low gas flow-rate, as
they can also operate with low liquid flow.• Provides gas absorption and dust collection in
a single unit.• Improves gas-slurry contact for SO2 removal.• Easy maintenance and operating.
Impingement Plate Scrubbers• Dust build-up around valves and/or on plates.• Higher costs than other wet scrubbers.
Spray Towers• Low pressure drop.• FRP constructions can operate in highly
corrosive atmospheres.• Low energy consumption.• Low capital costs.• Relatively free from plugging.• Relatively small space requirements.• Capable to collect gases as well as particulates.
Spray Towers• Low mass-transfer efficiency.• Low efficiency in removing fine particulates.• When FRP construction is used, sensitive to
temperature.• High operational costs.
Achievable Emission Levels / Performance Rates
ParameterPerformance
rate a[%]
Emission level[mg/Nm3] b Remarks
Alcohols up to 95 1 down to 100 1 water>99 1 <50 1 waterHydrogen fluoride <1 1 alkaline>99 1 <50 1 waterHydrogen chloride <10 1 alkaline
Chromic acid <0.1–1 1 waterAmmonia >99.9 c <1 1 acidAmines >99 1 <1 1 acidSulphur dioxide 80–99 d 2 <40 1 alkalinePhenols >90 alkaline
90–95 1 alkalineHydrogen sulphide 80->99 h 5
Inorganic compounds 95–99 d,f,h 2,3,5
50–95 d,e 2VOC 70->99 f,g 3,4
a high feed concentrationb low feed concentrationc feed concentration 25 g/Nm3 ammonia, effluent concentration <10 mg/Nm3
d spray tower, several reagentse may achieve > 99 %f packed-bed scrubberg fibrous packing scrubberh impingement plate scrubber1 [cww/tm/70]2 [cww/tm/114]3 [cww/tm/113]4 [cww/tm/110]5 [cww/tm/111]
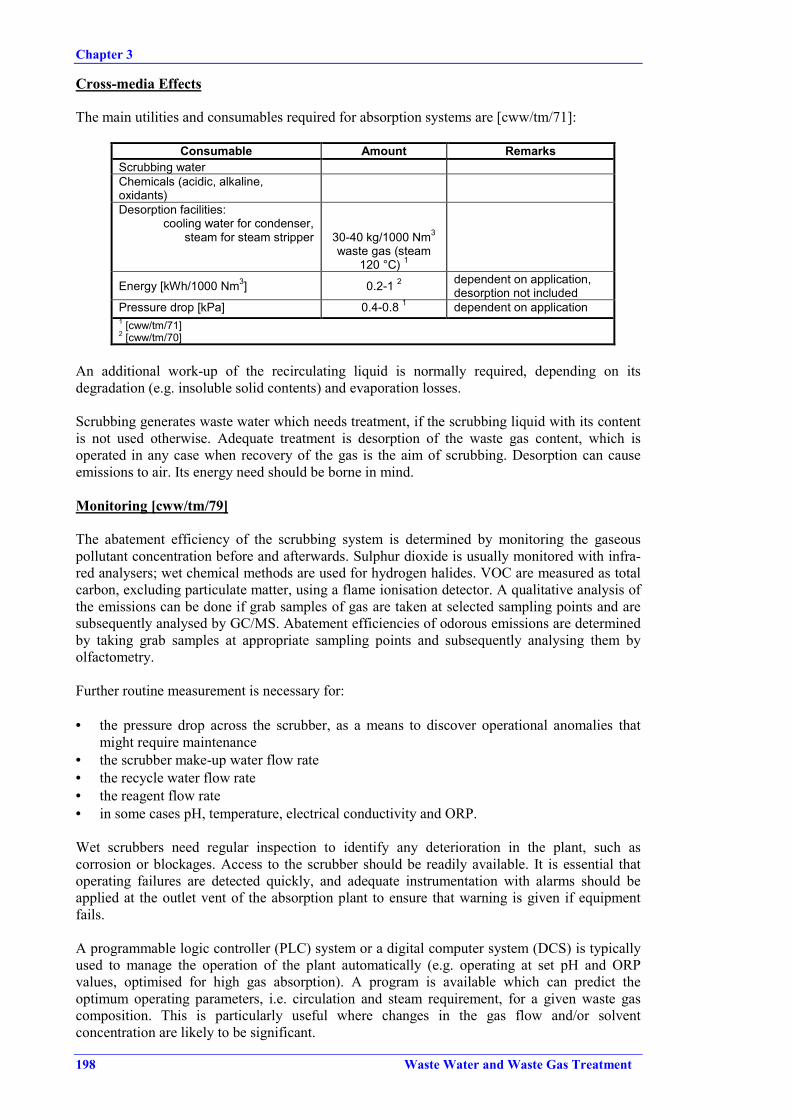
Chapter 3
198 Waste Water and Waste Gas Treatment
Cross-media Effects
The main utilities and consumables required for absorption systems are [cww/tm/71]:
Consumable Amount RemarksScrubbing waterChemicals (acidic, alkaline,oxidants)Desorption facilities:
cooling water for condenser,steam for steam stripper 30-40 kg/1000 Nm3
waste gas (steam120 °C) 1
Energy [kWh/1000 Nm3] 0.2-1 2 dependent on application,desorption not included
Pressure drop [kPa] 0.4-0.8 1 dependent on application1 [cww/tm/71]2 [cww/tm/70]
An additional work-up of the recirculating liquid is normally required, depending on itsdegradation (e.g. insoluble solid contents) and evaporation losses.
Scrubbing generates waste water which needs treatment, if the scrubbing liquid with its contentis not used otherwise. Adequate treatment is desorption of the waste gas content, which isoperated in any case when recovery of the gas is the aim of scrubbing. Desorption can causeemissions to air. Its energy need should be borne in mind.
Monitoring [cww/tm/79]
The abatement efficiency of the scrubbing system is determined by monitoring the gaseouspollutant concentration before and afterwards. Sulphur dioxide is usually monitored with infra-red analysers; wet chemical methods are used for hydrogen halides. VOC are measured as totalcarbon, excluding particulate matter, using a flame ionisation detector. A qualitative analysis ofthe emissions can be done if grab samples of gas are taken at selected sampling points and aresubsequently analysed by GC/MS. Abatement efficiencies of odorous emissions are determinedby taking grab samples at appropriate sampling points and subsequently analysing them byolfactometry.
Further routine measurement is necessary for:
• the pressure drop across the scrubber, as a means to discover operational anomalies thatmight require maintenance
• the scrubber make-up water flow rate• the recycle water flow rate• the reagent flow rate• in some cases pH, temperature, electrical conductivity and ORP.
Wet scrubbers need regular inspection to identify any deterioration in the plant, such ascorrosion or blockages. Access to the scrubber should be readily available. It is essential thatoperating failures are detected quickly, and adequate instrumentation with alarms should beapplied at the outlet vent of the absorption plant to ensure that warning is given if equipmentfails.
A programmable logic controller (PLC) system or a digital computer system (DCS) is typicallyused to manage the operation of the plant automatically (e.g. operating at set pH and ORPvalues, optimised for high gas absorption). A program is available which can predict theoptimum operating parameters, i.e. circulation and steam requirement, for a given waste gascomposition. This is particularly useful where changes in the gas flow and/or solventconcentration are likely to be significant.
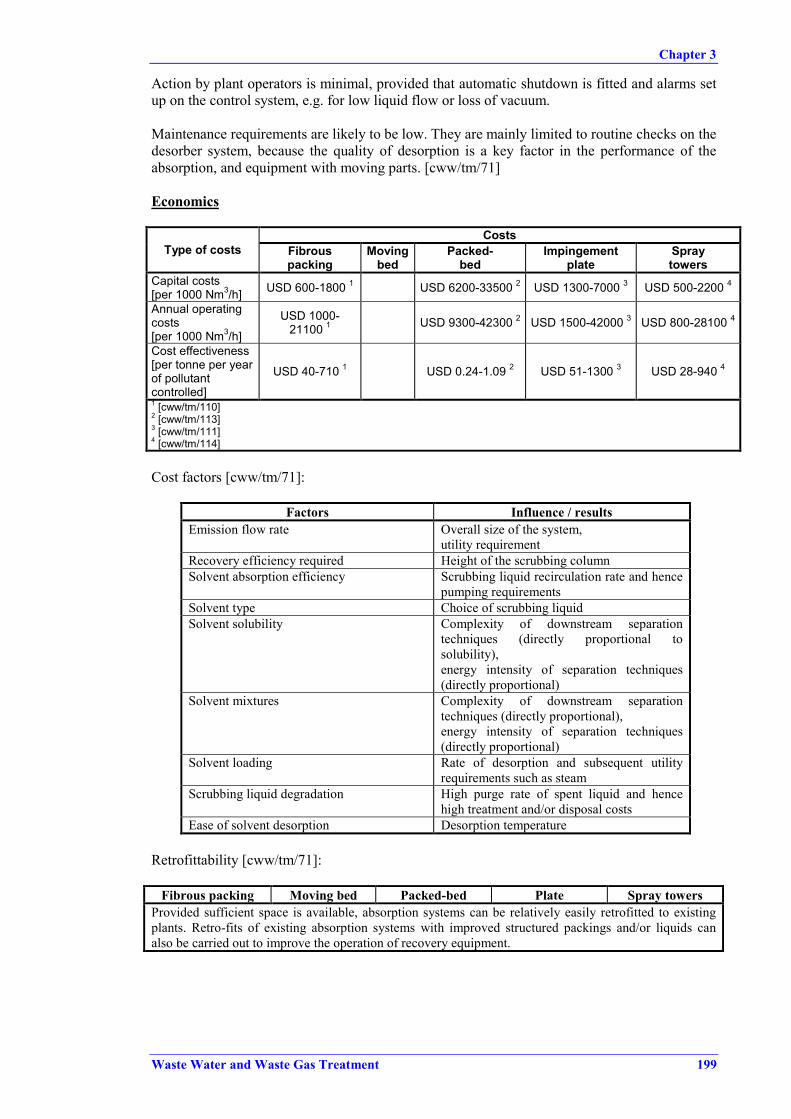
Chapter 3
Waste Water and Waste Gas Treatment 199
Action by plant operators is minimal, provided that automatic shutdown is fitted and alarms setup on the control system, e.g. for low liquid flow or loss of vacuum.
Maintenance requirements are likely to be low. They are mainly limited to routine checks on thedesorber system, because the quality of desorption is a key factor in the performance of theabsorption, and equipment with moving parts. [cww/tm/71]
Economics
CostsType of costs Fibrous
packingMoving
bedPacked-
bedImpingement
plateSpraytowers
Capital costs[per 1000 Nm3/h] USD 600-1800 1 USD 6200-33500 2 USD 1300-7000 3 USD 500-2200 4
Annual operatingcosts[per 1000 Nm3/h]
USD 1000-21100 1 USD 9300-42300 2 USD 1500-42000 3 USD 800-28100 4
Cost effectiveness[per tonne per yearof pollutantcontrolled]
USD 40-710 1 USD 0.24-1.09 2 USD 51-1300 3 USD 28-940 4
1 [cww/tm/110]2 [cww/tm/113]3 [cww/tm/111]4 [cww/tm/114]
Cost factors [cww/tm/71]:
Factors Influence / resultsEmission flow rate Overall size of the system,
utility requirementRecovery efficiency required Height of the scrubbing columnSolvent absorption efficiency Scrubbing liquid recirculation rate and hence
pumping requirementsSolvent type Choice of scrubbing liquidSolvent solubility Complexity of downstream separation
techniques (directly proportional tosolubility),energy intensity of separation techniques(directly proportional)
Solvent mixtures Complexity of downstream separationtechniques (directly proportional),energy intensity of separation techniques(directly proportional)
Solvent loading Rate of desorption and subsequent utilityrequirements such as steam
Scrubbing liquid degradation High purge rate of spent liquid and hencehigh treatment and/or disposal costs
Ease of solvent desorption Desorption temperature
Retrofittability [cww/tm/71]:
Fibrous packing Moving bed Packed-bed Plate Spray towersProvided sufficient space is available, absorption systems can be relatively easily retrofitted to existingplants. Retro-fits of existing absorption systems with improved structured packings and/or liquids canalso be carried out to improve the operation of recovery equipment.

Chapter 3
200 Waste Water and Waste Gas Treatment
3.5.2 Abatement Operations and Processes for VOCs and InorganicCompounds
3.5.2.1 Biofiltration
Description
The waste gas stream is passed through a bed of organic material, such as peat, heather,compost, or some inert material such as clay, charcoal or polyurethane, where it is biologicallyoxidised by naturally occurring micro-organisms into carbon dioxide, water and biomass.
A biofilter is shown in Figure 3.61 [cww/tm/79].
Figure 3.61: Biofilter Construction
Biofilters can be divided into:
• open biofilters• enclosed biofilters.
An open biofilter consists of a layer of porous biofiltering material underlain by a network ofpipes through which the contaminated air is blown to the filter. These filters require a longresidence time and therefore tend to be large. They might be used for low gas rates. Analternative are multi-level biofilters, where several layers set above each other obviate the needfor a large area. In areas with cold climate (frost), the suitability of open biofilters is restricted.
An enclosed biofilter consists of a layer of material supporting a suitable microbial populationand placed under a distribution system which supplies the contaminated waste gas stream to thefilter uniformly. The gas stream is drawn to the filter by electric fans. Gas flow is from top tobottom or vice versa. The blower, ventilation system and biofilter construction materials shouldminimise the effects of corrosive waste gas, excess condensate and dust / sludge.
The majority of operating biofilters are open bed filters, which are less costly than enclosedbiofilters but are less efficient. Hence enclosed filter systems with controlled feed and outflowof off-gas might be preferred. It can be assumed that in many cases open filter systems do notallow a sufficient removal of emissions and often lack the technological features to achieve acomprehensive VOC reduction. Enclosed high-tech biofilters can be upgraded to achieve areduction of a wide range of xenobiotic compounds.
The micro-organisms are enclosed in a fixed bed. The height of the filter material is between 0.5and 1.5 m, with a maximum of two to three layers. The specific load of the filter bed is between100 and 500 Nm3/h per m2 of filter surface. The moisture balance is usually very critical

Chapter 3
Waste Water and Waste Gas Treatment 201
(relative gas moisture of about 95 % and more is required). It is regulated by a pre-connectedhumidifier or gas scrubber, at times in combination with moistening the filter material. Therelative humidity of the filter material should be below 60 % to avoid clogging. The moisteningdevice needs protection against freezing in regions where temperatures considerably below 0 °Care an issue.
For application to warm waste gas streams (>35 ºC) cooling is necessary, either by mixing withair or introducing a gas scrubber or heat exchanger. Wet scrubbing can be applied aspretreatment with the aim of decreasing excessive particulate content, pollutant load andamount of pollutants not suitable for biofiltration.
The residence time to allow an effective abatement of, e.g., odour depends on the pollutantconcentration. As a rough guide, a minimum residence time of 30 to 45 seconds should beaimed for.
The material quality and process operation of biofilter machinery need to offer protectionagainst corrosion. The removal of condensed water from ducts needs to be ensured[cww/tm/46].
A typical biofilter process is shown in Figure 3.62 [cww/tm/64]. It includes a wet scrubber aspretreatment facility.
Application
Biofiltration is used in the chemical and petrochemical industry as well as in sewage treatmentplants. It is an abatement technique that removes readily biodegradable components, such asamines, hydrocarbons, hydrogen sulphide, toluene, styrene and odorous contaminants.Biofiltration is well suited to low concentrations of pollutants easily soluble in water. It isnormally not suited, however, for waste water containing many different and/or changingpollutants. Furthermore, methane is not abated, because the residence time needed would be toolong for normal filter dimensions.
Figure 3.62: Typical Biofilter Process

Chapter 3
202 Waste Water and Waste Gas Treatment
Application limits and restrictions:
Limits / restrictionsGas flow [Nm3/h] 100–400 per m2 of filter surface 1 , up to
200000Temperature [°C] 15–40 2
55, with thermophilic bacteriaPressure atmospheric 2
Oxygen concentration near ambient level 1
Relative humidity [%] >95, nearly saturated with water 1
Content of dust, grease, fat cause clogging, hence pretreatmentnecessary 3
Hydrocarbon concentration[mg/Nm3]
200–2000 2,4
Ammonia • can decrease efficiency of degradationfor hydrocarbons
• can be degraded to N2OOdour concentration [ou/Nm3] 20000–200000 2
Toluene concentration[mg/Nm3]
20–500 2
Styrene concentration[mg/Nm3]
50–500 2
Compounds containing N, S or Cl can acidify and deactivate the biofilterwithout buffer capacity, which bringsabout an increase of replacementfrequency
Climatic conditions frost, rain and high ambient temperatureaffect the filter material and decreaseefficiency
1 [cww/tm/64]2 [cww/tm/70]3 [cww/tm/132]4 comment
Advantages/Disadvantages
Advantages Disadvantages• Simple construction.• In combination with adsorption and absorption
also suitable for barely soluble components.• High efficiency for biodegradable compounds,
e.g. odorous substances.
• Dried-out peat and compost filter beds aredifficult to re-wet.
• Relatively bulky design.• Poisoning and acidification of the biomass
must be avoided.• Fluctuations in the gas stream have a great
impact on performance.• Packing is sensitive to clogging because of
dust.
Achievable Emissions Levels / Performance Rates
Parameter Performance rates[%]
Emission level[mg/Nm3] Remarks
Hydrocarbons 75–95 1 >5 1
Toluene 80–95 1 >5 1
Styrene 80–90 1 >10 1
Odour 75–95 1 >5000 ou/Nm3 1 Odour of biofilter200-500 ou/Nm3
1 [cww/tm/70]
The efficiency of biofiltration depends strongly on the composition of the waste gas stream.

Chapter 3
Waste Water and Waste Gas Treatment 203
Cross Media
The main utilities and consumables are:
Consumable Amount RemarksFilter material a
Chemicals (nutrients, alkali andacidic compounds for pH cor-rection)Water 5 l/1000 Nm3 1
Energy [kWh/1000 Nm3] <1 1
Pressure drop [kPa] 0.5–2 1a service life of filter material depends on its stress by acidification, poisoning, depletion, typically notmore than 1 year1 [cww/tm/70]
With open biofilters the filter material has to be regularly worked-up and disposed of from timeto time. Waste gas channelisation can occur through the filter bed, thereby decreasing thebiofilter efficiency. Since not all VOC sent through the biofilter are biodegradable, there mightbe loaded filter material containing hazardous contaminants that has to be disposed of as waste(incineration). The percolate water that is released from the filter material may contain organicresidues and has to be disposed of. Enclosed biofilters usually recirculate the leachate.
Monitoring
The moisture balance has to be carefully examined because it is a critical item for the accurateoperation of biofilters.
The efficiency may be determined by assessing the inlet and outlet gases, the appropriatemethod depending on the pollutants to abate. Regular pH examination of the percolate waterreleased from the filter bed is required.
Economics
Type of costs Costs RemarksEUR 5000–20000 1[per 1000 Nm3/h]Capital costs ATS 4000–180000 2
[per m3 filter]Operating costs a ATS 10000–20000 2
labour 1 h per week per filter +2 days per year 1
utilitiesconsumables EUR 200 per m3 filter material 1
Maintenance b ATS 5000–300000 2<ATS 1000 c 2
a per year per 1000 Nm3/h capacityb per yearc per year per 1000 Nm3/h capacity1 [cww/tm/70]2 [cww/tm/46]
Operation and maintenance costs are low, because no fuel or chemicals are needed.
Cost-relevant parameters are:
• the waste gas flow rate• the pollutant concentration in the gas stream• the type of component in the gas stream• the required efficiency• the character of the filter material.

Chapter 3
204 Waste Water and Waste Gas Treatment
3.5.2.2 Bioscrubbing
Description
Bioscrubbing combines wet gas scrubbing (absorption) (see Section 3.5.1.4) andbiodegradation, the scrubbing water containing a population of microbes suitable to oxidise thenoxious gas components. The microbes are suspended in water. Hence, the conditions to usebioscrubbers are:
• it ought to be possible to wash out the waste gas constituents• the washed-out constituents must be biodegradable under aerobic conditions.
A bioscrubber is shown in Figure 3.63 [cww/tm/132].
Figure 3.63: Typical Bioscrubber(a) Absorber, (b) Activated Sludge Circulation, (c) Activating Tank
The bioreactor design is founded on an activated sludge or a sludge-on-carrier system (details inSection 3.3.4.3.1). The water sludge mixture is recirculated into the reactor. The absorbedpollutants are degraded in aerated sludge tanks. The scrubbing tower should be designed in sucha way that a contact time of about one second, depending on the contaminants, is provided.
Bioscrubbers are frequently inoculated with activated sludge from, e.g. a biological waste watertreatment plant. Depending on the composition of the waste gas, the performance of thebioscrubber will only attain the desired level after some weeks of adaptation. Inoculation withcultures prepared in fermenters is particularly applied to contaminants that contain sulphur(mercaptans, hydrogen sulphide, dimethyl sulphide, etc.) or chlorine (chlorinated methanes orethanes) [cww/tm/70].
A typical bioscrubber process is shown in Figure 3.64 [cww/tm/64].

Chapter 3
Waste Water and Waste Gas Treatment 205
Figure 3.64: Typical Bioscrubbing Process
Evaporation accompanied by mineralisation and dosage of nutrients and/or neutralisation agentsnormally causes an increase of salt content in the absorbent. This effect might inhibit thebiological process, though it has been found that stable biodegradation rates can be maintained,even with salt concentrations corresponding to a conductivity of up to 5000 µS/cm[cww/tm/53].
Measures to prevent excessive salt formation are, e.g.:
• adequate removal of absorbent and simultaneous addition of fresh water• operation with softened water• vapour saturation of the upstream waste gas.
Compounds containing sulphur, chlorine and/or nitrogen lead to acidification (formation ofsulphuric, hydrochloric or nitric acid), which is corrected by pH control.
A residence time of the absorbent of 20–40 (maximum) days has proved to be appropriate.
Application
Bioscrubbing is used in chemical and petrochemical industry as well as in sewage treatmentplants. It is an abatement technique that removes readily biodegradable components, such asammonia, amines, hydrocarbons, hydrogen sulphide, toluene, styrene and odorouscontaminants. Bioscrubbing is well suited to low concentrations of pollutants easily soluble inwater.
Typical and proven applications of bioscrubbers are illustrated in Table 3.14 [cww/tm/53].

Chapter 3
206 Waste Water and Waste Gas Treatment
Elimina-tion ofodours
Aliphatichydro-
carbons
Aromatichydro-
carbons
Oxygen-basedcom-
pounds
Sulphur-basedcom-
pounds
Nitrogen-basedcom-
pounds
Haloge-natedhydro-
carbonsH2S NH3
Ethe-realoils
Activatedsludge tanks ofbiologicalsewage plants
X X X X X X X X
Enzymeproduction X X
Odorantproduction X X X X
Rubberindustry X X X
Conditioning ofpaint wastes X X X X X
Methionineproduction X X
Polymerisationproduction X X
Gases fromhazardouswaste dumps
X X X X X X X
Table 3.14: Typical Bioscrubber Applications
The applicability of bioscrubbing to compound groups is [cww/tm/53]:
Well suited Basically suited Not suitedAlcohols (methanol, ethanol,butanol, glycol, diglycol, butylglycol)Aldehydes and ketones (form-aldehyde, acetaldehyde, ace-tone, MIBK)Carboxylic acids and their esters(acetic acid, propionic acid,butyric acid, n-butyl acetate,ethyl acetate, methylmethacrylate, glycolic acid ester)Phenols (phenol, cresol)Heterocyclic sulphur compoundsMercaptansAminesHeterocyclic nitrogen com-poundsChlorophenolsHydrogen sulphide
NaphthaleneThioethers (sulphides)Ammonia
Aliphatic hydrocarbons(methane, pentane, hexane,longer chain hydrocarbons,acetylene etc., cyclohexane)Aromatic hydrocarbons(benzene, toluene, xylene,styrene), except naphthaleneEthers (tetrahydrofuran, di-ethylether, dioxan)Carbon disulphideNitro compoundsHalogenated hydrocarbons(dichloromethane, trichloro-ethene, perchloroethene,1,1,1-trichloroethane,1,2-dichloroethane, VCM),except chlorophenols
Application limits and restrictions:
Limits / restrictionsGas flow [Nm3/h] 1000–3000 Nm3/h per m2 of column
surface 1
Temperature [°C] 15–40 230–35 (optimum) 3
Pressure atmospheric 2
Concentration of micro-organisms >15 g/l dry matter 3
VOC-concentration in waste gas 100–2000 mg/Nm3 2,3
Concentration of ammonia 50–200 mg/Nm3 2
Odour concentration [ou/Nm3] >20000 21 [cww/tm/64]2 [cww/tm/70]3 [cww/tm/53]

Chapter 3
Waste Water and Waste Gas Treatment 207
Advantages/Disadvantages
Advantages Disadvantages• High concentrations can be abated owing to
high microbial conversion.• Also suitable for high concentrations of
compounds containing sulphur, chlorine,and/or nitrogen.
• Biomass builds up, needs to be disposed of aswaste and can result in blockage of thecirculating water.
• Poorly soluble components are more difficultto abate.
• Fluctuations, e.g. changing concentrations, inthe gas stream have a great impact onperformance.
• Percolate water needs treatment.
Achievable Emission Levels / Performance Rates
ParameterPerformance
rates[%]
Emission level[mg/Nm3] Remarks
VOC 80-90 1
Ammonia 80–95 1
Odour 70–80 11 [cww/tm/70]
Cross-media Effects
The main utilities and consumables are:
Consumable Amount RemarksChemicals (nutrients, alkalicompounds for pH correction)WaterActivated sludgeEnergy [kWh/1000 Nm3] 0.2–0.5 1
Pressure drop [kPa] 0.2–0.5 11 [cww/tm/70]
Because of biological activities in the bioscrubber, the salt concentration in the circulation waterincreases and thus has to be discharged from time to time. This waste water effluent has to betreated or disposed of in some other way.
Surplus activated sludge has to be disposed of, dependent on the contaminants or degradationproducts, e.g. by incineration.
Odour might occasionally arise from the tanks storing the circulation water, so collection ofexhaust air and its subsequent ducting to a treatment facility might be obligatory.
Monitoring
Efficiency is determined by chemical analysis or assessing the odour of inlet and outlet gases.pH control of the process is required.
Economics
Type of costs Costs RemarksCapital costs[per 1000 Nm3/h] EUR 5000–15000 1
Operating costslabourutilities
consumables ½ day per week 11 [cww/tm/70]

Chapter 3
208 Waste Water and Waste Gas Treatment
3.5.2.3 Biotrickling
Description
Biotrickling works with similar conditions to bioscrubbing. In contrast to bioscrubbing, themicrobes are fixed on supporting elements. The process principle is shown in Figure 3.65.
Trickle Bed Reactor
Mass transfergas/liquid
Biological oxidation of theabsorbed substances at the
biocatalyst
Waste gas absorbate
Scrubbed waste gas
CO2
Circulated water
Wastewater
Excesssludge
Figure 3.65: Flow Sheet of Biotrickling Process
In a biological trickle bed reactor, an aqueous phase is continuously circulated through a bed ofinert material. This packing can consist of irregular bulk material, such as rings, saddles, etc. orof structured packings. When selecting the packing material, it is necessary in every individualcase to ensure that even in the event of an anticipated excess sludge formation, the reactor willnot become choked in the long term. The surface properties should be such that the biofilmadheres firmly. The pollutants in the waste gas and the oxygen are absorbed by the water phaseand transported to the biofilm, where the biological transformation takes place. The quality ofthe mass transfer from the gas to the liquid phase and the elimination performance of the reactordepend essentially on the wetted surface area of the packing. In order to achieve optimumelimination results, i.e. to maximise the wetted surface area, the liquid phase should bedistributed uniformly over the surface of the biofilm [cww/tm/53].
The immobilisation of the biomass and the formation of the biofilm are generally a naturallycontrolled process which starts after inoculation of the water phase. The continuouslycirculating liquid phase takes on the function of supplying the microbe population with the

Chapter 3
Waste Water and Waste Gas Treatment 209
necessary nutrients. At the same time, excess activated sludge and reaction products which canalso be inhibitors, such as e.g. hydrogen chloride during the degradation of dichloromethane,are washed out of the reactor. In the liquid phase, the essential conditions such as pH, nutrientsand salt accumulation need to be controlled [cww/tm/53].
As with bioscrubbing, an increase of salt content in the absorbent takes place. Measures toprevent exceeding salt formation are, e.g.:
• adequate removal of absorbent and simultaneous addition of fresh water• operation with softened water• vapour saturation of the upstream waste gas.
A biotrickling facility is illustrated in Figure 3.66.
Figure 3.66: Typical Biotrickling Facility
Application
The application of biotrickling is comparable to that of bioscrubbing. Slight differences arefound in the pollutant compounds for which both treatment techniques are suitable.
The applicability of biotrickling to compound groups is [cww/tm/53] (compare with thecorresponding table in Section 3.5.2.2):

Chapter 3
210 Waste Water and Waste Gas Treatment
Well suited Basically suited Not suitedAlcohols (methanol, ethanol,butanol, glycol, diglycol, butylglycol)Aldehydes and ketones(formaldehyde, acetaldehyde, ace-tone, MIBK)Carboxylic acids and their esters(acetic acid, propionic acid, butyricacid, n-butyl acetate, ethyl acetate,methyl methacrylate, glycolic acidester)Phenols (phenol, cresol)MercaptansAminesAmmoniaHeterocyclic nitrogen compoundsDichloromethane, 1,2-dichlo-roethane, chlorophenolsHydrogen sulphide
Styrene, naphthaleneHeterocyclic sulphur com-poundsCarbon disulphideTrichloroethene, VCM
Aliphatic hydrocarbons(methane, pentane)Perchloroethene,1,1,1-trichloroethane,
Application limits and restrictions [cww/tm/70]:
Limits / restrictionsTemperature [°C] 15–40 1
30–35 (optimum) 2
Pressure atmospheric 2
Concentration of micro-organisms >15 g/l dry matter 3
VOC-concentration in waste gas[mg/Nm3]
400–2000 1,2
Ammonia concentration[mg/Nm3]
100–400 1
Odour concentration [ou/Nm3] >20000 1
Hydrogen sulphide concentration[mg/Nm3]
50–200 1
Mercaptan concentration[mg/Nm3]
5–100 1
1 [cww/tm/70]3 [cww/tm/53]
Advantages/Disadvantages
Advantages Disadvantages• Biodegradation of absorbed components.• Suitable for medium concentrations of acidi-
fying components containing sulphur, chlorineand nitrogen.
• Small pH corrections are possible.
• Fluctuations of intake air stream conditionshave great impact on effectiveness.
• Poorly soluble components are more difficultto abate.
• Toxic and high concentrations of acidifyingsubstances should be avoided.

Chapter 3
Waste Water and Waste Gas Treatment 211
Achievable Emission Levels / Performance Rates
Parameter Performance rates[%]
Emission level[mg/Nm3] Remarks
VOC 80-95 1
Ammonia 80–95 1
Odour 70–90 1
Hydrogen sulphide 80–95 1
Mercaptans 70–90 1
Carbon disulphide 98–99 2 Feed concentration100 mg/Nm3
Styrene 80 2 Feed concentrationabout 160 mg/Nm3
VCM 99 2 Feed concentrationup to 100 mg/Nm3
1 [cww/tm/70]2 [cww/tm/53]
Cross-media Effects
The main utilities and consumables are:
Consumable Amount RemarksChemicals (nutrients, alkalicompounds for pH correction)WaterActivated sludgeEnergy [kWh/1000 Nm3] <1 1
Pressure drop [kPa] 0.1-1 11 [cww/tm/70]
Because of biological activities in the biotrickler, the salt concentration in the circulation waterincreases and thus has to be discharged from time to time. This waste water effluent has to betreated or disposed of in some other way.
Surplus activated sludge has to be disposed of, depending on the contaminants or degradationproducts, e.g. by incineration.
Odour might occasionally arise from the tanks storing the circulation water, so collection ofexhaust air and its subsequent ducting to a treatment facility might be obligatory.
Monitoring
The effectiveness of the biotrickling system is determined by the gas feed and outletconcentrations. The composition of the absorbing water should be monitored by continuousmeasuring of the parameters [cww/tm/53]:
• pH• temperature• oxygen concentration• conductivity.

Chapter 3
212 Waste Water and Waste Gas Treatment
Economics
Type of costs Costs RemarksCapital costs[per 1000 Nm3/h] EUR 5000–20000 1
Operating costslabourutilities
consumables
½ day per week 1
1 [cww/tm/70]
3.5.2.4 Thermal Oxidation
Description
Thermal oxidation is the oxidation process of combustible gases and odorants in a waste gasstream, by heating a mixture of contaminants with air or oxygen above its auto-ignition point ina furnace and maintaining it at high temperature for sufficient time to complete combustion tocarbon dioxide and water. Time, temperature (about 200–400 °C above auto-ignition),turbulence (for mixing) and the availability of oxygen all affect the rate and efficiency of thecombustion process. These factors provide the basic design parameters for VOC oxidationsystems. When halogenated VOC are present, special conditions might be needed to suppressthe generation (or de-novo synthesis) of dioxins, though normally there is only a negligibledioxin formation with the combustion of gaseous waste streams:
• residence time ≥1 s [cww/tm/118 and 120]• temperature ≥1100 ºC [cww/tm/118 and 120]• oxygen content >3 %• quenching of flue gas after incinerator to rush through the ‘recombination window’ of
dioxins.
Additional facilities, e.g. alkaline scrubbers, need to be installed to remove hydrogen halides.
Several types of thermal oxidisers are operated:
• the straight thermal oxidiser, comprised of a combustion chamber and not including anyheat recovery of exhaust air
• the regenerative thermal oxidiser, following the steps [cww/tm/132]:- exhaust gas stream entering the oxidiser through the common inlet and passing into a
regenerative chamber through a butterfly valve- then passing through a ceramic heat exchange matrix, which raises the gas temperature
near to oxidation temperature- then entering the combustion chamber, which is maintained at about 800 °C by burners,
the released heat decreasing the fuel consumption of the burners- then leaving the combustion chamber through a second ceramic heat exchanger matrix,
transferring its thermal energy to be re-used for preheating the next cycle- the clean gas stream released through an outlet valve to discharge.
Due to the relatively high combustion space temperature, the large excess of air and smallinfluence of flame, only small amounts of carbon monoxide and NOx are formed.
This system is particularly suitable for waste gas streams of comparatively high flow rates(up to 200 Nm3/s). 90–97 % heat recovery (waste gas preheating) is generally achieved[cww/tm/132].

Chapter 3
Waste Water and Waste Gas Treatment 213
Examples of regenerative thermal oxidation systems are schematically given in Figure 3.67[cww/tm/132]:
Figure 3.67: Schemes of Various Regenerative Combustion SystemsA) Fixed-bed regenerator, B) Combu-Changer, C) Ljungstrom regenerator, D) Moving-bedregenerator
• the recuperative thermal oxidiser, comprised of a combustion chamber, the waste gaspreheater and, if appropriate, a secondary energy recovery heat exchanger, the heatcontinuously transferred to the preheater. This system is particularly suitable for waste gasstreams of comparatively low flow rates (<14 Nm3/s). 50–80 % heat recovery is generallyachieved [cww/tm/132]
• gas engines and/or steam boilers [cww/tm/133], with 57–67 % energy recovery. The wastegas is burned in the engine, if necessary natural gas is added as support fuel. Downstreamgenerators produce electricity. The engine contains a catalytic converter, especially tooxidise the carbon monoxide in the gas stream. The engine is coupled with a steam boiler touse the waste heat of the exhaust gas for the production of steam. The boiler feed water ispreheated by the engine cooling water. With low combustion temperatures the formation ofNOx is low. The exhaust gas leaving the gas engine is led over oxidation catalysts to reducethe carbon monoxide content.

Chapter 3
214 Waste Water and Waste Gas Treatment
The design criteria for a thermal oxidiser system depend mainly on the nature of the waste gasstream, which determines the combustion conditions. Some of the most important items are:
• The burnersSome types of burners are described in Table 3.15 [cww/tm/79].
Burner CharacteristicsDistributed Burner
Single Source Burner
Pre-mix Burner
Diffusion Burner
Vortex Burner
Oil Burner
gives much better mixing of the fuel and combustion air and of hot gaseswith the bypass air. This produces short flames and thus allows a greaterresidence time. However, only clean gases and gaseous fuels can beused. There is limited turndown (ratio between full and minimum output)and combustion air with a high oxygen content may be required.
is less expensive than distributed burners.
provides efficient combustion, but can only take gaseous fuel and cleanair.
can take liquid or gaseous fuel and clean or dirty air.
provides efficient combustion and a short flame, but a fan capable ofdelivering 500 mm water gauge is needed, there is low turndown andliability to fouling.
gives longer flames, is more expensive, requires more maintenance, hasmore limited turndown and is generally not as clean as a gas burner.
Table 3.15: Types of Burner
• The mixing section [cww/tm/79]Good mixing can be achieved by:- natural diffusion between turbulent streams- impingement of gas streams at an angle- changes in direction of flow, round corners or past baffles.
• The combustion chamber [cww/tm/79]Conditions for dimensioning the combustion chamber are:- its diameter must allow turbulent flow- it has to be large enough to take the flame without quenching- its length is determined by the length of the flame plus the length needed to achieve
mixing- it must be resistant to temperature and corrosion- it must withstand frequent expansion and contraction.
• Waste gas pretreatment [cww/tm/79]When pretreatment is necessary before entering the thermal oxidiser:- condensing out water vapour from a wet waste gas- removal of solid and liquid contaminants- concentration (e.g. by GAC or zeolite adsorption and subsequent desorption) to reduce
the total gas volume to be treated by the oxidiser- preheating, which reduces fuel requirements.
• Safety equipment [cww/tm/79]Necessary safety devices are:- protection against flame flashback by devices, e.g. parallel plate flame arrestors,
multiple screen flame arrestors, and/or water seals- burner purge period on start up of the thermal oxidiser- shut off flows in the event of flame failure- limiting of peak temperatures.

Chapter 3
Waste Water and Waste Gas Treatment 215
Application
Thermal oxidisers are used to reduce emissions from almost all VOC sources, including reactorvents, distillation vents, solvent operations and operations performed in ovens, dryers and kilns.They can handle minor fluctuations in flow, but excess fluctuations require the use of a flare.Their fuel consumption can be high, when low-loaded waste gases are fed, so thermal units arebest suited for smaller process applications with moderate-to-high VOC loadings. Thermaloxidisers are used to control VOC from a wide variety of industrial processes, e.g.:
• storing and loading / unloading of petroleum products and other volatile organic liquids• vessel cleaning (rail tank cars, road tankers, barges)• process vents in the synthetic organic chemicals manufacturing industry• paint manufacturing• rubber products and polymer manufacturing• flexible vinyl and urethane coating• hazardous waste treatment storage and disposal facilities.
Application limits and restrictions [cww/tm/70]:
Limits / RestrictionsTypical gas flows[Nm3/h]
900–86000 (straight and regenerativethermal oxidiser) 1,2
90–86000 (recuperative thermal oxidiser) 3
Temperature [°C] 750–1000 4980–1200 with hazardous components 1,2,3
VOC-concentration in waste gas <25 % LEL 1,2,3
Residence time [s] 0.5–2 5 (dependent on temperature)Substances no substances that can generate corrosive
compounds when gas engines or steamboilers are used
1 [cww/tm/120]2 [cww/tm/119]3 [cww/tm/118]4 [cww/tm/132]5 [cww/tm/64]
Advantages/Disadvantages
Advantages Disadvantages• High and constant performance.• Simple principle.• Reliable in operation.• Recuperative and regenerative oxidation have
a high thermal efficiency, with the effect oflower extra fuel consumption and hence lowercarbon dioxide emission.
• Process integration of waste heat or steamgeneration is possible.
• Emission of carbon monoxide and nitrogenoxides.
• Risk of dioxin formation, when chlorinatedcompounds are incinerated.
• Flue gas treatment necessary for VOCscontaining sulphur and/or halides.
• Additional fuel needed, at least for start-upoperation and VOC concentration below auto-ignition point.
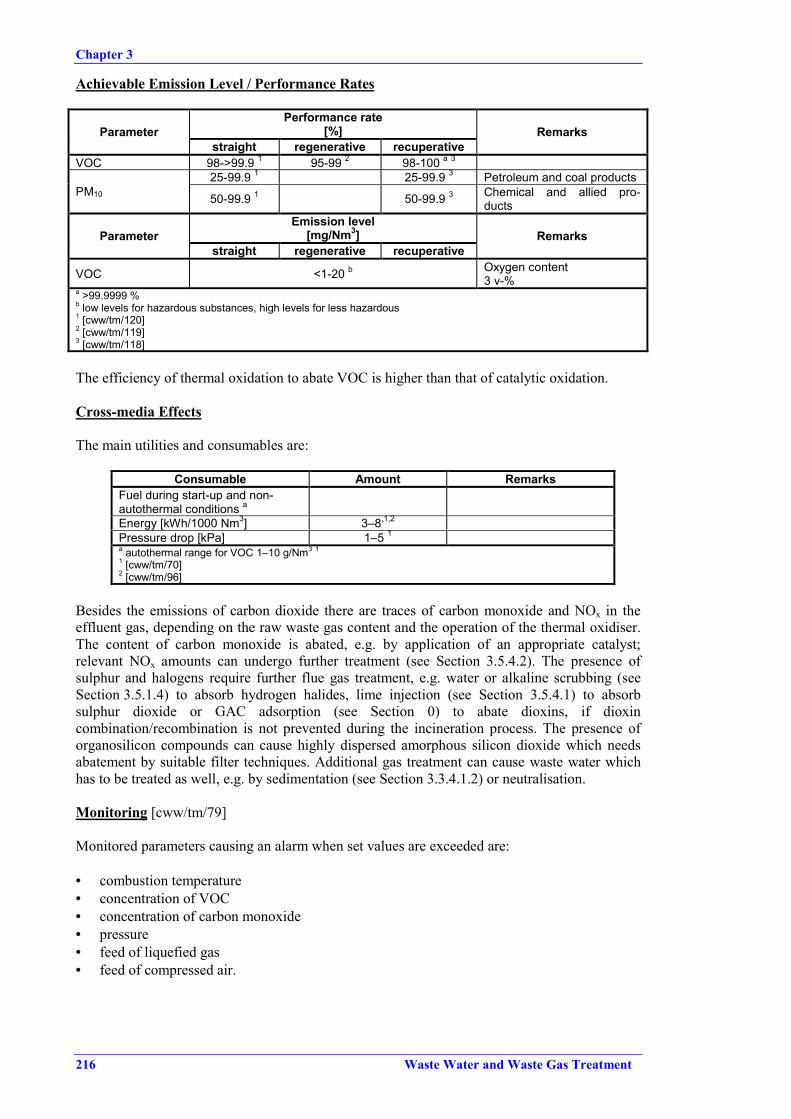
Chapter 3
216 Waste Water and Waste Gas Treatment
Achievable Emission Level / Performance Rates
Performance rate[%]Parameter
straight regenerative recuperativeRemarks
VOC 98->99.9 1 95-99 2 98-100 a 3
25-99.9 1 25-99.9 3 Petroleum and coal productsPM10 50-99.9 1 50-99.9 3 Chemical and allied pro-
ductsEmission level
[mg/Nm3]Parameterstraight regenerative recuperative
Remarks
VOC <1-20 b Oxygen content3 v-%
a >99.9999 %b low levels for hazardous substances, high levels for less hazardous1 [cww/tm/120]2 [cww/tm/119]3 [cww/tm/118]
The efficiency of thermal oxidation to abate VOC is higher than that of catalytic oxidation.
Cross-media Effects
The main utilities and consumables are:
Consumable Amount RemarksFuel during start-up and non-autothermal conditions aEnergy [kWh/1000 Nm3] 3–8,1,2
Pressure drop [kPa] 1–5 1a autothermal range for VOC 1–10 g/Nm3 11 [cww/tm/70]2 [cww/tm/96]
Besides the emissions of carbon dioxide there are traces of carbon monoxide and NOx in theeffluent gas, depending on the raw waste gas content and the operation of the thermal oxidiser.The content of carbon monoxide is abated, e.g. by application of an appropriate catalyst;relevant NOx amounts can undergo further treatment (see Section 3.5.4.2). The presence ofsulphur and halogens require further flue gas treatment, e.g. water or alkaline scrubbing (seeSection 3.5.1.4) to absorb hydrogen halides, lime injection (see Section 3.5.4.1) to absorbsulphur dioxide or GAC adsorption (see Section 0) to abate dioxins, if dioxincombination/recombination is not prevented during the incineration process. The presence oforganosilicon compounds can cause highly dispersed amorphous silicon dioxide which needsabatement by suitable filter techniques. Additional gas treatment can cause waste water whichhas to be treated as well, e.g. by sedimentation (see Section 3.3.4.1.2) or neutralisation.
Monitoring [cww/tm/79]
Monitored parameters causing an alarm when set values are exceeded are:
• combustion temperature• concentration of VOC• concentration of carbon monoxide• pressure• feed of liquefied gas• feed of compressed air.

Chapter 3
Waste Water and Waste Gas Treatment 217
A further important parameter to monitor is the oxygen content of the effluent gas, whichprovides information about the combustion conditions. This is crucial when halogen compoundsare thermally oxidised.
The abatement efficiency of the system may be determined by monitoring the concentration ofVOC and/or odour before and after the thermal oxidiser. VOCs can be measured as total carbon,using a flame ionisation detector. A qualitative analysis of the emissions can be done by takinggrab samples at selected sampling points and by subsequently analysing them by GC/MS.Abatement efficiencies for odorous emissions are determined by taking grab samples at anappropriate sampling point and subsequently analysing them by olfactometry.
Burners have to be inspected regularly and, if necessary, cleaned. If deposits build up rapidly,preventive action needs to be taken. Effective pretreatment may be necessary to clean thecontaminated waste gas before it enters the burner. If the deposits are due to carbon this mayindicate the use of the wrong waste gas/fuel ratio and the need to check the control settings.
Economics
CostsType of costs Straight Regenerative Recuperative Remarks
USD 2800-59000 1 USD 24000-89000 3 USD 8900-77000 4
EUR 10000-40000 2 EUR 20000-30000 2 EUR 10000-50000 2Capital costs[per 1000 Nm3/h] FIM 131000-174000 5
USD 24000-45000 1 USD 2400-5900 3 USD 2800-14800 4Annual operatingcosts[per 1000 Nm3/h] FIM 6500 5
labourutilities
consumables
0.5 days per week 2 days per year
Cost effectiveness[per tonne pollutantper year]
USD 440-3600 1 USD 110-21000 3 USD 110-2200 4
1 [cww/tm/120]2 [cww/tm/70]3 [cww/tm/119]4 [cww/tm/118]5 [cww/tm/96]
Cost factors [cww/tm/80]:
Factors Influence / resultsVolume of waste gases to be treated Dimensions of combustion chamberHeat content of waste gas Design of combustion equipment, support
fuel requirementCombustion temperature Construction materialsInstrumentationHeat recovery optionsInstallation requirements (indoor, outdoor,ground level, rooftop, etc.)
Kilns and boilers can be used for the thermal oxidation of VOC, if temperature and residencetime are in the correct range. This can be an attractive option where the kiln or boiler is alreadyon site.

Chapter 3
218 Waste Water and Waste Gas Treatment
3.5.2.5 Catalytic Oxidation
Description
Catalytic oxidisers operate in a very similar way to thermal oxidisers, with the main differencethat the gas, after passing through the flame area, passes through a catalyst bed. The catalyst hasthe effect of increasing the oxidation reaction rate, enabling conversion at lower reactiontemperatures than in thermal oxidation units. Catalysts, therefore, also allow smaller oxidisersto be used. The principle is illustrated in Figure 3.68 [cww/tm/79].
Figure 3.68: Principle of Catalytic Oxidation
The waste gas is heated by auxiliary burners to approximately 300–500 °C before entering thecatalyst bed. The maximum design exhaust temperature of the catalyst is typically 500–700 °C[cww/tm/116].
The method of contacting the gas stream with the catalyst serves to distinguish catalyticoxidation systems. Both fixed-bed and fluidised-bed systems are used.
The fixed-bed catalytic oxidiser may use a monolith catalyst or a packed-bed catalyst. Themonolith catalyst is a porous solid block containing parallel, non-intersecting channels alignedin the direction of the gas flow. Its advantage is minimal attrition due to thermal expansion /contraction during start-up / shutdown and low overall pressure drop. The packed-bed catalystconsists of particles which are supported either in a tube or in shallow trays through which thegas passes. Compared to the monolith catalyst its pressure drop is inherently high and thecatalyst particles tend to break due to thermal expansion when the confined catalyst bed isheated / cooled during start-up / shutdown.
Fluidised-bed catalytic oxidisers have the advantage of very high mass transfer rates, althoughthe overall pressure drop is somewhat higher than for a monolith. An additional advantage offluidised beds is a high bed-side heat transfer as compared to a normal gas heat transfercoefficient. A further advantage is their higher tolerance of particulate matter in the gas streamthan either fixed-bed or monolithic catalysts. This is due to the constant abrasion of the fluidisedcatalyst pellets, which helps remove particulates from the exterior of the catalysts in acontinuous manner. A disadvantage is the gradual loss of catalyst by attrition.

Chapter 3
Waste Water and Waste Gas Treatment 219
Catalysts for VOC oxidation are typically either precious metals, such as platinum, palladiumand rhodium, supported on ceramic or metal, or base metals supported on ceramic pellets, singleor mixed metal oxides, often supported by a mechanically strong carrier, such as oxides ofcopper, chromium, manganese, nickel, cobalt etc.
Catalysts such as chromia/alumina, cobalt oxide and copper oxide / manganese oxide are usedfor the oxidation of gases containing chlorinated compounds. Platinum-based catalysts areactive for the oxidation of sulphur-containing VOC, whereas they are rapidly deactivated by thepresence of chlorine.
The presence of catalyst poisons or masking (blinding) agents in the waste gas stream, such asparticulates or reactive chemicals, can have a significant impact on the working life of thecatalyst. Poisoning by blinding can be reversible, e.g. coating of the catalyst surface by oils orfats reduces its efficiency but the coating can be burnt off by raising the temperature. However,if certain chemicals are present, the poisoning of the catalyst becomes irreversible. Such catalystpoisons are, e.g.:
• fast acting inhibitors, such as phosphorous, bismuth, arsenic, antimony, lead, mercury,causing an irreversible loss of catalytic activity at a rate dependent on concentration andtemperature
• slow acting inhibitors, such as iron, tin, silicon, causing an irreversible loss of activity, buthigher concentrations than those of fast acting inhibitors may be tolerated
• reversible inhibitors, such as sulphur, halogens, zinc, causing – depending on the catalyst –a reversible surface coating of catalyst active area at a rate dependent on temperature andconcentration
• surface maskers, such as organic solids, causing a reversible coating of active surfaces• surface eroders and maskers, such as inert particles, causing the coating of active surfaces,
plus erosion of catalyst at a rate dependent on particle size, grain loading and gas velocity[cww/tm/80].
As with thermal oxidation, several types of oxidisers are operated:
• the straight catalytic oxidiser• the regenerative catalytic oxidiser• the recuperative catalytic oxidiser.
Normal operating conditions for catalytic oxidisers are, e.g.:
• natural gas as the preferred fuel (when additional fuel is needed)• distributed burner as suitable burner• chambers constructed of stainless steel or carbon steel• burner section constructed of sufficient length to provide even flow and temperature
distribution across the catalyst surface• flat flow profile across the catalyst surface• waste gas moving through the catalyst bed in ‘plug flow’ with minimum backmixing• typical residence time 0.3–0.5 seconds.
As with thermal oxidation, some waste gas pretreatment can be necessary, such as condensingthe water vapour from a wet waste gas, removal of solids and liquids and – typical for thecatalytic system – removal of catalyst poisons. The safety requirement are almost the same aswith thermal oxidation (see Section 3.5.2.4).
The catalytic oxidation should be designed in such a way as to facilitate the removal of thecatalyst for cleaning or replacement purposes.
An example of a regenerative catalytic oxidiser is given in Figure 3.69 [cww/tm/132].

Chapter 3
220 Waste Water and Waste Gas Treatment
Figure 3.69: Regenerative Catalytic Oxidiser1) Exhaust inlet, 2) Bed of ceramic heat-sink material, 3) Catalyst layer, 4) Combustion chamber, 5)Exit layer of catalyst, 6) Regenerative chamber, 7) Outlet manifold, 8) Transition duct
Application
Catalytic oxidation is used to reduce emissions from a variety of stationary sources. The mainemission source is VOC from solvent evaporation, and catalytic oxidation is widely used bymany industry sectors in this category. Examples from the chemical and related sectors are:
• petrol bulk loading stations• process vents in the synthetic organic chemical manufacturing industry• rubber products and polymer manufacturing• polythene, polystyrene and polyester resin manufacturing.
Catalytic oxidation is most suited to systems with lower exhaust volumes, when there is littlevariation in the type and concentration of VOC, and where catalyst poisons or other foulingcontaminants are not present. Other components to abate are carbon monoxide and – to a certaindegree – particulates, though the latter require special operational devices.
Application limits and restrictions:
Limits / restrictions1200–86000 (straight and regenerative catalyticoxidiser) 1,2Typical gas flows
[Nm3/h] 90–86000 (recuperative catalytic oxidiser) 3
Temperature [°C] 300–500 before the catalyst500–700 after the catalyst
VOC concentration in waste gas <25 % LEL 1
Residence time [s] 0.3–0.5 (dependent on catalyst bed volume)1 [cww/tm/116]2 [cww/tm/119]3 [cww/tm/118]

Chapter 3
Waste Water and Waste Gas Treatment 221
Advantages/Disadvantages
Advantages Disadvantages• More compact than thermal oxidisers.• Requiring lower temperatures and less
additional fuel than thermal oxidisers.• Little or no NOx produced from atmospheric
fixation (about 20–30 % of the amount formedby thermal oxidation).
• CO in the waste gas stream is simultaneouslyabated by the catalyst.
• High, constant and reliable performancepossible.
• Recuperative and regenerative oxidation havea high thermal efficiency, with the effect oflower extra fuel consumption and lowercarbon dioxide emission.
• Process integration of residual heat or steamgeneration is possible.
• Little or no insulation requirements.• Reduced fire hazards compared with thermal
oxidiser.
• Lower efficiency in VOC destruction thanthermal oxidation.
• System sensitive to changes of gas heatingvalue.
• Risk of dioxin formation, when chlorinatedcompounds are incinerated.
• All catalysts susceptible to poisoning agents,fouling agents and activity suppressants.
• Particulates must often be removed first.• Spent catalyst that cannot be regenerated may
need to be disposed of.
Achievable Emission Levels / Performance Rates
Performance rate[%]Parameter
straight regenerative recuperativeRemarks
95 1 90-99 2VOC 98-99 a 1
25-99.9 1 Petroleum and coal productsPM10 50-99.9 1 Chemical and allied productsCO >98 b 2
Odour 80-95 3
Parameter Emission level[mg/Nm3] Remarks
VOC <1-20 ca require larger catalyst volumes and/or higher temperaturesb precious metal-based catalystc low levels for hazardous substances, high levels for less hazardous substances1 [cww/tm/116]2 [cww/tm/119]3 [cww/tm/70]
Cross-media Effects
The main utilities and consumables are:
Consumable Amount RemarksFuel during start-up and non-autothermal conditions a[Nm3 methane per 1000 Nm3]
0–100
Energy [kWh/1000 Nm3] 1–2 1
Pressure drop [kPa] 1–5 1a autothermal range for VOC 1–2 g/Nm3,1 (regenerative system) and 3–5 g/Nm3 (recuperative system)1 [cww/tm/70]
Emissions to the environment include traces of carbon monoxide and, because of the relativelylow temperature compared to thermal oxidation, a low NOx content. Emission levels of15 mg/Nm3 are achievable.

Chapter 3
222 Waste Water and Waste Gas Treatment
The catalyst has a working life of two years and probably more. It then has to be regenerated ordisposed of as chemical or even hazardous waste.
When the oxidised VOCs contain sulphur and/or halogens, further emissions of sulphur dioxideand/or hydrogen halides might be be expected. These have to be abated with suitabletechniques.
Monitoring [cww/tm/79]
The bed temperature, pressure drop across the bed, combustion temperature and the carbonmonoxide and oxygen content of the effluent gas stream should be monitored to control thecombustion conditions.
The abatement efficiency of the system may be determined by monitoring the concentration ofVOC and/or odour before and behind the oxidiser. VOCs can be measured as total carbon, usinga flame ionisation detector. A qualitative analysis of the emissions can be done by taking grabsamples at selected sampling points and by subsequently analysing them by GC/MS. Abatementefficiencies for odorous emissions are determined by taking grab samples at an appropriatesampling point and subsequently analysing them by olfactometry.
Burners have to be inspected regularly and, if necessary, cleaned. If deposits build up rapidly,preventive action needs to be taken. Effective pretreatment may be necessary to clean thecontaminated waste gas before it enters the burner. If the deposits are due to carbon this mayindicate the use of the wrong waste gas/fuel ratio and the need to check the control setting.
Economics
CostsType of costs Straight Regenerative Recuperative Remarks
USD 14000-58000 1 USD 24000-89000 3Capital costs[per 1000 Nm3/h] EUR 10000-80000 2 EUR 30000-40000 2
Annual operating costs[per 1000 Nm3/h] USD 2800-21000 1 USD 3600-12000 3
labourutilities
consumables
0.5 days per week 2 days per year
Cost effectiveness[per tonne pollutant peryear]
USD 440-3600 1 USD 150-26000 3
1 [cww/tm/116]2 [cww/tm/70]3 [cww/tm/119]
Cost factors [cww/tm/80]:
Factors Influence / resultsWaste gas flow rate Dimensions of combustion chamberHeat content of waste gas Design of combustion equipment, support
fuel requirementSolvent destruction efficiency required Space velocity and consequently the amount
of catalyst requiredCatalyst typeInstrumentationType of heat exchangerInstallation requirements (indoor, outdoor,ground level, rooftop, etc.)

Chapter 3
Waste Water and Waste Gas Treatment 223
3.5.2.6 Flaring
Description
Flaring is a high-temperature oxidation process used to burn combustible components of wastegases from industrial operations. There are two types of flares:
• elevated flares• ground flares.
Elevated flares, the more common type, have larger capacities than ground flares. In elevatedflares, a waste gas stream is fed through a stack anywhere from 10 to over 100 metres tall and iscombusted at the tip of the stack. The flame is exposed to atmospheric disturbances (wind,precipitation). Elevated flares are generally designed for large capacities (hundreds of tonnesper hour) and are more suitable to large variations of gas flow.
The typical elevated flare system (see Figure 3.70 [cww/tm/143]) consists of [cww/tm/143]:
Figure 3.70: Typical Elevated Flare System [cww/tm/143]
• gas collection header and piping for collecting gases from processing units• knockout drum (disentrainment drum) to remove and store condensables and entrained
liquids• proprietary seal, water seal or purge gas supply to prevent flash-back• single- or multiple-burner unit and a flare stack• gas pilots and an ignitor to ignite the mixture of waste gas and air• if required, provision for external momentum force (steam injection or forced air) for
smokeless flaring.
Natural gas, fuel gas, inert gas or nitrogen can be used as purge gas.
In ground flares, combustion takes place at ground level. They vary in complexity and mayconsist either of conventional flare burners discharging horizontally with no enclosures or of

Chapter 3
224 Waste Water and Waste Gas Treatment
multiple burners in refractory-lined steel enclosures. They are designed for smaller capacities(tens of tonnes per hour) and handle the base load of combustible gases generated by all thepoint sources connected to the flare system during normal operation. This includes mainlyleaking safety valves and any start-up and shutdown processes.
The large diameter of the ground flare provides the possibility of more burners. Thus the groundflare can be adjusted to varying amounts of flare gas by adjusting the number of burners that areoperating. This improves the combustion conditions and results in higher combustionefficiency.
A new type of ground flare works as a premixed surface combustion system (enclosedburner), where premixed gas and air burns on a permeable medium. The permeable mediumconsists of several layers of metal fibres and withstands temperatures up to 1300 °C. The gas isfed to a venturi injector at the bottom end of the burner system, the injector drawing in the airneeded for stoichiometric combustion. Air ratios between 1 : 12 and 1 : 19 can be achieved. Inthe diffusor directly on top of the venturi injector, the velocity of the mixture is decreased andhence the pressure increased, which increases the efficiency of the venturi injector and causesstatic pressure to let the gas mixture flow through the permeable medium. From the diffusor thegas mixture enters the premix chamber and flows through the permeable medium, where it isignited by a pilot burner. The combustion takes place just above the permeable medium. Heat isreleased in a convective way, making energy recovery with heat exchanger an option. Theenclosed combustion zone prevents discharge of heat and light. The technique is described inFigure 3.71 [cww/tm/153].
Figure 3.71: Principal Components of the Enclosed Burner
The fibre mat is constantly cooled by the flow of gas and air. Because the metal fibres have alarge surface area relative to their volume, they cool rapidly. This also makes the unit resistantto flash back. Even at the lowest flow rate the premix stream is sufficient to cool the mat so thatthe premix side of the mat will not exceed 150 °C [cww/tm/153].
A single module comprises six burner units in two back to back banks with a total capacity of90 MW for natural gas (Wobbe index 47.8 MJ/Nm3). The flame is shielded and then directedupward by insulated walls. Heat radiation to the surrounding area is minimised and localambient temperature rises are limited to less than 5 K [cww/tm/153].
Complete combustion with flare systems requires sufficient combustion air and proper mixingof air and waste gas. Smoking may result from combustion, depending upon waste gas

Chapter 3
Waste Water and Waste Gas Treatment 225
components and the quantity and distribution of combustion air. Waste gases containingmethane, hydrogen, carbon monoxide and ammonia usually burn without smoke. Waste gasescontaining heavy hydrocarbons such as paraffins above methane, olefins and aromatics causesmoke. Industry usually requires a smokeless capacity of 10–15 % for elevated flares and 100 %for ground flares. An external momentum force is used as smoke suppressant, such as :
• steam, supplied at up to 0.7 MPa gauge pressure, normally used on large sites where steamis easily available
• air, suited to applications requiring a small and relatively inexpensive installation• high-pressure gas, which is very costly• water, supplied at a water pressure of about 2 MPa gauge, suitable where water is freely
available in large quantities.
External momentum is rarely required in ground flares.
Waste gases to be flared must have a heat content of at least 11 MJ/Nm3 for completecombustion, otherwise auxiliary fuel must be added. In some cases, even flaring waste gaseshaving the necessary heat content will also require supplemental heat. If fuel-bound nitrogen ispresent, flaring ammonia with a heating value of 13.6 MJ/Nm3 will require higher heat tominimise NOx formation.
Industrial sites often operate an integrated flare system, i.e. a combination of a ground flare withan optimal burner design for waste gas flows during regular operation and an elevated flare forhigh flow rates during emergencies and process upsets.
Different kinds of flares are shown in Figure 3.72 – Figure 3.74 [cww/tm/64].
Figure 3.72: Injector Rod Flare

Chapter 3
226 Waste Water and Waste Gas Treatment
Figure 3.73: Shielded Flare
Figure 3.74: Muffle Flare
Application
Flares are widely used in the oil, gas and petrochemical industry to safely dispose of surpluscombustible gases and vapours when there is no opportunity to use or recycle them. VOC fromvents, pumps and compressors are collected and routed to a flare system. A significant functionof flares is to prevent the unwanted occurrence of larger amounts of inflammable gases as asafety measure or under emergency conditions. Technically, all points in a chemical plant with apotential safety release of combustible gases are connected to a flare system. Flares arenormally not, however, regularly used as a continuous measure. They can also be used to burnwaste gases generated by sewage / sludge digesters.
Whereas elevated flares are normally used as emergency and relief gas flaring, ground flares aremore often employed as routine flaring, provided that the waste gas does not contain toxicconstituents. Ground flares cannot - in contrast to elevated flares – handle large fluctuations ingas flow. When these fluctuations can occur, combination with an elevated flare is required.

Chapter 3
Waste Water and Waste Gas Treatment 227
As reported [cww/tm/153], the premix surface combustion type is also applicable to toxic andhazardous gases, e.g. gas mixtures with hydrogen sulphide content.
Application limits and restrictions:
Limits / restrictionsTypical gas flows 0–1800000 Nm3/h 1 (upper limit for elevated
flares)600-210000 Nm3/d (Wobbe Index range15-52 MJ/Nm3) for ground flares of thepremixed surface combustion type
Combustion temperature [°C] >800 2900-1260 °C (ground flares of the premixedsurface combustion type)
Residence time in combustion chamber[s]
1–2 2
Pressure range[kPa gauge]
0-0.73 (ground flares of the premixed surfacecombustion type)
VOC concentration in waste gas 0–100 % LEL with safety engineering 20–50 % LEL without safety engineering 2
Oxygen content after incineration >5 % 3 (muffle flare)Flare velocity [m/s] 0–20 3 (to prevent backflash)1 [cww/tm/117]2 [cww/tm/132]3 [cww/tm/64]
Advantages/Disadvantages
Advantages DisadvantagesGeneral• Efficient abatement system concerned with
surplus combustible and non-recyclable gasesor sudden releases of large amounts of gas.
• Can be used to control intermittent orfluctuating waste gas streams.
General• No pollutant abatement (SOx, NOx, carbon
monoxide, hydrogen halides) beyond the flare.• Smoke suppressants needed.• Heat of combustion not recoverable.• High costs in case of retrofitting
Elevated flares• Quick and safe release of large amounts of
waste gas amounts.• Stand-by equipment for emergency use.
Elevated Flares• Light nuisance.• Noise nuisance.• Difficulties in handling low flows.• Coke formation may cause tip blockage.
Ground flares• Reliable flare ignition (less affected by wind).• Flexible; can handle gas flow variations in the
low range.
Ground flares• Limited capacity.• Cannot handle large variations of gas flow,
requiring a combination with elevated flares.• Increased health and safety risks at
malfunction.• Potentially reduced efficiency due to poor fuel
quality.• Odour nuisance.
Ground flare premixed surface combustion• Complete combustion.• Modular system for rapid rig-up and easy
transportation.• Very broad turn-down ratio (1 : 30 with
Wobbe-Index 15-52 MJ/Nm3)• Direct start-up at full capacity without needing
a period of start-up time.• Low NOx emissions.• Energy recovery is an option.• Low emissions of light and heat.
Ground flare premixed surface combustion• New technology, therefore not yet recognised
worldwide.• High costs when compared with conventional
flares.

Chapter 3
228 Waste Water and Waste Gas Treatment
Achievable Emission Levels / Performance Rates
Elevated flare Ground flareParameter Performance rate
[%]Emission level
[mg/Nm3]Performance rate
[%]Emission level
[mg/Nm3]>98 a 1 >99 a 2VOC 80-86 3 99.9 c 3
400 (200 ppm) 400 (200 ppm)NOx 11.6 (3.9 ppmv) b,c
NO 8.6 (2.9 ppmv) b,c
Hydrocarbons(included BTEX) <2.8 (<1 ppmv) b,c
CO -Noise 73 dB(A) b,d
a at optimum condition: heat content of waste gas >11 MJ/Nm3 1, low flows and low heat content achieve lowercombustion efficienciesb premixed surface combustion systemc corrected to 3 % O2d at 50 m at free field conditions1 [cww/tm/117]2 [cww/tm/84]3 [cww/tm/153]
The achievable emission levels mentioned in the table report the destruction of air pollutants(VOC and Hydrocarbons) by flaring. The other parameters (NO and NOx) refer to emissionscaused by flaring. Flaring has no exhaust gas treatment installed, hence pollutants caused by theincineration process of sulphur and/or halogens containing waste gases, NOx, carbon monoxide,soot etc. normally are not controlled. For these reasons, ground flares are not suited for toxicand hazardous gases. The combination / recombination reaction to dioxins, however, is notfavoured because of the lack of a ‘recombination window’ and metal surfaces acting as catalyst.
The abatement performance of flaring, as described in the table above, is only valid under theoptimum conditions. The performance range under non-optimum conditions covers 0-98 %[cww/tm/84], what means that flaring is very sensitive to changes of these conditions. Thatmakes flaring a very unreliable abatement technique when used in everyday operation.
Cross-media Effects
The main utilities and consumables are:
Consumable Amount RemarksSmoke suppressants (steam, air,water, natural gas)Ignition gas for ignition pilot(propane or butane)Purge gas (nitrogen or fuel) tokeep the system on over-pressurePilot gasEnergy [kWh/1000 Nm3]Pressure drop [kPa] 1 11 [cww/tm/64]
Flaring can cause the emission of noise. The most significant noise sources are [cww/tm/94]:
• smoke suppressant injection• combustion process• vents.
Any steam-assisted flare generates noise, due to the high-pressure steam jets and injectors andthe combustion noise associated with hydrocarbons. High-pressure steam generates high-frequency noise, which is most serious to humans, and also improves combustion efficiency,thereby increasing energy release and burning rate, which again results in higher combustion
Chapter 3
Waste Water and Waste Gas Treatment 229
noise. Combustion noise is typically low-frequency noise, comparable to the vent noise fromturbulent mixing of waste gases and air.
The suppression of noise is a crucial environmental issue and thus an important design aspectthat needs addressing at an early stage. Noise avoidance aspects are, e.g.:
• reduction or attenuation of the high frequency steamjet noise by using multiport steaminjectors, which, on the other hand, can lead to increased coke formation under low-flowconditions; orifice design to cope with the latter drawback is essential
• siting of the injectors in a way that the jet streams can interact and reduce the mixing noise• increasing the efficiency of suppressant with better and more responsive forms of control• restricting steam pressure to <0.7 MPa gauge• using a silencer around the steam injector as an acoustic shield for the injectors• using air-blown flares or enclosed ground flares.
Further impacts are:
• light nuisance from elevated flares• odour nuisance because of insufficient combustion (mostly with ground flares).
It should be mentioned that flaring is involved in a significant number of fire and explosionevents in the chemical and petrochemical industries, as is reported by the French Ministry of theEnvironment (through its Bureau of Risk Analysis and Industrial Pollution). The results can befound in the AIDA database, managed by that organisation.
Monitoring [cww/tm/94]
The flow rate of the smoke suppressant to the flare tip has to be checked to ensure that sufficientsuppressant is introduced, but not more than is required to prevent smoking. This can beachieved in three different ways:
• by an array of thermo-couples rated for at least 1000 ºC• by a ground-based infra-red detector• by metering flare gas flow to the ratio of suppressant flow to flare gas flow. Flow control
usually takes place with control valves or, in the case of air-blown flares, with varying fanpitch, inlet vane pitch or blower speed.
A more stringent monitoring policy is required for ground flares because of health and safetyrisks.
Rapid response of the control system is essential, preferably by means of electronictransmission of control signals between the, usually remote, flare stack and the relevant controlroom. Installation of TV to monitor the flare in the control room should be considered to allow amanual intervention of suppressant control if this should be necessary.
For the pilot, the operational monitoring equipment to apply includes:
• thermo-couples (but beware of erroneous signals)• direct surveillance of the pilot flame (e.g. TV-surveillance)• infra-red monitoring (caution: water absorbs IR), sometimes modified with optical
monitoring to surmount the IR-absorption of water• luminosity measurement• UV-monitoring• ionisation probes• low-pressure alarm• flow control of the purge gas.
A device is required for continuous detection of the presence of the pilot flame.

Chapter 3
230 Waste Water and Waste Gas Treatment
Economics
Type of costs Elevated flare Ground flare RemarksCapital costs[per 1000 Nm3/h] USD 8300-560000 1
Operating costs[per 1000 Nm3/h] USD 420-36500 1
Cost effectiveness[per tonne pollutantcontrolled per year]
USD 14-6400 1
1 [cww/tm/117]
Flares considered are those with tips between 2.5 cm and 2.3 m in diameter, burning 100 %combustible waste gas with a heat content of approximately 17 MJ/Nm3 and operated between1 and 100 hours per year. Flares at the lower end of the capital and operating costs have a higherflow capacity (approximately 300000 Nm3/h) with a flare tip diameter of up to 2.3 m and areoperated 100 hours per year or more. The flares at the higher end of the cost ranges have lowerflow capacity (approximately 36 Nm3/h), flare tip diameters as small as 2.5 cm and are operatedfor fewer than 10 hours per year.
Because flares are primarily safety devices which deal with flows of short duration (generallyan upset condition or an accidental release from a process) rather than a control device whichtreats a continuous waste stream, it is not entirely appropriate to compare the cost effectivenessof flares to other control devices. Cost per tonne of pollutant controlled largely depends uponthe annual hours of operation. Infrequent use of the flare will result in greater cost per tonne ofpollutant controlled, while more frequent use means the lower costs per tonne of pollutantcontrolled.
3.5.3 Recovery and Abatement Techniques for Particulates
Particulate pollutants are dust, heavy metals and their compounds, aerosols, mist and soot,which can frequently be found in waste gas streams, flue gas streams and exhaust air streams inthe chemical industry. Dust particles and heavy metals (and/or compounds) are found inproduction waste gas streams, when solids and powdery compounds are handled, formed and/orstored, as well as in the flue gas or exhaust air streams of combustion sites, e.g. power plants orwaste incineration. Aerosols and mist appear, e.g., during reaction and work-up of productionmixtures. The common treatment systems are described below.
3.5.3.1 Separator
Description
The waste gas stream is passed into a chamber where the dust, aerosols and/or droplets areseparated from the gas under the influence of gravity / mass inertia, the effect increased byreducing the gas velocity by design means, e.g. baffles, lamellae or metal gauze.
The design should ensure a good uniform speed distribution inside the vessel. Preferential flowshave an adverse effect on efficiency. The employment of internal obstructions in the inertiaseparator enables operation at higher speeds, which represents a reduction in volume of theseparator compared with the settling chamber. The drawback is the increasing pressure drop.
Application
A separator is usually installed as a preliminary step to various dust filter systems, scrubbers,cooling towers etc. It is used, e.g., to prevent entrainment of the washing liquid with the purifiedwaste gas and/or to remove abrasive particles. It is not applicable to treat particulates in fluegas.

Chapter 3
Waste Water and Waste Gas Treatment 231
Application limits and restrictions are [cww/tm/70]:
Limits / restrictionsWaste gas flow[Nm3/h]
100–100000 1
Dust content No restrictionParticulate size >PM10, better >PM50
2
Temperature Normally about 540 °C, but dependent onvessel material 2
1 [cww/tm/70]2 [cww/tm/108]
Advantages/Disadvantages
Advantages Disadvantages• No moving parts, hence low maintenance.• Very low pressure drop.• Suitable for higher temperatures.
• Low removal efficiency, especially for smallparticles.
• Not suitable when the density differencebetween gas and particulates is small.
Achievable Emission Levels / Performance Rates
Parameter Performance rate[%]
Emission level[mg/Nm3] Remarks
PM 10–90 1 Dependent on PM sizeDroplets 100 1 In demisters1 [cww/tm/70]
Cross-media Effects
Consumable Amount RemarksWater (optional cleaning systemfor baffles or lamellae) 100–200 l/m2 1
Energy [kWh/1000 Nm3] Only for fanPressure drop [kPa] <0.5 11 [cww/tm/70]
Residues are the separated dust and/or the separated droplets which have to be disposed of whenre-use / recirculation is not possible. Depending on its source, the separated dust might becontaminated with toxic and hazardous content which needs to be considered for furthertreatment or disposal.
Economics
The capital costs are low but since the separator is usually integrated in other systems, a usefulfigure cannot be given.
3.5.3.2 Cyclone
Description
Cyclones use inertia to remove particles from the gas stream, imparting centrifugal forces,usually within a conical chamber. They operate by creating a double vortex inside the cyclonebody. The incoming gas is forced into circular motion down the cyclone near the inner surfaceof the cyclone tube. At the bottom the gas turns and spirals up through the centre of the tube andout of the top of the cyclone. Particles in the gas stream are forced toward the cyclone walls bythe centrifugal force of the spinning gas but are opposed by the fluid drag force of the gastravelling through and out of the cyclone. Large particles reach the cyclone wall and arecollected in a bottom hopper, whereas small particles leave the cyclone with the exiting gas.

Chapter 3
232 Waste Water and Waste Gas Treatment
Wet cyclones are high-efficiency units, spraying water into the waste gas stream to increase theweight of the particulate material and hence also removing fine material and increasing theseparation efficiency.
There are two types of cyclones, the reverse flow and the straight through cyclone [cww/tm/79]:
• the Reverse Flow Cyclone (see Figure 3.75 [cww/tm/79]), which is the most common,consists of:- a cylindrical shell with conical base- a dust collection hopper- an air inlet, either tangential or axial- outlets.
Figure 3.75: Reverse Flow Cyclone
• the Straight Through Cyclone (see Figure 3.76 [cww/tm/79]) is equipped with fixed ormoving impellers, the inlet gas channelling into a spiral, the clean gas concentrating alongthe centre axis and particulates concentrating near the wall.
Figure 3.76: Straight Through Cyclone

Chapter 3
Waste Water and Waste Gas Treatment 233
Application
Cyclones are used to control particulate material, and primarily PM >10 µm. There are,however, high efficiency cyclones designed to be effective even for PM2.5 [cww/tm/107].
Cyclones themselves are generally not adequate to meet air pollution regulations, but they servea purpose as precleaners for more expensive final control devices such as fabric filters (seeSection 3.5.3.5) or electrostatic precipitators (see Section 3.5.3.3). They are extensively usedafter spray drying operations and after crushing, grinding and calcining operations. Fossil fuel-fired industrial fuel combustion units commonly use multiple cyclones which operate withgreater efficiency than a single cyclone and can separate PM <2.5 µm.
Application limits and restrictions are:
Limits / restrictions1–100000 1,2, (single cyclone unit)Waste gas flow
[Nm3/h] up to 180000 2 (multiple cyclones inparallel)
Dust content[g/Nm3]
1–16000 2
Particulate size <PM2.5 -<PM200 2
Temperature dependent on vessel material, can be>1200 °C 1
1 [cww/tm/132]2 [cww/tm/107]
Advantages/Disadvantages
Advantages Disadvantages• Simplicity of the installation.• Recovery of raw material.• No moving parts, hence few maintenance
requirements and low operating costs.• Dry collection and disposal, except wet
cyclones.• Relatively small space requirements.
• Relatively low particulate collection,particularly for PM <10 µm.
• Axial entry cyclones cannot be used withparticles likely to cause excessive erosion orclogging of the vanes in the inlet.
• Unable to handle sticky or tacky materials.• Emission to waste water with wet cyclone.• Noise.
Achievable Emission Levels / Performance Rates
Cyclones perform more efficiently with higher pollutant loadings, provided that the device doesnot become choked. Higher pollutant loadings are generally associated with higher flow designs[cww/tm/107].
The collection efficiency of cyclones varies as a function of particle size and cyclone design. Itincreases with [cww/tm/107]:
• particle size and/or density• inlet duct velocity• cyclone body length• number of gas revolutions in the cyclone• ratio of cyclone body diameter/gas exit diameter• dust loading• smoothness of the cyclone inner wall.

Chapter 3
234 Waste Water and Waste Gas Treatment
The collection efficiency decreases with [cww/tm/107]:
• increasing gas viscosity• increasing gas density• increasing gas inlet duct area• leakage of air into the dust outlet.
Performance rate[%] Remarks
ParameterConventional High-
efficiencyHigh-
through-putMulti-
cyclonePM 70–90 1 80-99 1 80-99 1PM10 30-90 1 60-95 1 10-40 1
PM5 90 1 80-95 1
PM2.5 0-40 1 20-70 1 0-10 11 [cww/tm/107]
Cross-media Effects
Consumables are:
Consumable Amount Remarks
Water (wet cyclones)
Energy [kWh/1000 Nm3] 0.25–1.5 1
0.5–1 2 Low-efficiency units (highthroughput)
1–1.5 2 ConventionalPressure drop [kPa]
2–2.5 2 High-efficiency units1 [cww/tm/64]2 [cww/tm/107]
Dust is emitted as residue and has to be disposed of. The amount depends on the dust load of thewaste gas. Depending on its source, the separated dust can be contaminated with toxic and/orhazardous substances.
The operation of cyclones is a significant noise source which has to be abated, e.g. by enclosingthe equipment.
Monitoring [cww/tm/79]
A mass emission to assess the performance of a cyclone can be determined by monitoring theparticulate concentration in the effluent gas stream, using an isokinetic sampling probe or ameter based on, e.g., UV/visible opacity, beta rays or particle impingement.
Maintenance requirements for cyclones are low – there should be easy access to enable periodicinspection of the cyclone for erosion or corrosion. The pressure drop across the cyclone isroutinely monitored and the dust handling system is checked for blockages.

Chapter 3
Waste Water and Waste Gas Treatment 235
Economics
CostsType of costs Single conventional
cyclone Multiple cyclones Remarks
USD 1200-1500 1 USD 1100-1400 1Capital costs[per 1000 Nm3/h] EUR 900 2
USD 700-7800 1 USD 450-750 1Annual operating costs[per 1000 Nm3/h] EUR 200 2
Cost effectiveness[per tonne pollutantcontrolled per year]
USD 0.45-460 1 USD 0.32-50 1
1 [cww/tm/107]2 [cww/tm/70]
For the conventional single cyclone, flow rates are assumed to be between 1800 and43000 Nm3/h, PM loading between 2.3 and 230 g/Nm3 and control efficiency to be 90 %. Forthe multiple cyclone these are assumed to be between 36000 and 180000 Nm3/h and the samerange of pollutant loading and control efficiency.
As a rule, smaller units controlling a waste gas stream with a low PM concentration will bemore expensive (per unit flow rate and per quantity of pollutant controlled) than a large unitcontrolling a waste gas stream with a high PM concentration.
3.5.3.3 Electrostatic Precipitator (ESP)
Description
An ESP is a particulate control device that uses electrical forces to move particles entrainedwithin a waste gas stream onto collector plates. The entrained particles are given an electricalcharge when they pass through a corona where gaseous ions flow. Electrodes in the centre ofthe flow lane are maintained at high voltage and generate the electrical field that forces theparticles to the collector walls. The pulsating DC voltage required is in the range of 20–100 kV.
There are several types of ESP:
• the dry wire-plate ESP• the dry wire-pipe ESP• the wet wire-plate ESP• the wet wire-pipe ESP.
In the wire-plate ESP (see Figure 3.77 [cww/tm/79]), the waste gas flows horizontally andparallel to vertical plates of sheet material. The high voltage electrodes are long wires that areweighted and hang between the plates. Within each flow path, gas flow must pass each wire insequence as it flows through the unit.
In the wire-pipe ESP (or tubular ESP) (see Figure 3.78 [cww/tm/79]), the exhaust gas flowsvertically through conductive tubes, generally with many tubes operating in parallel. The highvoltage electrodes are long wires suspended from a frame in the upper part of the ESP that runthrough the axis of each tube.

Chapter 3
236 Waste Water and Waste Gas Treatment
Figure 3.77: Wire-Plate ESP
Figure 3.78: Wire-Pipe ESP
In dry ESP the collectors are knocked or rapped by various mechanical means to dislodge theparticulate matter, which slides downward into a hopper. The rapping procedure can projectsome of the particles back into the gas stream. The particles re-entrained in the last section ofthe ESP cannot be recaptured and so escape the unit. A part of the waste gas might also flow

Chapter 3
Waste Water and Waste Gas Treatment 237
around the charging zones. For this reason anti-sneakage baffles are placed to force thesneakage flow to mix with the main gas stream.
Dry wire-pipe ESP can be cleaned acoustically with sonic horns. In contrast to wire-plate ESP,wire-pipe ESP provide no sneakage paths around the collecting region, but field non-uniformities may allow some particles to avoid charging.
In wet ESP, the collectors are either intermittently or continuously washed by a spray of water,the collection hoppers replaced with a drainage system. The wet effluent is collected andtreated. Wet ESP require a source of wash water to be injected or sprayed near the top of thecollector pipes either continuously or at timed intervals. This wash system replaces the rappingor acoustic mechanism usually used by dry ESP. The water flows with the collected particlesinto a sump from which the fluid is pumped or drained. A portion of the fluid may be recycledto reduce the total amount of water required.
ESPs work as Single- or Two-Stage ESPs. In single-stage ESP, the electric field that generatesthe corona discharge is also employed to attract and hence remove the charged particles, withcharging and discharging taking place in one appliance. In a two-stage ESP, charging andremoval of the particles occur in separate electric fields, the second one being purelyelectrostatic.
The principal difference between single- and two-stage ESP is illustrated in Figure 3.79[cww/tm/79].
Figure 3.79: Schematic Diagram of Single-Stage and Two-Stage ESP
One of the main operation parameters is the specific collection area (SCA) – the ratio of thesurface area of the collection electrodes to the gas flow. Higher SCA equates to better removalefficiencies but also requires larger collectors. SCA normally are in the range of 40–160 s/m.
Systems with elevated risks, such as explosion and fire, must be equipped with safety devices,such as explosion hatch or sprinkler system.

Chapter 3
238 Waste Water and Waste Gas Treatment
Application
ESP are applied to remove particulate matter down to PM2.5 and smaller and hazardous airpollutants, such as most metals (with the notable exception of mercury).
Application areas in the chemical industry and related sectors are:
Sector ESP TypeBoilers Dry wire-plateChemical manufacture (e.g. sulphuric acid) Dry and wet wire-plate, dry and wet wire-pipeRefineries Dry wire-plateIncineration Dry wire-plate, dry and wet wire-pipe
Wet ESP are used in situations for which the dry variant is not suited, e.g.:
• wet and sticky material• flammable / explosive mixtures• material with high resistivity• when higher collection efficiencies are desired• to control acid mists.
The single-stage ESP is used in large complex flue gas treatment systems, e.g. in power stationsand waste incinerations as a dust and fly ash abatement. As part of the dust, heavy metals andtheir compounds are eliminated as well and disposed of together with the other particulates. It isalso suitable for separating aerosols and mists.
The two-stage ESP is applied to remove dust and oil mists. It is an alternative to surfacefiltration (HEPA-filter). The two-stage ESP is common where small waste gas streams(<25 Nm3/s) and a high proportion of submicron particles, e.g. smoke or oil mist, are involved.
Application limits and restrictions are:
Limits / restrictions360000–1800000 (dry wire-plate) 1
1800–180000 (dry wire-pipe) 2
180000–900000 (wet wire-plate) 3Typical waste gas flow[Nm3/h]
1800–180000 (wet wire-pipe) 4
up to 700 (dry ESP) 1,2Temperature[°C] <80 – 90 (wet ESP) 3,4
2–110 (wire-plate) 1,3Typical dust content[g/Nm3] 1–10 (wire-pipe) 2,4
Resistivity[Ώ cm]
5 x 10³–2 x 10¹⁰ 1,3
(dry ESP)Particulate size >PM1.0 (dry ESP)1 [cww/tm/125]2 [cww/tm/124]3 [cww/tm/127]4 [cww/tm/126]

Chapter 3
Waste Water and Waste Gas Treatment 239
Advantages/Disadvantages
Advantages Disadvantages• High efficiency even for small particles.• Suitable for wide temperature, pressure and
gas flow ranges.• Low pressure drop, hence energy requirement
tends to be low.• Wet ESP can also handle sticky particles,
mists and highly resistive or explosive dusts.
• Explosion risk with dry ESP.• The separation capacity depends on the
resistivity of dust particles (with dry ESP).• Re-entrainment can be a problem due to high
gas velocities, poor rapping or poor gas flow.• Corrosion near the top of the wires because of
air leakage and acid condensation, which isalso an issue with wet ESP.
• Sensitive to maintenance of the correctgeometrical alignment, e.g. wire dischargeelectrodes.
• Sensitive to fluctuations in gas streamconditions (flow rates, temperatures, PM andgas composition, particulate loading).
• Relatively large space required.• High quality personnel required.• Special precautions to protect personnel from
the high voltage.• Dry ESP not recommended to remove sticky
or moist particles.
Achievable Emission Levels / Performance Rates
The size of the ESP is the main factor in determining the collection efficiency. Other parametersthat affect the collection efficiency are:
• dust resistivity• composition of dust and gas• temperature• particulate size distribution.
Performance rate[%]Parameter
Dry ESP Wet ESPRemarks
total PM 99.0–99.2 1 99.0–99.2 2
PM10 97.1–99.4 1 97.1–99.2 2
PM2.5 96.0–99.2 1 97.4–99.2 2
Emission level[mg/Nm3]Parameter
Dry ESP Wet ESPRemarks
Dust 5–15 For well designed andproperly sized ESP
1 [cww/tm/125]2 [cww/tm/127]
Cross-media Effects
Consumables are:
Consumable Amount RemarksWater (for wet ESP)Energy [kWh/1000 Nm3] 0.5–2 1
0.05–0.3 1,2 Single-stage ESPPressure drop [kPa] 0.5 Two-stage ESP1 [cww/tm/64]2 [cww/tm/70]

Chapter 3
240 Waste Water and Waste Gas Treatment
With dry ESPs, the separated dust is emitted as residue; with wet ESPs the separated dustmerges with the rinsing water, being treated as waste water.
Depending on its source, the separated dust can be contaminated – e.g. dust originating fromincineration might contain dioxins and/or heavy metals and their oxides. This type of dust mightbe classified as hazardous waste that has to be disposed of accordingly.
Monitoring [cww/tm/79]
A mass emission to assess the performance of an ESP can be determined by monitoring theparticulate concentration in the effluent gas stream, using an isokinetic sampling probe ormeters based on, e.g. UV/visible opacity, beta rays or particle impingement. The current andvoltage across the ESP, the rapping rate and the temperature need to be routinely monitored.The dust outlet from the collection hopper has to be maintained free of blockages so that thehopper does not become overfilled and thus cause short circuiting of the ESP.
ESP need to be regularly inspected to detect any deterioration, e.g. corrosion, of the electrodes,insulating materials or rapping system. Hence, access to the precipitator needs to be free ofobstruction, but within safety standards.
Economics
CostsType of costs Dry wire-plate Wet wire-plate Dry wire-pipe Wet wire-pipeCapital costs[per 1000 Nm3/h] USD 8500-28000 1 USD 18000-36000 2 USD 18000-120000 3 USD 35000-180000 4
Annual operatingcosts[per 1000 Nm3/h]
USD 2400-24000 1 USD 3500-27000 2 USD 2800-5600 3 USD 4200-7000 4
Cost effectiveness[per tonne pollutantcontrolled per year]
USD 45-280 1 USD 60-600 2 USD 55-950 3 USD 90-950 4
1 [cww/tm/125]2 [cww/tm/127]3 [cww/tm/124]4 [cww/tm/126]
Costs can be substantially higher than the ranges shown for pollutants which require anunusually high level of control, or which require the ESP to be constructed of special materialssuch as stainless steel or titanium. In general, smaller units controlling a low concentrationwaste gas stream will not be as cost-effective as a large unit cleaning a high pollutant load flow.
3.5.3.4 Wet Dust Scrubber
Description
Wet dust scrubbing is a variation of wet gas scrubbing (see Section 3.5.1.4), using the same orequivalent techniques to abate or recover particulate matter additionally to gaseous compounds.The different scrubbers operated are mainly:
• Fibrous Packing ScrubberSee Section 3.5.1.4. It is mainly suitable for gaseous contaminants. For particulate matter, itis restricted to collecting fine and/or soluble particulate matter, aerosols and mists. Insolubleand/or coarse particulate clogs the fibre bed.
• Moving Bed ScrubbersSee Section 3.5.1.4.
• Plate ScrubbersSee Section 3.5.1.4. Their primary application is for particle removal.

Chapter 3
Waste Water and Waste Gas Treatment 241
• Spray TowersSee Section 3.5.1.4. Their primary application is particle removal. Spray towers are not asprone to fouling as packed-scrubbers, but very high liquid-to-gas ratios (>3 l/m3) arerequired to capture fine particulate.
• Impingement Entrainment ScrubbersImpingement entrainment scrubbers contain a mechanism to accelerate the inlet gas streamtowards a liquid surface and an entrainment separator. They are generally not suitable formass transfer applications, e.g. trace gas removal, but to handle high or low gas streams andoperate at lower pressure drops than venturi scrubbers.
An example is given in Figure 3.80 [cww/tm/79].
Figure 3.80: Impingement Entrainment Scrubber
• Venturi ScrubbersThe characteristic feature of a venturi scrubber is the constriction of the duct – venturithroat – causing an increase in gas velocity. Liquid is introduced to the scrubber and forms afilm on the walls, which is atomised by the gas stream in the venturi throat. Alternatively,with ejector venturi scrubbers, the liquid is sprayed into the venturi throat. Venturiscrubbers are highly efficient particle scrubbing devices, because they are suitable down tosubmicron particles. They can also be used to remove trace gases, particularly reactiveslurries. An example is given in Figure 3.81 [cww/tm/79].
A problem encountered with this technology is the erosion that can occur due to high throatvelocities. The venturi throat is sometimes fitted with a refractory lining to resist abrasionby dust particles. A flooded elbow located after the venturi throat reduces wear fromabrasive particles. The venturi is constructed of corrosion resistant material designed formaximum life expectancy. The final choice of material depends on factors such as:
• temperature• abrasion• corrosion• chemical attack.

Chapter 3
242 Waste Water and Waste Gas Treatment
Collection efficiency increases with gas velocity and pressure drop. Several venturiscrubbers have been designed to allow velocity control by varying the width of the venturithroat.
Generally, no pretreatment is required for venturi scrubbers, though in some cases the wastegas is quenched to reduce the temperature for scrubbers made of materials that can beaffected by high temperatures.
When the waste gas stream contains both particulate matter and gases to be controlled,venturi scrubbers can be used as a pretreatment device that removes the particulate matter toprevent clogging of a downstream waste gas treatment facility, such as a packed bedscrubber.
Figure 3.81: Venturi Scrubber
Application
See Table 3.16.

Chapter 3
Waste Water and Waste Gas Treatment 243
Fibrous Packing Moving Bed Plate Spray Towers ImpingementEntrainment Venturi
Collect fine and/orsoluble PMAs mist eliminator tocollect liquid aero-sols, inorganic andVOCControl aerosolemissions fromchemical, plastics,asphalt, sulphuricacid, surface coatingindustryOnly limited accep-tance for dust col-lection
Collection of≤PM10, ≤PM2.5,PMHAPInorganic fumes,vapours, gases,VOC;
Collection of≤PM10, ≤PM2.5,PMHAP,Inorganic fumes,vapours, gases,VOC;Often used as partof flue gas desul-phurisationOnly limited usagefor fine PM
Collection ofPM10-PM2;Used in pharmaceuti-cal processing andpackaging, manufac-turing of chemicals,rubber, plastics,ceramics, fertilisersProcesses controlledinclude dryers,cookers, crushing andgrinding operations,spraying, ventilation,material handling
Collection of ≤PM10,≤PM2.5, down tosubmicronControl PM emissionsfrom utility, industrial,commercial andinstitutional boilers firedwith coal, oil, wood andliquid wasteControl emissionsources in the chemicaland related industriesTypically applied wherehigh collection efficien-cies for fine PM arerequired
Gas flow [Nm3/h] 1800–170000 1 1700–130000 2 2500–170000 3 1700–90000 4 720–100000 5
<60 1 4–370 (PM) 2 4–370 (PM) 3Temperature [°C] 4–38 (gases) 2 4–38 (gases) 3 up to 150 4 4–370 5
Pollutant loading (PM)[g/Nm3] 0.2–11 1 No limits No limits up to 23 4 1–115 5
1 [cww/tm/110]2 [cww/tm/111]3 [cww/tm/114]4 [cww/tm/112]5 [cww/tm/115]
Table 3.16: Application and Application Limits and Restrictions of Different Wet Dust Scrubbers

Chapter 3
244 Waste Water and Waste Gas Treatment
Advantages/Disadvantages
Advantages DisadvantagesGeneral• Can handle flammable and explosive dusts
with little risk.• Provides cooling for hot gases.• Corrosive gases can be neutralised.• Simultaneous removal of dust and inorganic
compounds.
General• Effluent liquid can create water pollution
problems.• Waste product collected wet.• Protection against freezing required.• Collected PM may be contaminated and/or not
recyclable.• Off-gas may require reheating to avoid visible
plume.Fibrous Packing Scrubber• Can handle mists.• Relatively low pressure drop.
Fibrous Packing Scrubber• High potential for corrosion problems.• Not really suitable to collect PM, only for fine
and/or soluble PM.Plate Scrubbers• Provides gas absorption and dust collection in
a single unit.• Can handle mists.• Collection efficiency can vary.• Improves gas-slurry contact for SO2 removal.
Plate Scrubbers• High potential for corrosion problems.
Spray Towers• Ability to collect PM as well as gases.• Relatively free from plugging.• Relatively small space requirements.• Relatively low pressure drop.• Operation in highly corrosive atmospheres
possible with FRP construction.
Spray Towers• Relatively low mass-transfer efficiencies.• Relatively inefficient at removing fine PM.• With FRP construction, sensitive to
temperature.
Impingement Entrainment Scrubbers• Can handle mists.• Relatively low water recirculation rate.• Collection efficiency can vary.
Impingement Entrainment Scrubbers• High potential for corrosion problems.
Venturi Scrubbers• Can handle mists.• Relatively low maintenance.• Simple in design and easy to install.• Collection efficiency can be varied.• Also removes reactive gaseous contaminants.• Free from clogging.
Venturi Scrubbers• High potential for corrosion problems.• Relatively high pressure drop, and hence high
energy requirement. Noise may be a problemsince gas velocity at the venturi throat is high.
• Limited to PM and gases with high solubility.
Achievable Emission Levels / Performance Rates
The performance of scrubbing techniques is highly dependent on the size of the particulatematter and the aerosols to be collected. The performance rates are listed in Table 3.17.
Cross-media Effects
The consumables are listed in Table 3.17.
With a wet dust removal technique a secondary installation to separate the suspension isessential.
Depending on its source, the separated dust can be contaminated – e.g. dust originating fromincineration might contain dioxins and/or heavy metals and their oxides. This type of dust mightbe classified as hazardous waste that has to be disposed of accordingly.

Chapter 3
Waste Water and Waste Gas Treatment 245
Performance Rates[%]Parameter
Fibrous Packing Moving Bed Plate Spray Tower ImpingementEntrainment Venturi
PM 70->99 1 50–99 2 70->99 3 80–99 4 70->99 5,7
VOC 70->99 (mists) 1 50–95 3
SO2 80->99 2 80->99 3
HCl 90 7
HF 90 7
NH3 94-99 8 94-99 8
Consumable Amount of ConsumablesScrubbing water[l/Nm3] >3 3 0.5–5 6
Energy [kWh/1000 Nm3] 1–2 6 <0.5–6 6,7
Pressure drop [kPa] 1.5–2.8 6 2.5–20 6,7
Type of Costs CostsUSD 600-1800 1 USD 1300-7000 2 USD 500-2200 3 USD 2800-10000 4 USD 1900-17000 5Capital costs
[per 1000 Nm3/h] EUR 5000 a,7
USD 1000-21100 1 USD 1500-41100 2 USD 800-28100 3 USD 2200-42000 4 USD 2400-70000 5Annual operating costs[per 1000 Nm3/h] bCost effectiveness[per tonne pollutant] USD 40-710 1 USD 51-1300 2 USD 28-940 3 USD 88-1400 4 USD 84-2300 5
a at 10000 Nm3/h, scale-up factor to the power of 0.3b EUR [2500 + 100 x (flow/1000)]1 [cww/tm/110]2 [cww/tm/111]3 [cww/tm/114]4 [cww/tm/112]5 [cww/tm/115]6 [cww/tm/132]7 [cww/tm/70]8 [cww/tm/138] fertiliser industry, phosphoric acid as scrubbing liquor
Table 3.17: Performance Rates, Consumables and Costs of the Wet Dust Scrubber Variants

Chapter 3
246 Waste Water and Waste Gas Treatment
Scrubbing devices are sources of noise that needs to be abated accordingly, e.g. by housing theequipment.
Monitoring [cww/tm/70]
A mass emission to assess the performance of a wet scrubber can be determined by monitoringthe particulate concentration in the effluent gas stream, using an isokinetic sampling probe or ameter based on, for example, UV/visible opacity, beta rays or particle impingement. Thepressure drop across the scrubber and the liquid/reagent flow rate and feed pressure need to beroutinely monitored. Liquid-to-gas ratio, liquid blowdown rate and pH also need regularcontrol. Wet scrubbers should be inspected regularly to identify any deterioration in the plant,such as corrosion or blockages. There should be ready access to the scrubber.
Economics
The cost ranges for wet dust scrubbers are listed in Table 3.17. The estimated costs are based onan assumed inlet loading of particulate matter of approximately 7 g/Nm3. For applicationswhich require expensive materials, solvents or treatment methods, actual costs can besubstantially higher than the ranges shown. As a rule, smaller units controlling a low-concentration waste gas stream will be much more expensive (per unit flow rate) than a largeunit cleaning a high pollutant load flow.
3.5.3.5 Fabric Filter
Description
In a fabric filter, waste gas is passed through a tightly woven or felted fabric, causing particulatematter to be collected on the fabric by sieving or other mechanisms. Fabric filters can be in theform of sheets, cartridges or bags (the most common type) with a number of the individualfabric filter units housed together in a group. The dust cake that forms on the filter cansignificantly increase the collection efficiency.
Operating conditions are important determinants of the choice of fabrics. Some commonly usedfabrics are shown in Table 3.18.
Chemical resistancetoGeneric name of
fibreAcids Alkalis
Continuousoperatingtemp. in
moist heat[ºC]
Continuousoperating
temp.[°C]
Maximumpeaktemp.[°C]
Materialsupportscombus-
tion
Polyester good fair 94 132 150 yesCopolymer Acrylic good fair 110 120 130 nom-Aramide good good 177 200 240 noPolyphenylensulphide excellent excellent 190 190 232 noEthylenechlorotrifluo-roethene excellent excellent 177 177 190 no
Polytetrafluorethene excellent excellent 260 260 290 noPolyimide good good 240 260 280 noGlass very good fair 260 260 290 noStainless Steel good excellent 550 550 600 noCeramic very good good 760 760 1204 no
Table 3.18: Commonly Used Fabrics
Practical application of fabric filters requires the use of a large fabric area to avoid anunacceptable pressure drop across the fabric. An unacceptable pressure drop can cause failure ofthe filter housing, resulting in fugitive dust emissions. Baghouse size for a particular unit is

Chapter 3
Waste Water and Waste Gas Treatment 247
determined by the choice of the ratio of volumetric air flow to cloth area (a/c ratio). Theselection of a/c ratio depends on the particular loading and characteristics and the cleaningmethod used. A high particulate loading will require the use of a larger baghouse to avoidforming too heavy a dust cake, which would result in an excessive pressure drop.
Cleaning intensity and frequency are important variables in determining removal efficiency.Because the dust cake can provide a significant fraction of the fine particulate removalcapability of a fabric, cleaning which is too frequent or too intense will lower the removalefficiency. If removal is too infrequent or too ineffective, then the pressure drop will becometoo high.
Common fabric filter types according to their cleaning method are:
• reverse-air (or reverse-jet) cleaned fabric filter, using a gentler but sometimes lesseffective cleaning mechanism than mechanical shaking. Typically, the bags are open on thebottom, closed on top, the dust being captured on the inside or the outside of the bags. Toclean the filter, it is taken off-line and clean air is forced through it in the opposite direction,the dust cake falling off into the hopper. The typical cleaning cycle lasts about < 5 minutesper compartment. Reverse air cleaning alone is used only in cases where the dust releaseseasily from the fabric. In many instances, it is used in conjunction with shaking, pulsing orsonic horns.
• mechanical shaker cleaned fabric filter, using a simple and effective cleaningmechanism. The waste gas enters an inlet pipe equipped with a baffle plate, where largeparticles are removed when they strike the baffle plate and fall into the hopper. The ladengas is drawn from beneath a cell plate in the floor into the filter bags and passes from theinside to the outside, the particles collected on the inside bag surface. The tops of the bagsare attached to a shaker bar, which is moved briskly to clean the bags.
• pulse-jet cleaned fabric filters, using a relatively new method that can treat high dustloads, operate at constant pressure drop and occupy less space than other fabric filter types.They can only operate as external dust collection devices. The bags are closed at thebottom, open at the top and supported by internal retainers. The laden gas flows from theoutside to the inside of the bags, using diffusers to prevent oversized particles fromdamaging the bags, the particles being collected on the outside of the bags and droppinginto the hopper. Pulse-jet cleaning means the injection of a short burst (0.03–0.1 seconds) ofhigh pressurised (0.4–0.8 MPa) air into the bags. This mechanism ensures that the waste gasflow does not have to be stopped during cleaning. Felted, i.e. non-woven, fabrics are used inpulse-jet fabric filters because they do not require a dust cake to achieve high collectionefficiencies. Woven fabrics are found to leak a great deal of dust after cleaning when theyare used with pulse-jet fabric filters.
Sonic horns are increasingly being used to enhance the collection efficiency of mechanicalshaker and reverse-air fabric filters. They are operated with compressed air (0.3–0.6 MPa).Sonic horn cleaning significantly reduces the residual dust load on the bags and decreases thepressure drop across the filter fabric by 20–60 % as well as the mechanical stress on the bags,resulting in a longer operational life.
Corrosion of filter and housing material can be a problem if the gas stream consists of acidiccomponents, especially at temperatures below the dew point. For appropriate filter fabrics seeTable 3.18.

Chapter 3
248 Waste Water and Waste Gas Treatment
Other near relatives of the fabric filter are:
• Compact filter, which is also known as cassette filter or envelope filter, and is a version ofthe fabric filter. The distinction lies in the compact way in which the filter material is fitted.It is pleated, e.g. like a concertina, to obtain a far larger specific filtration surface. The spacesaving, however, is partly cancelled out by the lower fabric load of this type of filter.
• Improved compact filter, which is also known as sintamatic, sinter lamellae filter or Spirottube, is another version of the fabric filter. It consists of porous sintered material withpleated filter elements for the sintamatic or sinter lamellae filter, which provides a longerservice life and thereby reduced maintenance costs.
The gas temperature needs to be above the dew point of any constituent because otherwise thefilter fabric is clogged and the filtration process stops. To prevent this the baghouse might needto be insulated and possibly heated.
Systems with an elevated risk, such as explosion and fire, have to be equipped with safetyfacilities, such as explosion hatch or sprinkler system. On the inlet side of the filter, there shouldbe an explosion relief that opens to a safe place, e.g. outside the building. A trap for very hotparticles, released from boilers and furnaces, may be required to prevent fire and hence fabricdamage. Sparks or flames must not be admitted.
Application
Primarily the fabric filter is used to remove particulate matter down to <PM2.5 and hazardous airpollutants in particulate form (PMHAP), such as metals (exception mercury). In combination withinjection systems (including adsorption, dry lime / sodium bicarbonate injection and semi-drylime injection) upstream of the baghouse, it can also be applied to remove specific gaseouscontaminants.
Fabric filters are useful to collect particulate matter with electrical resistivities either too low ortoo high for ESP, hence they are suitable to collect fly ash from low-sulphur coal or fly ashcontaining high levels of unburnt carbon. The addition of a baghouse downstream of an ESPhas been found to achieve very low particulate emissions.When the waste gas loading consists of relatively large particulates, upstream mechanicalcollectors such as cyclones, ESP or spray coolers may be used to reduce the load for the fabricfilter, especially at high inlet concentrations.
Application limits and restrictions are:
Limits / restrictionsTypical waste gas flow[Nm3/h]
300–1800000 1
Temperature[°C]
see Table 3.18above dew point of any condensable inthe gas stream, otherwise filter is blinding<70 (improved compact filter) 2
Pressure range –6.4 to +6.4 kPa aroundatmospheric pressure 1
Dust content[g/Nm3]
1–23 (typical) 10.1–230 1
Particle properties sticky dusts are difficult to remove fromthe bags, hence they need to be avoided≤1 3 (reverse-air filter)<0.5 3 (mechanical shaker filter)a/c ratio a
[m/min] 1–1.5 (2.0) 3 b (pulse-jet filter)a recommended to ensure proper operation (see above)b higher value for special arrangements1 [cww/tm/123]2 [cww/tm/70]3 personal information

Chapter 3
Waste Water and Waste Gas Treatment 249
Advantages/Disadvantages
Advantages Disadvantages• In general, fabric filters provide high
collection efficiencies for coarse and fineparticles.
• Efficiency and pressure drop of continuouslycleaned filters are relatively unaffected bylarge changes in inlet dust loads.
• Dust is separated dry without usingconsumables. The separated dust might be re-used in the preceding process.
• Residual emissions are virtually independentof the intake concentration.
• Relatively simple operation.
• No wet or sticky dusts allowed as input.• Static electricity may hinder the cake to be
removed from the fabric.• There is an explosion risk.• Baghouse fires possible if very hot particles
are released from furnaces or because ofpyrophoric materials.
Achievable Emission Levels / Performance Rates
For a given combination of filter design and dust, the effluent particle concentration from afabric filter is nearly constant, whereas the overall efficiency is more likely to vary withparticulate loading. Thus, fabric filters can be considered to be constant outlet devices ratherthan constant efficiency devices.
Fabric filter Compact filter Improved compact filter
Parameter Performancerate[%]
Emissionlevel
[mg/Nm3]
Performancerate[%]
Emissionlevel
[mg/Nm3]
Performancerate[%]
Emissionlevel
[mg/Nm3]
PM 99-99.9 1 2-10 11 a 2 1-10 2 <1 2
a ceramic filter1 [cww/tm/123]2 [cww/tm/70]
Cross-media Effects
Consumables are:
Consumable Amount RemarksFilter fabric[m2 per 1000 Nm3/h] 11-17 a/c ratio 1–1.5 m/min
Precoating material (optional) for sticky or static dust or asfabric protection
Compressed air [per 1000] afor 0.3-0.6 MPa (sonic horn)for 0.4-0.8 MPa (pulse-jet) 2–2.5 1
filter cleaning
Energy [kWh/1000 Nm3] 0.2–1.2 20.5–2.0
0.5–2.5 2 fabric filter
0.5–1.8 1 compact filter and improvedcompact filterPressure drop [kPa]
5–50 ceramic filtera Nm3/h compressed air per 1000 Nm3/h gas1 [cww/tm/70]2 [cww/tm/64]
The separated dust – possibly mixed with pre-coat material – is the only residue. Its quantitydepends on the dust content of the incoming gas stream. Depending on its source, the separateddust can be contaminated – e.g. dust originating from incineration might contain dioxins and/orheavy metals and their oxides. This type of dust might be classified as hazardous waste that hasto be disposed of accordingly.

Chapter 3
250 Waste Water and Waste Gas Treatment
Monitoring [cww/tm/79]
Performance and maintenance have to be carefully monitored. The mass emission to assess theperformance of a fabric filter can be determined by monitoring the particulate concentration inthe effluent waste gas stream, using an isokinetic sampling probe or a meter based on, e.g.UV/visible opacity, triboelectric flow, beta rays or particle impingement.
Temperature and pressure drop across the fabric filter need to be routinely monitored. The latteris used to indicate when the cleaning cycle has to start. Fabric filters should be inspectedregularly to identify any deterioration of fabric or housing. Hence access to the fabric filtershould be available. Each baghouse should be equipped with a bag leak detection system withalarm.
Economics
The working life of filter material is about 5 years for fabric filter and compact filter and 8 yearsfor the improved compact filter.
CostsType of costs
Reverse-air Mechanicalshaker Pulse-jet Compact Improved
compactCapital [per1000 Nm3/h]
USD 5300-50000 1EUR 30000-55000 c 4 USD 4500-42000 2 USD 3700-15000 3 EUR 1000-4000 4 EUR 2500-4000 4
Plus sonic horn USD 300-400 1 USD 300-400 2 --Plus reverse jetequipment USD 600-1200 1 -- --
Annualoperating costs[per1000 Nm3/h]
USD 4000-16000 1d 4 USD 2600-14000 2 USD 3200-14000 3 a 4 b 4
Cost effective-ness [per tonnepollutant]
USD 58-372 1 USD 41-334 2 USD 46-293 3
a EUR 2500 + 300 x flow/1000b EUR 350 + 240 x flow/1000c ceramic filterd 350 + 300 x flow/10001 [cww/tm/123]2 [cww/tm/121]3 [cww/tm/122]4 [cww/tm/70]
The cost estimates assume a conventional design under typical operating conditions and do notinclude auxiliary equipment such as fans and ductwork. Costs are primarily driven by thevolumetric flow rate and pollutant loading of the waste gas stream. In general, a small unitcontrolling a low pollutant loading will not be as cost-effective as a large unit controlling a highpollutant loading. The costs presented are for flow rates between 3500 and 1700000 Nm3/hrespectively, and a pollutant loading of 9 g/Nm3.
Pollutants that require an unusually high level of control or that require the fabric filter bags orthe unit itself to be constructed of special materials will increase the costs of the system.
3.5.3.6 Catalytic Filtration
Description
Catalytic filtration is the elimination of gaseous components accompanied by particulateseparation. It is comparable to the operation of fabric filters (see Chapter 3.5.3.5). Thedistinction is between the filter materials, the catalytic filter being loaded with a catalyst(titanium/vanadium system) that destroys pollutants by catalytical gas reaction. The separateddust will be removed and disposed of separately.

Chapter 3
Waste Water and Waste Gas Treatment 251
The catalyst filter consists of an expanded polytetrafluoroethene (ePTFE) membrane, laminatedto a catalytic felt substrate. The catalyst is inserted into the felt substrate. It is installed asmodules in a baghouse, shown in Figure 3.82 [cww/tm/85], in such a way that it can be easilyfitted to an existing plant.
hopperdust
raw gas
clean gas
bag house cleaning frequencybetween 10 min. and 24 hours
gas phasecollector
particle filter
pump
sampling train
gas phasecollector
particle filter
pump
sampling train
sampling time 0,25 - 3 hoursdepending on
dust load
sampling time3 hours
180 - 250°C
< 120°C
< 120°C
Figure 3.82: Catalytic Filter Baghouse, including Sampling Trains
Application
Catalytic filtration is used to separate particulates and eliminate hazardous contaminants fromthe gaseous phase. The chief contaminants this technology is applied to are dioxins and furans(PCDD and PCDF). But other contaminants such as polyaromatic hydrocarbons (PAH),polychlorinated benzenes (PCBz), polychlorinated biphenyls (PCB), VOCs and chlorinatedphenols (PCP) can be eliminated as well.
Application limits and restrictions are:
Limits / restrictionsrecommended continuousoperating temperature range
160–260 ºC a
ammonia content <200 ppmsulphur oxides content <50 ppmmoisture content 5–35 %filtration velocity 48–84 m/hcritical substances deactivation by arsenium, potassium, calcium,
sulphura The upper limit of the temperature range is determined by the maximum continuousoperating temperature of the filter medium (260 ºC). The recommended maximum operatingtemperature is 250 °C to avoid over-temperature spikes. The lower limit of the temperaturerange is determined by the temperature at which dioxins and furans are adequatelydestroyed. Successful testing has been conducted at temperatures down to 155 °C.

Chapter 3
252 Waste Water and Waste Gas Treatment
Advantages/Disadvantages
Advantages Disadvantages• Destruction of hazardous gaseous compounds
without contaminated residues.• Reduction in the total release of hazardous
pollutants to the environment.• Easily retro-fittable.• No additional operating and maintenance
costs.• No additional solid waste to be disposed of.• No change in standard operating procedures.• Cost comparable to using powdered activated
carbon.
• Restricted to a maximum continuous operatingtemperature of 260 ºC
• Although the filter removes organics ingeneral, and dioxins and furans specifically, atall temperatures, a minimum continuousoperating temperature of 155 °C isrecommended for adequate destruction ofdioxins and furans. At lower temperatures,they are adsorbed on the catalyst.
Achievable Emission Levels / Performance Rates
ParameterPerformance
rate[%]
Emission level Remarks
Dust <1 mg/Nm3 1 typical>99 a,1 <0.004-0.040 ng/Nm3 1 waste incineratorsPCDD/PCDF (TEQ) <0.075 ng/Nm3 1
a up to 99.8 % observed1 information from manufacturer
Cross-media Effects
The separated dust – fly ash possibly mixed with acid gas sorbent material – is the only residuefor which disposal is required. The filtered dust contains up to 90 % less dioxins and furans thanwhen activated carbon is used. The dust is normally classified as non-hazardous waste.
The main utilities and consumables are:
Consumable Amount RemarkFilter materialCatalyst
working life of filter and catalystabout 5 years or even longer
Energy [kWh/1000 Nm3]Pressure drop [kPa]
Monitoring [cww/tm/79]
Performance and maintenance have to be monitored carefully. The mass emission to assess theperformance of the filter can be determined by monitoring the particulate concentration in theeffluent waste gas stream, using an isokinetic sampling probe or a meter based on, e.g.UV/visible opacity, beta rays or particle impingement. Catalyst activity can be monitored bytesting an individual filter removed from the baghouse. If there are reasons to suspect a fall incatalytic activity, monitoring of dioxins and furans via stack sampling can be performed.
Temperature and pressure drop across the bag filter need to be routinely monitored. The latter isused to indicate if it is necessary to begin the cleaning cycle. Bag filters should be inspectedregularly to identify any deterioration in the filter housing or filters. Hence access to the filtershould be available.
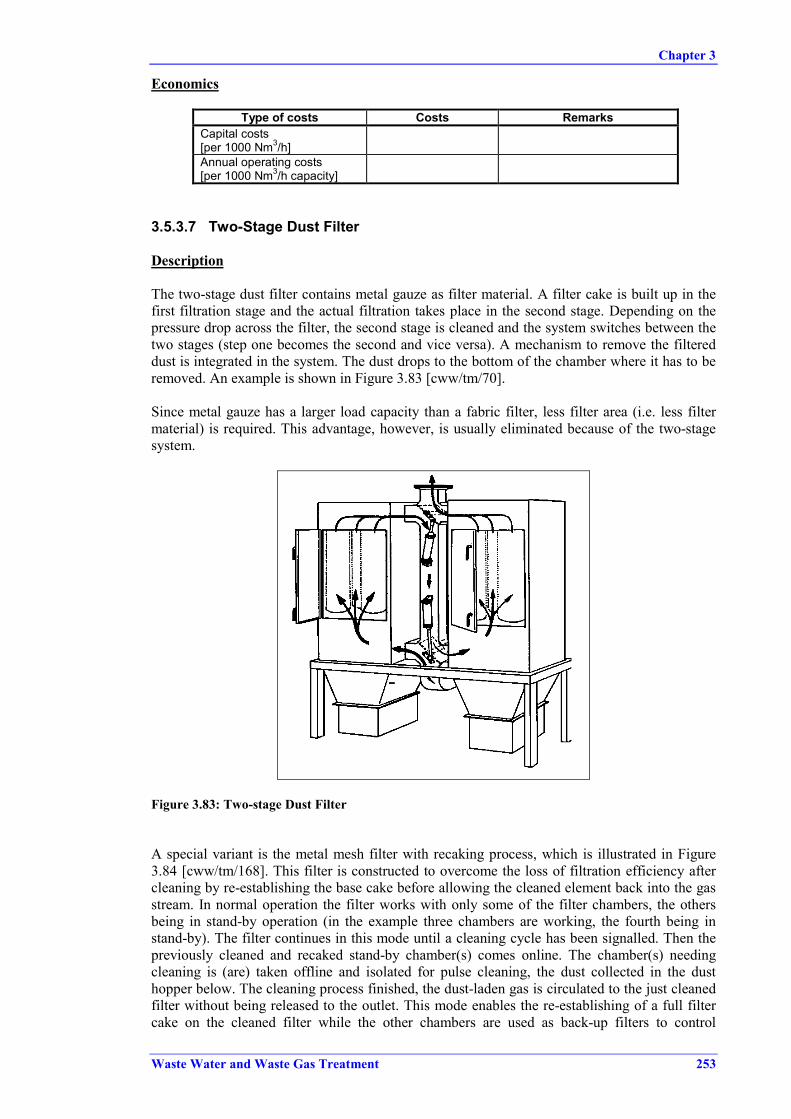
Chapter 3
Waste Water and Waste Gas Treatment 253
Economics
Type of costs Costs RemarksCapital costs[per 1000 Nm3/h]Annual operating costs[per 1000 Nm3/h capacity]
3.5.3.7 Two-Stage Dust Filter
Description
The two-stage dust filter contains metal gauze as filter material. A filter cake is built up in thefirst filtration stage and the actual filtration takes place in the second stage. Depending on thepressure drop across the filter, the second stage is cleaned and the system switches between thetwo stages (step one becomes the second and vice versa). A mechanism to remove the filtereddust is integrated in the system. The dust drops to the bottom of the chamber where it has to beremoved. An example is shown in Figure 3.83 [cww/tm/70].
Since metal gauze has a larger load capacity than a fabric filter, less filter area (i.e. less filtermaterial) is required. This advantage, however, is usually eliminated because of the two-stagesystem.
Figure 3.83: Two-stage Dust Filter
A special variant is the metal mesh filter with recaking process, which is illustrated in Figure3.84 [cww/tm/168]. This filter is constructed to overcome the loss of filtration efficiency aftercleaning by re-establishing the base cake before allowing the cleaned element back into the gasstream. In normal operation the filter works with only some of the filter chambers, the othersbeing in stand-by operation (in the example three chambers are working, the fourth being instand-by). The filter continues in this mode until a cleaning cycle has been signalled. Then thepreviously cleaned and recaked stand-by chamber(s) comes online. The chamber(s) needingcleaning is (are) taken offline and isolated for pulse cleaning, the dust collected in the dusthopper below. The cleaning process finished, the dust-laden gas is circulated to the just cleanedfilter without being released to the outlet. This mode enables the re-establishing of a full filtercake on the cleaned filter while the other chambers are used as back-up filters to control
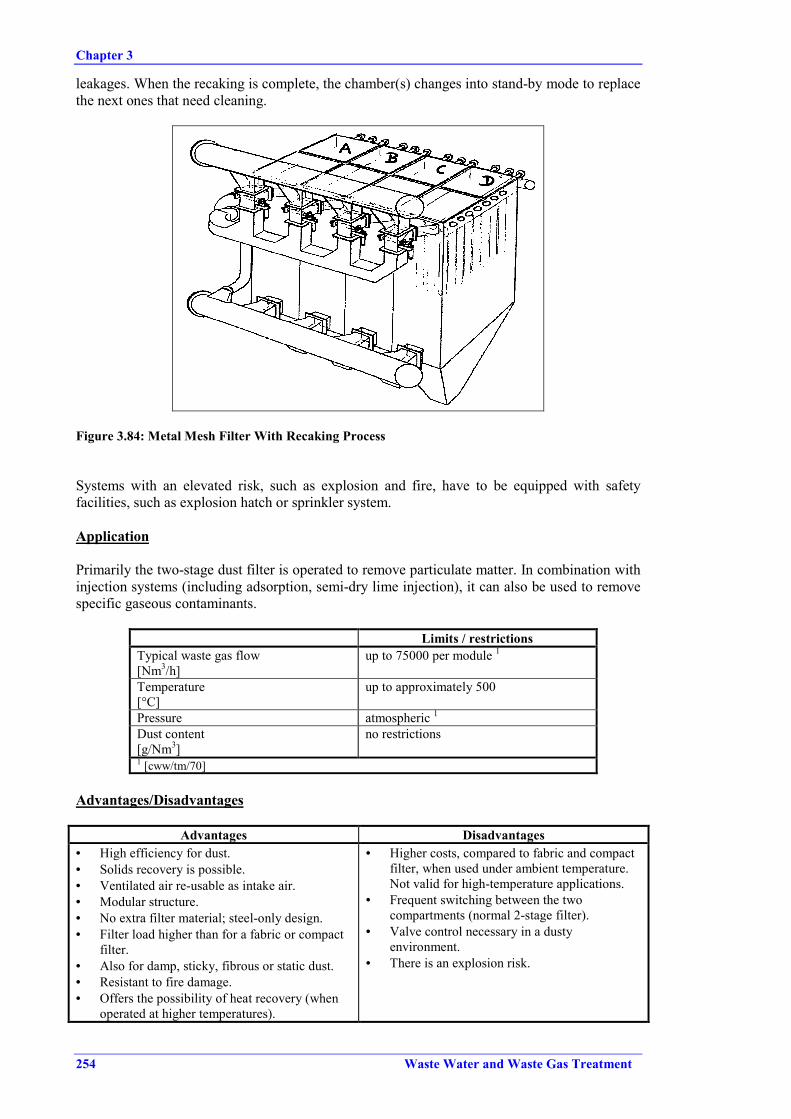
Chapter 3
254 Waste Water and Waste Gas Treatment
leakages. When the recaking is complete, the chamber(s) changes into stand-by mode to replacethe next ones that need cleaning.
Figure 3.84: Metal Mesh Filter With Recaking Process
Systems with an elevated risk, such as explosion and fire, have to be equipped with safetyfacilities, such as explosion hatch or sprinkler system.
Application
Primarily the two-stage dust filter is operated to remove particulate matter. In combination withinjection systems (including adsorption, semi-dry lime injection), it can also be used to removespecific gaseous contaminants.
Limits / restrictionsTypical waste gas flow[Nm3/h]
up to 75000 per module 1
Temperature[°C]
up to approximately 500
Pressure atmospheric 1
Dust content[g/Nm3]
no restrictions
1 [cww/tm/70]
Advantages/Disadvantages
Advantages Disadvantages• High efficiency for dust.• Solids recovery is possible.• Ventilated air re-usable as intake air.• Modular structure.• No extra filter material; steel-only design.• Filter load higher than for a fabric or compact
filter.• Also for damp, sticky, fibrous or static dust.• Resistant to fire damage.• Offers the possibility of heat recovery (when
operated at higher temperatures).
• Higher costs, compared to fabric and compactfilter, when used under ambient temperature.Not valid for high-temperature applications.
• Frequent switching between the twocompartments (normal 2-stage filter).
• Valve control necessary in a dustyenvironment.
• There is an explosion risk.
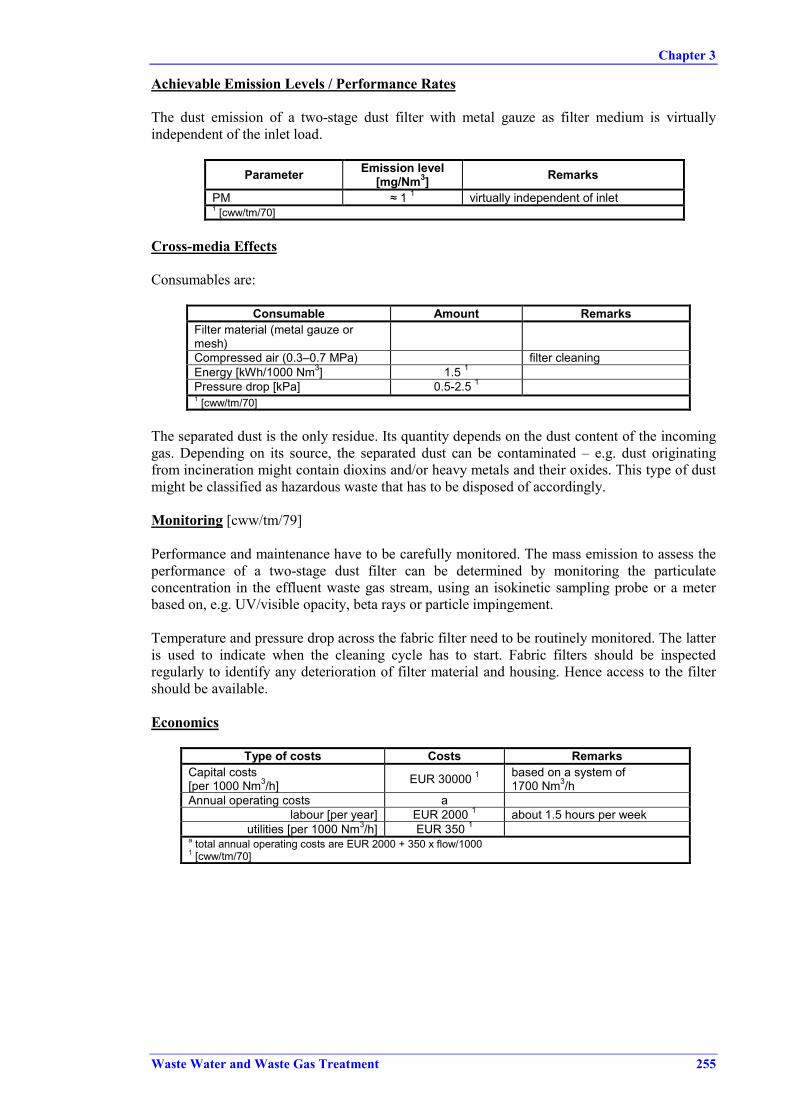
Chapter 3
Waste Water and Waste Gas Treatment 255
Achievable Emission Levels / Performance Rates
The dust emission of a two-stage dust filter with metal gauze as filter medium is virtuallyindependent of the inlet load.
Parameter Emission level[mg/Nm3] Remarks
PM ≈ 1 1 virtually independent of inlet1 [cww/tm/70]
Cross-media Effects
Consumables are:
Consumable Amount RemarksFilter material (metal gauze ormesh)Compressed air (0.3–0.7 MPa) filter cleaningEnergy [kWh/1000 Nm3] 1.5 1
Pressure drop [kPa] 0.5-2.5 11 [cww/tm/70]
The separated dust is the only residue. Its quantity depends on the dust content of the incominggas. Depending on its source, the separated dust can be contaminated – e.g. dust originatingfrom incineration might contain dioxins and/or heavy metals and their oxides. This type of dustmight be classified as hazardous waste that has to be disposed of accordingly.
Monitoring [cww/tm/79]
Performance and maintenance have to be carefully monitored. The mass emission to assess theperformance of a two-stage dust filter can be determined by monitoring the particulateconcentration in the effluent waste gas stream, using an isokinetic sampling probe or a meterbased on, e.g. UV/visible opacity, beta rays or particle impingement.
Temperature and pressure drop across the fabric filter need to be routinely monitored. The latteris used to indicate when the cleaning cycle has to start. Fabric filters should be inspectedregularly to identify any deterioration of filter material and housing. Hence access to the filtershould be available.
Economics
Type of costs Costs RemarksCapital costs[per 1000 Nm3/h] EUR 30000 1 based on a system of
1700 Nm3/hAnnual operating costs a
labour [per year] EUR 2000 1 about 1.5 hours per weekutilities [per 1000 Nm3/h] EUR 350 1
a total annual operating costs are EUR 2000 + 350 x flow/10001 [cww/tm/70]

Chapter 3
256 Waste Water and Waste Gas Treatment
3.5.3.8 Absolute Filter (HEPA-Filter)12
Description
The filter medium is paper or matted glass fibre with high packing density. The waste gasstream is passed through the filter medium, where particulate matter is collected. The dust cakethat forms on the filter medium can increase collection efficiency. The filter medium is pleatedto provide a smaller a/c ratio (volume flow rate to surface area).
The most common designs are a box filter cell and a cylindrical filter cell. In a box cell, thepleated medium is placed in a rigid, square frame constructed of wood or metal. The air flowsfrom the front to the back of the filter. In a cylindrical filter cell, a metal cap seals the mediumat one end. The air flows from the outside to the inside of the filter.
The filter can be mounted directly in the duct or in a separate housing. It requires pre-filteringfor large diameter particulate matter, hence HEPA filter systems are generally the finalcomponent in a removal system for particulate matter.
The number of filter cells used in a particular system is determined by the a/c ratio, the selectionof which is based on the particulate loading characteristics and the pressure drop across thefilter medium. Practical application of fibrous media filters requires the use of large media areasto minimise the pressure drop across the filter. The paper and non-woven filter media used havea larger pressure drop across the filter than the woven fabrics used in fabric filters. For thisreason, HEPA filters are mainly used at lower air flow rates and lower particulate loadings thanbaghouse designs. Once the air flow rate through the filter system decreases to an unacceptablepoint, the filter must be replaced. They are generally not cleaned, because cleaning action maycause leakage of the filter medium.
Application
HEPA filters are applicable to submicron particulate matter between PM0.12 and PM0.3 as well ashazardous air pollutants that are in particulate form, such as most heavy metals (exceptmercury).
HEPA filters are best applied in situations where high collection efficiency of submicronparticulate matter is required, where toxic and/or hazardous particulate matter cannot be cleanedby other filters, e.g. chemical and biological material. They are installed as the final componentin a collection system, downstream from other devices such as ESP or baghouses.
Limits / restrictionsWaste gas flow[Nm3/h]
100-3600 per module 1,2
Temperature[°C]
<200 2 (commercial HEPA)<530 2 (ceramic or glas packing)above dew point of waste gas
Pressure atmospheric 1
Dust content[g/Nm3]
1-30 2<2 3
Relative humidity[%]
<95 2
1 [cww/tm/70]2 [cww/tm/106]3 [cww/tm/64]
12 High Efficiency Particle Air Filter

Chapter 3
Waste Water and Waste Gas Treatment 257
HEPA filters require pre-filtering to remove large particulate matter, such as cyclones or venturiscrubbers to reduce large PM, standard baghouse or cartridge filters to filter out particulatematter >PM2.5.
Advantages/Disadvantages
Advantages Disadvantages• Separation of very small fractions is possible.• Very high efficiency with very low residual
emission.• Outlet air is very clean and can be recirculated
within the plant.• Modular structure.• Not sensitive to minor fluctuations in the waste
gas stream.• Relatively simple operation.• Usually no corrosion problems.
• Care has to be taken of explosive hazards.• High maintenance and frequent filter
replacement required.• Not suitable for moist environments.• Not suitable for high dust loads.• Glass fibre medium is not suitable for waste
gases containing alkalis.
Achievable Emission Levels / Performance Rates
Parameter Performance rate[%]
Emission level[mg/Nm3]
PM >0.0001 1
PM0.01 >99.99 2
PM0.1 >99.9999 21 [cww/tm/64]2 [cww/tm/106]
Cross-media Effects
Consumables are:
Consumable Amount RemarksFilter material (e.g. paper, glassfibre)Energy [kWh/1000 Nm3] <0.1 1
Pressure drop [kPa] 0.05–0.25 11 [cww/tm/70]
The loaded filter elements have to be disposed of as waste. Each module can absorbapproximately 1 kg of dust.
Monitoring [cww/tm/79]
Performance and maintenance have to be carefully monitored. The mass emission to assess theperformance of an absolute filter can be determined by monitoring the particulate concentrationin the effluent waste gas stream, using an isokinetic sampling probe or a meter based on, e.g.UV/visible opacity, beta rays or particle impingement.
Temperature and pressure drop across the fabric filter need to be routinely monitored. When thepressure drop reaches a point that prevents adequate air flow, the filter must be replaced anddisposed of.

Chapter 3
258 Waste Water and Waste Gas Treatment
Economics
Type of costs Costs RemarksCapital costs[per 1000 Nm3/h] USD 1800-2400 1
Annual operating costs a 2 application-specificannual labour costs EUR 2500 2 about 2 hours per weekannual consumable
[per 1000 Nm3/h] EUR 60-120 2
a total annual operating costs EUR 2500 + 60 x flow/10001 [cww/tm/106]2 [cww/tm/70]
3.5.3.9 High Efficiency Air Filter (HEAF)
Description
An HEAF is a flat bed filter in which aerosols combine into droplets. Highly viscous dropletsremain on the filter fabric and can eventually clog the filter. When a pre-set value of pressuredifference is reached, the filter fabric has to be replaced by a new and clean filter, which can beexchanged during continuous operation, because the filter fabric is set on a roll. The treatedwaste gas leaves the treatment device via a mist filter, which has to separate the entrained layerof viscous droplets.
Additionally a droplet separator is implemented for droplets with low viscosity. The design ofthe secondary droplet separator can be a lamellar type separator (inertia separator) or a mistfilter.
Application
HEAF are normally applied to remove aerosols such as oil, plasticisers and condensable VOCs.
Application limits and restrictions:
Limits / restrictionsTypical waste gas flow[Nm3/h]
up to 25000 1
Pressure atmospheric 11 [cww/tm/70]
Advantages/Disadvantages
Advantages Disadvantages• Continuous process.• Suitable for highly viscous droplets.
• High pressure drop.
Achievable Emission Levels / Performance Rates
Parameter Performance rate[%] Remarks
Droplets 99 1Aerosols 99 11 [cww/tm/70]

Chapter 3
Waste Water and Waste Gas Treatment 259
Cross-media Effects
Consumables are:
Consumable Amount RemarksFilter materialEnergy [kWh/1000 Nm3] <0.1 1
Pressure drop [kPa] 8 11 [cww/tm/70]
Residues to be disposed of are the loaded filter rolls, containing the contaminants separated asdroplets, aerosols and dust. They have to be disposed of as chemical or hazardous waste and areusually sent to waste incineration.
Economics
Type of costs Costs RemarksCapital costs[per 1000 Nm3/h] EUR 5700 – 8000 1
Annual operating costs[per 1000 Nm3/h]
annual labour costs about EUR 3000 1 about 2.5 hours per week1 [cww/tm/70]
3.5.3.10 Mist Filter
Description
The most common mist filters (mist eliminators, demisters) are mesh pads. Mesh pad filtersusually consist of woven or knitted metallic or synthetic material monofilament in either arandom or specific configuration and are operated as deep bed filtration, which takes place overthe entire depth of the filter. Solid dust particles remain in the filter until it is saturated and thushas to be cleaned by flushing. When the mist filter is used to collect droplets and/or aerosols, itis usually self-cleaning, drained by the liquid. They work by mechanical impingement and arevelocity-dependent. Baffle angle separators are also commonly used as mist filters.
The basis for the filter dimension is the waste gas flow rate, the outlet contents and the filterload.
Mist filters are designed to remove specific particle sizes. Because of the plugging potential ofhigh-efficiency mesh pads, washing is necessary on a regular schedule. If washing is neglected,the contaminants can solidify deep inside the pads and further pad flushing becomes ineffective.
Most mist filters incorporate access doors to facilitate the cleaning process. Special care shouldbe taken with reinstalling the media into the vessel to ensure that they properly fit and makecertain that there remain no gaps between the media and the vessel wall. Because of the highpressure drop across the mesh pad, gaps, however small, can create a bypass for the waste gasstream to avoid the filter.
Application
Mist filters are used to remove misty pollutants, such as droplets and aerosols. When the filtermaterial is cleaned in-situ, they are also applicable to solid particles soluble in liquids. Owing toclogging, they are less suitable for solid dusts and greasy vapours. They protect equipment fromsolid/liquid dust particles to prevent wear and friction on blower bearings and housings.

Chapter 3
260 Waste Water and Waste Gas Treatment
High-efficiency mist filters can be used as primary devices. They are an increasingly viableoption with regard to removal efficiency, water saving and economics in many processes thatevolve mists such as sulphuric acid, nickel compounds, sodium hydroxide, nitric acid andchromium compounds. Multi-stage mist filters to control mist emissions have been tested withgood results. The rationale to use these kind of filters is to collect most of the particles in thefirst stage, thereby protecting the subsequent stages that are designed to handle the smallerparticles. A good way to accomplish this is a three- or four-stage unit, using a monofilamentand voids configuration in the first stages and gradually decreasing monofilament size and voidsdownstream from stage to stage. Each stage is flushed with fresh water. Individual drainchambers should be used to prevent the wash water with the highest concentration ofcontaminant from flowing into the next stage.
As secondary devices, mist filters are widely used as the final stage of wet scrubbers to preventre-entrained scrubbing solution to be carried into the clean gas discharging into the air. A mistfilter is situated at the top part of the column to collect the droplets, which coalesce and fallback into the column. The design of the mist filter is critical if low pollutant concentrations(high control efficiencies) are to be achieved and if solvent losses in absorbers, scrubbers ordistillation equipment need to be reduced.
Application limits and restrictions [cww/tm/70]:
Limits / restrictionsTypical waste gas flow[Nm3/h]
up to 150000 1
Temperature[°C]
<170 1
Dust content[mg/Nm3]
<1 1
Aerosols a few g/Nm3 11 [cww/tm/70]
Advantages/Disadvantages
Advantages Disadvantages• Self–cleaning systems for the collection of
liquids.• Suitable for filtration of liquid aerosols, also as
primary device.
• The cleaning of the filter results in acontaminated washing liquid.
• High pressure drop with solid dust particles.• Clogging risk.
Achievable Emission Levels / Performance Rates
Parameter Performance rate[%] Remarks
Dust 99 1Aerosols 99 11 [cww/tm/70]
Smaller monofilaments and tighter voids in mesh pads are more efficient in removing smallerparticles (sizes 1–3 µm), but they have a greater potential for plugging and require more careand maintenance. The most effective mesh pad has a filament diameter and void space largeenough to minimise plugging potential and have a functional liquid drainage capacity. Thismesh pad configuration is usually effective on particles of 5–10 µm in diameter.

Chapter 3
Waste Water and Waste Gas Treatment 261
Cross-media Effects
Consumables are:
Consumable Amount RemarksFilter materialWashing liquid for cleaningEnergy [kWh/1000 Nm3]
2.5 1 normalPressure drop [kPa] 9.0 1 big loads1 [cww/tm/70]
Residues to be disposed of are the washing liquid, which contains filtered dust, and the loadedfilter material. The washing liquid either has to undergo waste water treatment or is disposed ofas waste, e.g. incinerated. When the mist filter is installed after a wet scrubber, the washingliquid is usually recycled to the scrubber.
Monitoring
The pressure drop of each individual stage of the mist filter needs to be monitored, e.g. bymagnahelic or photohelic gauge.
Economics
Type of costs Costs RemarksCapital costs[per 1000 Nm3/h] EUR 2300 1 for small systems up to
2000 Nm3/hAnnual operating costs[per 1000 Nm3/h] a 1
annual labour costs EUR 2500 1 about 2 hours per weekconsumables
[per 1000 Nm3/h] EUR 250-600a annual total operating costs EUR 2500 + 450 x flow/10001 [cww/tm/70]
3.5.4 Recovery and Abatement Techniques for Gaseous Pollutants inExhaust Gases
Pollutants in flue gas from high-temperature (e.g. thermal and catalytic oxidation) and chemicalprocesses are particulates and gases such as sulphur dioxide, NOx, hydrogen halides and, underspecial conditions, dioxins. Particulates and NOx in flue gas are abated (see Sections 3.5.3 forparticulates and 3.5.4.2 for NOx). Hydrogen chloride and sulphur dioxide, however, can berecovered. The treatment of hydrogen chloride and sulphur dioxide often follows a two-stageprocess:
• wet scrubbing with water (see Section 3.5.1.4) to produce a concentrated hydrochloric acid• various desulphurisation processes (see Section 3.5.1.4 and 3.5.4.1) to produce gypsum or
sulphuric acid.
Common flue gas treatment techniques in the chemical sector, additional to wet gas scrubbing(Sections 3.5.1.4 and 3.5.3.4), are described below.

Chapter 3
262 Waste Water and Waste Gas Treatment
3.5.4.1 Sorbent Injection as FGD13 Techniques
Description
The reaction principle of FGD sorbent injection is the introduction of reactive material to, andits dispersion in, the waste gas stream. This material reacts with SOx species to form a solid,which has to be removed afterwards from the waste gas stream. The most used sorbents are:
• lime• sodium hydrogencarbonate (sodium bicarbonate)• sodium carbonate (soda.).
The choice of the sorbent depends on its availability. It is in most cases a naturally occurringmaterial, such as limestone, dolomite or hydrated compounds derived from these raw materials.
These sorbents are also effective in removing other acid gases, particularly hydrogen chlorideand fluoride. If these acid gases are intended to be recovered, the waste gas needs to bepretreated (water scrubbing, see Section 3.5.1.4).
There are three types of sorbent injection techniques:
• dry sorbent injection• semi-dry (or semi-wet) injection• wet injection of lime milk.
With dry sorbent injection, the fine powdered sorbent is either injected into the flue gas streamor added to a reaction tower, the latter being the more efficient method. When the sorbent isinjected into the gas stream, this can be done at various positions according to the temperatureand conditions at which it is most reactive. This is illustrated in Figure 3.85 [cww/tm/79].
Figure 3.85: Dry Sorbent Injection for Sulphur Dioxide Removal (Injection Positions)
13 Flue Gas Desulphurisation

Chapter 3
Waste Water and Waste Gas Treatment 263
Commonly used injection positions and adequate sorbents are [cww/tm/79]:
• furnace injection of limestone at temperatures between 1100 and 1250 ºC• heat exchanger injection of slaked lime at temperatures of about 550 ºC• post-furnace injection of slaked lime at relatively high humidity at temperatures of 5–15 ºC
above flue gas saturation• post-furnace injection of sodium-based compounds, e.g. sodium bicarbonate, between heat
exchanger and particulate abatement device, at a temperature range between 130 and 180 ºCor, when the filter medium allows it, up to 400 °C.
With semi-dry sorbent injection, the sorbent is added as a suspension or solution (droplets) ina reaction chamber in such a way that the liquid is continuously evaporating during the reaction.The result is a dry product, collected at the base of the chamber or in a particulate abatementdevice. The technique is illustrated in Figure 3.86 [cww/tm/79] using a fabric filter asparticulate abatement, which can be replaced by an ESP.
The semi-dry system consists of:
• the spray dryer, i.e. atomiser and reaction chamber (a tower or duct, droplets and flue gasflowing co-currently)
• associated slurry/liquid equipment (lime slurries or sodium carbonate/bicarbonate solutions)• a particulate collection device• a particulate recycling device.
Figure 3.86: Spray or Semi-dry FGD System
With wet injection, SO2 is removed from the flue gas in the FGD absorber by direct contactwith an aqueous suspension of finely ground limestone (lime milk), after having left theparticulate control system and passed through a heat exchanger. The scrubbed flue gas passesthrough a mist eliminator and is released to the atmosphere by a stack or cooling tower. Thereaction products are withdrawn from the absorber and sent for dewatering and furtherprocessing.

Chapter 3
264 Waste Water and Waste Gas Treatment
The process is divided into:
• absorption of SO2 by the scrubbing liquid in the pH range of 4-5.5, the primary productbeing calcium bisulphite [Ca(HSO3)2]
• oxidation of the bisulphite to sulphate• crystallisation of the formed gypsum (CaSO4 . 2 H2O)• separation of the gypsum crystals from the solution.
The technique is illustrated in Figure 3.87.
Figure 3.87: Wet FGD System: Lime Milk Scrubber
The solid part of the scrubber cycle is principally gypsum with a concentration of 100-120 g/l.Modern incineration units operate with a fairly rich mix, the oxygen content of the flue gasoften not sufficient to complete the bisulphite oxidation, which requires the blowing of air intothe scrubber sump. To prevent fouling of the clean gas channel, FGD units are normallyequipped with mist eliminators.
The level of desulphurisation depends on the liquid to gas (L/G) ratio. The transverse turbulencebetween liquid and gas can be increased with high gas stream rates, by which the mass transferand – consequently – the level of desulphurisation are improved. On the other hand it ischaracteristic for co-current units that high gas rates reduce the residence time and thus the levelof desulphurisation.
To reduce the chloride concentration in the scrubbing liquid below 30 g/l, part of it is separatedfrom the process and treated to remove heavy metals and COD. Fresh lime milk is added toreplace the blowdown.
The treated flue gas leaves the FGD unit in a more or less saturated state. To ensure that the dewpoint is exceeded, a reheating stage (normally a regenerative gas preheater) and sufficient up-draught in the stack or cooling tower are required.

Chapter 3
Waste Water and Waste Gas Treatment 265
The adequate particle abatement techniques to remove the dry material both from dry and semi-dry systems are ESP or fabric filters. If fabric filters are used, the flue gas normally requirescooling, either by heat exchanger or cooling air, to keep the temperature below 200 °C (exceptwith fabrics suitable for higher temperatures, such as ceramics or metal gauze/mesh).
The temperature at which maximum abatement efficiency is achieved varies from component tocomponent. Furthermore, there is a different reactivity of waste gas pollutants with the variousabsorbents and competing reactions occur between the different species, especially if the ratioof reagent to acidic gases is relatively low. Therefore, the different absorption rates aredependent on the specific amount of absorption agent, waste gas composition (such aspollutants, humidity, oxygen content) and reaction temperature. The absorption rates due to thenature of the gas/solid reaction are highly dependent on the active specific area of the absorbentand the residence time. Therefore, it is normally necessary to have an over-stoichiometric ratioof absorbent.
The abatement rates for species such as HCl and SO2 decrease drastically with decreasingtemperature and are at a minimum in the range between 200 and 280 °C. Below 200 °C, theabatement rates increase and can achieve good results for most pollutants.
Application
Dry and semi-dry sorbent injection are typically used to reduce emissions of acidic gases. Thedry variant is also suitable for smaller plants or for retrofitting applications where the capitalexpenditure for other systems might be very high. To reduce other contaminants, grained carbon(GAC) can be added to the dry sorbent.
Application limits and restrictions [cww/tm/70]:
Limits / restrictions10000–300000 (dry sorbent)up to 1000000 1 (semi-dry sorbent)Typical waste gas flow
[Nm3/h]50-500000 1 (wet sorption)
SOx concentration wide rangeHydrogen halide concentration wide range1 [cww/tm/70]
Advantages/Disadvantages
Advantages DisadvantagesDry sorbent variant• No extra installations are necessary, since a
dust removal system is usually installed.• High efficiency if a well designed reaction
chamber or tower is installed.• Low cost system compared with others.
Dry sorbent variant• The added sorbent can, by interacting with fly
ash, cause fouling of heat exchanger surfaces.• Large surplus of sorbent that has to be
disposed of.
Semi-dry sorbent variant• Relatively simple installation.• Cheaper than wet scrubbing.• No waste water produced.
Semi-dry sorbent variant• Low particulate separation performance in the
reaction chamber.• Humidity can be a disturbance, if fabric filter
is used as subsequent particulate abatement.Wet sorbent variant• Very high efficiencies.• Compact equipment.• Can operate at relatively high temperatures
(50-80 °C).• Indirect monitoring through stoichiometric
dosing of chemicals (if pH controlled).• Re-usable product, when lime is used
(gypsum).
Wet sorbent variant• Arising of waste water.• High water consumption, compared with dry
and semi-dry variant.

Chapter 3
266 Waste Water and Waste Gas Treatment
Achievable Emission Levels / Performance Rates
As mentioned above, the reductions achieved depend on different factors including waste gastemperature, the molar ratio between sorbent and pollutant and the dispersion of the sorbent.Various efficiencies under various conditions are given in Table 3.19 - Table 3.22.
Performance rate [%]ESP Bag filterPollutant
about 400 °C 200–280 °C 130–240 °CSO2 50 10 10SO3 80 90 95HCl 70 35 80HF 95 95 95Ref.: VDI Guidelines 2578, Nov. 1997
Table 3.19: Dry Sorption Performance Rates for Lime as Sorbent with Different Temperatures andDust Abatement Systems
SOx abatement rate [%]Molar ratioCa/S 130–140 °C 170–180 °C
1 30 222 50 403 70 55
Ref.: Les techniques de désulfuration des procédés industriels, ADEME 1999
Table 3.20: Dry Sorption SOx Abatement Rates for Lime with Different Temperature Ranges andCa/S Molar Ratios
Molar ratioCa/S
SOx abatement rate[%]
1 801.5 902 92
Ref.: Les techniques de désulfuration des procédés industriels, ADEME 1999
Table 3.21: Semi-dry Sorption SOx Abatement Rates for Lime with Different Ca/S Molar Ratios
Abatement rates [%]Pollutant Dry sorption a Semi-dry sorptionSO2 <50 90–95SO3 90HCl 50–75 >90HF 10-40 >85a temperature range 300–400 °C
Table 3.22: Abatement Rates for Dry and Semi-dry Sorption with Sodium Carbonate
Under normal conditions achievable emission levels / performance rates are:
Dry sorption Semi-dry sorption Wet sorption
Contaminant Performancerate[%]
Emissionlevel a
[mg/Nm3]
Performancerate[%]
Emissionlevel
[mg/Nm3]
Performancerate[%]
Emissionlevel
[mg/Nm3]SOx 40-80 1 b <40 85->90 1,2 <40 90-97 c <40 2
HCl <10 2 >99 1 <10 2 <10 2
HF <1 2 <1 2 <1 2a achievable emission levels, but normally dry sorption is not used for such low concentrations, where wet scrubbing orsorption might be the preferred techniqueb use of fabric filters can increase abatement efficiency by about 10 % 1
c dependent on L/G ratio (90 % with 8 l/Nm3, 95 % with 14 l/Nm3, 97 % with 20 l/Nm3)1 [cww/tm/79]2 [cww/tm/70]

Chapter 3
Waste Water and Waste Gas Treatment 267
An effect on NOx emissions has been reported when using sodium carbonate orhydrogencarbonate in the semi-dry process, for sodium hydrogencarbonate the optimal range isbetween 120 and 160 °C. The efficiency depends on the SO2/NOx ratio. The abatement rate isfavoured by a high ratio and moderate temperatures [BREF on Glass Manufacturing Industry,2000].
Cross-media Effects
AmountConsumable Dry sorption Semi-dry sorption Wet sorptionSorbent a[Ca/S molar ratio] 3 and more (for lime) 1.5–3 (for lime) <1.1 1
Water b[l/Nm3] - 0.027–0.04 2 8-20 c
Energy[kWh/1000 Nm3]
dependent on dustremoval system 1 3
Pressure drop[kPa]
dependent on dustremoval system
2.5 3
a sodium hydrogencarbonate requires a considerable smaller excessb L/G ratioc 8 l/Nm3 corresponding with 90 %, 14 l/Nm3 with 95 % and 20 l/Nm3 with 97 % desulphurisation1 [cww/tm/132]2 [cww/tm/79]3 [cww/tm/70]
In the case of dry and semi-dry sorption, the residue is a mixture of the original sorbent and thereaction products and, if it cannot be recovered or recycled, has to be disposed of. Included areall pollutants that have not been destroyed during the incineration process, such as heavy metalcompounds and/or dioxins, depending on the input of the incineration installation. Sometimesthe dust is partially recycled.
With wet sorption, the residue is gypsum of high purity (>99 % CaSO4 in the solid)[cww/tm/132], which can be used elsewhere.
Monitoring [cww/tm/79]
The performance of the dry sorbent and semi-dry sorbent injection system is examined bydetermining the acidic gas concentration and particulate abatement efficiencies.
Temperature and pressure drop (and liquid / gas flow ratio with the semi-dry variant) areroutinely monitored across the (bag) filter. When an ESP is used, electric current and fieldstrength are monitored to give warning of any malfunction in the particulate abatement device.
Economics
CostsType of costs Dry sorption Semi-dry sorption Wet sorptionCapital costs[per 1000 Nm3/h] EUR 11000 1 c
Annual operating costs[per 1000 Nm3/h]
a 1 d 1
annual labour costs EUR 2500 1 b EUR 20000 1 e
annual utilities cost EUR 150 + sorbent 1 EUR 250 + sorbent 1
a annual total operating costs EUR 2500 + 300 x flow/1000 + sorbentb estimated 2 hours per weekc based on 100000 Nm3/hd annual total operating costs EUR 20000 + 400 x flow/1000 + sorbente estimated 1 day per week1 [cww/tm/70]

Chapter 3
268 Waste Water and Waste Gas Treatment
3.5.4.2 Selective Reduction of NOx (SNCR and SCR)14
Description
Selective reduction of NOx involves the injection of NH2-X compounds (with X = H, CN orCONH2) into the flue gas stream, reducing nitrogen oxides to nitrogen and water. The mostcommon reduction agent is a 25 % aqueous solution of ammonia or pure ammonia. Otherreaction agents are urea solutions, nitrolime or cyanamide.
There are different variants of selective NOx reduction:
• selective non-catalytic reduction (SNCR)• selective catalytic reduction (SCR).
With SNCR, the reduction agent is injected in the area where the exhaust gases have reached atemperature between 930 and 980 ºC, whereas urea is injected in an area where the gastemperature is between 950 and 1050 ºC. The injection occurs after combustion and beforeother treatment. Temperature, NH3/NOx molar ratio and residence time are the main parametersfor optimum reduction efficiency. Temperatures below the level mentioned above causeunconverted ammonia to be emitted (ammonia slip); temperatures significantly above the leveloxidise ammonia to NOx. SNCR is operated with a NH3/NOx molar ratio range of 0.5–0.9. Athigher levels (>1.2) ammonia slip can also occur, generating aerosols of ammonium chlorideand sulphate, which pass through the filter and cause visible white plumes above the exhaustgas stack. The residence time and mixing quality are decisive for the reaction efficiency. Tooshort a residence time will cause ammonia slip.
With SCR, the exhaust gas stream and the injected agent are passed over a catalyst, withoperation temperatures between 200 and 500 °C, dependent on the catalyst. The optimummixing, i.e. NH3/NOx molar ratio, over the catalyst is vital. The molar ratio level is usually keptbelow 1.1 to limit the potential for ammonia slip.
The considerably lower temperatures compared to SNCR make possible the installation of SCRdownstream of other treatment devices such as dust abatement and FGD. With this “cold”Denox process, a mixture of air (to control optimum oxygen content) and ammonia is addedafter FGD. The desulphurised flue gas stream needs to be reheated at the necessary reactiontemperature. The advantage of this procedure is that, because there is no adsorption to dust,there is no potential for ammonia slip.
The equipment of SNCR and SCR consists of:
• aqueous ammonia (or other agents) storage tank• the vaporiser• a carrier gas supply, steam or compressed air• injector nozzles• the catalyst bed (with SCR).
The main components of catalysts are titanium dioxide with vanadium, tungsten andmolybdenum compounds.
There are other techniques that treat sulphur dioxide and NOx in either consecutive orsimultaneous operations, such as [cww/tm/50]:
14 Selective Non-catalytic Reduction and Selective Catalytic Reduction

Chapter 3
Waste Water and Waste Gas Treatment 269
• Desonox process, where the dedusted flue gas is mixed with ammonia and passed at 450 °Cover a catalyst to reduce NOx and then over a catalyst to convert SO2 to SO3, which reactsto sulphuric acid
• absorption of NO (90 % of NOx in flue gas is NO) and SO2 with chelates (to bind NO) insodium bicarbonate solutions and redox reaction of NO-complex with sulphite to nitrogengas.
Application
SNCR and SCR are used to abate nitrogen oxides from processes such as chemical production,combustion or process furnaces. High dust, low dust and tail end configurations are availablewith SCR.
Application limits and restrictions:
Limits / restrictionsSNCR SCR
Typical waste gas flow[Nm3/h] >10000 up to 1000000 1
NOx concentration in the range of g/Nm3 1 in the range of g/Nm3 1
Temperature[°C] 800–1100 (dependent on agent) 200–500 (dependent on catalyst)
Pressure atmospheric 1 atmospheric 1
Residence time[s] 1–2
NH3/NOx molar ratio <1.2 <1.11 [cww/tm/70]
Advantages/Disadvantages
Advantages DisadvantagesGeneral• Both SNCR and SCR are generally proven
techniques.
General• Safety is of paramount importance when liquid
ammonia systems are used.SNCR• Under correct conditions good NOx reduction
achievable.• Relatively simple installation, though much
know-how is needed to locate the ammoniainjectors properly.
• Low capital costs compared to alternatives.• Low energy requirements.
SNCR• High temperature necessary.• Fly ashes contain ammonia.• Outside the operational condition range
(temperature, NH3/NOx ratio, residence time)ammonia slip or increased NOx emission.
SCR• Very high NOx reduction efficiency, higher
than with SNCR, and lower NOx emissions.• Reduces NOx from all sources, not only flue
gas.• Low temperature and hence lower energy
consumption for heating.• Because of less dust content, less ammonia
slip with the fly ash than with SNCR.
SCR• Outside the operational condition range
(temperature, NH3/NOx ratio, residence time)ammonia slip, lower NOx destructionefficiency.
• Pressure drop to be considered.• High space requirement.• Relatively high capital costs, compared with
SNCR.

Chapter 3
270 Waste Water and Waste Gas Treatment
Achievable Emission Levels / Performance Rates
SNCR SCR
Parameter Performance rate[%]
Emission level[mg/Nm3]
Performancerate[%]
Emission level[mg/Nm3]
NOx (gasboilers/heaters) 40-70 150-200 90-94 <20
NOx (liquid fuelboilers/heaters) 40-70 150-300 90-94 55-150
NOx (from nitric acidproduction) – – 80-97 1 74-100 3
NH3 <5 2 <5 21 lower value information from the Netherlands, upper end [cww/tm/137]2 measurements in Austria; value for new catalysts, but higher NH3-emissions occur as the catalyst ages3 lower value information from the Netherlands, upper value [cww/tm/157 a]
Cross-media Effects
Consumables are:
AmountConsumable SNCR SCRAmmonia[kg/tonne NOx removed] 570 1 370–450 1,2
Steam to evaporate ammonia(from aqueous solution)Energy[kWh/1000 Nm3]Pressure drop[kPa]
- 0.1-1 1
1 [cww/tm/70]2 upper value information from Italy
The catalyst has a service life under regular conditions of 5-10 years, or >10 years when cleanwaste gas is involved, e.g. waste gas from nitric acid plants. After this time, it cannot beregenerated but will normally be recycled by the manufacturer.
Monitoring
The performance of the SNCR / SCR systems can be monitored by analysing the nitrogenoxides content before and after the treatment and the ammonia and oxygen content of theeffluent gas stream.
The temperature and pressure drop (with SCR) are routinely monitored.
Economics
CostsType of costs SNCR SCRCapital costs[per 1000 Nm3/h] EUR 2300–3900 1 EUR 7500–32000 1
Operating costs[per tonne NOx removed] EUR 700–1200 EUR 500–5000 1,2
1 [cww/tm/70]2 [comment]
Cost-effectiveness parameter in the case of SNCR is the consumption of ammonia or urea; inthe case of SCR it is the catalyst. The retrofitting of SNCR is relatively easy because there is noother equipment to install than the injection items and the storage tank for the agent. Retro-fitting of SCR can require radical modifications of the existing installation and thus demandhigh capital costs.

Chapter 4
Waste Water and Waste Gas Treatment 271
4 BEST AVAILABLE TECHNIQUES FOR WASTE WATER /WASTE GAS TREATMENT / MANAGEMENT IN THECHEMICAL SECTOR
4.1 Introduction
In understanding this chapter and its contents, the attention of the reader is drawn back to thepreface of this document and in particular the fifth section of the preface: “How to understandand use this document”. The techniques and associated emission and/or consumption levels, orranges of levels, presented in this chapter have been assessed through an iterative processinvolving the following steps:
• identification of the key environmental issues for the sector.• examination of the techniques most relevant to address those key issues;• identification of the best environmental performance levels, on the basis of the available
data in the European Union and world-wide;• examination of the conditions under which these performance levels were achieved; such as
costs, cross-media effects, main driving forces involved in implementation of thetechniques;
• selection of the best available techniques (BAT) and the associated emission and/orconsumption levels for this sector in a general sense all according to Article 2(11) andAnnex IV of the Directive.
Expert judgement by the European IPPC Bureau and the relevant Technical Working Group(TWG) has played a key role in each of these steps and in the way in which the information ispresented here.
On the basis of this assessment, techniques and, as far as possible emission and consumptionlevels associated with the use of BAT, are presented in this chapter that are considered to beappropriate to the sector as a whole and in many cases reflect current performance of someinstallations within the sector. Where emission or consumption levels “associated with bestavailable techniques” are presented, this is to be understood as meaning that those levelsrepresent the environmental performance that could be anticipated as a result of the application,in this sector, of the techniques described, bearing in mind the balance of costs and advantagesinherent within the definition of BAT. However, they are neither emission nor consumptionlimit values and should not be understood as such. In some cases it may be technically possibleto achieve better emission or consumption levels but due to the costs involved or cross-mediaconsiderations, they are not considered to be appropriate as BAT for the sector as a whole.However, such levels may be considered to be justified in more specific cases where there arespecial driving forces.
The emission and consumption levels associated with the use of BAT have to be seen togetherwith any specified reference conditions (e.g. averaging periods).
The concept of “levels associated with BAT” described above is to be distinguished from theterm “achievable level” used elsewhere in this document. Where a level is described as“achievable” using a particular technique or combination of techniques, this should beunderstood to mean that the level may be expected to be achieved over a substantial period oftime in a well maintained and operated installation or process using those techniques.
Where available, data concerning costs have been given together with the description of thetechniques presented in the previous chapter. These give a rough indication about the magnitudeof costs involved. However, the actual cost of applying a technique will depend strongly on thespecific situation regarding, for example, taxes, fees and the technical characteristics of theinstallation concerned. It is not possible to evaluate such site-specific factors fully in this

Chapter 4
272 Waste Water and Waste Gas Treatment
document. In the absence of data concerning costs, conclusions on economic viability oftechniques are drawn from observations on existing installations.
It is intended that the general BAT in this chapter are a reference point against which to judgethe current performance of an existing installation or to judge a proposal for a new installation.In this way they will assist in the determination of appropriate "BAT-based" conditions for theinstallation or in the establishment of general binding rules under Article 9(8). It is foreseen thatnew installations can be designed to perform at or even better than the general BAT levelspresented here. It is also considered that existing installations could move towards the generalBAT levels or do better, subject to the technical and economic applicability of the techniques ineach case.
While the BAT reference documents do not set legally binding standards, they are meant to giveinformation for the guidance of industry, Member States and the public on achievable emissionand consumption levels when using specified techniques. The appropriate limit values for anyspecific case will need to be determined taking into account the objectives of the IPPC Directiveand the local considerations.
Identification of a Horizontal BATThe horizontal approach to waste water and waste gas treatment and management in the entirechemical sector is based on the premise that the options for emissions prevention or control canbe assessed independently of the particular production process(es), and that, on this basis, BATcan be identified that embrace the most effective and suitable measures to achieve a highgeneral level of protection of the environment as a whole against the emissions mentionedabove. Because this is a horizontal BREF, BAT needs to be determined more broadly than for avertical BREF, particularly to embrace more than just technology.
BAT used in this document includes both:
• the methodology to prevent waste water / waste gas discharge, identify the need for andcarry out emissions improvement and find the best option for waste water / waste gascollection and treatment (effluent management)
• the identification of the best and most suitable [in the sense of Art. 2(11)] treatmenttechnologies.
Thus this chapter contains:
• a generic part describing a general BAT for environmental management methodology• a specific part describing BAT for specific waste water / waste gas management
methodologies and a rationale that leads to decisions on waste water and waste gastreatment techniques.
The chemical SectorThe chemical industry sector covers a wide range of enterprises: at one end the one-process-few-products small enterprises with one or few waste water / waste gas release sources and, atthe other, the multi-production-mix enterprises with many complex waste water / waste gasstreams. Although there are probably no two chemical sites that are totally comparable inproduction range and mix, environmental situation and the quantity and quality of theiremissions is it possible to describe BAT for waste water and waste gas treatment for thechemical sector as a whole.
Implementation of BATThe implementation of BAT in new plants is not normally a problem. In most cases it makeseconomic sense to plan production processes and their waste water / waste gas releases tominimise emissions and material consumption. With existing sites, however, theimplementation of BAT is not generally an easy task, because of the existing infrastructure andlocal circumstances (see Section 3.2.2). Nevertheless, this document does not distinguishbetween BAT for new and existing installations. Such a distinction would not encourage the

Chapter 4
Waste Water and Waste Gas Treatment 273
operators of industrial sites to move towards adopting BAT and it would not reflect thecommitment of the chemical industry to continuous improvement of environmental conditions.
On the other hand, it is obviously not feasible or viable to implement all techniques identified asBAT at once. What is feasible, however, is integrating BAT in existing installations when majoralterations are planned, or implementing BAT that influences the whole site in a step-by-stepconstruction programme over a period of time. Such programmes challenge operator andregulator to come to an agreement on time scale and priority setting for the required changes.
Key ideas for priority setting programmes at existing sites would be, e.g.:
• consideration of the current quality of the receiving media• consideration of the degree of the current local impact• consideration of the effectiveness of the measures in terms of overall pollutant reduction in
relation to cost and hazard.
4.2 General BAT
BAT for General Environmental ManagementThe task of environmental management is to:
• define environmental goals for the operator’s activities• ensure an environmental optimum operation and ever-improving performance of these
activities• control the compliance with these environmental goals.
The management tools described in Section 2.2 are to consider in the determination of BAT andshould be reflected as conditions or requirements when deciding on a permit. These tools arenot restricted to dealing with waste water and waste gas, but they are a prerequisite of bestperformance as required under the Directive. BAT for general environmental management asdescribed below follows the same principles for all kinds of enterprises, i.e. small or big ones.In contrast to big companies, the general environmental management of small- and medium-sizeenterprises (SME) is less complex.
BAT is to:• implement and adhere to an environmental management system (EMS) or HSE-system, the
whole content of which is detailed in Section 2.1 (such as ISO 9001 / 14001, EMAS,Responsible Care®, ICC Business Charter for Sustainable Development, CEFIC Guidelinesfor Protection of the Environment). Elements of a good EMS could include:- implementation of a transparent hierarchy of personnel responsibility for EMS concerns
including effluent discharge, the persons in charge reporting directly to the topmanagement level
- preparation and publication of an annual environmental performance report (e.g. as partof EMAS or ISO 9001 / 14001) to enable the dissemination of performanceimprovements to the public, which can also serve as a vehicle for information exchangeaccording to Art. 16(2) of the Directive
- setting internal (site- or company-specific) environmental targets, reviewing themregularly as detailed in Section 2.2.2.2 and publishing them in the annual report
- holding a regular audit to secure compliance with the principles of EMS- regular monitoring of performance and progress towards the achievement of EMS
policy- practising risk assessment on a regular basis to identify hazards, as detailed in
Section 2.2.3.1

Chapter 4
274 Waste Water and Waste Gas Treatment
- practising benchmarking on a regular basis and challenging the processes (productionand waste water / waste gas treatment) on their water and energy consumption, wastegeneration and cross-media effects as described in Section 2.2.3.2
- implementation of an adequate training programme for staff and instructions forcontractors working on the site on HSE and emergency issues, as mentioned inSection 2.2.4.2
- application of good maintenance practices to ensure proper operation of the technicaldevices.
BAT for Waste Water / Waste Gas ManagementThe task of waste water / waste gas management is to fit the situation of the waste water / wastegas releases generated on the industrial site to legal and permit requirements, the given localenvironmental and hygienic conditions and the continuous improvement of environmentalconditions, which is also implemented in CEFIC’s Responsible Care programme. It detects andassesses options for preventing or reducing the generation of emissions or their impact to theenvironment. The results of waste water / waste gas management considerations and decisionsare the identification and implementation of:
• potential emissions reduction in the production process• means to avoid unnecessary contamination of otherwise unpolluted releases• best suitable waste collection systems• best suitable emission control systems• best monitoring systems to check compliance with targets or legal regulations
Again, as with general environmental management, BAT for waste water / waste gasmanagement follows the same principles for all kinds of enterprise sizes. Whereas waste water /waste gas management for enterprises with one or very few production lines and effluentsources is a relatively easy and simple task, it is normally very complex for large sites with amulti-production mix (see Section 2.1, Figure 2.3).
BAT is to:• implement a waste water / waste gas management system or waste water / waste gas release
assessment for the entire chemical site with reference to Section 2.1 and Figure 2.2 by usingan appropriate combination of:- using a site inventory and a stream inventory or register. These inventories provide the
necessary information for the following assessment steps, as described inSection 2.2.1.1 and 2.2.1.2.
- pursuing systematically the internal mass streams by applying EMFA (seeSection 2.2.1.3) – adequately to the complexity of the waste water / waste gas system –to draw the necessary conclusions for optimisation; for sites with only one or very fewemission arising points the application of EMFA can be obsolete or very simple
- checking and identifying the most relevant emission sources for each medium andlisting them according to their pollutant load. The resultant ranking of emission sourcesis the basis for an improvement programme which gives priority to those sources thatoffer the greatest potential reduction efficiency
- checking the receiving media (air and water) and their tolerance of the emissions, usingthe results to determine the extent to which stronger treatment requirements are neededor if the emissions can be accepted at all
- performing assessment of toxicity and, subject to available methods, persistence andpotential bioaccumulation of waste water to be discharged into a receiving water body,as described in Section 2.2.1.2.1, to identify potentially hazardous effects on theecosystem and share the results with the competent authorities
- checking and identifying relevant water-consuming processes and listing themaccording to their water usage. The resultant ranking is the basis for improvement ofwater consumption
- pursuing options for improvement (such as options for waste prevention or reduction,improvement of effluent collection and control and/or options for process-integrated
Chapter 4
Waste Water and Waste Gas Treatment 275
measures), focusing on streams with higher concentrations and loads, their hazardpotential and impact on the receiving water body, as detailed in Section 2.1 inconnection with Figure 2.2
Split viewOne Member State expressed the opinion that the statements on BAT for waste waterand waste gas management are partly too general and they refer to examples forstreams with higher concentrations and loads (as mentioned in Section 2.2.2.3.1).
- assessing the most effective options by comparing overall removal efficiencies, overallbalance of cross-media effects, technical, organisational and economic feasibility etc.,as detailed in Section 2.1
The waste water / waste gas release assessment is the basis for all decisions on streamsegregation, reduction strategies, process improvements (see the vertical BREFs on thechemical and related sectors with respect to cleaner process technology, clean raw material,improved process equipment, control of leakages etc.) and control techniques. An exampleof an efficient waste water management - as reported from Germany - which follows theoutlined strategy for chemical sites carrying organic loads from the production of organicchemicals has as a reasonable target an overall COD-removal performance (includingpretreatment) of at least 90 %. BAT for the measures to be adopted in the light of the resultsof waste water / waste gas release assessment are dealt with in Section 4.3.
• assess impact on the environment and the effects on treatment facilities when planning newactivities or alterations to existing activities, comparing the future environmental situationwith the existing one and indicating whether substantial changes are to be expected
• practice emission reduction at source by stream segregation, installation of adequatecollection systems and construction measures (see Section 4.3)
• link production data with the data on emission loads to compare the actual and calculatedreleases. If the data obtained do not match, the processes responsible for unexpectedreleases need to be identified
• treat contaminated waste water / waste gas streams at source in preference to dispersion andsubsequent central treatment, unless there are good reasons against it. Most treatmenttechniques work most efficiently when the pollutant content is high. It is also economical totreat relatively small tributary streams with small, high-efficiency treatment devices than tohave large central facilities with high hydraulic load
• use quality control methods, as described in Section 2.2.2.6, to assess the treatment and/orproduction processes and/or prevent them running out of control
• apply good manufacturing practice (GMP) for equipment cleaning to reduce emissions towater and to air
• implement facilities / procedures to enable timely detection of a deviation that could affectthe downstream treatment facilities, so as to avoid an upset of those treatment facilities,enable identification of the source of deviation and eliminate its cause; in the meantime thearising waste water can be diverted into retention facilities and the waste gas to adequatesafety facilities, e.g. a flare
• install an efficient central warning system that will give notice of failures and malfunctionsto all concerned; when the accident could have a significant effect on the environmentand/or the neighbourhood, the competent authorities need to be part in the informationchain
• implement a monitoring programme in all treatment facilities to check that they areoperating properly, to enable detection of any irregularities or operating failures that mightinfluence the receiving media and give information on the actual emissions of pollutants

Chapter 4
276 Waste Water and Waste Gas Treatment
• the implementation of a monitoring programme to detect the emissions is required by Art.9(5) of the Directive, with the information obtained serving as information to the publicunder Art. 15(2) of the Directive. The monitoring programme needs to include thecontaminants and/or surrogate parameters relevant to the treatment facility. The frequencyof the measurements depends on the hazard risk of the pollutants in question, the failure riskof the treatment facility and the variability of the emissions
• put in place strategies for dealing with fire-fighting water and spillages, as described inSection 2.2.4.1
• put in place a pollution incident response plan to enable the most rapid and appropriateresponse to internal accidents and operating failures, as described in Section 2.2.4.2
• allocate costs of treatment associated with production.
4.3 Specific BAT
Once this foundation of management methodology has been laid, the next step towardsintegrated pollution prevention and control is the implementation of technical measures.
4.3.1 Waste Water Section
This section is devoted to the determination of BAT for waste water treatment on a chemicalindustry site, including necessary prevention and reduction techniques in addition to control(end-of-pipe) techniques.
BAT for Process-integrated MeasuresAs already mentioned in Sections 1.3.1 and 3.3.1, process-integrated measures are the preferredmethod for preventing or reducing the amount of waste water and/or contamination. They are,however, generally production- or process-specific and their applicability requires specialassessment, which is within the scope of the vertical BREFs on the chemical and related sectors.Conclusions on BAT for process-integrated measures in this document therefore refer to thegeneral need to implement these measures within a production line and consider only themeasures for processes such as product washing, equipment cleaning, vacuum generation andcooling that are commonly applied to most production lines.
BAT is an appropriate combination of:• using process-integrated or waste water or contaminant-recovering measures in preference
to end-of-pipe techniques when there is a choice• assessing existing production installations for options of retrofitting process-integrated
measures and implement them when feasible or at latest when the installation undergoesmajor alterations
• using process water in a recycle mode whenever feasible for economic and quality reasons,with a maximum number of recycles before discharge, as described in Section 3.3.1.2
• optimising product washing processes by avoiding once-through processes wheneverfeasible for quality reasons, as mentioned in Section 3.3.1.1
• avoiding direct contact cooling systems whenever feasible, as detailed in Section 3.3.1.3• using closed-circuit vacuum generation instead of water jet or vapour jet pumps whenever
feasible, e.g. when their use is not prohibited by safety or corrosion issues as mentioned inSection 3.3.1.4
• assessing whether water-based waste gas treatment processes can be replaced by othermeasures, as described in Section 3.3.1.5. Waste gas treatment techniques using relativelyhigh amounts of water (such as scrubbing or cooling medium) are of special significance inregions where water is in short supply. Examples of such measures, which can be of highimportance in regions with water shortage, are:- removal of solid matter by dry techniques rather than by wet scrubbing- reduction of SOx in flue gas by secondary measures rather than by systems that include
wet scrubbing.

Chapter 4
Waste Water and Waste Gas Treatment 277
BAT for Waste Water CollectionAn adequate waste water collection system plays an essential role in effective waste waterreduction and/or treatment. It ducts the waste water streams to their appropriate treatmentdevice and prevents mixing of contaminated and uncontaminated waste water.
BAT is to:• segregate process water from uncontaminated rainwater and other uncontaminated water
releases. This minimises the amount of water requiring treatment and the hydraulic loadsent to treatment facilities. It enhances the cost and performance efficiency of treatmentdevices. If existing sites do not yet operate water segregation, it can be installed – at leastpartially – when major alterations are made to the site
• segregate process water according to its contamination load: organic, inorganic without orwith insignificant organic load or insignificant contamination. It ensures that a treatmentfacility receives only those pollutants it can cope with
• install a roof over areas of potential contamination by, for example, spillage or leakage -wherever feasible. It prevents rainwater falling on these areas and mixing with contaminantsthat would otherwise increase the amount of waste water requiring treatment
• install separate drainage for areas of contamination risk, containing a sump to catch leakageor spillage losses, as described in Section 3.3.4.4. They prevent the discharge of rainwatercontaminated by product losses. The separately captured rainwater is released afteradequate monitoring and discharged, according to the results, either directly to the drainagesystem for uncontaminated rainwater or to appropriate treatment facilities
• use overground sewers for process water inside the industrial site between the points ofwaste water generation and the final treatment device(s). If climatic conditions do not allowoverground sewers (temperatures significantly below 0 °C), systems in accessibleunderground ducts are a suitable replacement. Both provide easy and economical leakdetection, maintenance work and options for retrofitting new equipment into existinginstallations. Many chemical industry sites are still provided with underground sewers andthe immediate construction of new sewer systems is normally not viable, but work can bedone in stages when major alterations at production plants or the sewer system are planned
• install retention capacity for failure events and fire-fighting water in the light of a riskassessment, choosing one, two or all of the following options:- decentralised retention for detected failure events, whenever possible close to the
production plants and large enough to prevent the release of substances into the sewerduring the process undergoes a controlled shut down
- central retention to collect waste water from failure events that has already entered thesewerage system instead of ducting it to the central WWTP, as described in Section3.3.3. Although there are several kinds of retention systems in operation that can beconsidered to be BAT, the most secure systems are those where the tank is flooded onlyin the case of a failure event (see Figure 3.2) or where two tanks are filled alternately(see Figure 3.1)
- retention for fire-fighting water, either used in isolation or in combination with localcontainment. Experience has shown that fire-fighting water can amount to thousands ofcubic metres (for example about 15000 m3 highly contaminated fire-fighting water) andthe retention capacity needs to be large enough to cope with it to protect both surfaceand waste water drainage systems
- drainage system for hazardous and inflammable substances, e.g. to transport them fromthe fire zone.
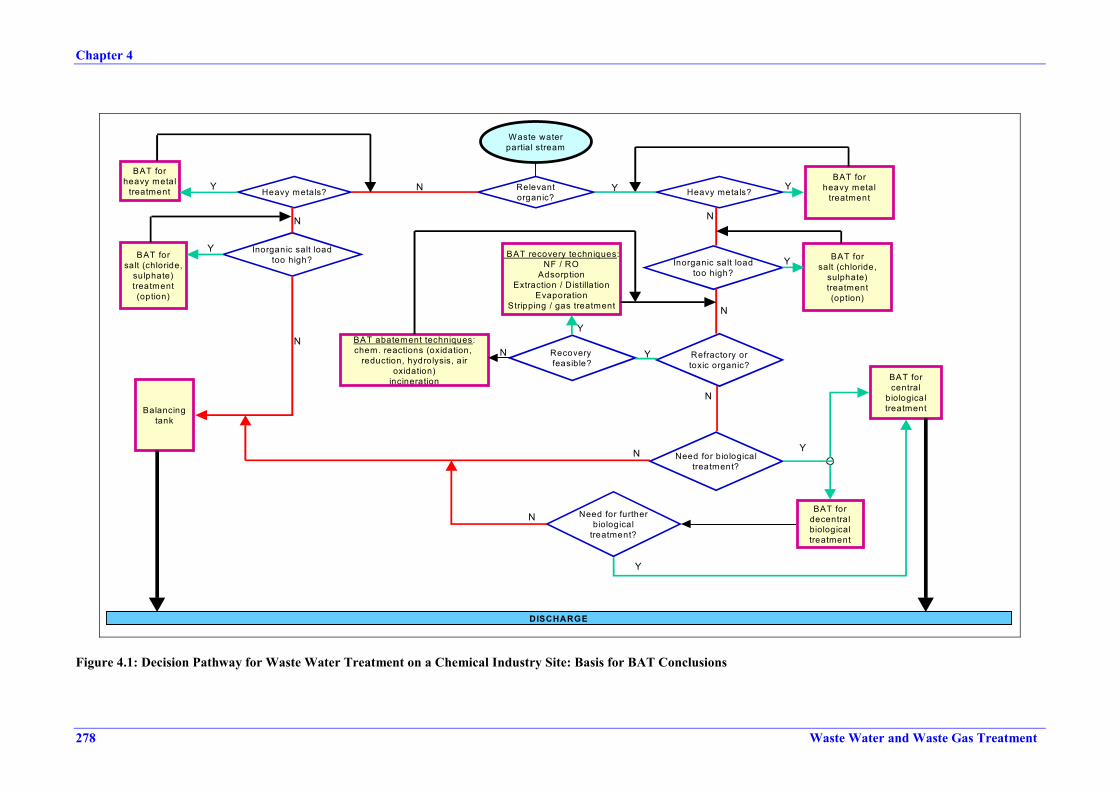
Chapter 4
278 Waste Water and Waste Gas Treatment
Waste waterpartial stream
Relevantorganic?
Y Heavy metals?NHeavy metals?
Inorganic salt loadtoo high?
N
BAT forheavy metal
treatmentY
BAT forsalt (chloride,
sulphate)treatment(option)
Refractory ortoxic organic?
N
Y
Recovery feasible?
BAT abatement techniques:chem. reactions (oxidation,
reduction, hydrolysis, airoxidation)
incineration
N Y
BAT forheavy metal
treatment
Inorganic salt loadtoo high?
BAT recovery techniques:NF / RO
AdsorptionExtraction / Distillation
EvaporationStripping / gas treatment
BAT forsalt (chloride,
sulphate)treatment(option)
Need for biologicaltreatment?
BAT forcentral
biologicaltreatmentBalancing
tank
DISCHARGE
Need for furtherbiological
treatment?
BAT fordecentralbiologicaltreatment
Y
N
Y
N
YN
Y
N
Y
N
Figure 4.1: Decision Pathway for Waste Water Treatment on a Chemical Industry Site: Basis for BAT Conclusions

Chapter 4
Waste Water and Waste Gas Treatment 279
BAT for Waste Water Treatment
Waste water treatment in the chemical sector follows at least four different strategies:
• central final treatment in a biological WWTP on site• central final treatment in a municipal WWTP• central final treatment of inorganic waste water in a chemical-mechanical WWTP• decentralised treatment(s).
This document gives no preference to any of those. All four strategies are to consider as BATwhen properly applied to the actual waste water situation, otherwise none of them is BAT.
The BAT conclusions follow the path of the contaminants to be controlled, as described inFigure 4.1. It is assumed at this stage that the appropriate effluent management decisions havebeen made, the impact on the receiving water body has been assessed, all practical options forprevention and reduction of waste water have been exploited and all safety measures have beentaken into account, i.e. from this point on, only end-of-pipe solutions are considered.
It needs to be mentioned that region-specific issues can require treatment techniques especiallydeveloped for a site, or they can invalidate well-known and commonly used techniques for thisspecial case. The following approach to come to BAT conclusions for waste water treatmentgives guidance on finding and installing the appropriate technique, including how to cope withthese peculiarities typical to waste water treatment. The approach follows a decision pathway tocome to BAT conclusions for appropriate waste water treatment for a chemical site, which isillustrated in Figure 4.1.
• GeneralBAT is to:- allocate contaminated waste water streams according to their pollutant load. Inorganic
waste water without relevant organic components is segregated from organic wastewater and ducted to special treatment facilities (see special sections on heavy metalsand inorganic salts, discussed later in this chapter). Organic waste water with a relevantportion of inorganic and refractory or toxic organic compounds is directed to specialpretreatment devices (see sections on heavy metals, inorganic salts and pollutantsunsuitable for biological treatment later in this chapter).
• RainwaterBAT is to:- duct uncontaminated rainwater directly to a receiving water, by-passing the waste water
sewerage system- treat rainwater from contaminated areas by using techniques described in Sections
3.3.4.1.1, 3.3.4.4.1 and 3.3.4.4.2, see Table 4.1, before discharging it into a receivingwater.
In some cases the use of rainwater as process water to reduce fresh water consumption maybe environmentally beneficial.
The techniques listed in Table 4.1 are to consider as BAT, when applied to the respectivesituation. The table lists the restrictions for the different techniques

Chapter 4
280 Waste Water and Waste Gas Treatment
Grit chambersChannel-shaped Circular Aerated
Retention pond / sedimentationtank (see Table 4.3) Sand filter
Purpose Removal of sand and grit onlyProtection of treatment process
Protection of equipment against abrasion
Clarification and cleaning of rainwaterand catching of hydraulic load fromheavy rainfall to protect receiving river(retention pond)Clarification of rainwater before dis-charge or re-use (sedimentation tank)
Treatment of rainwater run-offfrom lightly contaminatedsurfaces, either to discharge orre-use
Application As part of the WWTP applied to rainwater treated in the WWTP (rainwaterfrom heavily contaminated surfaces)
Flow rate 0.3 m/s thus only sand and coarse material is separated
Removal, from lightly contaminatedsurfaces, of suspended solids
Removal of suspended solids
Application limits Suitable for highlyfluctuating waste waterflow
Less suitable for highfluctuations in wastewater flow
Suitable for fluctuatingwaste water flow
Not suitable for rainwater from heavilycontaminated surfacesNot suitable for regions with longperiods of dryness and/or hightemperature, because long residencetime together with heat causes odouremissions
Not suitable for rainwater fromheavily contaminated surfaces
Consumables Energy for pumps Compressed airEnergy for pumps andair jet
Compressed airEnergy for pumps andair jet
Energy for pumpsFrom time to time replacementof filter medium
Cross-media effects Noise emissionsOdour emissions
Sand to dispose of
Retention pond:Disposal of sludgeDepending on hydraulic residencetime, odour emissions possible
Disposal of backwashedsludge
Space requirement Comparatively lowPart of the WWTP
Large area required Low space requirement
Achievable performance[% pollutant removal]
Retention pond:TSS 50-90
TSS 80-83
Retrofittability Easily retrofittable, if not already part of equipment Retrofittable when space available Easily retrofittable
Table 4.1: Rainwater Treatment Techniques as Described in Chapter 3

Chapter 4
Waste Water and Waste Gas Treatment 281
• Free Oil / HydrocarbonsBAT is to:- remove oil / hydrocarbons when they appear as large slugs and where these are
incompatible with other systems, with the aim of maximising recovery, by applying anappropriate combination of: oil/water separation by cyclone, MF or API, when large slugs of free oil or
hydrocarbons can be expected, otherwise PPI and CPI are alternatives, details inSection 3.3.4.1.6
MF, granular media filtration or gas flotation, which are described in Section3.3.4.1.5, 3.3.4.1.4 and 3.3.4.1.3 respectively
biological treatment (see section on biodegradable substances), either in a centralbiological WWTP, a municipal WWTP or a separate treatment plant for this specialwaste water stream.
The BAT-associated emission levels for oil / hydrocarbons removal are given in Table4.2.
Parameter Concentration a 1
[mg/l]total hydrocarbon content 0.05-1.5BOD5 2-20COD 30-125a monthly averageb There is disagreement on the analytical methods to assesshydrocarbons which could not be solved within the TWG.1 Taken from Draft BREF for Mineral Oil and Gas Refineries,dated October 2001
Table 4.2: BAT-associated Emission Levels for Free Oil / Hydrocarbons Discharged into aReceiving Water
• EmulsionsBAT is to:- break emulsions at source and recover the separated constituents. The addition of
flocculating and/or coagulating chemicals can be necessary to support separation;treatment at source enables recovery and prevents adverse effects on downstreamsewerage systems; or
- remove emulsions at source when they cannot be broken and can have adverse effectson downstream facilities. Suitable treatment techniques are such as air oxidation,evaporation, incineration (when the heat value of the emulsion allows autothermaloperation) or biological degradation. Often it is not permitted to discharge emulsionsinto public sewerage systems.
• Total suspended solids (TSS)The measures for TSS removal used in this section do not include those for activated sludgeor heavy metal compounds, which are dealt with in other sections.
BAT is to:- remove TSS from waste water streams when they can cause damage or failure to
downstream facilities such as abrasion and clogging in pumps and pipes or cloggingand plugging in treatment facilities. Downstream treatment facilities, which might bedamaged, are items such as filters, adsorption columns, membrane filters, oxidationvessels using UV irradiation or the central and municipal WWTP. The techniques arelisted in Table 4.3.The ranking of treatment techniques is: 1st step: sedimentation / air flotation to catch the main TSS load and to protect
subsequent filter systems from clogging or high frequencies of backwashing.Sedimentation or air flotation is normally sufficient to prevent abrasion andclogging in pumps and pipes (provided emulsions and inseparable solids have beentreated successfully)

Chapter 4
282 Waste Water and Waste Gas Treatment
2nd step: mechanical filtration as an option, if the solid content has not been reducedenough to prevent clogging in subsequent treatment facilities, such as membranefiltration, adsorption, chemical oxidation reaction using UV irradiation
3rd step: MF or UF as an option, if the waste water stream needs to be solid-free toprevent clogging, for example, in NF or RO facilities, or free of other particles thatcannot be removed by other filtration techniques
- remove TSS from waste water streams before discharging into a receiving water. Aslong as no hazardous substances are included in TSS, the common techniques are: sedimentation / air flotation filtration, only if required because of insufficient separation by the preceding
techniques- remove TSS from waste water streams using a technique that enables recovery in
preference to abatement techniques whenever it is feasible and viable to re-use thesolids
- apply flocculating and/or coagulating agents when finely dispersed or otherwiseinseparable material is present to produce flocs large enough to settle
- cover or close the treatment device when odour and/or noise are an issue, duct theexhaust air to further waste gas treatment if necessary and implement the necessarysafety devices when explosion risk can be expected in the closed treatment device
- dispose of the sludge appropriately either by handing it to a licensed contractor or bytreating it on site (see section on sludge treatment).
The techniques to consider as BAT, depending on the application, are those described inSections 3.3.4.1.2 - 3.3.4.1.5 and listed in Table 4.3.
• Heavy MetalsAs heavy metals are chemical elements that cannot be destroyed, recovery and re-use arethe only ways to prevent them being released into the environment. Any other option causesthem to be transferred between the different media: waste water, waste air and landfilling.Waste water streams carrying a significant load of heavy metals are those that originatefrom production processes where heavy metal compounds are produced or used (e.g. ascatalyst), or from cleaning processes of equipment used in such production.
BAT is to:- segregate waste water containing heavy metal compounds as far as possible and- treat the segregated waste water streams at source before mixing with other streams and- prefer techniques that enable recovery. The techniques that can be applied to achieve
these requirements are listed in Table 4.4 and- facilitate further elimination of heavy metals in a final WWTP (chemico-mechanical
stage for inorganic productions, biotreatment for organic productions) as a polishingstep, with subsequent treatment of sludge, if necessary.
The TWG could not provide BAT-associated emission levels for heavy metals intributary waste water streams that would be applicable to the chemical sector as a wholefor the reasons detailed in Section 3.3.4.2.1. The emission levels resulting from theapplication of BAT mentioned above are dependent on the production process fromwhich the heavy metal pollutants originate.

Chapter 4
Waste Water and Waste Gas Treatment 283
Sedimentation Air flotation Filtration MF/UFPurpose Clarification of collected rainwater from
suspended solidsClarification of process water fromsuspended solids or floc
Clarification of process water whensedimentation is not appropriate
Final separation stage aftersedimentation or air flotation to achievelow particulate emissions
Clarification down to solid-free wastewater for downstream treatmentfacilities (e.g. RO)
Application Separation of solids from waste waterIn principle TSS recoverable
Separation of unsettleable solids and oil /greaseSeparated material can be recovered
Separation of solids from waste waterstreamMaterial recovery depends on filter type
Separation of all solid material,colloidal particles, bacteria, virusesVery suitable to material recovery
Application limits Particles need to be settleableNo limits to TSS contentNo stable emulsions
No foaming detergentsNo limits to feed concentration, but notbulk free oil
Finely dispersed and slimy solids to avoidHigh TSS load causes clogging
Membrane material vulnerable tochemical attacksFeed of TSS needs to be lowbecause of clogging and plugging
Consumables Chemicals: 0.5-100 g/m3
Energy: 0.5-1.5 kW (tank diameter 25-35 m)
Compressed air: 0.53-0.55 m3/m3
Flocculant: 2.4-4.7 kg/tonne TSSEnergy: 20.6 kWh/1000 m3
Filter aidsPressure dropEnergy
Antiscaling, antifouling andbackwashing chemicalsEnergy related to flow rate andpressure drop: 2-20 kWh/m3 (MF) 1 1-10 kWh/m3 (UF) 1Pressure drop: 0.02-0.5 MPa (MF) 0.2-1 MPa (UF)
Cross-media effects Sludge disposalNoise emissions from pumps and sludge /scum removal systemOdour emissions (e.g. VOC) when tank isnot closed
Sludge disposalNoise emissions from pumps and air jetOdour emissions (e.g. VOC) when tankis not closed, higher than withsedimentation
Sludge disposal after backwashingClosed filters might need connection towaste gas abatement systems
Residue disposalNoise emissions from pumps
Space requirement Dependent on device (flat tank or laminasettler)
Less than with sedimentation Module arrangementSpace requirement low compared toother techniques
Achievable performance[% pollutant removal]
TSS 60-90Settleable solids 90-95
TSS 85-98HM sulphides: 95higher treatment stability with feedfluctuations
Dependent on filter medium and filter aidsTSS 50-99.99
TSS close to 100
Achievable emissions[mg/l]
TSS <10 TSS 10-20Oil 2-10
TSS <10Free oil <5
Retrofittability Dependent on available space yes yes yes1 It seems rather surprising that MF, the process with the lowest pressure drop, consumes more energy than the processes with high pressure drops. The reason is the occurrence of concentrationpolarisation and fouling. In MF, and to a lesser extent in UF, this phenomenon is very severe and it results in a drastic flux decline [cww/tm/161].
Table 4.3: Treatment Techniques Associated with BAT for Suspended Solids

Chapter 4
284 Waste Water and Waste Gas Treatment
• Inorganic Salts and/or Acids (Ionic Particles)The inorganic salt and/or acid content of waste water can influence both the biosphere of areceiving water, e.g. small rivers when they are confronted with high salt loads, and theoperation of sewerage systems, e.g. corrosion of pipes, valves and pumps or malfunction ofdownstream biological treatment. The control measures used in this section for inorganicsalts do not include those for heavy metal salts, which were dealt with in the previoussection, and for ammonium salts, which are controlled by other means.
BAT is to:- control the inorganic salt and acid content of waste water streams with negative impact
on the biosphere of receiving water appropriately, if necessary preventing its discharge.When treatment is required, it is more cost-effective if done at source
- control the inorganic salt content (mainly chloride and sulphate) by treatment at sourcewhen it could cause damage, failure and/or malfunction of the on-site or municipalsewerage system
- choose a treatment technique that enables recovery and re-use of the treatedcontaminants whenever it is feasible and suitable, taking into account cross-mediaeffects and the impact of the pollutants.
Appropriate treatment techniques are listed in Table 4.5, the actual choice depending on thegiven situation.

Chapter 4
Waste Water and Waste Gas Treatment 285
Precipitation / sedimentation or airflotation / filtration Crystallisation Ion exchange NF / RO
Purpose Transferring dissolved heavy metalcompounds to insoluble compoundsand separating them from the wastewater stream
Growth of heavy metal compounds ongranular seed material in a fluidised bed
Replacement of heavy metal ions inthe aqueous phase by other ions fromion exchange resin
Separation of heavy metal ions bymembrane permeationSeparation of most other contaminants
Application Removal of heavy metals from wastewater streams, preferably for higherconcentrationsRecovery possible in principle
Removal of heavy metals from wastewater streams by producing conditionsthat enable precipitationRecovery is the purpose
Solutions containing heavy metal ionswith low feed concentrationsRecovery is possible
Achieving high grade of purity torecycle and re-use the waterConcentration increase of contami-nants for further treatment requirementRecovery is possible
Application limits Avoid complex-forming agentspH adjustment is importantNot applicable when concentrationlower than solubility of precipitate
High ionic strength to be avoidedTemperature limit about 60 °CCorrosive agents damage resin
Concentrations with osmotic pressurestoo high to operateLow thermal and chemical resistance
Consumables Precipitation agentFlocculant / coagulantEnergy for pumps
Crystallisation chemicalsEnergy
Regeneration liquidFouling suppressorsEnergy
Chemicals for cleaningEnergy: 1-3 kWh/m3 (NF) 1-3 kWh/m3 (RO)Pressure drop: 0.5-3 MPa (NF) 2-100 MPa (RO)
Cross-media effects Disposal of sludgeOdour emissions possible
Over-dosage of crystallisationchemicals can result in a higher saltloadNormally no waste or sludge generation
Regeneration returns high concen-trations of heavy metal solutions(recovery or disposal)
Concentrate needs further treatment,e.g. ion exchange
Space requirement Comparable to ion exchange andNF/RO
Comparable to crystallisation andNF/RO
Comparable to crystallisation and ionexchange
Achievable performance[% pollutant removal]
80-99 inorganic Hg >90 (NF)organic Hg >90 (NF)Cd compounds >90 (NF)close to 100 % with RO
Achievable emission levels[mg/l]
for heavy metals highly dependent onproduction process from which theyoriginate
Zn 1Ni 1
0.1–10 very low (near to zero) with RO
Retrofittability yes relatively easy1 packed height of 1 m, diameter 1 m, including vessel, valves and resin
Table 4.4: Treatment Techniques Associated with BAT for Heavy Metals

Chapter 4
286 Waste Water and Waste Gas Treatment
Evaporation Ion exchange Reverse osmosis Biological sulphate removalPurpose Distillation of water leaving a
concentrate as bottom residueReplacement of cations by H+ andanions by OH- ions thus replacingsalts by water
Separation of all water contaminantsby membrane permeation
Anaerobic reaction of sulphate tosulphur via sulphide
Application Making inorganic salts to crystalliseand separate them from waste waterConcentrate other non-volatilesubstances as wellIn principle substance recoverypossible
Solutions containing salts, also withheavy metalsRecovery is possible
Achieving high grade of purity torecycle and re-use waterConcentration increase ofcontaminants for further treatment orrecovery requirementRecovery is possible
Removal of sulphate from wastewater containing a large amount of itCan also remove heavy metals assulphidesRecovery of the sulphur generated
Application limits Avoid foam generating substances High ionic strength to be avoidedTemperature limit about 60 °CCorrosive agents can damage resin
Concentrations too high result inosmotic pressure too high to operateLow thermal and chemical resistance
Very slow reaction, i.e. longresidence timeCOD/sulphate needs to be at least1:1
Consumables Chemicals when pretreatment isnecessarySteam 5-16 kg water/kg steamEnergy
Regeneration liquidFouling suppressorsEnergy for pumps
Chemicals for cleaningEnergy: 1-3 kWh/m3
Pressure drop: 2-100 MPa
Chemicals (neutralising agent, CODdelivering substance, flocculant)Energy
Cross-media effects Condensate might need furthertreatmentNoise emission
Recovery returns high concentrationsof salt removed (recovery by treatmentof aqueous waste or disposal)
Concentrate needs further treatment,e.g. ion exchange to enable recovery
Sulphur to be used for productionprocesses (sulphuric acid)
Space requirements Comparatively low Comparatively low Comparatively lowAchievable performance[% pollutant removal]
Complete salt removal 80-99 Close to 100 % sulphate: 94zinc: 99.8cadmium: >99
Achievable emission levels[mg/l]
0.1-10 very low (near to zero) sulphate: 75zinc: 0.05-0.15cadmium: <0.01
Retrofittability relatively easy1 packed height of 1 m, diameter 1 m, including vessel, valves and resin
Table 4.5: Treatment Techniques Associated with BAT for Inorganic Salts (Heavy Metals not Included)

Chapter 4
Waste Water and Waste Gas Treatment 287
• Pollutants Unsuitable for Biological TreatmentApart from the contaminants discussed in the previous sections there are tributary waste waterstreams that are not suited to biological treatment because they contain:
- COD not or only poorly biodegradable- toxic substances that inhibit the biological process.
Thus their discharge into a biological treatment plant needs to be prevented. It is not possible toforecast which contaminants are inhibitors for biological processes in a WWTP, because thisdepends on the adaptation to special contaminants of the micro-organisms working in this plant.There is no difference if the waste water is ducted to a central biological WWTP inside of thechemical industry site or to a municipal WWTP. The conditions for pretreatment of pollutantsunsuitable for biological treatment are in both cases the same.
BAT is to:- avoid the introduction of waste water components into biological treatment systems when they
can cause malfunction of such systems- treat tributary waste water streams with relevant non-biodegradable part by adequate
techniques, described in Section 3.3.4.2 and listed in Table 4.6, before or instead of a finalbiological treatment. The actual choice of the appropriate treatment technique depends on theactual situation, the composition of the waste water stream, the situation of the biologicalWWTP (if operated) and the adaptation of its micro-organisms and the requirements of thereceiving water. It is a site-specific issue in every case
Split viewOne Member State expresses a view that the criterion ‘relevant non-biodegradable part’needs to be more closely defined by giving a set of indicative values for recalcitrant TOC(see Section 3.3.4.2) to waste water streams.
- use techniques that enable substance recovery whenever feasible, such as (see Table 4.6): NF / RO adsorption, using the most suitable variant (for details, see Section 3.3.4.2.9) extraction distillation / rectification evaporation stripping
- remove relevant ammonia content from waste water streams at source, using, e.g. air or steamstripping, as described in Section 3.3.4.2.14
- use techniques that do not need additional fuel, when other abatement techniques achievesufficient results and if recovery is not feasible. When a final biological WWTP is operated, itcan suffice to break down refractory organic load into biodegradable substances, usingtechniques such as (see Table 4.6): chemical oxidation (making a thorough assessment whether organic chlorides are
generated when chlorine-containing oxidation agents are used) chemical reduction chemical hydrolysis
- use air oxidation and incineration only when there is no other choice to abate toxicity orinhibitory effects or when the process can be operated on a self-sustaining basis or it is theonly way to meet discharge requirements without biological treatment
- take into account water consumption with treatment techniques such as: extraction distillation / rectification evaporation stripping,
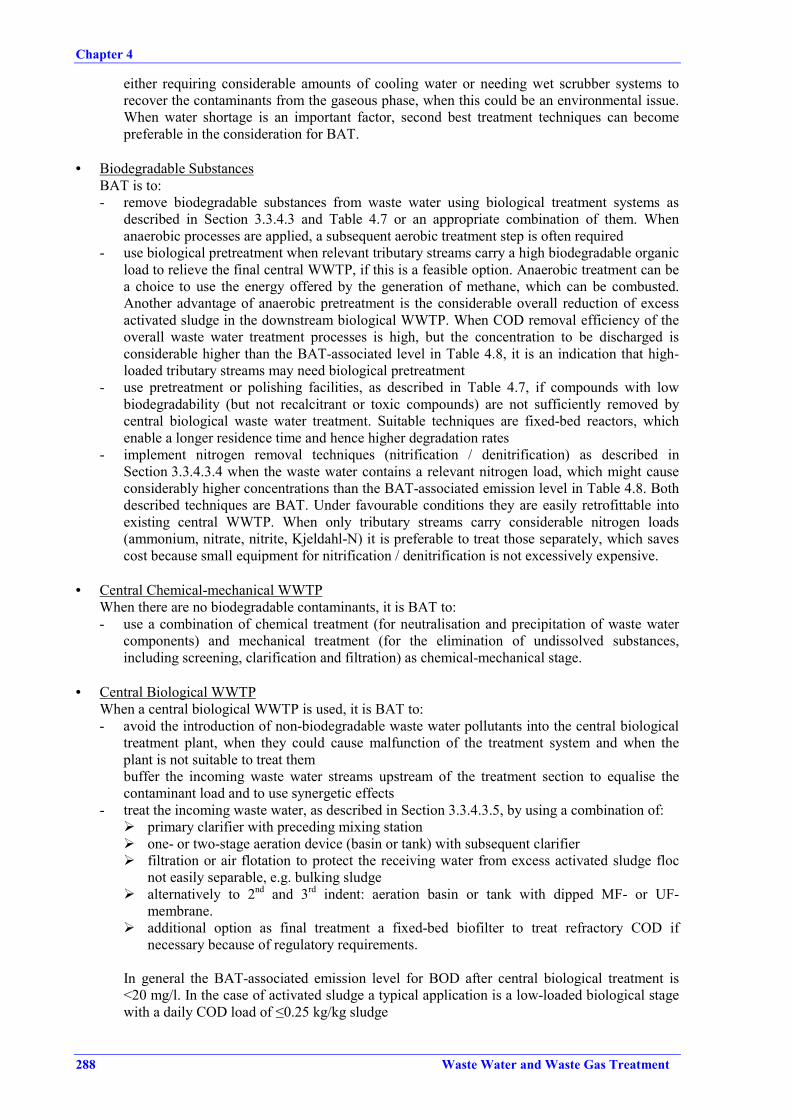
Chapter 4
288 Waste Water and Waste Gas Treatment
either requiring considerable amounts of cooling water or needing wet scrubber systems torecover the contaminants from the gaseous phase, when this could be an environmental issue.When water shortage is an important factor, second best treatment techniques can becomepreferable in the consideration for BAT.
• Biodegradable SubstancesBAT is to:- remove biodegradable substances from waste water using biological treatment systems as
described in Section 3.3.4.3 and Table 4.7 or an appropriate combination of them. Whenanaerobic processes are applied, a subsequent aerobic treatment step is often required
- use biological pretreatment when relevant tributary streams carry a high biodegradable organicload to relieve the final central WWTP, if this is a feasible option. Anaerobic treatment can bea choice to use the energy offered by the generation of methane, which can be combusted.Another advantage of anaerobic pretreatment is the considerable overall reduction of excessactivated sludge in the downstream biological WWTP. When COD removal efficiency of theoverall waste water treatment processes is high, but the concentration to be discharged isconsiderable higher than the BAT-associated level in Table 4.8, it is an indication that high-loaded tributary streams may need biological pretreatment
- use pretreatment or polishing facilities, as described in Table 4.7, if compounds with lowbiodegradability (but not recalcitrant or toxic compounds) are not sufficiently removed bycentral biological waste water treatment. Suitable techniques are fixed-bed reactors, whichenable a longer residence time and hence higher degradation rates
- implement nitrogen removal techniques (nitrification / denitrification) as described inSection 3.3.4.3.4 when the waste water contains a relevant nitrogen load, which might causeconsiderably higher concentrations than the BAT-associated emission level in Table 4.8. Bothdescribed techniques are BAT. Under favourable conditions they are easily retrofittable intoexisting central WWTP. When only tributary streams carry considerable nitrogen loads(ammonium, nitrate, nitrite, Kjeldahl-N) it is preferable to treat those separately, which savescost because small equipment for nitrification / denitrification is not excessively expensive.
• Central Chemical-mechanical WWTPWhen there are no biodegradable contaminants, it is BAT to:- use a combination of chemical treatment (for neutralisation and precipitation of waste water
components) and mechanical treatment (for the elimination of undissolved substances,including screening, clarification and filtration) as chemical-mechanical stage.
• Central Biological WWTPWhen a central biological WWTP is used, it is BAT to:- avoid the introduction of non-biodegradable waste water pollutants into the central biological
treatment plant, when they could cause malfunction of the treatment system and when theplant is not suitable to treat thembuffer the incoming waste water streams upstream of the treatment section to equalise thecontaminant load and to use synergetic effects
- treat the incoming waste water, as described in Section 3.3.4.3.5, by using a combination of: primary clarifier with preceding mixing station one- or two-stage aeration device (basin or tank) with subsequent clarifier filtration or air flotation to protect the receiving water from excess activated sludge floc
not easily separable, e.g. bulking sludge alternatively to 2nd and 3rd indent: aeration basin or tank with dipped MF- or UF-
membrane. additional option as final treatment a fixed-bed biofilter to treat refractory COD if
necessary because of regulatory requirements.
In general the BAT-associated emission level for BOD after central biological treatment is<20 mg/l. In the case of activated sludge a typical application is a low-loaded biological stagewith a daily COD load of ≤0.25 kg/kg sludge
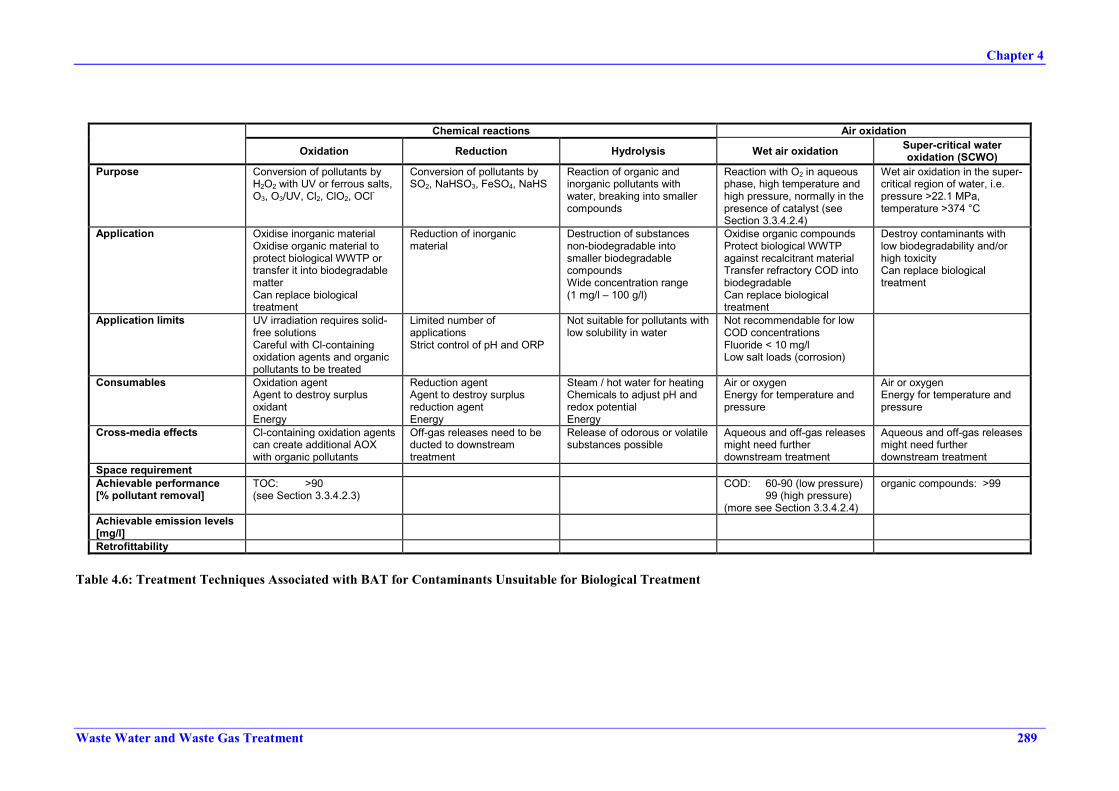
Chapter 4
Waste Water and Waste Gas Treatment 289
Chemical reactions Air oxidation
Oxidation Reduction Hydrolysis Wet air oxidation Super-critical wateroxidation (SCWO)
Purpose Conversion of pollutants byH2O2 with UV or ferrous salts,O3, O3/UV, Cl2, ClO2, OCl-
Conversion of pollutants bySO2, NaHSO3, FeSO4, NaHS
Reaction of organic andinorganic pollutants withwater, breaking into smallercompounds
Reaction with O2 in aqueousphase, high temperature andhigh pressure, normally in thepresence of catalyst (seeSection 3.3.4.2.4)
Wet air oxidation in the super-critical region of water, i.e.pressure >22.1 MPa,temperature >374 °C
Application Oxidise inorganic materialOxidise organic material toprotect biological WWTP ortransfer it into biodegradablematterCan replace biologicaltreatment
Reduction of inorganicmaterial
Destruction of substancesnon-biodegradable intosmaller biodegradablecompoundsWide concentration range(1 mg/l – 100 g/l)
Oxidise organic compoundsProtect biological WWTPagainst recalcitrant materialTransfer refractory COD intobiodegradableCan replace biologicaltreatment
Destroy contaminants withlow biodegradability and/orhigh toxicityCan replace biologicaltreatment
Application limits UV irradiation requires solid-free solutionsCareful with Cl-containingoxidation agents and organicpollutants to be treated
Limited number ofapplicationsStrict control of pH and ORP
Not suitable for pollutants withlow solubility in water
Not recommendable for lowCOD concentrationsFluoride < 10 mg/lLow salt loads (corrosion)
Consumables Oxidation agentAgent to destroy surplusoxidantEnergy
Reduction agentAgent to destroy surplusreduction agentEnergy
Steam / hot water for heatingChemicals to adjust pH andredox potentialEnergy
Air or oxygenEnergy for temperature andpressure
Air or oxygenEnergy for temperature andpressure
Cross-media effects Cl-containing oxidation agentscan create additional AOXwith organic pollutants
Off-gas releases need to beducted to downstreamtreatment
Release of odorous or volatilesubstances possible
Aqueous and off-gas releasesmight need furtherdownstream treatment
Aqueous and off-gas releasesmight need furtherdownstream treatment
Space requirementAchievable performance[% pollutant removal]
TOC: >90(see Section 3.3.4.2.3)
COD: 60-90 (low pressure) 99 (high pressure)(more see Section 3.3.4.2.4)
organic compounds: >99
Achievable emission levels[mg/l]Retrofittability
Table 4.6: Treatment Techniques Associated with BAT for Contaminants Unsuitable for Biological Treatment

Chapter 4
290 Waste Water and Waste Gas Treatment
NF / RO Adsorption ExtractionPurpose Separation of most contaminants Transfer of soluble pollutants from the water
phase to a solid adsorbentTransfer of soluble pollutants from the waterphase into a solvent
Application Achieving high grade of purity to recycle andre-use the waterConcentration increase of contaminants forfurther treatment requirementsRecovery is possible
Remove organic not biodegradable, coloured,odorous and/or toxic pollutantsConcentration enrichment for further treatmentoptions (e.g. incineration)Recovery is possible
Remove organic non-biodegradable and/ortoxic pollutants at high concentrationPretreatment to adsorption to reduce feed loadRecovery is possibleNot suitable as final treatment
Application limits Concentrations with osmotic pressures toohigh to operateLow thermal and chemical resistance
Low pollutant load, otherwise adsorbent isspent too fastLimited TSS because of cloggingEfficiency dependent on physical properties ofthe pollutant (low efficiency with low molecularmass, high polarity, high solubility)
Waste water preferably free of TSS andemulsionsDependent on suitability of solvent, thuslimited applications
Consumables Chemicals for cleaningHigh energy requirement
AdsorbentChemicals for regenerationEnergy for pumps and regeneration process(elevated temperature)
Replacement of solvent lossesEnergy for pumpingEnergy for subsequent solvent recovery (e.g.distillation / rectification)
Cross-media effects Concentrate needs further treatment, e.g.extraction, incineration (if not recovered)
Off-gases during regeneration requiretreatmentRegeneration generates residue (if notrecovered)
Waste water needs treatment to get rid ofdissolved solvent, e.g. strippingBottom residue from solvent recovery, if notrecovered, to incinerationOff-gas from extraction and recovery needswaste gas treatment, e.g. adsorption orincineration
Space requirement Normally at least two columns per applicationAchievable performance[% pollutant removal]
High efficiency (see Section 3.3.4.2.8) High efficiency, depending on pollutant (seeSection 3.3.4.2.9)
Good efficiency for special pollutants with highfeed concentration
Achievable emission levels[mg/l]Retrofittability
Table 4.6: continued
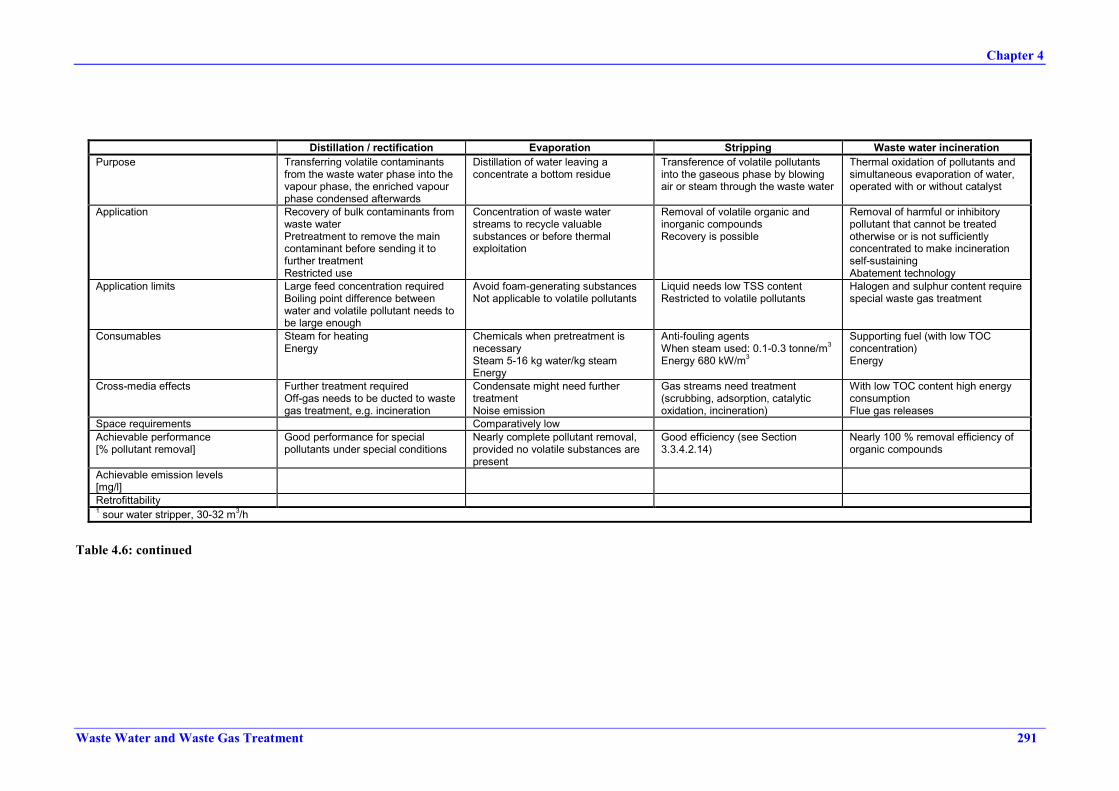
Chapter 4
Waste Water and Waste Gas Treatment 291
Distillation / rectification Evaporation Stripping Waste water incinerationPurpose Transferring volatile contaminants
from the waste water phase into thevapour phase, the enriched vapourphase condensed afterwards
Distillation of water leaving aconcentrate a bottom residue
Transference of volatile pollutantsinto the gaseous phase by blowingair or steam through the waste water
Thermal oxidation of pollutants andsimultaneous evaporation of water,operated with or without catalyst
Application Recovery of bulk contaminants fromwaste waterPretreatment to remove the maincontaminant before sending it tofurther treatmentRestricted use
Concentration of waste waterstreams to recycle valuablesubstances or before thermalexploitation
Removal of volatile organic andinorganic compoundsRecovery is possible
Removal of harmful or inhibitorypollutant that cannot be treatedotherwise or is not sufficientlyconcentrated to make incinerationself-sustainingAbatement technology
Application limits Large feed concentration requiredBoiling point difference betweenwater and volatile pollutant needs tobe large enough
Avoid foam-generating substancesNot applicable to volatile pollutants
Liquid needs low TSS contentRestricted to volatile pollutants
Halogen and sulphur content requirespecial waste gas treatment
Consumables Steam for heatingEnergy
Chemicals when pretreatment isnecessarySteam 5-16 kg water/kg steamEnergy
Anti-fouling agentsWhen steam used: 0.1-0.3 tonne/m3
Energy 680 kW/m3
Supporting fuel (with low TOCconcentration)Energy
Cross-media effects Further treatment requiredOff-gas needs to be ducted to wastegas treatment, e.g. incineration
Condensate might need furthertreatmentNoise emission
Gas streams need treatment(scrubbing, adsorption, catalyticoxidation, incineration)
With low TOC content high energyconsumptionFlue gas releases
Space requirements Comparatively lowAchievable performance[% pollutant removal]
Good performance for specialpollutants under special conditions
Nearly complete pollutant removal,provided no volatile substances arepresent
Good efficiency (see Section3.3.4.2.14)
Nearly 100 % removal efficiency oforganic compounds
Achievable emission levels[mg/l]Retrofittability1 sour water stripper, 30-32 m3/h
Table 4.6: continued
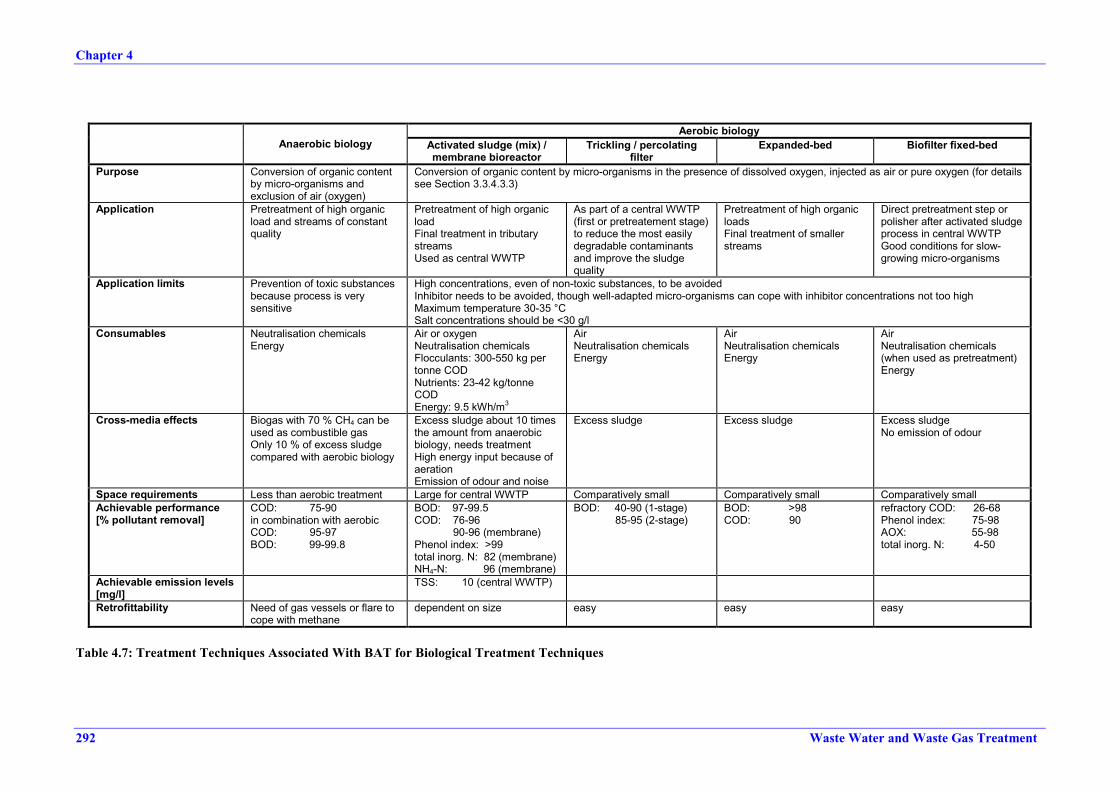
Chapter 4
292 Waste Water and Waste Gas Treatment
Aerobic biologyAnaerobic biology Activated sludge (mix) /
membrane bioreactorTrickling / percolating
filterExpanded-bed Biofilter fixed-bed
Purpose Conversion of organic contentby micro-organisms andexclusion of air (oxygen)
Conversion of organic content by micro-organisms in the presence of dissolved oxygen, injected as air or pure oxygen (for detailssee Section 3.3.4.3.3)
Application Pretreatment of high organicload and streams of constantquality
Pretreatment of high organicloadFinal treatment in tributarystreamsUsed as central WWTP
As part of a central WWTP(first or pretreatement stage)to reduce the most easilydegradable contaminantsand improve the sludgequality
Pretreatment of high organicloadsFinal treatment of smallerstreams
Direct pretreatment step orpolisher after activated sludgeprocess in central WWTPGood conditions for slow-growing micro-organisms
Application limits Prevention of toxic substancesbecause process is verysensitive
High concentrations, even of non-toxic substances, to be avoidedInhibitor needs to be avoided, though well-adapted micro-organisms can cope with inhibitor concentrations not too highMaximum temperature 30-35 °CSalt concentrations should be <30 g/l
Consumables Neutralisation chemicalsEnergy
Air or oxygenNeutralisation chemicalsFlocculants: 300-550 kg pertonne CODNutrients: 23-42 kg/tonneCODEnergy: 9.5 kWh/m3
AirNeutralisation chemicalsEnergy
AirNeutralisation chemicalsEnergy
AirNeutralisation chemicals(when used as pretreatment)Energy
Cross-media effects Biogas with 70 % CH4 can beused as combustible gasOnly 10 % of excess sludgecompared with aerobic biology
Excess sludge about 10 timesthe amount from anaerobicbiology, needs treatmentHigh energy input because ofaerationEmission of odour and noise
Excess sludge Excess sludge Excess sludgeNo emission of odour
Space requirements Less than aerobic treatment Large for central WWTP Comparatively small Comparatively small Comparatively smallAchievable performance[% pollutant removal]
COD: 75-90in combination with aerobicCOD: 95-97BOD: 99-99.8
BOD: 97-99.5COD: 76-96 90-96 (membrane)Phenol index: >99total inorg. N: 82 (membrane)NH4-N: 96 (membrane)
BOD: 40-90 (1-stage) 85-95 (2-stage)
BOD: >98COD: 90
refractory COD: 26-68Phenol index: 75-98AOX: 55-98total inorg. N: 4-50
Achievable emission levels[mg/l]
TSS: 10 (central WWTP)
Retrofittability Need of gas vessels or flare tocope with methane
dependent on size easy easy easy
Table 4.7: Treatment Techniques Associated With BAT for Biological Treatment Techniques

Chapter 4
Waste Water and Waste Gas Treatment 293
• Waste Water Discharge into Surface WaterAfter the treatment procedures mentioned in the preceding sections of this chapter thetreated waste water is discharged into a receiving water body (river, lake or sea).
BAT is a suitable combination of:- avoiding a discharge situation such as excessive hydraulic load or toxic waste water that
can cause damage to the river bed, the embankment or the biosphere of the receivingwater
- choosing, whenever it is possible, a discharge point into surface water where the wastewater is most efficiently dispersed. This minimises the impact on the aqueousbiosphere. This measure is not intended to replace treatment techniques
- balancing waste water not coming from a central WWTP to reduce the impact on thereceiving water body and to meet discharge requirements before discharging it
- implementing a monitoring system to check the water discharge with adequatemonitoring frequency (e.g. between 8 and 24-hours sampling)
- performing toxicity assessment as a complementary tool with the aim of obtaining(more) information on the effectiveness of the control measures and/or on the hazardassessment for the receiving water body. The application of toxicity assessment, such asthe actual need, the methods to be used and programming should be determined on acase-by-case basis.
BAT-associated emission levels for final waste water discharge into surface water are listedin Table 4.8. These values are to understand as emission without dilution with rainwaterand/or uncontaminated cooling water. For a better comparability of strategies with orwithout central biological WWTP, COD-performance is based on the raw contaminant load,i.e. the load before treatment and recycling / recovery procedures.
Parameter aPerformance
rates[%]
Emissionlevels
[mg/l] b
TSS 10-20 c
COD 76-96 d 30–250total inorganic N e 5-25total P 0.5-1.5 f
AOXa for BOD see preceding section on central biological treatmentb daily average, exception TSSc monthly averaged low performance rates for low contaminant concentrationse sum of NH4-N, NO2-N and NO3-N (a more recommendable parameter would betotal N. Because of the lack of information on total N, total inorganic N is usedhere)f lower range from nutrient feed in biological WWTP, upper range fromproduction processes
Table 4.8: BAT-associated Emission Levels for Final Waste Water Discharge into a ReceivingWater
No BAT-associated emission levels for heavy metals could be identified that wouldrepresent the chemical sector as a whole. The reasons for this situation include:
achievable emission levels of heavy metals after treatment at source are highlydependent on the production process where they are produced
the levels depend on the actual waste water matrix the discharge concentrations depend on the site-specific waste water mixture from the
various production processes, since there exists no further treatment after treatment atsource.

Chapter 4
294 Waste Water and Waste Gas Treatment
As compensation for the lack of BAT-associated emission levels for waste water dischargeof heavy metals, examples of such discharges are given in Annex 7.6.4. These examples aremeant to show the range of heavy metal emissions from chemical sites of variouscomplexities.
Split viewOne Member State insists on naming BAT-associated emission levels for heavy metalsbased on the examples given in Annex 7.6.4. In their view, when following the strategy ofprevention, pretreatment and central treatment as outlined above (see section on heavymetals), it is possible to name BAT-associated emission values for heavy metals whichare valid for many chemical sites. The following long term mean values (yearly of 24 h-mixed samples) in some examples of chemical sites at the discharge point/last waste watertreatment stage could be reached (without dilution of the waste water with rain andcooling water): Cd 0.02 – 0.833 µg/l; Hg 0.01 – 0.84 µg/l; Pb 10 – 100 µg/l;Cr 10 - 30 µg/l; Cu 20 – 60 µg/l; Ni 10 – 80 µg/l; Zn 4 – 174 µg/l. They further state thatthe values are influenced by the portion of productions relevant to heavy metals and henceare dependent on the production mix, which can cause higher values in special cases,especially in fine chemicals production. With regard to releases into public seweragesystems, the effect of the WWTP would have to be taken into account in so far as it wouldbe ensured that the heavy metals are not shifted to other media.The TWG did not follow this request, stating that it would not be useful to name BAT-associated emission levels which are influenced by particular combinations of waste waterstreams on individual production sites, resulting in values which might or might not bevalid in real-life cases. A split view is therefore recorded.
The situation with BAT-associated emission levels of AOX is comparable to that withheavy metals. The specific production-mix on a given site greatly influences the amount ofAOX discharged, hence levels valid for the chemical sector as a whole are not obtainable.Further more, AOX is not yet a regulatory parameter in most Member States. This might bethe reason why only one Member State reported AOX data for final waste water discharge.AOX will have to be reported routinely under EPER by the year 2003. Thus, the duty toroutinely monitor and report AOX might be a driver to make emission levels available fromthat time on. Until then, however, the TWG cannot come to a conclusion on BAT-associated emission levels for AOX. Nevertheless, the necessity for this parameter isemphasised.
Split viewOne Member State insists on naming BAT-associated emission levels for AOX based onthe examples given in Annex 7.6.2. They state that in this Member State on somechemical sites with production of chloro-organic chemicals and central waste watertreatment plants, AOX emission levels between 0.16 and 1.7 mg/l are achieved.The TWG did not follow this request. The examples presented (see Annex 7.6.2) wereinterpreted as consisting of different statistical data sets which did not allow naming BAT-associated emission levels. It was even mentioned that one of the lowest AOX emissionvalues reported as examples represented poor performance, whereas the highest emissionvalue came from a site with very good performance. Under these conditions the TWG sawit to be unsuitable to give BAT-associated emission levels for AOX. A split view istherefore recorded.
The BAT-associated emission levels listed in Table 4.8 reflect the emission levels aftercentral biological treatment. When the waste water is ducted to a municipal WWTP, itneeds to be demonstrated by, e.g. appropriate laboratory tests or other knowledge, thatequivalent results can be achieved. The decentralised treatment strategy is equivalent tofinal biological treatment when it achieves comparable results.

Chapter 4
Waste Water and Waste Gas Treatment 295
• BAT for Sludge TreatmentWhen sludge from waste water facilities is treated on the chemical industry site, it is BATto:- operate the techniques described in Section 3.4, also taking into account landfilling- concentrate sludge using the techniques described in Section 3.4.1- stabilise sludge for further treatment or disposal using the techniques described in
Section 3.4.2- use waste energy from chemical production processes as far as possible when thermal
sludge treatment, e.g. drying, as described in Section 3.4.3 is operated- operate appropriate waste gas treatment when sludge incineration is used as described
in Section 3.4.3.Off-site treatment is not taken into account because it is not within the scope of thedocument. This is by no means a BAT conclusion against off-site treatment by third-partycontractors.
4.3.2 Waste Gas Section
This section is devoted to the determination of BAT for waste gas treatment on a chemicalindustry site.
BAT for Process-integrated MeasuresAs with waste water, process-integrated measures are the preferred method for preventing orreducing the amount of waste gas and exhaust air contamination, but they are generallyproduction- or process-specific and their applicability requires special assessment, which iswithin the scope of the vertical BREFs on the chemical and related sectors. Conclusions onBAT for process-integrated measures in this document therefore refer to the general need toimplement these measures within a production line.
BAT is to:• use process-integrated measures in preference to end-of-pipe techniques when there is a
choice (e.g. in the case of NOx from combustion processes, the use of primary reductiontechniques such as low-NOx burners, in preference to secondary treatment techniques)
• assess existing production installations for options of retrofitting process-integratedmeasures and implement them when feasible or at latest when the installation undergoesmajor alterations. The observation of safety rules is a crucial point when assessing existingproduction lines for retrofitting options, because some might not allow the implementationof process-integrated measures due to explosion or corrosion risk
• assess existing production installations for options of source reduction of gaseouscontaminants and implement these options if feasible (also under safety conditions).Contaminant reduction at source reduces the amount of waste gas to be treated. Largeamounts of unnecessary waste gas mean installing larger equipment than necessary, whichis not cost-effective
• consider as far as possible all options for source reduction when planning a new installationor major alterations.
BAT for Waste Gas CollectionWaste gas collection systems are installed to route gaseous emissions to treatment systems.They consist of the emission source enclosure, vents and pipes.
BAT is to:• minimise the gas flow rate to the control unit by encasing the emission sources as far as
possible. However, process operability, safety issues, product quality and hygiene concernstake precedence, as mentioned in Section 2.2.2.4.2
• prevent explosion risk by:

Chapter 4
296 Waste Water and Waste Gas Treatment
- installing a flammability detector inside the collection system when the risk ofoccurrence of a flammable mixture is significant
- keeping the gas mixture securely below the LEL by adding air sufficient to limit it to25 % of LEL, by adding inert gas, such as nitrogen, instead of air or by working underinert atmosphere in the production vessel. The other option is to keep the gas mixturesecurely above HEL.
• install appropriate equipment to prevent the ignition of flammable gas-oxygen mixtures orminimise its effects, such as detonation arrestors and seal drums.
BAT for Waste Gas Treatment
The approach to reaching BAT conclusions follows the pathway of pollutants as in Section 3.5and illustrated in Figure 3.45. Regional issues, such as climate, availability of water, energy,raw material and/or existence of waste disposal or treatment facilities, shortage of water, energyor raw material, inaccessibility of the site or difficulties of waste disposal, can render commonlyused techniques unsuitable for a chemical industry site, which may require treatment techniquesto be especially developed.
According to treatment, the sources for waste gases are distinguished as:
• low-temperature sources, such as production processes, handling of chemicals (includingstorage activities causing emissions), work-up of products
• high-temperature sources, such as combustion processes, which include facilities such asboilers, power plants, process incinerators and thermal and catalytic oxidisers.
The releases of both groups have special contaminants to consider. The first group can consistof:• dust alone, i.e. solid raw material or products finely dispersed in air• VOC from compounds used in production or evaporated from a tank, with or without dusty
content• inorganic volatile compounds from production or work-up, with or without dusty content• mixture of VOC and inorganic compounds, with or without dusty content• mists.
The order of treatment techniques used in these cases is:• 1st step: remove considerable amounts of solid material or mists before further treatment of
gaseous components if this treatment is not suitable for high dust or mist concentrations• 2nd step: remove the gaseous pollutants• 3rd step: if the second step cannot achieve the required emission levels, further abatement is
necessary as a final polishing stage.
The second group – high-temperature processes – consists of a mixture of:• particulate matter• halogen compounds (mainly HCl, HF and Cl2)• carbon monoxide• sulphur oxides (mainly SO2)• NOx
• possibly dioxins.
BAT for treatment of waste gases originating from production processes, material handling andproduct work-up
• DustBAT is an adequate combination of:- removing particulate matter and aerosols / droplets from waste gas streams, using
techniques or combinations of techniques described in Section 3.5.3 and Table 4.9according to the given situation

Chapter 4
Waste Water and Waste Gas Treatment 297
- using pretreatment to prevent final facilities from damage or overloading. Damage isdone by e.g. hard or large particles or particles that clog filters, adsorption columns,scrubber surfaces, membrane surfaces, catalysts
- using high-efficiency techniques to remove considerable amounts of submicronparticulate matter
- implementing downstream mist filter when wet scrubbers are used as final treatmentdevice (with a HEAF the use of a mist filter downstream is already included)
- operating techniques in their appropriate pressure range (a/c ratio, flow rate/surfaceratio) to prevent damage to the vessel or dust emissions from vessel leaks
- using material recovery wherever feasible- taking into account energy consumption by critically assessing the use of energy-
intensive techniques and comparing the results with energy-free or low-energytechniques
- taking into account water consumption, most of all in regions where water shortage isan issue. The use of wet scrubbing needs to be assessed and the results compared withwater-free techniques
- using scrubbing water in a recycle mode with a maximum number of recycles when it isfeasible and does not lead to abrasion or corrosion in the scrubber vessel.
• VOCBAT is an appropriate combination of:- removing VOC from waste gas streams, using techniques (or a combination thereof)
described in Sections 3.5.1 and 3.5.2 and listed in Table 4.10.- using recovery techniques such as condensation, membrane separation or adsorption
whenever feasible to regain raw material and solvents. Waste gas streams with highVOC concentrations are best pretreated by techniques such as condensation ormembrane separation / condensation to recover the main load before sending them toadsorption, wet scrubbing or combustion. In the case of adsorption and combustion thiscan also be a safety issue, keeping VOC concentration below 25 % LEL
- taking into account water consumption (process and cooling water) with techniquessuch as wet scrubbing, condensation (when water is used as cooling medium),adsorption (when water is used in regeneration processes or to cool the waste gasstream before entering the adsorption column) or biological treatment (where water isused as reaction medium). The use of those techniques needs to be assessed andcompared with the results of water-free techniques. When water shortage is animportant issue these techniques can become unsuitable under special local conditions
- using abatement techniques only when recovery is not feasible, e.g. because of very lowVOC concentrations causing expenditure of energy or material disproportionate to theecological benefit derived
- assessing existing waste gas abatement if material recovery is feasible and implementthe appropriate technique, if the response is positive
- preferring biological treatment of low-concentration waste gas streams to incinerationprocesses if applicable (i.e. when content and composition of the waste gas as well asclimate characteristics are suitable, see Section 3.5.2.1) and if water saving allows it.The consumption of supporting fuel for the incineration of low VOC concentrations is adisadvantage that can, however, be counterbalanced if no other treatment is feasible toachieve the environmental targets set, for example, by legal restrictions
- using combustion of waste gas streams, especially when autothermal operation ispossible, when hazardous compounds need to be abated or when other, likewiseefficient techniques are not available
- preferring catalytic oxidation whenever feasible and ecologically favourable comparedto thermal oxidation. The much lower NOx-content in the emitted flue gas, the loweroperation temperature and energy requirement may render it more advantageous thanthermal oxidation
- operating combustion techniques with energy recovery (gas engine, regenerative andrecuperative incinerator) when feasible

Chapter 4
298 Waste Water and Waste Gas Treatment
- using thermal incineration when catalytic incineration is not applicable, e.g. because ofpoisonous effects of the waste gas content, or the lower destruction efficiency ofcatalytic oxidation is not sufficient to abate the respective VOC appropriately
- implementing combustion exhaust gas treatment after incineration when considerableamounts of exhaust gas contaminants are to be expected because of the waste gascontaminants exposed to incineration, such as SO2, HCl, NOx, whereas dioxins arenormally not an issue in waste gas combustion
- using flaring only to dispose safely of surplus combustible gases from, e.g. maintenanceevents, upset systems or remote vents without connection to abatement systems
- using ground flares only when there are no hazardous substances expected in the fluegas. When flares are needed, despite the foregoing conclusion, the options for heatrecovery and low-NOx burning have to be assessed and, when the result is positive, therespective equipment has to be implemented.
• Other compounds than VOCsBAT is to- remove these waste gas pollutants (hydrogen halides, Cl2, SO2, H2S, CS2, COS, NH3,
HCN, NOx, CO, Hg) by applying the appropriate techniques listed in Table 4.10.Appropriate techniques are: wet scrubbing (water, acidic or alkaline solution) for hydrogen halides, Cl2, SO2,
H2S, NH3 scrubbing with non-aqueous solvent for CS2, COS adsorption for CS2, COS, Hg biological gas treatment for NH3, H2S, CS2 incineration for H2S, CS2, COS, HCN, CO SNCR or SCR for NOx.
- recover hydrogen chloride whenever feasible by using water as scrubbing medium inthe first scrubbing stage to produce a solution of hydrochloric acid to be used as rawmaterial
- recover NH3 whenever feasible, using a technique that enables its recovery.
The techniques to consider as BAT are listed in Table 4.10.
The TWG did not come to conclusions on BAT-associated emission levels for waste gases fromproduction processes. It was recommended to leave this task to the appropriate vertical BREFs,because these levels were identified as process-specific and hence no levels could be given thatconsider the whole chemical sector.

Chapter 4
Waste Water and Waste Gas Treatment 299
Separator Cyclone (dry and wet) ESP (dry and wet) Wet scrubber a
Purpose Gravity separation Gravity separation supported bycentrifugal forces
Separation by electric field Mass transfer from gaseous phaseinto liquid phase
Application Preliminary (not stand-alonetechnique) to various filter systemsto prevent entrainment or abrasionNot suitable for flue gasRecovery possible in principle
Control of PM as precleaners forESP or fabric filters (not stand-alone technique)After spray drying, crushing,grinding and calcining operationsSuitable for flue gasRecovery possible in principle
Control of PM as final treatmentAfter boilers, in chemical manufacture,refineries, incineration and injectionsystemsApplicable for wet and sticky material,flammable mixtures (see Section3.5.3.3), acid mists (wet ESP)Recovery possible in principle
Control of PM as final treatmentDependent on variant for PM downto <PM2.5 and PMHAPApplication see Table 3.16Recovery possible in principleAlso applicable to gas removal(VOC, inorganic compounds)
Application limits Flow rate: up to 100000 Nm3/hDust content: no restrictionParticulate size: > PM50, but alsodown to PM10Temperature dependent on vesselmaterial, normally up to 540 °C
Flow rate: up to 100000 Nm3/h (single unit) up to 180000 Nm3/h (multiple units)Dust content: up to 16000 g/Nm3
Particulate size: down to PM2.5Temperature dependent on vesselmaterial, can be >1200 °C
Flow rate: very high, dependent onvariant up to 1800000 Nm3/hDust content: 1-10 g/Nm3 (wire-pipe) 2-110 g/Nm3 (wire-plate)Particulate size: >PM1.0Temperature: up to 700 °C (dry) <90 °C (wet)Resistivity: 5x10³-2x10¹⁰ ohm cmNot applicable to Hg
Flow rate: dependent on variant upto 170000 Nm3/hDust content: see Table 3.16High dust loading with platescrubber, spray tower,impingement-entrainment scrubber,venturi-scrubberTemperature: see Table 3.16
Consumables Energy: only for fanPressure drop: <0.5 kPa
Energy: 0.25-1.5 kWh/1000 Nm3
Pressure drop: 0.5-2.5 kPaWater with wet ESPEnergy: 0.5-2 kWh/1000 Nm3
Pressure drop: 0.05-0.5 kPa
Scrubbing water: 0.5-5 l/Nm3
Energy: 1-6 kWh/1000 Nm3
Pressure drop: 3-20 kPa (venturi)Cross-media effects Disposal of dust Disposal of dust
Emission of noiseDisposal of dust or waste water (wetESP)
Suspension needing furtherseparation treatmentEmission of noise
Space requirement LowAchievable performance[% pollutant removal]
10-90(dependent on particle size and feedconcentration)
PM 80-99PM10 60-95PM5 80-95PM2.5 20-70
PM 99-99.2PM10 97.1-99.4PM2.5 96-99.2(dry and wet ESP)
PM 50-99 depending on variantVOC 50-95 depending on variantSO2 80-99(see Table 3.17)
Achievable emission levels[mg/Nm3]
dust: 5-15
Retrofittability Normally integrateda details in the corresponding chapter
Table 4.9: Treatment Techniques Associated With BAT for Particulate Treatment from Normal Waste Gas Streams

Chapter 4
300 Waste Water and Waste Gas Treatment
Fabric filter Two-stage dust filter HEPA-filter HEAF Mist filterPurpose Filter technique, filter cake
improving efficiencyFilter technique, materialmetal gauze, metal mesh
Filter technique, material paperor matted glass fibre with highpacking density
Filter technique, flat-bedfilter
Filter technique, mesh padfilters of metallic or syntheticmonofilament
Application Removal of PM <PM2.5 as finaltreatmentCollect PM unsuitable for ESPWith injection systems (flue gas)Suitable for flue gasRecovery possible in principle
Removal of PM as finaltreatmentWith injection systems (fluegas)Suitable for flue gasRecovery possible inprinciple
Removal of submicron PMbetween PM0.12 and PM0.3Downstream after ESP or fabricfilters as final treatment whenhigh collection efficiencyrequiredRecovery possible in principle
Removal of aerosols such asoil, plasticisers, condensableVOCDownstream mist filter anddroplet separator required
Removal of aerosols anddropletsProtection of downstreamequipment to prevent wear andfrictionPrimary collection device toleave smaller particles to othertreatment techniquesAfter wet scrubber
Application limits Large particles to be collectedupstreamFlow rate: up to 1800000 Nm3/hTemperature dependent onfabric (see Table 3.18), abovedew pointDust content up to 230 g/Nm3
Sticky dust to be avoided
Flow rate: up to 75000Nm3/h per moduleTemperature: up to 400 °CDust content: no restrictions
Flow rate: up to 3600 Nm3/h permoduleTemperature: <200 °C <530 °C (ceramic) above dew pointDust content: 1-30 g/Nm3
Avoid moist environment
Flow rate up to 25000 Nm3/h Flow rate up to 150000 Nm3/hTemperature <170 °CDust content <1 mg/Nm3
Consumables Compressed airEnergy: 0.2-2 kWh/1000 Nm3
Pressure drop: 0.5-2.5 kPa 5-50 kPa (ceramic)
Compressed airEnergy: 1.5 kWh/1000 Nm3
Pressure drop: 0.5-2.5 kPa
Energy: <0.1 kWh/1000 Nm3
Pressure drop: 0.05-0.25 kPaEnergy: <0.1 kWh/1000 Nm3
Pressure drop: 8 kPaEnergyPressure drop 2.5-9.0 kPa
Cross-media effects Dust disposal Dust disposal Disposal of loaded filtermodules
Disposal of loaded filter rolls Disposal of washing liquid andloaded filter material
Space requirementAchievable performance[% pollutant removal]
dust 99-99.9 PM0.01 >99.99PM0.1 nearly completely
droplets 99aerosols 99
dust 99aerosols 99
Achievable emission levels[mg/Nm3]
dust 2-10 1 (ceramic filter)
dust 1(independent of feed)
PM 0.0001
Table 4.9: continued

Chapter 4
Waste Water and Waste Gas Treatment 301
Wet scrubbing (see Section3.5.1.4) Adsorption Condensation Membrane separation
Purpose Mass transfer from gaseous phaseinto liquid phase
Material transfer from gaseousphase to solid surface
Liquefaction by cooling Permeation through membranesurface
Application Control of VOC, inorganiccompounds and also of dust,dependent on variant and scrubberliquid (water, acidic and alkalinesolution), 1- or 2-stageApplication see Section 3.5.1.4In principle, recovery possible bydesorption
Removal of VOC, odoroussubstances, dioxins, etc.Guard filter after final treatmentDifferent variants, see Section 0In principle recovery possible afterregeneration
Recovery of VOC from concentratedwaste gas streamPretreatment before adsorption,scrubbing, abatement systemsPost-treatment of enriched gasstreams from membranes or wastewater stripping
Recovery of VOC or fuel vapoursEnrichment of VOC gas streams tomake them available for treatmentsuch as condensation or valuable forincineration
Application limits Flow rates see Section 3.5.1.4Temperatures best below 40 °C forgas scrubbing with water withoutchemical reactionDust load: dependent on variant, seeSection 3.5.1.4
Flow rate: up to 100000 Nm3/hTemperature: <80 °C (GAC) < 250 °C (zeolites)VOC content: <25 % LELDust load: low
Flow rate: up to 100000 Nm3/h <5000 Nm3/h (for cryogenic version)Temperature: <80 °CLimitations because of freezing andsubsequent blockingDust load: low (<50 mg/Nm3)
Flow rate: dependent on membranesurface areaTemperature and pressuredependent on membrane materialDust load: very lowVOC load: no limit
Consumables Scrubbing water, cooling waterChemicals (acid, caustic, oxidant)Energy 0.2-1 kWh/1000 Nm3
Steam for stripping (desorption)Pressure drop 0.4-0.8 kPa
Steam or nitrogen (desorption)Cooling water (condensation)Energy 35-260 kWh/tonne solventPressure drop: 2-5 kPa
Cooling medium (air, water, brine,ammonia-brine, liquid nitrogen)Energy: 70 kWh/1000 Nm3
(crogenic)Pressure drop: 0.1-0.2 kPa
Energy: 250 kWh/1000 Nm3
Pressure drop: 0.1-1 MPa
Cross-media effects Waste water to be treatedEnergy and emission of regeneration
Waste water from regenerationDisposal of adsorbent
Further treatment normally requiredafter condensation
Further treatment of permeate
Space requirementAchievable performance[% pollutant removal]
VOC 50-99inorganic compounds 90-99SO2 80-99
VOC 80-95Odour 80-95H2S 80-95
VOC up to 99.9
Achievable emission levels[mg/Nm3]
HF <1HCl <10 (<50 with water)SO2 <40
Hg <0.05Dioxins <0.1 ng/Nm3 TEQ
see Section 3.5.1.2
Retrofittability relatively easy relatively easy see Section 3.5.1.2
Table 4.10: Treatment Techniques Associated With BAT for Treatment of VOC and Inorganic Compounds from Normal Waste Gas Streams

Chapter 4
302 Waste Water and Waste Gas Treatment
Biological treatment(filtration / scrubbing / trickling) Thermal oxidation Catalytic oxidation Gas engine / steam boiler
Purpose Biological degradation by micro-organisms
Oxidation with oxygen (air) byheating a gas stream above its auto-ignition point
Oxidation with oxygen (air), usingcatalyst to lower auto-ignition point
Incineration of waste gas to recoverenergy
Application Removal of low pollutantconcentrations soluble in water: NH3,amines, hydrocarbons, H2S, toluene,styrene, odour
Emissions from all VOC sources,most suitable for autothermal VOCconcentrations and final treatment forhazardous substances
Same application as thermalincineration, contaminants restrictedto non-poisonous onesWith or without heat recovery
Waste gas streams suitable for gasengine, downstream generator toproduce electricity (see Section3.5.2.4)
Application limits see Sections 3.5.2.1 to 3.5.2.3not suitable for changing contentNH3 can cause problemsfrost, rain high ambient temperaturesaffect the filter material
Flow rate: up to about 86000 Nm3/hTemperature range: 800-1000°C 980-1200 °C (hazardous substances)VOC: <25 % LEL
Flow rate: up to about 86000 Nm3/hTemperature range: 300-500 °CVOC: <25 % LEL
Relatively low combustiontemperaturelimitations from waste gas com-position when corrosive compoundsor precursors are included
Consumables Water (scrubbing and trickling water)Chemicals (nutrients, pH adjustment)Energy: <1 kWh/1000 Nm3
Pressure drop: 0.2-2 kPa
Fuel during start-up and non-autothermal conditionsEnergy: 3-8 kWh/1000 Nm3
Pressure drop: 1-5 kPa
Fuel during start-up and non-autothermal conditionsEnergy: 1-2 kWh/1000 Nm3
Pressure drop: 1-5 kPa
Coupled with steam boiler to producesteam
Cross-media effects Disposal of filter materialWaste water from scrubbing andbiotricklingEmission of odour from scrubbing andbiotrickling
CO and NOx in flue gasCl- and S-content require flue gastreatmentdioxins are usually no problem withoptimised conditions (see 3.5.2.4)
Very low NOx in flue gas (about15 mg/Nm3)Cl- and S-content require flue gastreatmentdioxins are usually no problem
Low combustion temperature withlow NOxCO in flue gas reduced by catalyst
Achievable performance[% pollutant removal]
VOC 75-99Inorganic 80-95 (all)Odour 70-95Details see Sections 3.5.2.1 to 3.5.2.3
VOC 95-99 VOC 90-99CO >98Odour 80-95
Achievable emission levels[mg/Nm3]
TOC 1-4
Table 4.10: continued

Chapter 4
Waste Water and Waste Gas Treatment 303
BAT for Combustion Exhaust Gas TreatmentBAT for dust removal is to• implement ESP or bag filter (after heat exchanger at 120-150 °C) or• implement catalytic filtration or• implement wet scrubbing
BAT for removal of HCl, HF and SO2 is to• recover them when feasible by using two-stage wet scrubbing, using in the first stage water
or acidic solution as scrubber medium in recycle mode to remove HF and HCl, using in thesecond stage calcium carbonate suspension to remove SO2 as calcium sulphate (after airinjection). Both HCl and calcium sulphate can be recovered as enriched raw hydrochloricacid and gypsum respectively. Two-stage wet scrubbing is also used without materialrecovery to separate chloride and fluoride ions before desulphurisation or
• remove them by dry or semi-dry or wet sorbent injection as described in Section 3.5.4.1, thegenerated dust being removed together with the incineration dust. Wet scrubbing, however,is normally the most efficient technique for abatement as well as for recovery.
There are more FGD techniques, mainly used in power plants, which are within the scope of theBREF on large combustion plants.
BAT for removal of NOx is to• implement SCR instead of SCNR (at least for larger installations) because it has better
removal efficiency and environmental performance (see Section 3.5.4.2). For existinginstallations which operate SNCR devices, the time to consider exchange might be whenmajor alterations are planned for the incineration plant. Although SCR is BAT in thegeneral sense, there are individual cases (typically smaller installations) where SNCR is thetechnically and economically best solution. Assessment needs to be made if other measuresachieve better overall improvement instead of retrofitting SNCR.
There are more DeNOx processes in use, e.g. several simultaneous removal techniques of SO2and NOx, which are also BAT when they achieve similar performance.
When dioxins can be expected it is BAT to• abate dioxins by using a GAC filter (adsorption) at the end of flue gas treatment.
Techniques that achieve comparable results (see Table 4.11) are also considered as BAT.
BAT-associated emission levels and reduction performance of combustion exhaust gastreatment are listed in Table 4.11.
Parameter Emission levels[mg/Nm3] 1
dust <5-15HCl <10HF <1SO2 <40-150 2
NOx (gas boilers/heaters) 20-150 3
NOx (liquid boilers/heaters) 55-300 3
NH3 4 <5 5
dioxins 0.1 ng/Nm3 TEQ1 ½ hourly average, reference oxygen content 3 %2 lower range for gaseous fuel, upper range for liquid fuel3 higher value for small installations, using SNCR4 NH3 slip with SCR5 value for new catalysts, but higher NH3 emissions occur as the catalyst ages
Table 4.11: BAT-associated Emission Levels and Performance Rates for Combustion Exhaust GasTreatment in the Chemical Sector


Chapter 5
Waste Water and Waste Gas Treatment 305
5 EMERGING TECHNIQUES
An emerging technique as understood in this document is a technique that has not yet beenapplied on a commercial basis or outside of pilot plant operation, but that can be expected to beapplicable in the future in larger scale-operations in the chemical sector.
The techniques shown below are already operated to a certain degree under specified conditionsin other sectors. There is no evidence yet that they have been successfully implemented in thechemical sector under existing working conditions, but they are expected to be so in the future.
BIOLOGICAL SULPHUR DIOXIDE REMOVAL FROM EXHAUST GAS
The biological sulphur dioxide removal system is a combination of a waste gas scrubber(absorber) and a biological waste water treatment facility. In the absorber, the waste gas streamcontaining sulphur dioxide is brought into contact with washing water. A mixture of sulphiteand sulphate is formed. In a subsequent anaerobic biological process, this mixture is convertedbiologically into sulphide. The ensuing aerobic step converts sulphide into elemental sulphur,which is separated, and the supernatant water recycled to the scrubber.
Because of the presence of sulphide ions, heavy metals are precipitated as sulphides and can beremoved as well.
LOW-TEMPERATURE NOX OXIDATION
The low-temperature NOx Oxidation is a combination of an oxidation process (ozone asoxidation agent) and gas scrubbing (with water or alkali as scrubbing liquid). Ozone (generatedon-site in a high-voltage system) reacts with NO and NO2 in a reactor duct to obtain highlysoluble N2O5, which is subsequently removed in a wet gas scrubber by formation of nitric acid.Very low emission levels of NOx, SOx and HCl are expected (5, 5-10 and 5-10 ppmrespectively).
The main environmental issues are the energy need for the ozone generation and, whennecessary, for the generation and/or storage of pure dry oxygen, and the need for an essentialamount of water as scrubbing liquid.


Chapter 6
Waste Water and Waste Gas Treatment 307
6 CONCLUDING REMARKS
This chapter covers:
• the timing of the work• sources and availability of information• extent of consensus within the TWG• recommendations for future work.
TIMING OF THE WORK
The work on this BREF took nearly 3 years, the major steps being:
• 12th-14th April 1999: first Technical Working Group (TWG) meeting in Sevilla.• May 2000: a first draft was sent to the TWG members for consultation, covering Chapters
1 – 3. It included- general basic information on waste water and waste gas- information on waste water and waste gas management- information on common treatment technology, including treatment performance dataTWG members delivered additional information during the consultation.
• March 2001: a second draft was sent to the TWG members for consultation, coveringChapters 1-5 plus Annexes. Because of the information received as comments from TWGconsultation on the first draft and further information sources, the chapters on generalinformation and on management were completely redrafted and additional data were addedto the chapter on treatment technology. A chapter on BAT conclusions was included basedon the information in the preceding three chapters.
• 27th-29th June 2001: second TWG meeting in SevillaA range of issues, mainly those relating to Chapter 4, BAT conclusions, was discussed indetail. Four split views were recorded, partly because one Member State had the impressionthat the BAT conclusions on management were too general and should be supported withfigures and partly because they wanted BAT-associated emission levels for heavy metalsand AOX at the final waste water discharge point, based on the information they hadprovided.
• August 2001: an excerpt of the redrafted document as the result of the second TWGmeeting was sent out to TWG members for final consultation.
• 15th-16th November 2001: the final draft document was presented to DG Environment at the10th Meeting of the IPPC BAT Information Exchange Forum (IEF) in Brussels.The IEF found that the document accurately reflected the exchange of information in theTWG and that it was in line with the BREF Outline and Guide. The document was acceptedby DG Environment with some editorial changes.
SOURCES OF INFORMATION AND AVAILABILITY OF INFORMATION
Several sources were used while writing the BREF. The main sources were textbooks,ULLMANN’s Encyclopedia of Industrial Chemistry and publications on special techniques.Further information was taken from the internet website of the US Environmental ProtectionAgency (EPA), providing technical data sheets on waste gas treatment techniques, includinginformation on costs, and the Environmental Technology Best Practice Programme, providinginformation on several waste water and waste gas control techniques.
Single Member States, European industry organisations (CEFIC and CONCAWE) and onechemical company supplied BAT documents, guidance notes, technical background materialand real-life performance data on various issues, which are quoted in the Reference list of thisdocument. Some manufacturers delivered information on their technology. Most of thedocuments were provided at very late stages of the work. The first and second documents on thechemical sector arrived in November / December 1999, others between the issuing of the firstdraft and a date one week before the second meeting.

Chapter 6
308 Waste Water and Waste Gas Treatment
EXTENT OF CONSENSUS
This BREF has met support from the majority of the TWG members, although on four BATconclusions split views were noted. One Member State expressed their opinion on the lack ofclose definitions for the BAT conclusions on environmental management and of BAT-associated emission levels for heavy metals and AOX at the final discharge point. Details arefound in Chapter 4.
RECOMMENDATION FOR FUTURE WORK
The main drawback in the information exchange was the lack of information on usefulperformance data in combination with operational data (such as energy consumption and use,use of auxiliary substances, cross-media effects). When, to name one example, the expert groupconcluded that emission levels for heavy metal control techniques, covering the whole chemicalsector, do not exist, because those levels depend strongly on the source process, no data weremade available that could support their view. Thus, the BREF cannot present achievableemission levels – or BAT-associated emission levels – for heavy metal control techniques.
There is a notable lack of information on cost data. Since the chemical industry (exceptCONCAWE) did not deliver any data, the BREF resorted to the existing sources, mainly theUS-EPA data sheets, the Dutch paper on BAT for waste gas treatment and the VITO databaseon waste water techniques, still leaving big gaps. Thus, no sufficiently qualified, reliable andcomparable cost data have yet been made available. It was generally not known what exactlywas included within the cost data from the named sources and how the calculation wasperformed. The relative cost data (per m3 waste water, per 1000 Nm3 waste gas or per mass unitpollutant) presented in this BREF, therefore, are to be seen as indicators of magnitude and notas exact figures. The relatively few cost data in the BREF are delivered as they were received,i.e. national currencies are not converted into Euros. It is suggested to leave it to the BREF oneconomics and cross-media effects to make a decision on a conversion system for cost data. Tofill and correct this gap will be a task for future work.
The obvious recommendation for future work is therefore to fill all the gaps still existing withinthe present BREF. Issues that will merit fuller consideration when this document is reviewedinclude:
• focus on technical performance, not just on performance rates and emission levels, givingmore attention to cross-media and energy issues and providing the necessary data
• examples of real-life treatment systems in the context of the joint operation of the varioustechniques on chemical sites, providing the necessary data and rationale for the operator’sdecision, not just a list of the existing treatment plants or statements using “good” figures asexamples for management decisions without a proper, understandable rationale orexplanation
• selected examples of good engineering practice should be given as a demonstration of whatis behind terms such as ‘good manufacturing practice’, ‘adequate safety issues’ or ‘riskassessment’
• focus on the main objective of the BREF process, i.e. to support and give guidance to aregulator reaching a decision on a permit, not providing her/him only with a list oftechniques (‘shopping list’) or trying to steer her/him towards a decision. Taking intoaccount the preceeding three bullets might be helpful
• a more consistent approach to measurement of total nitrogen would assist comparison andconclusions in this respect. In this work data was primarily available for total inorganicnitrogen which is not a universally accepted parameter.
The EC is launching and supporting, through its RTD programmes, a series of projects dealingwith clean technologies, emerging effluent treatment and recycling technologies andmanagement strategies. Potentially these projects could provide a useful contribution to futureBREF reviews. Readers are therefore invited to inform the EIPPCB of any research resultswhich are relevant to the scope of this document (see also the preface of this document).

Chapter 6
Waste Water and Waste Gas Treatment 309
As to reviewing the BREF, the recommendation is to wait until all the vertical BREFs in thechemical sector are finalised. This will ensure that all the necessary information for thehorizontal BREF has been collected before the review process starts. This does not mean,however, that it would be sufficient to give the same input to the Common Waste Water andWaste Gas BREF as to the vertical BREFs and simply repeat the results. To do that would callinto serious question the need for a horizontal waste water / waste gas BREF.

References
Waste Water and Waste Gas Treatment 311
REFERENCES
[cww/tm/4]Metcalf & Eddy, Inc.,Waste Water Engineering – Treatment, Disposal, and Reuse,3rd edition, revised by Tchobanoglous, Burton,McGraw-Hill, New York, 1991
[cww/tm/26]Betz Handbook of Industrial Water Conditioning9th edition, Betz Laboratories, Inc., Trevose, 1991
[cww/tm/27]Environment Agency (UK), HMSO, 1997Technical Guidance Note A4,Effluent Treatment Techniques
[cww/tm/46]Bundesministerium für Umwelt, Jugend und Familie, Wien 1994Braun et al.Biologische Abluftreinigung in ÖsterreichStand und Zukunft biologischer Verfahren in der Abluftreinigung
[cww/tm/48]CONCAWE, May 1999Document No. 99/01,Best Available Techniques to reduce Emissions from Refineries
[cww/tm/50]Fonds der Chemischen Industrie, Frankfurt/M. 1995Umweltbereich LuftTextheft 22
[cww/tm/51]RIZA (NL), 1990Inventory of Treatment Techniques for Industrial Waste Water
[cww/tm/53]VDI, Düsseldorf 1996VDI 3478Biological Waste Gas PurificationBioscrubbers and Trickle Bed Reactors
[cww/tm/64]BASF, July 1999Verfahrenstechniken der Abgas-/Abluftbehandlung
[cww/tm/67]VDI-Gesellschaft Verfahrenstechnik und Chemie-ingenieurwesen, 19994. GVC-Abwasser-Kongress 1999, Preprints[a] Rosenwinkel et al., Membranverfahren in der industriellen Abwasserbehandlung, p 183 etseq[b] Neumann et al., Einsatz der BAYER-Hochleistungs-Flotationstechnik als zusätzlicheVerfahrensstufe der Klärtechnik, p 327 et seq[c] John et al., Weiterentwicklung vertikal durchströmter Nachklärbecken, p 483 et seq[d] Biener et al., Systematische Reduktion des Wasserverbrauchs und des Abwasseranfalls, p 71et seq

References
312 Waste Water and Waste Gas Treatment
[cww/tm/70]Tauw, Feb 2000InfoMil,Dutch Notes on Waste Gas Treatment
[cww/tm/71]ENTEC UK Ltd., 1996Environmental Technology Best Practice Programme, Guide GG12,Solvent Capture for Recovery and Re-use from Solvent-laden Gas Streams
[cww/tm/72]CEFIC, Dec 1999IPPC BAT Reference Document. Waste Water/Waste Gas Treatment. Chemical IndustryContribution Paper on Waste Water/Waste Gas Management
[cww/tm/74]Environmental Processes ’98, Hydrocarbon Processing 71-118,Aug 1998
[cww/tm/75]Paques Bio Systems B.V., Apr 1997,Jansen, Buisman,Biological SO2 Removal from Flue Gas
[cww/tm/76]European Lime Association, 1999Lime and Dolomite Products for the Treatment of Drinking Water, Waste Water andSewage Sludge
[cww/tm/77]Naval Facilities Engineering Service Center (USA), June 1998Joint Service Pollution Prevention Technical Library,http://enviro.nfesc.navy.mil/p2library
[cww/tm/78]Verfahrenstechnik, Mar 1999Kaiser, Lehner,Dampf- und Luftstrippung zur Rückgewinnung von Ammoniak aus Abwasser
[cww/tm/79]Environment Agency (UK), Apr 1994Technical Guidance Note A3,Pollution Abatement Technology for Particulate and Trace Gas Removal
[cww/tm/80]Environment Agency (UK), Febr 1994Technical Guidance Note A2,Pollution Abatement Technology for the Reduction of Solvent Vapour Emissions
[cww/tm/81]P. Kunz,Behandlung von Abwasser,Vogel Verlag, Würzburg, 2nd Edition 1990
[cww/tm/82]Bundesministerium für Umwelt, Naturschutz und Reaktorsicherheit / LAWA, Germany 2000Hinweise und Erläuterungen zu Anhang 22 der Abwasserverordnung

References
Waste Water and Waste Gas Treatment 313
[cww/tm/83]European Water Pollution Control, Vol 7, 1, 1997Meyer, Hanke,Reduction of Nitrogen and Phosphorous Discharges from Bayer’s Dormagen ProductionSite
[cww/tm/84]InfoMil, Feb 2000Dutch Notes on BAT for the Large Volume Organic Chemicals Industry
[cww/tm/85]W.L. GORE & Ass., 1999Plinke et al.,Catalytic Filtration – Dioxin Destruction in a Filter Bag,unpublished
[cww/tm/86]Linnhoff et al., Aug 1998Intelligent Networking of Process Waste Water Streams in the Chemical Industryhttp://www.linnhoffmarch.com/Resources/Pinch.html
[cww/tm/87]DVWK Regeln 134/1997,Technische Regel wassergefährdender Stoffe (TRwS) Abwasseranlagen als Auffangvor-richtungen
[cww/tm/88]Council Directive 1999/13/EC,11.3.1999
[cww/tm/89]US-EPA, 1995AP-42 Emission Estimating Handbook, section 7.1 Storage of Organic Liquidshttp://www.epa.gov./ttn/chief/ap42.html
[cww/tm/90]US-EPA OAQPS, Dec 1999TANKS 4.06 for Windowshttp://www.epa.gov/ttnchie1/tanks.html
[cww/tm/91]Nalco Chemical Company,The NALCO Water Handbook,2nd Edition, McGraw-Hill, New York, 1988
[cww/tm/92]ENTEC UK Ltd., 1996Environmental Technology Best Practice Programme, Guide GG37,Cost-effective Separation Technologies for Minimising Wastes and Effluents
[cww/tm/93]ENTEC UK Ltd., 1997Environmental Technology Best Practice Programme, Guide GG54,Cost-effective Membrane Technologies for Minimising Wastes and Effluents

References
314 Waste Water and Waste Gas Treatment
[cww/tm/94]Environment Agency (UK), Nov 1993Technical Guidance Note A1,Guidance on Effective Flaring in the Gas, Petroleum, Petrochemical and AssociatedIndustries
[cww/tm/95]Environmental Protection Agency (Ireland), May 1996Integrated Pollution Control LicensingBATNEEC Guidance Note for the Chemical Sector
[cww/tm/96]North Ostrobothnia Regional Environment Centre, June 2000Examples of Waste Water and Waste Gas Treatment in the Chemical Industry in Finland
[cww/tm/97]DHV Water BV, Febr 1996Giesen, van der Molen,The Crystalactor®: Waste Water Treatment by Crystallisation without Waste Production
[cww/tm/100]Biothane Systems International, 2000Biological Waste Water Treatment: KoSa Netherlands BV
[cww/tm/101]Paques BV, Netherlands, Oct 1991Buisman, Biological Zinc and Sulphate Removal from Waste Water
[cww/tm/102]1996 EPD Proceedings, 1996de Vegt, BuismanSulphur Compounds and Heavy Metal Removal Using Bioprocess Technology
[cww/tm/105]BAYER AG, April 2000Waste Water Treatment Plants of BAYER
[cww/tm/106]EPA-CICA Fact Sheet, US-EPA April 2000Air Pollution Technology Fact SheetHigh Efficiency Particle Air (HEPA) Filter, Ultra Low Penetration Air (ULPA) Filter
[cww/tm/107]EPA-CICA Fact Sheet, US-EPA Dec 1999Air Pollution Technology Fact SheetCyclones
[cww/tm/108]EPA-CICA Fact Sheet, US-EPA Dec 1999Air Pollution Technology Fact SheetSettling Chambers
[cww/tm/110]EPA-CICA Fact Sheet, US-EPA July 1999Air Pollution Technology Fact SheetFibre Bed Scrubber

References
Waste Water and Waste Gas Treatment 315
[cww/tm/111]EPA-CICA Fact Sheet, US-EPA April 2000Air Pollution Technology Fact SheetImpingement-Plate / Tray-Tower Scrubber
[cww/tm/112]EPA-CICA Fact Sheet, US-EPA July 1999Air Pollution Technology Fact SheetOrifice Scrubber
[cww/tm/113]EPA-CICA Fact Sheet, US-EPA April 2000Air Pollution Technology Fact SheetPacked-Bed / Packed-Tower Wet Scrubber
[cww/tm/114]EPA-CICA Fact Sheet, US-EPA April 2000Air Pollution Technology Fact SheetSpray-Chamber / Spray-Tower Wet Scrubber
[cww/tm/115]EPA-CICA Fact Sheet, US-EPA July 1999Air Pollution Technology Fact SheetVenturi Scrubber
[cww/tm/116]EPA-CICA Fact Sheet, US-EPA June 1999Air Pollution Technology Fact SheetCatalytic Incinerator
[cww/tm/117]EPA-CICA Fact Sheet, US-EPA June 1999Air Pollution Technology Fact SheetFlare
[cww/tm/118]EPA-CICA Fact Sheet, US-EPA June 1999Air Pollution Technology Fact SheetIncinerator – Recuperative Type
[cww/tm/119]EPA-CICA Fact Sheet, US-EPA June 1999Air Pollution Technology Fact SheetRegenerative Incinerator
[cww/tm/120]EPA-CICA Fact Sheet, US-EPA June 1999Air Pollution Technology Fact SheetThermal Incinerator
[cww/tm/121]EPA-CICA Fact Sheet, US-EPA April 2000Air Pollution Technology Fact SheetFabric Filter – Mechanical Shaker Cleaned Type, Mechanical Shaker Cleaned Type withSonic Horn Enhancement

References
316 Waste Water and Waste Gas Treatment
[cww/tm/122]EPA-CICA Fact Sheet, US-EPA April 2000Air Pollution Technology Fact SheetFabric Filter – Pulse-Jet Cleaned Type
[cww/tm/123]EPA-CICA Fact Sheet, US-EPA April 2000Air Pollution Technology Fact SheetFabric Filter – Reverse-Air Cleaned Type, Reverse-Air Cleaned Type with Sonic HornEnhancement, Reverse-Jet Cleaned Type
[cww/tm/124]EPA-CICA Fact Sheet, US-EPA May 1999Air Pollution Technology Fact SheetDry Electrostatic Precipitator (ESP) – Wire-Pipe Type
[cww/tm/125]EPA-CICA Fact Sheet, US-EPA May 1999Air Pollution Technology Fact SheetDry Electrostatic Precipitator (ESP) – Wire-Plate Type
[cww/tm/126]EPA-CICA Fact Sheet, US-EPA May 1999Air Pollution Technology Fact SheetWet Electrostatic Precipitator (ESP) – Wire-Pipe Type
[cww/tm/127]EPA-CICA Fact Sheet, US-EPA May 1999Air Pollution Technology Fact SheetWet Electrostatic Precipitator (ESP) – Wire-Plate Type
[cww/tm/128]VITO (Belgium), Aug 2000SLSS Techniekbladen
[cww/tm/129]BetzDearborn, Jan 1993Hartung,Applying Quality Methods to Waste Water TreatmentTAPPI Journal, 1993
[cww/tm/130]UBA (Berlin), Mai 2000Draft OSPAR Background Document Concerning the Elaboration of Programmes andMeasures Relating to Whole Effluent Assessment
[cww/tm/131]Ministry of Housing, Spatial Planning and the Environment, the Netherlands, Sept 1999Dutch Notes on BAT for Mineral Oil Refineries
[cww/tm/132]Ullmann’s Encyclopedia of Industrial Chemistry6th edition, Electronic ReleaseWiley-VCH Verlag, Weinheim, Germany 2000

References
Waste Water and Waste Gas Treatment 317
[cww/tm/133]UBA (Wien)Formaldehyde
[cww/tm/135]US-EPA, Clean Air Technology Center, May 1999Choosing an Adsorption System for VOC: Carbon, Zeolite or Polymers
[cww/tm/137]US-EPA, Clean Air Technology Center, Nov. 1999Technical Bulletin: Nitrogen Oxides (NOx), Why and How they are Controlled
[cww/tm/138]US-EPA, Control Technology Center, April 1995Control and Pollution Prevention Options for Ammonia Emissions
[cww/tm/143]US-EPAAP-42, 5th edition, Volume I, 1995Chapter 13.5 Industrial Flares
[cww/tm/146]Sackewitz, Umwelt 29 (1999) Nr. 4, pp 16 - 18Luftstrippverfahren zur TeilstrombehandlungBetriebserfahrungen auf den Kläranlagen Göttingen und Cuxhaven
[cww/tm/147]SEPA (Scotland), Environment Agency (England, Wales)Pollution Prevention Guidelines 18Managing Fire Water and Major Spillages
[cww/tm/148]SEPA (Scotland), Environment Agency (England, Wales)Pollution Prevention Guidelines 21Pollution Incident Response Planning
[cww/tm/149]UBA (WIEN), 2000Ecker, WinterStand der Technik bei Raffinerien im Hinblick auf die IPPC RichtlinieMonographien Band 119
[cww/tm/150]US-EPA, ICAC,Control Technology InformationBrief Descriptions of Air Pollution Control Technologieshttp://www.epa.gov/earth1r6/6pd/air/pd-1/noxcont.htm
[cww/tm/151]UmweltMagazin, Mai 2000, pp 48Karl,Neue Festbettbiologie reinigt schwierige Abwässer
[cww/tm/152]US-EPAProtocol for Equipment Leak Emission Estimateshttp://www.epa.gov/ncepihom/Catalog/EPA453R95017.html

References
318 Waste Water and Waste Gas Treatment
[cww/tm/153]World Oil Magazine August 2000, Vol. 221, No. 8Successful Field Trials Lead to Enclosed Burner Applicationhttp://www.worldoil.com/magazine/MAGAZINE_DETAIL.asp?ART_ID=1255&MONTH_YEAR=Aug-00
[cww/tm/154]IMPEL Network, December 2000Diffuse VOC Emissionshttp://europa.eu.int/comm/environment/impel/vocemissions.htm
[cww/tm/155]The European Parliament and the Council, 4th December 2000Directive 2000/76/EC on the Incineration of Waste
[cww/tm/156]Infomil, December 1999Dutch Notes on BAT for the Production of Nitric Acid
[cww/tm/157]Infomil/ADEME, March 2001NOXCONF 2001International Conference: Industrial Atmospheric PollutionNOx and N2O emission control: panel of available techniquesParis la Défense, 21st and 22nd March 2001[a] Gry, Session 8, Chemical Industry Program to reduce NOx emissions of HNO3 plants with selective catalytic reduction
[cww/tm/158]CEFIC, November 2000IPPC BAT Reference DocumentMonitoring of EmissionsChemical Industry Contribution PaperDefinitions
[cww/tm/159]Berlin 1999ATV Handbuch Industrieabwasser4th edition
[cww/tm/160]German Information
[cww/tm/161]Kluwer Academic Publishers 1994Mulder, M.Energy Requirements in Membrane Separation Processesin: Crespo, Böddeker (ed.): Membrane Processes in Separation and Purification
[cww/tm/162]UBA Berlin, 20.10.2000Classification of Toxicity, Whole Effluent Assessment (WEA) and Toxicity Test
[cww/tm/163]INERIS, 2001The Membrane Bioreactor

References
Waste Water and Waste Gas Treatment 319
[cww/tm/164]INERIS, 2001The Biofilter for Industrial Waste Water Treatment
[cww/tm/165]UBA Berlin, 1999K. Diehl, U. Hagendorf, J. HahnCompilation of Biotest Data (English Summary)
[cww/tm/166]Verband der Chemischen Industrie e.V., May 2000Erklärung des Verbandes der Chemischen Industrie“Handlungsziele für die Abwässer der chemischen Industrie”
[cww/tm/167]CEN as Member of TWG on Monitoring, version July 1999List of CEN Standards Available for the Monitoring of the Emissions of Industrial Plantsunder the IPPC Directive
[cww/tm/168]Parftec Limited, Wolverhampton (UK) 1999The KN-Filter – An All-metal Cake Filtration System for the More Arduous GaseousEmission Control Application


Annexes
Waste Water and Waste Gas Treatment 321
7 ANNEXES
The Annexes supplement the information provided in the document. They are:
Annex I Joint Operation of Industrial and Municipal WWTPAnnex II Pinch Technology as Example of EFMAAnnex III Monitoring of a Central Biological WWTPAnnex IV Monitoring StandardsAnnex V Pollution Incident Response PlanAnnex VI Examples of Waste Water Treatment and Waste Gas TreatmentAnnex VII Legislation Applied to Waste Water and Waste Gas in the Chemical Sector
7.1 Annex I. Joint Operation of Industrial and MunicipalWWTP
Conditions of Joint Treatment of Municipal and Industrial Waste Water (Example fromFrance)
The general case in the chemical industry in France is that effluents are treated on-site. Jointmunicipal and industrial waste water treatment, however, is sometimes encountered, e.g. inbiochemical productions (such as vitamins or antibiotics via biochemical pathways), and informulation and conditioning activities for which the flow rate and the load of the effluentremain manageable by a municipal treatment plant. In this case, a study of the impact ofindustrial streams on the municipal treatment plant (impact on operation and sludge disposal) isdone and an “industrial release agreement” is signed between industry and the local waste watermanagement authority.
A Municipal Decree is issued that generally contains the following main provisions of theagreement:• pH of the effluent comprised between 5.5 and 8.5 (eventually 9.5)• temperature of the effluent <30°C• effluent not containing substances hazardous to the personnel of the municipal WWTP, the
collecting network, the WWTP itself and its operation, the environment downstream of theWWTP and the further handling of the waste water sludge
• either maximum flows and pollution loads to be discharged (BOD, COD, TSS, totalKjeldahl-N, (NO2+NO3)-N, non-biodegradable N, nitrification inhibitors, total P, othersubstances that might impact on the operation of the WWTP and the further handling ofsludge) or provisions concerning pretreatment / recovery installations to be operated by theindustrial site prior to discharge in the municipal sewer
• financial conditions
The discharge convention further describes the technical conditions of the discharge agreementfixed by the municipal decree. These generally include the following:• provisions concerning the private network of the industrial site, in order to prevent
unwanted discharge to the public network• description of any private pretreatment facilities that have to be operated in order to handle
properly flow variations, start-up / shut down of the plant, have to be monitored (monitoringresults to be sent to the municipal authority)
• technical conditions for the connections between private and public networks• various obligations of the industrial site, such as:

Annexes
322 Waste Water and Waste Gas Treatment
- no dilution of the effluent- exceptionally high discharges (e.g. in case of maintenance) have to be smoothed over
24 hours- effluents need to be monitored, connections periodically inspected. The local authority
can monitor the effluent on their own initiative and check the monitoring equipment incooperation with the industrial operator.
- water consumption is monitored and the results sent to the local authorities- action plan for an emergency (e.g. the closure of connections between municipal
sewage system and industrial site)• the obligations of the local authority are:
- to accept the discharge when it is within the limits fixed in the agreement- to inform the industrial site in the case of operational problems at the municipal WWTP
• economic and administrative questions
Example of Cooperation Between Municipal and Industrial WWTP with PositiveSynergetic Effect (Germany)
In Section 1.3.2.1, it was mentioned that there are normally neither advantages nordisadvantages with the joint treatment of industrial and municipal waste water. An examplewhere this is not the case is described briefly here.
In the past, two WWTPs – one a municipal and the other a chemical industry plant – eachoperating a central biological treatment, had separate discharge points into a small receivingriver. They now operate jointly in the following manner:
• nitrogen-rich and poorly degradable filtrate from sludge treatment devices of the municipalWWTP is treated in the industrial WWTP, which has micro-organisms adapted to cope withthis kind of waste water
• in return, the industrial WWTP sends an equal amount of waste water to the municipalWWTP
Figure 7.1 and Figure 7.2 show, respectively, the processes before and after the move to jointoperation.
This cooperation has economic and environmental advantages. The use of equipment on onlyone site saves capital and the mutual discharge reduces the nitrogen load (sum of ammonium,nitrite and nitrate) into the receiving river by 1000 kg per day, compared to the separateddischarges before.
7.2 Annex II. Example of EFMA: Pinch Technology
A widespread and well known EMFA tool is Pinch technology, used to optimise productionprocesses, save energy and water consumption and decrease the impact of waste discharge. Twoof those – the optimisation of water consumption and waste discharge – are within the scope ofthis BREF. Optimisation of production processes is covered by vertical BREFs and otherreferences [cww/tm/132].
Pinch Technology is a methodology for optimising the consumption of consumables inprocesses and on sites by introducing process integration techniques. It was primarily used as anenergy saving tool to improve thermal efficiency in the chemical and process industries.Recently this method has been transferred to water and waste (water) minimisation.

Annexes
Waste Water and Waste Gas Treatment 323
Buffer
I + IINeutrali-
sationAeration
IIntermediate
clarifierAeration
IIFinal
clarifierInfluent
Screen-ing
Gridremoval
Pre-clarifier Aeration Final
clarifierFloc
filtration
Sludgetreatment
Recirculationsludge
Recirculationsludge
Excess sludge
Slud
ge
Recirculation
Process water 1
Excess sludge
Pre-clarification sludge
Recirculation sludge
Municipal WWTP
Industrial WWTP
Figure 7.1: Cooperation Between an Industrial and a Municipal WWTP: Situation Before

Annexes
324 Waste Water and Waste Gas Treatment
Buffer
I + IINeutrali-
sationAeration
IIntermediate
clarifierAeration
IIFinal
clarifierInfluent
Screen-ing
Gridremoval
Pre-clarifier Aeration Final
clarifierFloc
filtration
Sludgetreatment
Recirculationsludge
Recirculationsludge
Excess sludge
Slud
ge
Recirculation
Process water 1
Process water 2
Excess sludge
Pre-clarification sludge
Recirculation sludge
Pretreated waste waterMunicipal WWTP
Industrial WWTP
Figure 7.2: Cooperation Between an Industrial and a Municipal WWTP: New Situation

Annexes
Waste Water and Waste Gas Treatment 325
Its concept is to define and find water saving potential by, e.g. piping and control changes, andto minimise waste water discharge by process modifications, thus enabling selective wastewater regeneration and reducing treatment costs. It is also used to design or re-design distributedeffluent treatment so as to lower capital costs by reducing the hydraulic load of a centralWWTP.
Its application can be broken down into four steps [cww/tm/86]:
Step 1:Drawing a flowsheet of the entire water system (supply, discharge) that shows all places wherewater is used, and all points where waste water is generated.Developing a water balance accurate to within 10 % of the amounts of the larger streams.Defining the appropriate data for the analysis by determining water sources and water sinks.
A profile is presented in Figure 7.3 [cww/tm/86].
Figure 7.3: Pinch Technology – Analysis, Source and Sink Curves
Step 2:• Selecting key contaminants or properties that prevent the direct re-use of the respective
waste water stream• Choosing design concentrations – maximum allowable for sinks, and minimum practical for
sources.
Step 3:• Developing the multi-dimensional pinch analysis to determine optimum matches between
sources and sinks. Appropriate software is available for this. The procedure includesidentification of pinches and a consideration of process modifications and regenerationoptions resulting in lower targets.
Step 4:• Repetition of step 3 until a practical design has evolved.

Annexes
326 Waste Water and Waste Gas Treatment
The application of Pinch Technology has succeeded in waste water savings of up to 60 %[cww/tm/86]. Performance examples for waste water flow reduction are:
• Chemicals and Fibres 25 %• Chemicals 40 %• Oil Refining 20–30 %• Coal Chemicals 50 %• Polymers 60 %
An example of water conservation strategy is given in Figure 7.4 [cww/tm/86]
Figure 7.4: Example of Water Conservation Strategy before and after Pinch Analysis
Cost savings are not normally restricted to the water saving costs. They can be significant ifwaste water reduction leads to the construction of a smaller central WWTP, makes expansion ofthe existing waste water treatment facilities unnecessary or allows the expansion of productionunit capacity without hydraulically overloading the existing central WWTP. Processmodification and selective water regeneration can result in product recovery, which can beeconomically profitable as well.
The major applications for Pinch Technology [cww/tm/86] are:
• to avoid production cutbacks under limited water supply conditios• to reduce water supply costs• to reduce capital costs of new water supply facilities (e.g. new wells or pipelines)• to reduce capital costs of water treatment facilities• to reduce waste water treatment costs• to reduce sewage charges• to reduce capital costs of expanding on-site waste water treatment facilities to meet
increased production loads or more stringent emission regulations• to help comply with environmental regulations.

Annexes
Waste Water and Waste Gas Treatment 327
7.3 Annex III. Monitoring of a Central Biological WWTP
Proper operation of a biological WWTP requires constant surveillance and the targetedadjustment of various process parameters. Monitoring of the relevant parameters can beaccomplished by on-line measurements that facilitate direct intervention and control, oranalytical results derived from waste water samples, which reflect longer-term trends and arealso essential for monitoring and documentation purposes. Both the needs with respect to on-line measurements and analyses applicable to the various process stages associated with aWWTP are provided in Table 7.1. Specific requirements may vary in individual cases[cww/tm/132].
Parameter Influent Neutrali-sation
Preclari-fication
Bufferinfluent
to biologyBiology Effluent
Sludgetreat-ment
Analyses from on-line measurementswaste water flow c c
pH c c c c c c ctemperature c c
bacteria toxicity cTOC c c c
nitrogen c c cphosphorous c c c
total solids [g/l] cdissolved oxygen c c
Analyses from random samplestotal solids [g/l] i i isettling volume i i i
Analyses from average samplesTOC i i iCOD i i iBOD i i i
AOX / EOX i i itotal nitrogen i i i
NH4-N i i iNO3-N i i i
total phosphorus i i iPO4-P i i i
individual substances i i ic: continuously onlinei: inhalatory samples
Table 7.1: Monitoring of a WWTP

Annexes
328 Waste Water and Waste Gas Treatment
7.4 Annex IV. Monitoring Standards
The followings lists (version July 1999) give the available CEN standards of analyticalparameters for emission monitoring in the domains air, water, sludge and sediment. CENstandards are adopted in all EU Member States [cww/tm/167].
The table lists either the standards ratified by CEN (EN number and date of ratification) or thedrafts under public enquiry or vote (ISO or prEN number). When neither is given it signifiesthat work is still in progress.
Standards for water, sludge and sediment
Parameter Domain Standards ratified byCEN
Drafts under publicenquiry or vote
Surrogate, sum and group parametersAOX water EN 1485: 1996BOD water EN 1899: 1998Suspended solids water EN 872: 1996TOC water EN 1484: 1997Complexing agents waterHydrocarbon oil index water ISO DISOxygen consumption water, sludge EN ISO 8192: 1995PAH waterPhenol index by flowanalysis water, sludge prEN 14402
Permanganate value water EN ISO 8467: 1995Anionic surfactants water EN 903: 1993Activated sludgesimulation test water EN ISO 11733: 1998
Inherentbiodegradability water EN ISO 9887: 1994
Methylene blue index byflow analysis water
Inhibition of nitrification water EN ISO 9509: 1995Sulphite reducingClostridia water EN 26461: 1993
Ultimatebiodegradability(released CO2)
water EN 29439: 1993
Ultimatebiodegradability (ZahnWellens)
water EN 29888: 1993
Ultimatebiodegradability (closedrespirometer)
water EN 29408: 1993
Ultimatebiodegradability (DOCmeasurement)
water EN ISO 7827: 1995
Ultimatebiodegradability (lowsoluble substances)
water EN ISO 10634: 1995
Ultimatebiodegradability (biogasproduction)
water EN ISO 11734: 1998
Ultimatebiodegradability (BODmeasurement)
water EN ISO 10707: 1997
Alkalinity water EN ISO 9963: 1995Colour water EN ISO 7887: 1994Electrical conductivity water EN ISO 7888: 1993Odour, flavour water EN 1622: 1997Turbidity water EN 27027: 1999
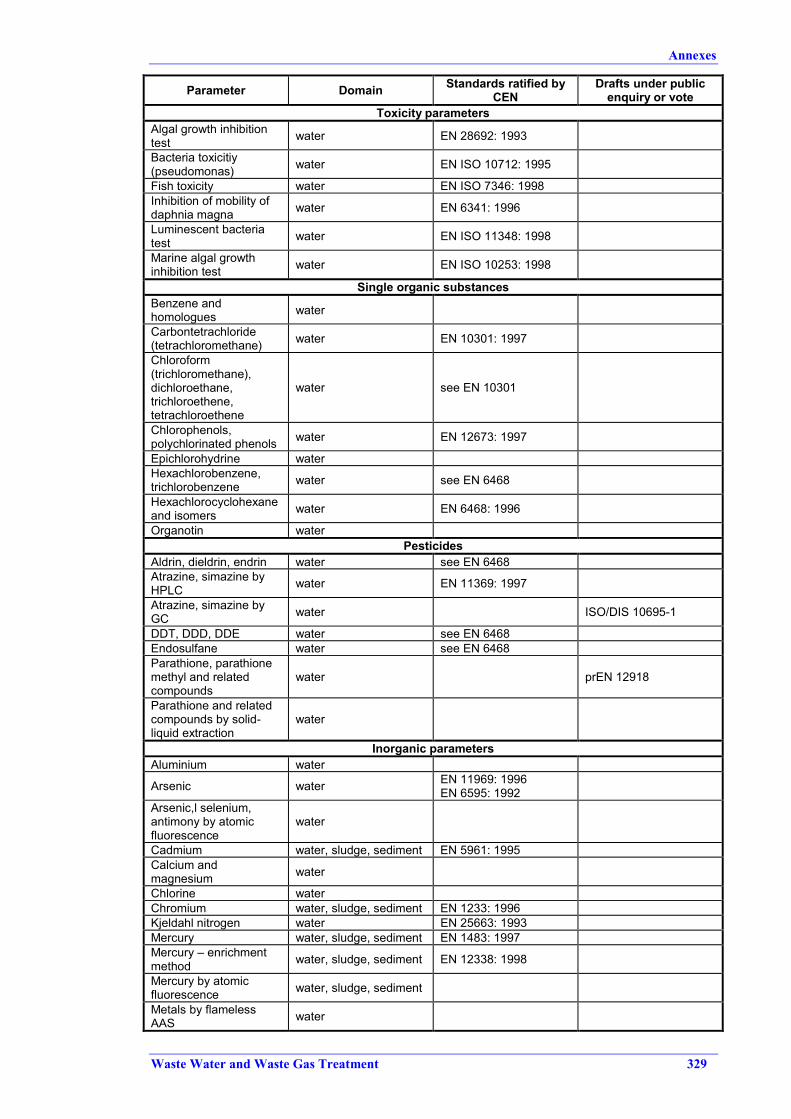
Annexes
Waste Water and Waste Gas Treatment 329
Parameter Domain Standards ratified byCEN
Drafts under publicenquiry or vote
Toxicity parametersAlgal growth inhibitiontest water EN 28692: 1993
Bacteria toxicitiy(pseudomonas) water EN ISO 10712: 1995
Fish toxicity water EN ISO 7346: 1998Inhibition of mobility ofdaphnia magna water EN 6341: 1996
Luminescent bacteriatest water EN ISO 11348: 1998
Marine algal growthinhibition test water EN ISO 10253: 1998
Single organic substancesBenzene andhomologues water
Carbontetrachloride(tetrachloromethane) water EN 10301: 1997
Chloroform(trichloromethane),dichloroethane,trichloroethene,tetrachloroethene
water see EN 10301
Chlorophenols,polychlorinated phenols water EN 12673: 1997
Epichlorohydrine waterHexachlorobenzene,trichlorobenzene water see EN 6468
Hexachlorocyclohexaneand isomers water EN 6468: 1996
Organotin waterPesticides
Aldrin, dieldrin, endrin water see EN 6468Atrazine, simazine byHPLC water EN 11369: 1997
Atrazine, simazine byGC water ISO/DIS 10695-1
DDT, DDD, DDE water see EN 6468Endosulfane water see EN 6468Parathione, parathionemethyl and relatedcompounds
water prEN 12918
Parathione and relatedcompounds by solid-liquid extraction
water
Inorganic parametersAluminium water
Arsenic water EN 11969: 1996EN 6595: 1992
Arsenic,l selenium,antimony by atomicfluorescence
water
Cadmium water, sludge, sediment EN 5961: 1995Calcium andmagnesium water
Chlorine waterChromium water, sludge, sediment EN 1233: 1996Kjeldahl nitrogen water EN 25663: 1993Mercury water, sludge, sediment EN 1483: 1997Mercury – enrichmentmethod water, sludge, sediment EN 12338: 1998
Mercury by atomicfluorescence water, sludge, sediment
Metals by flamelessAAS water

Annexes
330 Waste Water and Waste Gas Treatment
Parameter Domain Standards ratified byCEN
Drafts under publicenquiry or vote
Thallium by AAS waterTotal nitrogen,instrumental method water ENV 12260: 1996
33 elements by ICP-OES water, sludge, sediment EN ISO 11885: 1997
Inorganic parameters, cationicAmmonium by flowanalysis water EN ISO 11732: 1997
Cations by IC water, sludge UAP 1998Inorganic parameters, anionic
Bromate by IC waterChloride by flowanalysis water
Cyanide by flowanalysis water, sludge prEN 14403
Dissolved anions by IC waterEN ISO 10304-1: 1995EN ISO 10304-2: 1996EN ISO 10304-3: 1997
prEN 10304-4
Nitrite water EN 26777: 1993Nitrite and nitrate byflow analysis water EN ISO 13395: 1996
Phosphate by flowanalysis water
Phosphorous water EN 1189: 1996Silicate by flow analysis water
Water quality parameters
Dissolved oxygen water EN 25813: 1992EN 25814: 1992
Standards for emission to the atmosphere and ambient air
Parameter Domain Standards ratified byCEN
Drafts under publicenquiry or vote
Air from soil air emissionBenzene ambient airCarbon monoxide (CO) ambient airCarbon monoxide (CO)Concentration in stack air emission
Diffusive samplersRequirements and testmethods
ambient air prEN 13538-1
Diffusive samplersSpecific requirementstest methods
ambient air prEN 13538-2
Diffusive samplersGuide for selection, use,maintenance
ambient air
Dioxins and furansSampling air emission EN 1948-1: 1996
Dioxins and furansExtraction and clean-up air emission EN 1948-2: 1996
Dioxins and furansIdentification andquantification
air emission EN 1948-3: 1996
Dust, total, at lowconcentrationReference method
air emission prEN 13284-1
Dust, total, at lowconcentrationValidation of AMS
air emission
HCl, gaseousSampling and gaspretreatment
air emission EN 1911-1: 1997

Annexes
Waste Water and Waste Gas Treatment 331
Parameter Domain Standards ratified byCEN
Drafts under publicenquiry or vote
HCl, gaseousGaseous compoundabsorption
air emission EN 1911-2: 1997
HCl, gaseousSolution analysis andcalculation
air emission EN 1911-3: 1997
Fugitive/diffuseemissions air emission
Mercury ambient airMercury, totalReference method air emission prEN 13211-1
Mercury, totalValidation of AMS air emission
Metals – metaloids(except Hg – Sn) air emission
Metals – metaloidsPb – Cd – As – Ni ambient air
Nitrogen oxide (NO2) ambient airNitrogen oxides (NO-NO2)Concentration in stack
air emission
Odour by dynamicolfactometry air emission
Organic carbon,gaseous, total(FID) – lowconcentration
air emission prEN 12619
Organic carbon,gaseous, total(FID) – highconcentration
air emission prEN 13526
Organic carbon,gaseousIndividual compounds
air emission
Oxygen (O2)concentration in stack air emission
Ozone (O3) ambient airParticulate matter(<PM10) ambient air prEN 12341
Particulate matter(<PM2.5) ambient air
Quality assurance ofAMSPerformance andrequirements
air emission
Quality assurance ofAMSPeriodic validations
air emission
Quality assurance ofAMSOperation monitoring
air emission
Certification systems forAMS
air emission andambient air
Strategy/Quality ofemission measurement air emission
Sulphur dioxide (SO2) ambient airSulphur dioxide (SO2)Concentration in stack air emission
Water vapour(H2O vapour)Concentration in stack
air emission

Annexes
332 Waste Water and Waste Gas Treatment
7.5 Annex V. Pollution Incident Response Plan
An example of a Pollution Incident Response Plan [cww/tm/148], as mentioned in Section2.2.4.2, is detailed here. The information asked for is general, applicable to all sites. Specialproductions or site-specific features might require further information.
NAME AND ADDRESS OF COMPANY
NATURE OF BUSINESS
DATE OF PLAN REVIEW DATE
APPROVED BY DATE
ENVIRONMENTAL AUTHORITYFIRE AUTHORITYPOLICESEWAGE UNDERTAKINGWATER SUPPLIERLOCAL AUTHORITYOTHER
EMERGENCY SERVICESLOCAL POLICEMEDICAL SERVICEENVIRONMENTAL HOTLINEENVIRONMENTAL REGULATORLOCAL AUTHORITYSEWAGE UNDERTAKINGWATER SUPPLIERGAS SUPPLIERELECTRICITY SUPPLIERWASTE DISPOSAL CONTRACTORSPECIALIST ADVICESPECIALIST CLEAN-UP CONTRACTORS
COPIES TO
CONTACTPHONE
NUMBERSDURING
OFFICE ANDOUT OFOFFICEHOURS
MANAGING DIRECTORSITE MANAGERENVIRONMENTAL MANAGERFOREMANHEAD OFFICE CONTACT
COMPANYCONTACTS
(OUT OFHOURS)
SITE DRAINAGE PLAN
OIL, CHEMICAL AND PRODUCT INVENTORY
MAXIMUM QUANTITIES AT PEAK TIMES
TRADE NAME CHEMICAL LIQUID/GAS/POWDER CONTAINER SIZE MAXIMUM QUANTITY
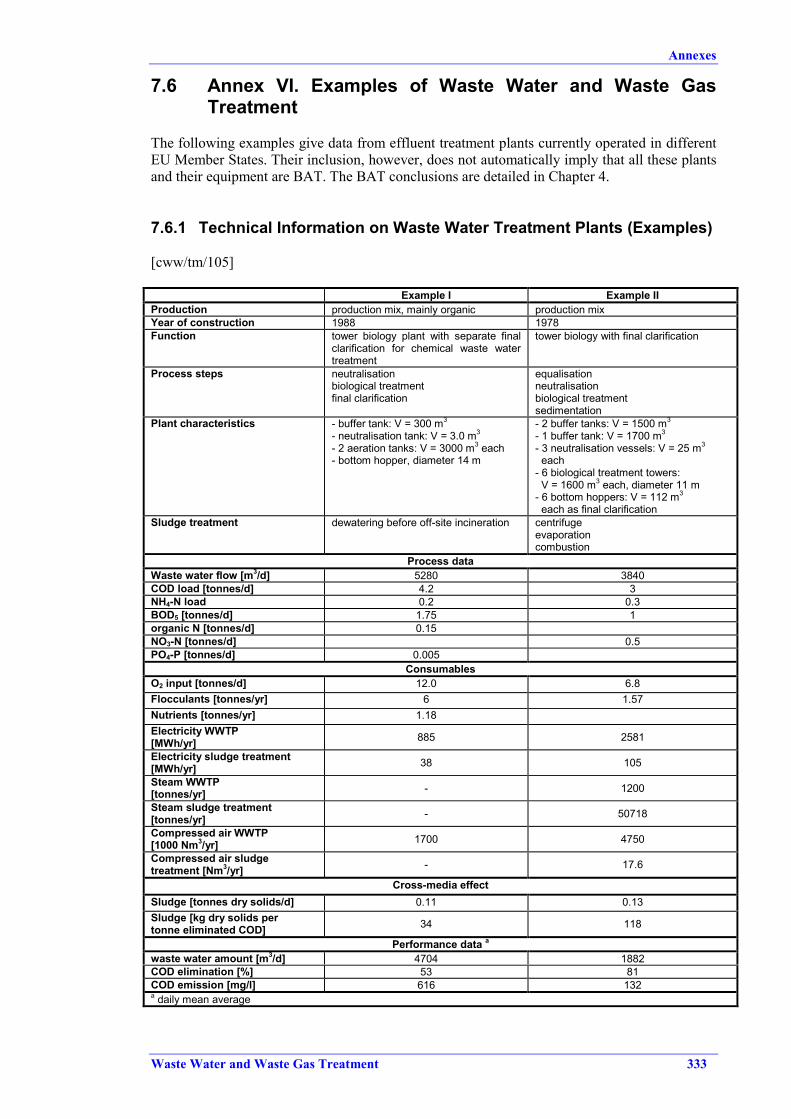
Annexes
Waste Water and Waste Gas Treatment 333
7.6 Annex VI. Examples of Waste Water and Waste GasTreatment
The following examples give data from effluent treatment plants currently operated in differentEU Member States. Their inclusion, however, does not automatically imply that all these plantsand their equipment are BAT. The BAT conclusions are detailed in Chapter 4.
7.6.1 Technical Information on Waste Water Treatment Plants (Examples)
[cww/tm/105]
Example I Example IIProduction production mix, mainly organic production mixYear of construction 1988 1978Function tower biology plant with separate final
clarification for chemical waste watertreatment
tower biology with final clarification
Process steps neutralisationbiological treatmentfinal clarification
equalisationneutralisationbiological treatmentsedimentation
Plant characteristics - buffer tank: V = 300 m3
- neutralisation tank: V = 3.0 m3
- 2 aeration tanks: V = 3000 m3 each- bottom hopper, diameter 14 m
- 2 buffer tanks: V = 1500 m3
- 1 buffer tank: V = 1700 m3
- 3 neutralisation vessels: V = 25 m3
each- 6 biological treatment towers: V = 1600 m3 each, diameter 11 m- 6 bottom hoppers: V = 112 m3
each as final clarificationSludge treatment dewatering before off-site incineration centrifuge
evaporationcombustion
Process dataWaste water flow [m3/d] 5280 3840COD load [tonnes/d] 4.2 3NH4-N load 0.2 0.3BOD5 [tonnes/d] 1.75 1organic N [tonnes/d] 0.15NO3-N [tonnes/d] 0.5PO4-P [tonnes/d] 0.005
ConsumablesO2 input [tonnes/d] 12.0 6.8Flocculants [tonnes/yr] 6 1.57Nutrients [tonnes/yr] 1.18Electricity WWTP[MWh/yr] 885 2581
Electricity sludge treatment[MWh/yr] 38 105
Steam WWTP[tonnes/yr] - 1200
Steam sludge treatment[tonnes/yr] - 50718
Compressed air WWTP[1000 Nm3/yr] 1700 4750
Compressed air sludgetreatment [Nm3/yr] - 17.6
Cross-media effectSludge [tonnes dry solids/d] 0.11 0.13Sludge [kg dry solids pertonne eliminated COD] 34 118
Performance data a
waste water amount [m3/d] 4704 1882COD elimination [%] 53 81COD emission [mg/l] 616 132a daily mean average

Annexes
334 Waste Water and Waste Gas Treatment
Example III Example IVProduction production mix: large volume and fine
chemicals, organic and inorganicYear of construction 1972-74, expansions 1979, 1981, 1985-6 1978, expansion 1994, 1999Function tower biology as high load and tank
biology as low load treatmenttower biology with final clarification
Process steps rake screenneutralisationpre-clarificationbuffering, equalisationpart denitrificationbiological stage 1 with intermediateclarificationbiological stage 2 with final clarificationflotationoff-gas treatmentsludge treatment
rake screenneutralisationpre-clarificationbuffering, equalisationbiological stage 1biological stage 2final clarificationsludge treatment
Plant characteristics - neutralisation: V = 628 m3
- 8 pre-clarifiers industrial: V = 480 m3
each- 2 pre-clarifiers municipal: V = 1950 m3
each- 3 buffer tanks: V = 10000 m3 each- 2 buffer tanks: V = 25000 m3 each- 1 buffer tank: V = 15000 m3
- 1 denitrification tank: V = 10000 m3
- 4 tower biology: V = 13000 m3 each- 4 intermediate clarifiers: V = 1000 m3
each- aeration basin 1: V = 11000 m3
- aeration basin 2: V = 25000 m3
- 6 bottom hoppers: each V = 1520 m3, diameter 18 m- 4 bottom hoppers: each V = 1520 m3, diameter 20 m- 3 secondary clarifiers- 2 flotation tanks: diameter 12 m
- neutralisation: V = 600 m3
- 1 buffer tank: V = 15600 m3
- 1 aeration tank: V = 5000 m3
- 1 aeration basin: V = 5500 m3
- 4 aeration basins: V = 2000 m3 each- 3 clarification basins: V = 3500 m3, diameter 40 m each
Sludge treatment thickenerlime- and iron conditioningmechanical dewatering with membranefilter pressessludge combustion
sludge thickener2 filter presses
Process data (industrial / municipal part)65000 / 65000 (dry weather)Waste water flow [m3/d] 65000 / 180000 (rainy weather) 18000
COD load [tonnes/d] 150 / 40 26NH4-N load 3 / 2.5 0.6BOD5 [tonnes/d] 80 / 20 8organic N [tonnes/d] 5 / 1NO3-N [tonnes/d] 3 / - 2.1PO4-P [tonnes/d] 1.6 / 0.8 0.07
ConsumablesO2 input [tonnes/d] 180 (tower biology) / 30 (tank) 20Flocculants [tonnes/yr] 50 360Nutrients [tonnes/yr] 10.6Electricity WWTP[MWh/yr] 39558 4320
Electricity sludge treatment[MWh/yr] 3644 145
Electricity exhaust airtreatment [MWh/yr] a 2812
Steam WWTP[tonnes/yr] 4241
Steam sludge treatment[tonnes/yr] 3
Compressed air WWTP[1000 Nm3/yr] 199459
Compressed air sludgetreatment [Nm3/yr] 3220
Cross-media effectSludge [tonnes dry solids/d] 77.25 7.9Sludge [kg dry solids pertonne eliminated COD] 720 620

Annexes
Waste Water and Waste Gas Treatment 335
Example III Example IVPerformance data b
waste water amount [m3/d] 148615 12269COD elimination [%] 87 91COD emission [mg/l] 107 106a off-gas thermal treatmentb daily mean average
Example V Example VIProduction production mix, mainly organic production mix, mainly organicYear of construction 1977 1974-76Function waste water treatment for chemical
production plantsdenitrification and biological treatment
Process steps neutralisationpre-clarificationdenitrificationbiological treatmentfinal clarificationflotationcoolingsludge treatment
neutralisationpre-clarificationdenitrificationfinal clarificationbiology
Plant characteristics - neutralisation: V = 220 m3 / V = 110 m3
- pre-clarification: V = 1000 m3
- 2 denitrification basins: V = 1500 m3 each- 2 aeration basins: V = 2500 m3 each- 2 bottom hoppers, diameter 14 m each
- neutralisation: V = 380 m3
- 4 pre-clarification tanks: V = 750 m3 each- 3 buffer basins: V = 9100 m3
- aeration basin/denitrification: V = 28000 m3 each- 16 clarification tanks, diameter 15 m
Sludge treatment thickenerpolyelectrolyte conditioningcentrifugesludge drying
pre-thickening by separatorsdewatering of excess and other sludgelandfilling
Process dataWaste water flow [m3/d] 8500 60000COD load [tonnes/d] 17.5 60NH4-N load 0.96BOD5 [tonnes/d] 9.55organic N [tonnes/d] 0.45NO3-N [tonnes/d] 1.9PO4-P [tonnes/d]
ConsumablesO2 input [tonnes/d] 16 15-20Flocculants [tonnes/yr] 196.2 17Nutrients [tonnes/yr] 7.71 91Electricity WWTP[MWh/yr] 4204 1163
Electricity sludge treatment[MWh/yr] 625 3882
Steam WWTP[tonnes/yr] 36 641
Steam sludge treatment[tonnes/yr] 2380 120
Compressed air WWTP[1000 Nm3/yr] 356 337
Compressed air sludgetreatment [Nm3/yr] 39.5 166
Cross-media effectSludge [tonnes dry solids/d] 1.83 103Sludge [kg dry solids pertonne eliminated COD] 150 2000
Performance data a
waste water amount [m3/d] 8616 61359COD elimination [%] 84 87COD emission [mg/l] 255 120a daily mean average

Annexes
336 Waste Water and Waste Gas Treatment
Example VII Example VIIIProduction production mix, mainly organic production mix, organicYear of construction 1977 1977/78Function waste water pretreatment of central
WWTP, 2-stage waste water treatmentexisting of biological treatment withsimultaneous precipitation of phosphateand nitrification in a closed plant
waste water treatment for chemical andpharmaceutical production plants
Process steps rake screenneutralisationpre-clarificationbiological treatmentintermediate clarificationnitrificationfinal clarification
rake screenbuffering, equalisationneutralisationbiological stage 1 (with pure oxygen)intermediate clarificationbiological stage 2final clarification
Plant characteristics - 2 neutralisation tanks: V = 380 m3
- 4 pre-clarification: V = 750 m3 each- 3 buffer basins: V = 9000 m3 each- 2 aeration basins: V = 5600 m3 each- 1 intermediate clarifiers: diameter 20 m, surface area 300 m2
- 2 final clarifiers: diameter 20 m, surface area 300 m2
- neutralisation: V = 50 m3
- 2 buffer tanks: V = 4000 m3 each- 2 aeration basins: V = 3100 m3 each- 1 intermediate clarifier: V = 4400 m3
- 2 aeration basins: V = 1600 m3 each- 2 final clarifiers: V = 2400 m3
Sludge treatment excess sludge pumped to sludgedewatering
excess sludge treated externally
Process dataWaste water flow [m3/d] 8000 20000COD load [tonnes/d] 15 60NH4-N load 1.5 0.1BOD5 [tonnes/d] 34organic N [tonnes/d]NO3-N [tonnes/d] 1.5PO4-P [tonnes/d] 0.2
ConsumablesO2 input [tonnes/d] 30 60Flocculants [tonnes/yr] 2.1Nutrients [tonnes/yr] 37.5 12Electricity WWTP[MWh/yr] 6200 5155
Electricity sludge treatment[MWh/yr]Electricity exhaust air treatment[MWh/yr] a 675
Steam WWTP[tonnes/yr] 2323
Steam sludge treatment[tonnes/yr]Compressed air WWTP[1000 Nm3/yr] 3261
Compressed air sludgetreatment [Nm3/yr]
Cross-media effectSludge [tonnes dry solids/d] 3.75 3.08Sludge [kg dry solids pertonne eliminated COD] 340 300
Performance data b
waste water amount [m3/d] 5344 3549COD elimination [%] 83 98COD emission [mg/l] 411 56a off-gas thermal treatmentb daily mean average
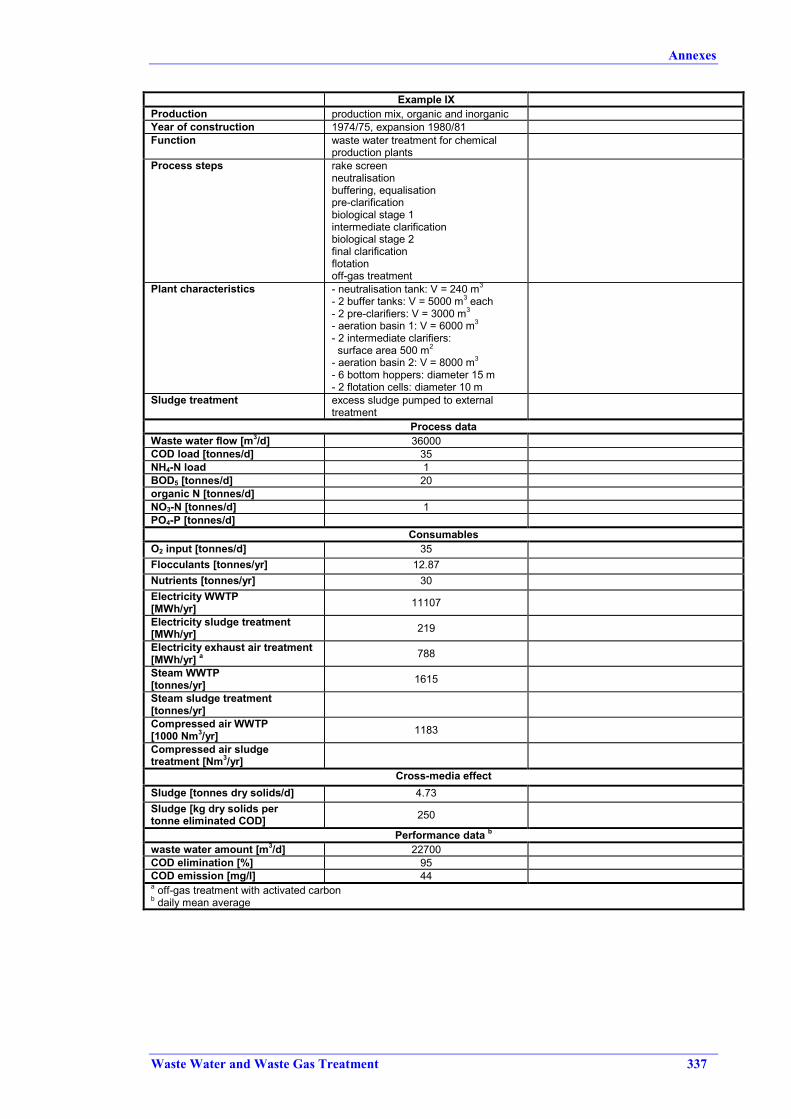
Annexes
Waste Water and Waste Gas Treatment 337
Example IXProduction production mix, organic and inorganicYear of construction 1974/75, expansion 1980/81Function waste water treatment for chemical
production plantsProcess steps rake screen
neutralisationbuffering, equalisationpre-clarificationbiological stage 1intermediate clarificationbiological stage 2final clarificationflotationoff-gas treatment
Plant characteristics - neutralisation tank: V = 240 m3
- 2 buffer tanks: V = 5000 m3 each- 2 pre-clarifiers: V = 3000 m3
- aeration basin 1: V = 6000 m3
- 2 intermediate clarifiers: surface area 500 m2
- aeration basin 2: V = 8000 m3
- 6 bottom hoppers: diameter 15 m- 2 flotation cells: diameter 10 m
Sludge treatment excess sludge pumped to externaltreatment
Process dataWaste water flow [m3/d] 36000COD load [tonnes/d] 35NH4-N load 1BOD5 [tonnes/d] 20organic N [tonnes/d]NO3-N [tonnes/d] 1PO4-P [tonnes/d]
ConsumablesO2 input [tonnes/d] 35Flocculants [tonnes/yr] 12.87Nutrients [tonnes/yr] 30Electricity WWTP[MWh/yr] 11107
Electricity sludge treatment[MWh/yr] 219
Electricity exhaust air treatment[MWh/yr] a 788
Steam WWTP[tonnes/yr] 1615
Steam sludge treatment[tonnes/yr]Compressed air WWTP[1000 Nm3/yr] 1183
Compressed air sludgetreatment [Nm3/yr]
Cross-media effectSludge [tonnes dry solids/d] 4.73Sludge [kg dry solids pertonne eliminated COD] 250
Performance data b
waste water amount [m3/d] 22700COD elimination [%] 95COD emission [mg/l] 44a off-gas treatment with activated carbonb daily mean average

Annexes
338 Waste Water and Waste Gas Treatment
7.6.2 Information on Waste Water Discharges (Examples)
[cww/tm/160]
Example X Example XIProduction active pharmaceutical ingredients and
intermediatesinorganic fine chemicals, pharmaceuticals
Process steps rake screenneutralisationbuffering, equalisationdenitrificationbiological treatment, 2 stagesmicroscreening
waste water with mainly inorganic load:- neutralisation- precipitation, flocculation, sedimentationwaste water with relevant organic loadtreated off-site
Pretreatment facilities wet oxidation (H2O2/Fe salt) for tributarystream (COD reduction)
Facilities for emergencysituations
additional biological treatment facilityV = 13500 m3 (covering 3 days)
additional retention and treatment facilitiesV = 3800 m3 and V = 1800 m3
Exhaust air treatment closed facilities, except biological stagesWaste water amount[m3/d] 3800 3500
Performance data a input[mg/l]
output[mg/l]
performance[%]
input[mg/l]
output[mg/l]
performance[%]
COD 1600 100 94 150 40BOD5 1100 7 >99 49 20NH4-N 30 2 93total inorganic N 20total N 40 25 37.5 15 15total P 4.2 0.5 88 3,8 0.3TF 2TD 1TA 1-8TL 1-8TM 1.5a daily mean average
Example XII Example XIIIProduction large volume organic and inorganic
chemicals, polymers, dyes, pharmaceuticalingredients and intermediates, municipalwaste water (13 %)
pharmaceutical ingredients, pesticides,dyes
Process steps neutralisationsedimentationbiological treatmentfinal clarification (sedimentation)
neutralisationsedimentationtower biology with final clarification
Pretreatment facilities stripping (ammonia from tributary streams)extraction (tributary streams for pesticideproductionprecipitation of heavy metals
central GAC adsorption (tributary streamsfrom production of chlorinatednitroaromatics with high AOX load), on-site regenration
Facilities for emergencysituations
possibility to isolate 2 aeration tanksretention volume 60000 m3
retention facility V = 12000 m3
Exhaust air treatment closed biological stages closed biological facilitieswaste gas combustion
Waste water amount[m3/d] 430000 11000
Performance data a input[mg/l]
output[mg/l]
performance[%]
input[mg/l]
output[mg/l]
performance[%]
COD 1050 112 91 160 18 89 b
BOD5 500 7 98.6 1NH4-N 27 22 19.5 4.2 0.9 78total inorganic N 22 50 28 44total Ntotal P 9 0.5 94 0.13AOX 1.1 0.16 85 c
TF 2 2TD 2 1TA 2 3TL 8TM 1.5a daily mean averageb 96 % when considering pretreatmentc 99 % when considering pretreatment

Annexes
Waste Water and Waste Gas Treatment 339
Example XIV Example XVProduction polymers, fibres, optical brighteners,
detergents, pharmaceutical ingredientslight stabilisers, antioxidants, corrosioninhibitors, additives, stabilisers
Process steps neutralisationpreliminary clarificationbiology: trickling filters, activated sludgetankfinal clarification
neutralisationoil-water separationflocculation, clarificationdenitrification2-stage biologyfinal clarificationflotation
Pretreatment facilities sedimentation of natural resins in tributarystreamsdistillation of tributary streams frompharmaceutical productions with recyclingof solvent
precipitation-flocculation-sedimentation-filtration (tributary stream from organo tinproduction)distillation (tributary stream from amineproduction)
Facilities for emergencysituations
retention tank(s) V = 9500 m3 2 buffer tanks V = 250 m3
Exhaust air treatment combustion of waste gas from tricklingfilters and sludge thickeners
biofiltercombustion of waste gas from sludgethickener
Waste water amount[m3/d] 14700 1300
Performance data a input[mg/l]
output[mg/l]
performance[%]
input[mg/l]
output[mg/l]
performance[%]
COD 2300 350 85 4750 220 95.4BOD5 920 18 98 2430 18 99.3NH4-Ntotal inorganic N 65 7 89 88 14.7 83.3total Ntotal P 4.4 0.5 88.4 16 1.5 90.6AOX 0.4 0.16 60 1.5 0.25 83.3TF 2 3TD 2 5TA 8 12TL 2 8TMa daily mean average
Example XVI Example XVIIProduction organic and inorganic speciality chemicals pharmaceutical ingredients, vitamins,
organic fine chemicalsProcess steps neutralisation
preliminary clarificationdenitrificationbiological treatment with integrated finalclarification
neutralisationpreliminary clarificationbiological treatment with denitrificationfinal clarification
Pretreatment facilities wet oxidation with H2O2 of tributary streamsfrom production of fungicidesoxidation of tributary streams containingNa2Sconcentrating tributary streams containingsulphuric acidprecipitation of tributary stream containingNi and recycling Ni
precipitation of Hg and Ni from tributarystreamsstripping of tributary streams containinghigh concentrations of AOX and solvents
Facilities for emergencysituations
retention facilities V = 18000 m3 retention facilities V = 23000 m3
facilities for treatment with activatedcarbon
Exhaust air treatment biofilter for waste gas from buffer tanks,preliminary clarification and sludgethickener
closed biology and buffer tanksbioscrubber
Waste water amount[m3/d] 4300 5750
Performance data a input[mg/l]
output[mg/l]
performance[%]
input[mg/l]
output[mg/l]
performance[%]
COD 1750 68 96 1740 98 94.4BOD5 820 9 99 890 5 99.4NH4-Ntotal inorganic N 35 3.7 89.5 45 2.7 94total Ntotal P 5 0.7 86 7 0.9 87AOX 0.3 0.4TF 2a daily mean average

Annexes
340 Waste Water and Waste Gas Treatment
Example XVIII Example XIXProduction textile dyes, intermediates, plastics, resins organic dyes and intermediates, optical
brighteners, antimicrobica, municipalwaste water (50 %)
Process steps neutralisationsedimentationtower biology with integrated finalclarification
2-stage neutralisationpreliminary clarification2-step biology with denitrification /nitrificationfinal clarification
Pretreatment facilities recycling of nitric acid from tributarystreamsfiltration-extraction-stripping
central high pressure wet oxidation fortributary streams with recalcitrant TOCloadstripping of ammoniaprecipitation of Cu of effluent of wetoxidationprecipitation of heavy metals from severaltributary streamsadsorption of special tributary streamsextraction of special tributary streams,concentrate to wet oxidationNF of tributary streams from dyeproduction (concentrate to wet oxidation,raffinate to WWTP)
Facilities for emergencysituations
retention tanks V = 10000 m3 andV = 7500 m3
retention tanks V = 6000 m3
Exhaust air treatment closed facilities closed facilities, except biology and finalclarificationoff-gas with plasmacat (ozone, ionisation)
Waste water amount[m3/d] 16000 11000
Performance data a input[mg/l]
output[mg/l]
performance[%]
input[mg/l]
output[mg/l]
performance[%]
COD 620 107 83 1000 250 75 bBOD5 280 7 97.5 370 6 98.4NH4-N 152 13 91.5total inorganic N 42 24 43 153 18 88total Ntotal P 1.6 7 1.1 84AOX 1.2 8.5 1.7 80TF 2 2TD 2 1-4TA 1 1-32TL 19 4-32TM 1.5a daily mean averageb 89 % when considering wet oxidation
Example XXProduction vitamins, intermediatesProcess steps neutralisation
primary clarification, essentially activatedcarbontrickling filtersactivated sludge plant, nitrification,denitrificationfinal clarification
Pretreatment facilities low pressure wet oxidation for tributarystream containing recalcitrant TOCevaporation of highly loaded organic wastewater streams and subsequent incinerationof residuedistillation of solvent, recyclingextraction of recalcitrant TOC from tributarystreamshydrolysis of tributary streams containingrecalcitrant TOC
Facilities for emergencysituations
retention tank V = 10000 m3
possibility to isolate and circumvent onebasin
Exhaust air treatment off-gas treatment with GAC adsorptionclosed facilities
Waste water amount[m3/d] 8000

Annexes
Waste Water and Waste Gas Treatment 341
Example XX
Performance data a input[mg/l]
output[mg/l]
performance[%]
COD 3300 167 95BOD5 1400 7 99.5NH4-N 100 5 95total inorganic N 100 7 93total N 155 b 23 b 85total P 5 0.9 82AOX 1.1 0.13 88TF 2TD 1-2TA 1TL 1TM 1.5a daily mean averageb Kjeldahl-N
7.6.3 Information on Complete-Site Waste Water Treatment Systems(Examples)
Example XXI
Example XXI describes a chemical industry site in Finland which is shared by five chemicalcompanies (A – E), their production characteristics being:
Company Main production Capacity[tonnes/yr]
A oil products and lubricantsB plastics and petrochemicals
polyesters max. 20000plasticizing agents max. 30000
C
PVC 70000-90000D EPS (encapsulated polystyrene 40000E SB-latex 17000
All companies have established or are establishing ISO 14001 standardised environmentalmanagement systems.
The situation is illustrated in Figure 7.5.
Information on waste water flows and treatment techniques and efficiency is detailed in Table7.2.
Waste waterstream
Treatmenttechniques
Waste wateramount[m3/h]
Inputconcentration
[mg/l]
Outputconcentration
[mg/l]
Performancerate[%]
WW-1 + WW-4 GAC treatment,regeneration;pretreatment byAPI, sandfilter
10000 COD: 300-400phenols: 5
COD: <100phenols: 1-2
COD: 67-75phenols: 60-80
WW-2 + WW-3 biochemicaltreatment,subsequentsludge treatment,incineration;pretreatment bystripping, severalAPIs, flocculation,flotation
2000 COD: 500-900phenols: 30
COD: <100phenols:0.02-0.04
COD: 80-89phenols: >99.8
D-1 12000 COD: <100phenols: 1-2
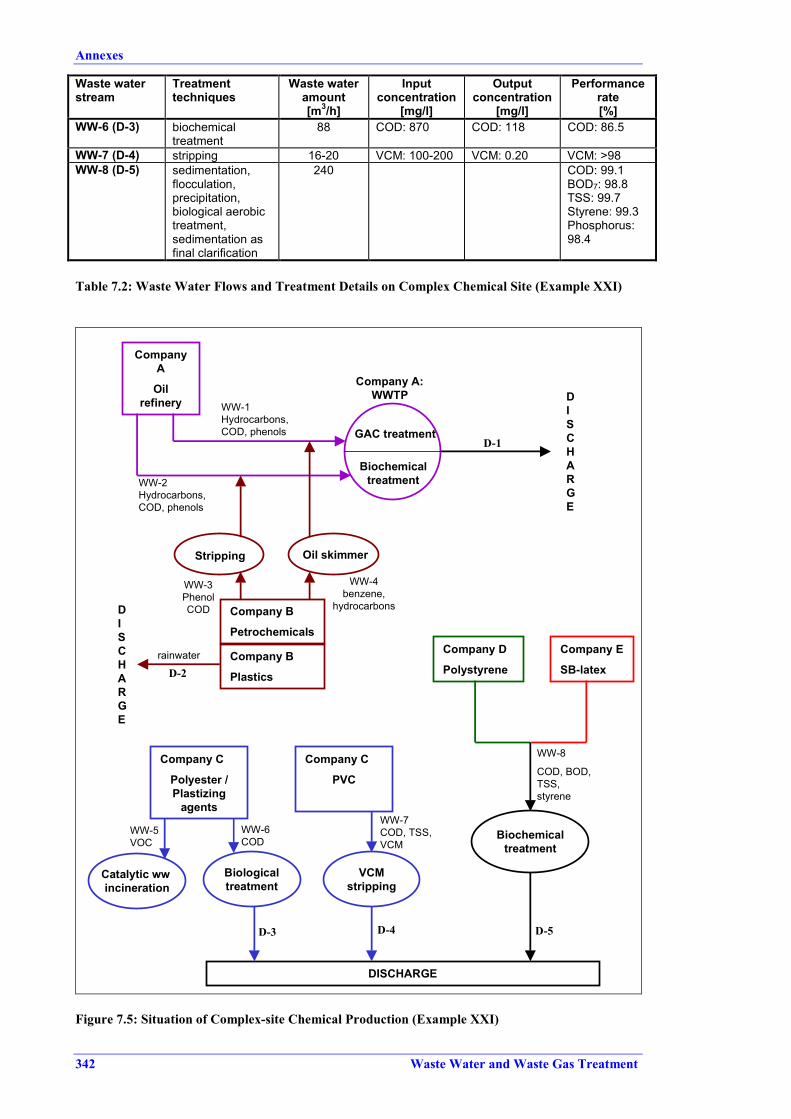
Annexes
342 Waste Water and Waste Gas Treatment
Waste waterstream
Treatmenttechniques
Waste wateramount[m3/h]
Inputconcentration
[mg/l]
Outputconcentration
[mg/l]
Performancerate[%]
WW-6 (D-3) biochemicaltreatment
88 COD: 870 COD: 118 COD: 86.5
WW-7 (D-4) stripping 16-20 VCM: 100-200 VCM: 0.20 VCM: >98WW-8 (D-5) sedimentation,
flocculation,precipitation,biological aerobictreatment,sedimentation asfinal clarification
240 COD: 99.1BOD7: 98.8TSS: 99.7Styrene: 99.3Phosphorus:98.4
Table 7.2: Waste Water Flows and Treatment Details on Complex Chemical Site (Example XXI)
CompanyA
Oilrefinery
GAC treatment
Biochemicaltreatment
WW-1Hydrocarbons,COD, phenols
WW-2Hydrocarbons,COD, phenols
Company A:WWTP
Company B
Petrochemicals
Stripping Oil skimmer
WW-4benzene,
hydrocarbons
WW-3PhenolCOD
Company B
Plastics
rainwater
DISCHARGE
DISCHARGE
Company C
Polyester /Plastizing
agents
Company C
PVC
Catalytic ww incineration
Biologicaltreatment
VCMstripping
DISCHARGE
WW-5VOC
WW-6COD
WW-7COD, TSS,VCM
Company D
Polystyrene
Company E
SB-latex
Biochemicaltreatment
WW-8
COD, BOD,TSS,styrene
D-1
D-2
D-3 D-4 D-5
Figure 7.5: Situation of Complex-site Chemical Production (Example XXI)

Annexes
Waste Water and Waste Gas Treatment 343
Example XXII
Central waste water treatment of a chemical site producing organic and inorganic finechemicals, such as pharmaceuticals, pesticides and hydrogen fluoride.
Amount of waste water: about 300 m3/h
Waste water treatment consists of:
• stepwise neutralisation with lime to pH 9.5 to precipitate fluoride, sulphate and heavymetals, flocculation and sedimentation
• high-load activated sludge aeration with clarifier• low-load activated sludge aeration with clarifier• third-stage biology, biocarb carrier biology to remove refractory COD, phenols and AOX• exhaust air purification with GAC adsorption, further treatment by incineration• sludge dewatering, sludge sent to cement industry or landfill.
Emissions:
COD: 123 mg/lBOD5: 13 mg/lphenols: 0.5 mg/lAOX: 1.1 mg/ltotal-N: 16 mg/l
The central WWTP is illustrated in Figure 7.6.

Annexes
344 Waste Water and Waste Gas Treatment
Entry tank / pre-neutralisation
Neutralisation
Step 1 Step 2Thickener Aeration 1 Aeration 2Clarifier 1 Clarifier 2
Biocarb carrierbiology
GAC filter
Sedimentationtank
Sludge basin
Sludge dewatering
Air compressor
Excess sludge 2Excess sludge 1
Sludge recycling 1 Sludge recycling 2
Storage tank20000 m3
Pure oxygen
Return to aeration 1
Lime milk preparation
Process water
Rain andcooling water
Figure 7.6: Central Waste Water Treatment for a Chemical Site Producing Pharmaceuticals, Pesticides
Annexes
Waste Water and Waste Gas Treatment 345
7.6.4 Examples of Heavy Metal Discharges
[cww/tm/160]
The following Table 7.3 contains the concentrations of heavy metals from 23 waste waterdischarges. The values given are yearly averages of 24 hours mixed samples; the ones inbrackets are the highest values found. The concentrations are achieved at the final dischargepoint, after treatment at source, without dilution with rainwater or cooling water. They dependon the share of heavy metals in the total waste water mix.
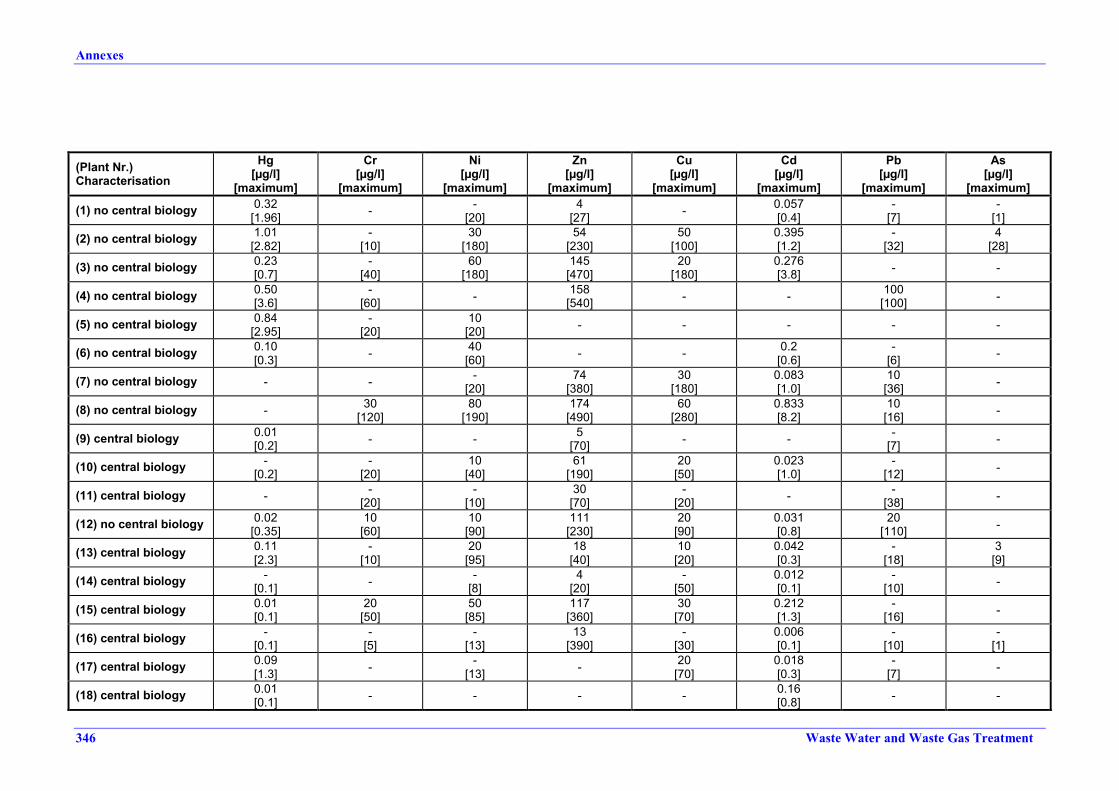
Annexes
346 Waste Water and Waste Gas Treatment
(Plant Nr.)Characterisation
Hg[µg/l]
[maximum]
Cr[µg/l]
[maximum]
Ni[µg/l]
[maximum]
Zn[µg/l]
[maximum]
Cu[µg/l]
[maximum]
Cd[µg/l]
[maximum]
Pb[µg/l]
[maximum]
As[µg/l]
[maximum]
(1) no central biology 0.32[1.96] - -
[20]4
[27] - 0.057[0.4]
-[7]
-[1]
(2) no central biology 1.01[2.82]
-[10]
30[180]
54[230]
50[100]
0.395[1.2]
-[32]
4[28]
(3) no central biology 0.23[0.7]
-[40]
60[180]
145[470]
20[180]
0.276[3.8] - -
(4) no central biology 0.50[3.6]
-[60] - 158
[540] - - 100[100] -
(5) no central biology 0.84[2.95]
-[20]
10[20] - - - - -
(6) no central biology 0.10[0.3] - 40
[60] - - 0.2[0.6]
-[6] -
(7) no central biology - - -[20]
74[380]
30[180]
0.083[1.0]
10[36] -
(8) no central biology - 30[120]
80[190]
174[490]
60[280]
0.833[8.2]
10[16] -
(9) central biology 0.01[0.2] - - 5
[70] - - -[7] -
(10) central biology -[0.2]
-[20]
10[40]
61[190]
20[50]
0.023[1.0]
-[12] -
(11) central biology - -[20]
-[10]
30[70]
-[20] - -
[38] -
(12) no central biology 0.02[0.35]
10[60]
10[90]
111[230]
20[90]
0.031[0.8]
20[110] -
(13) central biology 0.11[2.3]
-[10]
20[95]
18[40]
10[20]
0.042[0.3]
-[18]
3[9]
(14) central biology -[0.1] - -
[8]4
[20]-
[50]0.012[0.1]
-[10] -
(15) central biology 0.01[0.1]
20[50]
50[85]
117[360]
30[70]
0.212[1.3]
-[16] -
(16) central biology -[0.1]
-[5]
-[13]
13[390]
-[30]
0.006[0.1]
-[10]
-[1]
(17) central biology 0.09[1.3] - -
[13] - 20[70]
0.018[0.3]
-[7] -
(18) central biology 0.01[0.1] - - - - 0.16
[0.8] - -

Annexes
Waste Water and Waste Gas Treatment 347
(Plant Nr.)Characterisation
Hg[µg/l]
[maximum]
Cr[µg/l]
[maximum]
Ni[µg/l]
[maximum]
Zn[µg/l]
[maximum]
Cu[µg/l]
[maximum]
Cd[µg/l]
[maximum]
Pb[µg/l]
[maximum]
As[µg/l]
[maximum]
(19) central biology 0.45[1.2] - - 64
[150] - - - -
(20) central biology 0.49[1.6] - - 4
[29] - 0.064[1.61]
-[7] -
(21) central biology 0.05[0.3] - 50
[130]23
[60]-
[20]0.017[0.4] - -
(22) central biology - - 10[30]
613[1350]
-[50]
0.106[0.6]
10[34] -
(23) central biology <0.17 2.7 34 39 38 <0.3 <2.6
Table 7.3: Emission Levels of Heavy Metals at the Final Discharge Point[cww/tm/160]

Annexes
348 Waste Water and Waste Gas Treatment
7.6.5 Examples of Waste Gas Treatment Plants
Example 1
Process waste gas from a chemical site, several companies sharing joint equipment.
Waste gas Treatment method Discharge[mg/Nm3]
Reduction[%]
Incineration of sludgefrom biological WWTP
ESP and wet gasscrubber
SO2: 500CO: 250HCl: 1
Process gas fromphenol production Incineration Hydrocarbons: 14-15 Hydrocarbons: 99.5
Fugitive emissions fromproduction of aromatichydrocarbons
Incineration Hydrocarbons: 5-6 Hydrocarbons: about 99
Process gas from PVCproduction GAC adsorption VC monomer: 0-5
Company X (latexproduction) Thermal destruction 95
Process gas frompolystyrene production Thermal destruction VOC: 25 VOC about 95
Production:
• plastics and petrochemicals• oil products and lubricants• polyester• plasticizing agents• PVC• SB-latex• encapsulated polystyrene.
Example 2
Treatment of waste gas from incineration.
The treatment system consists of:
• venturi scrubber with alkali solution to remove HCl, some gaseous compounds and part ofthe solids. The acidic solution from the scrubber is neutralised with lime, the solids areremoved from the solution with additives and landfilled
• radial flow scrubber to remove SO2 with alkali or lime solution / suspension• wet ESP, solid residues are landfilled.
Emission levels are:
PM: 2-12 mg/Nm3
SO2: 58-84 mg/Nm3
CO: 2-55 mg/Nm3
HCl: 7-22 mg/Nm3
dioxines: 0.007-0.02 ng/Nm3 TEQ

Annexes
Waste Water and Waste Gas Treatment 349
Example 3
Highly effective SCR to control high initial NOx content.[Comments from France to Draft 2]
Production high performance abrasive grit for the manufacture of grinding wheelsand sand paper
Production process Norton SG process using nitric acid and emitting highly concentratednitrous waste gas
Conditions: waste gas stream 800 Nm3/h, NOx concentration 10000 ppmNOx abatement chosen SCR processAlternative abatement process Scrubbing with peroxide / water, conversion of NOx to nitric acid
Rationale of decision in favour ofSCR
• investment and operating costs of SCR seem to be reasonable• no more polluting effluents• operation and maintenance of SCR are easy
Abatement process
The gas (70-90 °C) is first diluted to reduce the NOx concentration toless than 5000 ppm. The mixture is heated to about 240 °C, thestoichiometric amount of NH3 (NH3/NOx up to 1.24) sprayed as 25 %ammonia solution into it. The mixture is immediately led across thecatalyst bed of granules. Finally, the waste gas is again diluted with airby a factor >10 (reduction of NOx concentration from 200 mg/Nm3 to20 mg/Nm3) to eliminate any rust that colours the flue gas.
Performance dataCatalyst temperature upstream: 215-225 °CNOx concentration downstream catalyst: 1240-1450 ppmNOx concentration after dilution: 50-100 ppmratio NH3/NOx (mol/mol): 1.17-1.24NH3 leakage: up to 15 mg/Nm3
NOx conversion: 93.1-96.2 %
CostsInvestment costs 2.4 million FFR
equipment and civil engineering 1.755 million FFRdesign 0.645 million FFR]
Annual operating costs 2176 FFR/t converted NOxOverall cost 5182 FFR/t abated NOx

Annexes
350 Waste Water and Waste Gas Treatment
7.7 Annex VII. Member States’ Legislation on Waste Waterand Waste Gas in the Chemical Sector
Annex VII surveys the chemical sector emission limits for waste water and waste gas inMember States. Note that there may be different criteria behind the figures, concerning suchitems as averaging time, reference conditions, sampling techniques, measurement and analysisand method of compliance testing.
1. AUSTRIA
Emissions to AirNo special legislation exists in Austria on emission standards for air emissions from thechemical industry. In general the “Gewerbeordnung” (BGBl. 194/1994) regulates the licensingof chemical plants and means that plants have to be “state-of-the-art” in their performance.Emission standards for air emissions from chemical plants are usually based on the German“Technical Instructions on Air Quality” (TA – Luft).
Combustion plants are regulated with the “Feuerungsanlagenverordnung” (BGBl. II 1997/331),except for steam boilers including waste heat boilers, afterburners of exhaust gases, gas turbinesand combustion engines.
Emission standards for boiler plants are regulated by the “Luftreinhaltegesetz fürKesselanlagen” (BGBl. 1988/380 i.d.F. BGBl. 1993/185, BGBl. I 1997/115, BGBl. I 1998/158)and the “Luftreinhalteverordnung für Kesselanlagen” (BGBl. 1989/19 i.d.F. BGBl. 1990/134,BGBl. 1994/785, BGBl. II 1997/324).
- Feuerungsanlagenverordnung (Ordinance for Firing Installations) (BGBl. II 1997/331)The “Feuerungsanlagenverordnung” regulates emissions of combustion plants with anominal thermal output of 50 kW or more. This ordinance is based on § 82 Abs. 1 of theGewerbeordnung. As mentioned above, steam boilers including waste heat boilers,afterburners of exhaust gases, gas turbines, combustion engines and plants using waste asfuel are not regulated by this ordinance.
The “Feuerungsanlagenverordnung” provides different emission standards, depending onthe fuel used and the thermal output. The emission standards for coal- and coke-firingplants, oil-fired furnaces and combustion plants for gaseous fuels are presented in thefollowing section.
a) Coal- and coke-fired plants
Emission standards for furnaces using coal or cokeCapacity a [MW]Pollutants
≤0.35 >0.35-1 >1–2 >2–10 >10-50 >50Dust [mg/m³] 150 150 150 50 50 50SO2 [mg/m³] - - - - 400 200CO [mg/m³] 1000 1000 150 150 150 150NOx [mg/m³] - 400 400 400 350 100a The capacity is defined as the average of the hourly added amount of heat related to the calorific valueof the fuelThe emission standards are related to dry exhaust gas at 0 °C, a pressure of 101.3 kPa and oxygencontent of 6 % in the exhaust gas.
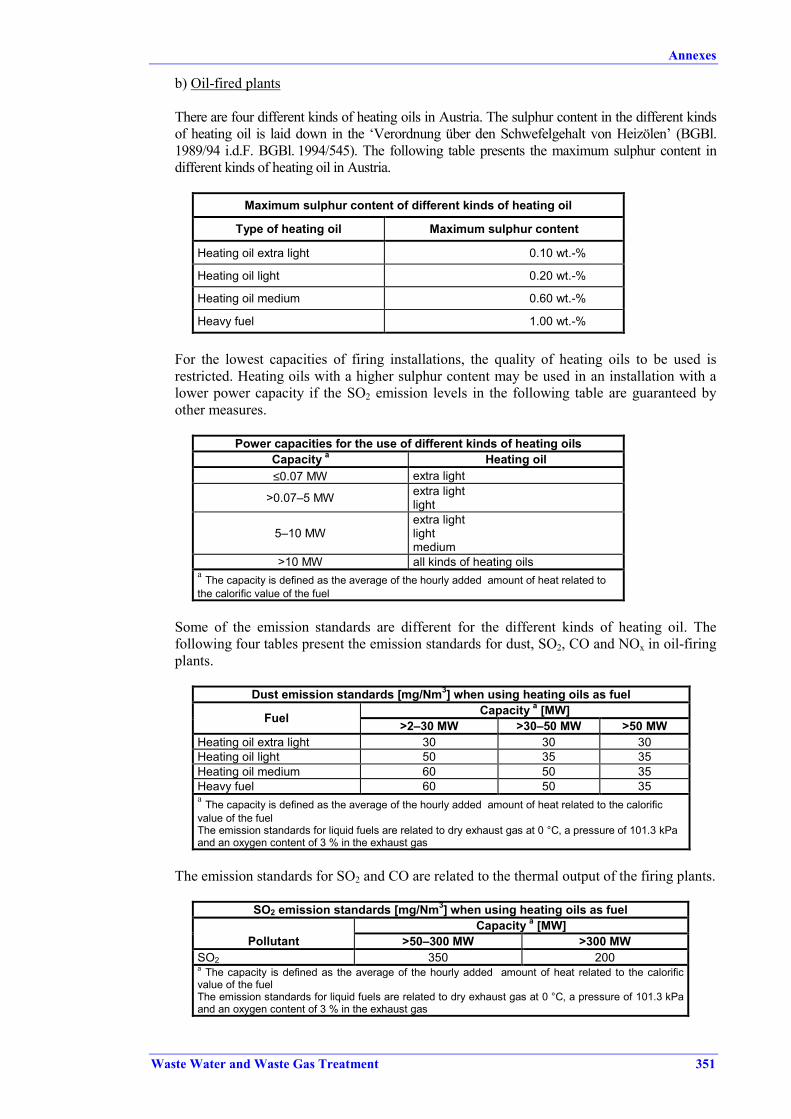
Annexes
Waste Water and Waste Gas Treatment 351
b) Oil-fired plants
There are four different kinds of heating oils in Austria. The sulphur content in the different kindsof heating oil is laid down in the ‘Verordnung über den Schwefelgehalt von Heizölen’ (BGBl.1989/94 i.d.F. BGBl. 1994/545). The following table presents the maximum sulphur content indifferent kinds of heating oil in Austria.
Maximum sulphur content of different kinds of heating oil
Type of heating oil Maximum sulphur content
Heating oil extra light 0.10 wt.-%
Heating oil light 0.20 wt.-%
Heating oil medium 0.60 wt.-%
Heavy fuel 1.00 wt.-%
For the lowest capacities of firing installations, the quality of heating oils to be used isrestricted. Heating oils with a higher sulphur content may be used in an installation with alower power capacity if the SO2 emission levels in the following table are guaranteed byother measures.
Power capacities for the use of different kinds of heating oilsCapacity a Heating oil≤0.07 MW extra light
>0.07–5 MW extra lightlight
5–10 MWextra lightlightmedium
>10 MW all kinds of heating oilsa The capacity is defined as the average of the hourly added amount of heat related tothe calorific value of the fuel
Some of the emission standards are different for the different kinds of heating oil. Thefollowing four tables present the emission standards for dust, SO2, CO and NOx in oil-firingplants.
Dust emission standards [mg/Nm3] when using heating oils as fuelCapacity a [MW]Fuel >2–30 MW >30–50 MW >50 MW
Heating oil extra light 30 30 30Heating oil light 50 35 35Heating oil medium 60 50 35Heavy fuel 60 50 35a The capacity is defined as the average of the hourly added amount of heat related to the calorificvalue of the fuelThe emission standards for liquid fuels are related to dry exhaust gas at 0 °C, a pressure of 101.3 kPaand an oxygen content of 3 % in the exhaust gas
The emission standards for SO2 and CO are related to the thermal output of the firing plants.
SO2 emission standards [mg/Nm3] when using heating oils as fuelCapacity a [MW]
Pollutant >50–300 MW >300 MWSO2 350 200a The capacity is defined as the average of the hourly added amount of heat related to the calorificvalue of the fuelThe emission standards for liquid fuels are related to dry exhaust gas at 0 °C, a pressure of 101.3 kPaand an oxygen content of 3 % in the exhaust gas

Annexes
352 Waste Water and Waste Gas Treatment
CO emission standards [mg/Nm3] when using heating oils as fuelCapacity a [MW]
Pollutant ≤≤≤≤1 MW >1 MWCO 100 80a The capacity is defined as the average of the hourly added amount of heat related to the calorificvalue of the fuelThe emission standards for liquid fuels are related to dry exhaust gas at 0 °C, a pressure of 101.3 kPaand an oxygen content of 3 % in the exhaust gas
For NOx, different emission standards for different kinds of heating oils are distinguished.Again the thermal output is a further criterion for the emission standard. The next tableshows the different NOx emission standards.
NOx emission standards [mg/Nm3] when using heating oils as fuelCapacity a [MW]
Fuel ≤≤≤≤3 MW >3–10 MW >10–50 MW >50 MWHeating oil extra light 150 150 150 100Heating oil light 450 400 350 100Heating oil medium 450 450 350 100Heavy fuel 450 450 350 100a The capacity is defined as the average of the hourly added amount of heat related to the calorific value of thefuelThe emission standards for liquid fuels are related to dry exhaust gas at 0 °C, a pressure of 101.3 kPa and anoxygen content of 3 % in the exhaust gas
c) Gas-fired plants
For plants using gaseous fuels (natural gas or liquefied petroleum gas) the“Feuerungsanlagenverordnung” only provides emission standards for NOx and CO.
Emissions standards for gaseous fuelsCapacity a [MW]
Pollutant Fuel ≤≤≤≤3 MW >3 MWNatural gas 80 80CO
[mg/Nm3] Liquefied petroleum gas 80 80Natural gas 120 100NOx
[mg/Nm3] Liquefied petroleum gas 160 130a The capacity is defined as the average of the hourly added amount of heat related to the calorific value of thefuelThe emission standards for liquid fuels are related to dry exhaust gas at 0 °C, a pressure of 101.3 kPa and anoxygen content of 3 % in the exhaust gas
For combustion plants with high temperature processes, higher NOx emissions are allowed.Using natural gas, 200 mg/Nm³ NOx and using liquefied petroleum gas, at maximum260 mg/Nm³ NOx are allowed.
The requirement for continuous measurements of different pollutants depends on the fueltype and on plant capacity.
Thresholds above which continuous measurement is requiredPollutant
Fuel Dust CO SO2 NOx
Solid >10 MW >10 MW >30 MW >30 MWLiquid >10 MW >10 MW >50 MW >30 MWGaseous - >10 MW - >30 MW
This ordinance came into force on 1.6.1998. Combustion plants which were improvedbefore this date have to comply with the emission values of this ordinance within five years,or if they do exceed these values for not more than 50 % they have to keep the emissionlimits eight years later.

Annexes
Waste Water and Waste Gas Treatment 353
- Luftreinhaltegesetz and Luftreinhalteverordnung für Kesselanlage (Clean Air Act and CleanAir Ordinance for Steam Boilers) (LRG-K and LRV-K)In Austria emissions from steam boiler plants and waste heat boilers are regulated by the“Luftreinhaltegesetz für Kesselanlagen” (BGBl. 1988/380 i.d.F. BGBl. 1993/185, BGBl. I1997/115, BGBl. I 1998/158) and the ordinance “Luftreinhalteverordnung fürKesselanlagen” (BGBl. 1989/19 i.d.F. BGBl. 1990/134, BGBl. 1994/785, BGBl. II1997/324). The emission standards for dust, SO2, CO and NOx due to theLuftreinhalteverordnung für Kesselanlagen depend on the kind of fuel and on the thermaloutput of the plants.
Dust emission standards [mg/Nm3]Capacity a [MW]
Fuel <2 MW 2–30 MW 30–50 MW >50 MWSolid fuels b 150 50Gaseous fuels - 5 5 5Heating oil extra light - 30 30 30Heating oil light - 50 35 35Heating oil medium - 60 50 35Heavy fuel - 60 50 35a The capacity is defined as the average of the hourly added amount of heat related to the calorific value of thefuelb Wood is excluded
SO2 emission standards [mg/Nm3]Capacity a [MW]
Fuel 10–50 MW 50–300 MW >300 MWLignite coal 400 400 400Other solid fuels 400 200 200Liquid fuels 1700 350 200a The capacity is defined as the average of the hourly added amount of heat related to the calorific value of thefuel
CO emission standards [mg/Nm3]Capacity a [MW]
Fuel ≤≤≤≤1MW >1MWSolid fuels 1000 150Liquid fuels 100 80Liquefied petroleum gas 100Natural gas 80a The capacity is defined as the average of the hourly added amount of heat related to the calorific value of thefuel
NOx emission standards [mg/Nm3]Capacity a [MW]
Fuel 0.35–3 MW 3–10 MW 10–50 MW >50 MWSolid fuels 400 350 200Gaseous fuels 125 100Heating oil extra light 150Heating oil light 400 400 350 100Heating oil medium 450 350 100Heavy fuel 450 350 100a The capacity is defined as the average of the hourly added amount of heat related to the calorific value of thefuelThe emission standards for solid fuels are related to 6 % oxygen in the exhaust gas. For liquid and gaseousfuels they are related to 3 % oxygen. All emission values are related to dry exhaust gas at 0 °C and a pressureof 101.3 kPa.
Emissions to WaterThe discharge of waste water into surface water or the public sewerage system in Austria isregulated by the ordinance “Allgemeine Abwasseremissionsverordnung” (General Waste WaterEmission Ordinance) (BGBl. 1996/186) and special ordinances for different industrial sectors.

Annexes
354 Waste Water and Waste Gas Treatment
These ordinances are based on the Austrian “Wasserrechtsgesetz” (Water Right Act) (BGBl. I155/1999). Special ordinances that are of interest for plants producing organic chemicals are:• Verordnung über die Begrenzung von Abwasseremissionen aus der Herstellung von
Kohlenwasserstoffen und organischen Grundchemikalien BGBl. II 1999/7 (Ordinance forthe limitation of waste water emissions from the production of hydrocarbons and basicorganic chemicals)
• Verordnung über die Begrenzung von Abwasseremissionen aus der ErdölverarbeitungBGBl. II 1997/344 (Ordinance for the limitation of waste water emissions from oil refining)
• Verordnung über die Begrenzung von Abwasseremissionen aus der Herstellung vontechnischen Gasen BGBl. 1996/670 (Ordinance for the limitation of waste water emissionsfrom the production of industrial gases)
• Verordnung über die Begrenzung von Abwasseremissionen aus der Herstellung vonanorganischen Düngemitteln sowie von Phosphorsäure und deren Salzen BGBl. 1996/669(Ordinance for the limitation of waste water emissions from the production of inorganicfertilizers or phosphoric acid and its salts).
- Hydrocarbons and basic organic chemicalsThe ordinance for the limitation of waste water emissions from the production ofhydrocarbons and basic organic chemicals regulates the emission standards for theproduction of hydrocarbons and basic organic chemicals. This ordinance entered into forceat the 13.1.2000. Plants, which have been approved before this date have to fulfil theserequirements within the next six years. This ordinance regulates:
i. storage of products from the processing of crude oil or crude oil fractions, which areused in the production processes of item ii to vi
ii. production of alkenes, alkines or aromatics from processing products of crude oil orcrude oil fractions with cracking, using additional steam (steam cracking)
iii. production of chemically pure hydrocarbons or their mixtures from cracking productsof item ii by using physical separation processes
iv. production of basic organic chemicals from products of item ii or iii using alkylation,desalkylation, dehydrogenation, disproportionation, hydration, hydroxylation,hydrodesalkylation, hydrogenation, isomerization, oxidation or etherification
v. production of nitrogen containing basic organic chemicals from hydrocarbons of itemii or iii or from substances of item iv (e. g. amides, amines, cyanates, isocyanates,lactams, nitriles, nitro-, nitroso or nitrate compounds, nitrogen containing aromatics)
vi. production of sulphur or phosphorus containing basic organic chemicals fromhydrocarbons of item ii or iii or from substances of item iv
vii. production of halogenated basic organic chemicals from hydrocarbons of item ii or iiior from substances of item iv
viii. storage of products from item ii to vii ix. cleaning of drawing-off air and aqueous condensates from actions according to item
to viii x. cleaning of combustion gases from actions according to item i to viii with the use of
aqueous substances if simultaneously physical or chemical reactions with the aim of asynthesis or production are made or if the exhaust gas of the combustion is mixed withan other waste gas and the composition of the residual exhaust gas is significantlydifferent compared to the composition of the combustion gas.

Annexes
Waste Water and Waste Gas Treatment 355
Emission standards for the production of hydrocarbons
General parameters Standards for the dischargeinto surface waters
Standards for the dischargeinto the public seweragesystem
Temperature 30 °C 40 °C
TA 8 no impairment of the publicwaste water treatment plant
TL 4 no impairment of the publicwaste water treatment plant
TD 4 No impairment of the publicwaste water treatment plant
TF 2 No impairment of the publicwaste water treatment plant
TSS 30 mg/l 150 mg/lpH 6.5 – 8.5 6.5 – 10
Inorganic parameters Standards for the dischargein surface waters
Standards for the dischargein the public seweragesystem
Aluminium (calculated as Al) 2 mg/l Limited with the standard forTSS
Lead (calculated as Pb) 0.5 mg/l 0.5 mg/l
Iron (calculated as Fe) 3.0 mg/l Limited with the standard forTSS
Copper (calculated as Cu) 0.5 mg/l 0.5 mg/l Nickel (calculated as Ni) 0.5 mg/l 0.5 mg/l Mercury (calculated as Hg) 0.01 mg/l 0.01 mg/l Zinc (calculated as Zn) 1 mg/l 1 mg/l Tin (calculated as Sn) 1 mg/l 1 mg/l Ammonium (calculated as N) 5 mg/l
Chloride (calculated as Cl) limited with standards fortoxicity
Cyanide (easily released and calculated as CN) 0.1 mg/l 0.5 mg/l
Fluoride (calculated as F) 30 mg/l 30 mg/l Total bound nitrogen (including ammonium, nitrite and nitrate nitrogen)
40 mg/l -
Total phosphorus (calculated as P) 2 mg/l -
Sulphate (calculated as SO4) - 200 mg/l Sulphide (easily released and calculated as S) 0.5 mg/l 1 mg/l
Organic parameters Standards for the dischargein surface waters
Standards for the dischargein the public seweragesystem
TOC (calculated as C) 25 mg/l - COD (calculated as O2) 75 mg/l - BOD5 (calculated as O2) 20 mg/l - AOX (calculated as Cl) 0.5 mg/l 0.5 mg/l Sum of hydrocarbons 5 mg/l 20 mg/l POX (calculated as Cl) 0.1 mg/l 0.1 mg/l Phenolindex (calculated as phenol) 0.2 mg/l 20 mg/l
Sum of anionic and non-ionic tensides 2 mg/l No impairment of the public
waste water treatment plant Sum of volatile aromatics (BTXE) 0.1 mg/l 1 mg/lTo meet the emission limits, four out of five successively measured values have to be lower than the emission limitvalue and only one measured value may exceed the emission limit (maximum 50 % of the emission limit). The majorityof the parameters have to be determined with mass proportional homogeneous daily average samples. The parameterstemperature, TSS, pH, cyanide, sulphide, POX and sum of volatile aromatics (BTXE) are determined with randomsamples.
Waste water from the production of the following substances has to observe the followingspecial emission limits. The production specific emission limits are related to the installedproduction capacity in tonnes.

Annexes
356 Waste Water and Waste Gas Treatment
Emission limits for the production of several organic substancesEmission standard
Substance [mg/l] [g/tonne installedproduction capacity]
1. Ethylbenzene, cumene 1.0 202. Acetaldehyde, vinyl acetate 1.0 303. Vinyl chloride (VC) 1.0 2
4. Trichlorophenols(TCP, all isomers) 1.0 20
5. Trichlorobenzenes(TCB, all isomers) 0.2 2
6. Tetrachloromethane 1.5 37. Hexachlorobutadiene (HCBD) 1.5 28. Ethane-1,2-dichloride (EDC) 1.0 29. Trichloroethene (TRI) 1.0 310. Perchloroethene (PER) 1.0 3
11.Halogenated organic solventsexcept: 1,2,4-trichlorobenzene anditems 6 – 11
1.0 10
To meet the emission limits, four out of five successively measured values have to be lower than the emission limitvalue and only one measured value may exceed the emission limit (maximum 50 % of the emission limit). The majorityof the parameters have to be determined with mass proportional homogeneous daily average samples. The parameterstemperature, TSS, pH, cyanide, sulphide, POX and sum of volatile aromatics (BTXE) are determined with randomsamples.
For the production of acetylene with calcium carbide as raw material emission limits are set inthe ordinance “Verordnung über die Begrenzung von Abwasseremissionen aus der Herstellungvon technischen Gasen” (BGBl. 1996/670). All acetylene plants in Austria use calcium carbideprocesses for acetylene production
Emission standards for the production of acetylene from calcium carbide
General parameters Standards for the dischargein surface water
Standards for the discharge inthe public sewerage system
Temperature 35 °C 40 °C
TL 4 No impairment of the public wastewater treatment plant
TF 2 No impairment of the public wastewater treatment plant
TSS 50 mg/lNo impairment of the operation ofthe public sewage system orwastewater treatment plant
pH 6.5 – 9 6.5 – 10
Inorganic parameters Standards for the dischargein running waters
Standards for the discharge inthe public sewerage system
Iron (calculated as Fe) 2 mg/l Limited with the standard for TSS Ammonium (calculated as N) 10 mg/l - Cyanide (easy to release and calculated as CN) 0.1 mg/l 0.1 mg/l
Total phosphorus (calculated as P) 1 mg/l -
Sulphate (calculated as SO4) - 200 mg/l Sulphide (calculated as S) 0.1 mg/l 1 mg/l Sulphite (calculated as SO3) 1 mg/l 10 mg/l
Organic parameters Standards for the dischargein running waters
Standards for the discharge inthe public sewerage system
COD (calculated as O2) 50 mg/l - Sum of hydrocarbons 10 mg/l 20 mg/l Phenolindex (calculated as phenol) 0.1 mg/l 10 mg/l
To meet the emission limits, four out of five successively measured values have to be lower than the emission limitvalue and only one measured value may exceed the emission limit (maximum 50 % of the emission limit). The majorityof the parameters have to be determined with mass proportional homogeneous daily average samples. The parameterstemperature, TSS, pH, cyanide, sulphide are determined with random samples.

Annexes
Waste Water and Waste Gas Treatment 357
The ordinance “Verordnung über die Begrenzung von Abwasseremissionen aus der Herstellungvon anorganischen Düngemitteln sowie von Phosphorsäure und deren Salzen “ (BGBl.1996/669) regulates the emission standards for the discharge of waste water from melamine andurea production.
Emission standards for waste water from urea and melamine production
General parameters Standards for the discharge intosurface water
Standards for the discharge intothe public sewerage system
Temperature 30 °C 35 °C
TF 4 No impairment of the public wastewater treatment plant
TSS 30 mg/l 150 mg/lpH 6.5–8.5 6.5–9.5
Inorganic parameters Standards for the discharge intosurface water
Standards for the discharge intothe public sewerage system
Ammonium (calculated as N) 0.5 kg/t 0.5 kg/t
Nitrate (calculated as N) 0.5 kg/t 0.5 kg/t Nitrite (calculated as N) 0.02 kg/t 0.02 kg/t
Organic parameters Standards for the discharge intosurface water
Standards for the discharge intothe public sewerage system
COD (calculated as O2) 0.5 kg/t -The emission standards are related to the installed production capacity of the plant (related to the tonne nitrogen in thefinal product).To meet the emission limits, four out of five successively measured values have to be lower than the emission limit andonly one measured value may exceed the emission limit (maximum 50 % of the emission limit). Most of the parametershave to be determined with mass proportional homogeneous daily average samples. The parameters temperature, filterout matter, pH and nitrite have to be determined with random samples.
2. BELGIUM
Flemish Legislation on Waste Water and Waste Gas in the Chemical Sector
In the Flemish environmental legislation, VLAREM, the chemical sector is classified underdifferent subsections:
• classification number 7 ‘Chemicals’(see Annex 1)
• classification number 17 ‘Hazardous Substances’(see Annex 2)
• classification number 20.4 ‘Chemical Industry, Industrial activities subject to 84/360/EEG’(see Annex 3)
Chemical plants are subject to some sector-specific legislation that may differ from the generalenvironmental legislation specified in VLAREM:
• Vlarem II, Hoofdstuk 5.7 ‘Chemicals’ (classification number 7)(see Annex 4)
• Vlarem II, Hoofdstuk 5.17 ‘Hazardous Substances’ (classification number 17)(see Annex 5)
• Vlarem II, Hoofdstuk 5.20 ‘Industrial activities that can give rise to air pollution’(classification number 20)(see Annex 6)

Annexes
358 Waste Water and Waste Gas Treatment
Annex 1
7. CHEMICALS (see also sections 17 and 20.4)Establishments which are not classified elsewhere for the production ortreatment of organic or inorganic chemicals involving:- alkylation- amination with ammonia- carbonylation- condensation- dehydrogenation- esterification- halogenation and halogen manufacture- hydrogenation- hydrolysis- oxidation- polymerisation- desulphurisation, synthesis and conversion sulphur-containing
compounds- nitration and synthesis of nitrogen-containing compounds- synthesis of phosphorus-containing compounds- distillation- extraction- solvatation- mixingwith an annual capacity of:
1. up to and including 1000 tonnes 32. between 1000 up to and including 10000 tonnes 2 A,G
7.1
3. over 10000 tonnes 1 G,M A P J7.2 Integrated chemical installations, i.e. for the manufacture on an
industrial scale of substances by chemical conversion, in whichdifferent units co-exist and are functionally interconnected, intended forthe manufacture of:1. basic organic chemicals2. basic inorganic chemicals3. phosphate, nitrogen or potassium-containing fertilizers (simple or
composite fertilizers)4. basic products for crop protection and biocides5. basic pharmaceutical products with a chemical or biological
process6. explosives
1 G,M A P J
Petrochemical plants or factories based on these for the cracking orvaporisation of naphtha, gas oil, LPG or other petroleum derivatives,as well as organic chemistry based thereon which is not classifiedelsewhere, with a processing capacity of:
1. up to and including 500000 tonnes per year 2 A
7.3
2. over 500000 tonnes per year 1 M A P JEstablishments for the preparation of one of the following products:a) phenols, carbon disulphides and mercaptans, with an annualcapacity of:
1. up to and including 10 tonnes 22. 10 tonnes and over 1 G,M A P J
b) amines and halogenated organic compounds with an annualcapacity of:
1. up to and including 10 tonnes 2
7.4
2. 10 tonnes and over 1 G,M A P JProduction of chlorine by electrolysis and/or by the mercury ordiaphragm process with an annual capacity of:
1. up to and including 10 tonnes 2
7.5
2. 10 tonnes and over 1 G,M A P JManufacture of organic and inorganic peroxides with an annualcapacity of:
1. up to and including 10 tonnes 2
7.6
2. 10 tonnes and over 1 G,M A P J

Annexes
Waste Water and Waste Gas Treatment 359
7. CHEMICALS (see also sections 17 and 20.4)Production of hydrogen chloride and derivatives, as well as itspolymers, other than those referred to in section 5, with an annualcapacity of:
1. up to and including 10 tonnes 2
7.7
2. 10 tonnes and over 1 G,M A P JProduction of sodium pentachlorophenol by electrolysis orhexachlorobenzene, with an annual capacity of:
1. up to and including 10 tonnes 2
7.8
2. 10 tonnes and over 1 G,M A P JProduction of soda (sodium carbonate) as end product and/or ofcalcium and sodium chloride as by-product, with an annual capacity ofend product or by-product of:
1. up to and including 10 tonnes 2
7.9
2. 10 tonnes and over 1 G,M A P JProduction of methyl cellulose by action of methyl chloride oncellulose, with an annual capacity of:
1. up to and including 10 tonnes 2
7.10
2. 10 tonnes and over 1 G,M A P JChemical installations for the manufacture of 1,2: G,M,X A P J1. basic organic-chemical products, such as:
a) simple hydrocarbons (linear or cyclic, saturated or unsaturated,aliphatic or aromatic)b) oxygen-containing hydrocarbons, such as alcohols, aldehydes,ketones, carboxylic acids, esters, acetates, ethers, peroxides,epoxy resinsc) sulphur-containing hydrocarbonsd) nitrogen-containing hydrocarbons, such as amines, amides,nitroso, nitro and nitrate compounds, nitriles, cyanates,isocyanatese) phosphor-containing hydrocarbonsf) halogen–containing hydrocarbonsg) organo-metallic compoundsh) plastic-based products (polymers, artificial fibres, cellulosefibres)i) synthetic rubberj) dyes and pigmentsk) surfactants and tensides
1 G,M,X A P J
2. basic inorganic-chemical products, such as:a) gases, such as ammonia, chlorine or hydrogen chloride,fluoride or hydrogen fluoride, carbon oxides, sulphur compounds,nitrogen oxides, hydrogen, sulphur dioxide, carbonyl dichlorideb) acids, such as chromic acid, hydrogen fluoride, phosphoricacid, nitric acid, hydrogen chloride, sulphuric acid, oleum,sulphurous acidc) bases, such as ammonium hydroxide, potassium hydroxide,sodium hydroxided) salts, such as ammonium chloride, potassium chlorate,potassium carbonate, sodium carbonate, perborate, silver nitratee) non-metals, metal oxides or other inorganic compounds, suchas calcium carbide, silicon, silicon carbide
1 G,M,X A P J
3. phosphate-, nitrogen- or potassium-containing fertilizers (simple orcomposite fertilizers)
1 G,M,X A P J
4. basic pharmaceutical products which use a chemical or biologicalprocess
1 G,M,X A P J
7.11
5. explosives 1 G,M,X A P J1 There may be overlapping with other subsections of sections 7, 13 and 382 Manufacture in the meaning of this section is understood to mean the manufacture of the substances or groups ofsubstances referred to in this section on an industrial scale by chemical conversion

Annexes
360 Waste Water and Waste Gas Treatment
Annex 2
17 Hazardous Products 1(discharge of waste water which contains one or more of the hazardoussubstances referred to in list 2C of Appendix 2 to title I of the Vlarem: seesection 3.5)
17.2 Industrial activities and storage depots with risks of major accidents (EUDirective 96/82/EC of 9 December 1996 concerning the control of thehazards of major accidents involving hazardous substances)
17.2.1 establishment in which hazardous products are present in quantities equalto or greater than the amount specified in Appendix 6, parts 1 and 2,column 2 appended to title I of the VLAREM (see also Article 7 of title I ofthe VLAREM)
1 G A P J
17.2.2 VR-obliged establishment in which hazardous products are present inquantities equal to or greater than the amount specified in Appendix 6,parts 1 and 2, column 3 appended to title I of the VLAREM (see alsoArticle 7 of title I of the VLAREM)
1 G A P J
17.3 Establishments or storage depots for hazardous products not classifiedunder 17.2 or 17.4 2,3
Establishments for the industrial production of very toxic, toxic, extremelyflammable, highly flammable, explosive or environmentally dangeroussubstances with an annual capacity of:
1. up to and including 10 tonnes 2 P J
17.3.1
2. 10 tonnes and over 1 G A P JEstablishments for the storage of very toxic, toxic and explosivesubstances with the exception of those referred to under section 48, witha storage capacity of:
1. over 10 kg up to and including 100 kg 32. over 100 kg up to and including 1 tonne 2
17.3.2
3. over 1 tonne 1 G B P JStorage depots for oxidizing, harmful, corrosive and irritating substances,with the exception of those referred to under section 48, with a totalcapacity of:
1. 200 kg up to and including 1000 kg 32. over 1000 kg up to and including 50000 kg 2
17.3.3
3. over 50000 kg 1 G B P JStorage depots for extremely flammable and highly flammable liquids withthe exception of those referred to under section 48, with a total capacityof:
1. 50 l up to and including 500 l 32. over 500 l up to and including 30000 l 2
17.3.4
3. over 30000 l 1 BStorage depots for flammable liquids with the exception of those referredto under section 48, with a total capacity of:
1. 100 l up to and including 5000 l 32. over 5000 l up to and including 100000 l 2
17.3.5
3. over 100000 l 1 BStorage depots for liquids with a flame point higher than 55°C but notexceeding 100°C, with the exception of those referred to under section48, with a total capacity of:
1a) 5000 l up to and including 20000 l if the establishment isconnected with the residential function of a property that is usedmainly for residential purposes.
3
1b) 100 l up to and including 20000 l for establishments other thanthose referred to in a)
3
2. over 20000 l up to and including 500000 l 2
17.3.6
3. over 500000 l 1 BStorage depots for liquids with a flame point higher than 100°C, with theexception of those referred to under section 48, with a total capacity of:
1. 200 l up to and including 50000 l 32. over 50000 l up to and including 5000000 l 2
17.3.7
3. over 5000000 l 1 B

Annexes
Waste Water and Waste Gas Treatment 361
17 Hazardous Products 1(discharge of waste water which contains one or more of the hazardoussubstances referred to in list 2C of Appendix 2 to title I of the Vlarem: seesection 3.5)Storage depots for environmentally dangerous substances, with theexception of those referred to in section 48, with a storage capacity of:
1. over 100 kg up to and including 1 tonne 32. over 1 tonne up to and including 100 tonnes 2 G
17.3.8
3. over 100 tonnes 1 G A E JFuel distribution installations for motor vehicles, i.e. installations for thefilling of fuel tanks of motor vehicles with liquid hydrocarbons intended topower the engine(s) fitted therein.1. establishments for the distribution of the liquids referred to in section
17.3.6.1° with a maximum of 1 distribution pipe3
2. establishments for the distribution of:a) the fuels referred to in section 17.3.6.2 with a maximum of 1distribution hose and/orb) fuels referred to in section 17.3.4.1 and 2 with a maximum of 1distribution hose
2
in which only the company's own vehicles are supplied 2
17.3.9
3 other establishments 1 B17.4 Storage depots, with the exception of those referred to under section 48,
and/or points of sale of the hazardous substances referred to in Appendix7 to title I of the VLAREM in packagings with a maximum capacity of 25litres or 25 kilograms, provided the maximum storage is between 50 kg or50 l and 5000 kg or 5000 l (EC directive 67/548/EEC of 27 June 1967concerning the application of the legal and administrative provisions onthe classification, packaging and marking of hazardous substances).
3
17.5 Devices that contain over 5 dm³ of PCBs and devices of which it can bereasonably assumed that the fluids therein contain between 0.05 and0.005% by weight of PCBs (EC directive 96/59/EC of 16 September1996) 4
3
1 This section concerns solid and liquid substances. Gases are classified in section 16.2 For the application of this section, "hazardous products" are considered as the substances referred to in Appendix 7 totitle I of the VLAREM.3 For the application of the classification criteria of this subsection, the main property and the flame point must be takeninto account. For liquid fuels, however, only the flame point needs to be taken into account.In this context, the "main property" is understood to mean the cataloguing according to EC directive 67/548/EEC of 27June 1967 concerning the classification, packaging and marking of hazardous substances and EC directive 88/379/EECof 7 June 1988 concerning the classification, packaging and marking of hazardous preparations. If a product is markedwith two or more hazard symbols, the most relevant risk must be taken into account. If this is not specified in the abovementioned EC directive, the classification of the ADR regulations must be followed as laid down by the Royal Decree of16 September 1991 concerning the transport of hazardous goods by road with the exception of explosive andradioactive substances as identified in the Belgian State Gazette of 18 June 1997.4 for power current condensors, the threshold applies to the total of the separate components of a combined device.
Annex 3
20.4 Chemical industry (also see section 7):Chemical establishments for the production of olefins, olefinderivatives, monomers and polymers not classified in section 7.31. with a production capacity of up to and including 10 tonnes per
year;2
20.4.1
2. with a production capacity of over 10 tonnes per year 1 G,M A P JChemical establishments for the manufacture of organic intermediateproducts, not classified in section 7:1. with a production capacity of up to 10 tonnes per year 2
20.4.2
2. with a production capacity of over 10 tonnes per year 1 G,M A P JEstablishments for the manufacture of basic inorganic chemicalproducts not classified in section 7:1. with a production capacity of up to and including 10 tonnes per
year2
2. with a production capacity of over 10 tonnes per year 1 G,M A P J
20.4.3
(Establishments for the disposal of toxic and dangerous waste byincineration: see sections 2.3.4)(Establishments for the treatment of other solid and liquid waste byincineration: see section 2.3.4)

Annexes
362 Waste Water and Waste Gas Treatment
Annex 4
CHAPTER 5.7: CHEMICALS
Section 5.7.1. General provisions
Art. 5.7.1.1
§ 1. The provisions of this chapter are applicable to the establishments specified in section 7 ofthe classification list.
§ 2. The substances falling within the scope of the regulations relating to hazardous substances,in particular the provisions of chapter 5.17, may only be brought into, stored at, used at andremoved from the establishment on condition that the provisions of the aforementionedregulations are strictly adhered to.
§ 3. For the application of these provisions, "production capacity" means: the total capacity foran uninterrupted working period of 24 hours, multiplied by the average number of days per yearduring which the installations can operate, under normal conditions as regards maintenance andsafety. This capacity is expressed in tonnes.
Art. 5.7.1.2
§ 1. The operator is responsible for the acceptance, manufacture, production, preparation,processing, handling, formulation, packaging and/or removal of the substances and products.
§ 2. Production of polychlorinated biphenyls (PCBs) and polychlorinated terphenyls (PCTs) isprohibited.
§ 3. Production of the chlorofluorocarbons (CFCs), bromofluorocarbons (BFCs or halons), ormixtures of them, specified in appendix 5.7, is prohibited.
§ 4. In accordance with article 11 of the EU Council regulation no. 3322/88 of 14 October 1988,operators of establishments where the CFCs and BFCs referred to in § 3 are manufactured, mustprovide the following information to the Commission of the European Community as well as tothe Environmental Licence Department, and this for each of the CFCs and BFCs referred to in§ 3:
1. at the latest two months after the date of the coming into force of the present order, withrespect to the year 1986, and for the whole of the period concerned:
a) the produced quantitiesb) the commercialised quantitiesc) the quantities used for their own accountd) the imported quantitiese) the exported quantitiesf) the quantities removed;
finally also the quantities in stock on 31 December of the year concerned must be indicated;
2. with respect to the CFCs, not later than 31 August of each year, for the preceding period of 1July to 30 June:
a) the produced quantitiesb) the commercialised quantitiesc) the quantities used for their own accountd) the imported quantitiese) the exported quantitiesf) the quantities removed;
finally also the quantities in stock on 30 June of the year concerned must be indicated;
Annexes
Waste Water and Waste Gas Treatment 363
3. with respect to BFCs, not later than 28 February of each year, for the preceding calendar year:a) the produced quantitiesb) the commercialised quantitiesc) the quantities used for their own accountd) the imported quantitiese) the exported quantitiesf) the quantities removed;
finally also the quantities in stock on 31 December of the preceding calendar year must beindicated.
§ 5. The production of the following substances is prohibited except when the production of oneor several of them is explicitly permitted in the environmental licence:
1. bromomethane;2. cyanogen, hydrocyanic (prussic acid) and its salts (cyanides);3. organic cyanides (nitriles).
Art. 5.7.1.3
§ 1. If an establishment is subject to a licence requirement because of its classification insection 7 of the classification list, any storage of dangerous substances must also meet theconditions of chapter 5.17 "Hazardous substances" of this order, providing that the storagequantities concerned fall within the scope of said chapter.However, in the environmental licence exceptions can be indicated with respect to theseparation distances between two groups and/or sub-groups with non-classified storagequantities. In such cases, the grounds for the exception must also be indicated.
§ 2. Unless specified otherwise in the environmental licence, bromomethane must be stored inpressure vessels with a contents of at most 100 kg of bromomethane per drum; the drums ofbromomethane must be placed vertically, with the closing device of the drum at the top; drumsof bromomethane must be protected against weather influences such as sunshine and rain andmay not be stacked; during storage, the closing devices of the drums of bromomethane must beprotected against mechanical damage by closing caps; empty drums must be stored as fulldrums;
§ 3. The construction of all spaces for the processing of hazardous products is provided in sucha way that accidentally spilt substances or leaked liquids can be collected.To prevent the spreading of fire, all spaces for the handling of extremely flammable and highlyflammable liquids must be constructed in such a way that accidentally spilt substances andleaked liquids end up in a collection device and are taken to one or more collection wells bymeans of collection channels.This collecting device may in no way be connected indirectly or directly to a public sewer, asurface water, a collecting basin for surface water, a ditch or a groundwater layer.The collection device and the collection wells must be regularly emptied, and at least after eachincident. The resulting waste flows must be disposed of in an appropriate manner.
§ 4. Without prejudice to any other relevant legal or regulatory provisions, the operator takes allmeasures required to sufficiently protect the surrounding area against the risks of fire andexplosion. This includes the mandatory availability of the necessary firefighting equipment. Thetype of firefighting equipment required and where it should be kept is determined afterconsultation with the authorised fire brigade. This matter is completely unrelated to theenvironmental licence.The firefighting equipment must be kept in a properly maintained condition, protected againstfrost, appropriately marked, easily accessible and placed in appropriate locations. It mustimmediately be able to be brought into operation.

Annexes
364 Waste Water and Waste Gas Treatment
§ 5. At the establishment, the necessary provisions must be present to prevent fire extinguishingwater contaminated with chemicals from draining into the ground, public sewers, surface orgroundwater. The collected contaminated fire extinguishing water must be disposed of in anappropriate fashion. The collection capacity for contaminated fire extinguishing water must bedetermined in consultation with the authorised fire brigade.
§ 6. All persons and staff working at the establishment must be fully aware of the nature of thesubstances and products manufactured and the dangers involved. Personnel must be wellinformed about the measures to be taken when irregularities occur. The operator is to provideup-to-date instructions as required. These instructions must be evaluated by the operator at leastonce per year.
Art. 5.7.1.4
§ 1. Unless specified otherwise in the environmental licence and as a derogation from thegeneral emission limit values specified in chapter 4.4, the emission limit values given below -expressed in mg/Nm3 and relating to the following circumstances: temperature 0 °C, pressure101.3 kPa, dry gas, or wet gas if steam ejectors are used - apply to the waste gases discharged:The quantities of air supplied to a part of the installation for the dilution or cooling of the wastegas are not taken into account with the calculation of the emission values.
1. propenenitrile:• in the gaseous effluent of the combustion plants for the production of propenenitrile,
irrespective of the mass flow: 0.2 mg/Nm3
• remaining, with a mass flow of 25 g/h or more: 5.0 mg/Nm3
2. the following organic substance, at a mass flow per substance of 100 g/h or more:1,2-dichloroethane:• with the production of this compound: 5.0 mg/Nm3
• in other cases: 20.0 mg/Nm3
3. total dust:plants for the production of biocides or active ingredients thereof, at a mass flow of 25 g/h ormore:• for highly toxic or highly bioaccumulative and persistent biocides: 5.0
mg/Nm³• for highly toxic, harmful or corrosive biocides: 20.0 mg/Nm³• for non-harmful biocides: 100.0
mg/Nm³
§ 2. Gaseous effluents are to be collected at the place they originate and, after any necessarypurification for compliance with the prevailing emission and immission conditions, dischargedinto the ambient air through a chimney stack. This chimney stack must be sufficiently tall to,from an environmental perspective, adequately disperse the discharged substances and not affectpublic health. The minimum height must be determined in accordance with the chimney stackheight calculation system as specified in art. 4.4.2.3.
Section 5.7.2 The production of titanium dioxide
Art. 5.7.2.1
The provisions of this section are applicable to the establishments referred to in subsection 7.1of the classification list, as far as these establishments belong to the sector of titanium dioxideproduction.

Annexes
Waste Water and Waste Gas Treatment 365
Art. 5.7.2.2
§ 1. The dumping of all solid wastes, strongly acid wastes, purifying waste materials, weaklyacid wastes or neutralised wastes is prohibited.
§ 2. For existing establishments the following transitional provisions apply:
1. for existing plants making use of the sulphate process:the discharge of weakly acid and neutralised wastes in all waters is restricted to a value of nomore than 800 kg total quantity of sulphate – i.e. corresponding to the SO4-ions in the freesulphuric acid and in the metal sulphates – per produced tonne of titanium dioxide.
2. for existing plants making use of the chloride process:the discharging of weakly acid wastes, purifying waste materials and neutralised wastes in allwaters is restricted to the following values for the total quantity of chloride – i.e.corresponding to the Cl-ions in the free hydrochloric acid and in the metal chlorides – perproduced tonne of titanium dioxide:• 130 kg when use is made of natural rutile• 228 kg when use is made of synthetic rutile• 450 kg when use is made of slag;in the case of an establishment that makes use of more than one kind of ore, the values applyin proportion to the quantities of the ores used.
Art. 5.7.2.3
For emissions into the atmosphere the following emission limitations apply:
1. for existing plants making use of the sulphate process:• emission limit value for dust: 50 mg/Nm3
• provisions must be made to prevent the emission of acid droplets• the emissions of SOx originating from the dissolution and roasting phases of titanium
dioxide production are restricted to a maximum of 10 kg SO2-equivalent per tonne oftitanium dioxide produced
• plants where the waste acids are concentrated may not discharge more than 500 mg/Nm3
of SOx, calculated as SO2-equivalent• plants where the salts originating from the purification of wastes are roasted, are to be
equipped with the best available techniques to reduce the SOx-emissions;
2. for existing plants making use of the chloride process:• emission limit value for dust: 50 mg/Nm3
• chlorine: - daily average of: 5 mg/Nm3
• instantaneous value of 40 mg/Nm3.
Art. 5.7.2.4
Regarding wastes from the titanium dioxide industry - and in particular wastes of which thedischarge or dumping into water or emission into the atmosphere is prohibited - the necessarymeasures must be taken in order to ensure that:
1. as far as possible they are not created, or that they are reused, insofar as this is possibletechnically and economically;
2. they are reused or disposed of without endangering human health and without adverse effectson the environment.
The same applies to wastes generated during the recycling or purification of the aforementionedwastes.

Annexes
366 Waste Water and Waste Gas Treatment
Art. 5.7.2.5
§ 1. The quantities of SO2, SO3 and acid droplets - expressed in SO2-equivalent - emitted bycertain plants, must be calculated taking account of the volume of gases emitted during thespecific activities concerned and the average SO2/SO3-content measured during the same period.The determination of the flow rate and of the SO2/SO3-content must be performed under thesame conditions of temperature and humidity.
§ 2. Without prejudice to the provisions of article 5.7.1.4 and of chapters 2.5 and 4.4, at one orseveral measurement stations located near the establishment in a location which isrepresentative for the pollution originating from the plant, the following must be monitored:
1. sulphur dioxide immissions, if use is made of the sulphate process for the production oftitanium dioxide;
2. chlorine immissions, if use is made of the chlorination process for the production of titaniumdioxide.
If no immission measuring station as referred to in the first paragraph is provided,measurements must be made at least 12 times per year of the total quantity of gaseous emissionsof sulphur dioxide and chlorine, respectively, from the production site.
§ 3. From 1 January 1995, unless specified otherwise in the environmental licence and as aderogation from the provisions of chapter 4.4, the SOx-emissions originating from thedissolution and roasting phases of the titanium dioxide production must be restricted to a valueof no more than 10 kg of SO2-equivalent per tonne of titanium dioxide produced.
Section 5.7.3. The production of sulphur dioxide, sulphur trioxide, sulphuric acid or oleum(fuming sulphuric acid)
Art. 5.7.3.1
§ 1. The provisions of this section are applicable to the sulphur dioxide, sulphur trioxide,sulphuric acid or oleum producing plants referred to in subsection 7.1 of the classification list.
§ 2. For the implementation of these provisions, the "conversion efficiency of SO2 to SO3" isdefined as follows:
conversion efficiency =
Art. 5.7.3.2
§ 1. If - in view of the gases used as raw material - it is technically possible from the viewpointof the best available techniques, the double-contact process must be used for the conversion ofSO2 to SO3. If it proves indispensable, in order to achieve the emission limitationscorresponding to the conversion efficiency values prescribed in § 4 of this article, the emissionsof SO2 and SO3 can be further reduced by making use of a fifth contact bed, or by means ofequivalent measures. The use of any alternative process is allowed, providing that such processis at least equivalent from the perspective of pollution control and in particular providing that itguarantees the same or higher conversion rates.
§ 2. The single-contact process (without intermediary absorption) is permitted only if gases withSO2-contents lower than 10 % are processed, or gases of which the SO2-contents are widelyvarying. If it proves indispensable, in order to achieve the emission limitations corresponding to
SO2(in) – SO2(out)________________________SO2(in)
x 100 (%)

Annexes
Waste Water and Waste Gas Treatment 367
the conversion efficiency values prescribed in § 4 of this article, the emissions of SO2 and SO3must be further reduced by alkaline scrubbing, or by means of equivalent measures.
§ 3. The wet catalytic process is allowed only with molybdenum sulphide roasting and for fluegas desulphurisation.
§ 4. The daily average conversion rate must be at least:
1. when use is made of the single-contact process:a) with a feed gas containing less than 6 % SO2, a conversion rate of at least 97.5 % must be
achievedb) with a feed gas containing 6 % SO2 or more, a conversion rate of at least 98.5 % must be
achieved;2. when use is made of the double-contact process:
a) with a feed gas containing less than 8 % SO2, a conversion rate of at least 99 % must beachieved
b) with a feed gas containing 8 % SO2 or more, a conversion rate must be achieved of atleast:• 99.5 % with varying gas conditions• 99.6 % with constant gas conditions;
3. when use is made of the wet catalytic process, a conversion rate of at least 97.5 % must beachieved;
4. when any other process is used, a conversion rate must be achieved of at least 99 %.
§ 5. As a derogation from the provisions of chapter 4.4, the following emission limit valuesapply for:
1. sulphur dioxide: 1700 mg/Nm3, without prejudice to theconversion rate prescribed in article5.7.5.1;
2. sulphur trioxide:• with constant gas conditions: 60 mg/Nm3;• in the other cases: 120 mg/Nm3.
§ 6. In addition, in the environmental licence limit values may be imposed for the mass flow ofthe SO3 and H2SO4 emissions (expressed in SO3) in the emitted waste gases.
§ 7. The conversion efficiency values indicated in § 4 of this article do not apply for SO3-generators of category 3 which are used to stimulate the emission of fly ash by the injection ofSO3 in the flue gases of heating installations. For the flue gases treated in this way, the SO3emission standards of the corresponding heating installation apply.
Section 5.7.4 The production of nitric acid
Art. 5.7.4.1
§ 1. The provisions of this section are applicable to the nitric acid producing plants referred to insubsection 7.1 of the classification list.
§ 2. As a derogation from the provisions of chapter 4.4, for nitrogen oxides in emitted gaseouseffluents - expressed in NO2 - an emission limit value applies of: 450 mg/Nm3.In addition, the gaseous effluents may only be emitted colourless into the ambient air. In orderto achieve this, and without prejudice to the limit value prescribed in the first paragraph, theNO2 emission may not exceed the value resulting from the calculation of the formula below:
NO2 concentration = 1200_________________________________open width of the chimney mouth in dm

Annexes
368 Waste Water and Waste Gas Treatment
Section 5.7.5 The production of chlorine
Art. 5.7.5.1
§ 1. The provisions of this section are applicable to the establishments referred to in subsection7.5 of the classification list.
§ 2. As a derogation from and supplementing the provisions of section 4.4.3, the followingemission limit values apply for:
1. chlorine:a) with plants for the production of chlorine with complete liquefaction: 6 mg/Nm3;b) in the other cases: 1 mg/Nm3;
2. mercury and its compounds:a) with a mass flow of 1 g/h or more: 0.2 mg/Nm3
b) with chlorine-alkali-electrolysis according to the amalgam process, the annual averageemissions of mercury in the air removed form the cell hall may not exceed: i. 1.5 g per tonne of chlorine produced, for new plants ii. 2 g per tonne of chlorine produced, for existing plants iii. the mercury in the hydrogen compounds emitted into the atmosphere or burned, isincluded in this limit value.
§ 3. The construction of new plants for the production of chlorine according to the mercurycathode process will no longer be licensed. After the year 2010, the mercury cathode processmay no longer be applied.
Section 5.7.6 The production of sulphur
Art. 5.7.6.1
§ 1. The provisions of this section are applicable to the sulphur producing plants referred to insubsection 7.1 of the classification list.
§ 2. With Claus-process plants, the following sulphur conversion efficiencies must be achieved:
1. with a production capacity of up to 20 tonnes of sulphur per day: 97 %;2. with a production capacity of between 20 and 50 tonnes of sulphur per day: 98 %;3. with a production capacity of over 50 tonnes of sulphur per day: 99 %.
Here, sulphur conversion efficiency must be understood as the proportion between the sulphurproduced and the sulphur in the feed gas.
§ 3. As a derogation from the provisions of section 4.4.3, the emissions of hydrogen sulphide inthe gaseous effluents may not exceed 10 mg/Nm3. To this end, the waste gases must be passedthrough an incinerator.
§ 4. The SO2-emission concentrations of Claus-process installations that form part of oilrefineries are regulated by article 5.20.2.2 ("Oil refineries") of chapter 5.20.
Section 5.7.7 The production of organic chemicals or solvents
Art. 5.7.7.1
§ 1. The provisions of this section are applicable to the establishments producing organicchemicals or solvents, referred to in section 7 of the classification list.

Annexes
Waste Water and Waste Gas Treatment 369
§ 2. The waste gases of plants for the production of 1,2-dichloroethane and of vinyl chloridemust be ducted to an air emission abatement installation for gaseous effluent. As a derogationfrom the provisions of section 4.4.3, for 1,2-dichloroethane in the emitted waste gases anemission limit value applies of 5 mg/Nm3.
§ 3. The waste gases from the reactor system and the absorber of an installation for theproduction of propenenitrile must be ducted to an incinerator. As a derogation from theprovisions of section 4.4.3, for propenenitrile in the emitted waste gases an emission limit valueapplies of 0.2 mg/Nm3. The waste gasses resulting from the purification of the reaction products(distillation) as well as the waste gases generated during the filling, must be ducted to ascrubber.
Section 5.7.8 The production of hydrocarbons in petrochemical plants not belonging to anoil refinery
Art. 5.7.8.1
§ 1. The provisions of this section are applicable to the establishments producing hydrocarbons,referred to in section 7.3 of the classification list.
§ 2. Waste gases discontinuously released by process plants such as gaseous effluents resultingfrom the regeneration of catalytic agents or with inspection and cleaning activities must beducted to a combustion facility, or equivalent abatement measures should be taken.
§ 3.Gaseous effluents released with the starting up or shutdown of an installation must, to theextent possible, be transported to a collection system for gaseous effluent or incinerated inprocess heating installations. If this is not possible the gases must be transported to a flare inwhich an emission level for organic substances of 1 % with respect to the total carbon contentmay not be exceeded.
§4. Gaseous effluents from desulphurisation installations or other sources with a volume levelof hydrogen sulphide of over 0.4 % and a mass flow of hydrogen sulphide of over 2 tonnes/daymust be further processed.Gaseous effluents which are not further processed must be ducted to an incinerator.As a derogation from the provisions of chapter 4.4, emissions of hydrogen sulphide in thedischarged gaseous effluent may not exceed 10 mg/Nm3.Hydrogen sulphide-containing water may only be processed in such a way that the release ofgaseous effluent into the atmosphere is avoided.
§ 5. With the transfer of base, intermediary and final products the emissions of organicsubstances with a vapour pressure of over 13.3 kPa at a temperature of 35 °C must be reducedby means of appropriate measures, such as by gas displacement systems, extraction and transferto an effluent gas purification installation.
§ 7. Process water may only be discharged into an open system after degassing. The gaseouseffluents collected here must be cleaned by washing or incineration.
Section 5.7.9 The production of carbon
Art. 5.7.9.1
§ 1. The provisions of this section are applicable to the plants producing carbon (hard lignite) orelectrographitic carbon (e.g. used in electrodes, current collectors or parts for appliances)referred to in subsection 7.1 of the classification list.

Annexes
370 Waste Water and Waste Gas Treatment
§ 2. As a derogation from the provisions of chapter 4.4, the emission limit values for organicsubstances in the gaseous effluent are as follows:
1. with mixing and moulding, from mixing and moulding installations where pitch, tar or othervolatile binders and liquefiers are processed at increased temperatures, expressed in totalcarbon: 100 mg/Nm3
2. with combustion, from furnaces with one chamber, furnaces with combined chambers andtunnel kilns, expressed in total carbon: 500 mg/Nm3
3. with combustion, from annular kilns for graphite electrodes and carbon blocks, expressed intotal carbon,: 200 mg/Nm3
4. with impregnation, from impregnating installations where tar-based impregnating agents areused, expressed in total carbon: 50 mg/Nm3.
Section 5.7.10 The manufacture of peroxides
Art. 5.7.10.1
§ 1. The provisions of this section are applicable to the establishments referred to in subsection7.6 of the classification list.
§ 2. Organic peroxides may only be manufactured if this is explicitly permitted in theenvironmental licence.The organic peroxides, which may explode or detonate in a violent thermal reaction, at theestablishment must be retained at a temperature lower than the temperature which from thepoint of view of safety is the permissible maximum temperature according to the nature of thesubstance concerned; for the substances indicated below, this maximum temperature is:• acetyl cyclohexane sulphonyl peroxide: –10 °C• amber acid peroxide: +10 °C• tert.-butyl peroxyisopropylcarbonate (BPIC): room temperature• tert.-butyl peroxypivalate: –10 °C• dibenzoyl peroxide: room temperature• dicyclohexyl peroxydicarbonate: +5 °C• diisopropyl peroxydicarbonate: –15 °C.
§ 3. The peroxides referred to in § 2 which must be kept at the establishment at a temperaturelower than room temperature, must be stored:
1. either in refrigerators or freezers located in the production building, in which case eachrefrigerator or freezer may contain a quantity of at most 30 kg non-refrigerated organicperoxides;
2. or in refrigerators or freezers, located in a detached storage building in which only the saidperoxides are stored. In this case each refrigerator or freezer may contain a quantity of atmost 150 kg non-refrigerated organic peroxides;
3. or in a detached cold store that is solely intended for this purpose. In this case, unlessspecified otherwise in the environmental licence, per cold store a quantity of at most 500 kgnon-refrigerated organic peroxides may be stored.

Annexes
Waste Water and Waste Gas Treatment 371
Section 5.7.11 The production of polyvinyl chloride
Art. 5.7.11.1
§ 1. The provisions of this section are applicable to the establishments producing polyvinylchloride referred to in section 7 of the classification list.
§ 2. At the transition from the closed system for polymerisation or drying to the open system,the residues of vinyl chloride (VC) in the polymerisate must be kept as low as possible. Withthis, the following maximum monthly average values may not be exceeded:• mass-PVC: 10 mg VC / kg PVC• suspension-homopolymerisates: 0.10 g VC / kg PVC• suspension-copolymerisates: 0.40 g VC / kg PVC• micro-suspension-PVC and emulsion-PVC: 1.5 g VC / kg PVC.
§ 3. To further reduce the mass concentration of vinyl chloride in the gaseous effluent, insofaras possible the spent gas of the drying plant must be used as combustion gas in heatinginstallations.
Section 5.7.12 The production of caprolactam
Art. 5.7.12.1
§ 1. The provisions of this section are applicable to the establishments producing caprolactam,referred to in section 7 of the classification list.
§ 2. With the production of caprolactam according to the Raschig-process, NO2-emissions maynot exceed 15 kg NOx/tonne of caprolactam produced.
Section 5.7.13 The production of polyacrylonitrile-based synthetic materials
Art. 5.7.13.1
§ 1. The provisions of this section are applicable to the establishments producingpolyacrylonitrile-based synthetic materials, referred to in section 7 of the classification list.
§ 2. The production and processing of propenenitrile-polymerisates for fibres.
1. For the emissions of propenenitrile in the gaseous effluent of the drying plants, an emissionlimit value of 20 mg/Nm3 applies.
2. The propenenitrile-containing spent gases originating from the reaction vessels, from theintensive waste gas purging, from the suspension tank and from the washing filter, must beducted to a spent gas scrubber or an adsorber. For the emissions of propenenitrile in thegaseous effluent of the adsorber, an emission limit value of 10 mg/Nm3 applies.
3. With the spinning into fibres of the polymer, the waste gas flows with an propenenitrile-content of over 5 mg/Nm3 must be ducted to an air emission abatement installation for spentgas.
§ 3. The production of ABS-resins
1. Emulsion polymerisation:the propenenitrile-containing gaseous effluents released during polymerisation, duringprecipitation or with the cleaning of the reactor, must be ducted to an incinerator; for theemissions of propenenitrile in the gaseous effluent of the drying plant an emission limit valueof 25 mg/Nm3 applies as monthly average;

Annexes
372 Waste Water and Waste Gas Treatment
2. Combined solution/emulsion polymerisation:the propenenitrile-containing gaseous effluents released from the reactors, duringintermediary storage, during precipitation, during dehydration, with the recycling of solventsand at the mixers, must be ducted to an incinerator; for the propenenitrile emissions releasednear the mixer exhaust, an emission limit value of 10 mg/Nm3 applies as monthly average.
§ 4. The production of nitrile rubber (NBR)The propenenitrile-containing spent gases released from the butadiene recycling, during theintermediary storage of the latex and with the washing of the solid rubber, must be ducted to anincinerator.The spent gases released during the recycling of the propenenitrile must be ducted to a spent gasscrubber.For the emissions of propenenitrile in the gaseous effluent of the drying plant an emission limitvalue of 15 mg/Nm3 applies.
§ 5. The production of dispersions by emulsion polymerisation of propenenitrileThe propenenitrile-containing gaseous effluents released from the monomer receiving vessels,the reactors, the intermediary storage tanks and from the condensers, must be ducted to a wastegas purification plant if the propenenitrile-content exceeds 5 mg/Nm3.
Section 5.7.14 The production and processing of viscose
Art. 5.7.14.1
§ 1. The provisions of this section are applicable to the establishments producing viscose,referred to in section 7 of the classification list.
§ 2. The spent gases from the viscose production, from the reprocessing of the spinning bathand from the post-treatment to produce textile rayon must be ducted to an air emissionabatement installation.As a derogation from the provisions of chapter 4.4, the emission limit values for the waste gasesare:
1. for hydrogen sulphide: 5 mg/Nm3 as daily average value2. for carbon disulphide: 0.10 g/Nm3 as daily average value.
§ 3. With the production of cellulose wool and cellophane, the gaseous effluents from thespinning machines and from the post-treatment must be ducted to an air emission abatementinstallation.As a derogation from the provisions of chapter 4.4, the emission limit values for the waste gasesare:
1. for hydrogen sulphide: 5 mg/Nm3 as daily average value2. for carbon disulphide: 0.15 g/Nm3 as daily average value.
§ 4. With the manufacture of viscose products for all gaseous effluents – including the airextracted from the various rooms and near the machines – the following emission limit valuesapply until 31 December 2001:
1. for hydrogen sulphide: 100 mg/Nm3 as daily average value2. for carbon disulphide: 600 mg/Nm3
3. for the sum of hydrogen sulphide and carbon disulphide: 650 mg/Nm3.
The best available techniques must be applied to maximally reduce and if possible prevent theemissions of hydrogen sulphide and carbon disulphide.
Annexes
Waste Water and Waste Gas Treatment 373
From 1 January 2002, and as a derogation from the provisions of chapter 4.4, the followingemission limit values apply for the gaseous effluent:
1. for hydrogen sulphide: 50 mg/Nm3 as daily average value2. for carbon disulphide different values apply according to the viscose product concerned:
a) cellulose wool: 150 mg/Nm3
b) cellophane: 150 mg/Nm3
c) rayon (textile): 150 mg/Nm3
d) synthetic casings: 400 mg/Nm3
e) synthetic chamois: 400 mg/Nm3
f) rayon (technical): 600 mg/Nm3.
Section 5.7.15 The production of enamel
Art. 5.7.15.1
The provisions of this section are applicable to the establishments producing enamel, referred toin section 7 of the classification list.
Art. 5.7.15.2
§ 1. As a derogation from the provisions of chapter 4.4, the emission limit values for gaseouseffluents from enamel production are:
1. for gaseous inorganic fluorides, expressed in hydrogen fluoride: 15 mg/Nm3, with 5 mg/Nm3
as guiding value;2. for nitrogen oxides (NOx), expressed in NO2: 15 kg per tonne of enamel produced as monthly
average, with a maximum concentration of 2200 mg/Nm3 and with 500 mg/Nm3 as guidingvalue.
§ 2. As a derogation from article 1.1.2, the concentrations indicated in § 1 are related to theactual oxygen content of the emitted gaseous effluents.
§ 3. Unless specified otherwise in the environmental licence, the emission values of thesubstances above must be measured continually using measuring equipment installed at theoperator's expense that is built and operated according to a code of good practice and which hasbeen approved by an environmental expert accredited in the discipline air.
Section 5.7.16 Batch processes in the production of fine chemicals and pharmaceuticals
Art. 5.7.16.1
For processes in the production of fine chemicals and pharmaceuticals the conditions for theemission limit value in mg/Nm3 for batch processes not exceeding 500 kg of pure final productper batch, are replaced by the following regulation:
the process must comply with a maximum total emission of at most 15 % of the solvents input.

Annexes
374 Waste Water and Waste Gas Treatment
Annex 5
CHAPTER 5.17 THE STORAGE OF HAZARDOUS PRODUCTS
Section 5.17.1 General provisions
Art. 5.17.1.1
§ 1. The regulations in this chapter are applicable to the establishments specified in section 17of the classification list. For the application of the provisions in this chapter, both the mainproperty and the flashpoint must be taken into account. For liquid fuels only the flashpoint mustbe taken into account.
§ 2. Short-term storage in connection with transport by road, rail, inland waterways, by sea orby air, including the loading and unloading and the transfer to or from another form of transportin ports, on quays or in railway yards is not subject to the conditions of these regulations.However, if the hazardous products referred to in these regulations are stored in storagefacilities located in ports, along quays or on railway yards and if these storage facilities areintended for the regular short-term storage of such hazardous products, then these storagefacilities are subject to the conditions of these regulations.
Art. 5.17.1.2
§ 1. Unless specified otherwise in the environmental licence, the operation of a category 1establishment for the storage of other than P1, P2, P3 or P4 products is prohibited:
1. in a water abstraction area or a type I, II or III protected zone2. in an area other than an industrial zone3. at a distance of less than 100 metres from:
a) a residential areab) parklandc) a recreation area.
§ 2. The prohibitory rules of § 1 do not apply:
1. for existing plants or parts of them, as specified in article 3.2.1.12. for hazardous products which are in a physico-chemical state such that they do not have any
properties that might result in a serious accident, insofar as this has been confirmed by anexpert accredited for the discipline external safety and risks for serious accidents
3. for hazardous products belonging to the actual operation of a public water abstraction.
§ 3. Unless specified otherwise in the environmental licence, the operation of a tank farm for thestorage of other than P1, P2, P3 or P4 products is prohibited in a water abstraction area or a typeI, II or III protected zone:
§ 4. Unless specified otherwise in the environmental licence, the storage of the followingsubstances is prohibited :1. bromomethane2. cyanogen, hydrogen cyanide (prussic acid) and its salts (cyanides)3. organic cyanides (nitriles).

Annexes
Waste Water and Waste Gas Treatment 375
Art. 5.17.1.3
§ 1. Unless specified otherwise in the environmental licence, at the entrance to category 1establishments for which article 7 of title I of Vlarem is applicable, an identification andinformation sign of at least 1 m2 must be placed, indicating at least the information below in aclearly readable way:
1. "VR-PLICHTIG BEDRIJF" (enterprise required to submit a safety report) if in accordancewith article 7 § 3 of title I of VLAREM it concerns an enterprise for which a safety report isrequired, or"GEVAARLIJKE STOFFEN" (hazardous substances), at establishments for which article 7 §1 and § 2, of title I of VLAREM is applicable
2. the operator’s name, address and phone number3. the contact and emergency (fire brigade) phone numbers.
§ 2. At the entrance to establishments for which article 7 of title I of VLAREM is applicable, anup-to-date site plan of the establishment must be kept inside a fireproof cabinet that is easilyaccessible to the emergency services. For all storage facilities for hazardous products at theestablishment, the following information must be clearlymarked on this site plan:
1. the exact location2. the chemical and/or technical names of the hazardous product, with the specification of the
classification according to EC directives 67/548/EEC of 27 June 1967 or 88/379/EEC of 7June 1988 and of the UN number
3. the specification whether it concerns storage in:a) mobile receptaclesb) fixed aboveground containersc) buried containersd) containers placed in a trench;
4. the maximum storage capacity in tonnes or m3
5. the normal storage temperature in °C and the storage pressure in Pa.
§ 3. The cabinet referred to in § 2 bears the notice "GS-SITUATIEPLAN" ("hazardousmaterials site plan"), in black letters with a height of at least 8 centimetres on a yellowbackground. If this cabinet is kept locked, either:
1. the key to the lock in question must be kept next to the cabinet, behind a protective glasscover that can be broken with a little hammer in an emergency
2. or the cabinet itself must be closed with a protective glass front that can be broken with alittle hammer in an emergency.
§ 4. The conditions specified in § 2 and § 3 may be derogated from if an alternative system isused that is accepted by the Environmental Licence Department and which offers at least thesame guarantees as regards information.
§ 5. The necessary provisions must be put in place to make the installation inaccessible tounauthorised persons.
§ 6. The provisions of § 5 are not applicable to storage facilities for liquid fuels which form partof a fuel distribution installation for motor vehicles.
Art. 5.17.1.4
§ 1. The leak-tightness of the piping, the couplings, the valves and all accessories must beensured. They must be protected against corrosion in an effective way.

Annexes
376 Waste Water and Waste Gas Treatment
§ 2. The non-accessible pipes must be fitted in a ditch that must be filled in with a fine-grainedinert material. This ditch must be impervious and must slope down to an impervious collectionwell.This system may be replaced by an alternative system which offers the same guarantees asregards the prevention of ground and/or groundwater pollution. The alternative system must beaccepted by an environmental expert accredited in the discipline containers for gases orhazardous substances. A certificate of this acceptance is drawn up and signed by theaforementioned environmental expert. This certificate is kept available for the perusal of thesupervisory official. A copy of the certificate will be forwarded by the operator to theEnvironmental Licence Department.
§ 3.The fitting of piping for the transport of P1 and/or P2 products inside spaces is prohibited,except if such piping is made of a single tube (no couplings with seals), or if the spaces havebeen laid out and zoned in accordance with the requirements referred to in the generalregulations for electrical installations, in particular the articles dealing with spaces in which anexplosive atmosphere can originate.
Art. 5.17.1.5
§ 1. Without prejudice to further provisions, the necessary precautionary measures must betaken to prevent products from coming into contact with each other if:
1. this could result in dangerous chemical reactions2. such products could react with each other to form harmful or dangerous gases and vapours3. contact between such products could result in explosions and/or fire.
§ 2. If at the establishment products with different main properties are stored, the storage facilitymust be subdivided into different compartments, with in each compartment only products beingstored with the same main properties.These compartments must be delimited by means of walls, safety screens, markings on theground, chains or fixed demarcations at a height of 1 metre.However, products with different main properties may be stored together in a singlecompartment if according to appendix 5.17.1 the minimum separation distance between theproducts is 0 metres.
§ 3. Any manufacturing operation or other treatment not concerned with the storage or transferof the products is prohibited inside the storage facilities and the zones delimited by theseparation distances and/or screens prescribed in appendix 5.17.1
§ 4. The products may not be stored outside the storage spaces intended for this purpose.Contaminated empty mobile receptacles that have contained hazardous products must be storedin a dedicated place that must be clearly indicated.
Art. 5.17.1.6
§ 1. With respect to aboveground compartments for products with a specific main property,minimum separation distances as indicated in appendix 5.17.1 are to be observed.
§ 2. The distances specified in § 1 may be reduced by the construction of a safety screen, on thecondition that the distance measured horizontally around this screen between the compartmentconcerned and the elements indicated in appendix 5.17.1 is equal to or larger than the minimumsafety distances prescribed in § 1.The safety screen must be made either of brickwork with a thickness of at least 18 cm, or ofconcrete with a thickness of at least 10 cm, or of any other material with a thickness providing

Annexes
Waste Water and Waste Gas Treatment 377
an equivalent fire-resistance coefficient. The screen has a height of at least 2 m and must exceedthe maximum height of the receptacles or containers stored by at least 0.5 m.
§ 3. The aforementioned minimum separation distances may be diverted from in theenvironmental licence, if necessary and in particular on the basis of the results specified in thesafety report or on the basis of a risk analysis drawn up by an expert accredited for the disciplineexternal safety and risks for serious accidents.
§ 4. Unless specified otherwise in the environmental licence, the stipulations of distances to beobserved do not apply to:
1. products stored in laboratories2. products for which the total storage capacity for a specific main property per storage facility
is less than the lower limit indicated in category 3 of the corresponding classification section3. storage facilities as referred to in section 17.4.
Art. 5.17.1.7
§ 1. The necessary measures (e.g. earthing) must be taken to prevent the formation of hazardouselectrostatic charges with the storage and handling of explosive, extremely flammable, highlyflammable and flammable products.
§ 2. The spaces where hazardous products are stored may only be heated by means ofappliances of which the location and use offer sufficient guarantees against any fire hazard ordanger of explosion.
§ 3. In the spaces where hazardous products are stored:
1. no work may be carried out for which the use is required of an appliance that works withnaked flame or which may generate sparks, with the exception of maintenance and/or repairwork, on the condition that the necessary precautions have been taken and subject toinstructions in writing being drawn up and/or initialled by the head of the Prevention andProtection Department or by the operator
2. a smoking ban applies; this smoking ban must be indicated in clearly readable letters or withthe regulatory signs on the outside of the entrance doors and inside the spaces in question; theobligation to post the prescribed "no smoking" pictogram does not apply if this pictogram isposted at the entrance to the enterprise and if the ban on smoking and on open fire applies forthe whole of the enterprise
3. the chimney stacks and the discharge ducts for the extracted vapours and emanations must bemade of non-combustible or self-extinguishing materials.
§ 4. It is forbidden:
1. to smoke, light a fire or store combustible substances above or near the containers, near thepumps, the piping, the dispensing units, the filling areas and the unloading site for roadtankers, within the bounds of the zoned locations as shown in the zoning plan, anddemarcated according to the general regulations for electrical installations
2. to wear shoes or clothing that may cause sparkover in the places that are not accessible to thepublic.
3. to store flammable products in any location within the establishment where temperatures mayexceed 40 °C as a result of heat generated by technological means.
§ 5. The prohibitory rules indicated in § 4 must be made clear using safety pictograms inkeeping with the Labour Welfare Code, to the extent that such pictograms are available.

Annexes
378 Waste Water and Waste Gas Treatment
Art. 5.17.1.8
§ 1. Without prejudice to any other relevant legal or regulatory provisions, the operator takes allmeasures required to sufficiently protect the surrounding area against the risks of fire andexplosion.One of the implications of this is that the necessary firefighting equipment must be provided.The type of firefighting equipment required and where it should be kept is determined afterconsultation with the authorised fire brigade. This matter is completely unrelated to theenvironmental licence.The firefighting equipment must be kept in a properly maintained condition, protected againstfrost, appropriately marked, easily accessible and placed in appropriate locations. Thefirefighting equipment must be able to be deployed immediately.
§ 2. At the establishment, in consultation with the authorised fire brigade the necessaryprovisions must be present to prevent fire extinguishing water contaminated with dangerousproducts from draining into the ground, public sewers, surface or groundwater. The collectedcontaminated fire extinguishing water must be disposed of in an appropriate fashion. Thecollection capacity for contaminated fire extinguishing water must be determined inconsultation with the authorised fire brigade.
Art. 5.17.1.9
§ 1. The electrical installations, appliances and lighting appliances must meet the requirementsof the General Regulations for Labour Safety or of the general regulations for electricalinstallations, in particular the articles dealing with spaces in which an explosive atmosphere canoriginate.
§ 2. Without prejudice to the regulatory provisions, in zones where there is danger of fire andexplosion because of the possible accidental presence of an explosive mixture, electricalinstallations must be designed and installed according to the conditions of a zoning plan.
§ 3. With respect to installations for which the general regulations for electrical installations arenot as yet applicable, the zoning is to take place in accordance with the provisions of article 105of the said general regulations.
Art. 5.17.1.10
§ 1. Containers intended for the storage of extremely toxic, toxic, harmful or corrosive liquidswith a vapour pressure of over 13.3 kPa at a temperature of 35 °C, must be equipped with aneffective system to restrict to a minimum the air pollution during storage and handling, such as avapour recovery system, a floating roof, or another equivalent system.
§ 2. With the loading and unloading of storage containers and/or supplying road tankers, railtankers or tanker vessels containing the liquids referred to in § 1, air pollution must be restrictedto a minimum.
Art. 5.17.1.11
§ 1. Without prejudice to the obligations from article 7 of title I of VLAREM, the operator of acategory 1 establishment must keep a register or alternative data carrier in which, per mainproperty, at least the nature and quantities of the stored hazardous products are specified.This information must be stored in such a way that it is possible at all times to determine thequantities of hazardous products present at the establishment.

Annexes
Waste Water and Waste Gas Treatment 379
§ 2. The register or alternative data carrier referred to in § 1 is to be kept available on site for thesupervisory official for a period of at least 1 month.
Art. 5.17.1.12
All personnel at the establishment must be fully aware of the nature of the hazardous productsstored and the dangers involved. Personnel must be well informed about the measures to betaken when irregularities occur.The operator must be able to prove that he has provided up-to-date instructions as required tothis end.These instructions must be evaluated by the operator at least once per year.
Art. 5.17.1.13
Unless specified otherwise in the environmental licence, solid products that are hazardousbecause of the concentration of leachable substances as specified in appendix 2B and/or inappendix 7 of title I of VLAREM, must be stored op an impervious base equipped with acollection system for possibly contaminated rainwater.Extremely toxic and toxic products, products susceptible to spontaneous ignition, productsreacting with water to form combustible gases and explosive products must be stored inside orunder a shelter on an impervious floor.In any event the necessary measures must be taken to prevent the product from infiltrating orbeing released into the public sewers, a groundwater layer or a surface water.
Art. 5.17.1.14
§ 1. Measures must be taken to ensure an effective supervision of the different spaces andstorage facilities at the establishment.If the total storage capacity at the establishment is 1 million litres of P1 and P2 products ormore, the supervision must be continuous - by dedicated security personnel or by means of apermanent surveillance system equipped with effective smoke, gas or fire detection and whichraises the alarm with a permanently manned security service. All this in consultation with theauthorised fire brigade and an expert accredited for the discipline external safety and risk’s forserious accidents.
§ 2. The buildings, containers, bunds, embankments, appliances, etc., must be kept in perfectlymaintained condition. Any fault or defect that may jeopardise the protection of man and theenvironment must be remedied forthwith.
Art. 5.17.1.15
§ 1. Before repairs to or internal inspections of containers having contained P1 and/or P2products may be carried out, the establishment must dispose of a procedure for such activitiesthat has been initialled either by the operator or by the head of the Prevention and ProtectionDepartment. One of the elements of such procedure must be the cleaning of the container,proceeding according to a method that offers sufficient guarantees as regards both fire andexplosion safety as well as environmental protection.
§ 2. At the workshop for the repair of containers for P1 and/or P2 products, no P1 and/or P2products may be stored.

Annexes
380 Waste Water and Waste Gas Treatment
Art. 5.17.1.16
§ 1. The drawing off of P1 and/or P2 products into mobile receptacles must be performed eitherin the open air or in a well-ventilated space constructed with non-flammable materials. Thenecessary measures must be taken to prevent dangerous electrostatic charges from beinggenerated during the drawing off. This place or space must be provided with signs according tothe General Regulations for Labour Safety indicating a fire hazard.
§ 2. The floor of the space referred to in § 1 must be impervious and made of non-flammablematerials. It must be constructed in such a way that accidentally spilt substances and leakedliquids are drained into a collection device and subsequently are taken to one or more collectionwells by means of collection channels. This collecting device may in no way be connectedindirectly or directly to a public sewer, a surface water, a collecting basin for surface water, aditch or a groundwater layer.
§ 3. If P1 and/or P2 products are stored in aboveground containers, the filling of the mobilereceptacles must be performed in a suitable filling area located at least 10 metres from thecontainers or completely outside the bund.
§ 4. P1 and/or P2 products must be handled in such a way that spillage of the liquids on thefloor is avoided.
§ 5. P1 and/or P2 products must be stored in closed receptacles offering all guarantees ofsealing. In addition, the sealing must be checked immediately after the filling. Receptaclesfound to be defective in this respect must immediately be emptied and removed from the spacewhere the filling takes place.
§ 6. The maximum quantities of P1 and/or P2 products (number of mobile receptacles, etc.) thatmay be present in the spaces where the filling of the mobile receptacles takes place, may berestricted in the environmental licence.
Art. 5.17.1.17
With respect to the filling of fixed containers and road tankers the following regulations apply:
1. the necessary measures must be taken to prevent spillages of liquids and pollution of theground, groundwater and surface water
2. the flexible hose used for the filling must be connected to the opening of the container or theconduit by means of a device with screw coupling or an equivalent system
3. each filling operation must be performed under the supervision of the operator or hisappointee; said supervision must be organised in such a way that the filling operation can bemonitored and that immediate action can be taken in the event of an incident
4. to prevent overfilling all fixed containers must be equipped with an overfilling protection,which may be:a) either a warning system, giving an acoustic signal which the supplier must always be able
to hear in the filling area and which informs the supplier that the container to be filled is95 % full; this system may be mechanical or electronic
b) or a safety system, which automatically shuts off product flow as soon as the container tobe filled is at most 98% full; this system may be mechanical or electronic
c) at storage facilities forming part of a fuel distribution installation for motor vehicles, asafety system of the type indicated in b) must be used
5. all containers must be equipped with the possibility to measure the level7. the filling position for the road tanker, the zones where the nozzles of the filling pipes are
grouped and the filling zones at the distribution installation must always be located on thepremises of the establishment and must:

Annexes
Waste Water and Waste Gas Treatment 381
a) provide sufficient strength of ground and be impervious;b) be equipped with the necessary gradients and possibly also with upright edges, to ensure
that all spilt liquids drain to a collection system; the elimination of collected liquids iseffected in accordance with regulatory provisions, in particular those relating to thedisposal of waste materials;
for P1 and/or P2 products this filling position and these zones must always be located in theopen air or under a shelter;no trenches, crawl spaces or rooms may be present under the aforementioned filling positionand zones; in the case of weighbridges, effective arrangements must be made to limit thespreading of leaks and to preclude any danger of explosion;the provisions of this paragraph are not applicable to storage sites for products only intendedfor the heating of buildings.
7. during filling with P1 or P2 products, measures must be taken to divert static electricity; theelectrical connection between the road tanker and the container must be made before thefilling operation is commenced and may only be broken after the filling hose has beenuncoupled when the filling is completed;
8. adequate measures must be taken to maintain the storage at atmospheric pressure;the underground ventilation and vapour recovery piping must fulfil the same requirements asthe rest of the piping; in addition, the aboveground ventilation piping must have sufficientmechanical strength
9. it is forbidden to fill a container with another liquid than the one for which the container hasbeen designed, unless after an inspection by an environmental expert accredited in thediscipline containers for gases or hazardous substances or by an authorised expert, provingthat the container in question is suitable for such other liquid.
Art. 5.17.1.18
The overfilling protection described in appendix 5.17.7 must be manufactured in accordancewith a code of good practice accepted by an environmental expert accredited in the disciplinecontainers for gases or hazardous substances.The control of the construction must be performed in accordance with the selected code of goodpractice by an environmental expert accredited in the discipline containers for gases orhazardous substances.The control of the construction for overfilling protection devices manufactured in series may belimited to a single approval of the prototype. The approval of the prototype must be performedby one of the aforementioned environmental experts and in accordance with the procedure ofappendix 5.17.7.The report on the approval mentions the controls carried out and must be signed by theaforementioned expert.For each overfilling protection device the operator must dispose of a certificate signed by theconstructor. This certificate must mention the number of the prototype approval certificate andthe name of the environmental expert who issued the test certificate (and his accreditationnumber). The constructor also confirms in the certificate that the overfilling protection has beenbuilt and controlled in accordance with the provisions of title II of VLAREM.
Art. 5.17.1.19
§ 1. Organic peroxides which may explode or detonate in a violent thermal reaction must beretained at the establishment at a temperature lower than the temperature which from the pointof view of safety is the permissible maximum temperature according to the nature of thesubstance concerned. For the substances indicated below, this maximum temperature is:

Annexes
382 Waste Water and Waste Gas Treatment
1. acetyl cyclohexane sulphonyl peroxide: –10° C2. succinic acid peroxide: +10° C3. tert-butyl peroxyisopropylcarbonate (BPIC): room temperature4. tert.-butyl peroxypivalate: –10° C5. dibenzoyl peroxide: room temperature6. dicyclohexyl peroxydicarbonate: +5° C7. diisopropyl peroxydicarbonate: –15° C.
§ 2. Peroxides which for reasons of safety must be kept at the establishment at a temperaturelower than room temperature, must be stored:
1. either in refrigerators or freezers located in the production building, in which case eachrefrigerator or freezer may contain a quantity of at most 30 kg non-refrigerated organicperoxides
2. or in refrigerators or freezers located in a detached storage building in which only the saidperoxides are stored. In this case each refrigerator or freezer may contain a quantity of atmost 150 kg non-refrigerated organic peroxides
3. or in a detached cold store that is solely intended for this purpose. In this case, unlessspecified otherwise in the environmental licence, per cold store a quantity of at most 500 kgnon-refrigerated organic peroxides may be stored.
Art. 5.17.1.20
As regards the construction certificates, inspections and tests prescribed in this chapter, theoperator must dispose of certificates in which the codes of good practice applied, the controlscarried out and the relevant observations are clearly indicated. He must at all times keep thecertificates concerned at the disposal of the supervisory official.
Art. 5.17.1.21
Without prejudice to the provisions of this chapter, the transport, the installation and connectionof containers must be performed according to the prevailing Belgian or European standards.
Section 5.17.2 Storage of hazardous liquids in underground containers
Art. 5.17.2.1
§ 1. The necessary measures must be taken to give maximum protection to the containersagainst mechanical damage and corrosion.
§ 2. It is forbidden to place containers intended for the storage of P1 and/or P2 products directlyunder a building or under a vertical projection of a building. A lean-to is not considered as abuilding.
§ 3. The distance between the container and the boundaries of the parcels of third parties mustbe at least 3 metres. The distance between the container and the basement space of thecompany's own buildings must be at least 2 m. The distance between the container and the wallof the establishment's own buildings must amount to at least 0.75 m. The distance between thecontainers themselves must amount to at least 0.5 m.The distance between containers for P3 and/or P4 products which do not form part of adistribution installation and the boundaries of the parcels of third parties must amount to at least1 m.

Annexes
Waste Water and Waste Gas Treatment 383
§ 4. In the event of possible flooding or high water levels, the necessary provisions must beinstalled to prevent empty containers from being floated upwards.
§ 5. Without prejudice to the requirements referred to in this section, storage sites for petrol andtheir associated installations must comply with the provisions of section 5.17.4.
Art. 5.17.2.2
§ 1. A notice is to be provided in a clearly visible place by the container in accordance with theprovisions of appendix 5.17.2.
§ 2. The following information is to be shown near the filling opening and near the manhole:
1. the number of the container2. the name or the code numbers or letters of the stored liquid3. the danger symbols4. the water content capacity of the container.
The information must be clearly readable.The provisions of this paragraph do not apply to storage sites for P3 and/or P4 products whichare only intended for the heating of buildings.
Art. 5.17.2.3
§ 1. The venting pipe must open into the open air at least 3 metres above ground level and atleast 3 metres from each opening in a space and the boundaries of the parcels of third parties.Outlets of venting pipes may not be located under construction parts such as, e.g. roofoverhangs.
§ 2. The provisions of § 1 are not applicable to venting pipes belonging to storage sites for P3and/or P4 products which do not form part of a fuel distribution installation for motor vehicles.For these storage sites it is to be ensured that the place and the height of the outlet of the ventingpipe does not excessively cause nuisance to the vicinity, particularly as a result of the filling ofthe containers
§ 3. For the storage of P1 and/or P2 products the air supply and discharge system must be shutoff by an appliance that prevents the spreading of fire.
Art. 5.17.2.4
§ 1. Storage in containers directly buried in the ground is only permitted in:
1. double-walled metal containers which have been manufactured according to the provisions ofappendix 5.17.2
2. containers of reinforced thermoset synthetics which have been manufactured according to theprovisions of appendix 5.17.2
3. stainless steel containers which have been manufactured in accordance with a code of goodpractice accepted by an environmental expert, accredited in the discipline containers for gasesor hazardous substances, or accepted by an authorised expert
4. a storage system which provides the same guarantees of the prevention of soil and/orgroundwater pollution as the aforementioned containers
this storage system must be accepted by an environmental expert accredited in the discipline ofcontainers for gases or hazardous substances; a certificate of this acceptance is drawn up and
Annexes
384 Waste Water and Waste Gas Treatment
signed by the aforementioned environmental expert; this certificate is kept available for theperusal of the supervisory official; a copy of the certificate will be forwarded by the operator tothe Environmental Licence Department.
§ 2. All containers must be provided with a permanent leak detection system. This obligationdoes not apply for containers of reinforced thermoset synthetics or stainless steel located outsidea water abstraction area or a protected zone, and of which the individual water content capacityamounts to less than 5000 l, or less than 10000 l if these containers are for the storage of P3and/or P4 products.The leak detection system must detect a leak inside an interstitial space formed either by anadditional, solid or flexible impervious inside or outside casing, or by an impervious coat on thewalls and the bottom of the excavation, and must meet the corresponding provisions ofappendix 5.17.3.
§ 3. For the installation of a metal container with an individual water content capacity from5000 l, or for the storage of P3 and/or P4 products from 10000 l and the associated ducts:
1. in a water abstraction area or a protected zone type I or II, or2. in an area surrounding electrical conductors where major stray currents can be present, the
corrosiveness of the soil and of the filling-in soil must be specified and categorised by anenvironmental expert accredited in the discipline soil corrosion according to the methodmentioned in appendix 5.17.5.
Here the corrosiveness of the soil at the deepest point in the place where the metal container isto be installed, or the filling-in soil is to be categorised as ‘barely corrosive’, ‘moderatelycorrosive’, ‘corrosive’ or ‘highly corrosive’.The determining of the corrosiveness may not take place under extreme circumstances ofdrought or frost.The provisions of this paragraph may be departed from if the corrosiveness of the soil andfilling-in soil has already been determined during the last five years or when without a prior soilcorrosiveness investigation cathodic protection is applied. The application of this cathodicprotection must take place under the supervision of an environmental expert accredited in thediscipline soil corrosion.
§ 4. Cathodic protection:
1. if the result of the inspection mentioned in § 3 is ‘corrosive’ or ‘highly corrosive’, cathodicprotection must be applied
2. if the result of the examination mentioned in § 3 is ‘moderately corrosive’, it may initially bedecided to not install cathodic protection. In this case, corrosion monitoring on the basis ofpermanent or periodic potential measurements must be provided for; with a potentialmeasurement more positive than -500 mV compared to a Cu/CuSO4 reference electrode,indicating possible corrosion or stray currents, cathodic protection must be applied
3. if the result of the inspection specified in § 3 is ‘barely corrosive’ and the container isadequately cladded, cathodic protection is not required.
The cathodic protection must bring the whole surface of the container, including the metal ducts(if this proves necessary), to a potential of -850 mV or a greater negative value measured withrespect to a Cu/CuSO4 reference electrode. In anaerobic soils his potential must amount to atleast -950 mV.
§ 5. The containers must be covered by a layer of earth, sand or another adapted inert material atleast 50 cm thick.Measures must be taken to prevent the passage of vehicles or the storage of goods above thecontainers, unless these are protected by a non-flammable and sufficiently resistant floor.

Annexes
Waste Water and Waste Gas Treatment 385
Art. 5.17.2.5
§ 1. Storage in containers placed in a trench is only allowed in:
1. single- or double-walled metal containers which have been manufactured according to theprovisions of appendix 5.17.2
2. containers of reinforced thermoset synthetics which have been manufactured according to theprovisions of appendix 5.17.2
3. containers of stainless steel manufactured according to a code of good practice which hasbeen approved by an environmental expert accredited in the discipline containers for gases orhazardous substances, or by an authorised expert
4. a storage system which provides the same guarantees of the prevention of soil and/orgroundwater pollution as the aforementioned containers; this storage system must beaccepted by an environmental expert accredited in the discipline of containers for gases orhazardous substances; a certificate of this acceptance is drawn up and signed by theaforementioned environmental expert; this certificate is to be kept available for the perusal ofthe supervisory official; a copy of the certificate will be forwarded by the operator to theEnvironmental Licence Department.
§ 2. All containers must be provided with a permanent leak detection system. This obligationdoes not apply for containers of reinforced thermoset synthetics or stainless steel which arelocated outside a water abstraction area or a protected zone, and of which the individual watercontent capacity is less than 5000 l, or less than 10000 l if these containers are for the storage ofP3 and/or P4 products.The leak detection system must meet the provisions of appendix 5.17.3.
§ 3. The trench must be built according to the provisions of appendix 5.17.6. The walls may notmeet any property boundaries.
§ 4. At the lowest point of the trench the necessary provisions must be installed to be able toregister and remove any leaked liquid or water.
§ 5. It is forbidden to give the trench any other purpose than that of storage space for thecontainers. Only the ducts required for the operation of the containers placed therein may bebrought through the trench.
§ 6. If the container has a content greater than 2000 l, there is to be a free space around thecontainer at least 50 cm wide to make possible the inspection of the container.
§ 7. Unless specified otherwise in the environmental licence, the filling in of the trench iscompulsory for the storage of P1 and/or P2 products.If the trench is filled up, between the container and the wall of the trench there must be adistance of at least 30 cm, and account is to be taken of the provisions of appendix 5.17.6 to thisorder.
§ 8. Measures must be taken to prevent the passage of vehicles or the storage of goods above thetrench, unless these are protected by a non-flammable and sufficiently resistant floor.
§ 9. A prefab construction, consisting of a concrete cylindrical container in which a single-walled metal container is placed, is only allowed for the storage of P3 and/or P4 productsintended for the heating of buildings with a water content capacity of max. 5300 l and if themetal container and the prefab concrete cylindrical container has been built as a prototypeaccepted by an environmental expert accredited in the discipline containers for gases orhazardous substances or by an authorised expert.

Annexes
386 Waste Water and Waste Gas Treatment
Art.5.17.2.6
§ 1. The monitoring of the construction must take place in accordance with the provisions ofappendix 5.17.2.The monitoring of separately constructed containers is done by an environmental expertaccredited in the discipline containers for gases or hazardous substances, or by an authorisedexpert.The control of containers installed in series may be limited to one prototype. The approval ofthe prototype is given by an environmental expert accredited in the discipline containers forgases or hazardous substances, of which the accreditation allows the approval of prototypes.The report on this approval mentions the controls carried out and must be signed by theaforementioned expert.
§ 2. For each container the operator must dispose of a "declaration of conformity of thecontainer" signed by the constructor, drawn up according to the specimen form in appendix5.17.2.The containers must be provided with the identification plate applied by the constructor.
Art. 5.17.2.7
Before the installation of the container, either directly in the ground or in a trench, it must bechecked whether the container and where appropriate also the trench meet the conditions ofthese regulations.After installation but before the bringing into use of the container, it must be checked whetherthe container, the ducts and the accessories, overfilling warning or safety system, the leakdetection system and, where appropriate, the cathodic protection and the provisions for vapourrecovery comply with the conditions of these regulations.The specified controls must be carried out under the supervision of an environmental expertaccredited in the discipline containers for gases or hazardous substances or an authorised expert,or with a technician accredited for the storage of P3 and/or P4 products intended for the heatingof buildings.The monitoring of any cathodic protection must take place in collaboration with anenvironmental expert accredited in the discipline soil corrosion.
Art. 5.17.2.8
§ 1. At least once a year for containers located in water abstraction areas and protected zonesand every two years for containers located in the other areas, the installation must be subjectedto a limited examination, comprising if relevant:
1. perusal of the previous report or certificate2. the checking of the good state of the overfilling protection3. checking for the presence of water and sludge in single-walled containers for liquid fuels
(appendix 5.17.4)4. an inspection for any visible or organoleptically observable pollution on the surface outside
the container (appendix 5.17.4)5. an examination of the state of the external visible parts of the container, the valves, ducts,
pumps, etc.6. the checking of the effectiveness of any cathodic protection or corrosion monitoring7. the checking of the effectiveness of the leak detection system8. the checking of the effectiveness of the provisions for vapour recovery.

Annexes
Waste Water and Waste Gas Treatment 387
§ 2. Except for containers of reinforced thermoset synthetics, at least every 10 years forcontainers located in a water abstraction areas and protected zones, and every 15 years forcontainers located in other areas, the installation must be subjected to a general inspection,comprising:
1. the limited examination as specified in § 12. the state of the inner wall with an observed major presence of water or sludge; if an internal
inspection is required the container must be internally cleaned; to the extent technicallypossible, the inner wall and the internal parts of the container must be investigated, and whereappropriate a non-destructive inspection will be carried out to determine the wall thickness ofthe container
3. the state of the outer cladding, to the extent technically possible and without the containerhaving to be exposed for this
4. where appropriate, in particular in the situation described in article 5.17.2.4, § 3, the detectionof possible corrosion on the basis of a potential measurement and a measurement of thecorrosiveness of the adjacent soil
5. a seal test on directly buried in the ground single-walled containers at an overpressure of atleast 30 kPa for a period of minimum 1 hour or at an underpressure of a maximum of 30 kPa;testing at an overpressure of more than 30 kPa may only be carried out if the containers arecompletely filled with water for this;non-accessible single-walled ducts must be tested at an overpressure of at least 30 kPa for aperiod of 1 hour;an equivalent seal test, carried out according to a code of good practice accepted by theEnvironmental Licence Department, is also allowed.
§ 3. The periodic examinations, as referred to in § 1 and § 2, must be carried out by anenvironmental expert accredited in the discipline containers for gases or hazardous substances,by an authorised expert, or by a technician accredited for storage sites for P3 and/or P4 productsintended for the heating of buildings.The inspection with respect to corrosion and cathodic protection must take place incollaboration with an environmental expert accredited in the discipline soil corrosion.
Art. 5.17.2.9
Following the inspections described in article 5.17.2.7 with the installation and/or the periodicinvestigations referred to in article 5.17.2.8, the experts or the accredited technician will drawup a certificate from which it unambiguously appears whether or not the installation complieswith the conditions of these regulations. The aforementioned conformity certificate alsomentions the name and the accreditation number of the expert or accredited technician who hasconducted the inspection.He then applies a clearly legible sticker or plate to the filling pipe, on which his/heraccreditation number, the year and the month of the inspection on installation and the lastinspection conducted are mentioned.The sticker or plate must have the following colour:
1. green, when the container and the installation comply with the provisions of these regulations2. orange, when the container and the installation do not comply with the provisions of these
regulations, but the faults established cannot cause pollution outside the container3. red, when the container and the installation do not comply with the provisions of these
regulations and the faults observed can lead or have led to pollution outside the container.

Annexes
388 Waste Water and Waste Gas Treatment
Art. 5.17.2.10
Only containers of which the filler pipe is provided with a green sticker or plate, as referred toin article 5.17.2.9, may be filled, replenished and operated.Containers of which the filler pipe is provided with an orange sticker or plate, as referred to inarticle 5.17.2.9, may be filled or replenished during a transitional period of a maximum of 6months starting on the first day of the month following the month mentioned on the orangesticker or plate. In this case a new control must take place before the expiry of theaforementioned term.Containers of which the filler pipe is provided with a red sticker or plate, as referred to in article5.17.2.9, may in no event be filled or replenished.
Art. 5.17.2.11
§ 1. The following are considered as existing containers for the storage of P1, P2, P3 or P4products:
1. containers of which operation was licensed on 1 January 1993 or for which the application forthe renewal of the environmental licence was being processed on the aforementioned date bythe competent authority
2. containers which on 1 September 1991 had already been brought into use and without theapplication of title I of the General Regulations for Labour Safety were not classified ashazardous, unhealthy or nuisance-producing establishments
3. containers for which before 1 July 1993 notification took place in accordance with theprovisions of Title I of VLAREM.
These containers continue to be existing containers, also with the renewal of the environmentallicence.
§ 2. Existing containers for the storage of other than P1, P2, P3 or P4 products are containers ofwhich their operation was licensed on 1 May 1999 or for which the application for the renewalof the environmental licence was being processed on the aforementioned date by the competentauthority.These containers continue to be existing containers, also with the renewal of the environmentallicence.
§ 3. The distance and prohibitory rules as well as the provisions of this section concerning themethod of construction and installation of the containers, the associated ducts and the fillingpoint are not applicable to existing containers.
§ 4. The general inspection as referred to in article 5.17.2.8, § 2 must take place for a first timeno later than on the dates mentioned in the table below, depending on the location, the nature ofthe stored liquid and the category.
Location with respect to waterabstraction areas or protected zones
Product Category Inside OutsideP1, P2 1, 2, 3 1 August 1997 1 August 1999P3, P4 1, 2 1 August 1997 1 August 1999P3, P4 3 1 August 1998 1 August 2000Other 1, 2, 3 1 January 2002 1 January 2003
In anticipation of this general inspection the containers may continue to be used.Before the same dates a corrosiveness inspection in accordance with article 5.17.2.4, § 3 musttake place on the following buried metal containers with an individual water content capacity of5000 l or those for the storage of P3 and/or P4 products from 10000 l as well as the associatedducts:

Annexes
Waste Water and Waste Gas Treatment 389
1. single-walled containers2. double-walled containers inside a water abstraction area or a protected zone type I and II3. double-walled containers inside the surrounding area of electrical conductors where major
stray currents can be present.
From the date of the first general inspection, the periodic examinations must be conductedaccording to the provisions of article 5.17.2.8 and 5.17.2.9.
§ 5. Without prejudice to the particular conditions imposed in the environmental licence, thecontainers must comply with the provisions of this chapter no later than the dates mentioned inthe table below related to:
1. overfilling warning or safety system2. leak detection3. cathodic protection.
Location with respect to waterabstraction areas or protected zones
Product Category Inside OutsideP1, P2 1, 2, 3 1 August 1998 1 August 2000P3, P4 1, 2 1 August 1998 1 August 2000P3, P4 3 1 August 1999 1 August 2001other 1, 2, 3 1 January 2003 1 January 2005
§ 6. With the replacement of the containers referred to in § 1 or § 2, the new container mustcomply with all conditions of these regulations, except for that regarding the stipulations ofdistances to be observed.
§ 7. For storage sites which form part of a fuel distribution installation for motor vehicles, theprovisions of § 5 can be departed from according to the provisions of article 5.17.5.7.
Art. 5.17.2.12
§ 1. If leaks are observed the operator will take all measures required to avoid the danger ofexplosion and restrict further soil and groundwater pollution to the extent possible.
§ 2. After professional repairs have taken place, the container may only be brought back into useproviding it has successfully undergone a seal test as specified in article 5.17.2.8.
§ 3. With the final putting out of use of containers, whether or not due to leaks, the containermust be emptied, cleaned and removed within a period of 36 months without prejudice to theprovisions of the decree of 2 July 1981 concerning the prevention of waste and waste materialsmanagement and its implementing decisions.With the material impossibility of removal, within the same term, after consultation with anenvironmental expert accredited in the discipline containers for gases or hazardous substances,with an authorised expert or for the storage of P3 and/or P4 products intended for the heating ofbuildings or with an accredited technician, the container must be emptied, cleaned and filledwith sand, foam or an equivalent inert material. Here the necessary measures relating toexplosion safety and the prevention of groundwater pollution must be taken.
§ 4. Liquids which have caused ground pollution or spillage into the sewer system, the surfacewaters, the groundwater layers or onto adjacent properties must be immediately reported by theoperator to the Environmental Inspection Department, to the Governor of the Province and tothe Burgomaster.

Annexes
390 Waste Water and Waste Gas Treatment
Section 5.17.3 Storage of Hazardous Liquids in aboveground containers
Art. 5.17.3.1
§ 1. The containers must be placed in or above a bund in order to prevent the spreading of fire,and to prevent soil and/or groundwater pollution. Equivalent collection systems can bepermitted in the environmental licence.Double-walled containers fitted with a permanent leak detection system do not have to beplaced in or above a bund.
§ 2. Unless specified otherwise in the environmental licence, the storage of P1 and/or P2products in fixed containers in basements or aboveground spaces is prohibited. It is forbidden toinstall storage sites for P1 and/or P2 products in moveable receptacles in basement floors.
Art. 5.17.3.2
§ 1. Fixed containers must be built according to the provisions of appendix 5.17.2.
§ 2. All metal parts of containers intended for the storage of P1 and/or P2 products, includingthe floating roof of the containers, must be equipotential.
Art. 5.17.3.3
§ 1. The control of the construction of fixed containers must take place according to theprovisions of appendix 5.17.2.The control of separately built containers must take place by an environmental expert accreditedin the discipline containers for gases or hazardous substances or by an authorised expert.The control of containers installed in series may be limited to one prototype; the approval of theprototype is given by an environmental expert accredited in the discipline containers for gasesor hazardous substances, of which the accreditation allows the approval of prototypes.The report on this approval mentions the controls carried out and must be signed by theaforementioned expert.
§ 2. For each container the operator must dispose of a “declaration of conformity of thecontainer” signed by the constructor, drawn up according to the specimen form in appendix5.17.2.The containers must bear the identification plate applied by the constructor.
Art. 5.17.3.4.
Before the installation of the fixed container it must be checked that the container and/or thefoundations meet the conditions of these regulations.After installation, but before the bringing into use of the container, it must be checked whetherthe container, the ducts and the accessories, the overfilling warning or safety system, the bundand the firefighting resources, and where appropriate, the leak detection system and theprovisions for vapour recovery comply with the conditions of these regulations.The specified controls must be carried out under the supervision of an environmental expertaccredited in the discipline containers for gases or hazardous substances or an authorised expertfor the storage of P3 and/or P4 products intended for the heating of buildings, or an accreditedtechnician.

Annexes
Waste Water and Waste Gas Treatment 391
Art. 5.17.3.5
§ 1. An identification plate must be applied to fixed containers in a visible and easily accessibleplace in accordance with the provisions of appendix 5.17.2.
§ 2. The following indications must be applied near the filling opening and in a clearly visibleplace on the fixed container:
1. the number of the container2. the name or the code numbers or letters of the stored liquid3. the danger symbols4. the water content capacity of the container.
The provisions of this paragraph are not applicable to storage sites for P3 and/or P4 productswhich are only intended for the heating of buildings.
§ 3. On moveable receptacles the name of the product mentioning the main property must beapplied.
Art. 5.17.3.6
§ 1. The bund and the foundations for fixed containers with an individual water content capacityfrom 10000 l must be built according to a code of good practice under the supervision of andaccording to the directions of an architect, a civil engineering architect, a civil structuralengineer or an industrial architectural engineer.For storage sites classified in category 1 or 2, the aforementioned expert confirms in a certificatethat he accepts the code of good practice used and that this was adhered to.
§ 2. Fixed containers must be placed on a supporting block or surface of sufficient dimensionsto prevent the load causing uneven slumps, from which a danger of toppling or breakage couldoriginate. For the installation of containers with an individual water content capacity from50000 l a stability study is conducted by the expert specified in §1.
§ 3. The bund must be resistant to the action of the stored liquids and must be impervious. Thebund must be sufficiently strong to withstand the liquid mass which could escape in the event ofthe breakage of the largest container placed in the bund.The floor must be provided in such a way that the spreading of the leaked liquids remainsminimal and the leaked liquids can be easily removed.
§ 4. If the bund is made of earthen dams, these dams must be made of a very clayish, solid andstrongly compressed earth, of which the gradients are a max. 4/4 and the thickness on the topside is to be at least 50 centimetres. The floor may be made of the same materials. The damsmust be sown with grass. At the base, carefully calculated supporting walls with a maximumheight of one metre may be constructed.
§ 5. The passage of ducts through the bund is only allowed if the sealing of the bund remainsassured.
§ 6. If the bund is wider than 30 metres, the escape ladders or stairs must be positioned so that aperson fleeing does not have to travel a distance greater than half the width of the bund plus15 metres to reach an escape ladder or stairs.
Annexes
392 Waste Water and Waste Gas Treatment
Art. 5.17.3.7
§ 1. For storage sites in fixed containers or moveable receptacles located inside a waterabstraction area and/or protected zone, the minimum capacity of the bund is to be equal to thetotal water content capacity of all containers and/or receptacles placed therein.
§ 2. For storage places in fixed containers located outside a water abstraction area and/orprotected zone, the minimum capacity of the bund must be determined as follows (double-walled containers fitted with a permanent leak detection system not included):
1. for the storage of P1, P2, highly toxic, toxic and explosive products, the greatest of thefollowing values:
a) the water content capacity of the largest container, increased by 25 % of the total watercontent capacity of the other containers in the bund
b) half of the total water content capacity of the containers placed therein;2. for the storage of P3, harmful, irritating, oxidising, corrosive and environmentally harmful
products: the water content capacity of the largest container;3. for the storage of P4 products and extra heavy heating oil, irrespective of the flashpoint: only
the presence of a upright edge is required4. for the storage of P1 and/or P2 products in aboveground spaces and basements: the total
water content capacity of all containers placed therein.
For the storage of products with various main properties the strictest of the regulations must beadhered to. Here account must also be taken of the flashpoint.
§ 3. For storage sites located outside a water abstraction area and/or protected zone for productsother than P1 and/or P2 products in moveable receptacles, the capacity of the bund must berestricted to 10 % of the total water content capacity of the receptacles stored therein. In eachcase the capacity of the bund must be at least equal to the capacity of the largest receptacleplaced in the bund.
§ 4. For storage sites located outside a water abstraction area and/or protected zone for P1and/or P2 products in moveable receptacles, the capacity of the bund must be 25 % of the totalwater content capacity of the receptacles stored therein. The capacity may be reduced to 10% if,after consultation with the authorised fire brigade, a suitable fire extinguishing installation isprovided. In each case the capacity of the bund must be at least equal to the capacity of thelargest receptacle placed in the bund.
Art. 5.17.3.8
Unless specified otherwise in the environmental licence, the distance between the containers isto be at least 0.5 m, and between the containers and the inner walls of the bund or the bottomthe dams at least half the height of the containers.This last obligation does not apply:
1. for the storage of hazardous liquids in double-walled containers or containers with ringcladding or similar protection which ensures that any leaked liquid stays inside the bund, or
2. for the storage of P4 products or extra heavy heating oil, irrespective of the flashpoint.
Art. 5.17.3.9
Without prejudice to other provisions of these regulations, storage sites for P1 and/or P2products in moveable receptacles must comply with the following conditions:

Annexes
Waste Water and Waste Gas Treatment 393
1. the storage must be protected against detrimental consequences of the action of the rays of thesun or the radiation of any other heat source
2. the storage of P1 and/or P2 products together with other liquids is allowed providing thatthese last liquids the do not increase the risk of or risks associated with an accident
3. storage sites in a building are constructed as prescribed in article 52 of the GeneralRegulations for Labour Safety
4. storage sites outside buildings particularly built for the storage of these liquids and which donot meet the provisions of article 52 of the General Regulations for Labour Safety must be atleast 10 m from each neighbouring building
5. doors in closed storage sites open outwards and are self-closing; with double doors 1 doormust remain continually locked; the other door must be self-closing; the doors may remaintemporarily opened if this is required for technical operating reasons. In the event of a firethey must also automatically close. The use of sliding partitions is allowed on the conditionthat these partitions, or the storage space, have one or more doors which meet therequirements of the aforementioned regulations
6. all storage sites must be adequately ventilated, either naturally or artificially.
Art. 5.17.3.10
§ 1. The construction of all spaces for the processing of hazardous products is provided in sucha way that accidentally spilt substances or leaked liquids can be collected.To prevent the spreading of fire, the construction of all spaces for the processing of P1 productsmust be provided in such a way that accidentally spilt substances and leaked liquids arrive in acollection device and are then taken by collecting channels to one or a multiple of collectiondrains.This collecting device may in no way be connected indirectly or directly to a public sewer, asurface water, a reservoir for surface water, a ditch or a groundwater layer.
§ 2. The contents of a leaking container must be immediately loaded or pumped into a differentsuitable container. Spilt liquids must be immediately localised and placed in a drum for thispurpose. At establishments the necessary emergency materials, such as absorption andneutralisation material, oversized drums, protection resources, etc., must be present to, in theevent of leaks, be able to immediately respond to faulty packing, spills and other incidents andmaximally restrict possible harmful consequences.
§ 3. Collection devices and collection basins must be regularly emptied, and at least after eachincident. The waste material flows obtained must be disposed of in an appropriate manner.
Art. 5.17.3.11
All necessary measures must be taken to regularly remove any rainwater that may enter thebund.Before the rainwater is removed, the operator will ensure there is none of the stored productpresent in the water. If the water contains stored products, he will take all the necessarymeasures to prevent the pollution of soil groundwater and surface water.
Art. 5.17.3.12
§ 1. In areas surrounding tank farms inside a water abstraction area and/or a protected zone,after consultation with the local water authority or an environmental expert accredited in thedisciplines groundwater or soil, observation pipes (measuring wells) are to be installed inaccordance with the provisions of appendix 5.17.3 concerning the detection of leaks in gas orliquid form outside the storage container.

Annexes
394 Waste Water and Waste Gas Treatment
The observation pipes (measuring wells) are to be made of a material that cannot be affected bythe stored liquids.The whole length of the piping is to be provided as filter piping; it is to have an internaldiameter of at least 5 cm, reach a minimum of 1 m deeper than the lowest level of the phreaticgroundwater table and be sealed above.Unless specified otherwise in the environmental licence, at least three observation pipes must beinstalled.The plans for the work and the drilling reports are to be available for inspection by thesupervisory official.
§ 2. The operator will regularly check the groundwater in the measuring wells for the presenceof pollution.For tank farms, at least every 2 years a groundwater investigation must take place, either by theoperator, with equipment and according to a method approved by an environmental expertaccredited in the discipline groundwater, or by the aforementioned environmental experthimself.
Art. 5.17.3.13
§ 1. Minimum extinguishing and cooling provisionsA tank farm for the storage of P1 and/or P2 products must be provided with an effective,permanent foam installation and/or an extinguishing or cooling installation suitable to thecircumstances, and this after consultation with the authorised fire service.The establishment must dispose of a quantity of water to be able to spray and/or cool thecontainers for a sufficient period. With the failure of the normal electricity supply, the workingof the extinguishing or cooling installations must be assured by emergency power units orequivalent emergency installations.
§ 2. Establishments with containers for the storage of P1 products classified in category 1 whichare not manned or only manned during ordinary working hours must, after consultation with theauthorised fire brigade, be equipped with an effective smoke, gas or flame detection systemwhich gives an alarm at a manned monitoring department.
§ 3. For the storage of P1 and/or P2 products in tank farms, the firefighting resources must beexamined when bringing into use by an expert accredited for the discipline external safety andrisks for serious accidents or by an authorised expert, unless this inspection is wholly or partlyconducted by the authorised fire brigade, by the Head of Prevention and Protection or by hisappointed party after consultation with the authorised fire brigade.
Art. 5.17.3.14
The accessibility of the tank farm must be conceived in such a way that:
1. traffic in the zones where a reasonable danger of fire and explosion exists must be kept to aminimum
2. the tank farm must have easy access3. easy access for the intervention material4. vehicles with which products are taken away or delivered must, during loading or unloading,
to the extent technically possible be located at a loading/unloading place with largerdimensions than an ordinary road lane.

Annexes
Waste Water and Waste Gas Treatment 395
Art. 5.17.3.15
§ 1. The operator of a tank farm will keep a file at appropriate places at the establishment for theauthorised fire brigade, with at least the following information:
1. a map of the tank farm and the access roads2. a description of the firefighting resources with their indication on a map3. a description of the stored products with the main physical and chemical properties (danger
cards) with the specification of the listing of EC directive 67/548/EEC of 27 June 1967 or88/379/EEC of 7 June 1988, of the UN number and of the ADR code
4. the water content capacity of the containers5. the composition of any establishment's own fire service.
Any other equivalent manner of providing information is allowed, providing the consent of thesupervisory official and of the authorised fire brigade has been given.
Art. 5.17.3.16
§ 1. At least every 3 years, without the period between two consecutive examinations being ableto exceed 40 months, the installations must be subjected to a limited inspection.This inspection comprises, if relevant:
1. perusal of the previous report or certificate2. the checking of the good state of the overfilling protection3. an inspection for visible or organoleptically observable pollution of the surface outside the
container according to the provisions of appendix 5.17.44. the inspection of the general state of the installation, comprising:a) the tracing of leaks and indications of leaksb) the inspection of the state of the plating, the connections and the butts of the containerc) the inspection of the state of accessories such as: valves, temperature, pressure and level
measurement devices and earthingd) the inspection of the pressure safety and alarm appliancese) the inspection of the state of the outer cladding, the paintwork and/or the insulationf) the inspection of the foundations and/or supporting blocks regarding stability and drainageg) the inspection of the bund for content, sealing, pollution, measuring wellsh) the inspection of the state of the ducts and the accessories inside the bund.
also for vertical containers:a) where appropriate, a non-destructive inspection must be conducted on the cladding and the
roof plating of the containers to determine the plate thickness and any corrosion, bothinternal and external
b) at the request of the environmental expert or the authorised expert, any settling will bedetermined by measuring the height at a number of points spread evenly over the peripheryof the bottom edge.
§ 2. At least every 20 years the installations must be subjected to a general inspection. Prior tothis inspection the container must be internally cleaned.This inspection comprises:
1. the limited inspection, as referred to in § 12. the inspection of the state of the inner wall3. for vertical containers the inspection also includes:
a) the inspection of the state of the framework and the internal accessories such as valves,heating coils, roof and groundwater drains and seals in the floating roofs
b) the inspection of the bottom plates for the tracing of internal and external corrosionc) the inspection of bottom deformation and the possible measuring of the profile

Annexes
396 Waste Water and Waste Gas Treatment
4. a pressure test on any heating pipes.For category 3 storage of P3 and/or P4 products, only the limited inspection mentioned in § 1has to take place.
§ 3. The periodic investigations must be carried out by an environmental expert accredited in thediscipline containers for gases or hazardous substances or by an authorised expert, or for storageplaces for P3 and/or P4 products intended for the heating of buildings by an accreditedtechnician.
Art. 5.17.3.17
Following the inspections described in article 5.17.3.4 with installation and/or the periodicinvestigations referred to in article 5.17.3.16, the experts or the accredited technician draw up acertificate from which it unambiguously appears whether or not the installation complies withthe conditions of these regulations. The aforementioned certificate also mentions the name andthe accreditation number of the expert or accredited technician who has conducted theinspection.Except in the case of a tank farm, a clearly visible sticker or plate is to be applied to or near thefiller pipe on which the accreditation number, the year and the month of the control withinstallation and the last inspection are mentioned.The sticker or plate has the following colour:
1. green, when the container and the installation comply with the provisions of these regulations2. orange, when the container and the installation do not comply with the provisions of these
regulations, but the faults established cannot cause pollution outside the container3. red, when the container and the installation do not comply with the provisions of these
regulations and the faults observed can lead or have led to pollution outside the container.
Art. 5.17.3.18
Only containers of which the filler pipe is provided with a green sticker or plate, as referred toin article 5.17.3.17, third subsection, 1., may be filled, replenished and operated.Containers of which the filler pipe is provided with an orange sticker or plate, as referred to inarticle 5.17.3.17, third paragraph, 2., may still be filled or replenished for a transitional period ofa maximum of six months. This period starts on the first day of the month following the monthmentioned on the relative orange sticker or plate. In this case a new control must take placebefore the expiry of aforementioned term.Containers of which the filler pipe is provided with a red sticker or plate, as referred to in article5.17.3.17, third subsection, 3., may in no event be filled or replenished.
Art. 5.17.3.19
§ 1. The following are considered as existing containers for the storage of P1, P2, P3 or P4products:
1. containers of which operation was licensed on 1 January 1993 or for which the application forthe renewal of the environmental licence was being processed on the aforementioned date bythe competent authority
2. containers which on 1 September 1991 were already in use, and without the application oftitle I of the General Regulations for Labour Safety were not classified as hazardous,unhealthy or nuisance-producing establishments
3. containers for which before 1 July 1993 notification was provided in accordance with theprovisions of Title I of VLAREM.

Annexes
Waste Water and Waste Gas Treatment 397
These containers continue to be existing containers, also with the renewal of the environmentallicence.
§ 2. Considered as existing containers for the storage of other than P1, P2, P3 or P4 products arecontainers of which the operation is licensed on the date of the enforcement of this order, or forwhich the application for the renewal of the environmental licence was being processed on theaforementioned date by the competent authority. These containers continue to be existingcontainers, also with the renewal of the environmental licence.
§ 3. The distance and prohibitory rules as well as the provisions of this section concerning themethod of construction and installation of the containers, the associated ducts and the fillingpoint are not applicable to existing containers.
§ 4. The general inspection as referred to in article 5.17.3.16 must take place a first time no laterthan on the dates mentioned in the table below, depending on the location, the nature, the storedliquid and the category.
Location with respect to waterabstraction areas or protected zones
Product Category Inside OutsideP1, P2, P3, P4 1, 2, 3 1 August 1998 1 August 2000other 1, 2, 3 1 January 2003 1 January 2005
In anticipation of this general inspection the containers may continue to be used.From the date of the first general inspection the periodic examinations must be conductedaccording to the provisions of article 5.17.3.16 and 5.17.3.17.
§ 5. Without prejudice to the particular conditions imposed in the environmental licence, thecontainers must comply with the provisions of this chapter no later than the dates mentioned inthe table below, with the exception of the regulations related to:
1. the construction and the installation of the containers and the ducts providing that thesecomply with the provisions of § 4
2. the construction and the liquid sealing of the bund of tank farms.
Location with respect to waterabstraction areas or protected zones
Product Category Inside OutsideP1, P2, P3, P4 1, 2, 3 1 August 1999 1 August 2001other 1, 2, 3 1 January 2004 1 January 2006
§ 6. With the replacement of the containers, as referred to in § 1 and § 2, the new container mustcomply with all the regulations of this chapter, except for that regarding the stipulations ofdistances to be observed.
§ 7. As a derogation from the provisions of § 5, existing containers which do not form part of atank farm must no later than 1 January 2003 comply with the provisions of article 5.17.3.6,5.17.3.7 and 5.17.3.8.
§ 8. In existing tank farms for the storage of P1, P2, P3 or P4 products located inside a waterabstraction area or a protected zone, no later than 1 August 1997 observation pipes must beinstalled in accordance with the provisions of article 5.17.3.12.In existing tank farms for the storage of other than P1, P2, P3 or P4 products located inside awater abstraction area or a protected zone, no later than within a period of 24 months after thedate of the coming into force of this order observation pipes must be installed in accordancewith the provisions of article 5.17.3.12.These obligations also apply within a period of 24 months after the date of the coming into forceof a decision for the assignment of a water abstraction area and/or a protected zone.

Annexes
398 Waste Water and Waste Gas Treatment
§ 9. In existing tank farms which do not dispose of an impervious bund and which are locatedoutside a water abstraction area or a protected zone, within a period of 24 months after the dateof the coming into force of this order observation pipes must be installed in accordance with theprovisions of article 5.17.3.12.
Art. 5.17.3.20
§ 1. If leaks are observed the operator will take all the measures required to avoid the danger ofexplosion and restrict further soil and groundwater pollution to the extent possible.
§ 2. After professional repairs the container may only be brought back into use if a certificatehas been issued by an environmental expert accredited in the discipline containers for gases orhazardous substances or by an authorised expert or by a technician accredited for the storage ofP3 and/or P4 products intended for the heating of buildings. From this certificate it must clearlyappear that the container and the installation comply with the requirements referred to in thisorder.
§ 3. With the final putting out of use of containers, whether or not due to leaks, the containermust be emptied, cleaned and removed within a period of 36 months without prejudice to theprovisions of the decree of 2 July 1981 concerning the prevention of waste and waste materialsmanagement and its implementing decisions.If it is impossible to remove the container within this period, after consultation with anenvironmental expert accredited in the discipline containers for gases or hazardous substancesor with an authorised expert or with a technician accredited for the storage of P3 and/or P4products intended for the heating of buildings, the container must be emptied, cleaned and filledwith sand, foam or an equivalent inert material. Here the necessary measures must be taken forexplosion protection and to prevent soil and groundwater pollution.
§ 4. Liquid leaks which have caused ground pollution or spillage into the sewer system, thesurface waters, the groundwater layers or onto adjacent properties must be immediately reportedby the operator to the Environmental Inspection Department, to the Governor of the Provinceand to the Burgomaster.
Section 5.17.4 Control of the emission of volatile organic compounds (VOC) with thestorage and transferring of petrol
Art. 5.17.4.1
The provisions of this section are applicable to the establishments as referred to in thesubsection 17.3.4 and the establishments as referred to in subsection 17.3.9 of the classificationlist, to the extent these establishments concern the collection, storage and transferring of petrol.
Art. 5.17.4.2
§ 1. Without prejudice to the other conditions in these regulations, the storage installations mustcomply with the technical regulations of appendix 5.17.9, § 2.
§ 2. As a derogation from § 1, existing storage installations must comply with the provisions of§ 1:
1. from 1 January 1999 for storage installations with a turnover greater than 50000 tonnes peryear, measured during the years 1996 and 1997

Annexes
Waste Water and Waste Gas Treatment 399
2. from 1 January 2002 for storage installations with a turnover greater than 25000 tonnes peryear, measured during the years 1996 up to and including 2000; if, however, the turnovermeasured during the years 1998 up to and including 2000 exceeds the limit of 50000 tonnesper year, the provisions of §1 of this article are applicable from 1 January of the second yearafter the year for which the limit value was exceeded
3. from 1 January 2005 for other storage installations.
Art. 5.17.4.3
§ 1. Without prejudice to the other conditions in these regulations, transfer installations ofmobile tanks at terminals must comply with the technical regulations of appendix 5.17.9, § 3.
§ 2. All terminals with transfer installations for the loading of tankers must be equipped with atleast one loading gantry that meets the specifications for installations for filling on the bottomside in appendix 5.17.9, § 5.
§ 3. As a derogation from § 1 of this article, existing transfer installations for the loading oftankers, rail tankers and/or ships must comply with the provisions of § 1 and § 2:
1. from 1 January 1999 for transfer installations with a turnover greater than 150000 tonnes peryear, measured during the years 1996 and 1997
2. from 1 January 2002 for transfer installations with a turnover greater than 25000 tonnes peryear, measured during the years 1996 up to and including 2000; if, however, the turnovermeasured during the years 1998 up to and including 2000 exceeds the limit of 150000 tonnesper year, the provisions of §1 of this article are applicable from 1 January of the second yearafter the year for which the limit value was exceeded
3. from 1 January 2005 for other transfer installations of terminals.
§ 4. Not later than three months after the date of bringing into use, and then at least once a year,an environmental expert accredited in the discipline air must draw up a report. In this report theresults of the measurements conducted to determine the average concentration of vapours in thevapour recovery unit outlet are shown, discussed and compared to the emission conditionmentioned in appendix 5.17.9, § 3. The term between two control measurements may in noevent exceed 15 months. This report must be sent to the Environmental Licence Department, theEnvironmental Inspection Department and the Flemish Environmental Agency.
Art. 5.17.4.4
§ 1. Without prejudice to the other conditions in these regulations, distribution installations forpetrol must meet the technical regulations of appendix 5.17.9, § 4.
§ 2. As a derogation from § 1 of this article, existing distribution installations must comply withthe provisions of § 1:
1. from 1 January 1999 for distribution installations with a turnover greater than 1000 m3 peryear, measured during the years 1996 and 1997, as well as for installations, irrespective oftheir turnover, which are located under permanent living spaces or working spaces
2. from 1 January 2002 for distribution installations with a turnover greater than 500 m3 peryear, measured during the years 1996 up to and including 2000; if, however, the turnovermeasured during the years 1998 up to and including 2000 exceeds the limit of 1000 m3 peryear, the provisions of § 1 of this article are applicable from 1 January of the second yearafter the year for which the limit value was exceeded
3. from 1 January 2005 for other distribution installations.

Annexes
400 Waste Water and Waste Gas Treatment
§ 3. The provisions of this article are not applicable to distribution installations with a turnoverof less than 100 m3 per year.
§ 4. Storage installations, which form part distribution installations for petrol which accordingto the provisions of this article must comply with the technical regulations of appendix 5.17.9,§ 4, may only be filled by mobile tanks which meet the federal regulations for the execution ofEC directive 94/63/EC of 20 December 1994 concerning the control of the emission of volatileorganic substances (VOS) as a result of the storage of petrol and the distribution of petrol fromterminals to distribution installations.
Art. 5.17.4.5
The operator must keep a register in which the turnover information is mentioned. This registeris to be kept at the disposal of the supervisory officials.
Art. 5.17.4.6
The operator of a vapour recovery installation must keep a register in which each period ofputting out of use of this installation is accurately recorded, as well as the reason for this and themeasures taken. This register is to be available for perusal at the place of operation. § 3.
Section 5.17.5 Fuel distribution installations for motor vehicles
Art. 5.17.5.1
The provisions of this section are applicable to the establishments as referred to in subsection17.3.9 of the classification list.
Art. 5.17.5.2
Without prejudice to the conditions in these regulations, the necessary measures must be takento prevent the spillage of liquid fuels, the pollution of the soil and the groundwater and surfacewater.In the case of an incident, effective measures must immediately be taken to prevent thespreading of liquid fuels.
Art. 5.17.5.3
Electrical installations must meet the requirements referred to in the General Regulations forelectrical installations, in particular the articles dealing with spaces in which an explosiveatmosphere can originate. These installations must be able to be manually stopped from a safeand always easily accessible place.
Art. 5.17.5.4
The filling of any vehicle whatsoever may only take place after the engines of this vehicle havebeen switched off.

Annexes
Waste Water and Waste Gas Treatment 401
Art. 5.17.5.5
Fuelling places for motor vehicles for P1 and/or P2 products are always in the open air and onthe premises of the establishment. The floor of the aforementioned parking place is imperviousand sufficiently supporting. The ground is to be provided with the necessary gradients andpossible raised edges to ensure that any spilled flammable fuels run off to a collector and areremoved in accordance with regulatory provisions.No trenches, crawl spaces or rooms may be present under the aforementioned filling position.
Art. 5.17.5.6
Each fixed container which forms part of a distribution installation for the filling of motorvehicles must be equipped with its own filler pipe.The filling point for P1 and/or P2 products :
1. is at a horizontal projection at least 2 m distance from the edge of the container2. may not be in a closed or open building3. must be located at least 3 m from any basement space and from the boundaries of the parcels
of third parties.
Art. 5.17.5.7
§ 1. As regards existing fuel distribution installations for motor vehicles, the specific transitionalperiod in article 3.2.1.2, § 3, b) for the specified construction requirements in article 5.17.5.5and 5.17.1.17, 6. may be brought to:
1. 1 January 1999 for all distribution installations fitted with directly buried in the groundsingle-walled metal containers located inside water abstraction areas and protected zones
2. 1 January 2002 for all distribution installations, other than those mentioned sub 1., fitted withdirectly buried in the ground single-walled metal containers which were built before 1975,whereby it is assumed that the containers were built before 1975 if the age cannot bedemonstrated
3. 1 January 2005 for all other distribution installations.
For existing containers or existing discharges of industrial sewage, the same derogation canapply as in article 5.17.1.4, § 2, article 5.17.2.11, § 5 and article 3.2.1.2, § 3, b, as regards therealisation of the requirements made in appendix 5.3.2, 52°, c).
§ 2. The operator can only be granted the exception as referred to in § 1 under the explicitcondition that he, no later than on 1 January 1998, has bound himself to the following byregistered mail to the Environmental Licence Department and the Environmental InspectionDepartment:
1. to ensure that the containers will meet the conditions of these regulations for new containersbefore the date set in § 1, except for that regarding the location regulations (in particular theprohibitory rules and stipulations of distances to be observed)
2. the further operation of the fuel distribution installation will be definitively stopped from thedate in § 1 in the event of the undertaking in sub 1. not being achieved.

Annexes
402 Waste Water and Waste Gas Treatment
Annex 6
CHAPTER 5.20: INDUSTRIAL ESTABLISHMENTS WHICH CAN CAUSE AIRPOLLUTION
Section 5.20.1 General provisions
Art. 5.20.1.1
§ 1. The provisions of this chapter are applicable to the establishments specified in section 20 ofthe classification list.
§ 2. As a derogation from the general emission limit values mentioned in chapter 4.4. theemission limit values specified in other chapters of this order for specific categories ofestablishments also apply for the categories of establishments covered by the specified sectionsin § 1 with the same industrial activity. This particularly concerns the emission limit valuesmentioned in chapters 5.7. "Chemicals" and 5.29. "Metal" which respectively apply for theestablishments as referred to in subsections 20.4 and 20.2.
Section 5.20.2 Oil refineries.
Art. 5.20.2.1 Scope
The provisions of this section are applicable to the establishments as referred to in subsections1.1 and 20.1.2. of the classification list.
Art. 5.20.2.2
§ 1. As a derogation from the provisions of the articles 5.7.6.1, chapters 5.31 and 5.43 and thegeneral emission limit values specified in chapter 4.4., for oil refinery installations [ ¼ ] thefollowing emission limit values apply concerning the sum of the emissions originating fromheating installations, including STEG installations and processing installations:
1. from 1 January 1994:a) for sulphur dioxide:
- until 31 December 1997: 2000 mg/Nm3
- from 1 January 1998: 1300 mg/Nm3
b) for nitrogen oxides:- until 31 December 1997: 900 mg/Nm3
- from 1 January 1998: 450 mg/Nm3
c) for suspended particulates:- until 31 December 1997: 300 mg/Nm3
- from 1 January 1998: 150 mg/Nm3
2. from 1 January 1997:for CO:- until 31 December 1997: 250 mg/Nm3
- from 1 January 1998: 150 mg/Nm3
3. from 1 January 1999:- for Ni and its compounds: 2 mg/Nm³ expressed in Ni- for V and its compounds: 7 mg/Nm³ expressed in V.
At processing installations referred to in the first subsection include, among others:- sulphur recovery units- catalytic cracking and converting installations- incinerators- torches as well as asphalt oxidisers and all other processing units with SO2-, NOx, CO and dust
emissions.

Annexes
Waste Water and Waste Gas Treatment 403
For new, large heating installations the provisions of section 5.43.2 apply, except for theemission limit values included in the section. These are replaced by the emission limit valuesincluded in appendix 5.20.2.As a derogation from article 3.2.1.2, § 3, a), for existing establishments the more stringentemission limit values apply as referred to in the third subsection, as of 1 January 2005.
§ 2. From 1 January 1994 the operating conditions in the operating licences for oil refinerieswith respect to SO2-, NOx-, CO and dust are replaced by the provisions of § 1.
§ 3. For the application of the provisions of § 1 of this article, the following specifications mustbe respected:
1. for the definitions of flue gases and emission limit values, for new and existing heatinginstallations and for steam and gas turbine installations (STEG) the definitions of article 1.1.2apply, in particular concerning industrial establishments which can cause air pollution.For processing installations the actual flow rates in m3/hour must be converted at the normaltemperature (273 °K) and pressure (101.3 kPa), but on a dry basis as specified in article4.4.3.1. with the actual quantity of excess oxygen
2. measuring strategy for suspended particulates, SO2 , NOx , CO, Ni and V:- for heating installations, including machines with internal incineration the provisions of
article 5.43.2.3. apply, §§ 1 and 2- for processing installations, residual gas measurements are constantly conducted or the
emissions are calculated on the basis of constant or periodically measured relevantparameters according to codes of good practice as in article 5.43.2.3., §§ 1 and 2
3. assessment of measuring results:for the assessment of the measuring results the following applies:- for SO2: the provisions of article 5.43.2.4 with continuous measurement or article 4.4.4.5
with discontinuous measurement- for NOx and CO: the provisions of article 5.43.5.1, § 4 with continuous measurement or
article 4.4.4.5 with discontinuous measurement- for suspended particulates: the provisions in article 5.43.5.1, § 4 with continuous
measurement or article 4.4.4.5 with discontinuous measurement- for Ni and V: the provisions as mentioned for NOx, in article 5.43.5.1, § 4 with continuous
measurement or article 4.4.4.5 with discontinuous measurement.
§ 4. Gaseous effluents discontinuously released by a processing such as gaseous effluentsresulting from the regeneration of catalytic agents and with inspection and cleaning activitiesmust be transported to a combustion facility or a torch, or equivalent measures must be taken toensure emission reduction.Gaseous effluents released with the starting up or stoppage of an installation must, to the extentpossible, be transported to a collection system for gaseous effluent or incinerated in processheating installations. When this not possible, the gases must be led to a torch, in which fororganic substances an emission level of 1 % with respect to the total carbon content may not beexceeded.Gaseous effluents from desulphurisation installations or other sources with a volume level ofhydrogen sulphide of over 0.4 % and a mass flow of hydrogen sulphide of over 2 tonnes/daymust be further processed.Gaseous effluents which are not further processed must be transported to an incinerator.As a derogation from the provisions of chapter 4.4, the emissions of hydrogen sulphide in thedischarged gaseous effluent may not exceed 10 mg/Nm3.Hydrogen sulphide-containing water may only be processed in such a way that the release ofgaseous effluent into the atmosphere is avoided.With the transfer of base, intermediary and finished products the emissions of organicsubstances with a vapour pressure of over 13.3 kPa at a temperature of 35 °C must be reducedby means of appropriate measures, such as by gas pendulum, extraction and transfer to aneffluent gas purification installation.

Annexes
404 Waste Water and Waste Gas Treatment
Process water may only be discharged into an open system after degassing. The gaseouseffluents collected here must be cleaned by washing or incineration.
§ 5. As a derogation from § 1, the emission in the gaseous effluent of installations for thecatalytic cracking according to the 'fluid bed' procedure with the regeneration of the catalystmay not exceed the following emission limit value for suspended particulates:
1. until 1 January 2005: 300 mg/Nm3 as monthly average2. from 1 January 2005: 50 mg/Nm3 as monthly average.
§ 6. The concentration of polychlorinated dibenzo-p-dioxins (PCDD’s) and polychlorinateddibenzo-p-furans (PCDF’s), calculated according to article 5.2.3.1.5, § 6, expressed asnanograms dioxin toxic equivalent per Nm3 (ng TEQ/Nm3), may not exceed a limit value of0.5 ng TEQ/Nm3 for all average values over a sampling period of at least 6 hours and amaximum of 8 hours. The emission guide value is 0.1 ng TEQ/Nm3.As a derogation from the provisions of the first subsection, the following applies for existingestablishments:- an emission guide value of 0.4 ng TEQ/Nm3;- an emission limit value of 2.5 ng TEQ/Nm3 as of 1 January 2002.The aforementioned guide values must be striven for by the application of the best availabletechniques.The mass concentration of PCDD’s and PCDF’s is to be measured according to therequirements referred to in the Belgian standard T95-R-NBN EN 1948-1, 2 or 3. Thisconcentration is to be measured at least once a year by an environmental expert accredited forthese measurements. This measurement is not compulsory for constituent flows which do not ordo not significantly contribute to the emissions. Unless specified otherwise in the environmentallicence, the omission of the measurements of specific constituent flows is only acceptedproviding that this has been approved of in advance by the supervisory authority.Each measurement performed according to the above-mentioned method must, after thecalculation of the accuracy as referred to in article 4.4.4.2, § 5, comply with the prescribedemission limit value. If the measured concentration, after the calculation of the aforementionedaccuracy, exceeds the emission limit value, within three months new sampling and analysis willtake place.
Art. 5.20.2.3 Immission control procedures
§ 1. Without prejudice to the provisions of chapter 4.4, each time the weather conditions appearunfavourable for the good dispersion of the combustion gases, in particular at the establishment,the operator will take all necessary steps to maximally restrict the emissions of SO2 as well as ofNOx from this installation.
§ 2. Each change of fuel, sulphur content of the liquid fuel, as well as the times of putting out ofuse are recorded in a register that the operator keeps available to the official charged withsupervision.
§ 3. When the total installed nominal thermal capacity at one establishment amounts to morethan 300 MW, in the surrounding area of the installations appliances for the measuring of theimmissions of SO2 and NO2 in the air at the ground will be installed and maintained at theoperator’s expense. The type, the place of measurement, the method of control and the otherconditions for use for the appliances are determined in the environmental licence.
§ 4. Without prejudice to the provisions of § 1, each time the average immission value over24 hours measured with the equipment specified in § 3, amounts to more than 300 mg/m3 forSO2 and/or 150 mg/m3 for NO2, the operator will take the steps prescribed in § 1, and maintainthese measures for as long as the measured average immission values over 24 hours of SO2 andof NO2 amount to more than 300 mg/m3 for SO2 and/or 150 mg/m3 for NO2.

Annexes
Waste Water and Waste Gas Treatment 405
§ 5. To guarantee compliance with the emission limit values for nitrogen oxides of art. 5.20.2.2,more appropriate technical construction conditions can be imposed in the environmentallicences.If from control measurements it appears that the emission limit value is not being complied withdue to unforeseen circumstances, the operator must take all suitable primary measures to ensurecompliance with the emission limit values as soon as possible. The operator must report this tothe Environmental Inspection Department together with the mentioning of measures taken forimprovement. The European Commission is to be immediately informed through the usualchannels of such events, as well as of the work carried out for improvement.
Section 5.20.3 Installations for the dry distillation of coal (coke ovens)
Art. 5.20.3.1 Underfiring, coke oven gas and heating installations
§ 1. Reference valueThe emission values for waste gases from heating concern a volume level of oxygen in the spentgas of 5 %.
§ 2. Coke oven gas and fuelAs a derogation from the general emission limit value for SO2 as specified in article 4.4.3.1, theweighed average of the mass concentration of sulphur compounds in the gas from theunderfiring, as well as in the gases originating from the coke ovens used as fuel, may over acalendar year not exceed 0.80 g/m3 expressed in sulphur.
§ 3. Nitrogen oxidesWith the first time of measuring, the emissions of nitrogen monoxide and nitrogen dioxide inthe gaseous effluent from the underfiring may not exceed 0.50 g/m3 expressed in nitrogendioxide. The best available techniques to reduce the increase of emissions due to ageing must beapplied.The measurements to be conducted for the first time after foundation or significant modificationmust be carried out after the installation has reached uninterrupted operation, but at the earliestafter three months in operation and at the latest twelve months after being in operation.
Art. 5.20.3.2 Filling the coke ovens
With the unloading of the coal from the coal bunker in the larry car, dust emissions must beavoided.The filling gases must be collected.When dumping, the filling gases must be transferred to the raw gas or an oven close by to theextent possible, with the further processability of the raw coal tar in mind.With stamping, the filling gases must be transferred in the raw gas to the extent possible.Filling gases which cannot be transferred must be taken to an incineration facility. Dust-containing emissions in the gaseous effluent of the incineration may not exceed 25 mg/m3.With the levelling activities with the dumping of coal, the emissions of filling gases must bereduced by the sealing of the levelling opening.
Art. 5.20.3.3 Filling opening covers
Emissions with filling opening covers must be avoided to the extent possible, for example byusing filling opening covers with large sealing surfaces, coating the filling opening covers willloam each time after filling the ovens and the regular cleaning of the filling opening frames andfilling opening covers before the filling openings are closed. Coal remains must be regularlyremoved from the oven roof.

Annexes
406 Waste Water and Waste Gas Treatment
Art. 5.20.3.4 Riser pipe covers
For the avoidance of gas and coal tar emissions, riser pipe covers must be fitted with devices forkeeping wet with water or equivalent devices.
Art. 5.20.3.5 Coke oven operating machines
Coke oven operating machines must be fitted with devices for the cleaning of the sealingsurfaces at the oven door frames.
Art. 5.20.3.6 Coke oven doors
Coke oven doors with a large sealing effect must be used, for example diaphragm doors ordoors with an equivalent sealing effect. The sealing surfaces of the oven doors must be regularlycleaned.Unless specified otherwise in the environmental licence, the coke oven batteries are to bearranged in such a way that on the machine side and on the coke side door extraction units withdedusting devices can be installed.
Art. 5.20.3.7 Pushing out of coke
With the pushing out of coke the spent gases must be collected and led to a dedustinginstallation.Unless specified otherwise in the environmental licence, the dust concentration in the emissionswill not exceed the emission limit value of 50 mg/Nm3, and the dust-containing emissions maynot exceed 5 gram per tonne of produced coke.
Art. 5.20.3.8 Coke cooling
§ 1. If dry cooling is applied, unless specified otherwise in the environmental licence, the dustemissions in the gaseous effluent may not exceed 20 mg/m3.
§ 2. If wet cooling is applied, the quenching tower used must be fitted with built-in dustextractors.As a derogation from the general emission limit values laid down in article 4.4.3.1, the emissionlimit values are expressed in gram per tonne of coke. Unless specified otherwise in theenvironmental licence, an emission limit value of 60 gram suspended particulates per tonnecoke, measured according to the VDI directive VDI 2303 or another equivalent measuringmethod approved by an environmental expert accredited in the discipline air, may not beexceeded.
Art. 5.20.3.9 Operating manual
An operating manual must contain measures for the reduction of emissions with the operation ofthe coke oven, in particular regarding:
1. the sealing of the openings2. the guaranteeing that only fullycoked material will be pushed out3. the avoidance of unburned gases escaping into the atmosphere.

Annexes
Waste Water and Waste Gas Treatment 407
Art. 5.20.3.10 Existing installations
For existing installations the provisions of this section apply as of 1 January 1998.
Section 5.20.4 The production of glass fibre or rock fibre and glass wool, the manufactureof glass (flat, concave and special glass) and the manufacture of crudeceramics
Subsection 5.20.4.1 The production of glass (flat, concave and special glass) and of glassfibre or rock fibre
Art. 5.20.4.1.1
§ 1. Reference valueThe emission limit values for flame-heated glass melting furnaces concern a volume level of8 %, and with flame-heated crucible kilns and open tiling a volume level of oxygen in the spentgas of 13 %.
§ 2. Nitrogen oxidesThe emissions of nitrogen monoxide and nitrogen dioxide, expressed in nitrogen dioxide, in thegaseous effluent may not exceed the following values:
oil fired[g/Nm3]
gas fired[g/Nm3]
crucible kilns 1.2 1.2tiling with recuperative heatrecovery 1.2 1.4
open tiling 1.6 1.6U-fire tiling withregenerative heat recovery 1.8 2.2
crossfiring tiling withregenerative heat recovery 3.0 3.5
Insofar from production quality considerations purification with nitrate is necessary, theemissions may not exceed double the values specified in the previous subsection.All possibilities for the reduction of emissions of nitrogen oxides by means technical heatingmeasures and other available measures are to be applied.
§ 3. sulphur oxides.The emissions of sulphur dioxide and sulphur trioxide in the spent gas, expressed in sulphurdioxide, may not exceed the following values at a mass flow of 10 kg/h or more with firing:
a) glass melting furnaces: 1.8 g/Nm3
b) crucible kilns and open tiling: 1.1 g/Nm3
Subsection 5.20.4.2 Production of crude ceramics
Art. 5.20.4.2.1
§ 1. Reference valueThe emission limit values concern a volume level of oxygen in the gaseous effluent of 18 %.
§ 2. Sulphur oxidesWith a sulphur content of the raw materials of less than 0.12 %, the emissions of sulphurdioxide and sulphur trioxide, expressed in sulphur dioxide in the gaseous effluent at a mass flowof 10 kg/h or more, may not exceed 0.5 g/Nm3.

Annexes
408 Waste Water and Waste Gas Treatment
With a sulphur content of the raw materials of 0.12 % or more, the emissions of sulphur dioxideand sulphur trioxide, expressed in sulphur dioxide in the gaseous effluent at a mass flow of10 kg/1 hour2 or more, may not exceed 1.5 g/Nm3.All possibilities for the reduction of emissions by cleaning installations for gaseous effluentmust be applied.
§ 3. For existing establishments, as referred to in section 30.9 of the classification list, theprovisions of chapter 5.30 also apply.
Section 5.20.5 Installations for the production of hydroelectric energy as well asinstallations for the abstraction of wind power for energy production
Art. 5.20.5.1
§ 1. The provisions of this section are applicable to subsections 20.1.5 and 20.1.6 of theclassification list.
§ 2. As a derogation from the provisions of chapter 4.5, in this case no noise standards areapplicable. In the environmental licence noise emission limits can be imposed depending onlocal conditions.
3. DENMARK
No information supplied
4. FINLAND
The Finnish environmental protection legislation has been revised recently and a newEnvironmental Protection Act came into force on the 1st of March, 2000. The new act totallyimplements the EU Directive on Integrated Pollution Prevention and Control (IPPC) and has anintegrated approach to control emissions caused by the industry. According to theEnvironmental Protection Act an environmental permit is required for installations of thechemical industry.
In the permitting procedure the environment is considered as a whole and all the environmentaleffects of the activity are estimated at the same time. All necessary permit conditions are set in asingle permit. The application for a permit is dealt with by one competent authority.
In Finland permit conditions are set mainly based on case-by-case consideration. At the momentthere are no special regulations concerning the emissions to air or waste water from thechemical industry. Instead there are some general Council of State Decisions on dischargingcertain compounds into public sewer systems or into water bodies. In addition to that there areregulations banning or restricting the use of certain hazardous chemicals. All of them are validin the chemical industry as well as in all other branches of industry.
International recommendations, e.g. HELCOM-recommendations (HELSINKI COMMISSION,Baltic Marine Environment Protection Commission), are also taken into consideration in settingthe permit conditions.
Annexes
Waste Water and Waste Gas Treatment 409
5. FRANCE
The legislation for the chemical sector is composed of:
• the general framework for the control of industrial pollution and risk prevention, asprovided by the “classified installations law” of the 19th July 1976, and the Order of the 2nd
February 1998. This Order specifies that emission limit values should be based on BAT andlocal conditions of the environment. The Order gives general emission limit values for airand water, for all classified installations, and also specific limit values for many industrialactivities, many of which included in the chemical sector.
• special legislation, each targeting a particular sector of the chemical industry, and detailingthe general provisions of the general framework for that particular sector. The main sectorscovered by such special legislation are:
production of superphosphatesproduction of organic sulphuric compoundsproduction of detergent and of soapsteam extraction of perfumes, essential oilsproduction of dyesproduction of pharmaceuticalsproduction of plastics, rubberuse or re-use of plastics, rubberstorage of plastics, rubberstorage of tyresproduction of accumulators.
6. GERMANY
Important regulations relevant for industrial installations in Germany are laid down in theFederal Immission Control Act [Bundesimmissionsschutzgesetz - BImSchG], the Federal WaterAct [Wasserhaushaltsgesetz - WHG] and the Federal Recycling and Waste Management Act[Kreislaufwirtschafts- und Abfallgesetz - KrW-/AbfG]. Germany uses a media segregatedpermit system for the different environmental media, but the final decision on an application ismade by the assessment of environmental impacts over all media by the competent authorities.Also noise requirements are considered in the licensing procedure. The “precautionaryprinciple” has a legal status which permits the setting of standards. Legal standards are notsubject to any negotiation in the licensing process in Germany.
In compliance with the federal structure of Germany, the implementation of environmental lawsand decrees is under the responsibility of the federal states (Bundesländer), which mayimplement the administrative procedure differently. For new plants, that are regarded as relevantwith respect to emissions and releases into the environment, also an environmental impactassessment is required during the licensing procedure [‘Gesetz über dieUmweltverträglichkeitsprüfung [UVPG]’, (Environmental Impact Assessment Act)].
Regulations on Air QualityThe basic law for air pollution control is the Federal Immission Control Act [Bundes-Immissionsschutzgesetz BImSchG]. It is specified by 21 ordinances and the TechnicalInstructions on Air Quality [TA Luft].
The Technical Instructions on Air Quality (TA Luft) have been set up as general administrativeregulations in connection with §48 BImSchG. The TA Luft further specifies the requirements tobe met by installations subject to licensing. Therefore, it prescribes emission limit values forvirtually all air pollutants as well as structural and operational requirements designed to limitdiffuse emissions.

Annexes
410 Waste Water and Waste Gas Treatment
The emission limit values contained in the TA Luft represent state-of-art for technical measuresfor reducing emissions (dating from 1986). These values were developed referring to scientificfindings and research, taking into account toxicological, bioaccumulative and epidemiologicalaspects.
Emission control requirements laid down in the TA LuftEmitted
substance(TA Luft section)
Class SubstancesMass flowthreshold
[g/h]
Concen-tration limit
[mg/m³]Total dust ≤500
≥50015050
I (Hg, Cd, Tl) Sum of substances ≥1 0.2II (As, Co, Ni, Te, Se) Sum of substances ≥5 1III (e.g. Sb, Pb, Cr, CN, F,
Cu, Mn, Pt, Pd, Rn, V, Sn,substances wich arestrongly suspected tocause cancer)
Sum of substances
≥25 5
I+II Sum of substances 1
Inorganic dustparticles(3.1.4)
I+III, II+III Sum of substances 5I (e.g. AsH3) Per substance ≥10 1II (e.g. HF, Cl2, H2S) Per substance ≥50 5III (e.g. Cl-compounds as
HCl)Per substance ≥300 30
Vaporous orgaseous inorganicsubstances(3.1.6)
IV (e.g. SO2 + SO3 as SO2,NO + NO2 as NO2)
Per substance≥5000 500
I (e.g. Chlormethane) ≥100 20II (e.g. Chlorbenzene) ≥2000 100
Organicsubstances (3.1.7)
III (e.g. Alkylalcohols)
Classificationaccording toAnnex E of TA Luft ≥3000 150
Vaporous orgaseous emissioneduring treatmentand refilling oforganic substances(3.1.8)
Requirements for the minimization of diffuse organic emyission by the installation oftechnical equipment, e.g. pumping units, compressors, flanged joints, stop valvesand in sampling stations
Carcinogens(2.3)
I (e.g. Cd1), As1), asbestos,benzo(a)pyren)
Sum of substances ≥0.5 0.1
II (e.g. Ni, chromium VI) Sum of substances ≥5 1III (e.g. Acrylonitrite,
benzene)Sum of substances ≥25 5
1) Based on the decision adopted by the Conference of the Federal Government/Federal States Ministers for theEnvironment on 21/22. November 1991, an emission concentration value of 0.1 mg/m³ has been stipulated for Cd andits compounds, given as Cd, as well as for As and its compounds, given as As.
The required emission limits are given in mass of emitted substances related to the volume of emitted gas understandard conditions (0°C, 101.3 kPa) after subtraction of the water vapour content.
If organic substances in several classes are present, the mass concentration in the emitted gas should not exceed atotal of 0.15 mg/Nm3 with a total mass flow of 3 kg/h or more.
In the case of high emission mass flows, emissions have to be monitored continuously.
No daily mean value of the respective emitted substances should exceed the required emissionlimits, 97 % of all half-hourly means should not exceed six fifths of the required emissionlimits, and all half-hourly means should not exceed the required emission limits by more thantwice.

Annexes
Waste Water and Waste Gas Treatment 411
Specific emission control requirements laid down in the TA Luft for organic chemical industrySector Requirements
Production of 1,2-dichloro-ethane (EDC) andvinylchloride (VC)(3.3.4.1.g.1)
Limit emission concentration: 5 mg/Nm3 EDC or VC
Production of acrylnitrile(AN)(3.3.4.1.g.2)
Limit emission concentration: 0,2 mg/Nm3 ANWaste gases from distillation or refilling have to be reduced
Production of pesticideagents(3.3.4.1.g.3)
DustIn the case of production of pesticides, which are pesistent or accumulatingor restricted according to the directive on Bans on the Placing on the Marketand the Use of Plant Protecting Agents Containing Particular ActiveSubstanceslimit emission concentration: 5 mg/Nm3 (mass flow threshold: ≥25 g/h)
Plant for milling,mixing,refilling and packaging ofpesticides(3.3.4.2.1)
Limit emission concentration: 5 mg/Nm3 dust
Regulations on Water QualityThe legal framework for water management is the Federal Water Act [Wasserhaushaltsgesetz -WHG]. The WHG applies to waste water generated by various industrial processes. The usageof surface, coastal, and ground waters requires the approval of the competent authority.Discharges into water are regulated in the Waste Water Ordinance including its Annexes[Abwasserverordnung, AbwV]. It specifies the minimum requirements to be stipulated whengranting a permit to discharge waste water from the source categories listed in the Appendicesinto receiving water.
Issued by the Federal Government in consent with the Federal States (Länder), these minimumrequirements bind the authority competent for licensing and controlling the discharges.Depending on the local conditions, more stringent requirements can be established. Theminimum requirements are based on the ‘emission principle’ and the precautionary principle.General requirements according to the Waste Water Ordinance are covered by the Article 3listed below:
General requirements
i. unless otherwise stated in the Appendices, a permit to discharge waste water intowaterbodies shall only be granted if the pollutant load at the site of occurrence, based onan examination of the conditions in each individual case, is kept as low as the use ofwater-saving procedures such as washing and cleaning operations, indirect cooling and theuse of low-pollutant feedstocks and auxiliary materials permit
ii. the requirements of this Ordinance must not be met by means of procedures wherebyenvironmental pollution is transferred to other environmental media such as air or soil,contrary to state-of-art
iii. requirements specified in the form of concentration levels must not be achieved viadilution, contrary to state-of-art
iv. if requirements prior to blending are specified, then blending shall be permissible for thepurpose of joint treatment, provided at least the same overall reduction of contaminantload per parameter is achieved as would be the case via separate compliance with therelevant requirement
v. if requirements are specified for the site of occurrence of waste water, blending is onlypermissible provided these requirements are adhered to
vi. if waste water flows which are subject to differing requirements are discharged jointly,then the relevant decisive requirement for each parameter shall be determined by means ofalligation
vii. if requirements governing the site of occurrence of the waste water or prior to blending areimposed in the applicable Appendices, then paragraphs iv and v shall remain unaffected.

Annexes
412 Waste Water and Waste Gas Treatment
The requirements refer to the point at which the waste water is discharged into the waterbodyand, when specified in the appendices to this ordinance, also to the site of occurrence of thewaste water or the site prior to blending thereof. The point of discharge is synonymous with theoutlet from the waste water plant where the waste water was last treated. The site prior toblending is also the point of discharge into a public waste water plant.
If a level specified by this ordinance is not complied with based on the results of analysis withinthe context of government monitoring, it shall nevertheless be deemed to have been met,provided the results of this and the four preceding government analyses do not exceed the levelin four cases and no result exceeds the level by more than 100 %. Analyses conducted morethan three years ago shall be disregarded.
The productions of the specific sectors are covered by Annexesof this regulation. The relevantannexes for the chemical sector are:
• Annex 22 (Chemical industry)• Annex 36 (Production of hydrocarbons)
Appendix 22 on Chemical industry
“A. Scope of application(1) This Appendix shall apply to waste water originating primarily from the production ofsubstances using chemical, biochemical or physical techniques, including the relatedpretreatment, intermediate treatment and after-treatment.(2) This Appendix shall not apply to waste water discharges of less than 10 m3 per day.(3) For waste water derived from formulation (i.e. the manufacture of substances andpreparations by blending, dissolving or bottling) which is discharged without being blendedwith other waste water falling under the scope of application of this Appendix, only part B ofthis Appendix shall apply.
B. General requirementsA permit for the discharge of waste water into waterbodies shall only be granted, subject to therequirement that the contaminant load at the site of occurrence of the waste water is kept as lowas the following measures permit, after investigating the situation in each individual case:
- Use of water-saving techniques, such as countercurrent washing- Multiple use and recirculation, e.g. with washing and purifying processes- Indirect cooling, e.g. to cool vapour phases instead of using jet condensers or jet coolers- The use of waste water-free techniques to generate vacuums and for waste air purification- The retention or recovery of substances via the preparation of mother liquor and by means
of optimised techniques- The use of low-pollutant raw and auxiliary materials.
Proof of compliance with the general requirements shall be furnished in the form of a wastewater register.
C. Requirements for waste water at the point of discharge(1) The following requirements apply to the waste water at the point of discharge into the
waterbody:
1. Chemical oxygen demand (COD)a) For waste water flows whose COD concentration at the site of occurrence of waste
water is more than 50000 mg/l, a COD concentration of 2500 mg/l shall applyb) more than 750 mg/l, a COD concentration equivalent to a 90% reduction in COD
shall applyc) 750 mg/l or less, a COD concentration of 75 mg/l shall applyd) less than 75 mg/l, the actual COD concentration at the site of occurrence shall
apply.

Annexes
Waste Water and Waste Gas Treatment 413
The requirements shall also be deemed to have been met provided a COD concentrationof 75 mg/l in the qualified random sample or 2-hour composite sample is adhered to,with due regard for part B.
2. Total nitrogen as the sum of ammonia, nitrite and nitrate nitrogen (Ntot): 50 mg/l in thequalified random sample or 2-hour composite sample. A higher concentration of up to75 mg/l may be specified in the water discharge licence, provided a 75 % reduction inthe nitrogen load is adhered to. The set value shall also be deemed to have been met,provided the level defined as “total bounded nitrogen (TNb)” is adhered to.
3. Total phosphorous: 2 mg/l in the qualified random sample or 2-hour composite sample.This requirement shall also be deemed to have been met provided the level defined as“phosphorous compounds as total phosphorous” is adhered to.
4. ToxicityFish toxicity TF = 2Daphnia toxicity TD = 8Algae toxicity TA = 16Luminescent bacteria test TL = 32Mutagenic potential (umu test) TM = 1.5
The requirements refer to the qualified random sample or the 2-hour composite sample.
(2) If process-integrated measures are applied to reduce the COD load by arrangement with thewater authority, then the decisive load prior to implementation of the measure shall be usedas a basis.
(3) For chemical oxygen demand (COD), the total load in 0.5 or 2 hours shall be limited in thewater discharge licence. The total load is the sum of the individual loads from the individualwaste water flows. The total load which must not be exceeded refers to the concentration inthe qualified random sample or 2-hour random sample and the volumetric flow of wastewater in 0.5 or 2 hours corresponding to sampling.
D. Requirements on waste water prior to blending(1) The following requirements apply to waste water prior to blending with other waste water:
Adsorbable organic halogens (AOX)a) Waste water from the manufacture of epichlorhydrin, propylene oxide andbutylene oxide 3 mg/l
b) Waste water from the two-stage manufacture of acetaldehyde 80 g/tc) Waste water from the single-stage manufacture of acetaldehyde 30 g/td) Waste water from the manufacture of AOX-relevant organic colorants andaromatic intermediate products, where these are predominantly used tomanufacture organic colorants
8 mg/l
e) Waste water from the manufacture of AOX-relevant active pharmaceuticalingredients
8 mg/l
f) Waste water from the manufacture of C1 chlorinated hydrocarbons by meansof methane chlorination and methanol esterification, and of carbon tetrachlorideand perchloroethane by means of perchlorination
10 g/t
g) Waste water from the manufacture of 1,2 dichloroethane (EDC), includingfurther processing to vinyl chloride (VC)
The load level refers to the production capacity for purified EDC. The capacityshould be specified with due regard for the EDC portion which is not cracked inthe VC unit linked to the EDC production unit and which is returned to theproduction cycle in the EDC purification plant.
2 g/t
h) Waste water from the manufacture of polyvinyl chloride (PVC) 5 g/ti) Waste water flows with an AOX concentration of more than 0.1 mg/l and lessthan 1 mg/l without targeted measures 0.3 mg/l
j) Waste water flows from the manufacturing, further processing and applicationof substances which are not separately regulated elsewhere witha concentrationof more than 1 mg/l is exceeded or less than 1 mg/l via targeted measures
1 mg/l or20 g/t
The load level refers to the capacity of the organic target products. It does not apply to the application ofsubstances.

Annexes
414 Waste Water and Waste Gas Treatment
Other substancesQualified random sample or
2-hour composite sample[mg/l]
Mercury 0.05 0.001Cadmium 0.2 0.005Copper 0.5 0.1Nickel 0.5 0.05Lead 0.5 0.05Total chromium 0.5 0.05Zinc 2 0.2Tin 2 0.2The requirements in column I apply to waste water flows from the manufacturing, further processing orapplication of these substances. The requirements in column II refer to waste water flows not originatingfrom the manufacturing, further processing or application of these substances but which are neverthelesscontaminated with such substances below the concentration levels in column I.
(2) Upon compliance with the AOX requirements and the general requirements pursuant to partB, the requirements of Appendix 48, part 10 shall also be deemed to have been met.
(3) The AOX requirements shall not apply to iodo-organic substances in waste water from themanufacturing and bottling of X-ray contrast media.
(4) For adsorbable organic halogens (AOX) and the substances limited in paragraph (1),number 2, the total load per parameter in 0.5 or 2 hours shall be limited in the waterdischarge licence. The respective total load is derived from the sum of the individual loadsof the separate waste water flows. The total load which must not be exceeded refers to theconcentration in the qualified random sample or 2-hour composite sample and thevolumetric flow of waste water in 0.5 or 2 hours corresponding to sampling.
(5) A waste water flow may only be blended with other waste water, subject to the furnishing ofproof that the load of total organically bonded carbon (TOC) in this waste water flowascertained for the site of occurrence is reduced by 80 % overall. This requirement shall notapply where the residual TOC load discharged from the respective waste water flow intowaterbodies does not exceed 20 kilograms per day or 300 kilograms per year or 1 kilogramper tonne of production capacity of the organic target product. When proving the reductionin load, in the case of physico-chemical waste water treatment plants, the TOC eliminationlevel of such plants shall be used as a basis, whereas in the case of biological waste watertreatment plants, the result of a study pertaining to number 407 of the Annex to Article 4shall be used as a basis.
E. Requirements on the waste water at the site of occurrence(1) For chromium VI, a concentration of 0.1 mg/l in the random sample shall be adhered to.(2) For volatile organically bonded halogens, a concentration of 10 mg/l in the random sample
shall be adhered to. This requirement shall be deemed to have been met, provided it isachieved prior to the inlet into a sewage system without prior risk of leakage losses andwithout the waste water having been diluted.
F. Requirements for existing discharges(1) For existing discharges of waste water from installations which were lawfully in operation
prior to 1 January 1999 or whose construction had lawfully commenced by this date, theprovisions in parts A, B, C and D shall only apply insofar as no requirements to the contraryare specified in paragraphs (2) to (5).
(2) Notwithstanding part B, proof of compliance with the general requirements in a waste waterregister must only be provided for 90 % of the parameter-related total loads in each case.The use of waste water-free techniques to generate a vacuum and for waste air purificationmust only be tested for the parameters specified in parts D and E. Additional testing withrespect to other parameters is unnecessary.
(3) The requirements of part C pertaining to COD shall not apply to waste water from themanufacture of polyacrylonitrile.
(4) Notwithstanding part D, the following AOX requirements shall apply to the following wastewater flows prior to blending with other waste water:
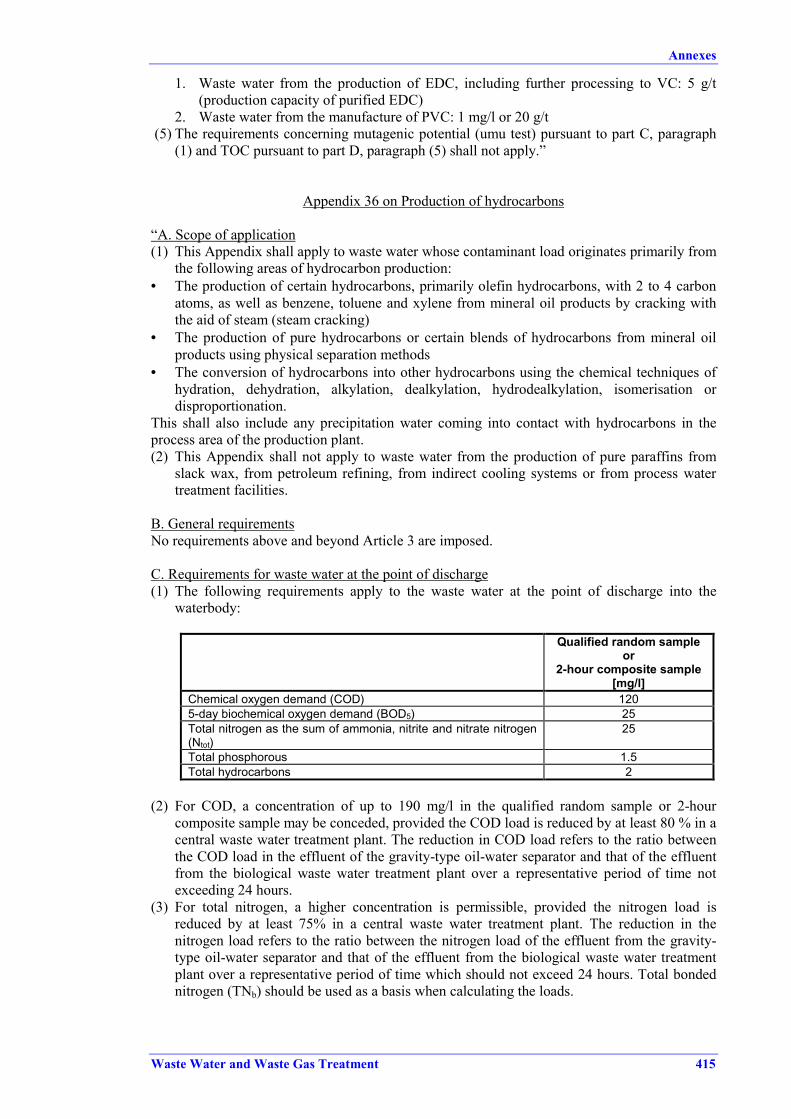
Annexes
Waste Water and Waste Gas Treatment 415
1. Waste water from the production of EDC, including further processing to VC: 5 g/t(production capacity of purified EDC)
2. Waste water from the manufacture of PVC: 1 mg/l or 20 g/t (5) The requirements concerning mutagenic potential (umu test) pursuant to part C, paragraph
(1) and TOC pursuant to part D, paragraph (5) shall not apply.”
Appendix 36 on Production of hydrocarbons
“A. Scope of application(1) This Appendix shall apply to waste water whose contaminant load originates primarily from
the following areas of hydrocarbon production:• The production of certain hydrocarbons, primarily olefin hydrocarbons, with 2 to 4 carbon
atoms, as well as benzene, toluene and xylene from mineral oil products by cracking withthe aid of steam (steam cracking)
• The production of pure hydrocarbons or certain blends of hydrocarbons from mineral oilproducts using physical separation methods
• The conversion of hydrocarbons into other hydrocarbons using the chemical techniques ofhydration, dehydration, alkylation, dealkylation, hydrodealkylation, isomerisation ordisproportionation.
This shall also include any precipitation water coming into contact with hydrocarbons in theprocess area of the production plant.(2) This Appendix shall not apply to waste water from the production of pure paraffins from
slack wax, from petroleum refining, from indirect cooling systems or from process watertreatment facilities.
B. General requirementsNo requirements above and beyond Article 3 are imposed.
C. Requirements for waste water at the point of discharge(1) The following requirements apply to the waste water at the point of discharge into the
waterbody:
Qualified random sampleor
2-hour composite sample[mg/l]
Chemical oxygen demand (COD) 1205-day biochemical oxygen demand (BOD5) 25Total nitrogen as the sum of ammonia, nitrite and nitrate nitrogen(Ntot)
25
Total phosphorous 1.5Total hydrocarbons 2
(2) For COD, a concentration of up to 190 mg/l in the qualified random sample or 2-hourcomposite sample may be conceded, provided the COD load is reduced by at least 80 % in acentral waste water treatment plant. The reduction in COD load refers to the ratio betweenthe COD load in the effluent of the gravity-type oil-water separator and that of the effluentfrom the biological waste water treatment plant over a representative period of time notexceeding 24 hours.
(3) For total nitrogen, a higher concentration is permissible, provided the nitrogen load isreduced by at least 75% in a central waste water treatment plant. The reduction in thenitrogen load refers to the ratio between the nitrogen load of the effluent from the gravity-type oil-water separator and that of the effluent from the biological waste water treatmentplant over a representative period of time which should not exceed 24 hours. Total bondednitrogen (TNb) should be used as a basis when calculating the loads.

Annexes
416 Waste Water and Waste Gas Treatment
D. Requirements on waste water prior to blendingThe following requirements shall apply to the waste water prior to blending with other wastewater:
Qualified random sample or 2-hour composite sample
[mg/l]
Randomsample[mg/l]
Adsorbable organic halogens (AOX) - 0.1Phenol index after distillation and dye extraction 0.15 -Benzene and derivatives 0.05 -Sulphide sulphur and mercaptan sulphur 0.6 -
If hydrocarbon production also includes the manufacture of ethylbenzene and cumene, an AOXlevel of 0.15 mg/l shall apply.
E. Requirements on waste water for the site of occurrenceWaste water from the production of ethylbenzene and cumene must not exceed a level of 1 mg/lfor adsorbable organic halogens (AOX) in the random sample.”
7. GREECE
No information supplied.
8. IRELAND
Releases to air:The reference conditions for concentrations of substances in emissions to air from containedsources are:
For non-combustion gases: Temperature: 273 KPressure: 101.3 kPano correction for water vapour
For combustion gases: Temperature: 273 KPressure: 101.3 kPadry gasOxygen content: 3 % (dry) for liquid and gaseous fuel 6 % (dry) for solid fuel
Achievement of emission limit value (ELV) concentrations by the introduction of dilution air isnot permitted.
For continuously monitored emissions, the following will be required for compliance withmeasurements based on 30 minute mean values (unless otherwise stated):
i. 97 % of all 30 minute mean measurements shall be below 1.2 times the emission limit ii. no 30 minute measurement shall exceed 2.0 times the emission limit iii. all daily mean values shall be less than the emission limit.
Where periodic monitoring is used to check compliance, all samples should meet the consentconditions.

Annexes
Waste Water and Waste Gas Treatment 417
Emission Limit Values for Fertiliser ProductionProcess Source ELV (mg/Nm3)
Ammonium nitrate production Prill towers - particulate - ammonia
1510
Ammonium nitrate production Neutralisers/reactors/coolers/driers - particulate - ammonia
3050
Ammonium nitrate procuction Evaporators - particulate -ammonia
1550
Ammonium phosphateproduction
- particulate - ammonia
1510
Other fertiliser production - particulate - sulphur oxides (as SO2) - nitrogen oxides (as NO2) - ammonia - fluorides (as HF)
502002005010
Emission Limit Values for Sulphuric Acid ProductionProcess Minimum conversion rate (SO2 to SO3)
New process Steady state: 99.7 %Start up: 98 %(hourly average for first 5 hours)
Emission Limit Values for Ammonia ProductionSource Emission ELV (mg/Nm3)
Steam reforming plants Nitrogen oxides (as NO2 at 3 % O2) 450Sulphur dioxide (natural gas fuelled) 2Carbon monoxide 10Diffuse emissions 1 t/yrNitrogen oxides (non-continuousemissions as NO2)
20 kg/h
Purge gas scrubber 40 g NH3 per tonne NH3produced
Partial oxidation plants – auxiliaryboiler flue gas
Sulphur dioxide 1700
Nitrogen oxides (as NO2) 700Carbon monoxide (hourly maximum) (daily average)
17510
Particulates (hourly maximum)(active ingredient) (daily average)
5010
Partial oxidation plants – steamsuperheater flue gas
Nitrogen oxides (as NO2) 450
Sulphur dioxide (natural gas fuelled) 2Carbon monoxide 30Hydrogen sulphide 0.3Methanol 100
Emission Limit Values for Specific MaterialsParameter mg/Nm3 Mass flow threshold for ELVs
Cadmium 0.1 >1 g/hChlorides (as HCl) 10 >0.3 kg/hIodides (as HI) 5 >50 g/hCarbon disulphide 5 >0.1 kg/hHydrogen cyanide 2 >50 g/hMercaptans 2 >0.1 kg/hAmines (total) 10 >0.1 kg/hTrimethylamine 2 >0.1 kg/hPhenols / cresols / xylols 10 >0.1 kg/h1,2-Dichloroethane 5 >0.1 kg/h

Annexes
418 Waste Water and Waste Gas Treatment
Emission Limit Values for Specific MaterialsParameter mg/Nm3 Mass flow threshold for ELVs
Dust – pesticide contaminated a 0.15 >1 g/hDust – pharmaceutical a 0.15 >1 g/hBromine 10 >50 g/hChlorine 10 >50 g/hIodine 10 >50 g/hMercury 0.1 >1 g/hTotal heavy metals 1.5 >5 g/hNitrogen oxides (as NO2) 300 >3 kg/hSulphur oxides (as SO2) 300 >3 kg/hParticulates - general 20 >0.5 kg/h1,1-Dichloroethene 5 >0.1 kg/hAcrylonitrile 20 >0.1 kg/hToluene diisocyanate 1 >0.1 kg/hEthyl acrylate 1 b
Isobutyl acrylate 1 b
Methyl acrylate 5 b
n-Butyl acrylate 5 b
t-Butyl acrylate and higheracrylate esters
20 b
a Dust as active ingredientb Only applicable to vents from bulk storage (>20 tonnes)
Emission Limit Values for General Emissions to Air (excluding Incinerator Emissions) for Materialsnot already covered by the Tables above
Constituent group a orparameter Class Mass flow threshold
for ELV b ELV (mg/Nm3)
Carcinogenicsubstances
T.A. Luft IT.A. Luft IIT.A. Luft IIISubstances (other thanthose above) with R45designation
>0.5 g/h>5.0 g/h
>25.0 g/h>0.5 kg/h
0.11.05.05.0
Inorganic dust particlesT.A. Luft IT.A. Luft IIT.A. Luft III
>1 g/h>5 g/h
>25 g/h
0.21.05.0
Vaporous or gaseousinorganic substances
T.A. Luft IT.A. Luft IIT.A. Luft IIIT.A. Luft IV
>10 g/h>50 g/h
>0.3 kg/h>5.0 kg/h
15
30500
Organic substances withphotochemical ozonepotential - POCP
U.K. AEA 1U.K. AEA 2
>0.5 kg/h>2.0 kg/h
2050
Organic substances cT.A. Luft IT.A. Luft IIT.A. Luft III
>0.1 kg/h>2.0 kg/h>3.0 kg/h
20100150
General dusts <0.5 kg/h>0.5 kg/h
15020
Pharmaceutical andpesticide dust (as activeingredient)
>1 g/h 0.15
Fugitive emission d
Footnotes to the table:a Where a substance falls into more than one category, the lower ELV applies.b The mass flow is calculated in kg/h for the raw gas and is determined at the point before anygas cleaning or abatement plant, but after any devices inherent in the process (e.g. after reactoroverhead condensers or after product cyclones). Mass flow is the maximum emission which canoccur over any one hour period of plant operation, from the entire site. Where the mass flowexceeds the mass threshold, then abatement will be required down to the appropriate ELV,unless the concentration of the raw gas is already below the ELV, in which case no furtherabatement is required.

Annexes
Waste Water and Waste Gas Treatment 419
c Where organic substances of several classes are present, in addition to the above limit, the sumof classes I and II shall not exceed the class II limit and the sum of classes I, II and III shall notexceed the class III limit.d Fugitive solvent emissions should comply with the requirement of the Solvent Directive(Council Directive 1999/13/EC [cww/tm/88]) or licence as appropriate
Releases to water:The ELVs for discharges to water are based on 24 hours flow proportional composite samples,unless otherwise specified.
Effluent load should be minimised by recovery of materials wherever practible. The use oflower quality water may be possible for some parts of the process rather than fresh water.
Excluding uncontaminated rainwater, all releases to waters are subject to a licence from theEnvironmental Protection Agency. However, any discharge to a sewer will require the consentof the local authority or sewerage undertaker. BATNEEC to minimise the release of substanceswill generally include minimisation at source and either specific treatment of contaminatedwaste streams to remove particular substances or co-treatment of combined effluent streams orboth.
Emission Limit Values for Discharges to Water a
Constituent group orparameter ELV Footnote
pH 6-9 5Number of Toxicity Units 10 2, 5Total Nitrogen (as N) >80 % removal or 15 mg/l 5Total phosphorous (as P) >80 % removal or 2 mg/l 5Total ammonia (mg/l as N) 10 5Oils, fats and grease (mg/l) 10 5Organohalogens (mg/l) 0.1 (monthly means) 4, 5Phenols (mg/l) 1.0 5Cyanide (mg/l as CN) 0.2 5Mercury (mg/l) 0.05 5, 7Tin (mg/l) 2.0 5, 7Lead (mg/l) 0.5 5, 7Chromium(VI) (mg/l as Cr) 0.1 5, 7Total chromium (mg/l as Cr) 0.5 5, 7Cadmium (mg/l) 0.05 5, 7Zinc (mg/l) 0.5 5, 7Copper (mg/l) 0.5 5, 7Mineral oil (mg/l) interceptors 20 5Mineral oil (mg/l) biologicaltreatment
1.0 5
Directive 76/464/EC, List 1 according to list 1BTX (mg/l combined) 0.1 (monthly means)Genetically modified organisms as per Directive 90/219/EEC and
S.I. No. 345 of 1994BOD ≥91 % total removal 1COD ≥75 % total removal 1, 6Fish tainting No tainting 3
Footnotes to the table:a All values refer to daily averages, exept where otherwise stated to the contrary, and except forpH which refers to continuous values.1 The daily raw waste load for BOD/COD is defined as the average daily mass arising fortreatment over any three month period. Calculation of the removal rates for BOD/COD shouldbe based on the differences between the waste loads arising for disposal and those discharges tothe receiving waters. The amounts removed by treatment (physical, chemical, biological) maybe included in the calculation. Calculation of the raw waste loads of BOD/COD shall excludeany waste load associated with microbial cell biomass removal and solvent recovery. However,residual amounts remaining after these practices may be included in the raw waste load

Annexes
420 Waste Water and Waste Gas Treatment
calculation. For certain specific effluents where the BOD/COD removal rates are unattainable, aconcentration limit may be more appropriate. This will be a matter for inclusion in a licence.2 Toxicity unit = 100/x hour E(L)C50 in vol-%, where x is defined by the test procedure. Thetoxicity of the process effluent to at least two appropriate aquatic species shall be determined.3 No substance shall be discharged in a manner, or at a concentration which, following initialdilution, causes tainting of fish or shellfish, interferes with normal patterns of fish migration oraccumulates in sediments or biological tissues to the detriment of fish, wildlife or theirpredators.4 Within 6 months of the commencement of production (or as may be relevent on a campaignbasis), the effluent should be screened for a priority pollutant list.5 Consent conditions for these parameters for discharge to municipal treatment plants can beestablished with the licencing authority and different values may apply.6 This limit applies only to
- manufacture of chemicals in an integrated chemical installation- manufacture of olefins and their derivatives or of monomers and polymers, including
styrene and vinyl chloride- manufacture, by way of chemical reaction processes, of organic or organo-metallic
chemical products- manufacture of pesticides, pharmaceutical or veterinary products and their
intermediates.7 Where the metallic content of the effluent arises as an unavoidable contaminant of rawmaterials, then these limits may not apply
9. ITALY
Emissions to Air
"Emission limit values for the containment of pollutant emissions from existing plants"[Supplemento ordinario N. 51 alla Gazzetta Ufficiale Italiana n. 176 del 30 luglio 1990 – Seriegenerale]
The emission limit values for existing plants (i.e. plants built or authorised before the approvalof the law above) are set by three Annexes:
Annex 1 reports general emission limit valuesAnnexes 2 and 3 list specific limits and prescriptions for the activities reported thereinAnnex 4 reports sampling, analysis and emissions assessment methodsAnnex 5 reports abatement techniquesAnnex 6 reports diffuse emissionsAnnex 7 reports fugitive emissions
Please note:Only an extract of Annex 2 is reported in this document.Limit emission values have not yet been set for the new plants in Italy.
ANNEX 1 (GENERAL EMISSION LIMIT VALUES):
1.1 Substances considered as carcinogenic and/or teratogenic and/or mutagenic (Table A1)1.2 Substances with very high toxicity and bioaccumulability (Table A2)2. Inorganic substances, preferably in the form of dust (Table B)3. Inorganic substances, preferably in the form of gas or vapour (Table C)4. Organic substances in the form of gas, vapour or dust (Table D)5. Total dust

Annexes
Waste Water and Waste Gas Treatment 421
ANNEX 2 (SPECIFIC EMISSION LIMITS FOR THE PLANTS LISTED BELOW):
1. Combustion plants with thermal power <50 MW2. Essication plants3. Internal combustion engines4. Gas turbines fixed5. Waste incinerators6. Cement plants7. Furnaces for the calcination of bauxite, dolomite, gypsum, limestone, diatomite, magnesite,
quartzite8. Furnaces for the production of glass9. Furnaces for the baking of clay ceramic products10. Plants for the fusion of mineral products, particularly of basalt, diabase or slag11. Plants for the production of ceramic tiles12. Plants for the agglomeration of pearlite, schist or expanded clay13. Plants for the production or the fusion of compounds of bitumen of tars, and mineral
products included the plants for the preparation of roads works materials based on bitumenand the plants for the production of rubble of tar
14. Dry coal distillation plants (cokeries)15. Plants for the agglomeration of iron mineral16. Plants for the production of pig iron17. Plants for the steel production by converter. Electric arc furnaces and under vacuum fusion
furnaces18. Iron and steel foundry19. Heat treatments furnaces for lamination plants and other treatments20. Plants for metal surface finishing with melted zinc21. Plants for metal surface treatments by nitric acid22. Plants for the production of iron alloys by electrothermal or pyrometallurgic processes23. Plants for the primary production of non-ferrous metal processes24. Plants for the production of aluminium25. Plants for the fusion of aluminium26. Plants for the secondary fusion of others non-ferrous metal and their alloys27. Plants for the production of lead accumulators28. Plants for the production of sulphur oxide, sulphuric acid and oleum29. Plants for the production of chlorine30. Claus plants for the production of sulphur31. Plants for the production, granulation and essication of phosphorous, nitrogen or potassium
containing fertilizers32. Plants for the production of acrylonitrile33. Plants for the production of pesticides active ingredients34. Plants for the production of polivinyl choride (PVC)35. Plants for the production of poliacrylonitrile polymers36. Plants for the production and manufacturing of viscose37. Plants for the production of nitrosylsulphuric acid38. Plants for the production of poliesters39. Plants of production of cellulose acetate fibres40. Plants for the production of poliammidic fibres41. Plants for the formulation specialties pesticides42. Plants for the nitration of cellulose43. Plants for the production of titanium dioxide44. Plants for the production of acrylic fibres45. Plants for the production of polycarbonate46. Plants for the production of black carbon47. Plants for the production of carbon or electrographite with burning, example electrodes
production48. Plants for the series painting of the automotives bodies and their components with exception
of bus bodies

Annexes
422 Waste Water and Waste Gas Treatment
49. Others painting plants50. Plants for the production of rubber products51. Plants for the impregnation of glass fibres or mineral fibres with resins52. Plants for the production of sugar53. Plants for extraction and the refining of olive husk oil54. Plants for extraction and the refining of seed oils
ANNEX 3 (LARGE UTILITIES AND SPECIFIC FIELDS):
A: Large Combustion PlantsField of applicationEmission values time requirements for complianceAbatement technique malfunction of abatement plants
B: Mineral Oil RefineriesField of applicationEmission valuesMeasurementsOther prescriptionsTime requirements for compliance of Refineries
C: Plants for the cultivation of hydrocarbons and geothermal fluidsApplication fieldCultivation of hydrocarbonsPlants using geothermal fluids
ANNEX 4 (SAMPLING, ANALYSIS AND EMISSIONS ASSESSMENT METHODS)
ANNEX 5 (ABATEMENT TECHNIQUES)
Summary tableApplication criteria
ANNEX 6 (DIFFUSE EMISSIONS)
ANNEX 7 (FUGITIVE EMISSIONS)
ANNEX 1: Mass flow threshold and concentration limits(standard conditions: 0 °C, 101.3 kPa; hourly values)
1.1 Substances considered as carcinogenic and/or teratogenic and/or mutagenic (Table A1)
Table A1
Class I
If the mass flow equals or exceeds 0.5 g/h: 0.1 mg/Nm3
- Asbestos (chrysotile, crocidolite,amosite, antofillite, actinolite andtremolite)
- Benzo(a)pyrene
- Beryllium and its compounds,expressed as Be
- Dibenzo(a,h)anthracene- 2-Naphthylamine and its salts

Annexes
Waste Water and Waste Gas Treatment 423
- Benzo(a)anthracene- Benzo(b)fluoranthene- Benzo(j)fluoranthene- Benzo(k)fluoranthene- Dibenzo (a,h) acridine
- Dibenzo(a)pyrene- Dimethylnitrosamine- 5-Nitroacenaphthene- 2-Nitronaphthalene- 1-Methyl-3-Nitro-1-Nitrosoguanidin
Class II
If the mass flow equals or exceeds 5 g/h: 1 mg/Nm3
- Arsenic and its compounds, expressedas As
- Chromium(VI) and its compounds,expressed as Cr
- Cobalt and its compounds, expressed asCo
- 3,3'-Dichlorobenzidine and its salts- Dimethyl sulphate- Ethylenimine- Nickel and its compounds, expressed as
Ni- 4-Aminobiphenyl and its salts
- Benzidine and its salts- 4,4'-Methylene-bis(2-Chloroanilin) and
its salts- Diethyl sulphate- 3,3'-Dimethylbenzidine and its salts- Hexamethylphosphorotriamide- 2-Methylaziridine- Methyl azoxymethyl acetate- Sulfallate- Dimethyl carbamoylchloride- 3,3'-Dimethoxybenzidine and its salts
Class III
If the mass flow equals or exceeds 25 g/h: 5 mg/Nm3
- Acrylonitrile- Benzene- 1,3-Butadiene- 1-Chloro-2,3-epoxipropane
(epichlorohydrine)- 1,2-Dibromoethane- 1,2-Epoxipropane- 1,2-Dichloroethane- VCM- 1,3-Dichloro-2-propanol
- Chloromethyl methyl ether- N,N-Dimethylhydrazine- Hydrazine- Ethylene oxide- Ethylene thiourea- 2-Nitropropane- Bis-Chloromethylether- 3-Propanolide- 1,3-Propane sultone- Styrene oxide
1.2 Substances with very high toxicity and bioaccumulability (Table A2)
Table A2
Class I
If the mass flow equals or exceeds 0.02 g/h: 0.01 mg/Nm3
- PCDD - PCDF
Class II
If the mass flow equals or exceeds 0.5 g/h: 0.5 mg/Nm3
- PCB- PCT
- Polychloronaphthenes

Annexes
424 Waste Water and Waste Gas Treatment
2. Inorganic substances, preferably in the form of dust (Table B)
Table B
Class I
If the mass flow equals or exceeds 1 g/h: 0.2 mg/Nm3
- Cadmium and its compounds,expressed as Cd
- Mercury and its compounds, expressedas Hg
- Thallium and its compounds, expressedas Tl
Class II
If the mass flow equals or exceeds 5 g/h: 1 mg/Nm3
- Selenium and its compounds, expressedas Se
- Tellurium and its compounds,expressed as Te
Class III
If the mass flow equals or exceeds 25 g/h: 5 mg/Nm3
- Antimony and its compounds,expressed as Sb
- Cyanides, expressed as CN- Chromium(III) and its compounds,
expressed as Cr- Manganese and its compounds,
expressed as Mn- Palladium and its compounds,
expressed as Pd- Lead and its compounds, expressed as
Pb
- Platinum and its compounds, expressedas Pt
- Quartz, pulverised, if in the form ofcrystallised silicon expressed as SiO2
- Copper and its compounds, expressedas Cu
- Rhodium and its compounds, expressedas Rh
- Tin and its compounds, expressed as Sn- Vanadium and its compounds,
expressed as V
3. Inorganic substances, preferably in the form of gas or vapour (Table C)
Both mass flows and concentrations refer to single substances or substances families.
Table C
Class I
If the mass flow is equals or exceeds 10 g/h: 1 mg/Nm3
- Chlorocyanide- Phosphine
- Phosgene
Class II
If the mass flow equals or exceeds 50 g/h: 5 mg/Nm3
- Hydrocyanidric acid- Bromine and its compounds, expressed
as hydrobromic acid- Chlorine
- Fluorine and its compounds, expressedas hydrofluoric acid
- Hydrogen sulphide

Annexes
Waste Water and Waste Gas Treatment 425
Class III
If the mass flow equals or exceeds 0.3 kg/h: 30 mg/Nm3
- gaseous or vaporous inorganic chlorine compounds, excluded chlorocyanide and phosgene,expressed as hydrochloric acid
Class IV
If the mass flow equals or exceeds 2 kg/h: 250 mg/Nm3
- Ammonia
Class V
If the mass flow equals or exceeds 5 kg/h: 500 mg/Nm3
- NOx (NO and NO2), expressed as NO2 - SOx (SO2 and SO3), expressed as SO2
4. Organic substances in the form of gas, vapour or dust (Table D)
Table D
Class I
If the mass flow equals or exceeds 25 g/h: 5 mg/Nm3
- Anisidine- Butylmercaptan- Chlorpicrine- Diazomethane- Dichloroacetylene- Dinitrobenzene- Dinitrocresol- Hexachlorobutadiene- Hexachlorocyclopentadiene- Hexafluoroacetone
- Diglycidyl ether- Ethyl acrylate- Ethylene imine- Ethylmercaptan- Isocyanates- Methyl acrylate- Nitroglycerine- Perchloromethylmercaptan- 1,4-Dioxane
Class II
If the mass flow equals or exceeds 0.1 kg/h: 20 mg/Nm3
- Acetaldehyde- Chloroacetic acid- Formic acid- Thioglycolic acid- Trichloroacetic acid- Phthalic anhydride- Maleic anhydride- Aniline- Benzylchloride- Biphenyl- Butyl acrylate- Butylamine- Camphor synthetic- Tetrabromomethane- Tetrachloromethane- Cyclohexylamine
- Chloroacetaldehyde- 1-Chloro-1-nitropentane- Cresol- Crotonaldehyde- 1,2-Dibutylaminoethanol- Dibutylphosphate- o-Dichlorobenzene- 1,1-Dichloroethene- Dichloroethylether- Dichlorophenol- Dichloromethane- Diethylamine- Diphenylamine- Diisopropylamine- Dimethylamine- Ethylamine

Annexes
426 Waste Water and Waste Gas Treatment
- Ethanolamine- 2-Ethoxyethanol- 2-Ethoxyethyl acetate- Phenol- Phthalates- 2-Furaldehyde- Furfurol- Triiodomethane- Isophorone- Isopropylamine- Methylacrilonitrile- Methylamine- Methylaniline- Bromomethane- Methyl n-butylbromide- Chloromethane- Methyl 2-cyanoacrilate- Methylstyrene- 2-Methoxyethanol- 2-Methoxyethanol acetate- Nitroethane
- Nitromethane- 1-Nitropropane- Nitrotoluene- Pyretre- Pyridine- Lead alkyls- 2-Propenal- 1,1,2,2-Tetrachloroethane- Tetrachloroethene- Tetranitromethane- m- and p-Toluidine- Tributyl phosphate- Trichlorophenol- Trichloroethene- Trichloromethane- Triethylamine- Trimethylphosphine- Vinylbromide- Xylenes (excluded 2,4-xylene)- Formaldehyde
Class III
If the mass flow equals or exceeds 2 kg/h: 150 mg/Nm3
- Acrylic acid- Acetonitrile- Propionic acid- Acetic acid- n-Butanol- i-Butanol- sec-Butanol- tert-Butanol- Methanol- Butyraldehyde- p-tert-Butyltoluene- 2-Butoxyethanol- Caprolactam- Carbon disulphide- Cyclohexanone- Cyclopentadiene- Chlorobenzene- 2-Chloro-1,3-butadiene- o-Chlorostyrene- o-Chlorotoluene- p-Chlorotoluene- Cumene- Diacetonalcohol (4-hydroxy-4-methyl-
2-pentanone)- 1,4-Dichlorobenzene- 1,1-Dichloroethane- Dichloropropane- Diethanolamine- Diethylformamide- Diisobutylketone
- N,N-Dimethylacetamide- N,N-Dimetylformamide- Dipropylketone- Hexamethylendiamine- n-Hexane- Ethylamylketone- Ethylbenzene- Ethylbutylketone- Ethyleneglycol- Isobutylglycidyl ether- Isopropoxyethanol- Methyl methacrylate- Methylamylketone- o-Methylcyclohexanone- Methyl chloroform- Methylformiate- Methylisobutylketone- Methylisobutylcarbinol- Naphthalene- Propyleneglycol- Propyleneglycol monomethyl ether- Propionaldehyde- Styrene- Tetrahydrofurane- Trimethylbenzene- n-Veratraldehyde- Vinyl acetate- Vinyltoluene- 2,4-Xylene

Annexes
Waste Water and Waste Gas Treatment 427
Class IV
If the mass flow equals or exceeds 3 kg/h: 300 mg/Nm3
- Propanol- Isopropanol- n-Amyl acetate- Methyl benzoate- n-Butyl acetate- Isobutyl acetate- Diethylketone- Difluorodibromomethane- sec-Hexyl acetate- Ethyl formiate
- Methyl acetate- Methylethylketone- Methylisopropylketone- N-Methylpyrrolidone- Pinene- n-Propyl acetate- Isopropylen acetate- Toluene- Xylene
Class V
If the mass flow equals or exceeds 4 kg/h: 600 mg/Nm3
- Acetone- Ethanol- Butane- Cyclohexane- Cyclohexene- Chloropentane- Chlorobromomethane- Chlorodifluoromethane- Chloropentafluoroethane- Dibromodifluoroethane- Dibutylether- Dichlorofluoromethane- Dichlorotetrafluoroethane- Diethylether- Diisopropylether
- Dimethylether- Heptane- Hexane (technical)- Isopropyl ether- Ethyl acetate- Methylacetylene- Methylcyclohexane- Pentane- 1,1,1,2-Tetrachloro-2,2-difluoroethane- 1,1,2,2-Tetrachloro-1,2-difluoroethane- Trichlorofluoromethane- 1,1,2-Tricloro-1,2,2-trifluoroethane- Trifluoromethane- Trifluorobromomethane
5. Total dust
The emission values are:
Class I
If the mass flow equals or exceeds 0.5 kg/h: 50 mg/Nm3
Class II
If the mass flow equals or exceeds 0.1 kg/h and remains below 0.5 kg/h: 150 mg/Nm3
Asbestos (particles in suspension and fibres): Emission limit value must not exceed0.1 mg/Nm3 [DLGS 17/03/1995, n. 114 Gazz. Uff. – Serie generale n. 92 del 20 Aprile 1995]
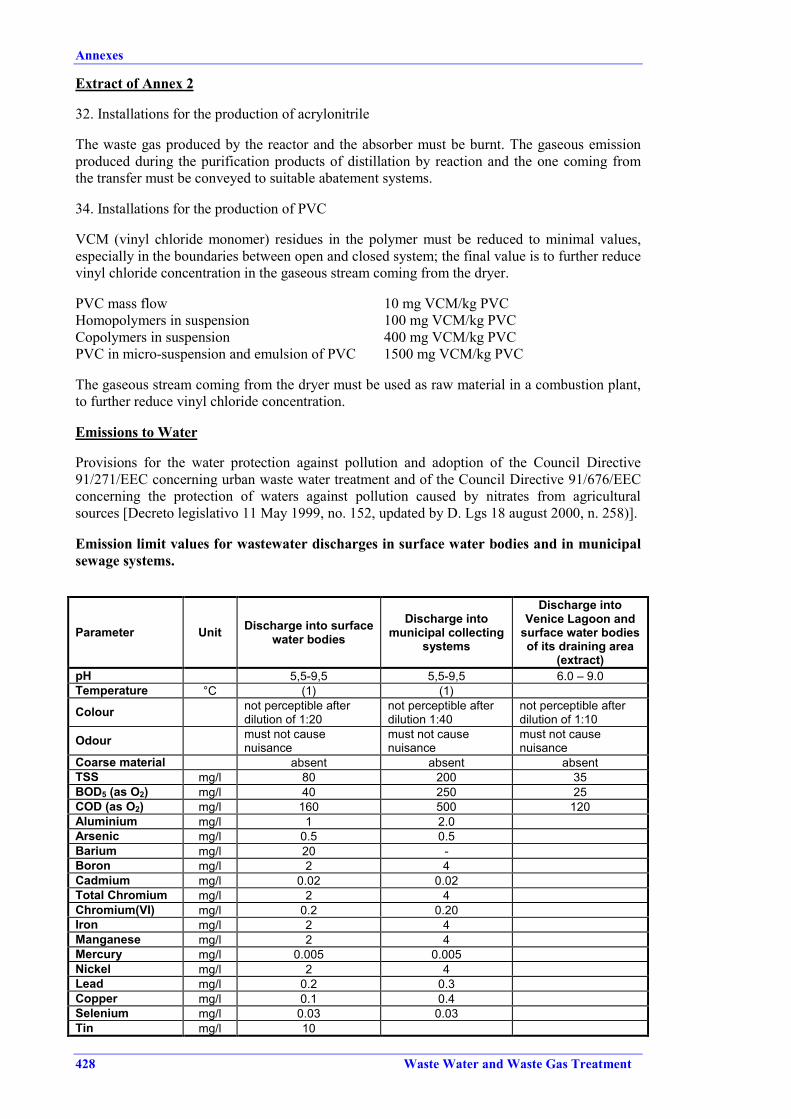
Annexes
428 Waste Water and Waste Gas Treatment
Extract of Annex 2
32. Installations for the production of acrylonitrile
The waste gas produced by the reactor and the absorber must be burnt. The gaseous emissionproduced during the purification products of distillation by reaction and the one coming fromthe transfer must be conveyed to suitable abatement systems.
34. Installations for the production of PVC
VCM (vinyl chloride monomer) residues in the polymer must be reduced to minimal values,especially in the boundaries between open and closed system; the final value is to further reducevinyl chloride concentration in the gaseous stream coming from the dryer.
PVC mass flow 10 mg VCM/kg PVCHomopolymers in suspension 100 mg VCM/kg PVCCopolymers in suspension 400 mg VCM/kg PVCPVC in micro-suspension and emulsion of PVC 1500 mg VCM/kg PVC
The gaseous stream coming from the dryer must be used as raw material in a combustion plant,to further reduce vinyl chloride concentration.
Emissions to Water
Provisions for the water protection against pollution and adoption of the Council Directive91/271/EEC concerning urban waste water treatment and of the Council Directive 91/676/EECconcerning the protection of waters against pollution caused by nitrates from agriculturalsources [Decreto legislativo 11 May 1999, no. 152, updated by D. Lgs 18 august 2000, n. 258)].
Emission limit values for wastewater discharges in surface water bodies and in municipalsewage systems.
Parameter Unit Discharge into surfacewater bodies
Discharge intomunicipal collecting
systems
Discharge intoVenice Lagoon and
surface water bodiesof its draining area
(extract)pH 5,5-9,5 5,5-9,5 6.0 – 9.0Temperature °C (1) (1)
Colour not perceptible afterdilution of 1:20
not perceptible afterdilution 1:40
not perceptible afterdilution of 1:10
Odour must not causenuisance
must not causenuisance
must not causenuisance
Coarse material absent absent absentTSS mg/l 80 200 35BOD5 (as O2) mg/l 40 250 25COD (as O2) mg/l 160 500 120Aluminium mg/l 1 2.0Arsenic mg/l 0.5 0.5Barium mg/l 20 -Boron mg/l 2 4Cadmium mg/l 0.02 0.02Total Chromium mg/l 2 4Chromium(VI) mg/l 0.2 0.20Iron mg/l 2 4Manganese mg/l 2 4Mercury mg/l 0.005 0.005Nickel mg/l 2 4Lead mg/l 0.2 0.3Copper mg/l 0.1 0.4Selenium mg/l 0.03 0.03Tin mg/l 10

Annexes
Waste Water and Waste Gas Treatment 429
Parameter Unit Discharge into surfacewater bodies
Discharge intomunicipal collecting
systems
Discharge intoVenice Lagoon and
surface water bodiesof its draining area
(extract)Zinc mg/l 0.5 1.0Total Cyanide(as CN) mg/l 0.5 1.0
Free activechlorine mg/l 0.2 0.3
Sulphide (as S) mg/l 1 2Sulphite (as SO2) mg/l 1 2Sulphate (as SO3)(2) mg/l 1000 1000
Chloride (2) mg/l 1200 1200Fluoride mg/l 6 12Totalphosphorus(as P) (3)
mg/l 10 10
Ammonium (asNH4) (3) mg/l 15 30
Nitrite (as N) (3) mg/l 0.6 0.6Nitrate (as N) (3) mg/l 20 30Fat andanimal/vegetableoil
mg/l 20 40
Totalhydrocarbons mg/l 5 10
Phenols mg/l 0.5 1Aldehydes mg/l 1 2Aromatic organicsolvents mg/l 0.2 0.4
Nitrogencontainingorganic solvents
mg/l 0.1 0.2
Total surfactants mg/l 2 4Pesticides(containingphosphorus)
mg/l 0.10 0.10
Total pesticides(exclusivephosphorouscontaining ones),and also:
mg/l 0.05 0.05
- Aldrin mg/l 0.01 0.01- Dieldrin mg/l 0.01 0.01
- Endrin mg/l 0.002 0.002- Isodrin mg/l 0.002 0.002
Chlorinatedorganic solvents mg/l 1 2
Escherichia coli(4)
cfu/100ml Footnote
Acute toxicitytest (5)
Sample considered notto be acceptable if after24 hours the fraction ofimmobilised testorganisms 50 %
Sample considerednot to be acceptable ifafter 24 hours thefraction ofimmobilised testorganisms 80 %
Footnotes to the table:(1) Dependent on the receiving water bodies, the following prescriptions apply:
• Running waters: The maximum temperature difference before and after the dischargepoint is 3°C
• Lakes: The wastewater temperature must be 30 °C and further than 50 meters from thedischarge point the temperature increase in the water body must be 3 °C

Annexes
430 Waste Water and Waste Gas Treatment
• Artificial channels: The maximum mean value temperature in any section must notexceed 35 °C
• Sea and estuary/delta zones of non significant rivers: The wastewater temperature mustnot exceed 35°C and further than 1000 meters from the discharge point the temperatureincrease in the water body must be 3 °C.
(2) These limits do not apply to wastewaters discharged into the sea (assimilation is providedfor sea coastal waters).(3) Industrial wastewaters discharged into sensitive areas must respect the total phosphorousand total nitrogen limits of 1 mg/l and 10 mg/l, respectively.(4) The general limit 5000 cfu/100 ml is recommended. The competent authority will establishthe most appropriate limit according to environmental, hygienic and sanitary situation of thewater body and to existing uses.(5) The toxicity test is obligatory. In addition to Daphnia magna test, acute toxicity tests can bedone on Ceriodaphnia dubia, Selenastrum capricornutum, bioluminescent bacteria or otherorganisms such as Artemia salina for salt containing wastewater effluents or other organismsthat will be indicated. The worst test result must be considered. A positive test is not straightpenalised, but the following actions are required: a deep analytical investigation, the search ofthe toxicity sources and their removal.
10. LUXEMBURG
No information supplied.
11. THE NETHERLANDS
The Netherlands has two main framework environmental acts: the ‘EnvironmentalManagement Act’ and the ‘Surface Water Pollution Act’. These acts together provide theframework for issuing environmental permits and for setting the conditions of the permits. Theacts comply with the requirements of the IPPC Directive and integrated permitting is guaranteedby a co-ordinated licensing procedure from the competent authorities. Both framework actsgovern a number of Decrees and Regulations that provide requirements with regard topotentially polluting activities.
The Netherlands emission Regulations (NeR) are concerned with process emissions to air andfunction as guidelines for the issuing of licences and/or for the adjustment of licensingconditions. The NeR has been used for guidance in the granting of licences from 1 May 1992.In the NeR, concentration standards for different substances are given, which constitute upperlimits for distinct point sources, depending on mass flow. Furthermore, in ‘special regulations’rules departing from the ‘general emission standards’ for certain industries or specificinstallations are given.
The emissions standards in the NeR are not legally binding and the NeR does not replaceexisting binding agreements. However, if the licensing authority wishes to depart from the NeR,the reasons for doing so must be stated explicitly in the preamble to the licence.
Voluntary agreementsVoluntary agreements or covenants (in Dutch: Convenanten) are declarations of intent on theimplementation of environmental policy for certain industrial sectors. The declarations of intentare agreements between the authorities and the industry. Participation in a covenant gives theauthorities and companies the advantage of a more transparent, coherent and predictable path ofenvironmental improvement and investments. The covenants are applied in two fields:
• general environmental performance on ‘traditional’ pollutants• energy efficiency.

Annexes
Waste Water and Waste Gas Treatment 431
General Environmental Performance on ‘Traditional’ PollutantsIn the declaration of intent of this voluntary agreement, the authorities have drawn up anIntegral Environmental Target Plan (IETP), based on the National Environmental PolicyPlan (NEPP), the Memorandum on Water Management, the North Sea Action Plan, theRhine Action Programme, the Memorandum on Energy Conservation and other officialplans at the time of signature.
The Integral Target Plan is concerned with environmental pollution of the traditional pollutants(SOx, NOx, VOC, heavy metals, PAH, etc.) caused by the relevant industrial sector. The IETPhas been drawn up in 1994/1995, and will be adjusted in 2000 and 2010. Apart from thereduction of emissions into the air, water and soil, the IETP also incorporates policy with regardto energy conservation, water conservation, soil clean up, hazard risk, odour nuisance, noise andinternal management systems. However, especially for energy conservation and CO2 reduction,two other covenants have been agreed upon.
For the chemical industry a declaration of intent was signed on April 2, 1993. A significantfactor is the understanding that in view of the wide range of disparate companies in the chemicalindustry, the contribution of each individual company to the implementation of the IETP in theindustry may vary. The responsibility of individual companies to contribute to theimplementation of the IETP in the industry requires that these companies take an active stance.The contribution of a company will be defined in Company Environmental Plans (‘BMPs’),which are drawn up by each company. These BMPs are renewed every four years and must beagreed upon by the licensing authority.
Energy Efficiency: Long-Term Agreements on Energy EfficiencyIn the Netherlands, ‘Long-Term Agreements on Energy Efficiency (MJAs)’ have been madebetween the Ministry of Economic Affairs and representative organisations of many industrialsectors. The most important aspect of the MJAs is the target value for improvement of energyefficiency in the relevant industrial sector within a certain time frame. For the elaboration of theMJAs, bilateral agreements are made between the individual companies and the facilitatingagency, which is NOVEM. For the chemical industry, an MJA was signed on 24 November1993 and the agreed improvement of energy efficiency was 20% over the period 1989-2000.The target has been achieved by the sector and a second round of MJAs is now in preparation,although most of the chemical industry companies will probably join the ‘Benchmarking’covenant.
Energy Efficiency: Benchmarking covenantThe Benchmarking covenant is an agreement between the Dutch authorities and the Dutchenergy intensive industry. In contrast to the above mentioned MJAs, no fixed quantified targetfor energy efficiency improvement is set. Instead, the industry agrees to belong to the world topin energy efficiency and the authorities will then refrain from impairing additional energy taxmeasures. The reason for this different approach is that in the light of international competition,industry has asked the government to look at the relative effort on energy efficiency of Dutchindustry in relation to their foreign competitors. The agreement is open to all companies with anenergy use of 0,5 PJ per year or more. The principle agreement was signed on July 6, 1999,between the industrial organisations and the authorities. Now that the principle agreement hasbeen signed, the agreement is open to individual companies to sign up to the covenant.

Annexes
432 Waste Water and Waste Gas Treatment
Emission Levels Associated With BAT for Process Emissions
Categories**Emission level
associated with BAT(mg/Nm3 )
Threshold(kg/hr) Remark
Extremely hazardous substances Dioxins & furans 0-0.1 ng/Nm3 I-TEQ no threshold Minimisation obligated PCB’s 0-0.1 ng/Nm3 pcb-TEQ no threshold Minimisation obligatedParticulates
Particulate matter 5–25 no thresholdDepending on techniqueapplied and processconditions
Carcinogenic substances* C1 0-0.1 0.0005 Minimisation required C1 + C2 0-1.0 0.005 Minimisation required C1 + C2 + C3 0-5.0 0.025 Minimisation requiredOrganic subst. (gas and vapour)* gO1 20 0.1 gO1 + gO2 100 2.0 gO1 + gO2 + gO3 100-150 3.0Organic subst. (solid)* sO1 5–10 no threshold See particulate matter sO2 and sO3 5–25 no threshold See particulate matterInorganic subst. (gas andvapour) gI1 1.0 0.01 gI2 5.0 0.05 gI3 30 0.3 gI4 200 5Inorganic substances (solid)* sI1 0.2 0.001 sI1 + sI2 1.0 0.005 sI1 + sI2 + sI3 5.0 0.025
* For the category of substances marked with an asterisk, the summation rule applies. This means that the given emission level applies to the sum of the substances in the relevant category plus those of the lower category.
** The different substances are classified below.
Classification of carcinogenic substancesCategory SubstanceC1 benzo(a)anthracene, benzo(a)pyrene, benzo(b)fluoranthene, benzo(j)fluoranthene,
benzo(k)fluoranthene, dibenzo(a,h)anthracene, 2-naphtylamine, 2-nitropropane, beryllium (andcompounds) as Be, chromium (VI) (and compounds) as Cr.
C2 3,3-dichlorobenzidine, diethylsulphate, dimethylsulphate, ethylene oxide, nickel (andcompounds) as Ni.
C3 acrylonitrile, benzene, buta-1,3-diene, 1,2-dibromomethane, 1,2-dichloroethane,epichlorohydrine, hydrazine, propylene oxide, vinyl chloride.
Organic substancesThe organic substances have been classified according to their ecotoxicity. Distiction is madebetween gases/vapours and solids (gO and sO). The standard applies to the emission of the sumof the substances (so called ‘summation rule’). Note that the classification as given above is notcomplete (the total list includes several hundred components), but some relevant substanceshave been included here.

Annexes
Waste Water and Waste Gas Treatment 433
Classification of organic substancesCategory SubstanceO1 many components (e.g. acetaldehyde, acroleine, acrylic acid, amino benzene/ethane/methane,
anilin, anthracene, bisphenol A, caprolactam, 1,2-dichlorobenzene, dichlorophenols,formaldehyde, methylamine, nitro-monocyclic-aromatics, organotins, phenol, pyridine,tetrachloromethane, trichlormethane).
O2 many components (e.g. 1,3/4-dichlorobenzene, cumene, ethyl-benzene, monochlorobenzene,styrene, tetrachloroethene, toluene, 1,1,1-trichloroethane, trichlorethene, xylenes)
O3 many components (e.g. dichloromethane, many alcohols, alkanes and ketones)
Inorganic substancesDistinction is made between gaseous and solid inorganics (gI and sI respectively). The reasonfor doing so is that the techniques that can be applied to reduce the emissions for gaseous andsolid components are different. The substances have been classified according to theirecotoxicity. The standard for solid inorganics applies to the emission of the sum of thesubstances (so called ‘summation rule’).
Classification of inorganic substancesCategory SubstancegI1 arsine, chlorocyane, chlorodioxide, diborane (B2H6), phosphine, phosgene.gI2 bromine (and compounds) as HBr, boron trichloride/trifluoride, chlorine, cynaic acid, fluorine
(and compounds) as HF, phosphoric acid, germaniumhydride, silicon tetrafluoride/tetrahydride,nitrogen trifluoride, hydrogen sulpide, sulphuric acid.
gI3 chlorine compounds as HCl, dichloro-siliconhydride, nitric acid, silicon tetrachloride, trichlorosiliconhydride, sulphur hexafluoride (SF6)
gI4 ammonia, nitrogen oxides (as NO2), sulphur oxides (as SO2)sI1 asbestos fibres*, arsenic (and compounds) as As*, cadmium (and compounds) as Cd*, iron
pentacarbonyl, mercury (and compounds) as Hg, platinum compounds as Pt, rhodiumcompounds as Rh, silica (cristoballite, tridymite)*, silver (and compounds) as Ag, thallium (andcompounds) as Tl, vanadium compounds (especially oxides, halides, sulphates andvanadates) as V.
sI2 chromylchloride, cobalt (smoke and compounds) as Co, copper smoke as Cu, lead (andinorganic lead compounds) as Pb, silica (ex cristoballite and tridymite) as respirable dust,rhodium (and non-water-solvable compounds) as Rh, selenium (and compounds) as Se,tellurium (and compounds) as Te.
sI3 antimony (and compounds) as Sb, barium (and compounds) as Ba, calciumoxide, chromium(and compounds, ex. Cr(VI)) as Cr, copper (and compounds ex smoke) as Cu, cyanides asCN, fluorides as F, manganese (smoke and compounds) as Mn, palladium (and compounds)as Pd, platinum (and non-water-solvable compounds) as Pt, potassium/sodium hydroxide, tin(and inorganic tincompounds) as Sn, vanadium (and alloys and carbide) as V, zinc chloride(smoke).
* Compounds marked with asterisk are considered carcinogenics with a threshold value. Special attention should be paid to these components
12. PORTUGAL
No information supplied.
13. SPAIN
No information supplied.

Annexes
434 Waste Water and Waste Gas Treatment
14. SWEDEN
1. The Swedish legal situation is laid down in the Environmental Code. Each facility is tried onits own and the requirements with regard to water and gas treatment are set individually with aview to the recipient situation etc. In the Code this is formulated as a series of principles:
• the burden of proof principle - the operators must demonstrate that their operations areundertaken in an environmentally acceptable manner; the burden of proof is always on theoperator
• the knowledge requirement - persons who pursue an activity must possess the knowledgethat is necessary in view of the nature and scope of the activity. The purpose of theprovision is to ensure that operators acquire the relevant expertise before starting operations,thus preventing damage and detriment
• the precautionary principle - the mere risk of damage or detriment involves an obligation totake the necessary measures to combat or prevent adverse health and environmental effects
• best possible technology - applies to the technology used for the operation itself and for theconstruction, operation and decommissioning of the plant. An essential condition is that itmust be feasible in industrial and economic terms in the line of business concerned
• the polluter pays principle - the operation must pay for the preventative or remedialmeasures that must be taken
• the resource management and ecocycle principles - an operation must be undertaken in sucha way as to ensure efficient use of raw materials and energy and minimisation ofconsumption and waste
• the reasonableness principle - all the rules of are to be applied in the light of benefits andcosts. It is the operator who, in accordance with the burden of proof principle, mustdemonstrate that the cost of a protective measure is not justified from an environmentalpoint of view or that it represents an unreasonable burden.
Hence in the permitting process, the operator will have to demonstrate what treatmenttechniques are valid, and suggest one or several of them to treat wastewater and wastegas etc. asrequired. Chosen technologies and conditions set will depend on BAT to the extent that it isavailable for the chemical industry, the technology is proven in similar production elsewhere,etc. A range of solutions and conditions are possible, depending on location, processtechnology, etc.
2. It more or less follows from this that there is no general reference literature with respect topermit writing. The technical officer in an environmental authority needs a good command ofthe technologies used and available or access to such knowledge, as well as the impact on theenvironment and what can be achieved to counter such impact. These officers give statements tothe court on what is acceptable influence on the environment and how this influence should becontrolled.
The actual permit is written by an Environment Court in the case of major process industries.The ruling is based on the information and advice given from national, regional and localauthorities as well as the operator himself.
15. UNITED KINGDOM
No information supplied.

Glossary
Waste Water and Waste Gas Treatment 435
GLOSSARY OF TERMS AND ABBREVIATIONS
Chemical symbols
Al AluminiumAl2O3 Aluminium oxideAs ArsenicCd CadmiumBr- Bromide ionBr2 BromineCa(OH)2 Calcium hydroxide, limeCl- Chloride ionCl2 ChlorineOCl- Hypochlorite ionClO3
- Chlorate ionCN- Cyanide ionCO Carbon monoxideCO2 Carbon dioxideCOS Carbon oxysulphideCr ChromiumCr3+ Chromium(III) ionCrO4
2- Chromate ionCS2 Carbon disulphideCu CopperF- Fluoride ionFe IronHBr Hydrogen bromideHCl Hydrogen chloride
Hydrochloric acidHCN Hydrogen cyanideHF Hydrogen fluorideHg MercuryH2O2 Hydrogen peroxideH2S Hydrogen sulphideH2SO4 Sulphuric acidHNO3 Nitric acidN2 Nitrogen gasNaOH Sodium hydroxideNa2CO3 Sodium carbonate, sodaNaHCO3 Sodium hydrogencarbonate, -bicarbonateNaOCl Sodium hypochloriteNaClO3 Sodium chlorateNaHSO3 Sodium hydrogensulphite, -bisulphiteNH2CN Cyanamide(NH2)2CO UreaNH3 AmmoniaNH4
+ Ammonium ionNi NickelN2O Nitrous oxideNO Nitrogen oxideNO2 Nitrogen dioxideNO2
- Nitrite ionNO3
- Nitrate ionNOx Nitrogen oxides (mixture of NO and NO2)O2 OxygenO3 OzoneP Phosphorous
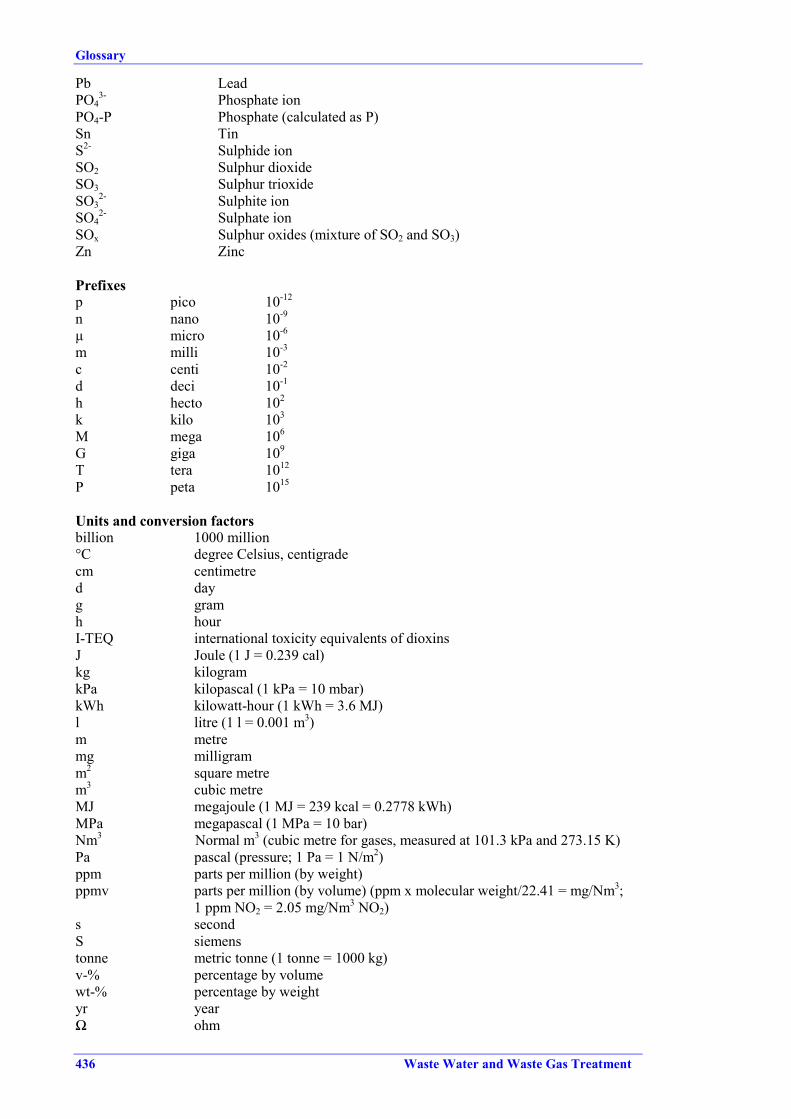
Glossary
436 Waste Water and Waste Gas Treatment
Pb LeadPO4
3- Phosphate ionPO4-P Phosphate (calculated as P)Sn TinS2- Sulphide ionSO2 Sulphur dioxideSO3 Sulphur trioxideSO3
2- Sulphite ionSO4
2- Sulphate ionSOx Sulphur oxides (mixture of SO2 and SO3)Zn Zinc
Prefixesp pico 10-12
n nano 10-9
µ micro 10-6
m milli 10-3
c centi 10-2
d deci 10-1
h hecto 102
k kilo 103
M mega 106
G giga 109
T tera 1012
P peta 1015
Units and conversion factorsbillion 1000 million°C degree Celsius, centigradecm centimetred dayg gramh hourI-TEQ international toxicity equivalents of dioxinsJ Joule (1 J = 0.239 cal)kg kilogramkPa kilopascal (1 kPa = 10 mbar)kWh kilowatt-hour (1 kWh = 3.6 MJ)l litre (1 l = 0.001 m3)m metremg milligramm2 square metrem3 cubic metreMJ megajoule (1 MJ = 239 kcal = 0.2778 kWh)MPa megapascal (1 MPa = 10 bar)Nm3 Normal m3 (cubic metre for gases, measured at 101.3 kPa and 273.15 K)Pa pascal (pressure; 1 Pa = 1 N/m2)ppm parts per million (by weight)ppmv parts per million (by volume) (ppm x molecular weight/22.41 = mg/Nm3;
1 ppm NO2 = 2.05 mg/Nm3 NO2)s secondS siemenstonne metric tonne (1 tonne = 1000 kg)v-% percentage by volumewt-% percentage by weightyr yearΩ ohm

Glossary
Waste Water and Waste Gas Treatment 437
Abbreviations / AcronymsACP Anaerobic Contact ProcessACR Anaerobic Contact ReactorAMS Automated Measuring System (installed and operating continuously in the
field)AOX Adsorbable Organic HalidesAPI American Petroleum InstituteATS Austrian Schilling (currency)BAT Best Available Techniques, as defined in Art. 2(11) of the DirectiveBEF Belgian Franc (currency)BODx Biochemical Oxygen Demand during x days (normally 5 or 7) indicating
the amount of biodegradable organic matter in waste waterBREF Best Available Techniques Reference DocumentBTEX Benzene, Toluene, Ethylbenzene, XyleneCEFIC European Chemical Industry CouncilCOD Chemical Oxygen Demand indicating the amount of chemically oxidisable
organic matter in waste waterCONCAWE European Refinery Association for Environment, Health and SafetyCPI Corrugated Plate InterceptorCSTR Continuously Stirred Tank ReactorCWW BREF on Common Waste Water and Waste Gas Treatment / Management
Systems in the Chemical SectorDAF Dissolved Air FlotationDDT 1,1,1-Trichloro-2,2-bis-(p-chlorophenyl)ethane; a pesticideDEM German Mark (currency)DTA Direct Toxicity AssessmentEC50 effluent concentration in dilution water that causes a measurable negative
effect on 50 % of the test populationEIPPCB European Integrated Pollution Prevention and Control BureauELV Emission Limit ValueEMAS Eco-Management and Audit Scheme (Council Regulation 761/2001)EMFA Energy and Material Flow AnalysisEMS Environmental Management SystemEOX Extractable Organic HalidesEQO Environmental Quality ObjectivesEQS Environmental Quality StandardsESP Electrostatic PrecipitatorEUR Euro (currency)FGD Flue Gas DesulphurisationFIM Finnish Mark (currency)FRP Fibreglass-reinforced PlasticGAC Granular Activated CarbonGBP British Pound (currency)GMP Good Manufacturing PracticeHAP Hazardous Air PollutantsHEAF High Efficiency Air FilterHEAP High Efficiency Particle Air (filter)HEL Higher Explosion LimitHSE Health, Safety and EnvironmentIAF Induced Air FlotationICC International Chamber of CommerceIMPEL European Union Network for the Implementation and Enforcement of
Environmental LawIPPC Integrated Pollution Prevention and ControlIR InfraredISO International Organisation for Standardisation

Glossary
438 Waste Water and Waste Gas Treatment
LC50 effluent concentration in dilution water that causes mortality to 50 % of thetest population
LCA Life Cycle AssessmentLDAR Leak Detection And RepairLEL Lower Explosion LimitLID Lowest Ineffective Dilution; numeric value given as reciprocal dilution
value (dimensionless) of the waste water at which no effects are observedLVIC BREF on Large Volume Inorganic Chemical IndustryLVOC BREF on Large Volume Organic Chemical IndustryMEK Methyl Ethyl KetoneMF Microfiltration (membrane process, waste water section)MIBK Methyl Isobutyl KetoneNF Nanofiltration (membrane process, waste water section)NFL Dutch Gulden (currency)NH4-N Ammonium (calculated as N)NO2
--N Nitrite (calculated as N)NO3
--N Nitrate (calculated as N),OFC BREF on Organic Fine Chemical IndustryORP Redox potentialOSPAR Oslo and Paris Convention for the Protection of the Marine Environment of
the North East AtlanticPAC Powdered Activated CarbonPAH Polycyclic Aromatic HydrocarbonsPCDDs Polychlorinated dibenzodioxinsPCDF Polychlorinated dibenzofuransp.e. Population equivalentPM Particulate Matter (air contaminant)PMx Particulate Matter, x µm aerodynamic diameter (air contaminant)POP Persistent Organic PollutantPPI Parallel Plate InterceptorPSA Pressure-swing AdsorptionPTFE Poly Tetrafluoro Ethene (TEFLON)PVC Polyvinyl ChlorideRO Reverse Osmosis (membrane process, waste water section)SAC Strong Acid Cation ExchangerSBA Strong Base Anion ExchangerSCA Specific Collection Area (ESP: ratio of surface area of collection electrodes
to gas flow)SCR Selective Catalytic Reduction (NOx-reduction)SCWO Super Critical Water OxidationSIC BREF on Speciality Inorganic Chemical IndustrySME Small and Medium-size EnterprisesSNCR Selective Non-catalytic Reduction (NOx-reduction)SPC Statistical Process ControlSVI Sludge Volume Index: Volume in ml occupied by 1 g of activated sludge
after settlement under specified conditions for a specified timeTA Algae toxicity; determination of the non-toxicity of waste water to green
algae (Scenedesmus subspicatus CHODAT), using various dilutions ofwaste water; value is a dimensionless number, giving the dilution factor
TD Daphniae toxicity; determination of the acute non-toxicity of waste water todaphniae (Daphnia magna STRAUS) over a 24 hour exposure period, usingvarious dilutions of waste water; value is a dimensionless number, givingthe dilution factor
TF Fish toxicity; determination of the acute non-toxicity of waste water to fish(Leuciscus idus L.) over a 48 hour exposure period, using various dilutionsof waste water; value is a dimensionless number, giving the dilution factor

Glossary
Waste Water and Waste Gas Treatment 439
TL Luminescent bacteria toxicity; short-term determination of the inhibitiveeffect (sublethal toxic effects) of waste water on the light emission ofPhotobacterium phosphoreum, using various dilutions of waste water; valueis a dimensionless number, giving the dilution factor
TM Mutagenity; determination of the lowest dilution level at which nogenotoxicity of waste to the test organism Salmonella typhimurium TA1535/pSK 1002 is observed; value is a dimensionless number, giving thedilution factor
TOC Total Organic CarbonTSS Total Suspended Solids (in waste water)UASB Upflow Anaerobic Sludge Blanket reactor or processUF Ultrafiltration (membrane process, waste water section)USD US-Dollar (currency)USEPA United States Environmental Protection AgencyUV Ultra-violetVCM Vinyl Chloride MonomerVOC Volatile Organic CompoundsVOX Volatile Organic HalidesVRU Vapour Recovery UnitWAC Weak Acid Cation ExchangerWBA Weak Base Anion ExchangerWEA Whole Effluent AssessmentWEER Whole Effluent Environmental RiskWWTP Waste Water Treatment Plant
Terms as used in this document
Aerobic processes biological treatment processes that occur in the presence ofoxygen
Anaerobic processes biological treatment processes that occur in the absence ofoxygen
Anoxic denitrification process by which nitrate nitrogen is converted biologically tonitrogen gas in the absence of oxygen
Biological nutrient removal removal of nitrogen and phosphorus in biological treatmentprocesses
Component substance imbedded in a mixture (e.g. in waste water, wastegas or air)
Content matter contained in a mediumCross-media effects possible shift of environmental pressure from one
environmental compartment to the otherDenitrification biological process by which nitrate is converted to nitrogen and
other gaseous end productsDiffuse emissions emissions that are not released via specific emission points
(stacks, etc.) [cww/tm/154].Dilution factor used with toxicity determination in waste water; defined as
ratio of total sample amount after dilution to amount of wastewater contained in the sample when no effect on the testorganisms is detected; high dilution factors are equivalent withhigh toxicity in waste water
Effluent waste stream (waste water or waste gas) discharged from aprocess, an installation or a site
Emissions direct or indirect release of substances, vibrations, heat or noisefrom individual or diffuse sources into the air, water or land, asdefined in Art. 2(5) of the Directive
Exhaust air air stream (waste gas) from an installation contaminated withgaseous components, normally with low concentrations

Glossary
440 Waste Water and Waste Gas Treatment
Existing installation installation in operation or existing before the date on whichthis Directive into effect, according to Art. 2(4) of the Directive
Flue gas waste gas generated by incineration processFugitive emissions any emissions not in waste gases of volatile organic
compounds into air, soil and water as well as solventscontained in any products. They include uncaptured emissionsreleased to the outside environment via windows, doors, ventsand similar openings [cww/tm/88].
Halogenated organic compound an organic compound which contains at least one atom ofbromine, chlorine, fluorine or iodine per molecule.
Installation stationary technical unit where one or more activities listed inAnnex I of the Directive are carried out, and any other directlyassociated activities which have a technical connection with theactivities carried out on that site and which could have an effecton emissions and pollution (Art. 2(3) of the Directive)
Make-up water water added to a process to start or maintain a reaction, preparea solution, mix reactants, dilute reactants
Mother liquor: waste water stream directly arising from a synthesis orchemical reaction, generally highly concentrated in products,starting material or by-products, especially the initial aqueousdischarges
Nitrification biological process by which ammonia is converted first tonitrite and then to nitrate
Start-up, shut down operations operation whilst bringing an activity, an equipment item or atank into or out of service or into or out of an idling state.Regularly oscillating activity phases are not to be considered asstart-ups and shut downs [cww/tm/88].
Substance chemical element and its compounds, as defined in Art. 2(1) ofthe Directive
Substantial change change in operation which, in the opinion of the competentauthority, may have significant negative effects on humanbeings or the environment, as defined in Art. 2(1) of theDirective
Volatile organic compound any organic compound having at 293.15 K a vapour pressure of0.01 kPa or more, or having a corresponding volatility underthe particular conditions of use [cww/tm/88].
Waste gas final gaseous discharge containing volatile organic compounds(VOC) or other pollutants, from a stack or abatementequipment into air [cww/tm/88].
Waste water aqueous effluent from chemical processes, product make-up,raw material preparation, equipment cleaning, storage facilities,loading activities. Rainwater and indirect cooling water are notincluded because of the different definitions in the MemberStates for waste water. Instead rainwater and its need fortreatment is dealt with separately. Cooling water is dealt within the respective horizontal BREF on Industrial CoolingSystems