Nature on the EdgeNatural Capital aNd ONtariO’s grOwiNg gOldeN HOrsesHOe

Suite 219, 2211 West 4th Avenue Vancouver, B.C. V6K 4S2T: 604.732.4228 E: [email protected]
www.davidsuzuki.org
NATurE oN ThE EdgE: NATurAl CApiTAl ANd oNTArio’S groWiNg goldEN horSEShoE
February 2013
By Sara Wilson, MSc.F., lEAd Fellow,
Natural Capital research and Consulting
ACKNoWlEdgEMENTS
The author would like to thank the Friends of the greenbelt Foundation and the david Suzuki Foundation for its support and interest in pursuing natural capital research.
Special thanks to Matt hanneman and peter lee of global Forest Watch Canada for the spatial analyses presented in the study.
Several people provided input and review including: dr. ray Tomalty (Mcgill university), and dr. Faisal Moola (university of Toronto), Jode roberts and Kiruthiha Kulendiren of the david Suzuki Foundation. Senior staff at the Ministry of Municipal Affairs and housing (MMAh) and the ontario growth Secretariat (Ministry of infrastructure) provided invaluable assistance with data and with interpreting provincial land use planning policy in ontario, as well as expert peer review.
iSBN 978-1-897375-57-0
graphic design by Nadene rehnby handsonpublications.com
Cover photo Jeff Chevrier/iStock
downloaded this report at davidsuzuki.org

ContentsglEN SiMMoNS phoTo
pArT 1 iNTroduCTioN ..............................................................................................................5
pArT 2 NATurAl CApiTAl ANd ECoSySTEM SErViCES ...........................................................9
What is Natural Capital? .................................................................................................. 9
Valuing Ecosystems ........................................................................................................ 9
pArT 3 lANd CoVEr iN ThE WhiTEBElT STudy ArEA ..........................................................12
pArT 4 ECoSySTEM SErViCE VAluES oF ThE WhiTEBElT STudy ArEA ..............................15
york region ..................................................................................................................... 18
peel region .....................................................................................................................20
durham region ...............................................................................................................22
halton region ................................................................................................................. 24
City of hamilton ..............................................................................................................26
pArT 5 urBAN groWTh plANNiNg iN ThE gThA .................................................................28
pArT 6 ExpANdiNg proTECTioN For NATurAl CApiTAl iN ThE gThA ................................29
pArT 7 CoNCluSioNS ANd rECoMMENdATioNS ...................................................................32

download reports in this series
at davidsuzuki.org/publications
liST oF MApS
Figure 1: greenbelt plan 2005 Map ............................................................................................... 6
Figure 2: greater golden horseshoe growth plan Area ................................................................ 6
Figure 3: Whitebelt Study Area within the greater Toronto and hamilton Area (gThA) ........... 7
Figure 4: land Cover in the Whitebelt Study Area of the gThA ................................................. 14
Figure 5: land Cover for the Whitebelt Study Area within york region .................................... 18
Figure 6: land Cover for the Whitebelt Study Area within peel region ....................................20
Figure 7: land Cover for the Whitebelt Study Area within durham region ..............................22
Figure 8: land Cover for the Whitebelt Study Area within halton region ................................ 24
Figure 9: land Cover for the Whitebelt Study Area within the City of hamilton ......................26
liST oF TABlES
Table 1: Ecosystem Functions, processes and Services ........................................................... 11
Table 2: land Cover in the Whitebelt Study Area by Municipality ............................................. 13
Table 3: Summary of Annual Ecosystem Service Values
by land Cover Type for the Whitebelt Study Area ........................................................ 16
Table 4: land Cover and Natural Capital Values
for the Whitebelt Study Area in york region .................................................................. 19
Table 5: land Cover and Natural Capital Values
for the Whitebelt Study Area in peel region .................................................................. 21
Table 6: land Cover and Natural Capital Values
for the Whitebelt Study Area in durham region ........................................................... 23
Table 7: land Cover and Natural Capital Values
for the Whitebelt Study Area in halton region ..............................................................25
Table 8: land Cover and Natural Capital Values
for the Whitebelt Study Area in the City of hamilton ....................................................27

dav id s uzu ki fOu N datiON page 5
the rapid increase
in population and
intensity of urban
land use in the golden
Horseshoe is placing
unprecedented
pressure on the natural
capital assets of the
region, such as forests,
wetlands and prime
agricultural soils.aNtOiNe Belaief pHOtO
pa rt 1
introduction
sOutHerN ONtariO’s greater gOldeN HOrsesHOe (ggh), located on the western end of lake ontario, is
the most densely populated area in Canada, with about 25 per cent of the country’s population now living
in the region. it is also one of the fastest growing regions in North America, where an additional 4.5 million
people are expected to live by the year 2041.1 The rapid increase in population and intensity of urban land
use is placing unprecedented pressure on the natural capital assets of the region, such as forests, wetlands
and prime agricultural soils. For example, the most recent analysis of land use change in the region found
that between 1996 and 2001, 16 per cent of prime farmland in the region was lost to urbanization.2
To manage further urban growth and expansion more sustainably, the ontario government launched
several initiatives to control urban sprawl and to enhance the quality of life for people living in southern
ontario. in 2005, the ontario government passed two major pieces of legislation that direct and impact land
use planning in the greater Toronto and hamilton Area (gThA) of the golden horseshoe region, the places
to grow Act and the greenbelt Act. Both were intended to change the path of explosive urban growth and
expansion in the region.
The places to grow Act provided the legislative basis for the greater golden horseshoe growth plan (the
growth plan), which establishes policies for urban growth management in south-central ontario. The greenbelt
Act provides the legislative basis for the greenbelt plan, which protects a large swath of land around lake
ontario from urban development, called the greenbelt.3 The greenbelt extends 325 kilometers from the eastern
end of the oak ridges Moraine to the Niagara river in the west, covering 1.8 million acres (Figure 1 on page
6). its area consists of protected green spaces, farmlands, communities, forests, wetlands, and watersheds.
1 greater golden horseshoe growth Forecasts to 2041. hemson Consulting ltd. 2012. http://tinyurl.com/bzndqvh2 ontario’s wealth Canada’s future: appreciating the value of the greenbelt’s eco-services. 2008. david Suzuki Foundation. 3 Tomalty, r., and Komorowski, B. 2011. inside and out: Sustaining ontario’s greenbelt. Friends of the greenbelt
Foundation.

page 6 N at u r e ON t H e e dge : N at u r a l C a pita l a N d ON ta riO ’ s grOw iNg gOlde N HOr s e s HOe
figure 1: greeNBelt plaN 2005 Map
figure 2: greater gOldeN HOrsesHOe grOwtH plaN area Map
the purpose of this
study is to quantify some
of the natural capital values
that could be degraded or
lost if this area were to be
completely built out as the
greater golden Horseshoe
grows and expands in
the coming decades.kristiN MaliNg pHOtO

dav id s uzu ki fOu N datiON page 7
When the growth plan was passed, a buffer zone was left between the current urban built-up areas of the
inner ring of municipalities circling lake ontario and the greenbelt,4 to accommodate further urban growth
and expansion in the coming decades. This area is approximately 58,000 hectares in size and has become
known, colloquially, as the Whitebelt (Figure 3).
The Whitebelt area primarily consists of rural and agricultural land, and although it has less land use
restrictions than the adjacent greenbelt,5 it represents some of the best farmland (i.e. most productive Class 1
agricultural lands) left in Canada, as well as sensitive ecological areas, such as wetlands, that are exceedingly
rare in southern ontario. The rules governing the expansion of urban areas into the Whitebelt are laid down in
the greater golden horseshoe growth plan.
This study estimates the value of the ecosystem services provided by natural capital in the Whitebelt as
well as within approved vacant greenfield lands already designated for urban expansion and available for
development now among the inner ring municipalities of the gThA. For the purposes of this study, we refer to
this area as the Whitebelt study area; spanning approximately 94,000 ha across the gThA. Much of natural
capital (greenspace and agricultural land) within this large region has already been zoned for development
in the gThA, and may developed in the coming decades as the greater golden horseshoe expands outwards
with further urbanization.
The purpose of this study is to quantify some of the natural capital values that could be degraded or lost if
this area were to be completely built out as the greater golden horseshoe grows and expands in the coming
decades. it is our hope that this study will raise awareness of the potential cost of urbanization on the natural
4 The inner-ring municipalities are comprised of the City of hamilton and the regions of halton, peel, york, and durham5 Farmland within the Whitebelt study area are designated as prime agricultural land in municipal official plans and are
subject to agricultural and natural heritage policies under the provincial policy statement.
figure 3: wHiteBelt study area witHiN tHe greater tOrONtO aNd HaMiltON area
a buffer zone was
left between the
current urban built-up
areas of the inner
ring of municipalities
circling lake Ontario
and the greenbelt,
to accommodate
further urban growth
and expansion in the
coming decades. this
area has become
known, colloquially,
as the Whitebelt.
frieNds Of tHe greeNBelt pHOtO

page 8 N at u r e ON t H e e dge : N at u r a l C a pita l a N d ON ta riO ’ s grOw iNg gOlde N HOr s e s HOe
capital assets of the region, which are so important to sustaining community health and wellbeing, such as
providing clean water, habitat for wildlife, and sustaining productive land to grow local food.
it should be stressed that our estimate of the natural capital values of the Whitebelt study area is a
conservative estimate. This is due to: (1) the incomplete understanding of all the non-market benefits provided
by nature and farmland; (2) the intrinsic value of nature itself; and (3) the likely increase in ecosystem service
value over time, as services such as water supply become increasingly scarce due to global warming and
population increase. it, does, however, provide an estimate of the current benefits of the Whitebelt study area’s
natural capital and the potential costs of further loss of greenspace and farmland to urbanization in the region.
greenbelt plan and growth plan for the greater golden Horseshoe
The 2005 greenbelt plan defined and established permanently protected areas, including areas of agricultural
and ecological value in the greater golden horseshoe. The greenbelt was designed to safeguard key environ-
mentally sensitive land, watersheds, and farmlands that provide essential ecosystem services for quality of life
in this densely populated area of Canada.6 This protected region includes green space, farmland, communities,
forests, wetlands, and watersheds, including habitat for more than one-third of ontario’s species at risk, such
as the bald eagle, peregrine falcon and the common snapping turtle.7
The 2006 growth plan for the greater golden horseshoe was prepared under the places to grow Act and
works in concert with the greenbelt plan to ensure that communities can accommodate new settlement
while still protecting the natural areas and farmland that provide critical ecosystem services for residents,
such as clean air, water and local food. The plan was designed to intensify existing built-up areas, especially
urban growth centres, intensification corridors, major transit station areas, brownfield sites and greyfields.
As a result, the plan requires better use of land and infrastructure by building more compact communities
that are supported by public transit.
To achieve the growth plan’s objectives, it requires that 40 per cent of the annual population growth is
absorbed within the existing built-up area boundary within each municipality by the year 2015 and onward.8
The growth plan also limits the amount of land that can be designated for urban development. it identifies
certain intensive urban growth centres within built-up areas where a minimum density of 400 people plus
jobs per hectare is required in the City of Toronto, and 150 to 200 residents and jobs per hectare in the smaller
urban growth centres. The remaining growth can be directed beyond the existing built up boundaries but
must have an average density of at least 50 people and/or jobs per hectare. This innovative effort to increase
density and limit further loss of greenspace and farmland was recognized with a prestigious award by the
American planning Association.9
6 The greenbelt’s primary purpose is to: protect against the loss and fragmentation of the agricultural land base and support agriculture predominant use; give permanent protection to natural heritage and water resource systems that sustain ecological human health and form the environmental framework around which major urbanization in south-central ontario will be organized; and, provide a diverse range of economic and social activities associated with rural communities, agriculture, tourism, recreation and resources uses.
7 Biodiversity in ontario’s greenbelt. 2011. ontario Nature and david Suzuki Foundation.8 ontario Ministry of public infrastructure renewal. 2006. Places to Grow: Growth Plan for the Greater Golden Horseshoe.9 American planning Association, National Planning Awards 2007, www.planning.org/awards/2007/
the greenbelt was
designed to safeguard
key environmentally
sensitive land,
watersheds, and
farmlands that
provide essential
ecosystem services
for quality of life in
this densely populated
area of Canada.Bev Currie pHOtO

dav id s uzu ki fOu N datiON page 9
pa rt 2
Natural Capital and Ecosystem Services
what is Natural Capital?
Natural capital refers to our natural assets (or “stocks”), and the ecosystem goods and services (or “flows”)
that those assets provide. Natural assets and ecosystem services are the foundation of life – including
human life. The benefits provided by natural capital include the storage of floodwaters by wetlands, water
capture and filtration by forested watersheds, air pollution absorption by trees, and climate regulation
resulting from carbon storage in trees, plants and soils.
Forests, wetlands and rivers that make up watersheds are like giant utilities providing ecosystem services
for local communities as well as regional and global processes that we all benefit from. Ecosystems provide
many services including carbon storage and sequestration, water storage, rainfall generation, climate buf-
fering, biodiversity, soil stabilization and more.10 however, as we do not pay directly for these services, they
are undervalued in our market economy. They are worth billions of dollars per year, but need to be valued
more accurately because their loss has massive economic impacts, threatening health, food production,
climate stability, and basic needs such as clean water.
valuing ecosystems
Ecosystem goods and services are the benefits derived from ecosystems. These benefits are dependent on
ecosystem functions, which are the processes (physical, chemical and biological) or attributes that maintain
ecosystems and the species that live within them. humans are reliant on the capacity of natural processes
10 global Canopy programme. www.globalcanopy.org/main.php?m=3
the benefits provided
by natural capital
include the storage
of floodwaters
by wetlands,
water capture and
filtration by forested
watersheds, air
pollution absorption
by trees, and
climate regulation
resulting from carbon
storage in trees,
plants and soils.frieNds Of tHe greeNBelt pHOtO
page 10 N at u r e ON t H e e dge : N at u r a l C a pita l a N d ON ta riO ’ s grOw iNg gOlde N HOr s e s HOe
and systems to provide for human and wildlife needs.11 These include products received from ecosystems
(e.g. food, fibre, clean air and water), benefits derived from processes (e.g. nutrient cycling, water purification,
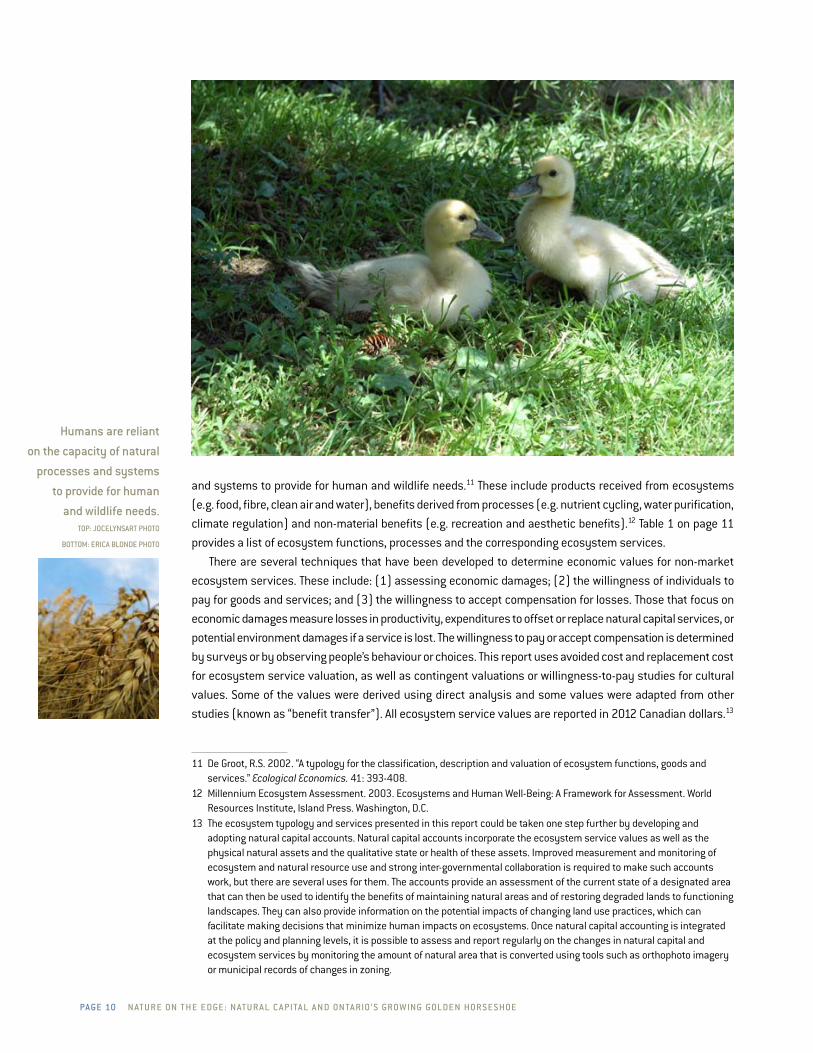
climate regulation) and non-material benefits (e.g. recreation and aesthetic benefits).12 Table 1 on page 11
provides a list of ecosystem functions, processes and the corresponding ecosystem services.
There are several techniques that have been developed to determine economic values for non-market
ecosystem services. These include: (1) assessing economic damages; (2) the willingness of individuals to
pay for goods and services; and (3) the willingness to accept compensation for losses. Those that focus on
economic damages measure losses in productivity, expenditures to offset or replace natural capital services, or
potential environment damages if a service is lost. The willingness to pay or accept compensation is determined
by surveys or by observing people’s behaviour or choices. This report uses avoided cost and replacement cost
for ecosystem service valuation, as well as contingent valuations or willingness-to-pay studies for cultural
values. Some of the values were derived using direct analysis and some values were adapted from other
studies (known as “benefit transfer”). All ecosystem service values are reported in 2012 Canadian dollars.13
11 de groot, r.S. 2002. “A typology for the classification, description and valuation of ecosystem functions, goods and services.” Ecological Economics. 41: 393-408.
12 Millennium Ecosystem Assessment. 2003. Ecosystems and human Well-Being: A Framework for Assessment. World resources institute, island press. Washington, d.C.
13 The ecosystem typology and services presented in this report could be taken one step further by developing and adopting natural capital accounts. Natural capital accounts incorporate the ecosystem service values as well as the physical natural assets and the qualitative state or health of these assets. improved measurement and monitoring of ecosystem and natural resource use and strong inter-governmental collaboration is required to make such accounts work, but there are several uses for them. The accounts provide an assessment of the current state of a designated area that can then be used to identify the benefits of maintaining natural areas and of restoring degraded lands to functioning landscapes. They can also provide information on the potential impacts of changing land use practices, which can facilitate making decisions that minimize human impacts on ecosystems. once natural capital accounting is integrated at the policy and planning levels, it is possible to assess and report regularly on the changes in natural capital and ecosystem services by monitoring the amount of natural area that is converted using tools such as orthophoto imagery or municipal records of changes in zoning.
Humans are reliant
on the capacity of natural
processes and systems
to provide for human
and wildlife needs.tOp: JOCelyNsart pHOtO
BOttOM: eriCa BlONde pHOtO
dav id s uzu ki fOu N datiON page 11
taBle 1: eCOsysteM fuNCtiONs, prOCesses aNd serviCes
functions ecosystem processes ecosystem services
gas regulationrole of ecosystems in bio-geochemical cycles (e.g. Co2/o2 balance, ozone layer)
uVb protection by ozone maintenance of air quality
Climate regulationinfluence of land cover and biological mediated processes on climate
Maintenance of a favourable climate, carbon regulation, cloud formation
disturbance prevention
influence of ecosystem structure on environmental disturbances
Storm protection, flood control, drought recovery
Water regulationrole of land cover in regulating runoff and river discharge
drainage, natural irrigation, transportation
Water supplyFiltering, retention and storage of fresh water
provision of water by watersheds, reservoirs and aquifers
Soil retentionrole of the vegetation root matrix and soil biota in soil retention
prevention of soil loss/damage from erosion/siltation; storage of silt in lakes, and wetlands; maintenance of arable land
Soil formationWeathering of rock, accumulation of organic matter
Maintenance of productivity on arable land; maintenance of natural productive soils
Nutrient cyclingrole of biota in storage and re-cycling of nutrients (e.g. nitrogen)
Maintenance of healthy soils and productive ecosystems; nitrogen fixation
Waste treatmentrole of vegetation and biota in removal or breakdown of xenic nutrients and compounds
pollution control/detoxification, filtering of dust particles, abatement of noise pollution
pollinationrole of biota in the movement of floral gametes
pollination of wild plant species and crops
Biological control population and pest controlControl of pests and diseases, reduction of herbivory (crop damage)
habitatrole of biodiversity to provide suitable living and reproductive space
Biological and genetic diversity, nurseries, refugia, habitat for migratory species
Food productionConversion of solar energy, and nutrient and water support for food
provision of food (agriculture, range), harvest of wild species (e.g. berries, fish, mushrooms)
raw materialsConversion of solar energy, nutrient and water support for natural resources
lumber, fuels, fodder, fertilizer, ornamental resources
genetic resourcesgenetic materials and evolution in wild plants and animals
improve crop resistance to pathogens and crop pests, health care
Medicinal resourcesBiochemical substances in and other medicinal uses of biota
drugs and pharmaceuticals, chemical models and tools
recreation Variety in landscapesEcotourism, wildlife viewing, sport fishing, swimming, boating, etc.
Education, culture and spirituality
Variety in natural landscapes, natural features and nature
provides opportunities for cognitive development: scenery, cultural motivation, environmental education, spiritual value, scientific knowledge, aboriginal sites
Source: Adapted from: de groot, r.S. 2002. “A typology for the classification, description and valuation of ecosystem functions, goods and services.” Ecological Economics. 41: 393-408.
ecosystem goods and
services are the benefits
derived from ecosystems.
these benefits are
dependent on ecosystem
functions, which are the
processes or attributes
that maintain ecosystems
and the species that
live within them.tHe HiNdru pHOtO/fliCkr
page 12 N at u r e ON t H e e dge : N at u r a l C a pita l a N d ON ta riO ’ s grOw iNg gOlde N HOr s e s HOe
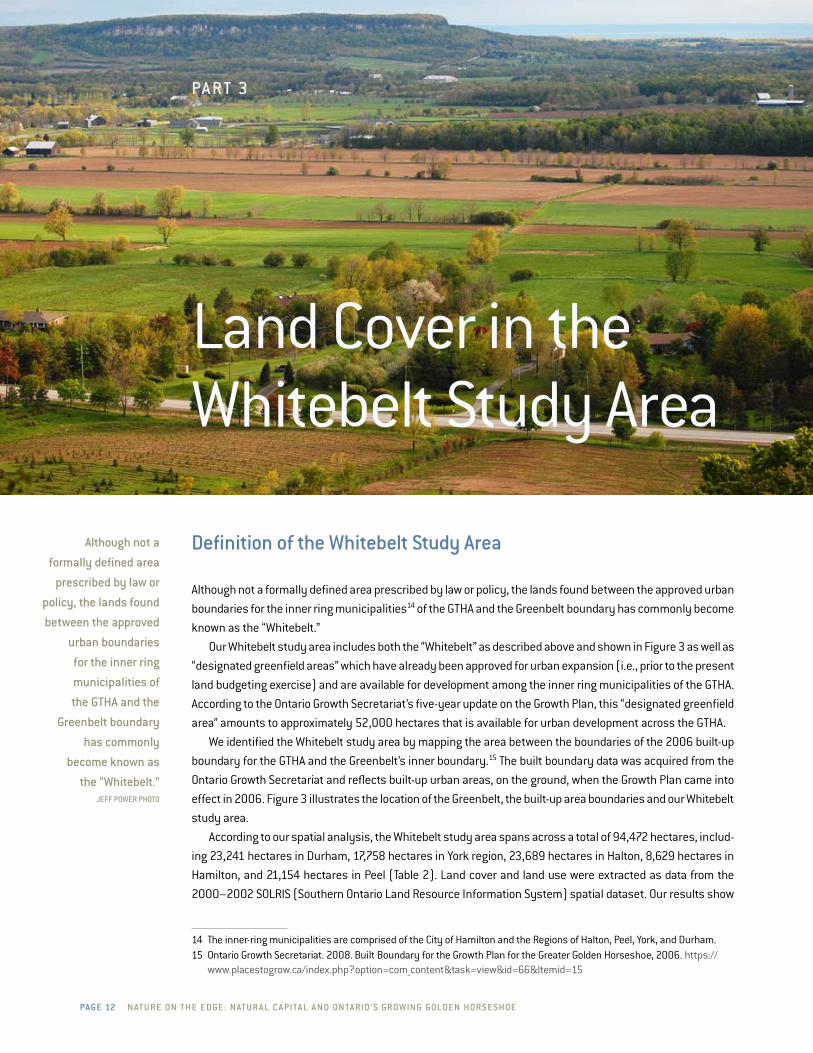
pa rt 3
land Cover in the Whitebelt Study Area
definition of the whitebelt study area
Although not a formally defined area prescribed by law or policy, the lands found between the approved urban
boundaries for the inner ring municipalities14 of the gThA and the greenbelt boundary has commonly become
known as the “Whitebelt.”
our Whitebelt study area includes both the “Whitebelt” as described above and shown in Figure 3 as well as
“designated greenfield areas” which have already been approved for urban expansion (i.e., prior to the present
land budgeting exercise) and are available for development among the inner ring municipalities of the gThA.
According to the ontario growth Secretariat’s five-year update on the growth plan, this “designated greenfield
area” amounts to approximately 52,000 hectares that is available for urban development across the gThA.
We identified the Whitebelt study area by mapping the area between the boundaries of the 2006 built-up
boundary for the gThA and the greenbelt’s inner boundary.15 The built boundary data was acquired from the
ontario growth Secretariat and reflects built-up urban areas, on the ground, when the growth plan came into
effect in 2006. Figure 3 illustrates the location of the greenbelt, the built-up area boundaries and our Whitebelt
study area.
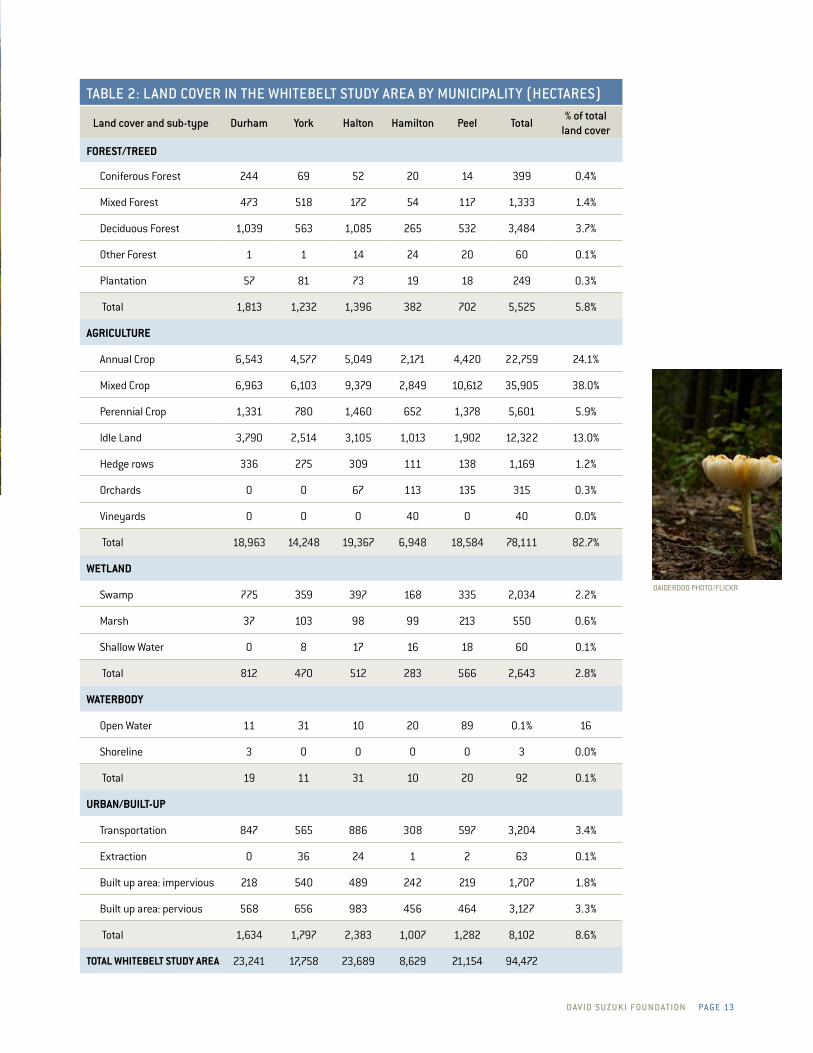
According to our spatial analysis, the Whitebelt study area spans across a total of 94,472 hectares, includ-
ing 23,241 hectares in durham, 17,758 hectares in york region, 23,689 hectares in halton, 8,629 hectares in
hamilton, and 21,154 hectares in peel (Table 2). land cover and land use were extracted as data from the
2000–2002 SolriS (Southern ontario land resource information System) spatial dataset. our results show
14 The inner-ring municipalities are comprised of the City of hamilton and the regions of halton, peel, york, and durham.15 ontario growth Secretariat. 2008. Built Boundary for the growth plan for the greater golden horseshoe, 2006. https://
www.placestogrow.ca/index.php?option=com_content&task=view&id=66&itemid=15
although not a
formally defined area
prescribed by law or
policy, the lands found
between the approved
urban boundaries
for the inner ring
municipalities of
the gtHa and the
greenbelt boundary
has commonly
become known as
the “whitebelt.”Jeff pOwer pHOtO
dav id s uzu ki fOu N datiON page 13
taBle 2: laNd COver iN tHe wHiteBelt study area By MuNiCipality (HeCtares)
land cover and sub-type durham york Halton Hamilton peel total% of total
land cover
Forest/treed
Coniferous Forest 244 69 52 20 14 399 0.4%
Mixed Forest 473 518 172 54 117 1,333 1.4%
deciduous Forest 1,039 563 1,085 265 532 3,484 3.7%
other Forest 1 1 14 24 20 60 0.1%
plantation 57 81 73 19 18 249 0.3%
Total 1,813 1,232 1,396 382 702 5,525 5.8%
Agriculture
Annual Crop 6,543 4,577 5,049 2,171 4,420 22,759 24.1%
Mixed Crop 6,963 6,103 9,379 2,849 10,612 35,905 38.0%
perennial Crop 1,331 780 1,460 652 1,378 5,601 5.9%
idle land 3,790 2,514 3,105 1,013 1,902 12,322 13.0%
hedge rows 336 275 309 111 138 1,169 1.2%
orchards 0 0 67 113 135 315 0.3%
Vineyards 0 0 0 40 0 40 0.0%
Total 18,963 14,248 19,367 6,948 18,584 78,111 82.7%
WetlAnd
Swamp 775 359 397 168 335 2,034 2.2%
Marsh 37 103 98 99 213 550 0.6%
Shallow Water 0 8 17 16 18 60 0.1%
Total 812 470 512 283 566 2,643 2.8%
WAterbody
open Water 11 31 10 20 89 0.1% 16
Shoreline 3 0 0 0 0 3 0.0%
Total 19 11 31 10 20 92 0.1%
urbAn/built-up
Transportation 847 565 886 308 597 3,204 3.4%
Extraction 0 36 24 1 2 63 0.1%
Built up area: impervious 218 540 489 242 219 1,707 1.8%
Built up area: pervious 568 656 983 456 464 3,127 3.3%
Total 1,634 1,797 2,383 1,007 1,282 8,102 8.6%
totAl Whitebelt study AreA 23,241 17,758 23,689 8,629 21,154 94,472
daiderdOO pHOtO/fliCkr

page 14 N at u r e ON t H e e dge : N at u r a l C a pita l a N d ON ta riO ’ s grOw iNg gOlde N HOr s e s HOe
that the predominant land cover within the study area is agricultural land (83 per cent of total area), of which
75 per cent is cropland (annual and mixed crops), and the remaining 25 per cent is perennial crop, idle land,
hedgerows, orchards and vineyards. urban and built-up areas, including transportation and extraction areas
cover 8.6 per cent of the study area; forestlands cover 5.8 per cent, wetlands cover 2.8 per cent, and water
cover is 0.1 per cent of the Whitebelt study area.
The land cover classes from SolriS, as shown above in Table 2 on page 13, were re-classed into more
general land cover types in order to map land cover at the scale of the study area.
Figure 4 shows the land cover types as water/shoreline, forest, cropland, woody plantation, transportation,
extraction, built-up pervious, built up impervious, and wetlands.
figure 4: laNd COver iN tHe wHiteBelt study area Of tHe gtHa

dav id s uzu ki fOu N datiON page 15
tHe estiMated value fOr eaCH laNd COver type in the Whitebelt study area was extrapolated from the
ecosystem service values developed for the 2008 greenbelt report Ontario’s Wealth, Canada’s Future: Ap-
preciating the Value of the Greenbelt’s Eco-services.16 The greenbelt study estimated the non-market values of
the ecosystem services provided by the greenbelt’s natural capital based on land cover analysis using SolriS
land cover data, and the social, economic and ecological information available at the time. it is important to
note that the ecosystem service values are conservative estimates. They do not represent the full value of
natural capital due to the incomplete understanding of all benefits provided by nature, the intrinsic value of
nature itself, and the likely increase in ecosystem service values over time as natural capital, such as forests
and farmland, becomes more scare with ongoing urban development. Furthermore, the ecosystem services
evaluated in this report are only but one portion of the true value of nature and farmland in sustaining the
health and wellbeing of citizens in the region. Many ecosystem services, like cultural and spiritual benefits
(e.g. opportunities for cognitive development, scenery, environmental education, spiritual value) cannot be
monetized, and indeed can be considered “priceless.”
The 2008 greenbelt study found that the average annual estimated value for natural capital across the
greenbelt was $3,487 per hectare, with the highest average values per hectare attributed to wetlands and
forests. Wetlands were estimated to be worth $14,153 per hectare annually because of their high value for
water regulation, water filtration, flood control, waste treatment, recreation, and wildlife habitat. Forests were
estimated to be worth on average $5,414 per hectare each year because of their importance for water filtration
services, carbon storage services, pollinators, wildlife and recreation. The non-market annual value of the
greenbelt’s agricultural lands were estimated to be worth $477 per hectare for cropland, $1,667 for idle land,
$1,678 for hedgerows and $494 for orchards. Key agricultural values included the pollination value of idle land
and hedgerows, the storage of carbon in soils, and the cultural value of agricultural lands.
16 Wilson, S.J. 2008. Ontario’s Wealth, Canada’s Future: Appreciating the Value of the Greenbelt’s Eco-services. The greenbelt Foundation and the david Suzuki Foundation. Toronto, Canada.
figure 4: laNd COver iN tHe wHiteBelt study area Of tHe gtHa
pa rt 4
Ecosystem Service Values of the Whitebelt Study Area
the ecosystem
services evaluated
in this report are
only but one portion
of the true value of
nature and farmland
in sustaining the
health and wellbeing of
citizens in the region.
page 16 N at u r e ON t H e e dge : N at u r a l C a pita l a N d ON ta riO ’ s grOw iNg gOlde N HOr s e s HOe
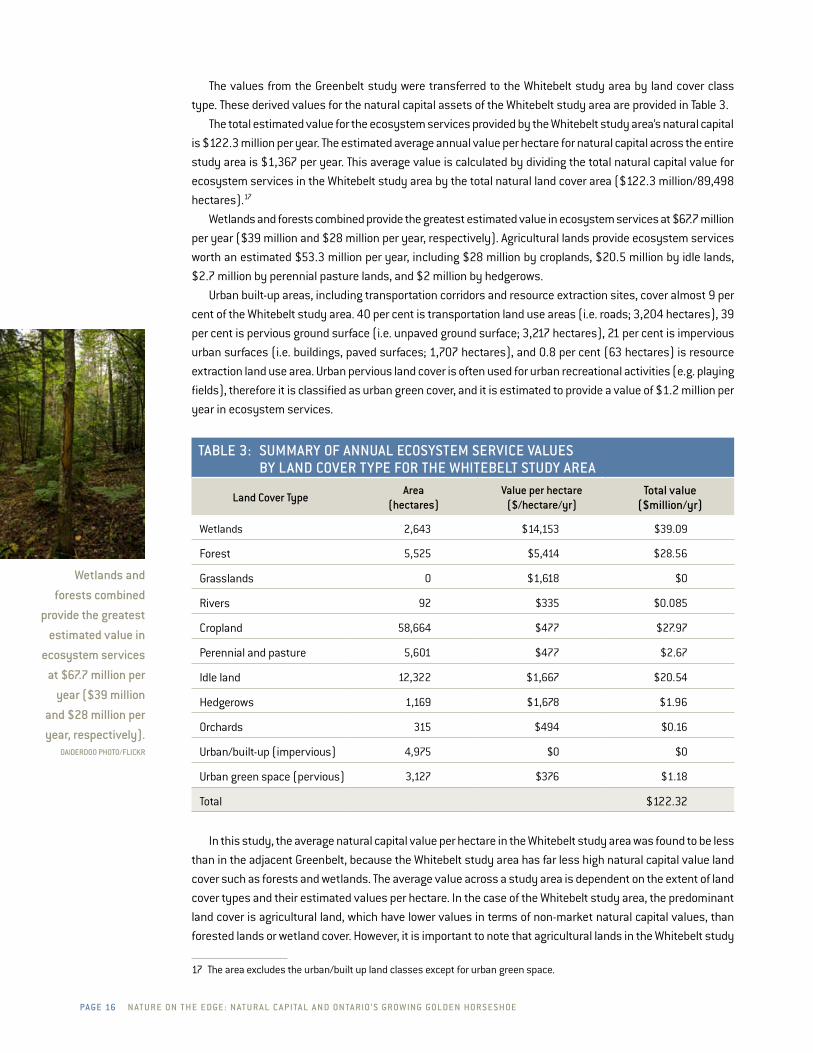
The values from the greenbelt study were transferred to the Whitebelt study area by land cover class
type. These derived values for the natural capital assets of the Whitebelt study area are provided in Table 3.
The total estimated value for the ecosystem services provided by the Whitebelt study area’s natural capital
is $122.3 million per year. The estimated average annual value per hectare for natural capital across the entire
study area is $1,367 per year. This average value is calculated by dividing the total natural capital value for
ecosystem services in the Whitebelt study area by the total natural land cover area ($122.3 million/89,498
hectares).17
Wetlands and forests combined provide the greatest estimated value in ecosystem services at $67.7 million
per year ($39 million and $28 million per year, respectively). Agricultural lands provide ecosystem services
worth an estimated $53.3 million per year, including $28 million by croplands, $20.5 million by idle lands,
$2.7 million by perennial pasture lands, and $2 million by hedgerows.
urban built-up areas, including transportation corridors and resource extraction sites, cover almost 9 per
cent of the Whitebelt study area. 40 per cent is transportation land use areas (i.e. roads; 3,204 hectares), 39
per cent is pervious ground surface (i.e. unpaved ground surface; 3,217 hectares), 21 per cent is impervious
urban surfaces (i.e. buildings, paved surfaces; 1,707 hectares), and 0.8 per cent (63 hectares) is resource
extraction land use area. urban pervious land cover is often used for urban recreational activities (e.g. playing
fields), therefore it is classified as urban green cover, and it is estimated to provide a value of $1.2 million per
year in ecosystem services.
taBle 3: suMMary Of aNNual eCOsysteM serviCe values By laNd COver type fOr tHe wHiteBelt study area
land Cover typearea
(hectares)value per hectare
($/hectare/yr)total value
($million/yr)
Wetlands 2,643 $14,153 $39.09
Forest 5,525 $5,414 $28.56
grasslands 0 $1,618 $0
rivers 92 $335 $0.085
Cropland 58,664 $477 $27.97
perennial and pasture 5,601 $477 $2.67
idle land 12,322 $1,667 $20.54
hedgerows 1,169 $1,678 $1.96
orchards 315 $494 $0.16
urban/built-up (impervious) 4,975 $0 $0
urban green space (pervious) 3,127 $376 $1.18
Total $122.32
in this study, the average natural capital value per hectare in the Whitebelt study area was found to be less
than in the adjacent greenbelt, because the Whitebelt study area has far less high natural capital value land
cover such as forests and wetlands. The average value across a study area is dependent on the extent of land
cover types and their estimated values per hectare. in the case of the Whitebelt study area, the predominant
land cover is agricultural land, which have lower values in terms of non-market natural capital values, than
forested lands or wetland cover. however, it is important to note that agricultural lands in the Whitebelt study
17 The area excludes the urban/built up land classes except for urban green space.
wetlands and
forests combined
provide the greatest
estimated value in
ecosystem services
at $67.7 million per
year ($39 million
and $28 million per
year, respectively).daiderdOO pHOtO/fliCkr

dav id s uzu ki fOu N datiON page 17
area provide important market values (i.e. local food production), worth hundreds of millions of dollars in revenue
annually, which have not been included in this economic assessment.18
Two other major studies of the value of natural capital have been undertaken within the southern ontario region.
one study assessed the value of the Credit river Watershed at an annual average value per hectare of $3,911 (a
value comparable with the greenbelt study’s finding of $3,487 per hectare per year).19 This study adopted some
of the values established in the greenbelt report as well as values based on local information. The second study
assessed the ecosystem service values for the entire southern ontario region at an annual average value per
hectare of $6,780, based on transfer benefits from other studies20 (including the 2008 greenbelt study).21 The
higher value for the latter study is a result of the significantly greater values attributed to urban and suburban
forests, wetlands, and rivers, as well as urban greenspace.22 We have not adopted the higher range of values
for the Whitebelt study.23
18 While no study has yet to be done on the economic importance of agricultural commodities grown in the Whitebelt study area, a 2009 analysis found that farmland in the adjacent greenbelt produced over $1.5 billion in total revenue annually, representing 17% of gross farm receipts for the province as a whole (greenbelt grown. A profile of agriculture in ontario’s greenbelt. 2009. Friends of the greenbelt Foundation). Furthermore, a recent study in the lower Mainland in BC, found that urban dwellers would be willing to pay a significant premium for locally grown food, such as corn, over imported produce (46% premium over corn from California). The annual value for access to locally grown food in the Fraser Valley was estimated to be $382 per ha (Natural Capital in BC’s lower Mainland: Valuing the Benefits From Nature. 2010. david Suzuki Foundation and pacific parklands Foundation).
19 Kennedy, M., and Wilson, J. 2009. Natural Credit: Estimating the Value of Natural Capital in the Credit River Watershed. The pembina institute and Credit Valley Conservation. Canada.
20 The values are average values taken from several studies undertaken in other locations and selected by literature review.21 Troy, A., and Bagstad, K. 2009. Estimation of Ecosystem Service Values for Southern Ontario. prepared for the ontario
Ministry of Natural resources by Spatial informatics group. pleasanton, California.22 For example, their study valued non-urban forests at $4,443, similar to the greenbelt study’s value of $5,414, but valued
suburban forests at $14,777 per hectare per year, and urban forests at $25,843 per hectare per year. The non-urban wetlands were valued at $14,761 to $15,171 per hectare per year, also a similar value to the greenbelt study wetland values (range of $14,760 to $15,691/hectare/year depending on wetland type), whereas urban/suburban coastal fresh wetlands were valued at $73,840 (originally $161,420 per hectare per year but has since been corrected) – over five fold greater than the non-urban value. if these values were applied to the current Whitebelt study area, the estimated total value for ecosystem services provided each year would be $687.3 million. A value over five times more than the estimated values adapted from the greenbelt study.
23 The authors attribute higher values for urban and suburban natural cover because of their proximity to larger populations. While it is true that natural areas in urban and suburban areas are in greater demand than in rural areas, it is also likely that these natural areas are small in size, have low connectivity with other natural areas, and contain low biological diversity. As a result, although they may have a greater demand for recreation, they likely have low ecological functionality and therefore the benefits in terms of providing many other types of ecosystem services may be lower in value. until a greater number of studies and/or local information are provided that show that urban and suburban areas do provide higher values for their services, our valuation approach in this study will continue to use the values from our original 2008 greenbelt study.
agricultural lands
in the whitebelt
study area provide
ecosystem services
worth an estimated
$53.3 million per
year, including $28
million by croplands,
$20.5 million by idle
lands, $2.7 million
by perennial pasture
lands, and $2 million
by hedgerows. daiderdOO pHOtO/fliCkr
page 18 N at u r e ON t H e e dge : N at u r a l C a pita l a N d ON ta riO ’ s grOw iNg gOlde N HOr s e s HOe
york region
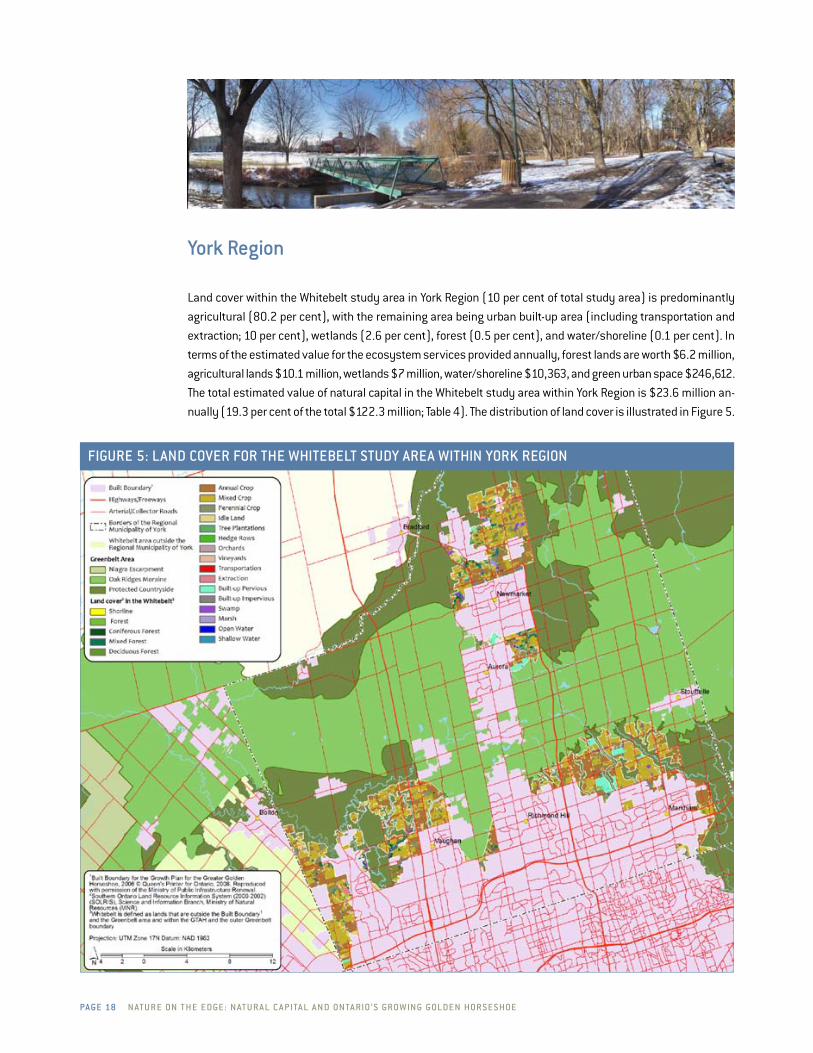
land cover within the Whitebelt study area in york region (10 per cent of total study area) is predominantly
agricultural (80.2 per cent), with the remaining area being urban built-up area (including transportation and
extraction; 10 per cent), wetlands (2.6 per cent), forest (0.5 per cent), and water/shoreline (0.1 per cent). in
terms of the estimated value for the ecosystem services provided annually, forest lands are worth $6.2 million,
agricultural lands $10.1 million, wetlands $7 million, water/shoreline $10,363, and green urban space $246,612.
The total estimated value of natural capital in the Whitebelt study area within york region is $23.6 million an-
nually (19.3 per cent of the total $122.3 million; Table 4). The distribution of land cover is illustrated in Figure 5.
figure 5: laNd COver fOr tHe wHiteBelt study area witHiN yOrk regiON

dav id s uzu ki fOu N datiON page 19
taBle 4: laNd COver aNd Natural Capital values fOr tHe wHiteBelt study area iN yOrk regiON
land cover type and sub-type
area (hectares)
value (Cdn$)
% of land cover
Forest/treed
Coniferous Forest 69 $372,894 0.4%
Mixed Forest 518 $2,804,072 2.9%
deciduous Forest 563 $3,050,029 3.2%
other Forest 1 $4,751 0.005%
plantation 81 0.5%
Total 1,232 $6,231,746 6.9%
Agriculture
Annual Crop 4,577 $2,181,727 25.8%
Mixed Crop 6,103 $2,909,302 34.4%
perennial Crop 780 $372,009 4.4%
idle land 2,514 $4,190,605 14.2%
hedge rows 275 $460,735 1.5%
orchards 0 $- 0.0%
Vineyards 0 $- 0.0%
Total 14,248 $10,114,378 80.2%
WetlAnd
Swamp 359 $5,303,119 2.0%
Marsh 103 $1,536,430 0.6%
Shallow Water 8 $118,522 0.04%
Total 470 $6,958,072 2.6%
WAterbody
open Water 11 $10,363 0.1%
Shoreline 0 $- 0.0%
Total 11 $10,363 0.1%
urbAn/built up
Transportation 565 $- 3.2%
Extraction 36 $- 0.2%
Built up area: impervious 540 $- 3.0%
urban green space 656 $246,612 3.7%
Total 1,797 $246,612 10.1%
totAl Whitebelt study AreA 17,758 $23,561,171 100%
figure 5: laNd COver fOr tHe wHiteBelt study area witHiN yOrk regiONagricultural land
ecosystem services
within the york region
of the whitebelt study
area are valued at
$10.1 million annually.aNdrea williaMs pHOtO

page 20 N at u r e ON t H e e dge : N at u r a l C a pita l a N d ON ta riO ’ s grOw iNg gOlde N HOr s e s HOe
figure 6: laNd COver fOr tHe wHiteBelt study area witHiN peel regiON
peel region
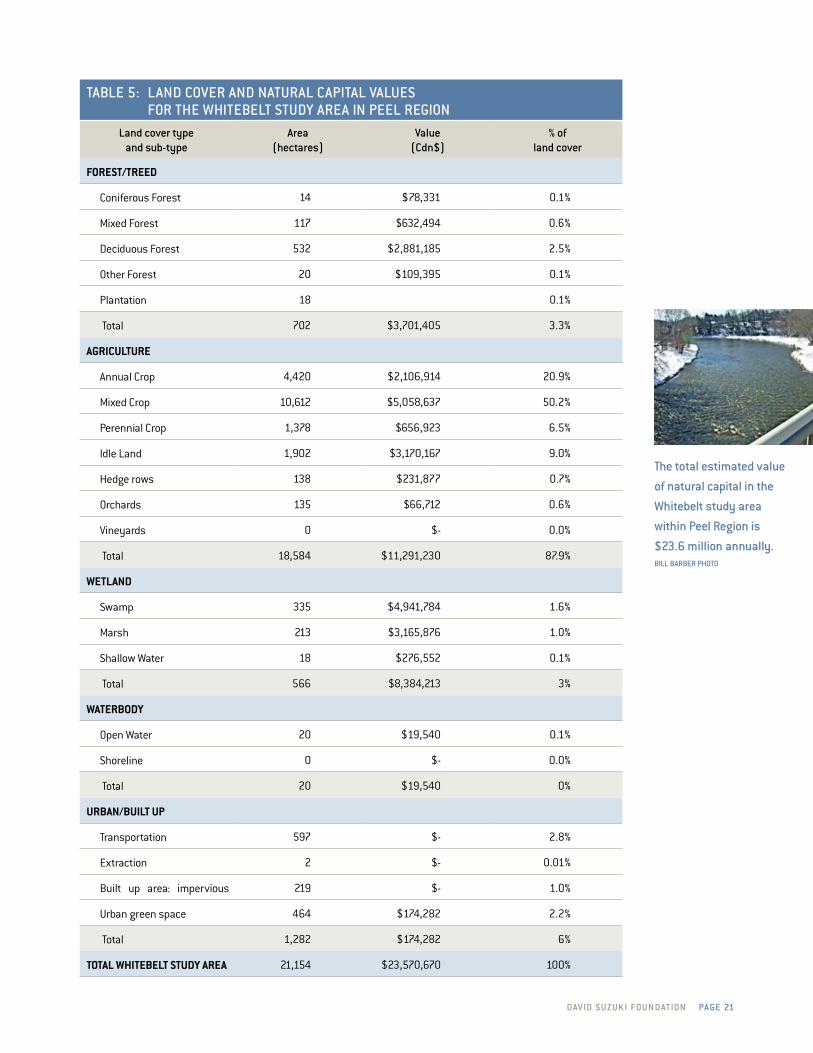
land cover in the Whitebelt study area within peel region is predominantly agricultural land (87.9 per cent), with
the remaining area classified as urban built-up (including transportation and extraction; 6 per cent), wetlands
(3 per cent), forest (3.3 per cent), and water/shoreline (0.1 per cent). in terms of the estimated value for the
ecosystem services provided annually, forest lands are worth $3.7 million, agricultural lands $11.3 million,
wetlands $8.4 million, water/shoreline $19,540, and green urban space $174,282. The total estimated value
of natural capital in the Whitebelt study area within peel region is $23.6 million annually (19.3 per cent of the
total $122.3 million; Table 5). The distribution of land cover is illustrated below in Figure 6.
dav id s uzu ki fOu N datiON page 21
taBle 5: laNd COver aNd Natural Capital values fOr tHe wHiteBelt study area iN peel regiON
land cover type and sub-type
area (hectares)
value (Cdn$)
% of land cover
Forest/treed
Coniferous Forest 14 $78,331 0.1%
Mixed Forest 117 $632,494 0.6%
deciduous Forest 532 $2,881,185 2.5%
other Forest 20 $109,395 0.1%
plantation 18 0.1%
Total 702 $3,701,405 3.3%
Agriculture
Annual Crop 4,420 $2,106,914 20.9%
Mixed Crop 10,612 $5,058,637 50.2%
perennial Crop 1,378 $656,923 6.5%
idle land 1,902 $3,170,167 9.0%
hedge rows 138 $231,877 0.7%
orchards 135 $66,712 0.6%
Vineyards 0 $- 0.0%
Total 18,584 $11,291,230 87.9%
WetlAnd
Swamp 335 $4,941,784 1.6%
Marsh 213 $3,165,876 1.0%
Shallow Water 18 $276,552 0.1%
Total 566 $8,384,213 3%
WAterbody
open Water 20 $19,540 0.1%
Shoreline 0 $- 0.0%
Total 20 $19,540 0%
urbAn/built up
Transportation 597 $- 2.8%
Extraction 2 $- 0.01%
Built up area: impervious 219 $- 1.0%
urban green space 464 $174,282 2.2%
Total 1,282 $174,282 6%
totAl Whitebelt study AreA 21,154 $23,570,670 100%
figure 6: laNd COver fOr tHe wHiteBelt study area witHiN peel regiONthe total estimated value
of natural capital in the
whitebelt study area
within peel region is
$23.6 million annually.Bill BarBer pHOtO
page 2 2 N at u r e ON t H e e dge : N at u r a l C a pita l a N d ON ta riO ’ s grOw iNg gOlde N HOr s e s HOe
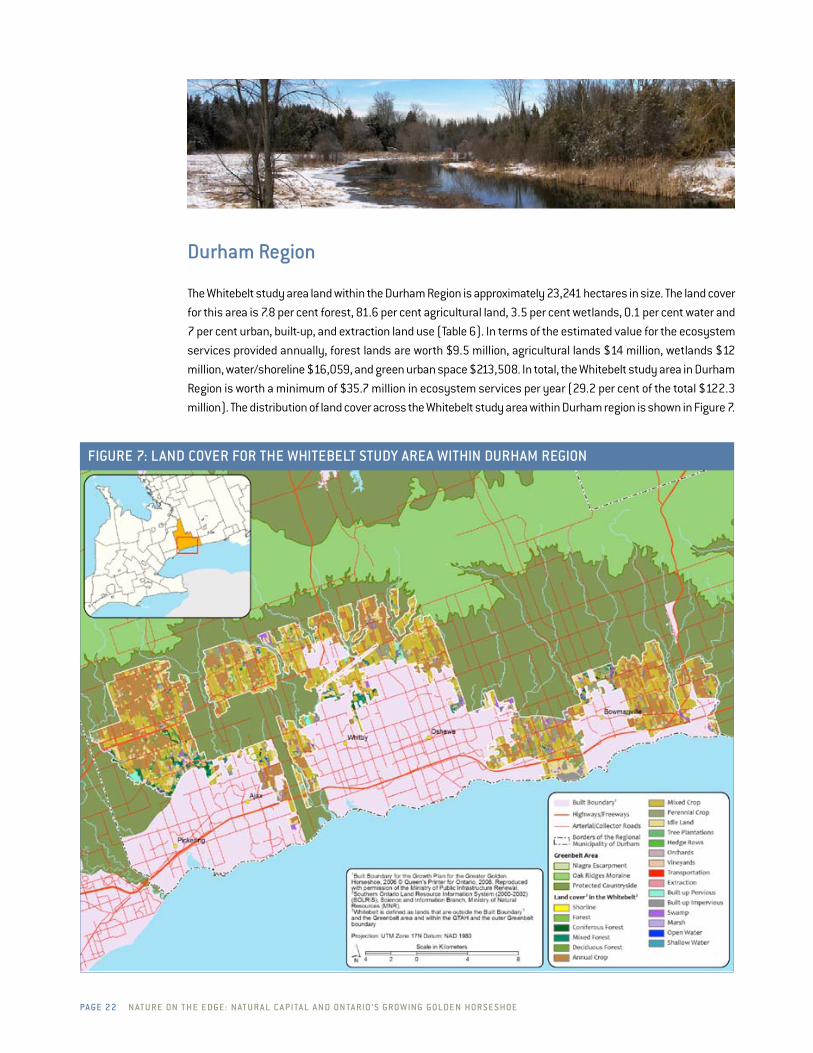
figure 7: laNd COver fOr tHe wHiteBelt study area witHiN durHaM regiON
durham region
The Whitebelt study area land within the durham region is approximately 23,241 hectares in size. The land cover
for this area is 7.8 per cent forest, 81.6 per cent agricultural land, 3.5 per cent wetlands, 0.1 per cent water and
7 per cent urban, built-up, and extraction land use (Table 6). in terms of the estimated value for the ecosystem
services provided annually, forest lands are worth $9.5 million, agricultural lands $14 million, wetlands $12
million, water/shoreline $16,059, and green urban space $213,508. in total, the Whitebelt study area in durham
region is worth a minimum of $35.7 million in ecosystem services per year (29.2 per cent of the total $122.3
million). The distribution of land cover across the Whitebelt study area within durham region is shown in Figure 7.

dav id s uzu ki fOu N datiON page 23
taBle 6: laNd COver aNd Natural Capital values fOr tHe wHiteBelt study area iN durHaM regiON
land cover type and sub-type
area (hectares)
value (Cdn$)
% of land cover
Forest/treed
Coniferous Forest 244 $1,320,660 1.0%
Mixed Forest 473 $2,559,578 2.0%
deciduous Forest 1,039 $5,623,494 4.5%
other Forest 1 $4,507 0.004%
plantation 57 0.2%
Total 1,813 $9,508,239 7.8%
Agriculture
Annual Crop 6,543 $3,119,145 28.2%
Mixed Crop 6,963 $3,319,120 30.0%
perennial Crop 1,331 $634,441 5.7%
idle land 3,790 $6,318,166 16.3%
hedge rows 336 $564,366 1.4%
orchards 0 $- 0.0%
Vineyards 0 $- 0.0%
Total 18,963 $13,955,238 81.6%
WetlAnd
Swamp 775 $11,438,504 3.3%
Marsh 37 $547,052 0.2%
Shallow Water 0 $- 0.0%
Total 812 $11,985,556 3.5%
WAterbody
open Water 16 $15,684 0.1%
Shoreline 3 $375 0.01%
Total 19 $16,059 0.1%
urbAn/built up
Transportation 847 $- 3.6%
Extraction 0 $- 0.0%
Built up area: impervious 218 $- 0.9%
urban green space 568 $213,508 2.4%
Total 1,634 $213,508 7.0%
totAl Whitebelt study AreA 23,241 $35,678,601 100%
agricultural land
ecosystem services
within the durham
region of the whitebelt
study area are valued at
$14 million annually.Bev Currie pHOtO
page 24 N at u r e ON t H e e dge : N at u r a l C a pita l a N d ON ta riO ’ s grOw iNg gOlde N HOr s e s HOe
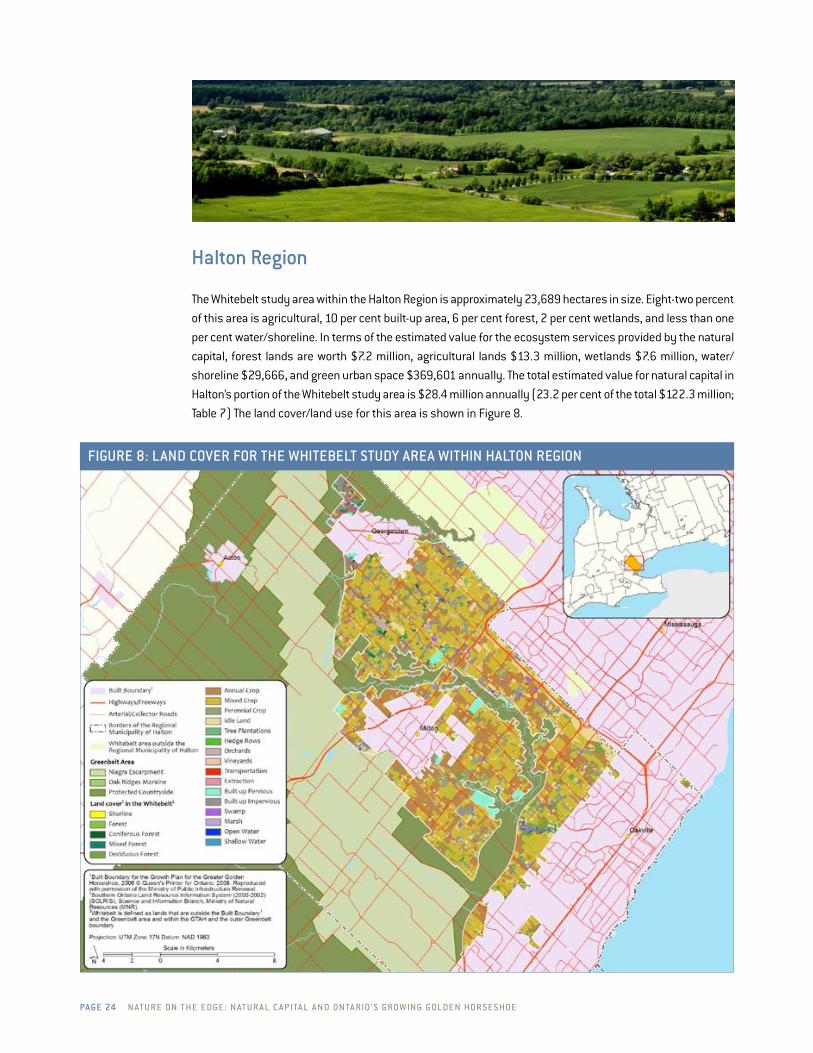
figure 8: laNd COver fOr tHe wHiteBelt study area witHiN HaltON regiON
Halton region
The Whitebelt study area within the halton region is approximately 23,689 hectares in size. Eight-two percent
of this area is agricultural, 10 per cent built-up area, 6 per cent forest, 2 per cent wetlands, and less than one
per cent water/shoreline. in terms of the estimated value for the ecosystem services provided by the natural
capital, forest lands are worth $7.2 million, agricultural lands $13.3 million, wetlands $7.6 million, water/
shoreline $29,666, and green urban space $369,601 annually. The total estimated value for natural capital in
halton’s portion of the Whitebelt study area is $28.4 million annually (23.2 per cent of the total $122.3 million;
Table 7) The land cover/land use for this area is shown in Figure 8.

dav id s uzu ki fOu N datiON page 25
taBle 7: laNd COver aNd Natural Capital values fOr tHe wHiteBelt study area iN HaltON regiON
land cover type and sub-type
area (hectares)
value (Cdn$)
% of land cover
Forest/treed
Coniferous Forest 52 $280,432 0.2%
Mixed Forest 172 $930,346 0.7%
deciduous Forest 1,085 $5,873,349 4.6%
other Forest 14 $76,016 0.1%
plantation 73 0.3%
Total 1,396 $7,160,142 5.9%
Agriculture
Annual Crop 5,049 $2,406,715 21.3%
Mixed Crop 9,379 $4,470,982 39.6%
perennial Crop 1,460 $695,772 6.2%
idle land 3,105 $5,175,447 13.1%
hedge rows 309 $519,025 1.3%
orchards 67 $32,917 0.3%
Vineyards 0 $- 0.0%
Total 19,367 $13,300,859 81.8%
WetlAnd
Swamp 397 $5,864,716 1.7%
Marsh 98 $1,452,783 0.4%
Shallow Water 17 $257,305 0.1%
Total 512 $7,574,804 2.2%
WAterbody
open Water 31 $29,666 0.1%
Shoreline 0 $-
Total 31 $29,666 0.1%
urbAn/built up
Transportation 886 $- 3.7%
Extraction 24 $- 0.1%
Built up area: impervious 489 $- 2.1%
urban green space 983 $369,601 4.2%
Total 2,383 $369,601 10.1%
totAl Whitebelt study AreA 23,689 $28,435,073 100.0%
the estimated value for
forest land ecosystem
services in the Halton
region’s portion of the
whitebelt study area is
$28.4 million annually. MeliNa stetHOpOulis pHOtO
page 26 N at u r e ON t H e e dge : N at u r a l C a pita l a N d ON ta riO ’ s grOw iNg gOlde N HOr s e s HOe
figure 9: laNd COver fOr tHe wHiteBelt study area witHiN tHe City Of HaMiltON
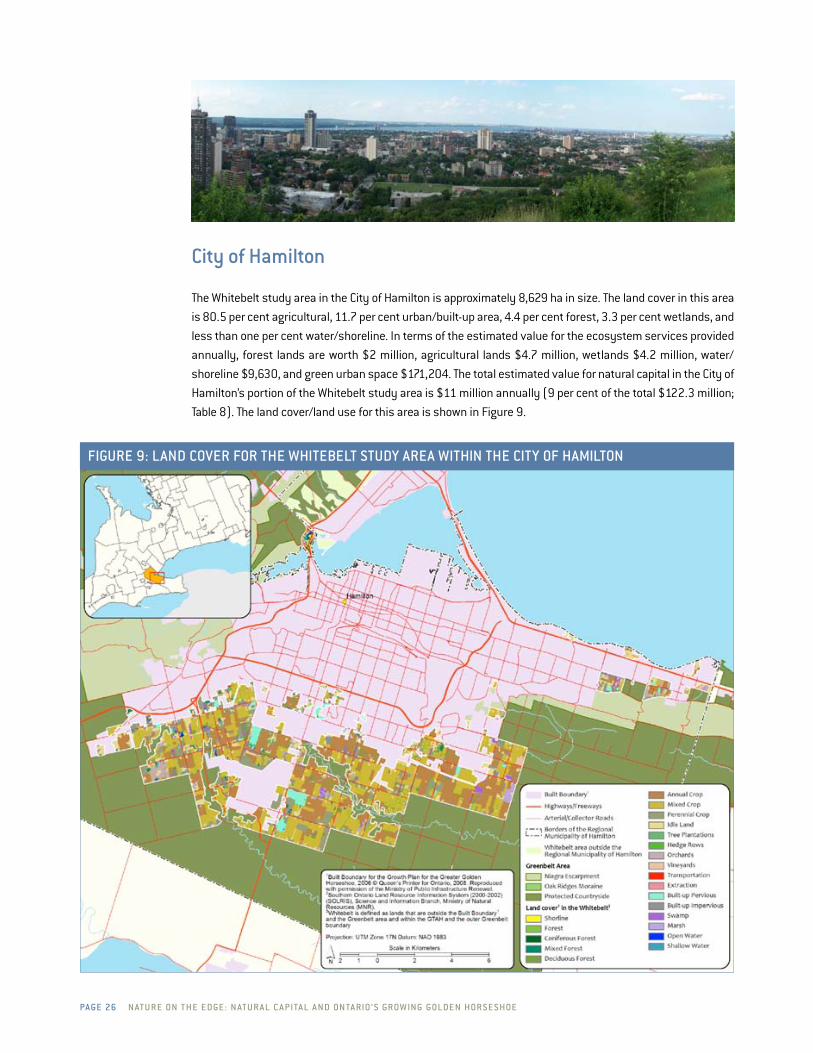
City of Hamilton
The Whitebelt study area in the City of hamilton is approximately 8,629 ha in size. The land cover in this area
is 80.5 per cent agricultural, 11.7 per cent urban/built-up area, 4.4 per cent forest, 3.3 per cent wetlands, and
less than one per cent water/shoreline. in terms of the estimated value for the ecosystem services provided
annually, forest lands are worth $2 million, agricultural lands $4.7 million, wetlands $4.2 million, water/
shoreline $9,630, and green urban space $171,204. The total estimated value for natural capital in the City of
hamilton’s portion of the Whitebelt study area is $11 million annually (9 per cent of the total $122.3 million;
Table 8). The land cover/land use for this area is shown in Figure 9.

dav id s uzu ki fOu N datiON page 27
taBle 8: laNd COver aNd Natural Capital values fOr tHe wHiteBelt study area iN tHe City Of HaMiltON
land cover type and sub-type
area (hectares)
value (Cdn$)
% of land cover
Forest/treed
Coniferous Forest 20 $106,837 0.2%
Mixed Forest 54 $292,614 0.6%
deciduous Forest 265 $1,434,562 3.1%
other Forest 24 $129,008 0.3%
plantation 19 0.2%
Total 382 $1,963,021 4.4%
Agriculture
Annual Crop 2,171 $1,034,702 25.2%
Mixed Crop 2,849 $1,358,348 33.0%
perennial Crop 652 $310,710 7.6%
idle land 1,013 $1,688,027 11.7%
hedge rows 111 $186,083 1.3%
orchards 113 $55,910 1.3%
Vineyards 40 $19,537 0.5%
Total 6,948 $4,653,318 80.5%
WetlAnd
Swamp 168 $2,472,885 1.9%
Marsh 99 $1,473,528 1.1%
Shallow Water 16 $242,110 0.2%
Total 283 $4,188,522 3.3%
WAterbody
open Water 10 $9,630 0.1%
Shoreline 0 $-
Total 10 $9,630 0.1%
urbAn/built up
Transportation 308 $- 3.6%
Extraction 1 $- 0.01%
Built up area: impervious 242 $- 2.8%
urban green space 456 $171,204 5.3%
Total 1,007 $171,204 11.7%
totAl Whitebelt study AreA 8,629 $10,985,696 100.0%
the total estimated
value for natural capital
in the City of Hamilton’s
portion of the whitebelt
study area is $11
million annually.peter CruiksHaNk pHOtO

page 28 N at u r e ON t H e e dge : N at u r a l C a pita l a N d ON ta riO ’ s grOw iNg gOlde N HOr s e s HOe
pa rt 5
urban growth planning in the gThA
tHe five MaJOr MuNiCipal regiONs with lands in the Whitebelt study area (City of hamilton, halton, york,
durham, and peel regions), have updated their official plans to show where urban development will occur
between now and 2031 under the provincial growth plan. All of these municipal regions have proposed to
further expand settlement areas into the Whitebelt for their current urban growth forecasts to 2031. For
example, a recent study reported that 10,115 hectares, or 17.2 per cent, of the Whitebelt around these
municipalities has been proposed for development from now to 2031 in the current round of draft official plan
amendments.24 The authors estimated, that if approved, this would consume between 11 per cent and 22.8
per cent of each municipality’s portion of the Whitebelt. it’s important to note, that this proposed additional
greenfield development is over and above the approximately 52,000 hectares25 of greenfield land that has
already been designated for urban expansion (approved vacant greenfields) and is available for development
in the Whitebelt study area already.26,27
24 ibid.25 According to the ontario growth Secretariat 5 year update on the growth plan, this “designated greenfield area” amounts
to about 52,000 hectares within the Whitebelt study area. 26 These greenfield lands were approved for urban development prior to the current land budgeting process.27 other estimates have put the amount of vacant approved greenfield lands (i.e., approved prior to the present land
budgeting exercise) available for development as less. Tomalty and Komorowski 2011 report that 27,000 ha of residential land have been designated along with more than 10,000 ha of employment land, for a total land bank of 37,000 ha within the Whitebelt study area.
all of these
municipal regions
have proposed to
further expand
settlement areas into
the whitebelt for their
current urban growth
forecasts to 2031.laura M. Bailey pHOtO
dav id s uzu ki fOu N datiON page 29
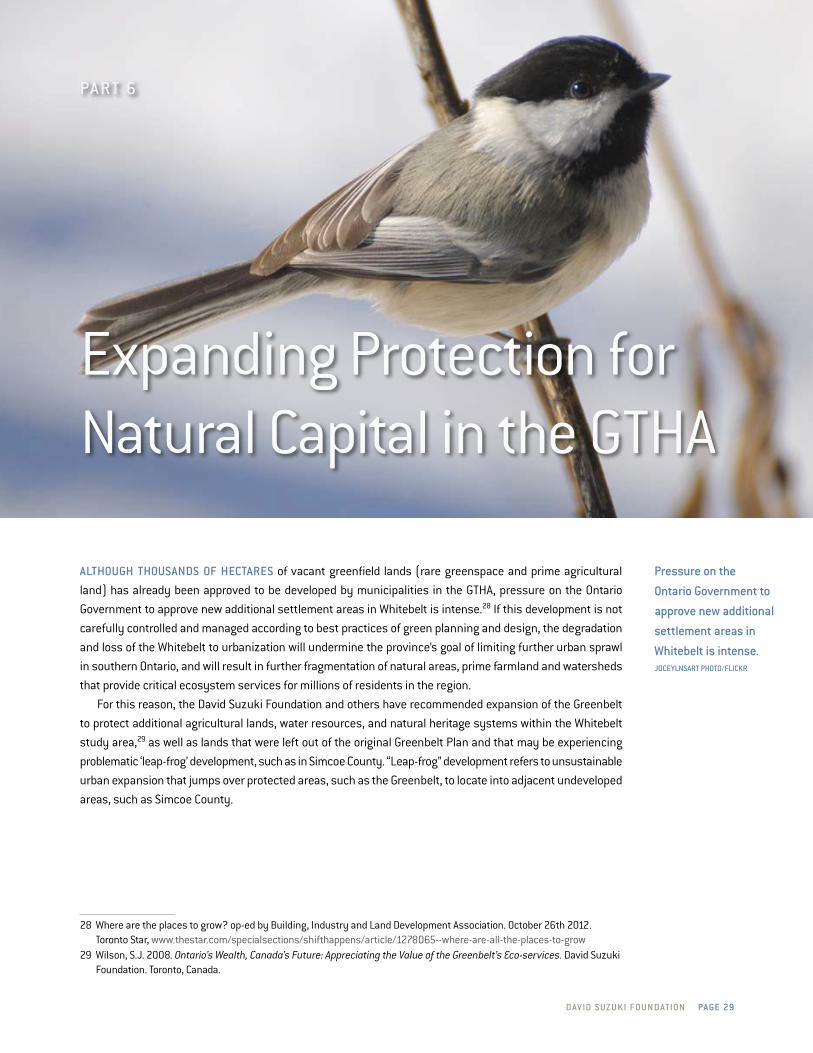
altHOugH tHOusaNds Of HeCtares of vacant greenfield lands (rare greenspace and prime agricultural
land) has already been approved to be developed by municipalities in the gThA, pressure on the ontario
government to approve new additional settlement areas in Whitebelt is intense.28 if this development is not
carefully controlled and managed according to best practices of green planning and design, the degradation
and loss of the Whitebelt to urbanization will undermine the province’s goal of limiting further urban sprawl
in southern ontario, and will result in further fragmentation of natural areas, prime farmland and watersheds
that provide critical ecosystem services for millions of residents in the region.
For this reason, the david Suzuki Foundation and others have recommended expansion of the greenbelt
to protect additional agricultural lands, water resources, and natural heritage systems within the Whitebelt
study area,29 as well as lands that were left out of the original greenbelt plan and that may be experiencing
problematic ‘leap-frog’ development, such as in Simcoe County. “leap-frog” development refers to unsustainable
urban expansion that jumps over protected areas, such as the greenbelt, to locate into adjacent undeveloped
areas, such as Simcoe County.
28 Where are the places to grow? op-ed by Building, industry and land development Association. october 26th 2012. Toronto Star, www.thestar.com/specialsections/shifthappens/article/1278065--where-are-all-the-places-to-grow
29 Wilson, S.J. 2008. Ontario’s Wealth, Canada’s Future: Appreciating the Value of the Greenbelt’s Eco-services. david Suzuki Foundation. Toronto, Canada.
pa rt 6
Expanding protection for Natural Capital in the gThA
pressure on the
Ontario government to
approve new additional
settlement areas in
whitebelt is intense.JOCeylNsart pHOtO/fliCkr

page 3 0 N at u r e ON t H e e dge : N at u r a l C a pita l a N d ON ta riO ’ s grOw iNg gOlde N HOr s e s HOe
provincial process for expanding the greenbelt
The ontario government has established a process to expand the greenbelt further to protect additional green
space, farmland and water resources in the greater golden horseshoe. in 2008, the Ministry of Municipal
Affairs and housing consulted on draft criteria to be used to consider potential municipal requests to expand
the greenbelt. Based on this advice, the ontario government has put in place criteria to assess requests from
regional, county single-tier and lower tier governments to expand the greenbelt further. The following criteria
must be met before new requests are considered for additions to the current greenbelt:30,31
1. The request is from a regional, county or single-tier municipal government and is supported by a
council resolution.
2. in a region or county, the lower-tier host municipality (or municipalities) in the proposed expansion
area supports the request through a council resolution.
3. The municipality documents how it has addressed the Ministry of Municipal Affairs and housing’s
expectations for:
• Engagement with the public, key stakeholders, and public bodies such as conservation author-
ities, including notification of affected landowners.
• Engagement with Aboriginal communities.
4. The request identifies a proposed expansion area that is adjacent to the greenbelt or demonstrates
a clear functional relationship to the greenbelt area and how the greenbelt plan policies will apply.
5. The request demonstrates how the proposed expansion area meets the intent of the vision and one
or more of the goals of the greenbelt plan.
6. one or more of the greenbelt systems (Natural heritage System, Agricultural System and Water
resource System) is identified and included in the proposed expansion area and their functional
relationship to the existing greenbelt system is demonstrated.
7. A municipality’s request to expand the greenbelt may be considered by the Ministry of Municipal
Affairs and housing while the municipality is engaged in its associated growth plan conformity
exercise. The proposed area for expansion cannot impede the implementation of the growth plan. The
municipality must demonstrate how the expansion area supports the goals, objectives and targets
of both the greenbelt plan and the growth plan.
8. Expansions to the greenbelt will be considered for areas that are outside of existing urban settlement
areas. An exception may be considered for major natural heritage systems that are located within
existing urban settlement areas. The natural heritage system must be designated within the municipal
official plan.
30 Ministry of Municipal Affairs and housing. growing the greenbelt Booklet. August 2008. www.mah.gov.on.ca/page5895.aspx#Expansion%20Criteria
31 The ontario government has recently proposed to amend its policies for expansion of the greenbelt with a new designation for the inclusion of urban river valleys. if successful, this move would allow municipalities, like Toronto, Mississauga, oakville and Brampton, to add critical riparian corridors to the existing network of protected lands and waters within the greenbelt. Adding these municipalities’ major waterways, which includes the don, humber, Bronte, Sixteen Mile and Credit rivers, to the greenbelt will help address issues of water quality, public access for local citizens to river systems in addition to local food and critical ecosystem services. The government announced in late 2012 that the first addition since 2005 under the new greenbelt expansion policy would be the 255 ha glenorchy Conservation Area in oakville.
the Ontario
government has
established a
process to expand
the greenbelt
further to protect
additional green
space, farmland and
water resources in
the greater golden
Horseshoe.graNt MCdONald pHOtO
dav id s uzu ki fOu N datiON page 31
9. A municipality’s request to expand the greenbelt may be considered by the Ministry of Municipal
Affairs and housing while complementary provincial initiatives are being developed.
10. The request has to demonstrate that the proposed expansion area will not undermine provincial
interests, or the planning or implementation of complementary provincial initiatives (e.g. Source
protection plans under the Clean Water Act, 2006, Metrolinx’s regional Transportation plan, proposed
lake Simcoe protection Strategy.)
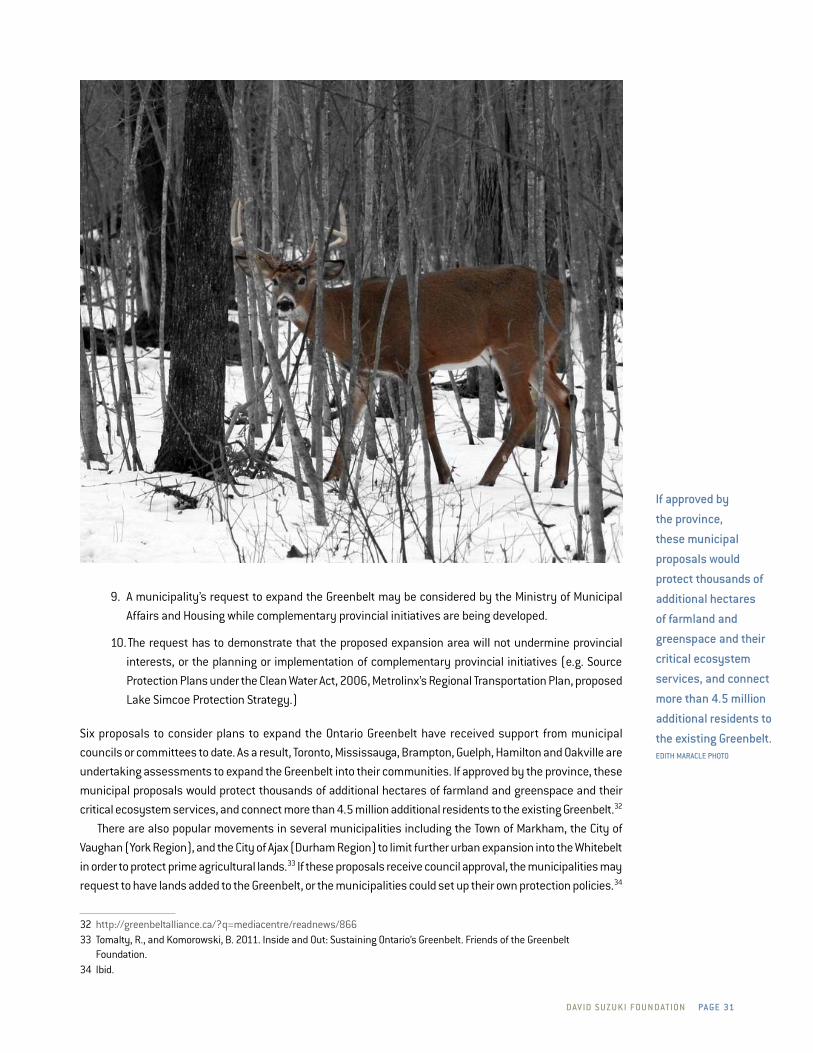
Six proposals to consider plans to expand the ontario greenbelt have received support from municipal
councils or committees to date. As a result, Toronto, Mississauga, Brampton, guelph, hamilton and oakville are
undertaking assessments to expand the greenbelt into their communities. if approved by the province, these
municipal proposals would protect thousands of additional hectares of farmland and greenspace and their
critical ecosystem services, and connect more than 4.5 million additional residents to the existing greenbelt.32
There are also popular movements in several municipalities including the Town of Markham, the City of
Vaughan (york region), and the City of Ajax (durham region) to limit further urban expansion into the Whitebelt
in order to protect prime agricultural lands.33 if these proposals receive council approval, the municipalities may
request to have lands added to the greenbelt, or the municipalities could set up their own protection policies.34
32 http://greenbeltalliance.ca/?q=mediacentre/readnews/86633 Tomalty, r., and Komorowski, B. 2011. inside and out: Sustaining ontario’s greenbelt. Friends of the greenbelt
Foundation.34 ibid.
if approved by
the province,
these municipal
proposals would
protect thousands of
additional hectares
of farmland and
greenspace and their
critical ecosystem
services, and connect
more than 4.5 million
additional residents to
the existing greenbelt.editH MaraCle pHOtO

page 32 N at u r e ON t H e e dge : N at u r a l C a pita l a N d ON ta riO ’ s grOw iNg gOlde N HOr s e s HOe
pa rt 7
Conclusions and recommendations
1. The five major municipal regions within the Whitebelt study area (City of hamilton, halton, york, durham,
and peel), have proposed to expand urban settlement areas into the Whitebelt as part of their current
growth forecasts to 2031. 10,115 hectares, or 17.2 per cent, of the Whitebelt around these municipalities
has been proposed for development from now to 2031 in the proposed official plan amendments. This
proposed greenfield development is over and above the approximately 52,000 hectares of pre-existing
approved greenfield lands (approved vacant greenfields) that have already been designated for urban
expansion and are available for urban development in the gThA now.
• reCOMMeNdatiON: development of approved vacant greenfields should incorporate best practices
for green planning and design in order to preserve, restore and enhance natural capital features (e.g.
greenspace) at the site and neighborhood scales. This includes the establishment of naturalized urban
parks and playgrounds, ecological restoration of sensitive sites, and incorporation of green living
technologies into the design of built infrastructure, such as bioswales, rain gardens, green roofs and
other engineered vegetative features.35
35 health, prosperity and Sustainability: the Case for green infrastructure in ontario. 2012. green infrastructure ontario Coalition and Ecojustice. http://greeninfrastructureontario.org/sites/greeninfrastructureontario.org/files/health,%20prosperity%20and%20Sustainability_The%20Case%20for%20green%20infrastructure%20in%20ontario.pdf
development of
approved vacant
greenfields should
incorporate best
practices for green
planning and
design in order to
preserve, restore
and enhance natural
capital features. eriCa BlONde pHOtO

dav id s uzu ki fOu N datiON page 33
2. due to the extent of urban expansion that is planned to happen in the inner ring of ontario’s greenbelt
in the coming decades, it will be important to evaluate how approved and proposed new urban
development will impact the region’s critical natural capital assets, especially key natural heritage
and hydrological features. This is especially important for the Whitebelt study area where only 5.8 per
cent of the region remains forested, only 2.8 per cent is wetland, and a mere 0.1 per cent is water/
shoreline.
• reCOMMeNdatiON: remaining priority ecosystems in the Whitebelt study area, such as forests
and wetlands should be identified and protected as part of existing municipal Natural heritage
Systems.
3. Southern ontario has some of the best remaining agricultural lands in Canada in terms of soil fertility,
crop productivity and economic value. While there is currently no effort to inventory or track the loss
of agricultural land in ontario, the most recent analysis found that between 1996 and 2001, 16 per
cent of farmland in the gThA was lost to urban encroachment.36 over 80 per cent of the Whitebelt
study area remains agricultural, much of which is classified Class 1 prime agricultural land.
• reCOMMeNdatiON: Further urban growth and development on prime agricultural lands in the
Whitebelt study area should be avoided at all cost. Municipalities should explore the establish-
ment of community-driven proposals to establish local food belts of protected agricultural land.
4. Six municipal proposals to expand the ontario greenbelt have received support from municipal councils
or committees in the gThA. if successful, such municipal action will protect thousands of additional
hectares of farmland and greenspace in the greater golden horseshoe.
• reCOMMeNdatiON: once the applications are completed, the province should move quickly to
approve these municipal proposals under its criteria to grow the greenbelt.
5. Additional provincial expansion of the greenbelt should be considered for areas just upstream of
existing communities in the gThA in the Whitebelt.
• reCOMMeNdatiON: Expansion of the greenbelt should focus on improving connectivity of natural
areas across the gThA. This includes terrestrial and freshwater corridors, such as river systems,
that connect areas outside of the greenbelt, to the natural systems protected within the current
greenbelt, as well as those that link the greenbelt, across the Whitebelt, to lake ontario.
36 Wilson, S.J. 2008. Ontario’s Wealth, Canada’s Future: Appreciating the Value of the Greenbelt’s Eco-services. The greenbelt Foundation and the david Suzuki Foundation. Toronto, Canada.
Over 80 per cent
of the whitebelt
study area remains
agricultural, much of
which is classified
Class 1 prime
agricultural land.sOMeBOdyaka/fliCkr pHOtO
pHOtO COurtesy frieNds Of tHe greeNBelt
the david suzuki foundation works with government, business and individuals to conserve our environment by providing science-based education, advocacy and policy work, and acting as a catalyst for the social change that today’s situation demands.
davidsuzuki.org
this report is the tenth in a series examining the value of natural capital to communities in
Canada’s major urban areas. it provides the first ever estimate of the non-market economic
values of ecosystem services in the largely undeveloped ‘whitebelt’ area between the
Ontario greenbelt and the current urban containment boundaries for municipalities in
the greater golden Horseshoe region. the purpose of the study is to better understand
the benefits provided by remaining natural capital assets, such as prime farmland and
rare wetlands, and the potential cost of further urban development in the region.
for more information about the economic benefits of nature, please visit www.davidsuzuki.org/
naturalcapital. you can contribute to the conversation yourself on twitter at #foodandwaterfirst
Recommended