Embed Size (px)
Citation preview
5-17-04
The Regional Nature of the World’s Automotive Sector
by
Alan M. Rugman*
and
Simon Collinson**
*L. Leslie Waters Chair in International Business Kelley School of Business, Indiana University
N 1309 E. Tenth Street Bloomington, IN 47401-1701 U.S.A
Tel: 812-855-5415 Fax: 812-855-3354
E-mail: [email protected] and
Associate Fellow, Templeton College University of Oxford
**Senior Lecturer in International Business
Warwick Business School, University of Warwick Coventry, CV4 7AL, UK.
Tel: (0)2476 524508 Fax: (0)2476 524628
E-mail: [email protected]

1
Abstract
There are 29 automotive firms in the world’s largest 500 firms. Yet none of these are
“global” firms, defined as having at least 20 per cent of their sales in each of the three
regions of the broad “triad” of the E.U., North America and Asia. Indeed 23 of the 29
auto and auto parts firms are home-region based, with an average of 60.6 per cent of their
sales as intra-regional. These are representative firms across the 500, as the average intra-
regional sales for all manufacturing firms is 61.8 per cent. These are a few special cases,
especially Toyota and Nissan of firms being active in two regions of the triad.
DaimlerChrysler and Honda are “host-region oriented”. Seven cases are discussed in
some detail to explore the reasons for the lack of globalization in the world automotive
business.
Key words: regional; intra-regional; automotive; globalization

2
Introduction
In a previous article in this journal, it has been demonstrated that globalization is a myth,
Rugman and Hodgetts (2001). Business leaders cannot simply assume that world markets
are fully integrated and that consumer demand is becoming homogenized. Nor is there a
trend towards global economic integration. Instead, the data indicate that world markets
are divided into three large “triad” blocks. The great majority of world trade, foreign
direct investment (FDI), and sales by large firms takes place within these triad blocks,
rather than between them. Further, there is evidence that such intra-regional trade, FDI
and corporate sales are all increasing. The growth of these regional blocks should not be
mistaken for globalization as entry to other regions of the triad is a difficult journey for
most firms. Indeed, in another article in this journal, it was shown that only one of the 49
retail firms in the world’s 500 largest firms was global (LVMH) whereas most were
heavily dependent for sales on their home region, Rugman and Girod (2003). The world’s
largest firm, Wal-Mart, has 94 per cent of its sales in North America, while Carrefour has
81.3 per cent in Europe and Itochu has 100 per cent in Asia.
Recently the latter work has been extended to investigate the global or regional
activities of the entire set of the world’s 500 largest firms. These firms account for 90 per
cent of the world’s stock of FDI and nearly half the world’s trade, Rugman (2000). From
this work it has been demonstrated that the vast majority of international business activity
by the 500 firms is conducted on a regional basis, rather than globally, Rugman and Brain
(2003), Rugman and Verbeke (2004), Rugman (2004). The large regional “triad” markets
of the European Union (EU), the United States (or, more broadly, NAFTA) and Japan
(or, more broadly, all of Asia) also account for most of the sales of the world’s largest
automobile companies. For 380 of the world’s 500 largest companies, data on their

3
geographic sales in the “broad” triad regions of Europe, North America and Asia
(including Oceania) is available. Of these 380, 180 are manufacturing MNEs, see Table
1. The motor vehicle and parts industry accounts for 29 of these manufacturing MNEs.
Table 1 here
In this paper, we focus on the regional sales and localized production of the 29
large auto firms. We develop a table with the regional sales of these 29 firms. We find
that none are global, only four are bi-regional, and the vast majority are home-region
oriented. We then examine the reasons for such home-region sales including some
discussion of the localized production clustering of auto and auto parts makers within
each of the regions of the triad. We discuss the possible barriers to global expansion in
this sector. Finally, we report in detail on the regional strategies and organizational
structures of five leading auto firms. We find that the auto industry is not global, but very
regional in its activities.
A Regional Automotive Industry
In previous papers, a revenue-based classification for firms’ regional scope was
developed, Rugman and Brain (2003), Rugman and Verbeke (2004). Global firms were
defined as deriving over 20 per cent of their sales from each region of the broad triad, but
less than 50 per cent in any one region. Bi-regional firms were defined as deriving over
20 per cent of their sales from two regions of the triad, including their own, but less than
50 per cent in the region in which they are headquartered. Host-region firms are defined
as deriving over 50 per cent of their sales from a region other than their own. Home-
region oriented firms, derived over 50 per cent of their sales from the region in which
they are headquartered.

4
If we begin by examining the ‘Transnationality Index’ (TNI) published in the
World Investment Report (UNCTAD) (2003) we find that all but two auto firms (Honda
and Volvo) are actually less transnational than the average (59.4 per cent) for the top 100
non-financial transnational corporations (Table 2). This widely-cited measure of
transnationality is based on comparing the foreign to total (F/T) ratios of three measures:
sales, employment and assets. So it focuses on the country-level (F/T) dependence of a
firm.
Table 2 here
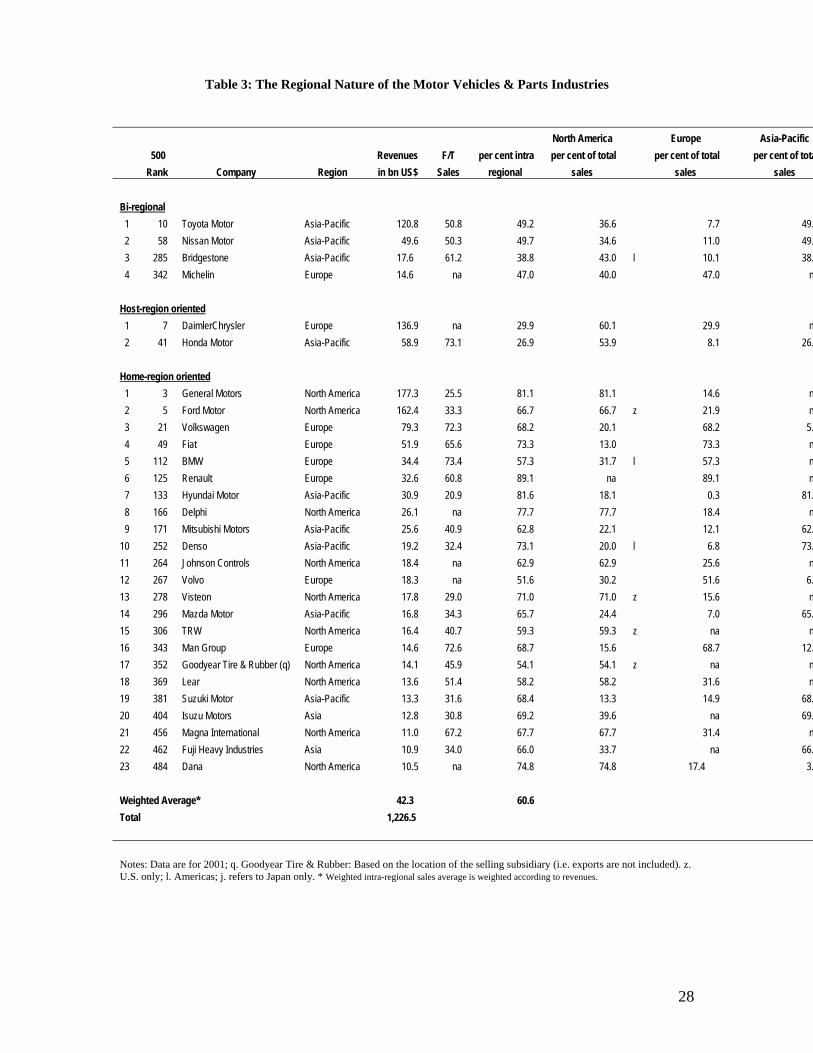
If we then examine the regional dependence of these firms we find, as shown in
Table 3, that none of the 29 automotive MNEs in the largest 500 are global; in fact, 23
are classified as “home-region oriented”, with a majority of their sales in their home
region of the triad. This includes Volvo which, despite its high TNI indicating a lack of
home country orientation, is heavily dependent on the European region. Two automakers
and two parts makers are bi-regional, with over 20 per cent of their sales in two parts of
the triad and less than 50 per cent in any region.
DaimlerChrysler and Honda derive more than 50 per cent of their revenue from a
host region and are labeled “host-region oriented.” The weighted average of intra-
regional sales in the automotive sector is 60.6 per cent, just below the manufacturing
sector’s average of 61.8 per cent.
Table 3 here
The automotive sector is concentrated in the three triad regions of the United
States (North America), Europe and Japan (Asia). In each of these regions, domestic

5
producers are significantly more competitive than foreign producers. General Motors,
Ford and the Chrysler Group of DaimlerChrysler (a U.S. company prior to the merger
with Daimler Benz) each have 28.3 per cent, 21.1 per cent, and 12.9 per cent of the U.S.
market for motor vehicles. Together, the largest three domestic automakers in the United
States have 62.3 per cent of the U.S. market. Imports account for approximately 15 per
cent of the United States market and do not include locally-made Japanese brands, Morris
(2001).
In general, the European market is more fragmented than the North American
market. In 2002, Renault had 11.3 per cent of the European market for passenger cars and
light commercial vehicles. Volkswagen and Opel (a GM subsidiary) followed with 10 per
cent and 9 per cent of this market respectively. The five largest European brands,
Renault, Volkswagen, Peugeot, Fiat and Citroen, accounted for 43.6 per cent of the
European market. Ford, the fourth largest competitor in Europe, had 8.9 per cent of the
market. Japanese and South Korean firms accounted for approximately 12.2 per cent and
3.1 per cent respectively.
The Japanese market is the most consolidated of all triad markets. Toyota alone
has 38.3 per cent of the automobile market, Henderson (2003). Honda, the second largest
Japanese automaker, accounts for 15.6 per cent. Together, Honda, Toyota, Renault-
Nissan and Suzuki-Maruti, the four largest Japanese automakers, have 78.4 per cent of
the Japanese market. Ford, which acquired domestic Mazda, accounts for 5 per cent.
General Motors, the U.S. leader and the world’s largest car manufacturer, has a mere 0.4
per cent of this market. VW, the European leader, has 1.2 per cent. Imports are a mere 4.5
per cent of the Japanese market and include imports by Japanese companies
manufacturing abroad.

6
Excluding Japan, Toyota is the market leader in two of the six largest countries in
Asia-Pacific: Malaysia and Thailand. South Korea is dominated by Hyundai, which
controls 72.9 per cent of that market. Suzuki-Maruti is the leader in India, with 36.8 per
cent market share. Indeed, only Australia and China have Western-based market leaders.
In Australia, GM controls 22 per cent of the market, followed closely by Japan, which
holds 20.6 per cent of the market. Including Japan, the top six Asian automakers control
69.5 per cent of the Asian market. This includes Renault-Nissan (8.1 per cent) and Ford-
Mazda (4.4 per cent), Japanese companies in which Western firms have a dominant
share, Henderson (2003).
Although the majority of the market in each of the three triad regions is controlled
by home-region oriented companies, foreign companies continue to play a major role in
each region. For example, Ford holds 10.9 per cent of the European market and is the
fourth largest competitor. A number of foreign companies attained a competitive position
by acquiring the operations of a local producer, such as GM’s Opel subsidiary and others,
through organic growth in foreign markets, such as Toyota and Honda in North America.
These findings counter a number of popular myths about the ‘archetypal global
industry’, many dating from the 1980s and early 1990s which saw the global expansion
of Japanese firms in the industry. Common views included: that a global car and a global
car firm would soon evolve; that all production would shift to cheap labour regions
leaving ‘hollow corporations’ in the United States and Europe, Jonas (1986), and; that
sales by incumbents in the largest markets would be overtaken by more competitive
foreign rivals. Both solid research, such as Womack, Jones and Roos (1991) and more
sensationalist books, Maynard (2003) supported these views each of which had
significant strategic implications for management in the automotive business. We find

7
that such global car industry predictions have not come to pass for the key reason that the
industry operates regionally, not globally.
Barriers to Global Expansion in the Automotive Industry
The auto industry operates largely in “clusters” of localized activity within each major
triad region, as discussed in Rugman and D’Cruz (2000). There are networks of key
supplies, other suppliers, key distributors, other partners, and the OEMs assemble cars
from imports of literally thousands of suppliers, all location bound. This is why of the 55
million vehicles produced each year over 90 per cent are sold where they are made,
McKinsey Quarterly (2003).
Auto firms are also strongly embedded in a range of other downstream activities
and after-sales markets including financing (such as Ford Credit), insurance, maintenance
and repairs (like Ford’s Kwik-Fit operations), parts and accessories and emergency
rescue services (such Ford’s Rescu). These represent a substantial proportion of total
revenues for the larger firms and are highly regionally-specific, Ealey and Troyano-
Bermudez (2003).
Another persistent barrier to a global strategy or a global car is cultural barriers
across regions. European consumers prefer performance cars with good engines while in
the United States large comfortable cars are the norm. Even within NAFTA, while the
United States and Canada prefer automatic transmissions, most cars in Mexico have
manual transmissions. In terms of customer tastes, it is impossible to market the same car
across regions, and usually all of the economies of scale for a model are achieved within
each major region, Hong, Roos and Wensley (2004), Grein (2001).
Another factor is fuel. Diesel continues to be popular in Europe but is being
phased out in the United States because of its environmental implications. Rather than

8
phase out the less expensive fuel, European automakers are seeking ways of making it a
cleaner alternative.
Each regional market in which automakers operate has its own set of
environmental regulations. In the United States, automakers must design its vehicles to
conform to the Environmental Protection Agency’s (EPA) regulations and the
environmental regulations of individual states. Other regulations that relate to automotive
design include: noise control and fuel economy. The companies’ industrial processes are
also heavily regulated with laws relating to water discharges, air emissions, waste
management and environmental cleanup. European and Asia-Pacific markets have
different environmental laws to which automaker’s operations must comply. For instance,
the European Union is making all carmakers financially responsible for dismantling and
recycling its own vehicles.
Finally, tariffs, ranging from 2.5 per cent in the United States, 10 per cent in some
European countries and 100 per cent in some developing countries, represent another
significant barrier to globalization.
Each region has a particular regulatory and competitive environment in which the
major world players compete for market share. Local competitors are more adept at
meeting the demands of their regional markets because they possess know-how on
consumer preferences, government regulations, and market trends. While foreign
companies might hire local personnel, purchase local car manufacturers, and do extensive
market research, companies headquartered in that region are more capable of responding
to changing circumstances of their primary market.
Cases

9
We now discuss seven cases with their top 500 ranking in parenthesis:- General Motors
(3), Volkswagen (21), Toyota (10), DaimlerChrysler (7), Honda (4), Ford (5) and Renault
(125)
General Motors
The world’s largest manufacturer of automobiles is General Motors (GM). In 2002, the
company’s revenues totaled $187 billion; GM accounted for nearly 15 per cent of the
world’s market for trucks and automobiles. General Motors produces and manufactures
vehicles in all three triad markets. Nonetheless, 74.3 per cent of its sales originate in the
United States, its home national market. Including Canada, Mexico, Puerto Rico and
Caribbean markets in North America, this number rises to 82.3 per cent of total sales. On
the production side, its network of North American factories—which exist partly as a
result of NAFTA—accounts for 65.8 per cent of production capacity. An international
company yes, but by no means a global company, see Table 4.
Table 4 here
General Motors is primarily an automotive company, but it also operates
communications services businesses and has a financing and insurance arm. Its
automotive business is segmented geographically: GM North America, GM Europe, GM
Latin America/Africa/Mid-East, and GM Asia Pacific. Each of these regions has a set of
brands it promotes. In North America, for example, these are Chevrolet, Pontiac, Saturn,
etc. In Europe, GM’s brands include Opel, Vauxhall and Holden, among others. The GM
Daewoo and Suzuki brands are marketed throughout Asia-Pacific.
The company is most successful in the North American market, where it holds 28
per cent of the market compared to 8.7 per cent of the European market and 3.4 per cent
10
of the Asia-Pacific market. In North America, GM has a competitive advantage in that it
is already well situated in the market and has a loyal consumer base. In other regions,
however, it faces competition from local automakers that know their home regions very
well. In Europe, Volkswagen, BMW, and DaimlerChrysler build high performance cars.
In Asia, competitors build smaller, more fuel efficient cars that cater to local preferences.
General Motors’ primary market is North America, in particular the United States.
It derives most of its revenue and most of its profits from its home-region operations.
GM’s strategy must balance the benefit of investing in foreign regions to the benefits of
investing in its home-region market. Foreign markets, though potentially profitable, do
not offer the consolidated GM company sufficient incentive to switch the focus of its
strategy. GM has plans to expand in China, but this is a country where rival MNEs are
already active and where local Chinese producers are adapt at appropriating the
intellectual property of western firms. In other words, China offers potentially high
returns, but has great risks.
Volkswagen
In March 1998, Germany’s Volkswagen revamped its strategy in the U.S. market
by introducing the New Beetle. The car’s appeal stems from the 60s and 70s nostalgia for
the original VW Beetle. In 2002, Volkswagen delivered over 420,000 vehicles to the
United States market and accounted for approximately 10.1 per cent of the passenger car
import market.
Although the Volkswagen comeback into the U.S. market has been a success, the
North American market is still a minor part of the company’s operations. In 2002, only
19.9 per cent of total revenues originated in North America. It is the European market
that Volkswagen depends on for the vast majority of its revenue. Like GM, which

11
concentrates in the U.S. market, VW’s primary market is Europe. Its cars reflect the
European taste for performance, safety and durability. Germany accounted for 27.5 per
cent of total sales. Including other European countries, the intra-regional sales of VW rise
to 69.3 per cent. In addition, Europe accounts for over three-fourths of all assets. This is a
highly regional company, and while success in other regions is significant, the company’s
main strategic market continues to be its home region, see Table 5.
Table 5 here
Over the last few years, Volkswagen has increasingly relied on foreign markets
for its revenue and production. Between 1993 and 2002, production outside of Germany
rose from 53.3 per cent of all units to 64.5 per cent, and its foreign workforce rose from
40.7 per cent to 48.1 per cent of the total. However, many of these factories and workers
are located in Eastern Europe. Similarly, unit sales in foreign markets increased from
69.1 per cent to 81.8 per cent, but a large portion of these units are actually sold in the
European regional market. Units delivered to Europe accounted for 63.2 per cent of total
deliveries in 2002.
Volkswagen also has a larger share of the passenger car market in its home region.
The company holds 30 per cent of its domestic market and 17.9 per cent of the European
market (including Germany). This is well above its market share in the other two triad
regions. Although the company has had some success in developing countries, with 25.1
per cent of the Mexican market and 20.2 per cent of the South American market, its
revenues from these regions account for a very small fraction of total revenues because of
the small size of these economies and their automobile markets.
Toyota

12
In 2002, two regional markets accounted for well over 80 per cent of Toyota’s revenues:
Asia (with Japan at 45 per cent of revenues) and North America, at 38.8 per cent of
revenues. Europe was only at 8.8 per cent of revenues. In terms of units sold, the
geographic distribution is similar: Asia and Oceania account for 46.2 per cent of unit
sales (Japan at 38 per cent); North America for 30.8 per cent; and Europe for 15 per cent.
Thus, in terms of revenue and units sold, Toyota is a bi-regional company. Market share
shows a slightly different picture. Toyota holds approximately 40 per cent of the Japanese
market but only 10 per cent of the North American market. Moreover, production is not
as dispersed around the world; 75.9 per cent of all Toyota cars are still produced in Japan.
Only 14.9 per cent are produced in North America. Other regions account for less than 10
per cent of production.
Table 6 here
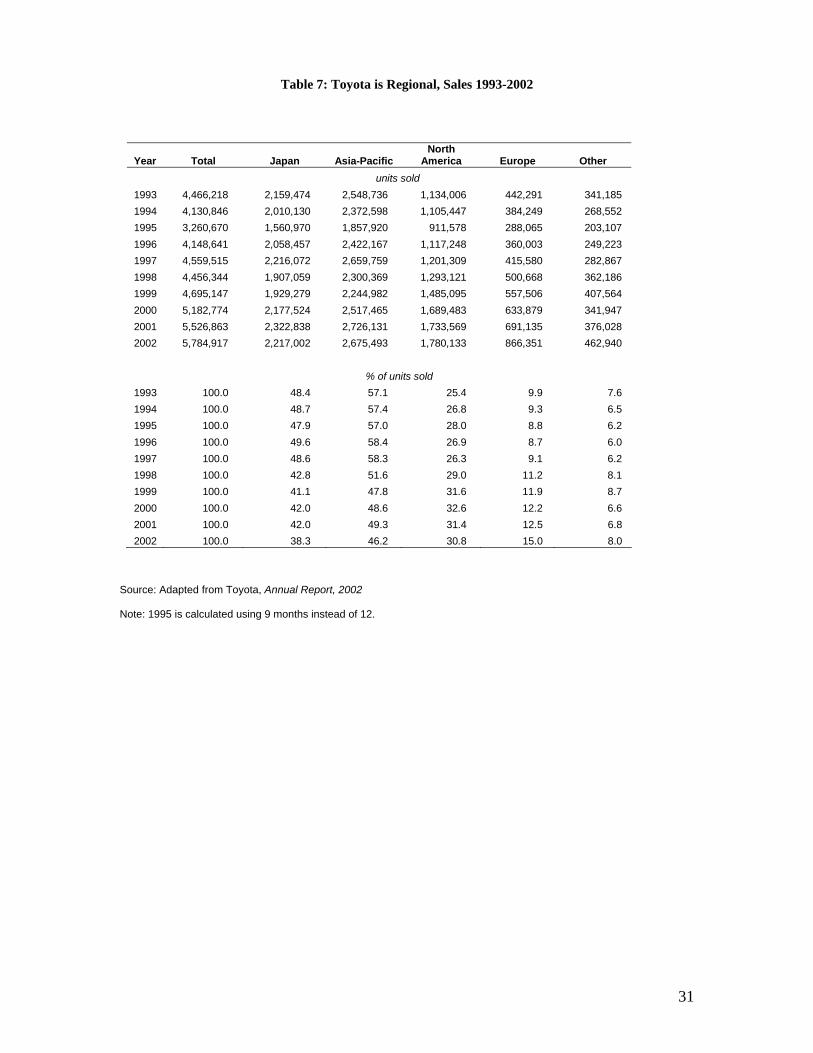
Over the last 10 years, Toyota’s intra-regional percentage of sales has decreased
from 57.1 per cent to 46.2 per cent. One major reason for this is the Japanese market
itself, where sales decreased from 48.4 per cent of total revenues in 1993 to 38.3 per cent
in 2002. In contrast, North America, European, and non-triad sales have steadily
increased in importance. In 1993, Toyota derived 25.4 per cent of its sales from North
America. This rose to 30.8 per cent in 2002; EU restrictions on imports of Japanese cars
were one reason why Toyota historically has been unable to be successful in the
European market. European sales accounted for a mere 9.9 per cent of total sales in 1993,
but by 2002 Toyota almost doubled the number of units sold so that, in this year, the
region accounted for 15 per cent of total sales. This is partly a result of more local
production but also of Toyota learning to cater to the European market.
Table 7
13
The Asian economies have been in a slump since the 1990s, and Europe has been
growing slowly. This is why the North American market is very important for all
Japanese manufacturers. Japanese carmakers began to manufacture in the United States,
the largest North American national market, in the 1980s to protect themselves from
import restrictions. North America is Toyota’s second largest regional market in terms of
revenues. It is also highly profitable. In 2002, one-fourth of Toyota’s profits originated in
this region.
Toyota manufactures locally over two-thirds of the cars it sells in the United
States. The company’s Canadian plant also serves this regional market, and a Mexican
plant in Tijuana is expected to increase local production when it opens in 2005. Local
responsiveness is important. Toyota introduced its luxury models to accommodate the
aging and wealthier North American baby boomers in the 1990s. Today, the company is
introducing cars to target the young American customer, the demographic echo of the
baby boomers. Sixty per cent of U.S. car buyers remain loyal to the brand of their first
car. It is thus imperative to service this young market.
American consumers, for their part, have been responsive to the company’s
reputation for quality and in particular for the lower price at which Toyota’s cars are sold.
In fact, during economic downturns in which consumers seek more value for their money
Toyota does better in the United States. The company’s cars are not only less expensive,
but they also consume less gasoline than American cars. The resale value is also higher
for Toyota cars. One major advantage for Toyota is that it has some of the best
manufacturing facilities in the world, and it combines this with excellent relationships
with its suppliers. The company is so efficient that, despite the lower price of its cars, it
makes an average profit of $1,000 on each car sold compared to $330 for GM.

14
Toyota’s European operations are money losers, but the company continues to try
to access this market and increase its market share from its 3.8 per cent level in 2002. To
boost its image for performance in the region, the company recently began to compete in
Formula One races. To protect itself from currency risk, Toyota will now produce a
higher percentage of its cars within the region. That also means more local procurement.
To this end, Porsche was asked to produce engines for its European models. Porsche
already produces transmissions for the company. The company expects to increase its
market share to 5 per cent by 2005.
Toyota is one of the most efficient companies at outsourcing production to
suppliers with whom it enjoys amicable long-term, sometimes kieretsu-style
relationships. If the auto industry is to become more like the electronics industry (as
many believe may occur), vehicle brand owners (VBOs), such as Toyota, GM, VW, will
be the equivalent of original equipment manufacturers (OEMs) in the electronics
industry, such as Nokia, IBM, and Microsoft, and will concentrate on designing,
engineering and marketing vehicles to be sold under their brand while others take care of
manufacturing. Toyota is probably furthest along this outsourcing route than other triad
automakers.
DaimlerChrysler
When German Daimler-Benz merged with U.S. Chrysler, the aim of the German
company was to secure a share in the large U.S. economy-class car market. Synergies
(for instance in the area of purchasing), it argued, would reduce costs across all
operations. At first glance, one can argue that the merger achieved its goal. In 2002, 58.7
per cent of the company’s revenues originated in North America, a trend that has
remained relatively stable since 2000, see Table 8. These data define the firm as host-

15
region oriented. The numbers can be deceiving though; soon after the merger the
Chrysler group was plagued by management defections and decreasing profits.
Table 8 here
Two things help explain the troubles of this merger. The first is that these
companies were producing very different products. Mercedes Benz, Daimler-Benz’
brand, had a competitive edge in the luxury market. Chrysler produced popular cars for
the U.S. market. Although the expensive parts of Daimler’s vehicles could be used for
more affordable Chrysler cars and the cheaper Chrysler parts be used on Daimler
vehicles; both these moves were likely to reduce the competitive advantage on each of
the markets in which the original companies operated. Chrysler cars could have become
less affordable while Daimler’s brand might have lost its reputation for quality. In effect,
while some parts can be shared and suppliers can manufacture different products for both
vehicle brands at lower prices, the benefits from the merger were limited by the different
product lines of each company.
The second, and perhaps most important barrier to overcome, was the cross-
cultural differences between the German and U.S. companies. From the beginning,
Daimler’s management dominated the merged company, which resulted in an outflow of
key U.S. personnel from management positions and the designer ranks. The Germans
tended to be bureaucratic while U.S. managers made decisions on the spot. Many U.S.
managers left unable to deal with the imposed management style. Capable designers went
to rivals General Motors and Ford. Over time, the company has improved its cultural
management of the U.S. operations, and this is improving the company’s overall position
in the motor vehicle market.

16
DaimlerChrysler is undoubtedly a host-region based company, but a closer look at
the organization shows, not a cohesive organization with a bi-regional market span, but
two internal groups with individual global standings.. The Mercedes Car Group, the non-
commercial vehicle successor to the German part of the merger, derives 63 per cent of its
revenues from the European market. The Chrysler Group, on the other hand, continues to
derive over 90 per cent of its revenues from the North American market.
In terms of production, the Mercedes Group has eight production locations in
Europe while the Chrysler Group has none. In the NAFTA region, the Chrysler Group
has 38 production locations while the Mercedes Group only has one. This reflects two
separate entities each trying to capitalize on their own knowledge of its home region, not
a truly bi-regional or host-region oriented company.
Honda Toyota may be the largest Japanese automaker in the world, but in the United States,
Honda competes successfully for market share. In 2002, the Honda Accord was the best-
selling passenger car in the United States. Not surprisingly, given the size of the US
market, the company generates over half its revenues (55.6 per cent) in North America.
Its home market of Japan accounts for only 23.3 per cent of sales. European sales account
for 11.2 per cent of sales while sales to non-triad regions account for the remaining 9.9
per cent. Most of the company’s assets are also in its host region of North America, 53
per cent. See Table 9.
Table 9 here
This unusual dependence on the North American market is partly the result of
Honda’s very early market-entry into the United States in the 1950s, as well as Toyota’s
evolving dominance of the Japanese market. The relative spread of revenues across the

17
triad is not only influenced by the ability of a company to penetrate a foreign market, but
also by how much of the domestic market it can attain. A small car manufacturer might
have better opportunities for growth, despite the liability of foreignness, in another region
of the triad than in its own home region. Indeed, Toyota’s share of the U.S. market is
higher than Honda’s, but the region is significantly more important to Honda’s overall
revenues than to Toyota’s.
Honda’s future success is expected to rely on the company’s three strategic
directions: to create value, “glocalization” a term the company coined to mean localized
global operations and a commitment to the future. To increase value, the company relies
on continued innovation. Honda’s modular production methods are giving it an edge
against the competition. Around the world the company is known for its smaller, less
expensive, more efficient and environmentally friendly cars.
Glocalization is the company’s commitment to a global supply chain that is
responsive to local customers. “Made by Global Honda” has already been chosen as the
expression that will represent this global supply network that will link facilities in
different regions. Honda divides its business into five regional operations: its domestic
market of Japan; North America, Latin America, Europe, the Middle East and Africa; and
Asia and Oceania. The Japanese market is expected to be served through imports from
China, Thailand, Malaysia and Indonesia. To maintain its local responsiveness, the
company has R&D facilities in each of the triad markets.
Ford and the Premier Auto Group (PAG)
Before it bought into Mazda and took over the four European auto manufacturers that
make up its Premier Brands Group (PAG) Ford had already developed a relatively strong
presence in Europe. In contrast to General Motor’s mode of internationalization through

18
M&A it had expanded organically through the development of local sales, distribution
and manufacturing activities around the world. In Europe it began with a plant in
Manchester, England in 1911 before moving to the Dagenham site near London in 1932.
Three-quarters of Ford’s overseas production is now located in Europe, with plants in
Germany, Spain, the UK and Belgium, Dicken (2003). Yet, including Brazil around 50
per cent of total production still takes place in the Americas, primarily in the U.S.,
Mexico and Canada.
This distribution reflects the regional sales mix of Ford’s core brand, listed in
Table 10, with 62 per cent sales in North America, 29 per cent in Europe and a weak 5
per cent showing in the Asia-Pacific region. Ford’s historically weak position in Asia
spurred it to establish an alliance with Mazda. This began with a series of joint ventures
leading to Ford’s initial 25 per cent stake in Mazda in 1979 increased to 33.4 per cent in
1996. The alliance has probably succeeded in boosting Mazda’s sales in the U.S market,
more than Ford’s showing in Japan and Asia.
Table 10 here
The series of alliances and takeovers that led to the creation of the PAG were
driven partly by the considerable drop in Ford’s market share in Europe from 1994 to
1999, from almost 12 per cent to just over 9 per cent. A broad range of restructurings at
the end of the 1990s and earlier this decade were initiated by then CEO Jacques Nasser
who stepped in to refocus on the central Ford brand operations and marketing. In 1999,
Ford bought Volvo for $6.45 billion, the largest of the PAG companies, adding to Jaguar
(bought in 1989), Aston Martin and Land Rover.

19
On the face of it the overall Ford Group, combining the core brands group and the
European-centered PAG, appears to be one of the more global of the largest auto firms. It
is, however, still heavily regional and primarily U.S.-oriented. The relative lack of
integration between the group companies, particularly when compared to the more recent
Renault-Nissan alliance described below, further underlines its regional structure.
Although Volvo, the largest of the four PAG firms, is listed as a ‘Center of Excellence for
Safety’ within the Ford Group and a ‘Center of Excellence for Telematics’ within the
PAG, this simply means its research and product development in these areas are
monitored by other group companies. Volvo is headquartered in Gothenburg. Its major
plants are in Sweden, Belgium and the Netherlands (operated by Nedcar), where it made
398,631 vehicles in 2002 (plus assembly units in South Africa, Thailand and Malaysia). It
has a Swedish President and CEO and a very Swedish/North European organizational
structure and culture.
The need to clearly differentiate and segment the individual brands is one major
factor underlying the structural separation and cultural distinctiveness of the group
companies in Ford. As discussed above, customizing auto designs and marketing
campaigns to regional and even national markets is still a central part of the business.
Renault and Nissan
The Renault-Nissan alliance, currently heralded as one of the most successful in the
business, represents the combination of two very different organizations, structurally and
culturally. Renault is a strongly home-region oriented firm and is heavily dependent on
its home economy, France. Alone it is relatively small holding just 4.2 per cent of the
global market, but it vies with Volkswagen for European market leadership and held 10.7
of this market in 2002. Nissan is one of the unusual bi-regional auto firms, with strong

20
sales in the United States and a relatively good market position in countries outside the
triad regions.
Together Renault and Nissan account for 9.1 per cent of global auto sales, placing
them jointly amongst the top 5 companies. Table 11 shows the individual and combined
sales of both firms. These are similar-sized firms with very different geographic
footprints that complement each other well.
Table 11 here
A similar pattern of differentiation is true for production. Nissan manufactures
just over half of its vehicles in Japan with most of the rest spread fairly evenly between
the United States, Mexico and the UK. It has industrial operations in 19 countries,
including manufacturing sites in Taiwan, South Africa, Thailand, Philippines and
Indonesia. Renault manufactures in 17 countries but makes over 55 per cent of its
vehicles in France and most of the rest in Europe.
The alliance began in March 1999 with Renault taking a 36.8 per cent stake in
Nissan; this is now increased to 44.4 per cent with Nissan having a reciprocal 15 per cent
stake in Renault. The alliance has deepened following the far-reaching changes put in
place by Carlos Ghosn, installed as President and CEO of Nissan and now revered for
having engineered a radical turnaround in the firm’s fortunes. It is now much broader and
deeper than the auto sector alliances described above. Driven by an alliance board,
chaired by the CEO of Renault, the two firms have developed: shared production
facilities in Mexico, Brazil and Spain; common engineering platforms for entry-level B
segment and mid-level C segment vehicles; common power train parts and increased

21
sharing of engines and transmissions, and; increasingly integrated IT, information and
communications systems.
Renault’s competencies in marketing, design and financing complement Nissan’s
capabilities in engineering and manufacturing processes. Synergies are enhanced through
the exchange of personnel. About 50 employees from Renault have joined departments
such as supplier relations, product strategy, sales and marketing, and finance in Nissan.
Similarly, around 50 Nissan employees work in the areas of quality control, vehicle
engineering, manufacturing and power train in Renault. Beyond this, 250 executives from
both firms are assigned to the permanent alliance structures, including cross-company
teams and functional task teams and a further 250 Nissan employees are part of the
restructured European sales and marketing divisions of Renault.
Nissan is one of the 8 passenger-car companies that have manufacturing
operations in the centre-north maquiladoras region of Mexico, alongside GM, Ford,
Chrysler and VW. Because Nissan had established these plants prior to the finalization of
NAFTA they are considered to be within the agreement, with the right to privileged
access to the export markets of the United States and Canada. Renault is therefore now in
a position to use its Nissan alliance to make Mexico an export platform into these large
markets.
Conclusions
The world's automobile sector has no companies producing globally. Instead, most
production occurs in sub-regional clusters within the broad triad economies of the EU,
North America, and Asia. GM is a very home-region oriented firm, as is VW.
DaimlerChrysler is a host-oriented regional firm. Only Toyota and Honda are "bi-

22
regionals", able to create significant sales presence in the host region United States, as
well as in their home-region market of Japan and Asia. There is no evidence of a global
car; just regional production as well as intra-regional sales. It's a regional world, not a
global one.

23
Acknowledgements
We are pleased to thank Ms. Cecilia Brain of Toronto for excellent research assistance in
the preparation of the data and case notes for this article.

24
Reference Dicken, P. (2003) Global Shift. Guilford Press, New York. Ealey, L.A. and Troyano-Bermudez, L. (2003) The Automotive Industry: A 30,000-mile Checkup, The McKinsey Quarterly, 4, 27-30. Grein, A.F. (2001) Integration and Responsiveness: Marketing Strategies of Japanese and European Automobile Manufacturers, Journal of International Marketing, 9(2), 19-32. Henderson, F. (2003) Capitalizing on Global Growth, presentation at 2003 Tokyo Analyst Conference, October 20. Hong, L., Roos, L-U. and Wensley, R. (2004) The Dynamics of Business Orientation: The Case of the Volvo Car Corporation, Industrial Marketing Management, 33(4), 333-345. Jonas, N. (1986) The Hollow Corporation, Business Week, (March 3), 56-62. Maynard, M. (2003) The End of Detroit: How the Big Three Lost Their Grip on the American Car Market, Currency, New York. McKinsey Quarterly (2003) How Far Can It Go? The McKinsey Quarterly, Special Edition 4, 27-30. Morris, R.W. (2001) Motor Vehicles 2000. Random House, London. Rugman, A. (2000) The End of Globalization. Random House, London. Rugman, A. (2005) The Regional Multinationals, Cambridge University Press, Cambridge, forthcoming. Rugman, A. and Brain, C. (2003) Multinational Enterprises Are Regional, Not Global. Multinational Business Review, 11(1), 3-12. Rugman, A. and D'Cruz, J (2000) Multinationals as Flagship Firms: Regional Business Networks. Oxford University Press, Oxford. Rugman, A. and Girod, S. (2003) Retail Multinationals and Globalization: The Evidence is Regional, European Management Journal, 21(1), 24-37. Rugman, A. and Hodgetts, R. (2001) The End of Global Strategy, European Management Journal, 19(4), 333-343. Rugman, A. and Verbeke, A. (2004) A Perspective in Regional and Global Strategies of Multinational Enterprises, Journal of International Business Studies, 35 (1), 1-15.

25
The Regional Nature of Global Multinational Activity (RNGMA) database(2003) available at www.kelley.iu.edu/ciber/publications.cfm. UNCTAD (2003) The World Investment Report, United Nations Conference on Trade and Development, New York and Geneva (http://unctad.org). Womack, J.P., Jones, D.T. and Roos, D. (1991) The Machine That Changed the World: The Story of Lean Production. Rawson Macmillan, New York.

26
Table 1: The Top 500 MNEs,
Industry Category No of Firms in the Fortune 500 No. of Firms in the RNGMA % of total
Manufacturing 206 180 87.4
1 Aerospace and Defense 11 11 100.0 2 Chemicals and Pharmaceuticals 19 18 94.7 3 Computer, Office & Electronics 39 36 92.3 4 Construction, Building Materials and Glass 12 11 91.7 5 Energy, Petroleum & Refining 43 31 72.1 6 Food, Drug & Tobacco 18 14 77.8 7 Motor Vehicle and Parts 31 29 93.5 8 Other Manufacturing 13 13 100.0 9 Natural Resource Manufacturing 20 17 85.0
Services 294 200 68.0
1 Banks 62 40 64.5 2 Entertainment, Printing & Publishing 9 9 100.0 3 Merchandisers 77 63 81.8 4 Other Financial Services 58 27 46.6 5 Other Services 25 21 84.0 6 Telecommunications & Utilities 43 27 62.8 7 Transportation Services 20 13 65.0
Total 500 380 76.0
Data are for 2001 and are re-calculated from the annual reports of the world's top 500 firms. Source: The Regional Nature of Global Multinational Activity, 2003. Indiana University CIBER, http://www.kelley.indiana.edu/CIBER

27
Table 2: The Transnationality of The Major Global Auto Firms
Firm Rank* TNI**Volvo 65 74.6Honda 19 62.8Toyota 12 59.3Volkswagen 15 57.4BMW 27 54.4Fiat 13 51.5Nissan 37 45.6Renault 70 43.5Ford 7 38.4General Motors 8 29.8Mitsubishi 64 28.5DaimlerChrysler 35 22.1
* Rank in the WIR list of the 100 largest non-financial transnational corporations in terms of size of foreign assets
** The WIR's Transnationality Index (TNI) is calculated as the average of the following three ratios: foreign assets to total assets, foreign sales to total sales and foreign employment to total employment.
Source: UNCTAD's World Investment Report (WIR) 2003 (giving data for 2001).
28
Table 3: The Regional Nature of the Motor Vehicles & Parts Industries
North America Europe Asia-Pacific
500 Revenues F/T per cent intra per cent of total per cent of total per cent of tota Rank Company Region in bn US$ Sales regional sales sales sales
Bi-regional
1 10 Toyota Motor Asia-Pacific 120.8 50.8 49.2 36.6 7.7 49.2 58 Nissan Motor Asia-Pacific 49.6 50.3 49.7 34.6 11.0 49.3 285 Bridgestone Asia-Pacific 17.6 61.2 38.8 43.0 l 10.1 38.4 342 Michelin Europe 14.6 na 47.0 40.0 47.0 n
Host-region oriented
1 7 DaimlerChrysler Europe 136.9 na 29.9 60.1 29.9 n2 41 Honda Motor Asia-Pacific 58.9 73.1 26.9 53.9 8.1 26.
Home-region oriented
1 3 General Motors North America 177.3 25.5 81.1 81.1 14.6 n2 5 Ford Motor North America 162.4 33.3 66.7 66.7 z 21.9 n3 21 Volkswagen Europe 79.3 72.3 68.2 20.1 68.2 5.4 49 Fiat Europe 51.9 65.6 73.3 13.0 73.3 n5 112 BMW Europe 34.4 73.4 57.3 31.7 l 57.3 n6 125 Renault Europe 32.6 60.8 89.1 na 89.1 n7 133 Hyundai Motor Asia-Pacific 30.9 20.9 81.6 18.1 0.3 81.8 166 Delphi North America 26.1 na 77.7 77.7 18.4 n9 171 Mitsubishi Motors Asia-Pacific 25.6 40.9 62.8 22.1 12.1 62.
10 252 Denso Asia-Pacific 19.2 32.4 73.1 20.0 l 6.8 73.11 264 Johnson Controls North America 18.4 na 62.9 62.9 25.6 n12 267 Volvo Europe 18.3 na 51.6 30.2 51.6 6.13 278 Visteon North America 17.8 29.0 71.0 71.0 z 15.6 n14 296 Mazda Motor Asia-Pacific 16.8 34.3 65.7 24.4 7.0 65.15 306 TRW North America 16.4 40.7 59.3 59.3 z na n16 343 Man Group Europe 14.6 72.6 68.7 15.6 68.7 12.17 352 Goodyear Tire & Rubber (q) North America 14.1 45.9 54.1 54.1 z na n18 369 Lear North America 13.6 51.4 58.2 58.2 31.6 n19 381 Suzuki Motor Asia-Pacific 13.3 31.6 68.4 13.3 14.9 68.20 404 Isuzu Motors Asia 12.8 30.8 69.2 39.6 na 69.21 456 Magna International North America 11.0 67.2 67.7 67.7 31.4 n22 462 Fuji Heavy Industries Asia 10.9 34.0 66.0 33.7 na 66.23 484 Dana North America 10.5 na 74.8 74.8 17.4 3. Weighted Average* 42.3 60.6 Total 1,226.5 Notes: Data are for 2001; q. Goodyear Tire & Rubber: Based on the location of the selling subsidiary (i.e. exports are not included). z. U.S. only; l. Americas; j. refers to Japan only. * Weighted intra-regional sales average is weighted according to revenues.

29
Table 4: Regional Sales of General Motors
Country Sales units Sales units Sales $ Assets Production Capacity(000) (%) (%) (%) Capacity (%)
(000)
United States 4,859 57.0 74.3 70.9 4,839 51.3 North America 5,623 66.0 82.3 80.5 6,213 65.8
Other Americas 635 7.4 2.5 1.5 794 8.4 Total Americas 6,258 73.4 84.8 82.0 7,007 74.2
Europe 1,662 19.5 14.2 14.7 2,123 22.5 Asia-Pacific 605 7.1 na na 311 3.3
Other na na 1.0 3.3 na na
Total 8,525 100.0 100.0 100.0 9,441 100.0
Source: Adapted from General Motors, Annual Report, 2002 Note: Data are for 2002
Table 5: Regional Sales of Volkswagen
Country Delivered Delivered Sales $ Assets Units Units* (%) (%)(000) (%)
Germany 940 18.9 27.5 50.0 Rest of Europe 2,210 44.3 41.8 28.7 Total Europe 3,150 63.2 69.3 78.6
North America 663 13.3 19.9 16.4 South America 421 8.5 3.8 2.9 Africa na na 1.1 0.3 Asia/Oceania 621 12.5 5.9 1.8
Other 128.9 2.6 1.1 0.3
Total 4,984 100.0 100.0 100.0
Source: Adapted from Volkswagen, Annual Report, 2002* Delivered Units include unsold inventory
Note: Data are for 2002

30
Table 6: Toyota’s Regional Sales, Assets, and Production
Country Sales units Sales units
(%) Sales $
(%) Assets
(%) Production (000) units
Production (%)
Japan 2,217 38.3 45.0 52.8 4,029 75.9 Asia-Pacific 2,675 46.2 NA NA NA NA North America 1,780 30.8 38.8 35.8 793 14.9 Europe 866 15.0 8.8 6.7 258 4.9 Other 463 8.0 7.4 4.7 225 4.2 Total 5,785 100.0 100.0 100.0 5,306 100.0
Note: Data are for 2002 Source: Toyota, Annual Report, 2002 Notes: Production per cent is calculated using units Unit Sales shows percentage of units sold in each region Sales $ shows percentage of revenues generated in each region Asia-Pacific includes Japan
31
Table 7: Toyota is Regional, Sales 1993-2002
Year Total Japan Asia-Pacific North
America Europe Other units sold 1993 4,466,218 2,159,474 2,548,736 1,134,006 442,291 341,185 1994 4,130,846 2,010,130 2,372,598 1,105,447 384,249 268,552 1995 3,260,670 1,560,970 1,857,920 911,578 288,065 203,107 1996 4,148,641 2,058,457 2,422,167 1,117,248 360,003 249,223 1997 4,559,515 2,216,072 2,659,759 1,201,309 415,580 282,867 1998 4,456,344 1,907,059 2,300,369 1,293,121 500,668 362,186 1999 4,695,147 1,929,279 2,244,982 1,485,095 557,506 407,564 2000 5,182,774 2,177,524 2,517,465 1,689,483 633,879 341,947 2001 5,526,863 2,322,838 2,726,131 1,733,569 691,135 376,028 2002 5,784,917 2,217,002 2,675,493 1,780,133 866,351 462,940 % of units sold 1993 100.0 48.4 57.1 25.4 9.9 7.6 1994 100.0 48.7 57.4 26.8 9.3 6.5 1995 100.0 47.9 57.0 28.0 8.8 6.2 1996 100.0 49.6 58.4 26.9 8.7 6.0 1997 100.0 48.6 58.3 26.3 9.1 6.2 1998 100.0 42.8 51.6 29.0 11.2 8.1 1999 100.0 41.1 47.8 31.6 11.9 8.7 2000 100.0 42.0 48.6 32.6 12.2 6.6 2001 100.0 42.0 49.3 31.4 12.5 6.8 2002 100.0 38.3 46.2 30.8 15.0 8.0
Source: Adapted from Toyota, Annual Report, 2002
Note: 1995 is calculated using 9 months instead of 12.

32
Table 8: Daimler Chrysler Revenues
Country/Region 2002 2001 2000(in percentages of total)European Union 31.1 29.9 31.0
of which Germany 15.5 15.9 16.0
North America 58.7 60.1 59.1 of which United States 51.9 53.1 52.0
Other markets 10.2 10.0 9.9
Total Revenues 100.0 100.0 100.0
Source: DaimlerChrysler, Key Figures, 2002
Table 9: Regional Sales and Assets of Honda
Country Sales $ ( per
cent) Assets ( per
cent) Japan 23.3 31.4 North America 55.6 53.0 Europe 11.2 7.4 Other 9.9 8.2 Total 100.0 100.0 Source: Adapted from Honda, Annual Report, 2003
Note: Data are for 2002

33
Table 10: Ford and its Brands (2002)
AUTOMOTIVE CORE BRANDS
PrimaryBrands
Dealers 13,000 1,561 2,141 6,131
Markets 137 38 15 145
Competitors DaimlerChrysler, DaimlerChrysler, DaimlerChrysler, Toyota, Nissan,Fiat, GM, GM, GM, Honda, Mitsubishi,Honda, Nissan, Honda, Nissan, Honda, Nissan, GM,Toyota, VW, Toyota, BMW Toyota, VW DaimlerChrysler,Hyundai/Kia VW
Vehicle retail sales 5,457,445 159,651 274,875 964,800
...% of total 74% 2% 4% 13%
Sales mix 62% N.America 98% N.America 98% N.America 39% Asia-Pacific29% Europe 2% Rest-of-World 2% Rest-of-World 36% N.America5% Asia-Pacific 20% Europe3% S.America 5% Rest-of-World1% Rest-of-World
PREMIER AUTOMOTIVE GROUP (PAG)PrimaryBrands
Dealers 100 787 2,500 1,808
Markets 25 66 100 142
Competitors Lamborghini, DaimlerChrysler BMW, Mercedes- Toyota, Nissan,Ferrari, Porsche (Mercedes), BMW, Benz, Audi, Lexus GM,
Toyota (Lexus), DaimlerChrysler,Porsche BMW
Vehicle retail sales 1,551 130,330 406,695 174,593
...% of total 0% 2% 5% 2%
Sales mix 30% N.America 50% N.America 60% Europe 61% Europe30% Europe 41% Europe 30% N.America 25% N.America30% UK 7% Asia-Pacific 10% Rest-of-World 14% Rest-of-World10% Rest-of-World 2% Rest-of-World
Source: Corporate Annual Reports

34
Table 11: The Global Distribution of Renault and Nissan Sales (2002)
Region
France 763,612 32% 35,800 1% 799,412 16%Germany 227,182 9% 64,269 2% 291,451 6%UK 215,343 9% 106,583 4% 321,926 6%Spain 202,186 8% 56,523 2% 258,709 5%Italy 182,352 8% 59,616 2% 241,968 5%
Western Europe 1,869,251 78% 432,017 16% 2,301,268 45%North America NA NA 804,186 29% 804,186 16%Japan 2,414 0% 773,726 28% 776,140 15%Other 532,310 22% 725,601 27% 1,257,911 24%
World Total 2,403,975 100% 2,735,530 100% 5,139,505 100%
Source: Corporate Annual Reports
Renault Nissan Combined Sales

35
Short Bios
Alan Rugman holds the L. Leslie Waters Chair of
International Business at the Kelley School of Business, Indiana University, where he is
also Director of the IU CIBER. He is an Associate Fellow at Templeton College,
University of Oxford. Dr. Rugman has published widely, appearing in leading refereed
journals that deal with economic, managerial, and strategic aspects of multinational
enterprises and with trade and investment policy. Currently he serves as President of the
Academy of International Business and is the 2004 recipient of the Eminent Scholar in
International Management Award of the Academy of Management. His recent books
include: International Business (FT/Prentice Hall 2003); The End of Globalization
(Random House 2000; and, forthcoming, The Regional Multinationals (Cambridge
University Press 2004).
Simon Collinson is Senior Lecturer in International Business at
Warwick Business School, University of Warwick, Visiting Senior
Research Fellow at AGSM, Sydney, and Visiting Professor at the
Kelley School of Business, Indiana University. His research and
executive consulting work is in the areas of Japanese and Chinese
business practices, global innovation strategies, R&D and knowledge management and
global high-technology entrepreneurship. He has published in a wide range of books and
leading journals.