1
Monthly Market Outlook December 2019

2
There Is Too Much Of Bad News
3
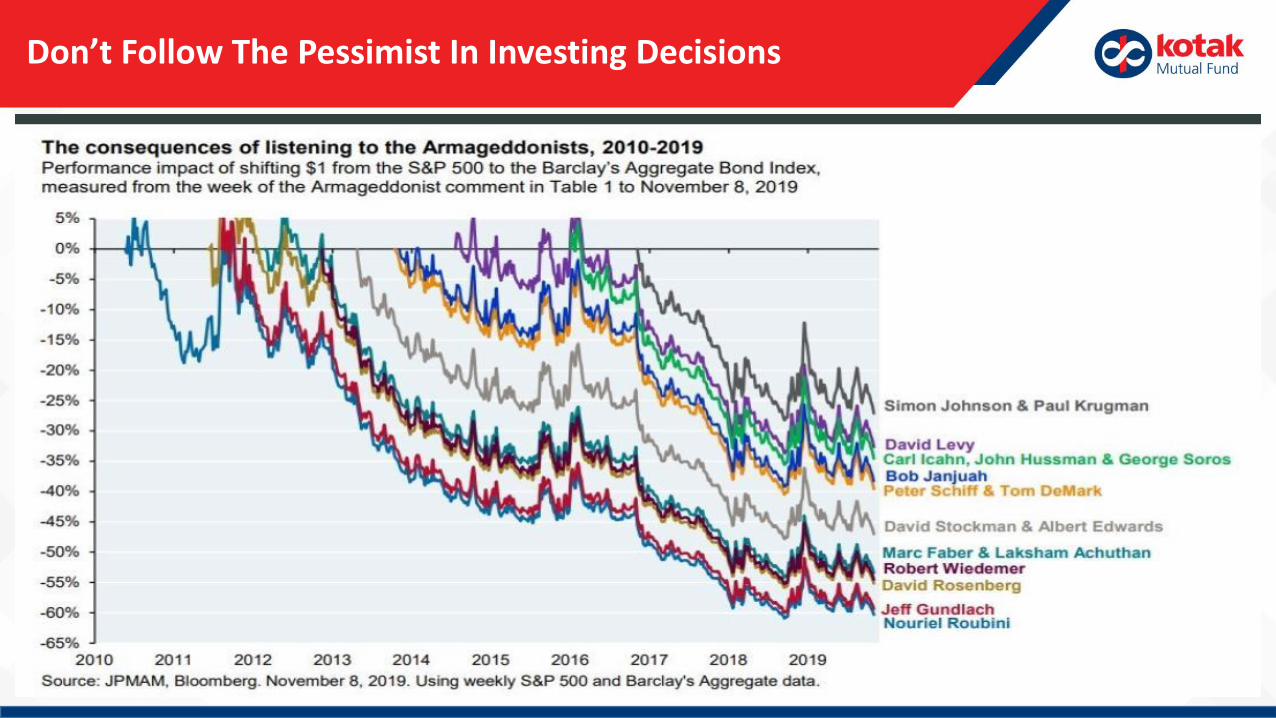
Don’t Follow The Pessimist In Investing Decisions

Equity Market OutlookDecember 2019
4
5
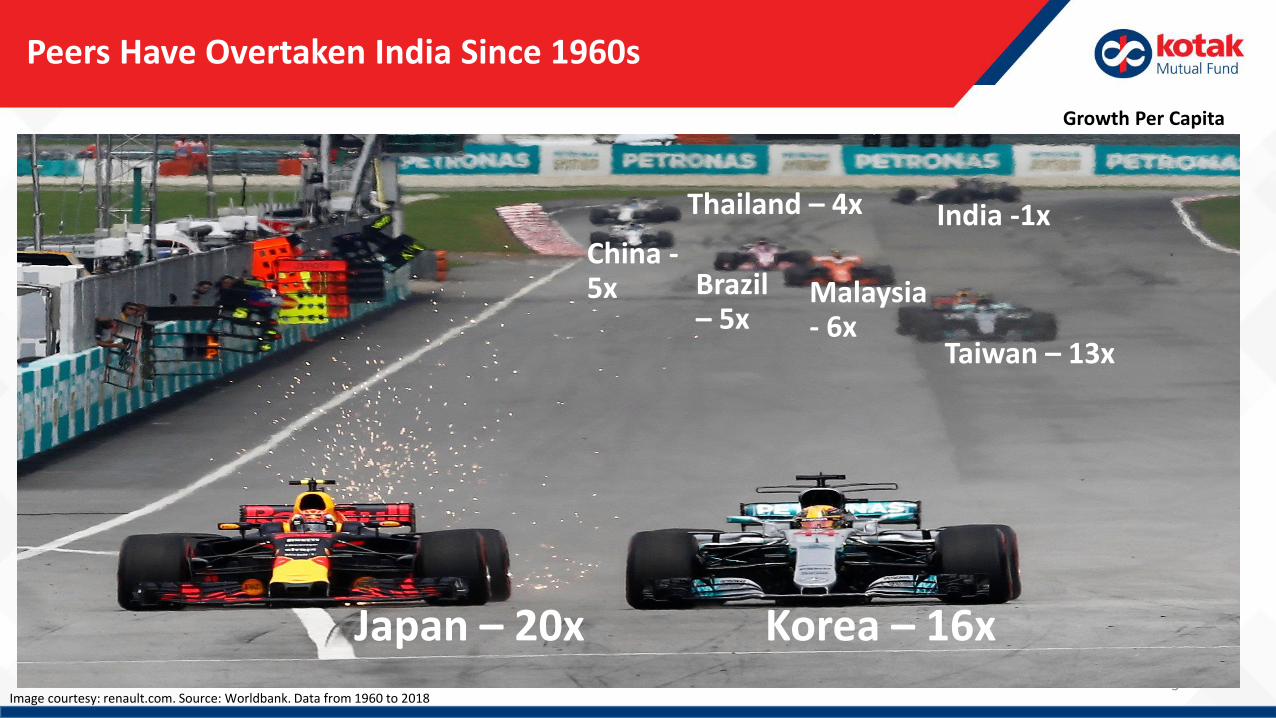
Peers Have Overtaken India Since 1960s
Image courtesy: renault.com. Source: Worldbank. Data from 1960 to 2018
Japan – 20x Korea – 16x
Taiwan – 13x
India -1x
Malaysia - 6x
China -5x
Thailand – 4x
Brazil – 5x
Growth Per Capita

6
India Needed To Take A Pit Stop
Image courtesy: sprintwell.com
GST
Demonetization
NPA Resolution
Inflation-Subsidy-CAD
India
7
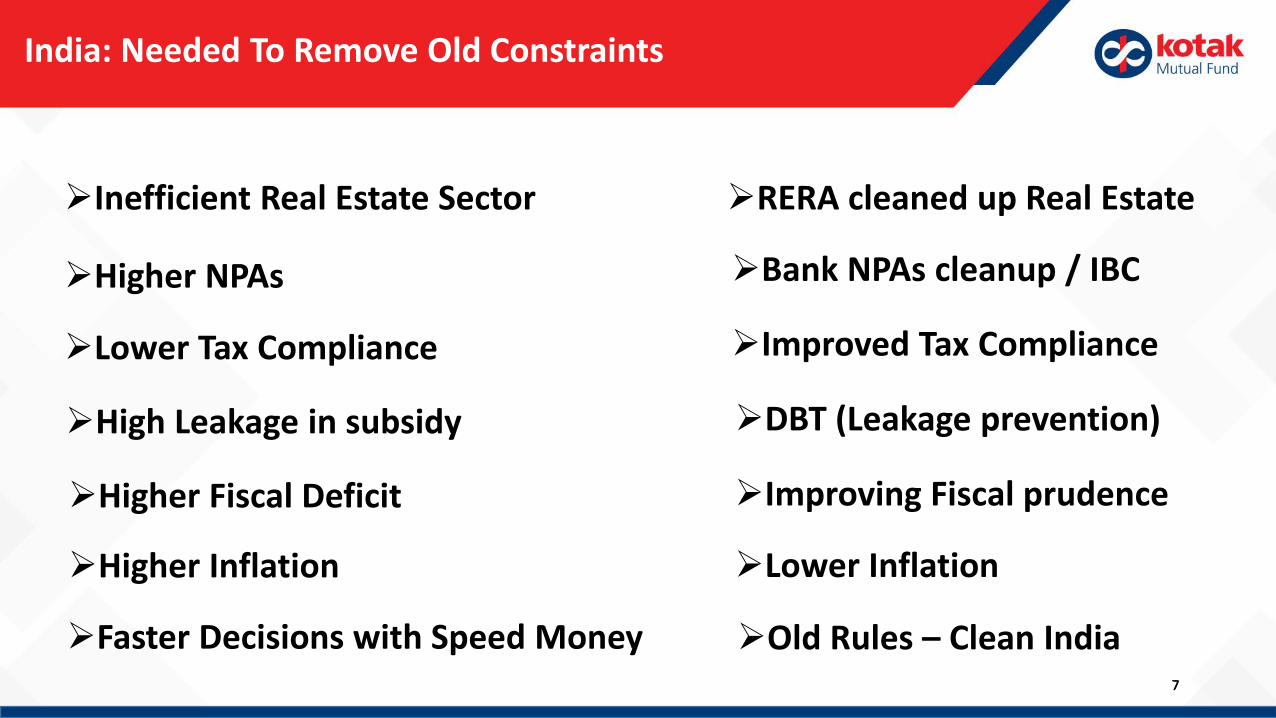
India: Needed To Remove Old Constraints
7
Improving Fiscal prudence
Lower Inflation
Bank NPAs cleanup / IBC
Improved Tax Compliance
RERA cleaned up Real Estate
DBT (Leakage prevention)
Higher Fiscal Deficit
Higher Inflation
Higher NPAs
Lower Tax Compliance
Inefficient Real Estate Sector
High Leakage in subsidy
Faster Decisions with Speed Money Old Rules – Clean India

8
Some Self Goals
9
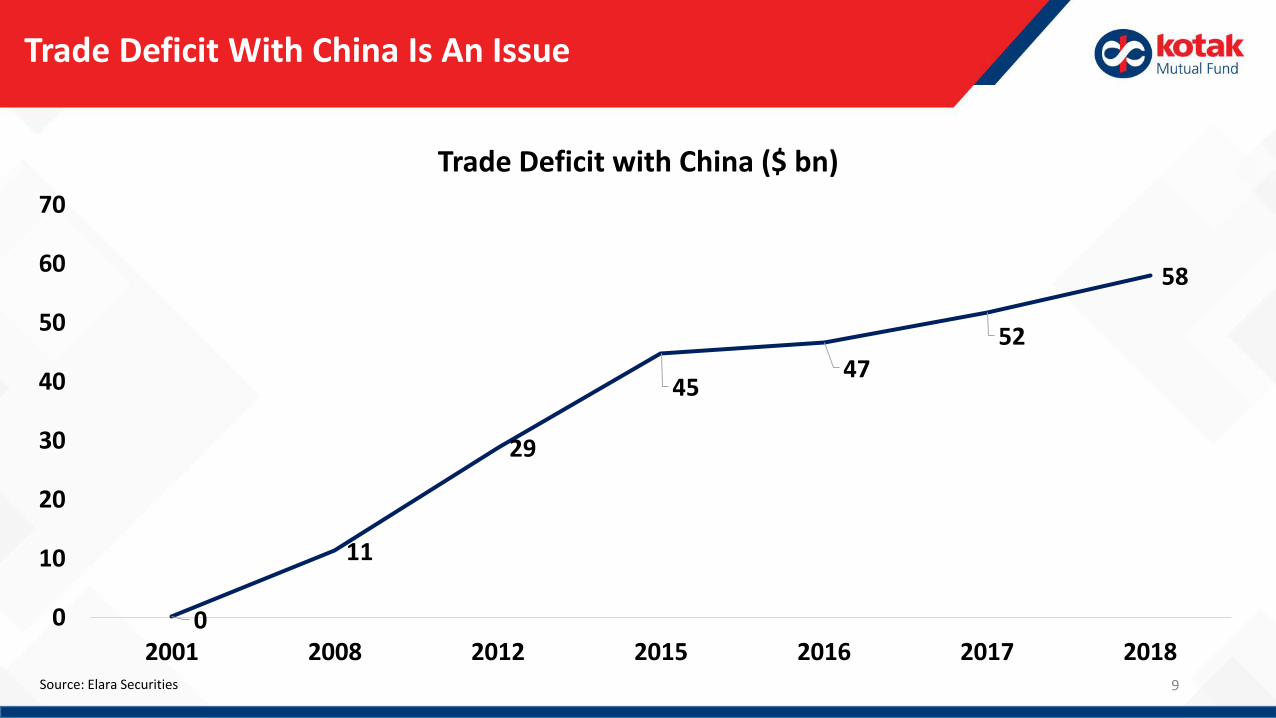
Trade Deficit With China Is An Issue
0
11
29
4547
52
58
0
10
20
30
40
50
60
70
2001 2008 2012 2015 2016 2017 2018
Trade Deficit with China ($ bn)
Source: Elara Securities
10
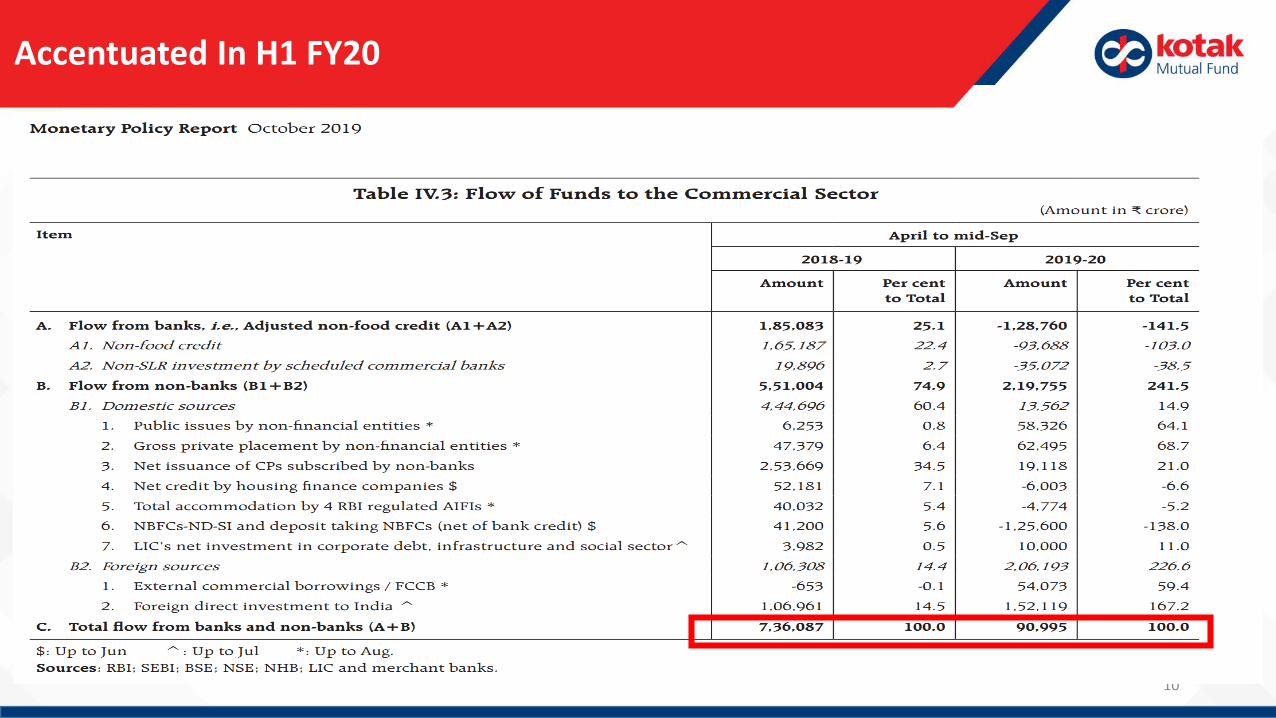
Accentuated In H1 FY20
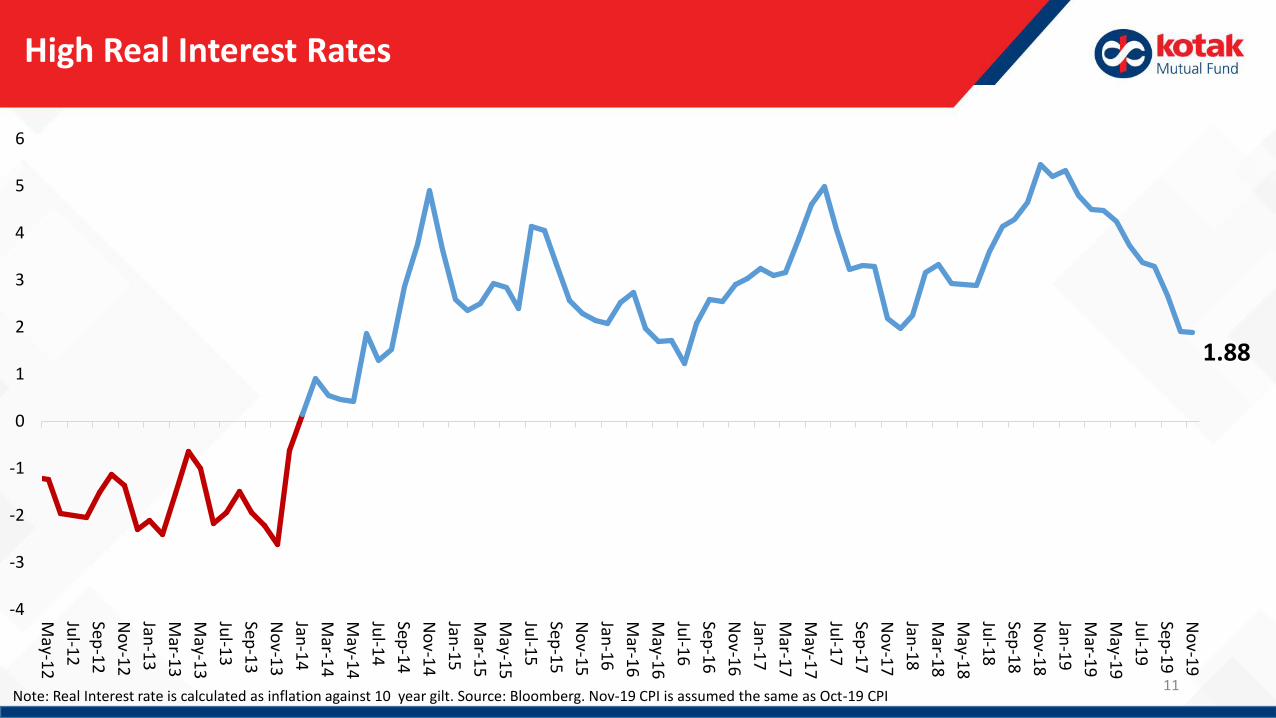
High Real Interest Rates
Note: Real Interest rate is calculated as inflation against 10 year gilt. Source: Bloomberg. Nov-19 CPI is assumed the same as Oct-19 CPI11
1.88
-4
-3
-2
-1
0
1
2
3
4
5
6
May-1
2
Jul-1
2
Sep-1
2
No
v-12
Jan-1
3
Mar-1
3
May-1
3
Jul-1
3
Sep-1
3
No
v-13
Jan-1
4
Mar-1
4
May-1
4
Jul-1
4
Sep-1
4
No
v-14
Jan-1
5
Mar-1
5
May-1
5
Jul-1
5
Sep-1
5
No
v-15
Jan-1
6
Mar-1
6
May-1
6
Jul-1
6
Sep-1
6
No
v-16
Jan-1
7
Mar-1
7
May-1
7
Jul-1
7
Sep-1
7
No
v-17
Jan-1
8
Mar-1
8
May-1
8
Jul-1
8
Sep-1
8
No
v-18
Jan-1
9
Mar-1
9
May-1
9
Jul-1
9
Sep-1
9
No
v-19
12
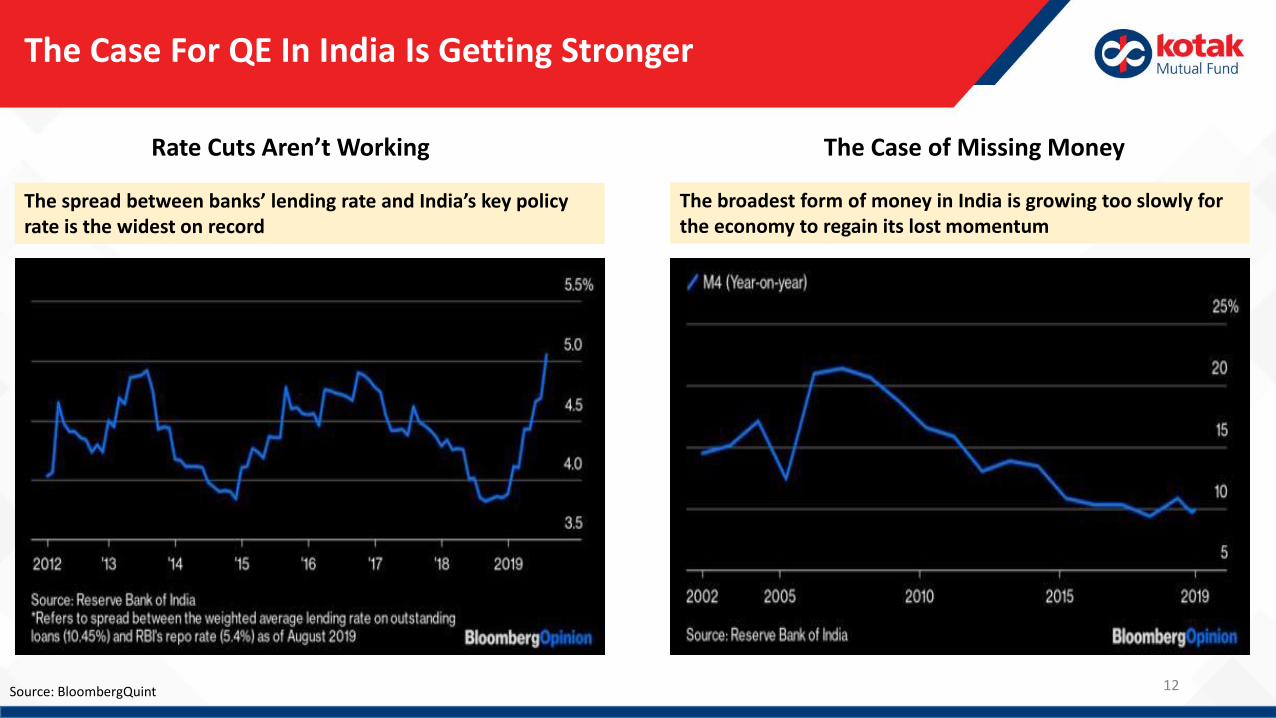
The Case For QE In India Is Getting Stronger
Source: BloombergQuint
The spread between banks’ lending rate and India’s key policy rate is the widest on record
Rate Cuts Aren’t Working
The broadest form of money in India is growing too slowly for the economy to regain its lost momentum
The Case of Missing Money
13
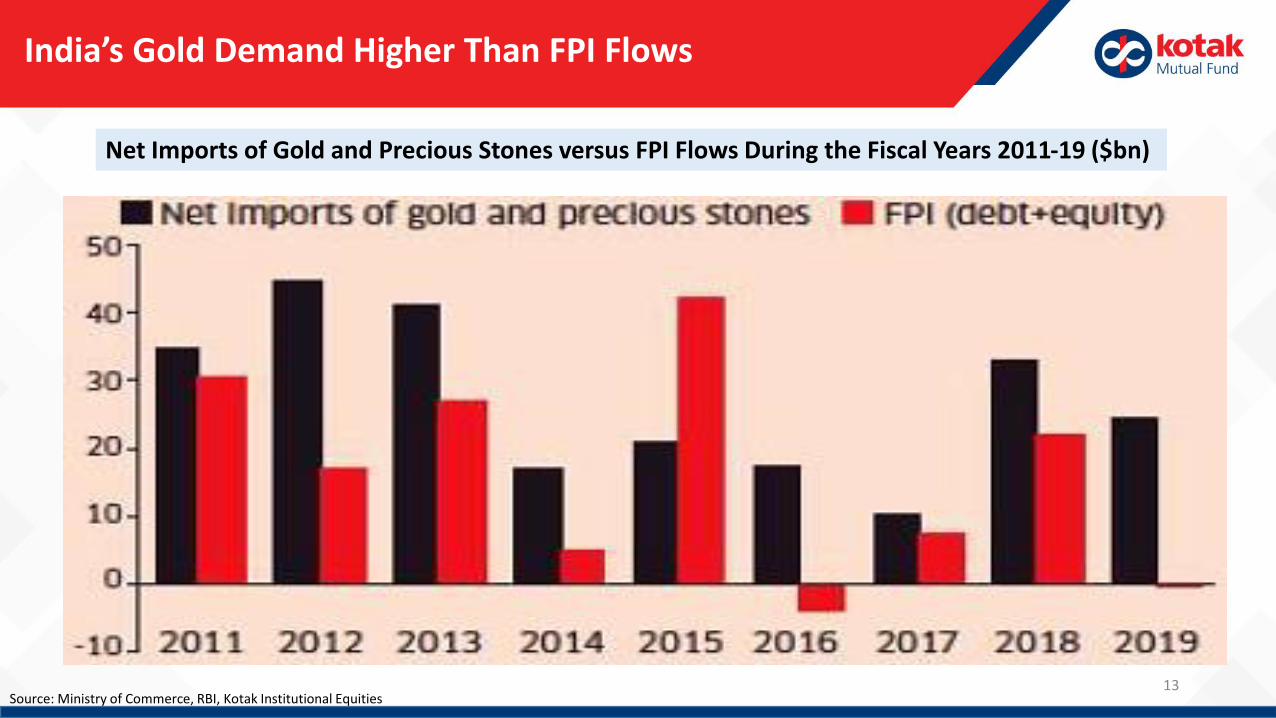
India’s Gold Demand Higher Than FPI Flows
Source: Ministry of Commerce, RBI, Kotak Institutional Equities
Net Imports of Gold and Precious Stones versus FPI Flows During the Fiscal Years 2011-19 ($bn)
14
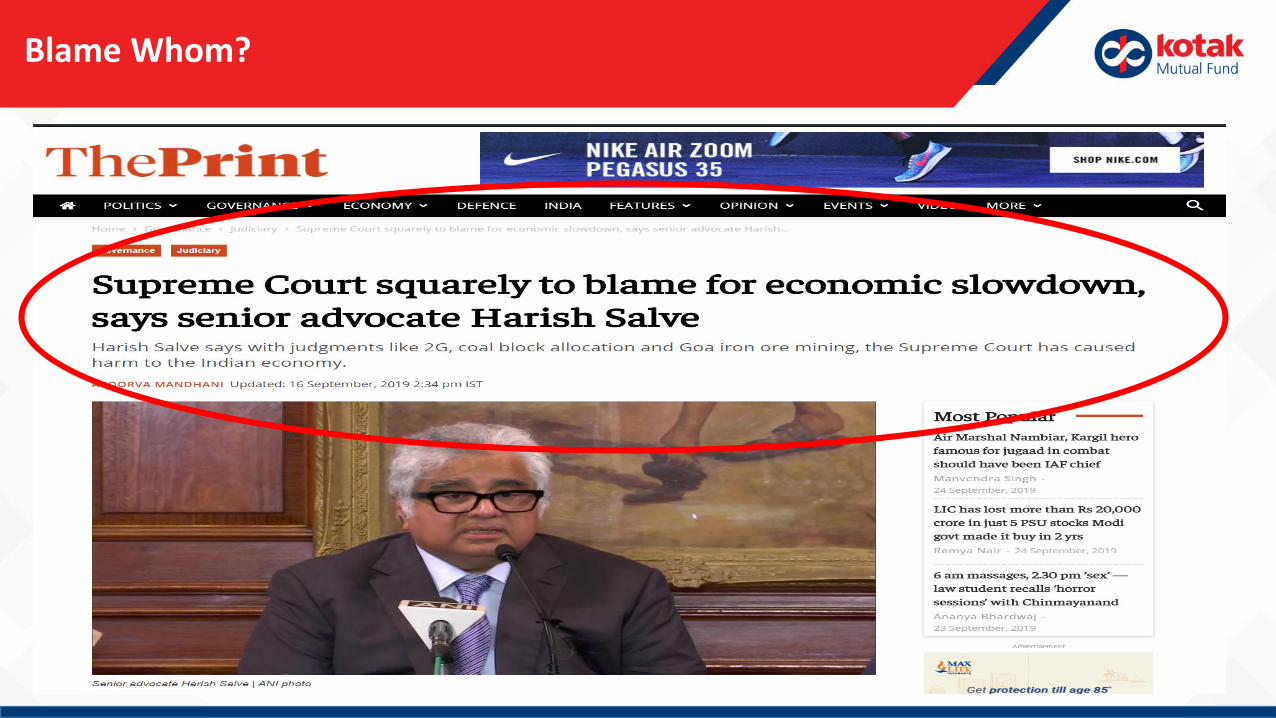
Blame Whom?

15
Kaliyug’s Abhimanyu
Source: Awaaz Nation
16
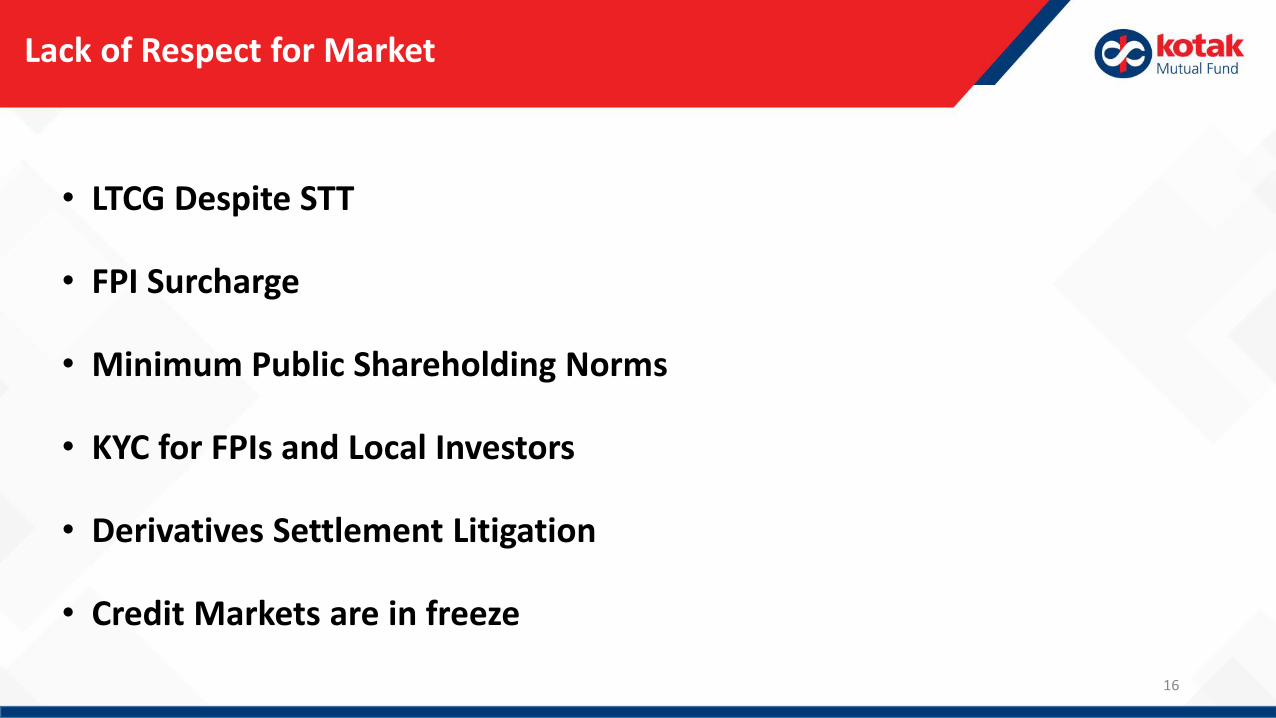
Lack of Respect for Market
• LTCG Despite STT
• FPI Surcharge
• Minimum Public Shareholding Norms
• KYC for FPIs and Local Investors
• Derivatives Settlement Litigation
• Credit Markets are in freeze

17
Some Corrective Actions
18
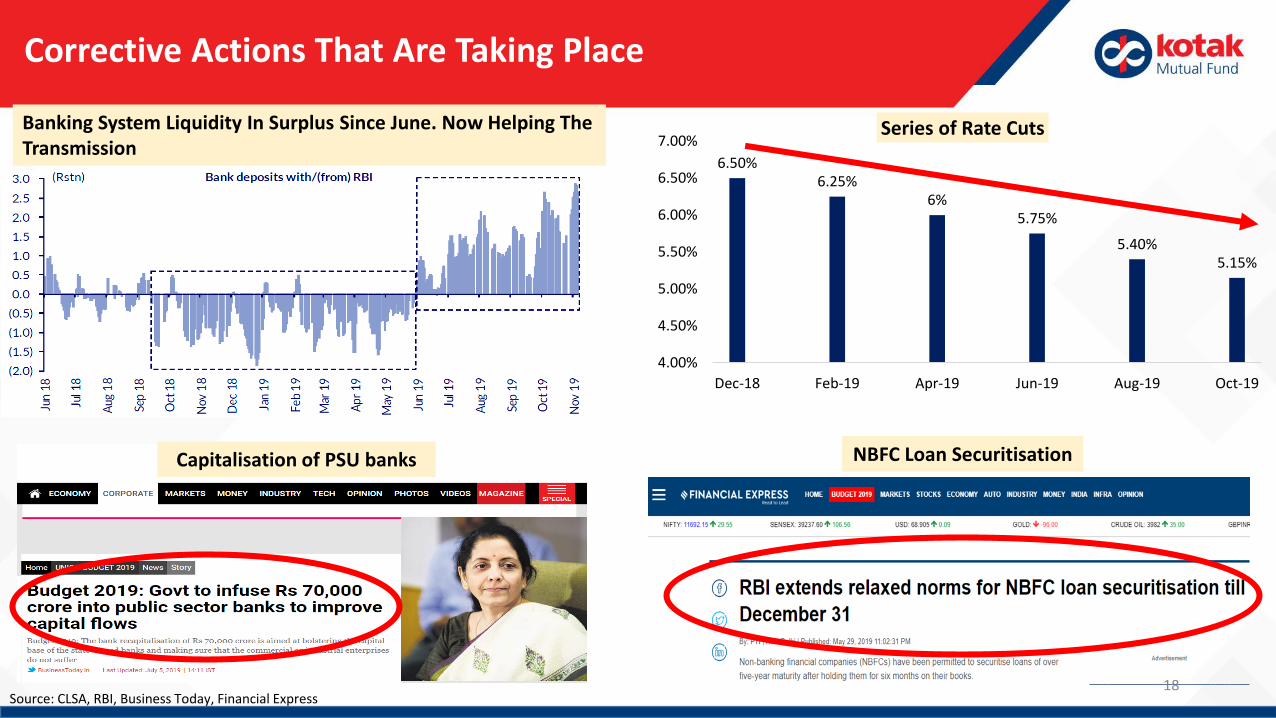
Corrective Actions That Are Taking Place
Source: CLSA, RBI, Business Today, Financial Express
6.50%6.25%
6%5.75%
5.40%5.15%
4.00%
4.50%
5.00%
5.50%
6.00%
6.50%
7.00%
Dec-18 Feb-19 Apr-19 Jun-19 Aug-19 Oct-19
Series of Rate CutsBanking System Liquidity In Surplus Since June. Now Helping The Transmission
Capitalisation of PSU banks NBFC Loan Securitisation

19
What Will Be A Game Changer?
20
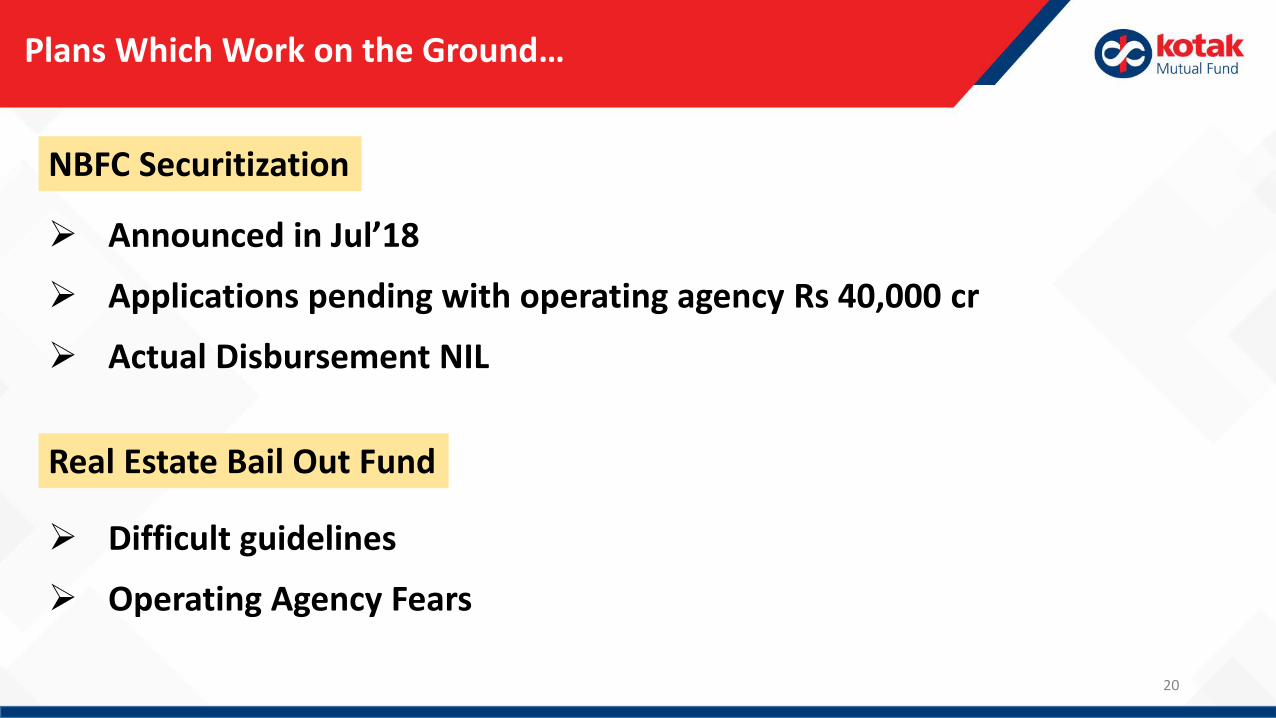
Plans Which Work on the Ground…
Announced in Jul’18
Applications pending with operating agency Rs 40,000 cr
Actual Disbursement NIL
Difficult guidelines
Operating Agency Fears
NBFC Securitization
Real Estate Bail Out Fund

21
Strategic Divestment
Image Source: Company Website

22
Emphasis Areas
Electronics
Coal
Travel Education
Gold India China Trade Deficit
23
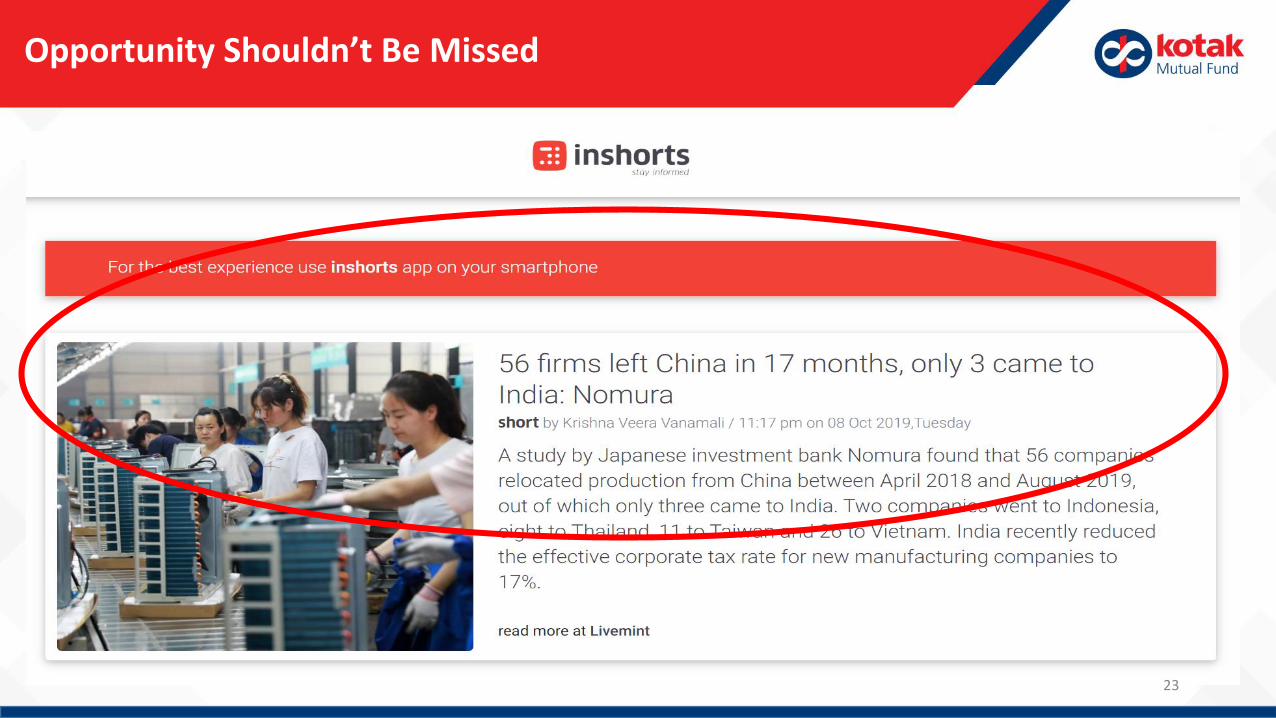
Opportunity Shouldn’t Be Missed
24
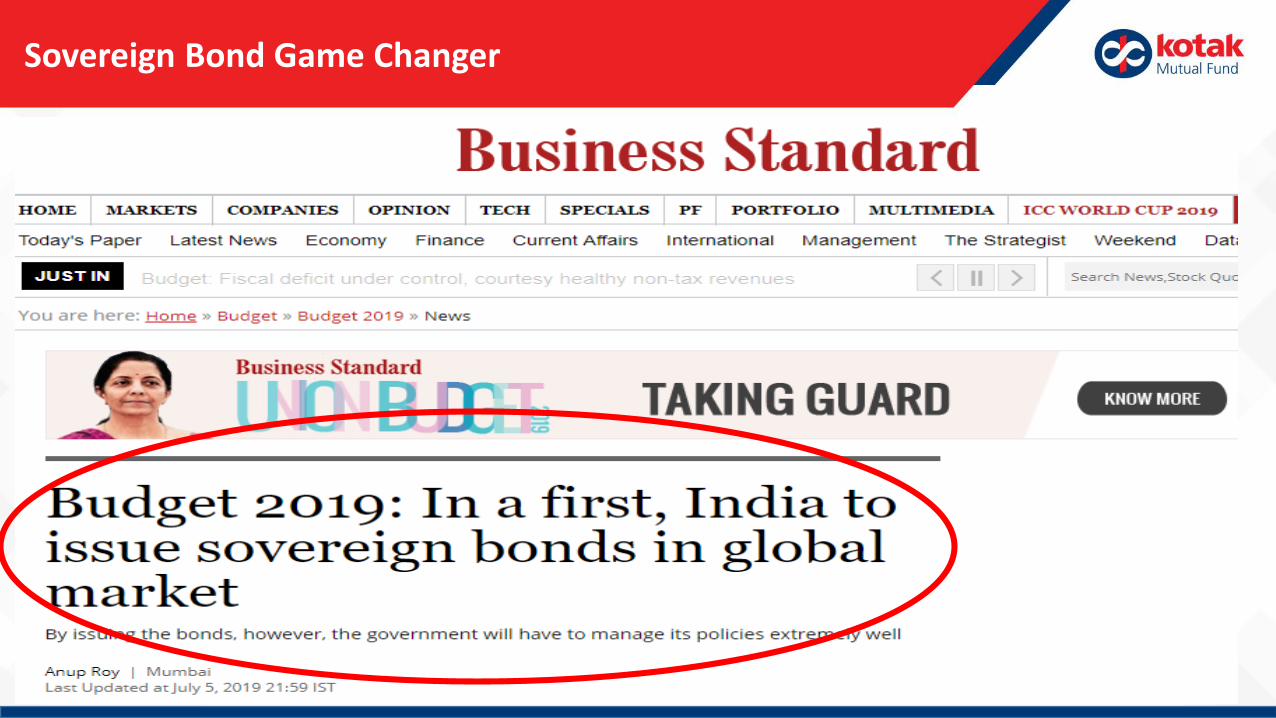
Sovereign Bond Game Changer
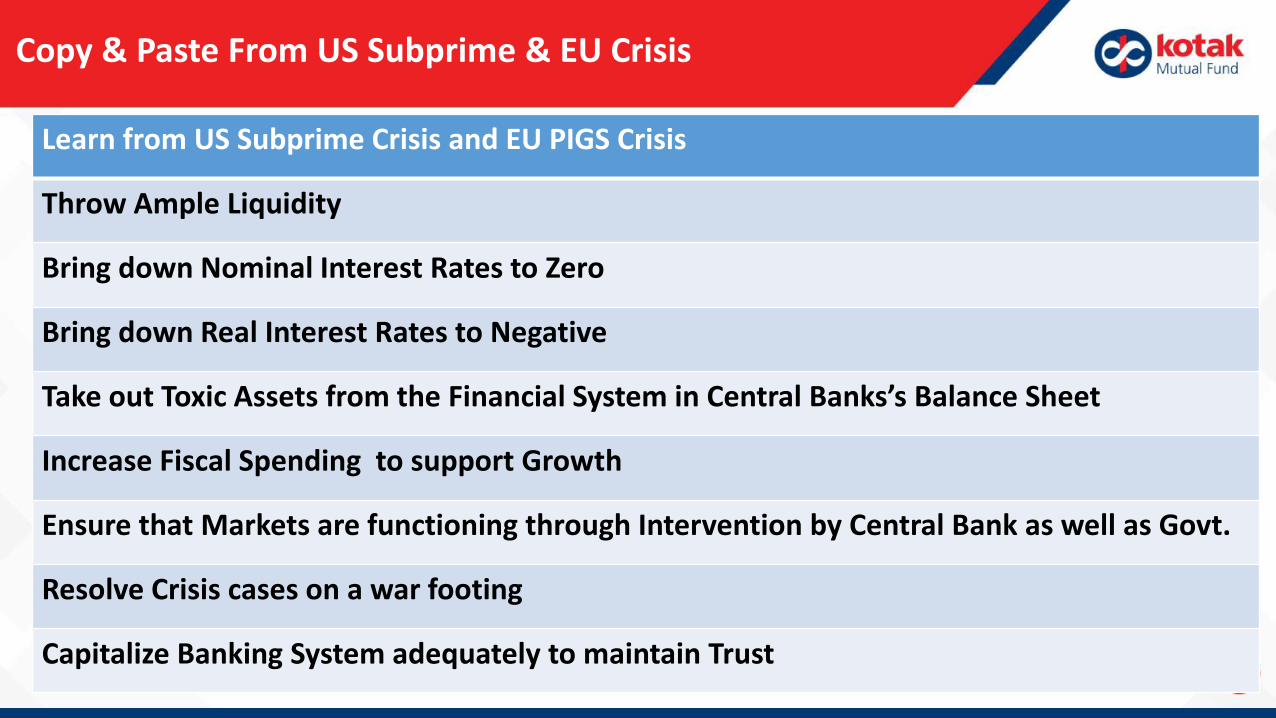
Copy & Paste From US Subprime & EU Crisis
Learn from US Subprime Crisis and EU PIGS Crisis
Throw Ample Liquidity
Bring down Nominal Interest Rates to Zero
Bring down Real Interest Rates to Negative
Take out Toxic Assets from the Financial System in Central Banks’s Balance Sheet
Increase Fiscal Spending to support Growth
Ensure that Markets are functioning through Intervention by Central Bank as well as Govt.
Resolve Crisis cases on a war footing
Capitalize Banking System adequately to maintain Trust
26
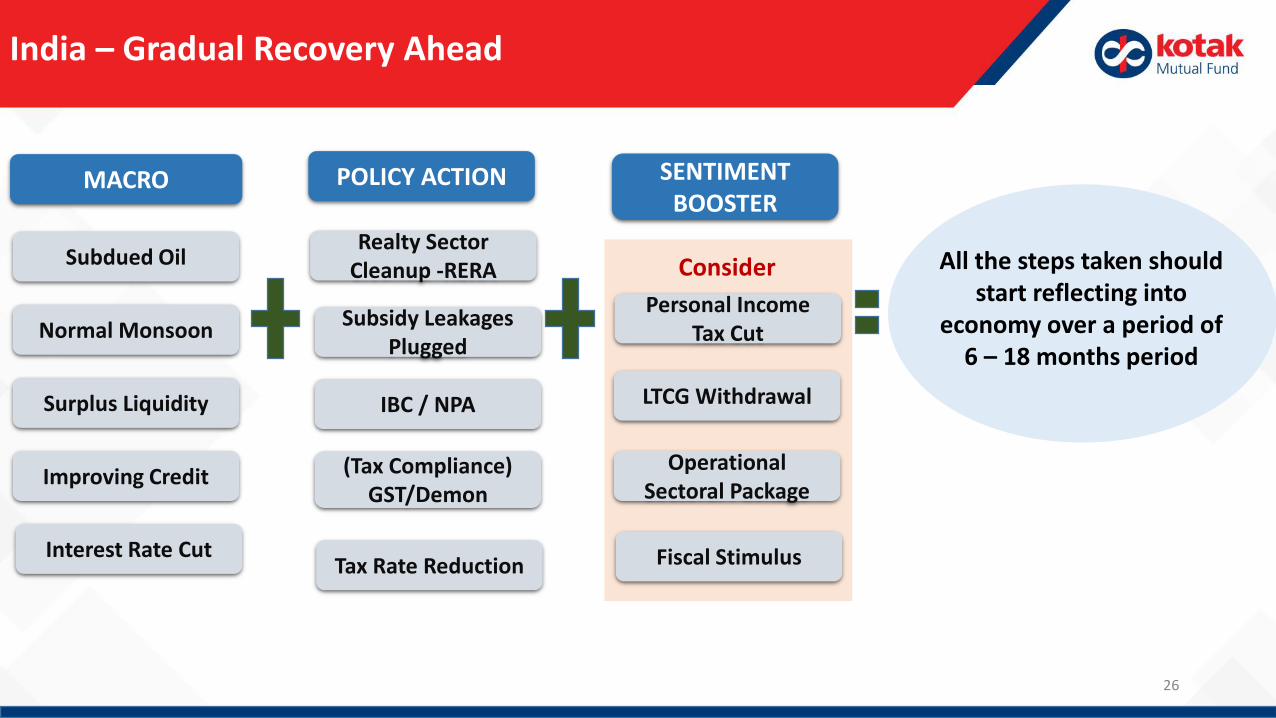
India – Gradual Recovery Ahead
All the steps taken should start reflecting into
economy over a period of 6 – 18 months period
Subdued Oil
Normal Monsoon
Surplus Liquidity
Improving Credit
Realty Sector Cleanup -RERA
Subsidy Leakages Plugged
Operational Sectoral Package
MACRO POLICY ACTION SENTIMENT BOOSTER
LTCG WithdrawalIBC / NPA
(Tax Compliance) GST/Demon
Consider
Tax Rate Reduction Fiscal StimulusInterest Rate Cut
Personal Income Tax Cut

27
Equity Outlook
28
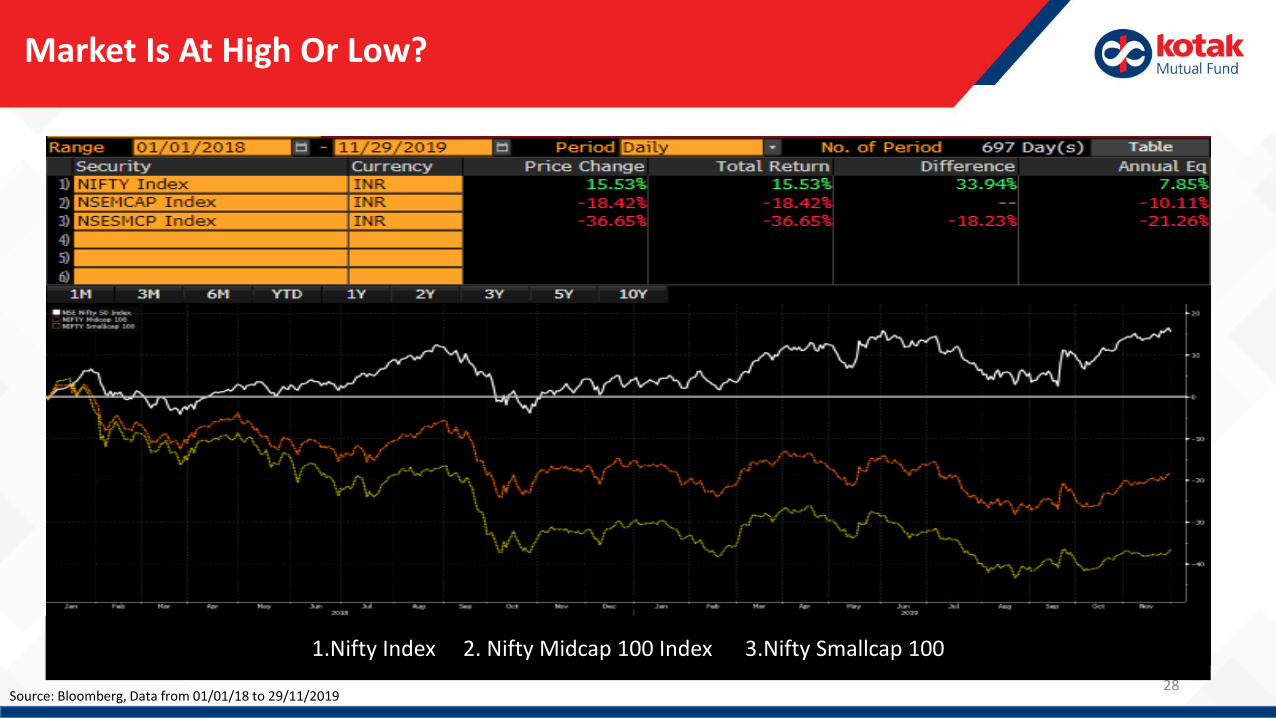
Market Is At High Or Low?
Source: Bloomberg, Data from 01/01/18 to 29/11/2019
1.Nifty Index 2. Nifty Midcap 100 Index 3.Nifty Smallcap 100
29
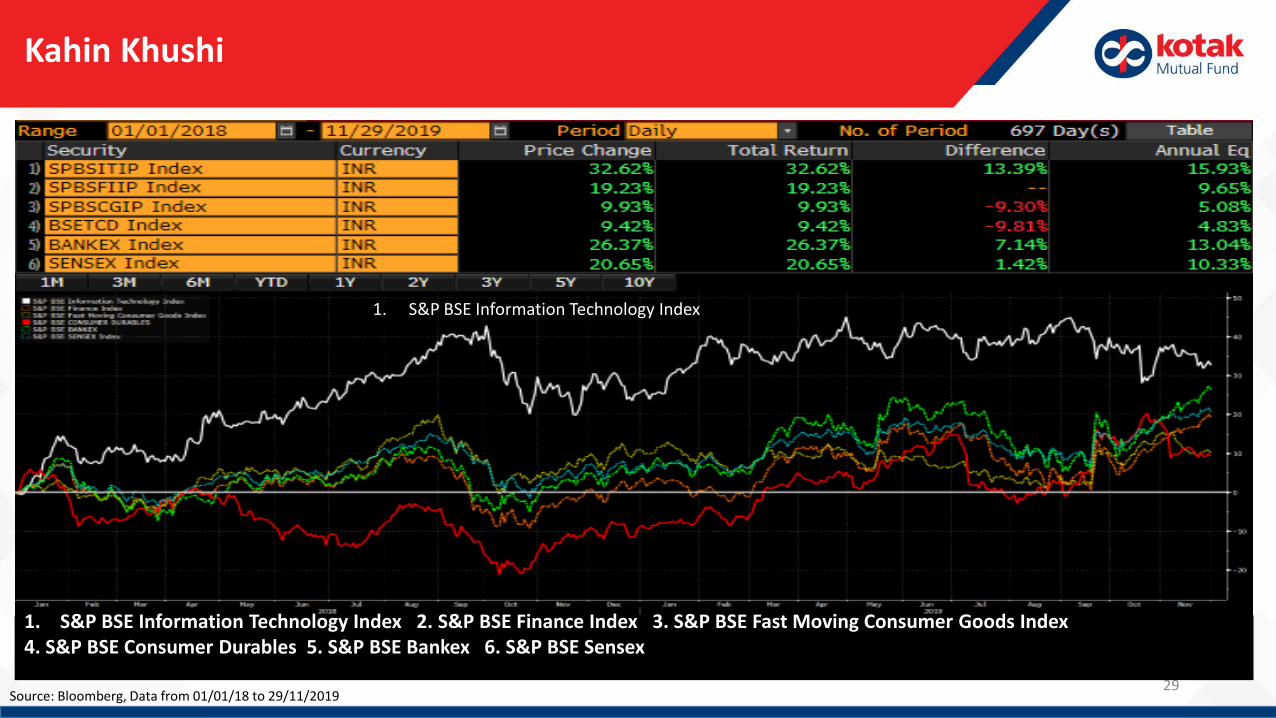
Kahin Khushi
1. S&P BSE Information Technology Index
1. S&P BSE Information Technology Index 2. S&P BSE Finance Index 3. S&P BSE Fast Moving Consumer Goods Index 4. S&P BSE Consumer Durables 5. S&P BSE Bankex 6. S&P BSE Sensex
Source: Bloomberg, Data from 01/01/18 to 29/11/2019
30
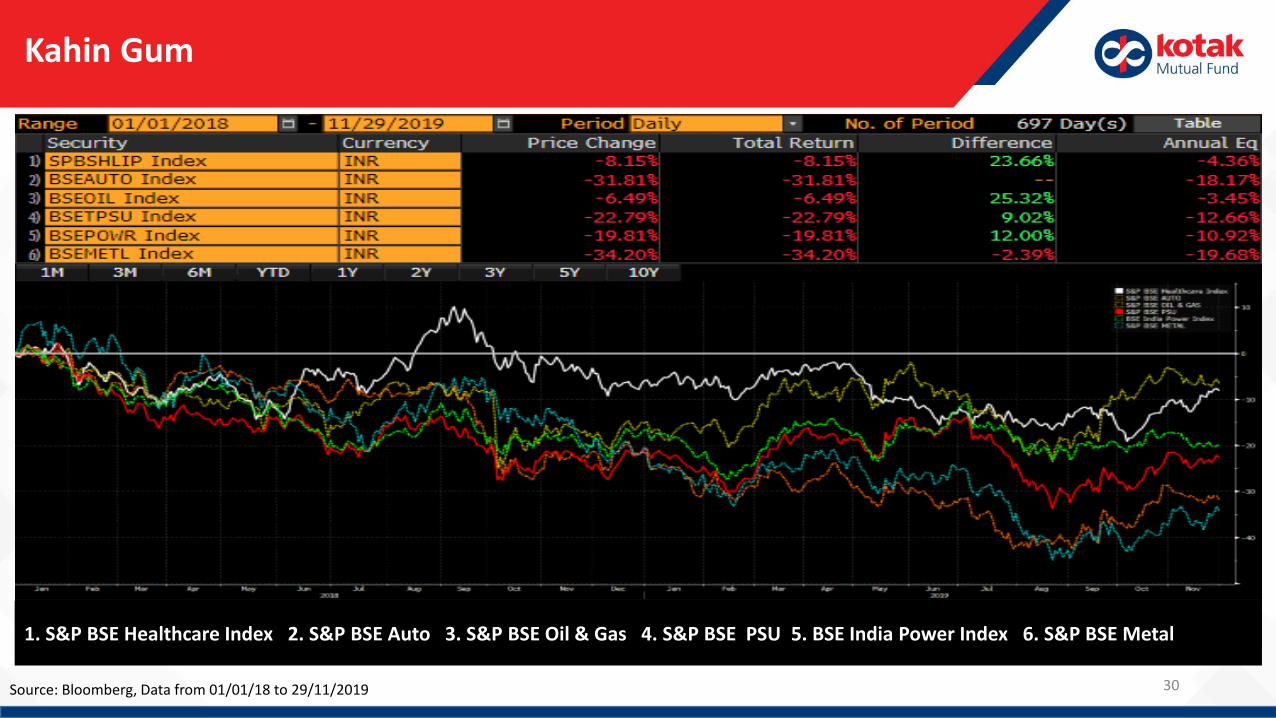
Kahin Gum
1. S&P BSE Healthcare Index 2. S&P BSE Auto 3. S&P BSE Oil & Gas 4. S&P BSE PSU 5. BSE India Power Index 6. S&P BSE Metal
Source: Bloomberg, Data from 01/01/18 to 29/11/2019
31
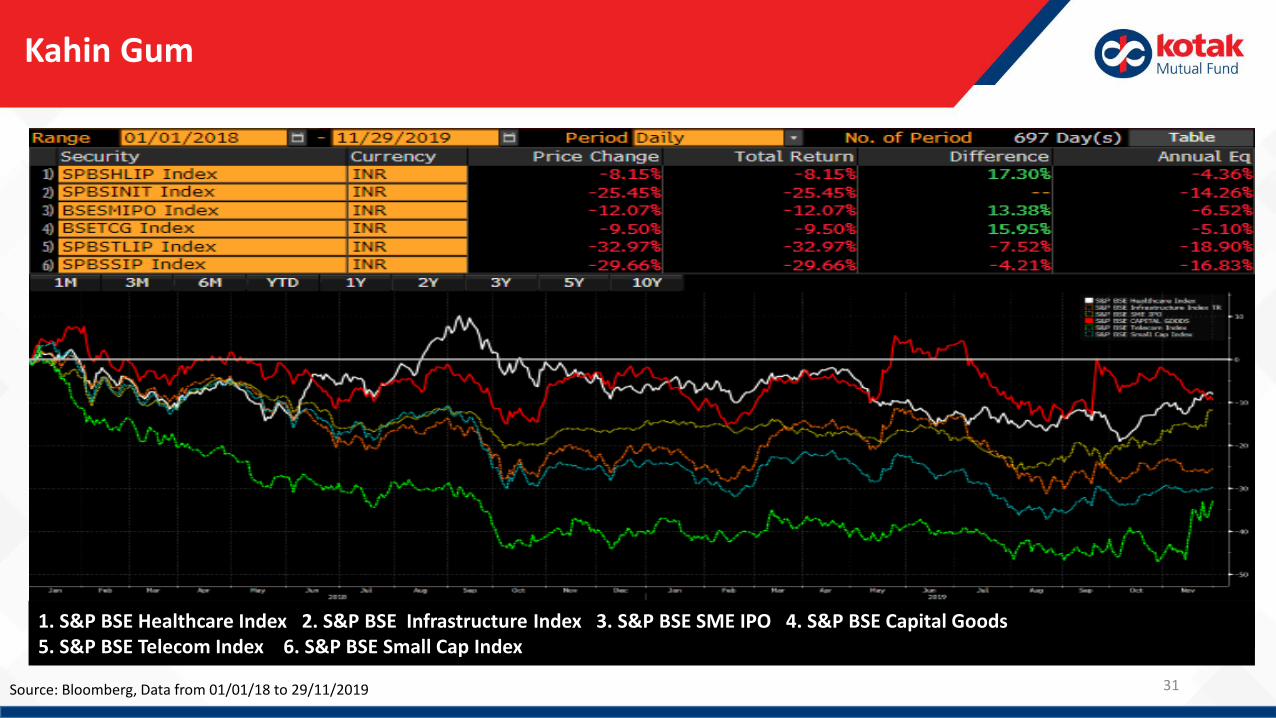
Kahin Gum
1. S&P BSE Healthcare Index 2. S&P BSE Infrastructure Index 3. S&P BSE SME IPO 4. S&P BSE Capital Goods 5. S&P BSE Telecom Index 6. S&P BSE Small Cap Index
Source: Bloomberg, Data from 01/01/18 to 29/11/2019
32
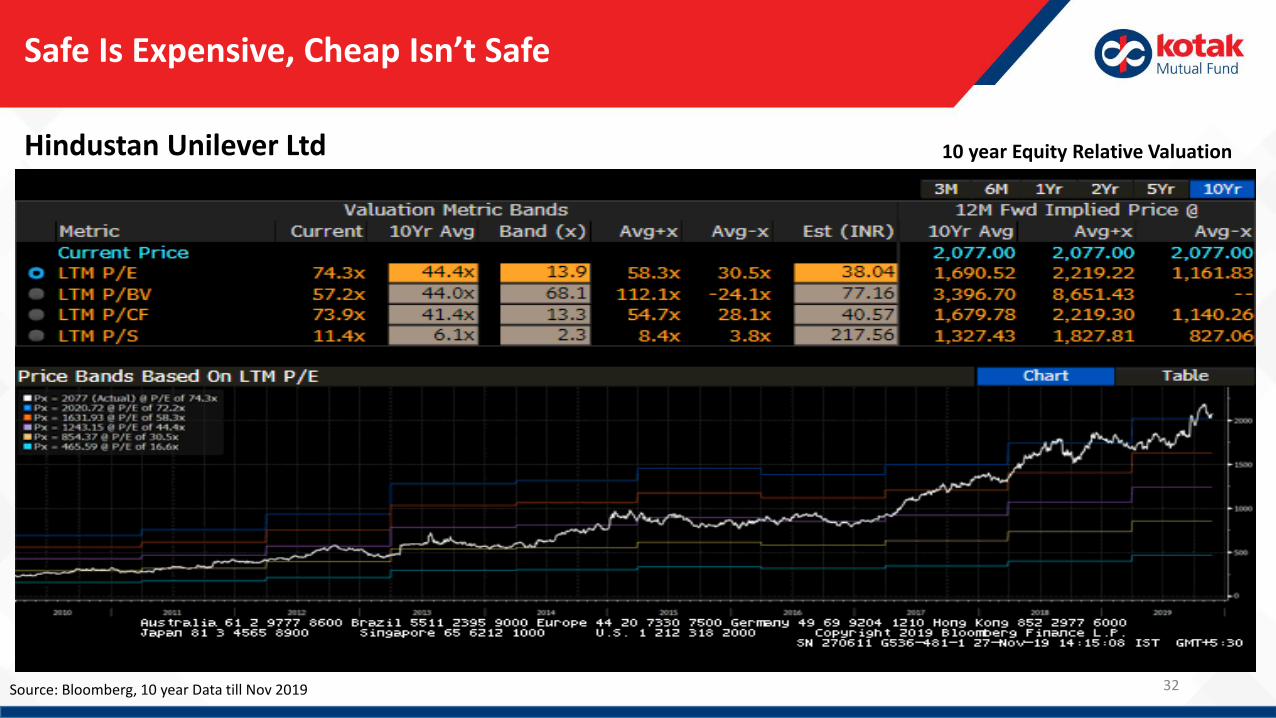
Safe Is Expensive, Cheap Isn’t Safe
Hindustan Unilever Ltd
Source: Bloomberg, 10 year Data till Nov 2019
10 year Equity Relative Valuation
33
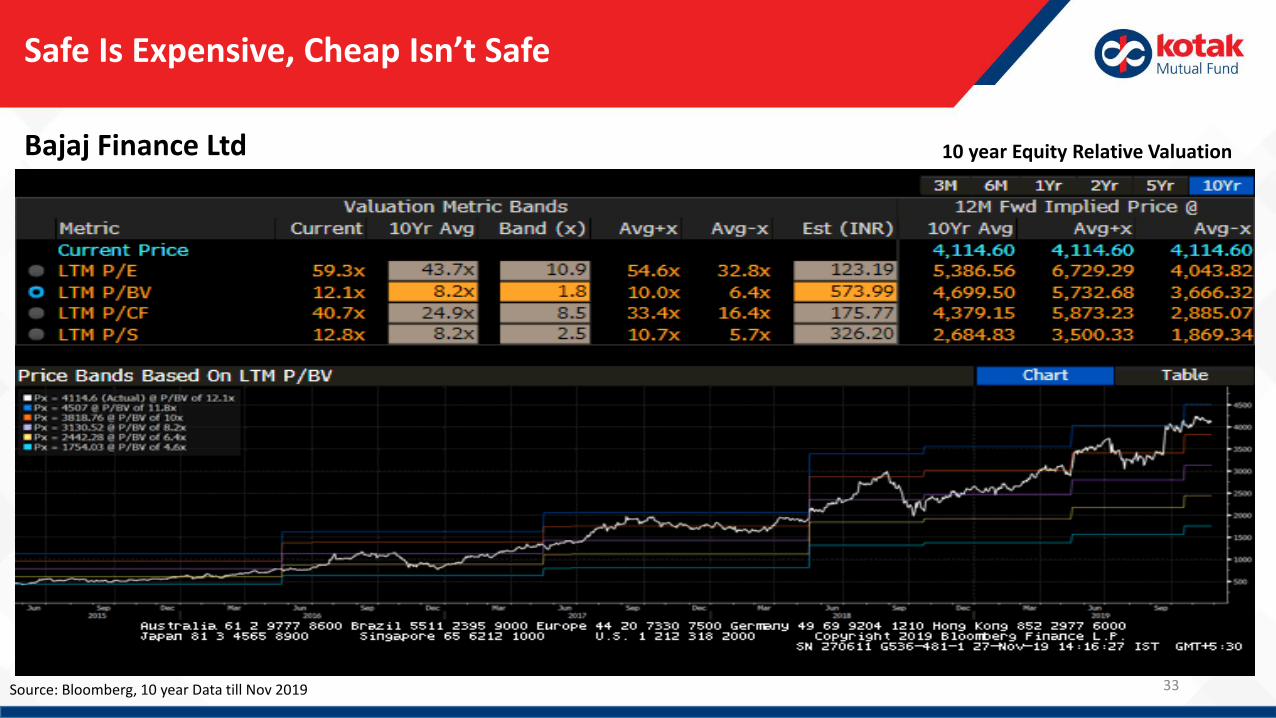
Safe Is Expensive, Cheap Isn’t Safe
Bajaj Finance Ltd 10 year Equity Relative Valuation
Source: Bloomberg, 10 year Data till Nov 2019
34
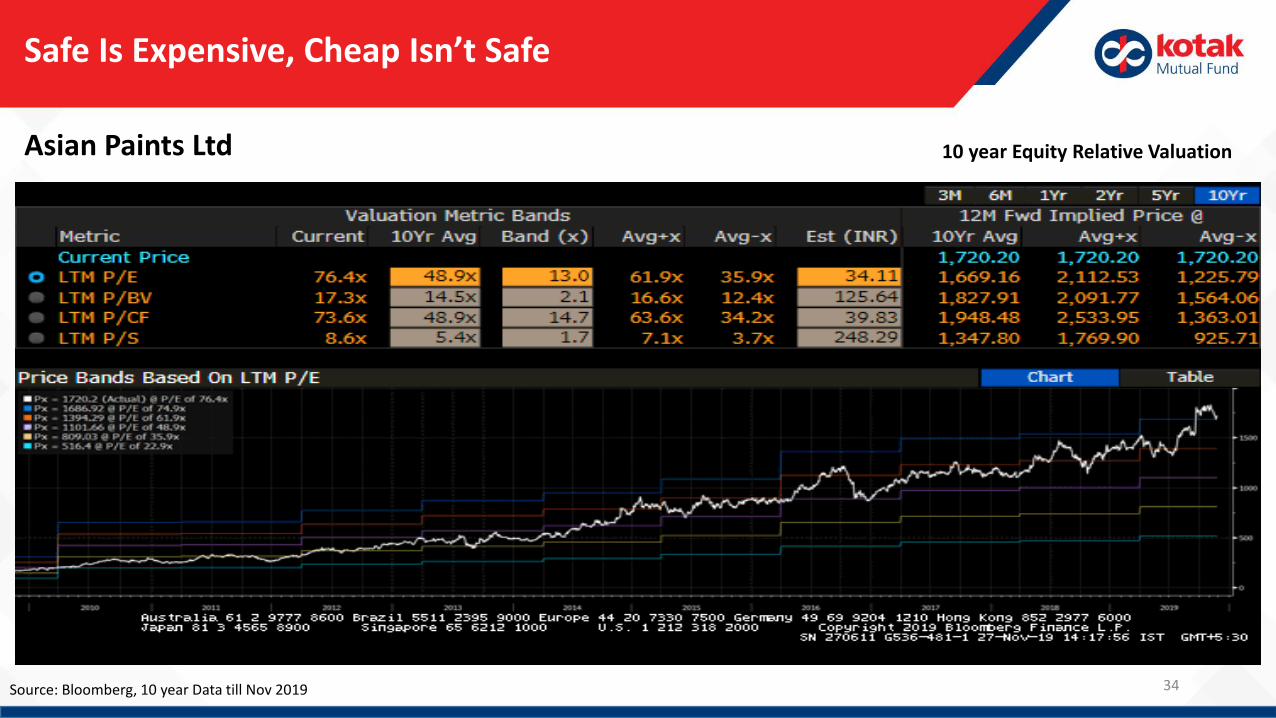
Safe Is Expensive, Cheap Isn’t Safe
Asian Paints Ltd 10 year Equity Relative Valuation
Source: Bloomberg, 10 year Data till Nov 2019
35
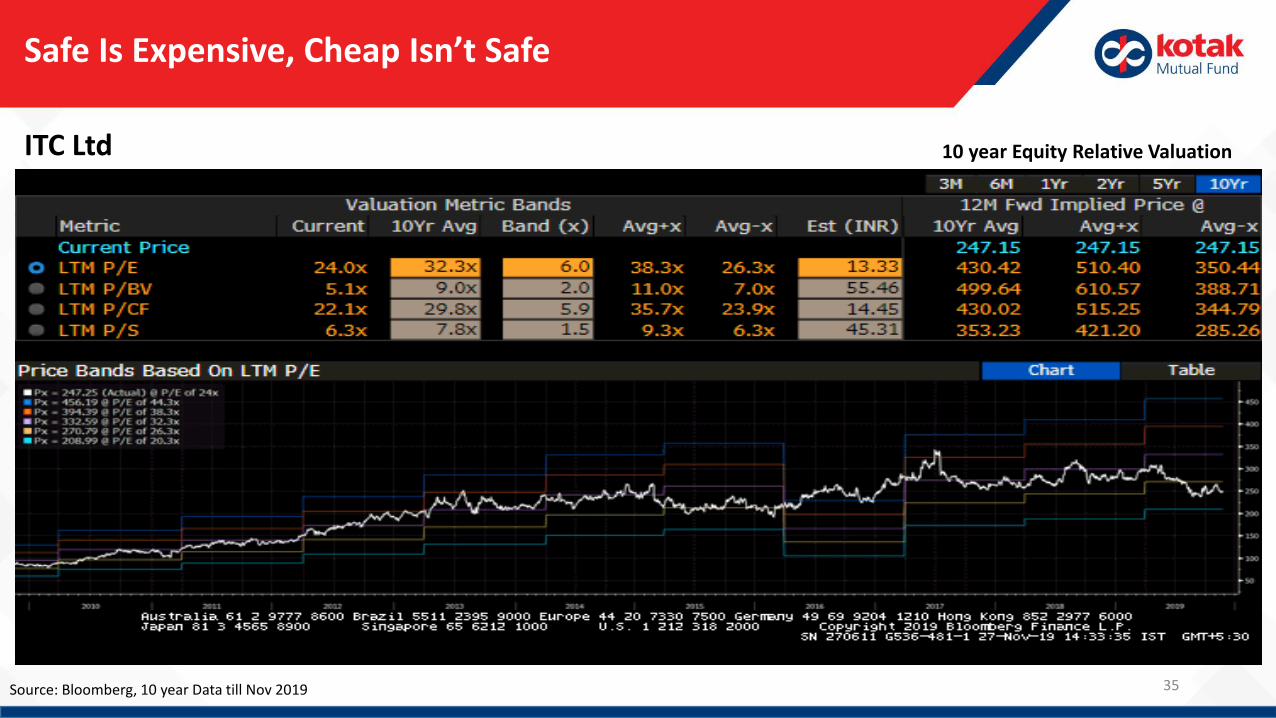
Safe Is Expensive, Cheap Isn’t Safe
ITC Ltd 10 year Equity Relative Valuation
Source: Bloomberg, 10 year Data till Nov 2019
36
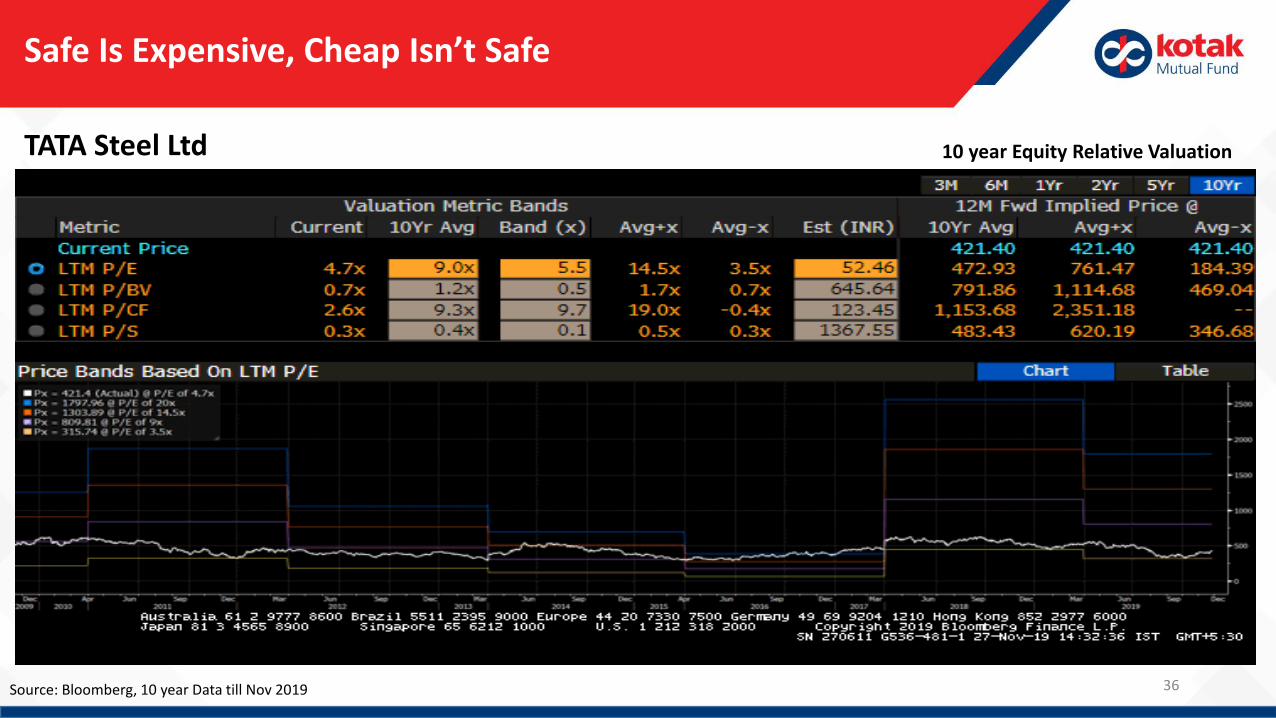
Safe Is Expensive, Cheap Isn’t Safe
TATA Steel Ltd 10 year Equity Relative Valuation
Source: Bloomberg, 10 year Data till Nov 2019
Why Mid Caps & Small Caps Now ?
37
38
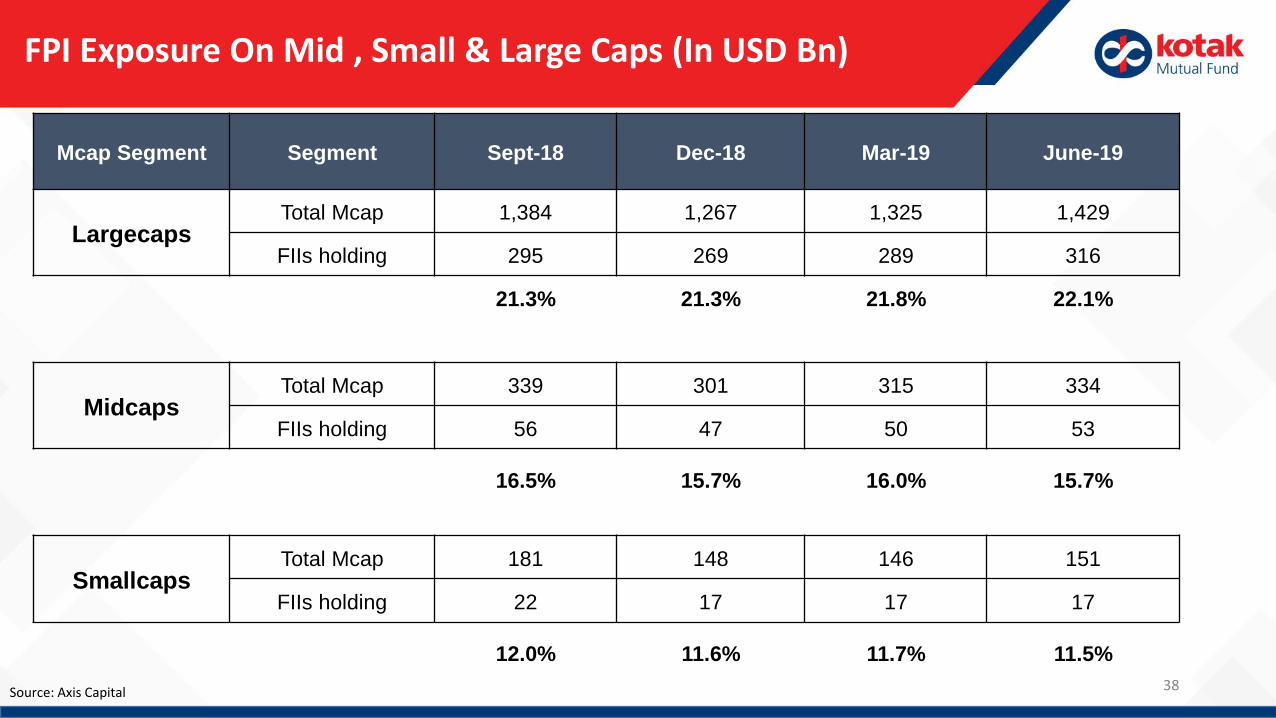
FPI Exposure On Mid , Small & Large Caps (In USD Bn)
Mcap Segment Segment Sept-18 Dec-18 Mar-19 June-19
LargecapsTotal Mcap 1,384 1,267 1,325 1,429
FIIs holding 295 269 289 316
21.3% 21.3% 21.8% 22.1%
MidcapsTotal Mcap 339 301 315 334
FIIs holding 56 47 50 53
16.5% 15.7% 16.0% 15.7%
SmallcapsTotal Mcap 181 148 146 151
FIIs holding 22 17 17 17
12.0% 11.6% 11.7% 11.5%
Source: Axis Capital
39
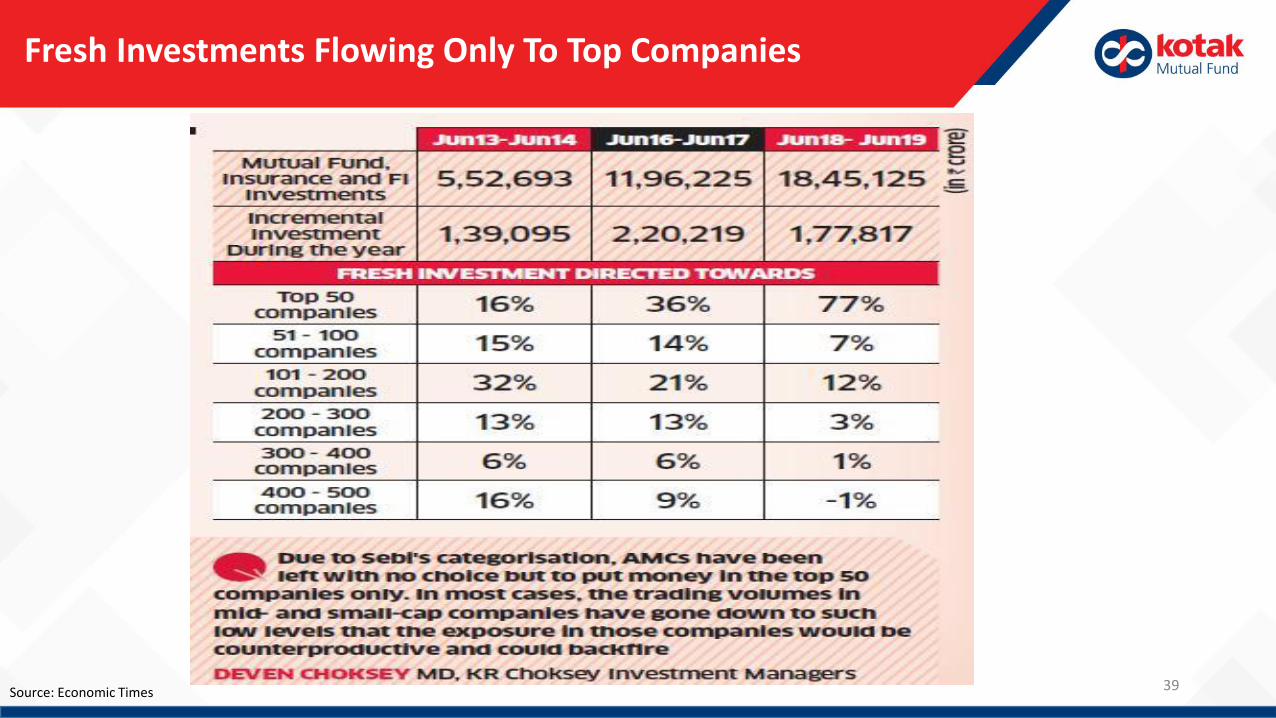
Fresh Investments Flowing Only To Top Companies
Source: Economic Times
40
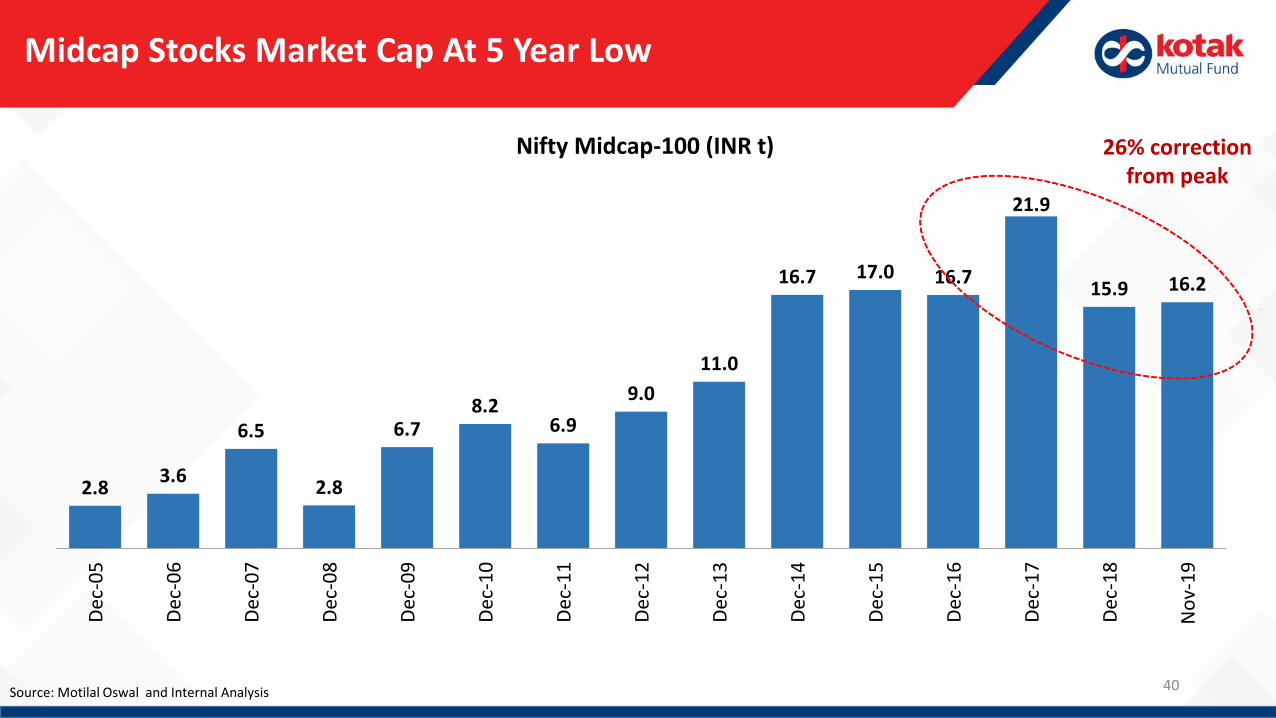
Midcap Stocks Market Cap At 5 Year Low
Source: Motilal Oswal and Internal Analysis
2.83.6
6.5
2.8
6.78.2
6.9
9.0
11.0
16.7 17.0 16.7
21.9
15.9 16.2
Dec
-05
Dec
-06
Dec
-07
Dec
-08
Dec
-09
Dec
-10
Dec
-11
Dec
-12
Dec
-13
Dec
-14
Dec
-15
Dec
-16
Dec
-17
Dec
-18
No
v-1
9
Nifty Midcap-100 (INR t) 26% correction from peak
41
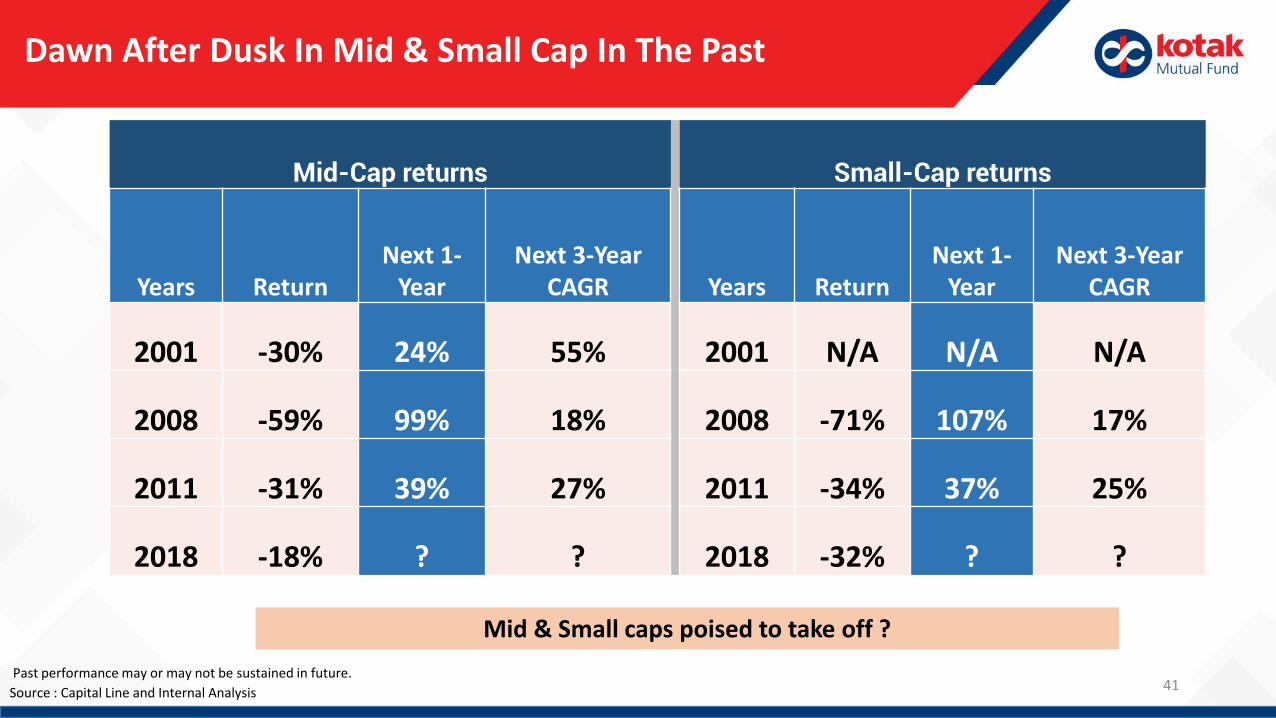
Dawn After Dusk In Mid & Small Cap In The Past
Source : Capital Line and Internal Analysis
Mid-Cap returns Small-Cap returns
Years ReturnNext 1-
YearNext 3-Year
CAGR Years ReturnNext 1-
YearNext 3-Year
CAGR
2001 -30% 24% 55% 2001 N/A N/A N/A
2008 -59% 99% 18% 2008 -71% 107% 17%
2011 -31% 39% 27% 2011 -34% 37% 25%
2018 -18% ? ? 2018 -32% ? ?
Past performance may or may not be sustained in future.
Mid & Small caps poised to take off ?
Market Performance
42
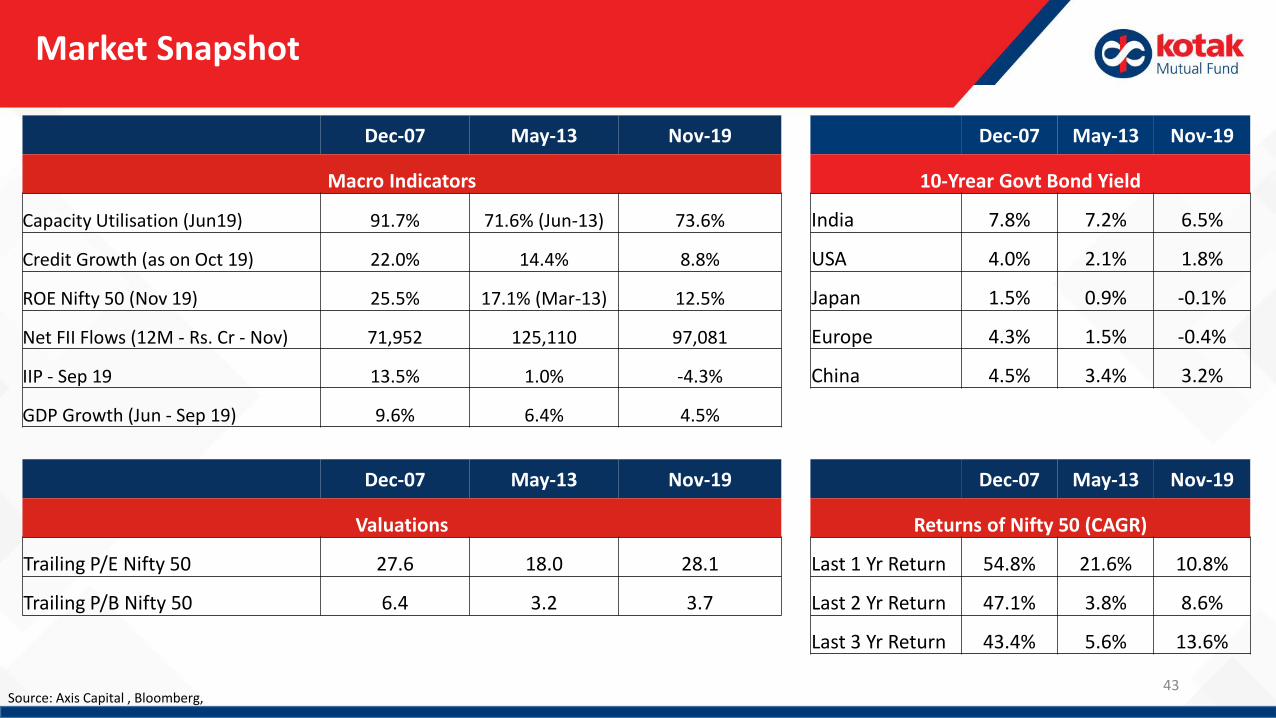
Market Snapshot
Source: Axis Capital , Bloomberg,
Dec-07 May-13 Nov-19 Dec-07 May-13 Nov-19
Macro Indicators 10-Yrear Govt Bond Yield
Capacity Utilisation (Jun19) 91.7% 71.6% (Jun-13) 73.6% India 7.8% 7.2% 6.5%
Credit Growth (as on Oct 19) 22.0% 14.4% 8.8% USA 4.0% 2.1% 1.8%
ROE Nifty 50 (Nov 19) 25.5% 17.1% (Mar-13) 12.5% Japan 1.5% 0.9% -0.1%
Net FII Flows (12M - Rs. Cr - Nov) 71,952 125,110 97,081 Europe 4.3% 1.5% -0.4%
IIP - Sep 19 13.5% 1.0% -4.3% China 4.5% 3.4% 3.2%
GDP Growth (Jun - Sep 19) 9.6% 6.4% 4.5%
Dec-07 May-13 Nov-19 Dec-07 May-13 Nov-19
Valuations Returns of Nifty 50 (CAGR)
Trailing P/E Nifty 50 27.6 18.0 28.1 Last 1 Yr Return 54.8% 21.6% 10.8%
Trailing P/B Nifty 50 6.4 3.2 3.7 Last 2 Yr Return 47.1% 3.8% 8.6%
Last 3 Yr Return 43.4% 5.6% 13.6%
43
*As on 29 November 2019, Source: Axis Capital, Bloomberg, Past Performance may or may not sustain in the future
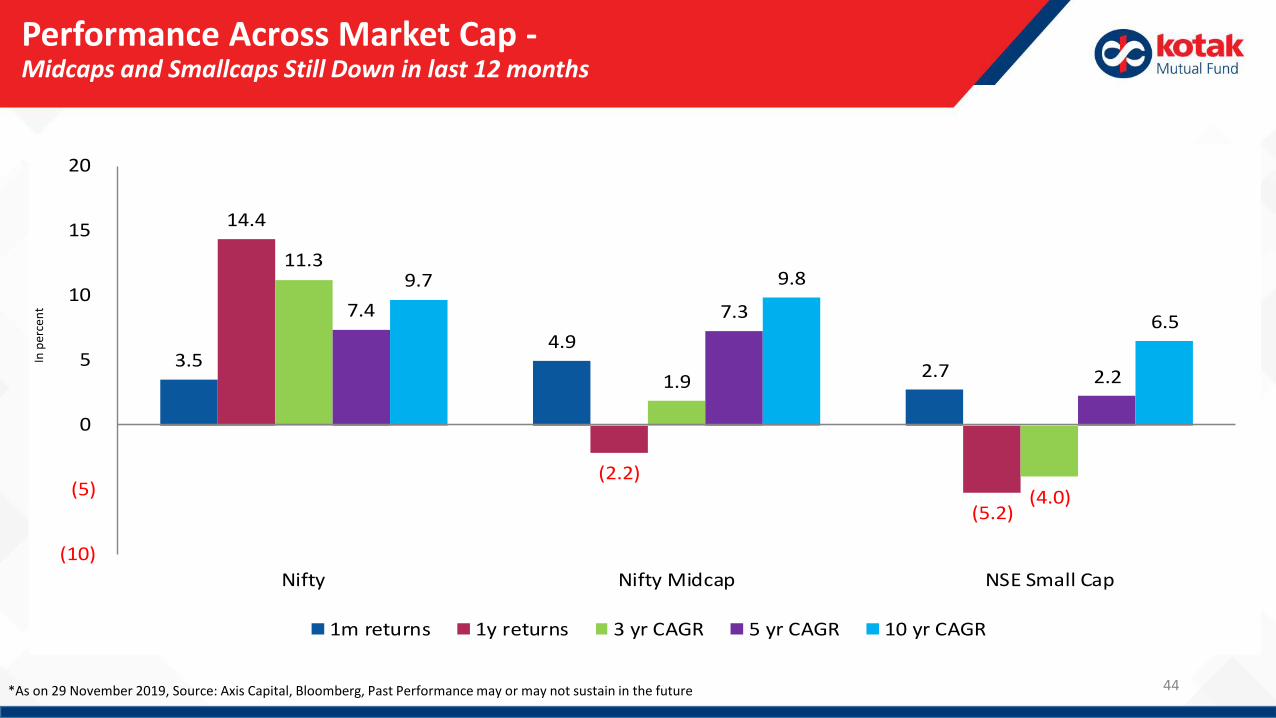
Performance Across Market Cap -Midcaps and Smallcaps Still Down in last 12 months
3.5 4.9
2.7
14.4
(2.2)
(5.2)
11.3
1.9
(4.0)
7.4 7.3
2.2
9.7 9.8
6.5
(10)
(5)
0
5
10
15
20
Nifty Nifty Midcap NSE Small Cap
1m returns 1y returns 3 yr CAGR 5 yr CAGR 10 yr CAGR
In p
erce
nt
44
45
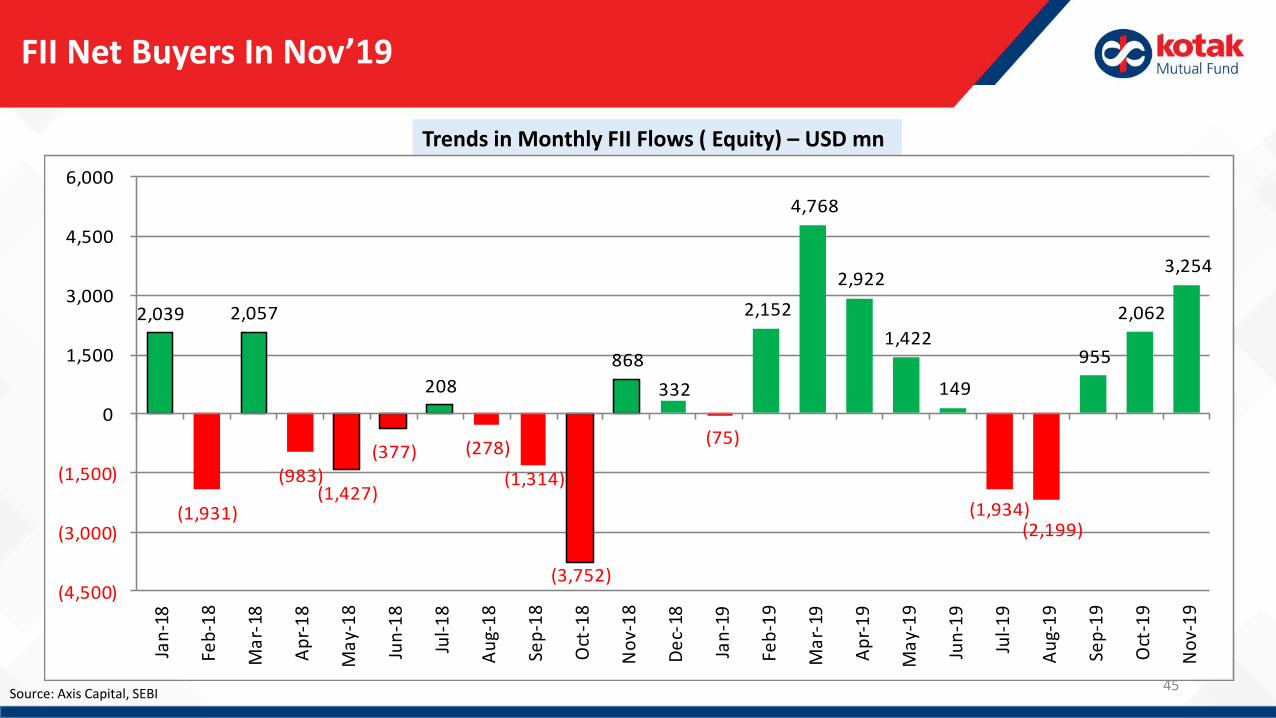
FII Net Buyers In Nov’19
Source: Axis Capital, SEBI
Trends in Monthly FII Flows ( Equity) – USD mn
2,039
(1,931)
2,057
(983)(1,427)
(377)
208
(278)
(1,314)
(3,752)
868
332
(75)
2,152
4,768
2,922
1,422
149
(1,934)(2,199)
955
2,062
3,254
(4,500)
(3,000)
(1,500)
0
1,500
3,000
4,500
6,000Ja
n-1
8
Feb
-18
Ma
r-18
Ap
r-1
8
Ma
y-1
8
Jun
-18
Jul-
18
Au
g-1
8
Sep
-18
Oct
-18
No
v-1
8
De
c-18
Jan
-19
Feb
-19
Ma
r-19
Ap
r-1
9
Ma
y-1
9
Jun
-19
Jul-
19
Au
g-1
9
Sep
-19
Oct
-19
No
v-1
9

Valuations
46
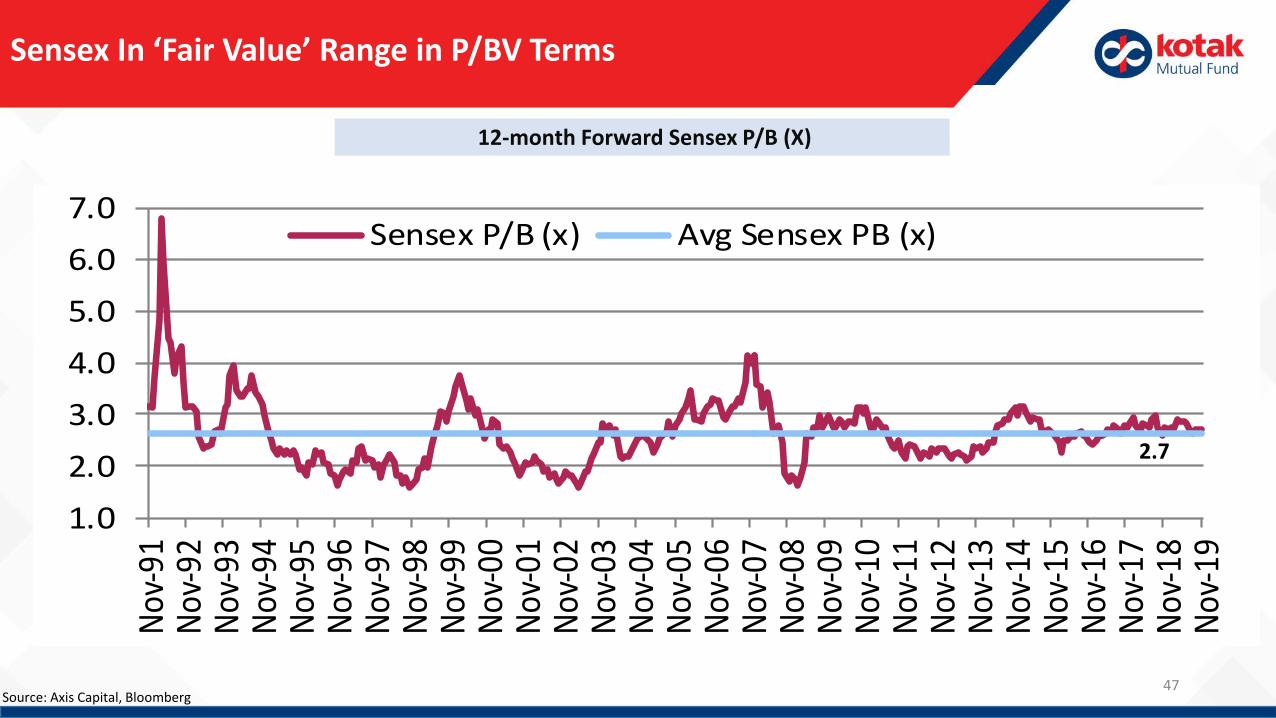
12-month Forward Sensex P/B (X)
Sensex In ‘Fair Value’ Range in P/BV Terms
Source: Axis Capital, Bloomberg47
1.0
2.0
3.0
4.0
5.0
6.0
7.0
Nov
-91
Nov
-92
Nov
-93
Nov
-94
Nov
-95
Nov
-96
Nov
-97
Nov
-98
Nov
-99
Nov
-00
Nov
-01
Nov
-02
Nov
-03
Nov
-04
Nov
-05
Nov
-06
Nov
-07
Nov
-08
Nov
-09
Nov
-10
Nov
-11
Nov
-12
Nov
-13
Nov
-14
Nov
-15
Nov
-16
Nov
-17
Nov
-18
Nov
-19
Sensex P/B (x) Avg Sensex PB (x)
2.7
48
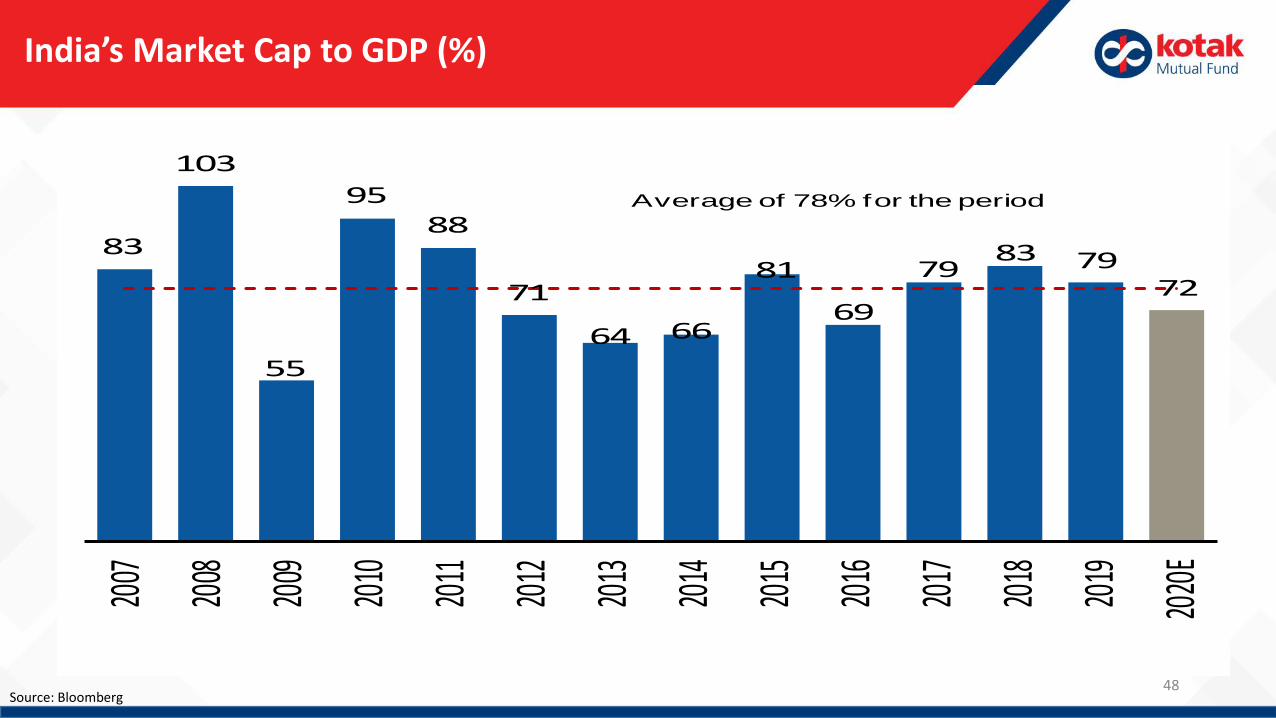
India’s Market Cap to GDP (%)
83
103
55
9588
71
64 66
81
69
7983 79
72
2007
2008
2009
2010
2011
2012
2013
2014
2015
2016
2017
2018
2019
2020
E
Average of 78% for the period
Source: Bloomberg

49
Recommendation
50
Maintain Neutral Allocation To Equity
Overweight Small Cap And Mid Cap
51
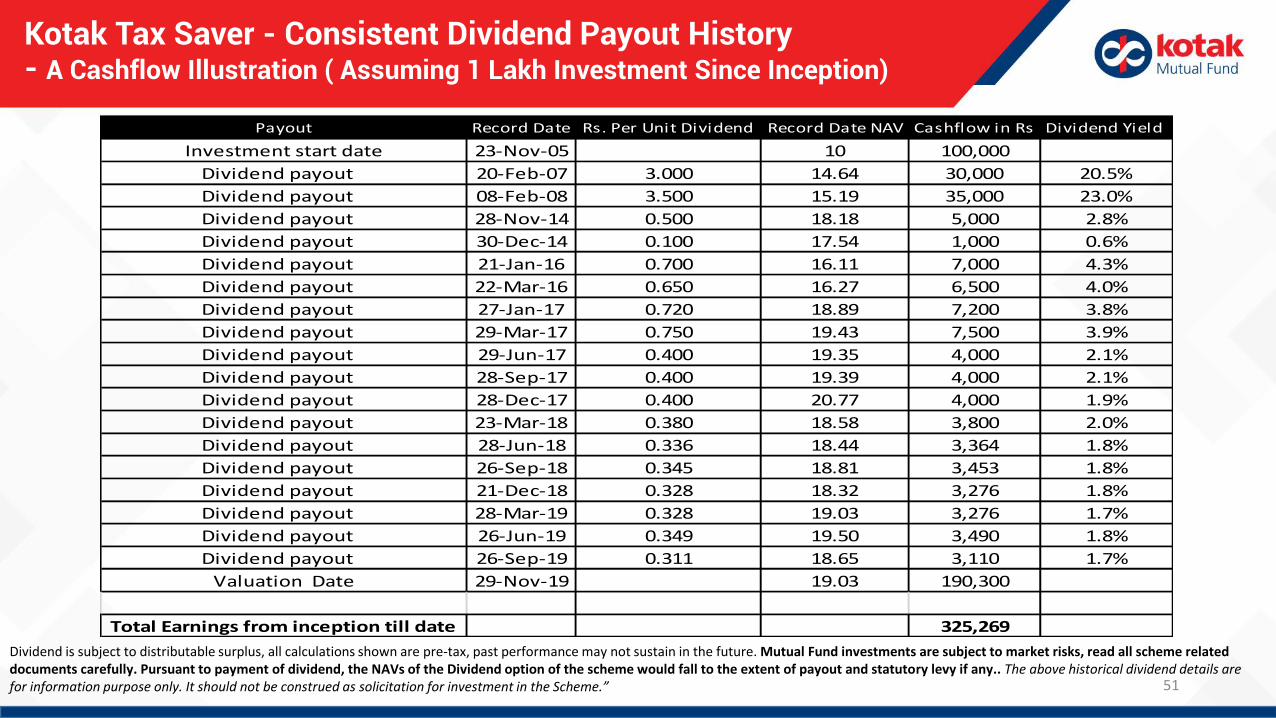
Kotak Tax Saver - Consistent Dividend Payout History - A Cashflow Illustration ( Assuming 1 Lakh Investment Since Inception)
Payout Record Date Rs. Per Unit Dividend Record Date NAV Cashflow in Rs Dividend Yield
Investment start date 23-Nov-05 10 100,000
Dividend payout 20-Feb-07 3.000 14.64 30,000 20.5%
Dividend payout 08-Feb-08 3.500 15.19 35,000 23.0%
Dividend payout 28-Nov-14 0.500 18.18 5,000 2.8%
Dividend payout 30-Dec-14 0.100 17.54 1,000 0.6%
Dividend payout 21-Jan-16 0.700 16.11 7,000 4.3%
Dividend payout 22-Mar-16 0.650 16.27 6,500 4.0%
Dividend payout 27-Jan-17 0.720 18.89 7,200 3.8%
Dividend payout 29-Mar-17 0.750 19.43 7,500 3.9%
Dividend payout 29-Jun-17 0.400 19.35 4,000 2.1%
Dividend payout 28-Sep-17 0.400 19.39 4,000 2.1%
Dividend payout 28-Dec-17 0.400 20.77 4,000 1.9%
Dividend payout 23-Mar-18 0.380 18.58 3,800 2.0%
Dividend payout 28-Jun-18 0.336 18.44 3,364 1.8%
Dividend payout 26-Sep-18 0.345 18.81 3,453 1.8%
Dividend payout 21-Dec-18 0.328 18.32 3,276 1.8%
Dividend payout 28-Mar-19 0.328 19.03 3,276 1.7%
Dividend payout 26-Jun-19 0.349 19.50 3,490 1.8%
Dividend payout 26-Sep-19 0.311 18.65 3,110 1.7%
Valuation Date 29-Nov-19 19.03 190,300
Total Earnings from inception till date 325,269
Dividend is subject to distributable surplus, all calculations shown are pre-tax, past performance may not sustain in the future. Mutual Fund investments are subject to market risks, read all scheme related documents carefully. Pursuant to payment of dividend, the NAVs of the Dividend option of the scheme would fall to the extent of payout and statutory levy if any.. The above historical dividend details are for information purpose only. It should not be construed as solicitation for investment in the Scheme.”
52
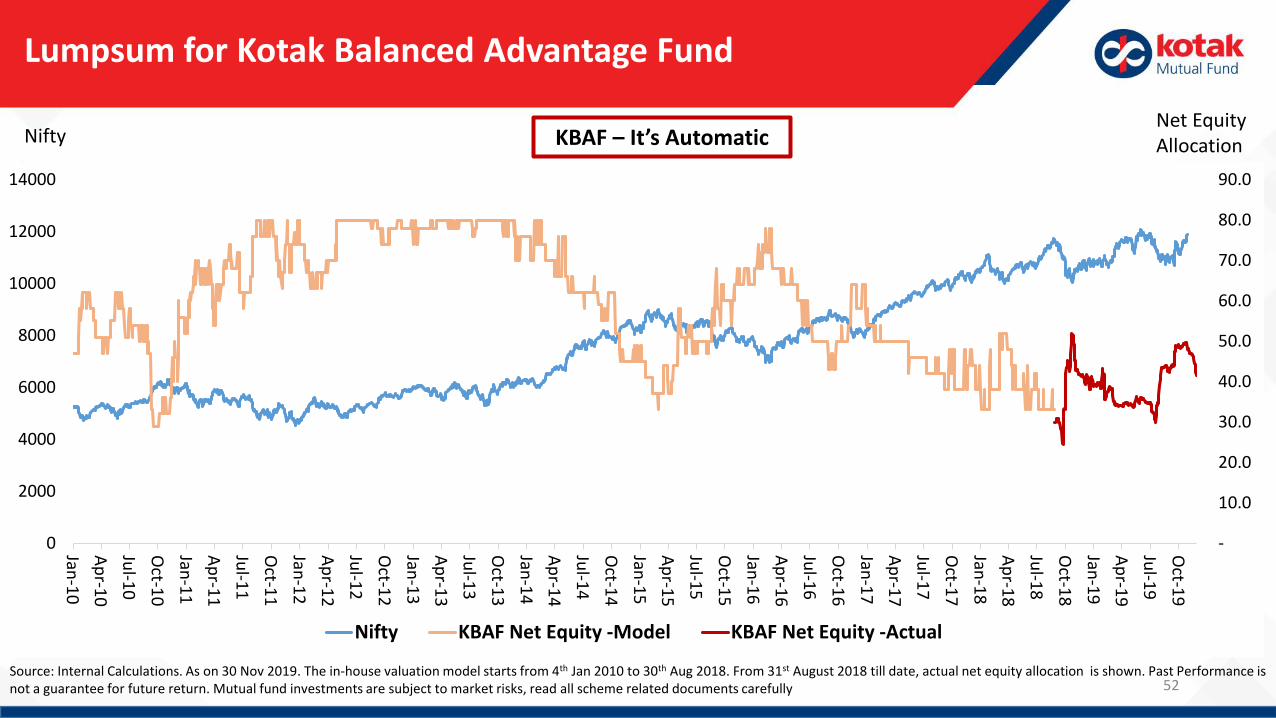
Lumpsum for Kotak Balanced Advantage Fund
Nifty
Source: Internal Calculations. As on 30 Nov 2019. The in-house valuation model starts from 4th Jan 2010 to 30th Aug 2018. From 31st August 2018 till date, actual net equity allocation is shown. Past Performance is not a guarantee for future return. Mutual fund investments are subject to market risks, read all scheme related documents carefully
KBAF – It’s Automatic
-
10.0
20.0
30.0
40.0
50.0
60.0
70.0
80.0
90.0
0
2000
4000
6000
8000
10000
12000
14000
Jan-1
0
Ap
r-10
Jul-1
0
Oct-1
0
Jan-1
1
Ap
r-11
Jul-1
1
Oct-1
1
Jan-1
2
Ap
r-12
Jul-1
2
Oct-1
2
Jan-1
3
Ap
r-13
Jul-1
3
Oct-1
3
Jan-1
4
Ap
r-14
Jul-1
4
Oct-1
4
Jan-1
5
Ap
r-15
Jul-1
5
Oct-1
5
Jan-1
6
Ap
r-16
Jul-1
6
Oct-1
6
Jan-1
7
Ap
r-17
Jul-1
7
Oct-1
7
Jan-1
8
Ap
r-18
Jul-1
8
Oct-1
8
Jan-1
9
Ap
r-19
Jul-1
9
Oct-1
9
Nifty KBAF Net Equity -Model KBAF Net Equity -Actual
Net Equity Allocation
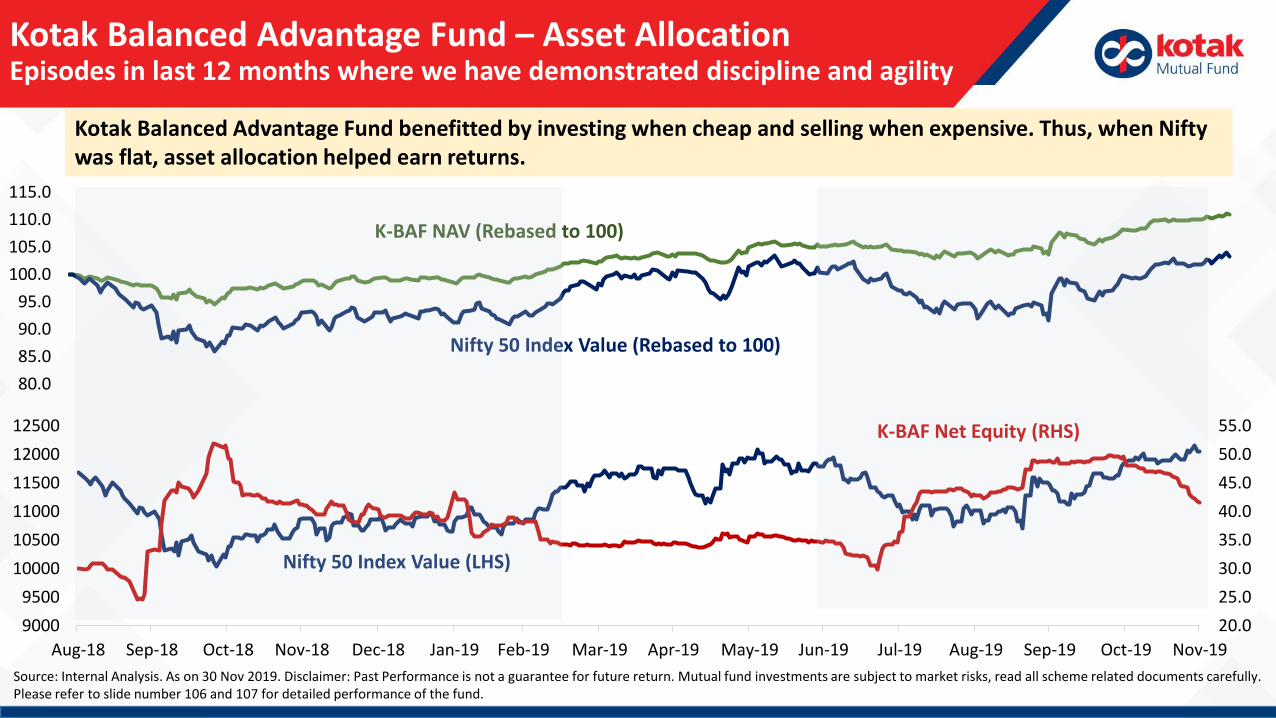
Kotak Balanced Advantage Fund – Asset AllocationEpisodes in last 12 months where we have demonstrated discipline and agility
Kotak Balanced Advantage Fund benefitted by investing when cheap and selling when expensive. Thus, when Nifty was flat, asset allocation helped earn returns.
Source: Internal Analysis. As on 30 Nov 2019. Disclaimer: Past Performance is not a guarantee for future return. Mutual fund investments are subject to market risks, read all scheme related documents carefully. Please refer to slide number 106 and 107 for detailed performance of the fund.
80.0
85.0
90.0
95.0
100.0
105.0
110.0
115.0
K-BAF NAV (Rebased to 100)
Nifty 50 Index Value (Rebased to 100)
20.0
25.0
30.0
35.0
40.0
45.0
50.0
55.0
9000
9500
10000
10500
11000
11500
12000
12500
Aug-18 Sep-18 Oct-18 Nov-18 Dec-18 Jan-19 Feb-19 Mar-19 Apr-19 May-19 Jun-19 Jul-19 Aug-19 Sep-19 Oct-19 Nov-19
Nifty 50 Index Value (LHS)
K-BAF Net Equity (RHS)
54
Debt Market Outlook December 2019
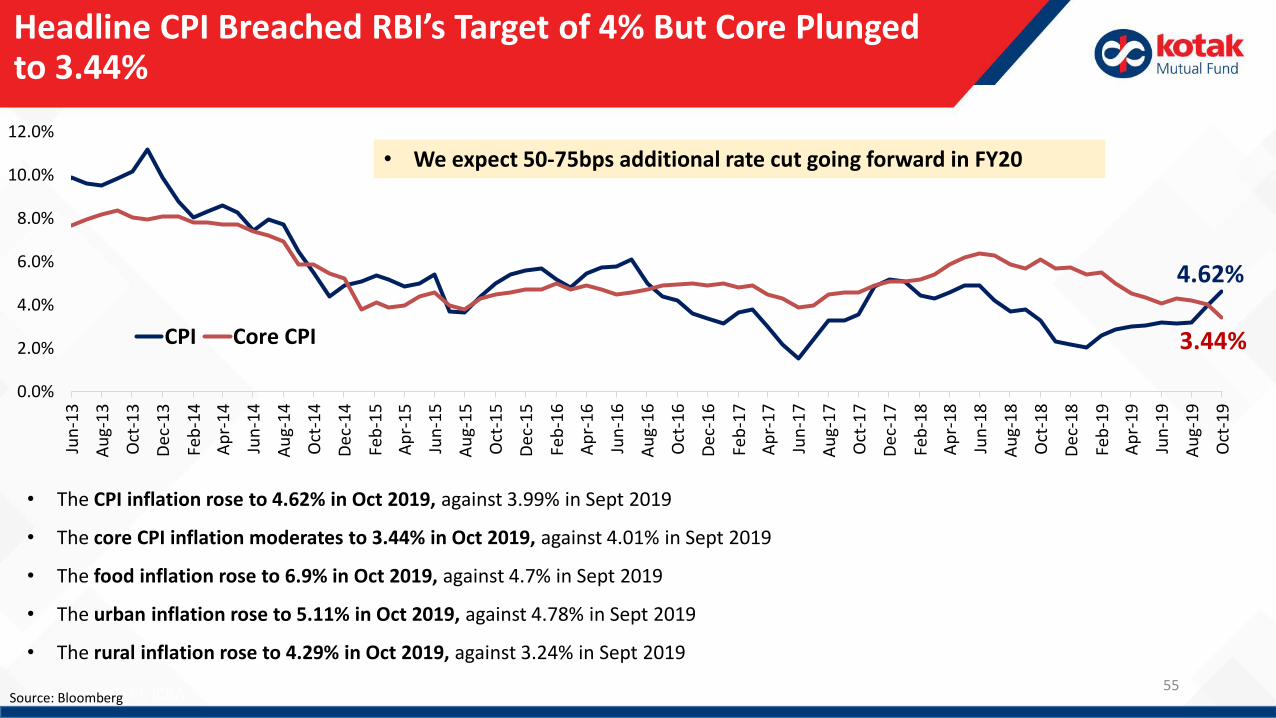
Headline CPI Breached RBI’s Target of 4% But Core Plunged to 3.44%
Source: MOSPI, ICRA
• The CPI inflation rose to 4.62% in Oct 2019, against 3.99% in Sept 2019
• The core CPI inflation moderates to 3.44% in Oct 2019, against 4.01% in Sept 2019
• The food inflation rose to 6.9% in Oct 2019, against 4.7% in Sept 2019
• The urban inflation rose to 5.11% in Oct 2019, against 4.78% in Sept 2019
• The rural inflation rose to 4.29% in Oct 2019, against 3.24% in Sept 2019
Source: Bloomberg
4.62%
3.44%
0.0%
2.0%
4.0%
6.0%
8.0%
10.0%
12.0%
Jun
-13
Au
g-1
3
Oct
-13
Dec
-13
Feb
-14
Ap
r-1
4
Jun
-14
Au
g-1
4
Oct
-14
Dec
-14
Feb
-15
Ap
r-1
5
Jun
-15
Au
g-1
5
Oct
-15
Dec
-15
Feb
-16
Ap
r-1
6
Jun
-16
Au
g-1
6
Oct
-16
Dec
-16
Feb
-17
Ap
r-1
7
Jun
-17
Au
g-1
7
Oct
-17
Dec
-17
Feb
-18
Ap
r-1
8
Jun
-18
Au
g-1
8
Oct
-18
Dec
-18
Feb
-19
Ap
r-1
9
Jun
-19
Au
g-1
9
Oct
-19
CPI Core CPI
55
• We expect 50-75bps additional rate cut going forward in FY20
56
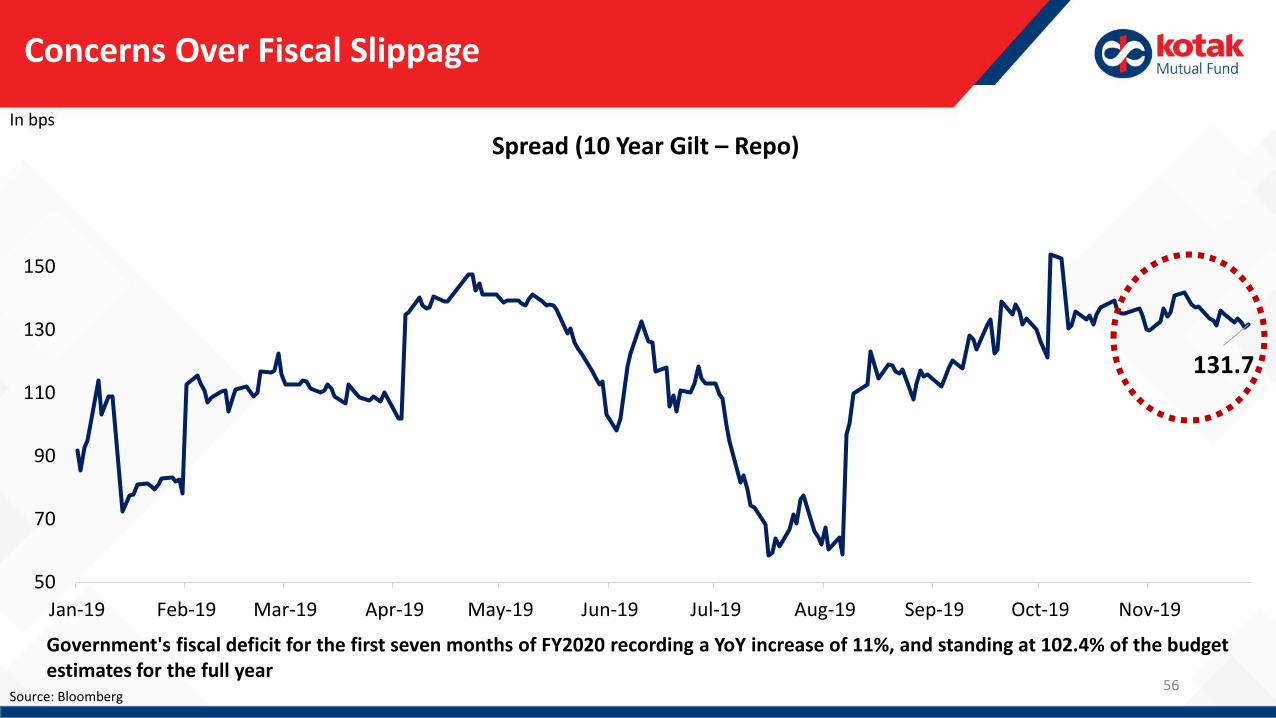
Concerns Over Fiscal Slippage
Source: Bloomberg
In bps
131.7
50
70
90
110
130
150
Jan-19 Feb-19 Mar-19 Apr-19 May-19 Jun-19 Jul-19 Aug-19 Sep-19 Oct-19 Nov-19
Spread (10 Year Gilt – Repo)
Government's fiscal deficit for the first seven months of FY2020 recording a YoY increase of 11%, and standing at 102.4% of the budget estimates for the full year
57
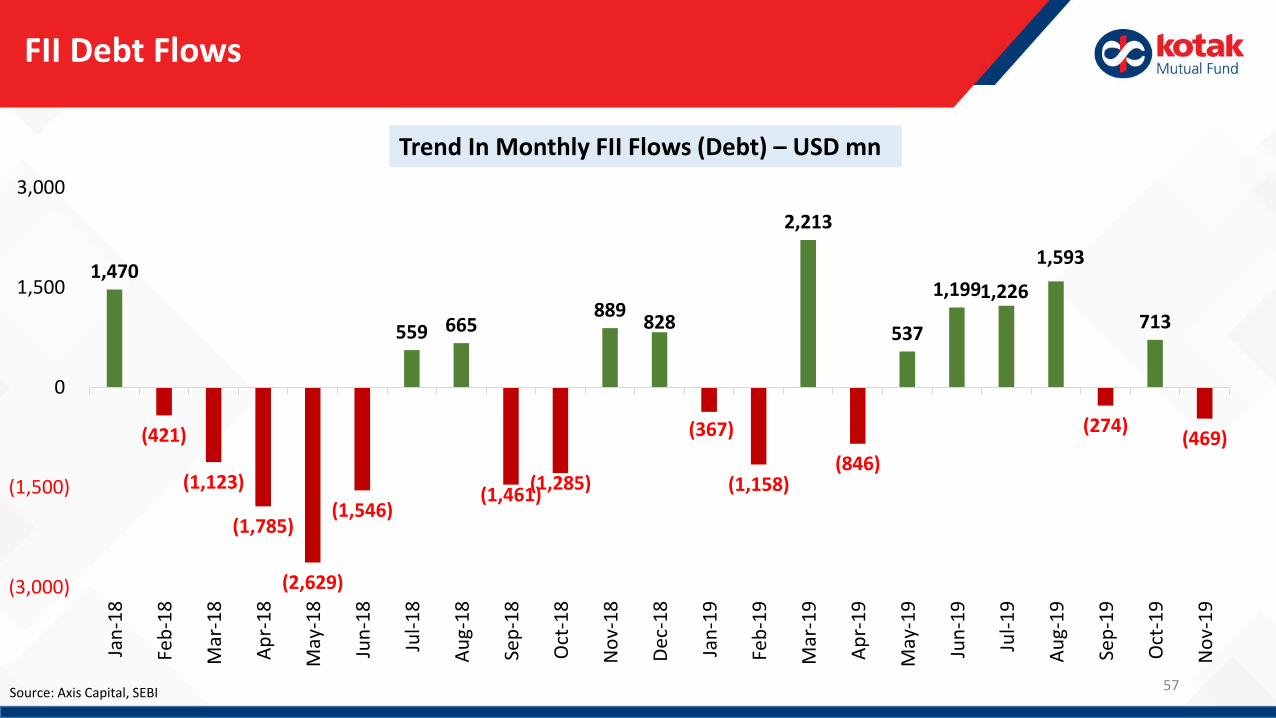
FII Debt Flows
Source: Axis Capital, SEBI
Trend In Monthly FII Flows (Debt) – USD mn
1,470
(421)
(1,123)
(1,785)
(2,629)
(1,546)
559 665
(1,461)(1,285)
889 828
(367)
(1,158)
2,213
(846)
537
1,199 1,226
1,593
(274)
713
(469)
(3,000)
(1,500)
0
1,500
3,000
Jan
-18
Feb
-18
Mar
-18
Ap
r-1
8
May
-18
Jun
-18
Jul-
18
Au
g-1
8
Sep
-18
Oct
-18
No
v-1
8
Dec
-18
Jan
-19
Feb
-19
Mar
-19
Ap
r-1
9
May
-19
Jun
-19
Jul-
19
Au
g-1
9
Sep
-19
Oct
-19
No
v-1
9
58
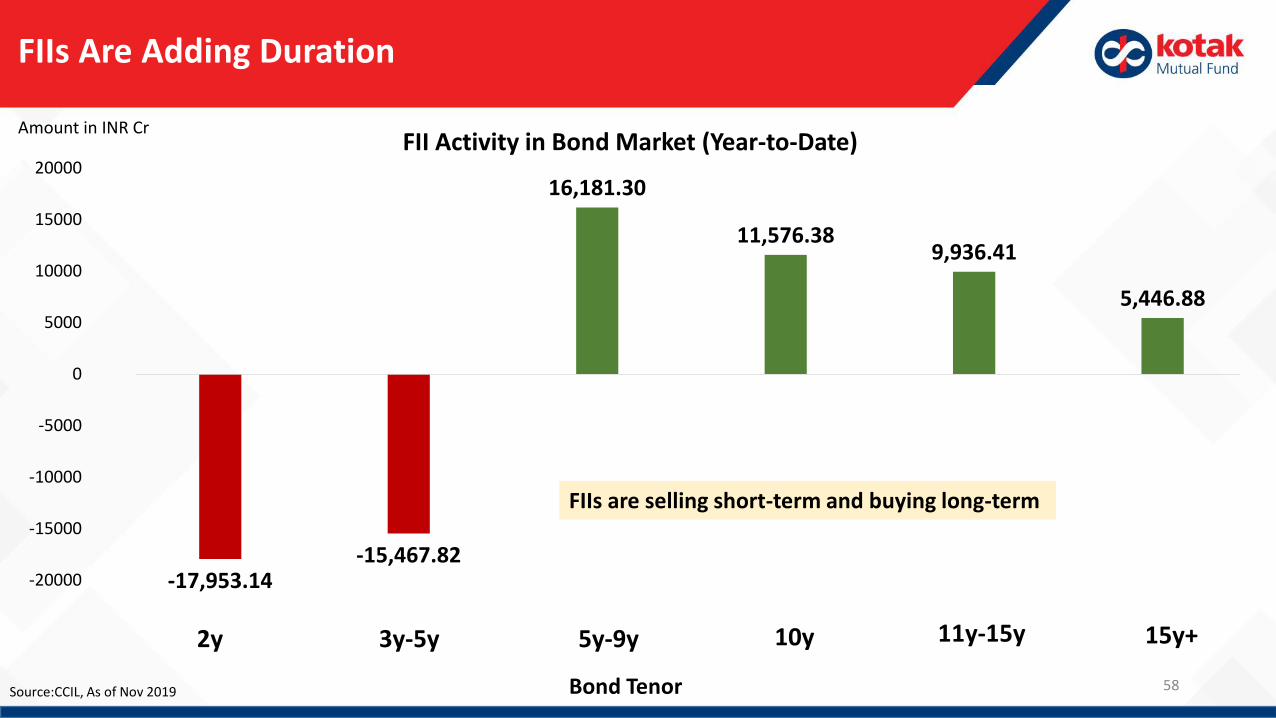
FIIs Are Adding Duration
-17,953.14-15,467.82
16,181.30
11,576.389,936.41
5,446.88
-20000
-15000
-10000
-5000
0
5000
10000
15000
20000
2y 3y-5y 5y-9y 10y 11y-15y 15y+
Amount in INR CrFII Activity in Bond Market (Year-to-Date)
Bond TenorSource:CCIL, As of Nov 2019
FIIs are selling short-term and buying long-term
59
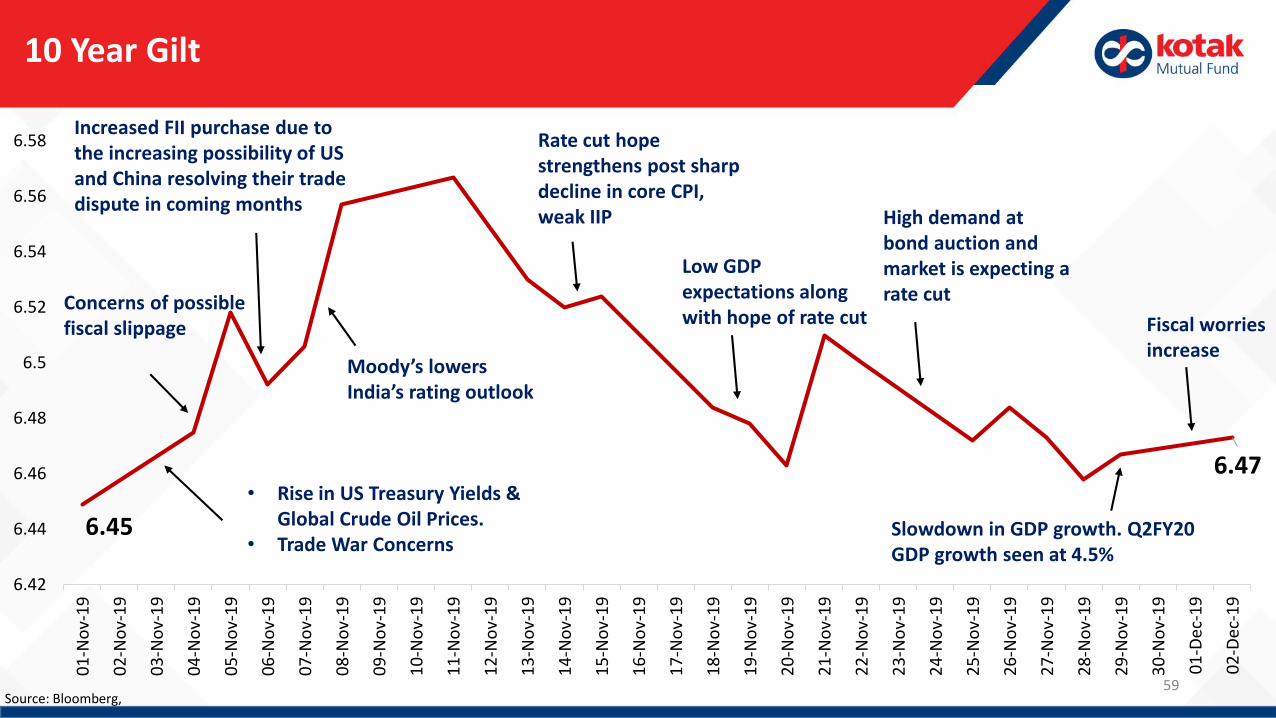
10 Year Gilt
Source: Bloomberg,
6.45
6.47
6.42
6.44
6.46
6.48
6.5
6.52
6.54
6.56
6.58
01
-No
v-1
9
02
-No
v-1
9
03
-No
v-1
9
04
-No
v-1
9
05
-No
v-1
9
06
-No
v-1
9
07
-No
v-1
9
08
-No
v-1
9
09
-No
v-1
9
10
-No
v-1
9
11
-No
v-1
9
12
-No
v-1
9
13
-No
v-1
9
14
-No
v-1
9
15
-No
v-1
9
16
-No
v-1
9
17
-No
v-1
9
18
-No
v-1
9
19
-No
v-1
9
20
-No
v-1
9
21
-No
v-1
9
22
-No
v-1
9
23
-No
v-1
9
24
-No
v-1
9
25
-No
v-1
9
26
-No
v-1
9
27
-No
v-1
9
28
-No
v-1
9
29
-No
v-1
9
30
-No
v-1
9
01
-Dec
-19
02
-Dec
-19
Rate cut hope strengthens post sharp decline in core CPI, weak IIP
Concerns of possible fiscal slippage Fiscal worries
increase
• Rise in US Treasury Yields & Global Crude Oil Prices.
• Trade War Concerns
Increased FII purchase due to the increasing possibility of US and China resolving their trade dispute in coming months
Moody’s lowers India’s rating outlook
Low GDP expectations along with hope of rate cut
Slowdown in GDP growth. Q2FY20 GDP growth seen at 4.5%
High demand at bond auction and market is expecting a rate cut
60
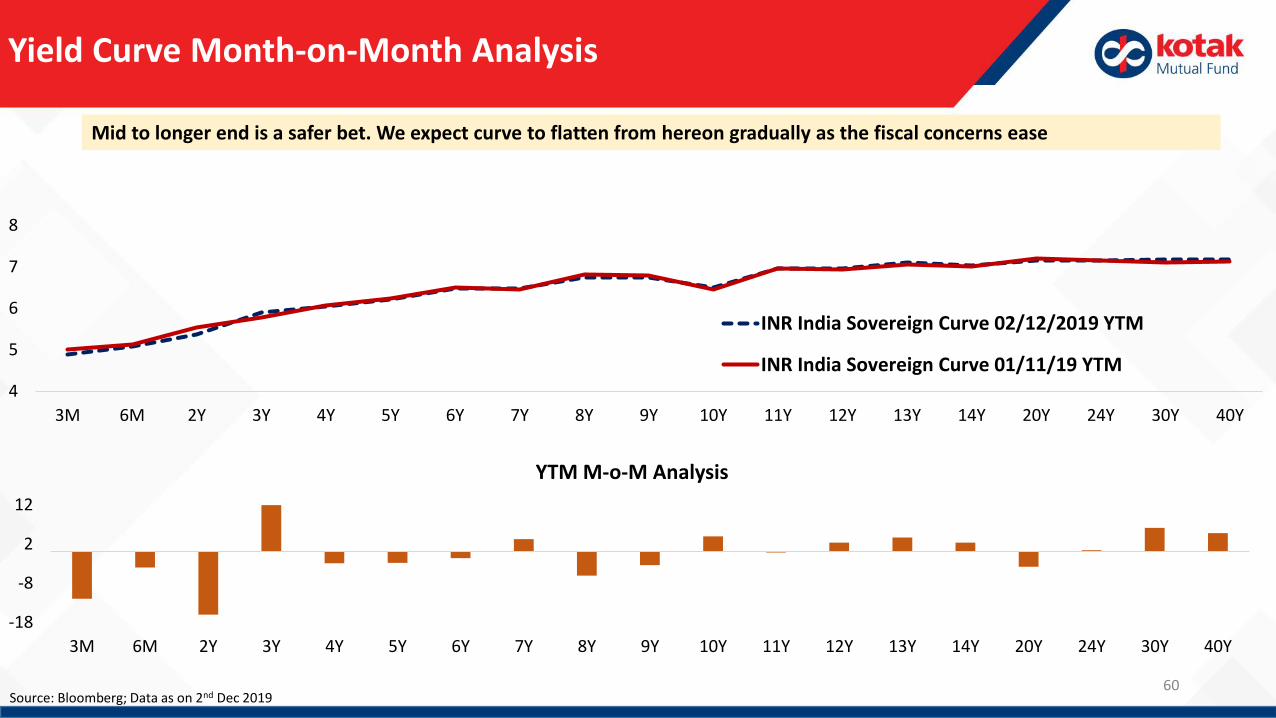
Yield Curve Month-on-Month Analysis
Source: Bloomberg; Data as on 2nd Dec 2019
Mid to longer end is a safer bet. We expect curve to flatten from hereon gradually as the fiscal concerns ease
4
5
6
7
8
3M 6M 2Y 3Y 4Y 5Y 6Y 7Y 8Y 9Y 10Y 11Y 12Y 13Y 14Y 20Y 24Y 30Y 40Y
INR India Sovereign Curve 02/12/2019 YTM
INR India Sovereign Curve 01/11/19 YTM
-18
-8
2
12
3M 6M 2Y 3Y 4Y 5Y 6Y 7Y 8Y 9Y 10Y 11Y 12Y 13Y 14Y 20Y 24Y 30Y 40Y
YTM M-o-M Analysis
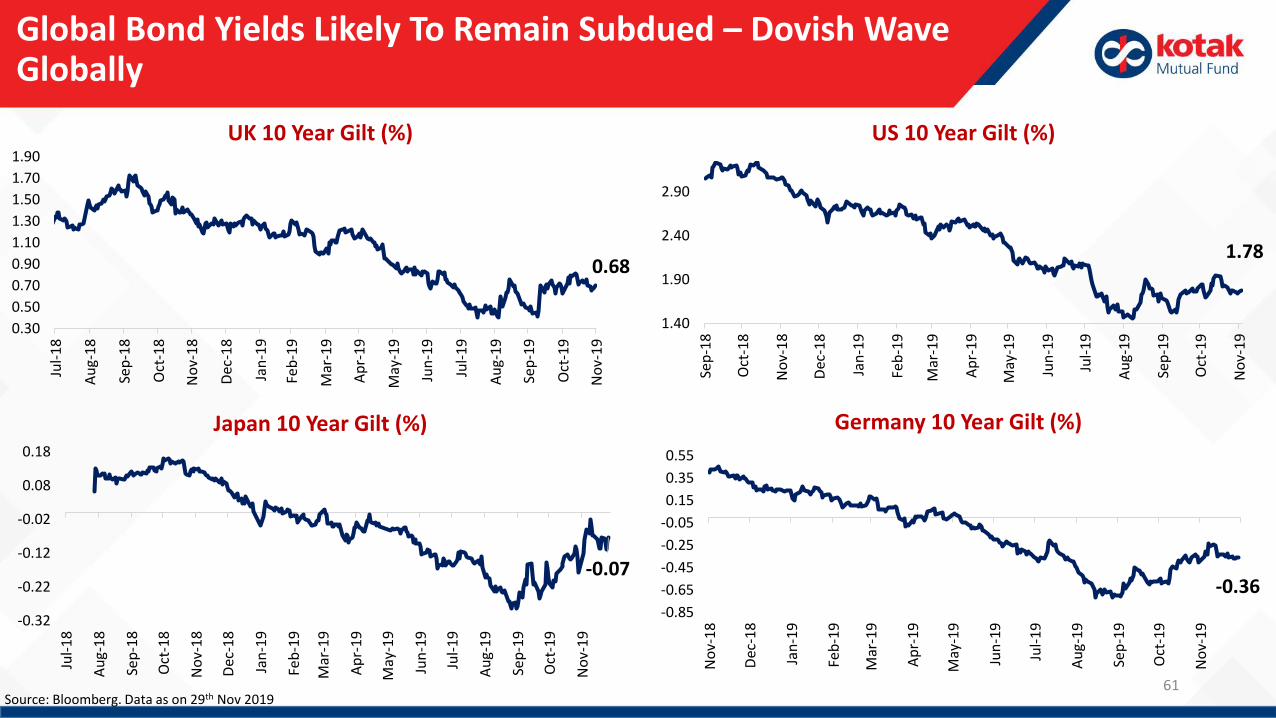
Global Bond Yields Likely To Remain Subdued – Dovish Wave Globally
Source: Bloomberg. Data as on 29th Nov 201961
0.68
0.30
0.50
0.70
0.90
1.10
1.30
1.50
1.70
1.90
Jul-
18
Au
g-1
8
Sep
-18
Oct
-18
No
v-1
8
Dec
-18
Jan
-19
Feb
-19
Mar
-19
Ap
r-1
9
May
-19
Jun
-19
Jul-
19
Au
g-1
9
Sep
-19
Oct
-19
No
v-1
9
UK 10 Year Gilt (%)
-0.36-0.85
-0.65
-0.45
-0.25
-0.05
0.15
0.35
0.55
No
v-1
8
Dec
-18
Jan
-19
Feb
-19
Mar
-19
Ap
r-1
9
May
-19
Jun
-19
Jul-
19
Au
g-1
9
Sep
-19
Oct
-19
No
v-1
9
Germany 10 Year Gilt (%)
-0.07
-0.32
-0.22
-0.12
-0.02
0.08
0.18
Jul-
18
Au
g-1
8
Sep
-18
Oct
-18
No
v-1
8
Dec
-18
Jan
-19
Feb
-19
Mar
-19
Ap
r-1
9
May
-19
Jun
-19
Jul-
19
Au
g-1
9
Sep
-19
Oct
-19
No
v-1
9
Japan 10 Year Gilt (%)
1.78
1.40
1.90
2.40
2.90
Sep
-18
Oct
-18
No
v-1
8
Dec
-18
Jan
-19
Feb
-19
Mar
-19
Ap
r-1
9
May
-19
Jun
-19
Jul-
19
Au
g-1
9
Sep
-19
Oct
-19
No
v-1
9
US 10 Year Gilt (%)
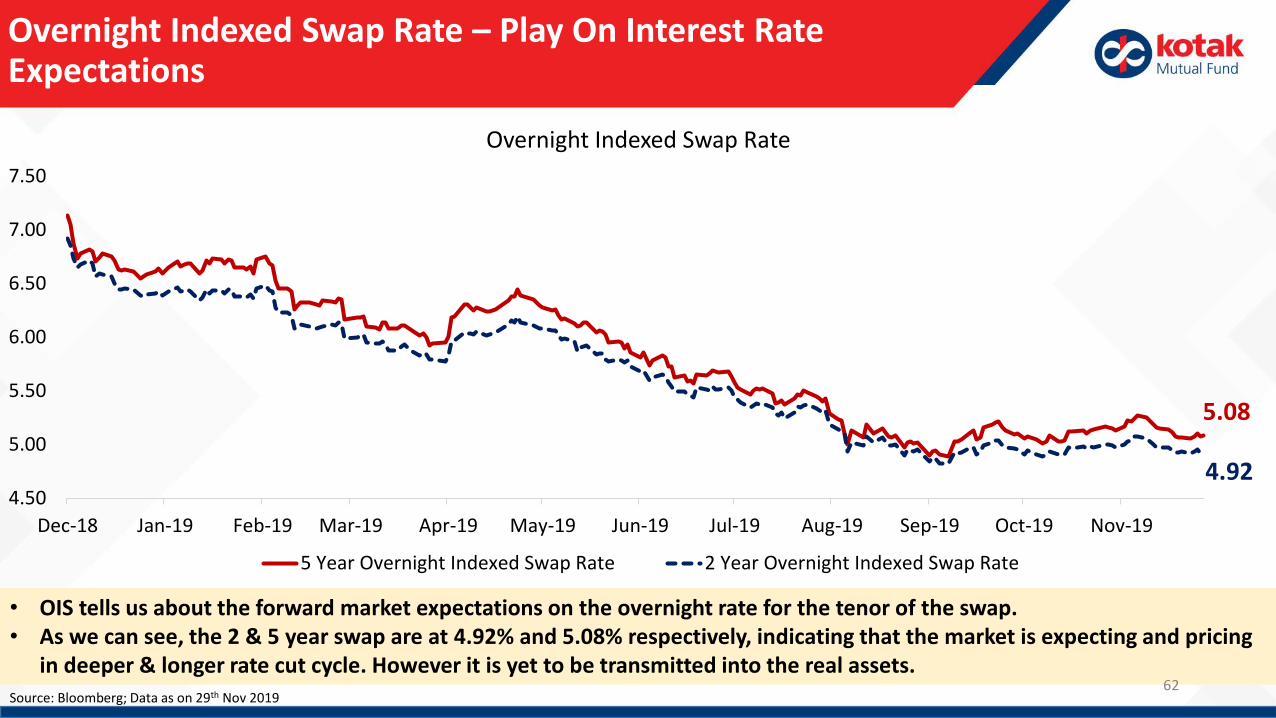
Overnight Indexed Swap Rate – Play On Interest Rate Expectations
Source: Bloomberg; Data as on 29th Nov 2019
• OIS tells us about the forward market expectations on the overnight rate for the tenor of the swap. • As we can see, the 2 & 5 year swap are at 4.92% and 5.08% respectively, indicating that the market is expecting and pricing
in deeper & longer rate cut cycle. However it is yet to be transmitted into the real assets. 62
5.08
4.924.50
5.00
5.50
6.00
6.50
7.00
7.50
Dec-18 Jan-19 Feb-19 Mar-19 Apr-19 May-19 Jun-19 Jul-19 Aug-19 Sep-19 Oct-19 Nov-19
Overnight Indexed Swap Rate
5 Year Overnight Indexed Swap Rate 2 Year Overnight Indexed Swap Rate
63
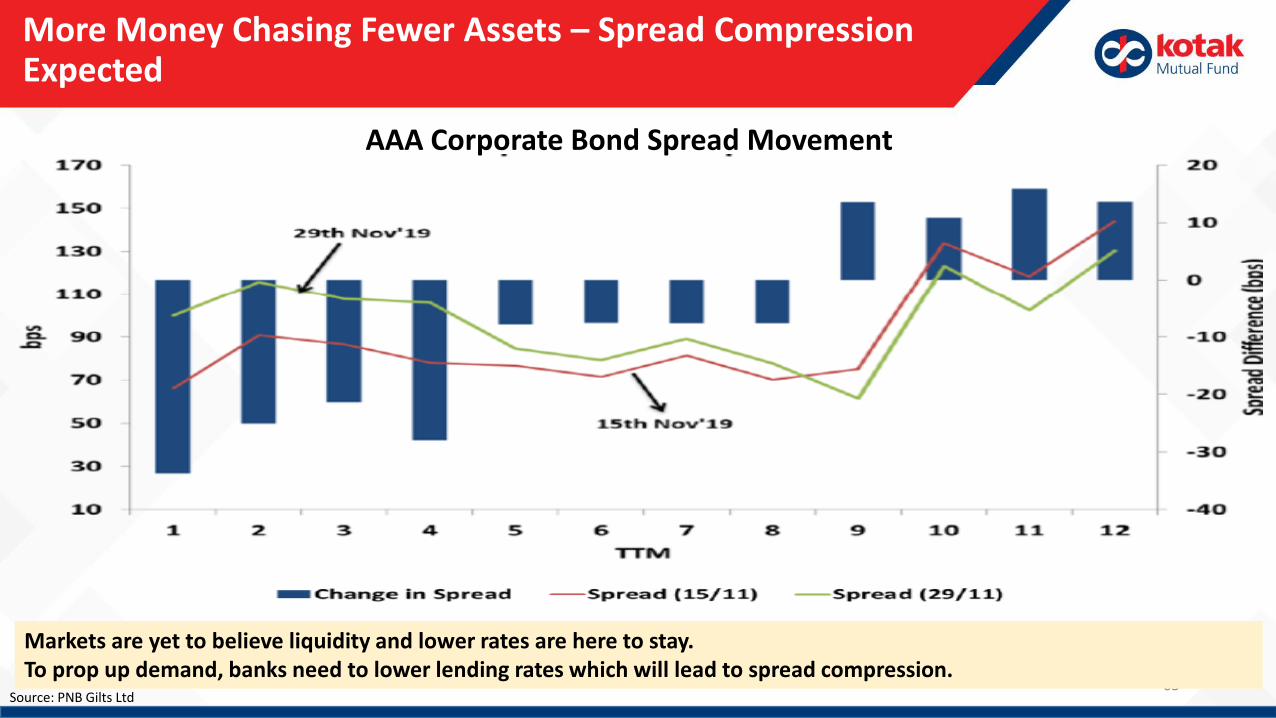
More Money Chasing Fewer Assets – Spread Compression Expected
Source: PNB Gilts Ltd
Markets are yet to believe liquidity and lower rates are here to stay. To prop up demand, banks need to lower lending rates which will lead to spread compression.
AAA Corporate Bond Spread Movement
64
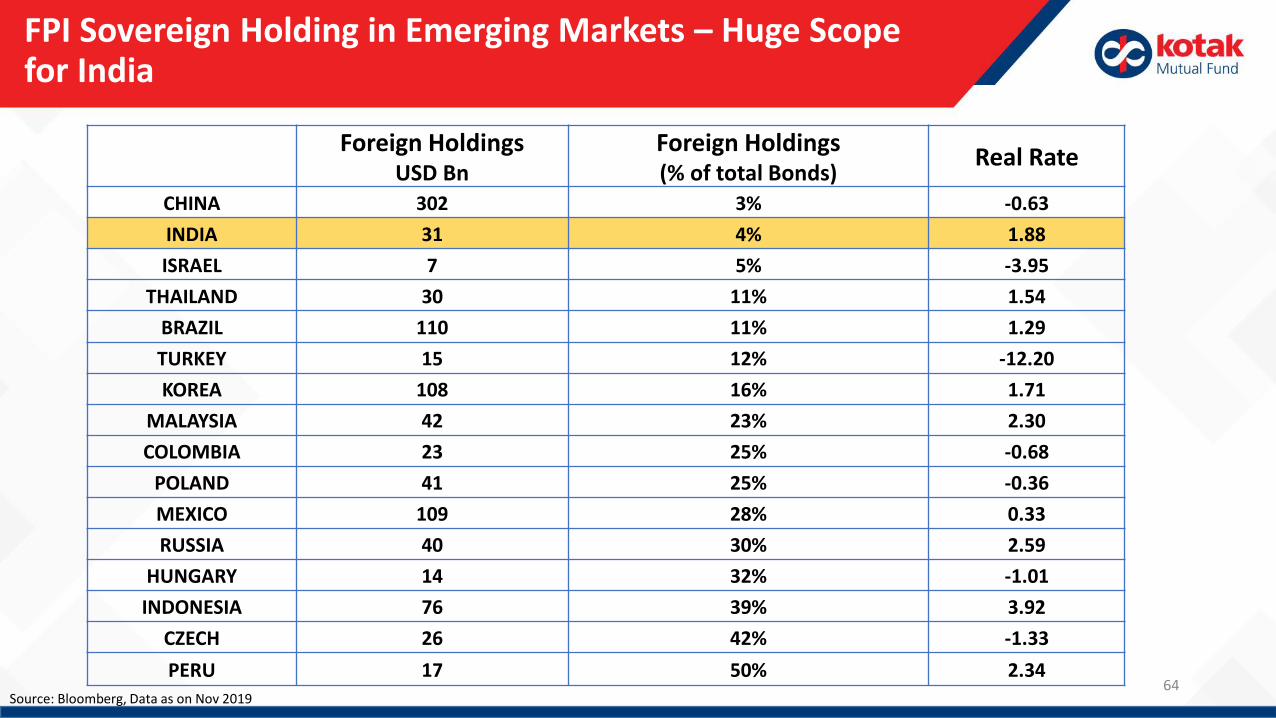
FPI Sovereign Holding in Emerging Markets – Huge Scope for India
Foreign Holdings USD Bn
Foreign Holdings (% of total Bonds)
Real Rate
CHINA 302 3% -0.63
INDIA 31 4% 1.88
ISRAEL 7 5% -3.95
THAILAND 30 11% 1.54
BRAZIL 110 11% 1.29
TURKEY 15 12% -12.20
KOREA 108 16% 1.71
MALAYSIA 42 23% 2.30
COLOMBIA 23 25% -0.68
POLAND 41 25% -0.36
MEXICO 109 28% 0.33
RUSSIA 40 30% 2.59
HUNGARY 14 32% -1.01
INDONESIA 76 39% 3.92
CZECH 26 42% -1.33
PERU 17 50% 2.34Source: Bloomberg, Data as on Nov 2019
Debt Outlook
65
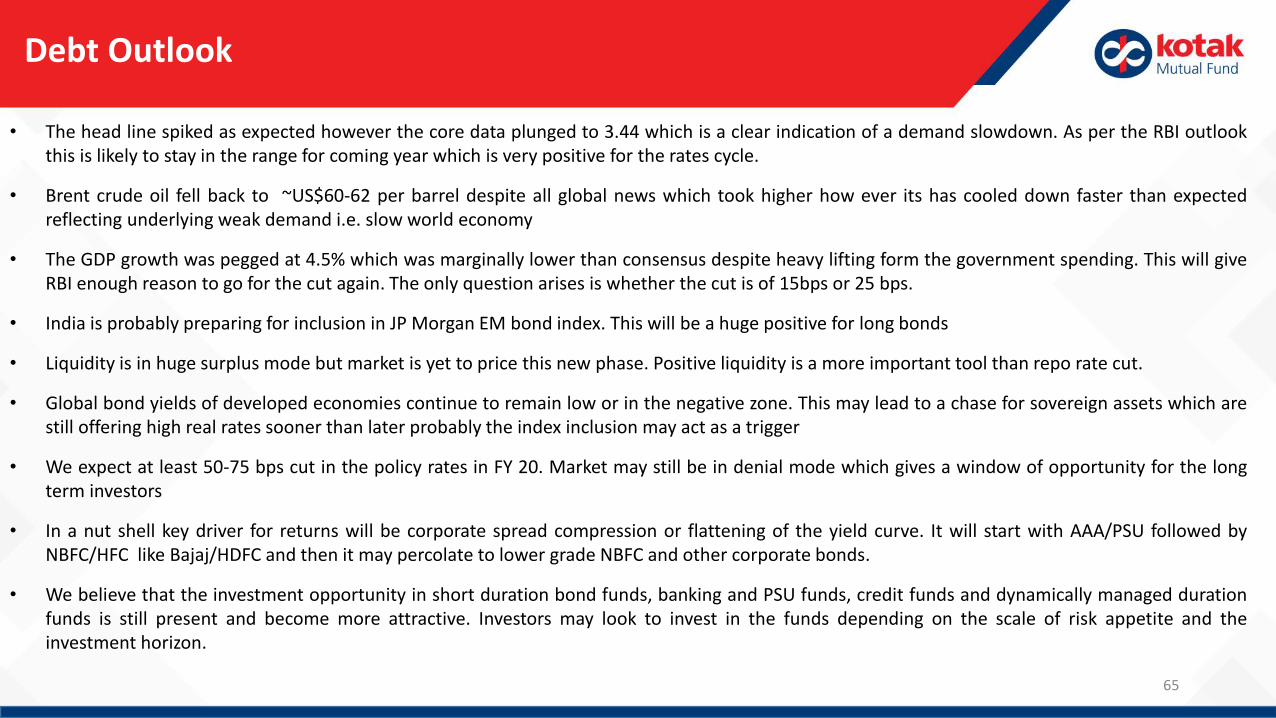
• The head line spiked as expected however the core data plunged to 3.44 which is a clear indication of a demand slowdown. As per the RBI outlookthis is likely to stay in the range for coming year which is very positive for the rates cycle.
• Brent crude oil fell back to ~US$60-62 per barrel despite all global news which took higher how ever its has cooled down faster than expectedreflecting underlying weak demand i.e. slow world economy
• The GDP growth was pegged at 4.5% which was marginally lower than consensus despite heavy lifting form the government spending. This will giveRBI enough reason to go for the cut again. The only question arises is whether the cut is of 15bps or 25 bps.
• India is probably preparing for inclusion in JP Morgan EM bond index. This will be a huge positive for long bonds
• Liquidity is in huge surplus mode but market is yet to price this new phase. Positive liquidity is a more important tool than repo rate cut.
• Global bond yields of developed economies continue to remain low or in the negative zone. This may lead to a chase for sovereign assets which arestill offering high real rates sooner than later probably the index inclusion may act as a trigger
• We expect at least 50-75 bps cut in the policy rates in FY 20. Market may still be in denial mode which gives a window of opportunity for the longterm investors
• In a nut shell key driver for returns will be corporate spread compression or flattening of the yield curve. It will start with AAA/PSU followed byNBFC/HFC like Bajaj/HDFC and then it may percolate to lower grade NBFC and other corporate bonds.
• We believe that the investment opportunity in short duration bond funds, banking and PSU funds, credit funds and dynamically managed durationfunds is still present and become more attractive. Investors may look to invest in the funds depending on the scale of risk appetite and theinvestment horizon.

66
Investment Opportunity
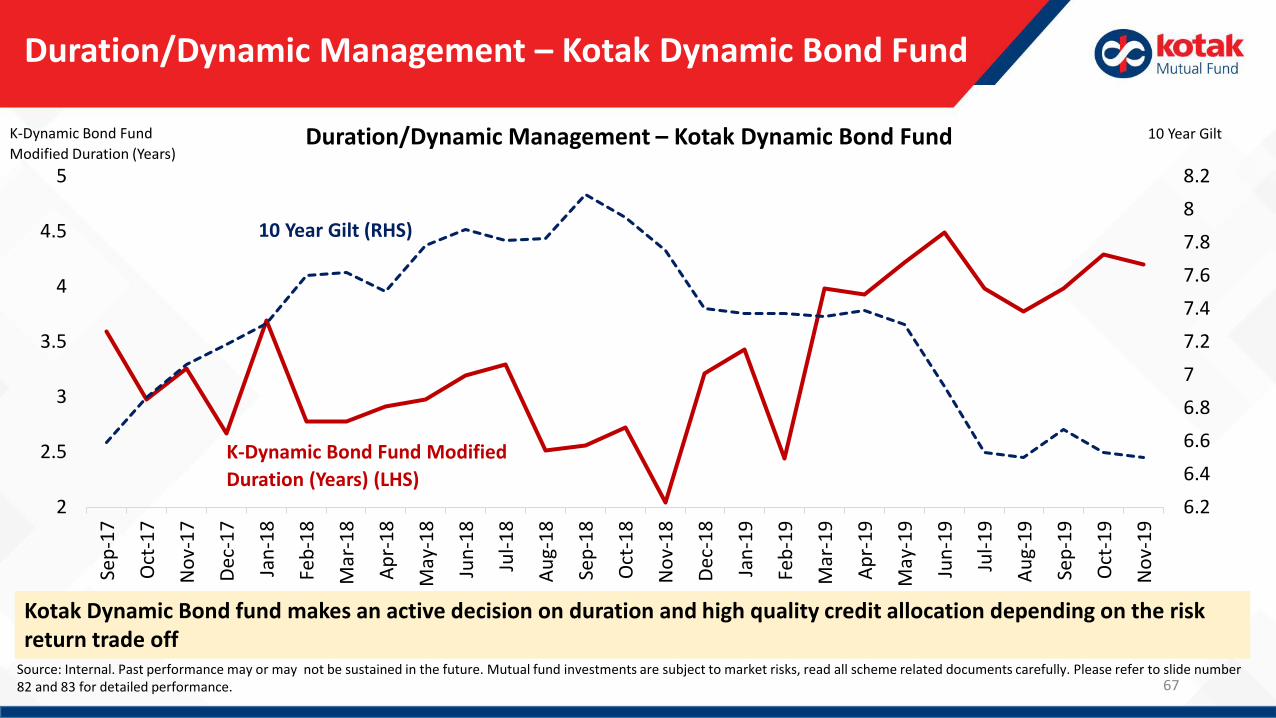
Duration/Dynamic Management – Kotak Dynamic Bond Fund
6.2
6.4
6.6
6.8
7
7.2
7.4
7.6
7.8
8
8.2
2
2.5
3
3.5
4
4.5
5
Sep
-17
Oct
-17
No
v-1
7
Dec
-17
Jan
-18
Feb
-18
Mar
-18
Ap
r-1
8
May
-18
Jun
-18
Jul-
18
Au
g-1
8
Sep
-18
Oct
-18
No
v-1
8
Dec
-18
Jan
-19
Feb
-19
Mar
-19
Ap
r-1
9
May
-19
Jun
-19
Jul-
19
Au
g-1
9
Sep
-19
Oct
-19
No
v-1
9
Duration/Dynamic Management – Kotak Dynamic Bond Fund
K-Dynamic Bond Fund Modified
Duration (Years) (LHS)
K-Dynamic Bond Fund
Modified Duration (Years)
10 Year Gilt
Kotak Dynamic Bond fund makes an active decision on duration and high quality credit allocation depending on the risk return trade off
Source: Internal. Past performance may or may not be sustained in the future. Mutual fund investments are subject to market risks, read all scheme related documents carefully. Please refer to slide number 82 and 83 for detailed performance.
10 Year Gilt (RHS)
67
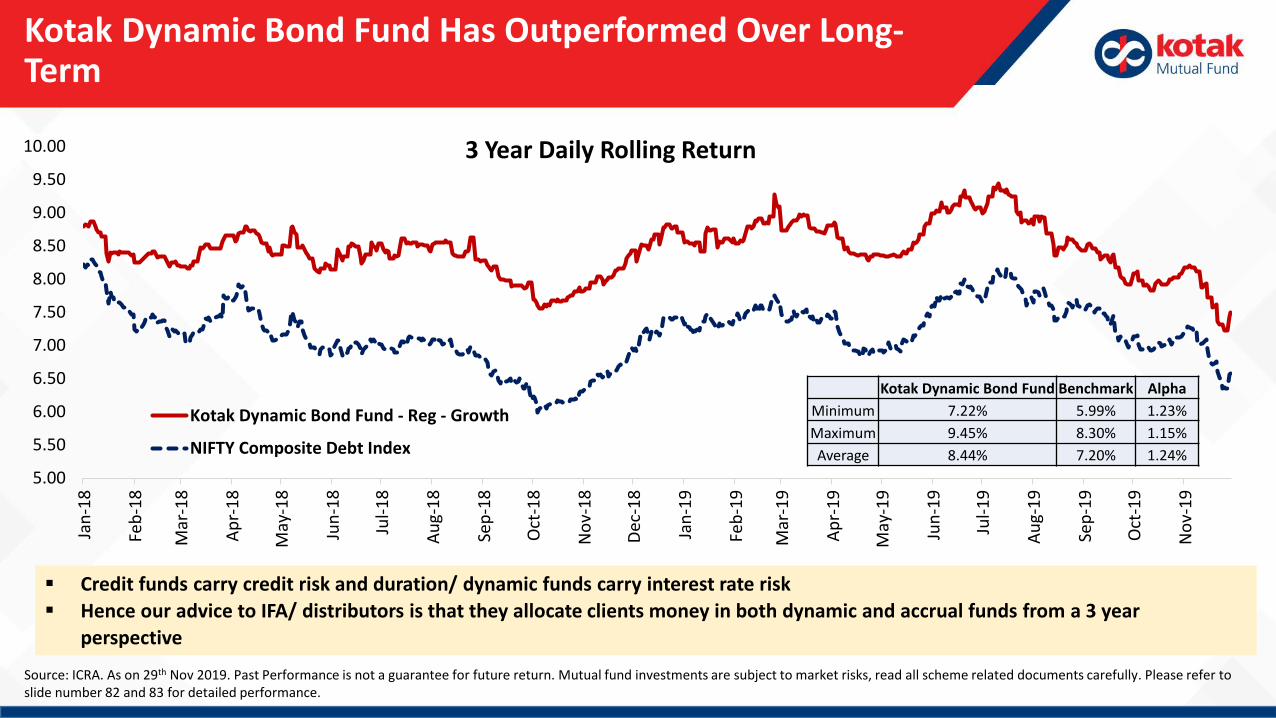
Kotak Dynamic Bond Fund Has Outperformed Over Long-Term
Credit funds carry credit risk and duration/ dynamic funds carry interest rate risk
Hence our advice to IFA/ distributors is that they allocate clients money in both dynamic and accrual funds from a 3 year
perspective
Source: ICRA. As on 29th Nov 2019. Past Performance is not a guarantee for future return. Mutual fund investments are subject to market risks, read all scheme related documents carefully. Please refer to slide number 82 and 83 for detailed performance.
5.00
5.50
6.00
6.50
7.00
7.50
8.00
8.50
9.00
9.50
10.00
Jan
-18
Feb
-18
Mar
-18
Ap
r-1
8
May
-18
Jun
-18
Jul-
18
Au
g-1
8
Sep
-18
Oct
-18
No
v-1
8
Dec
-18
Jan
-19
Feb
-19
Mar
-19
Ap
r-1
9
May
-19
Jun
-19
Jul-
19
Au
g-1
9
Sep
-19
Oct
-19
No
v-1
9
Kotak Dynamic Bond Fund - Reg - Growth
NIFTY Composite Debt Index
3 Year Daily Rolling Return
Kotak Dynamic Bond Fund Benchmark Alpha
Minimum 7.22% 5.99% 1.23%
Maximum 9.45% 8.30% 1.15%
Average 8.44% 7.20% 1.24%
69
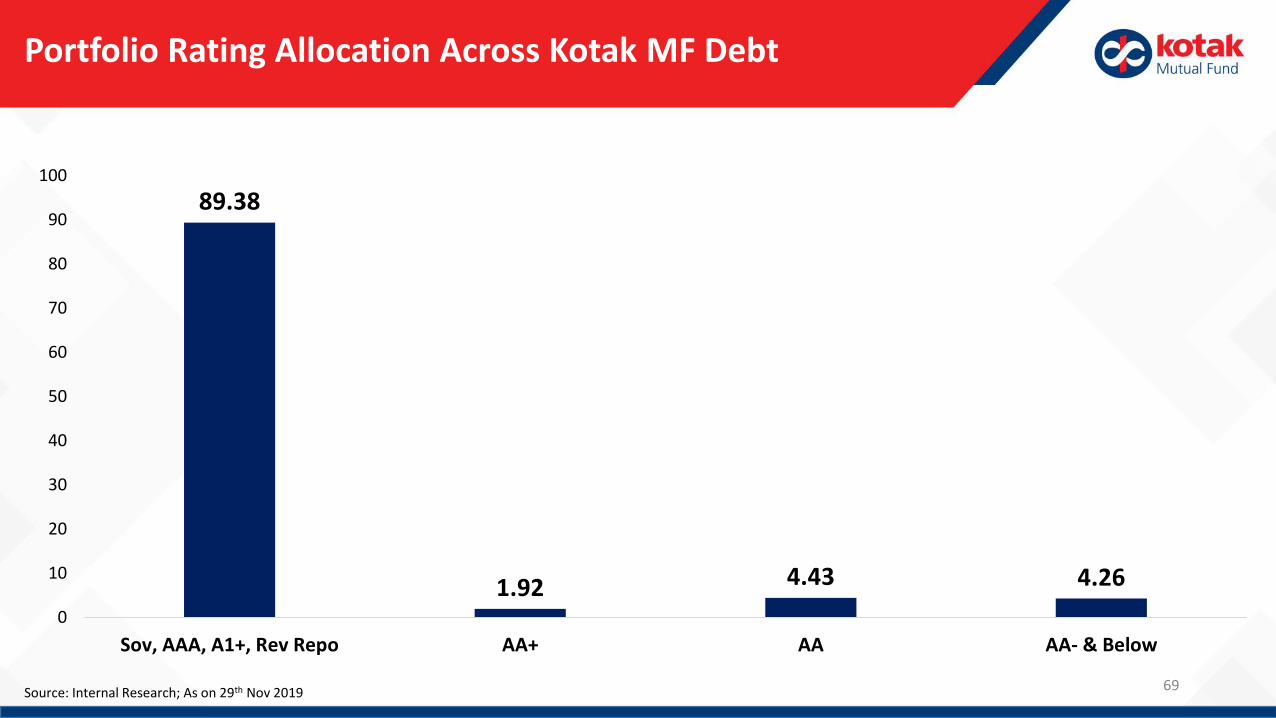
Portfolio Rating Allocation Across Kotak MF Debt
Source: Internal Research; As on 29th Nov 2019
89.38
1.92 4.43 4.26
0
10
20
30
40
50
60
70
80
90
100
Sov, AAA, A1+, Rev Repo AA+ AA AA- & Below
70
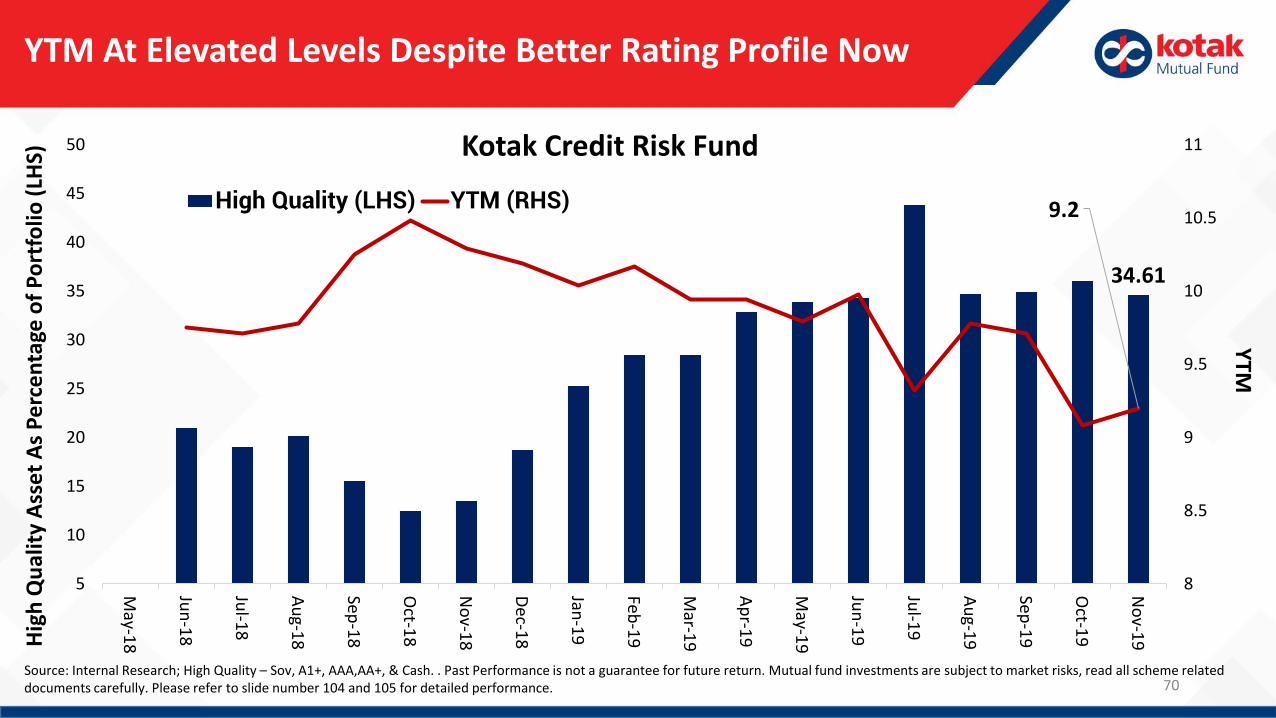
YTM At Elevated Levels Despite Better Rating Profile NowH
igh
Qu
alit
y A
sse
t A
s P
erc
en
tage
of
Po
rtfo
lio (
LHS)
Source: Internal Research; High Quality – Sov, A1+, AAA,AA+, & Cash. . Past Performance is not a guarantee for future return. Mutual fund investments are subject to market risks, read all scheme related documents carefully. Please refer to slide number 104 and 105 for detailed performance.
YTM
Kotak Credit Risk Fund
34.61
9.2
8
8.5
9
9.5
10
10.5
11
5
10
15
20
25
30
35
40
45
50
May-1
8
Jun
-18
Jul-1
8
Au
g-18
Sep-1
8
Oct-1
8
No
v-18
Dec-1
8
Jan-1
9
Feb-1
9
Mar-1
9
Ap
r-19
May-1
9
Jun
-19
Jul-1
9
Au
g-19
Sep-1
9
Oct-1
9
No
v-19
High Quality (LHS) YTM (RHS)
71
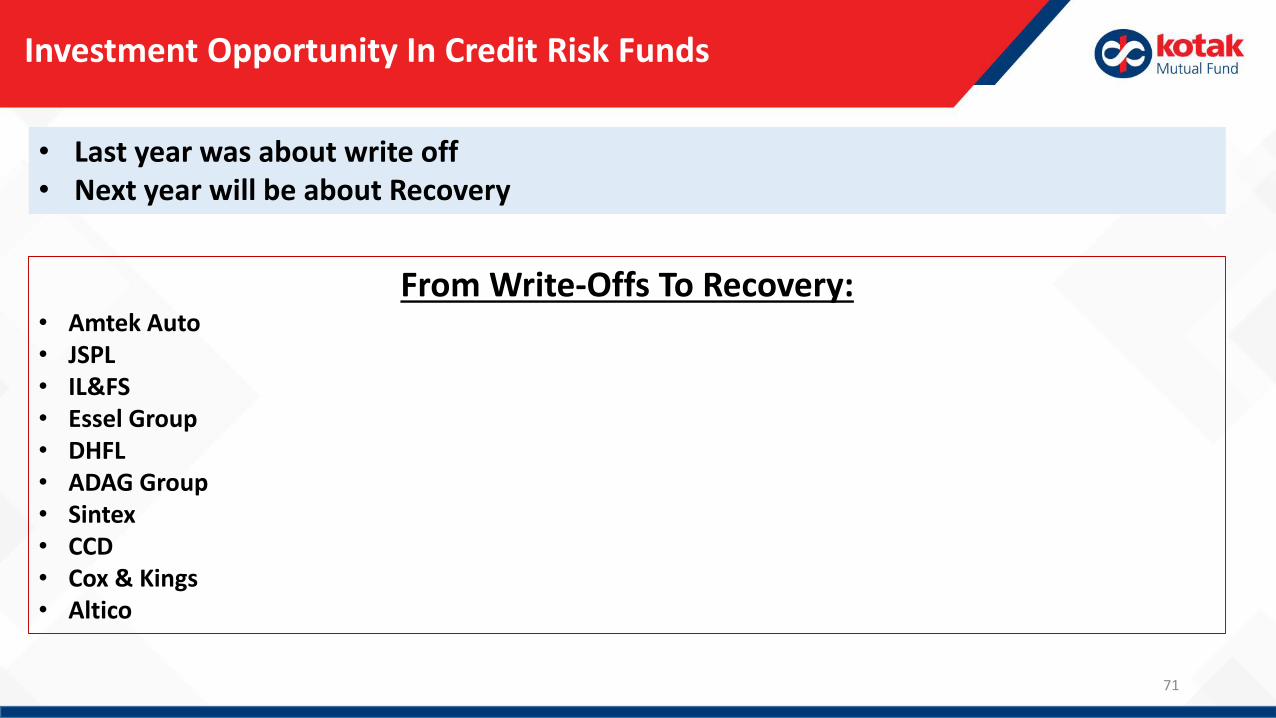
Investment Opportunity In Credit Risk Funds
• Last year was about write off• Next year will be about Recovery
From Write-Offs To Recovery: • Amtek Auto• JSPL• IL&FS• Essel Group• DHFL• ADAG Group• Sintex• CCD• Cox & Kings • Altico
Story in Accruals
72
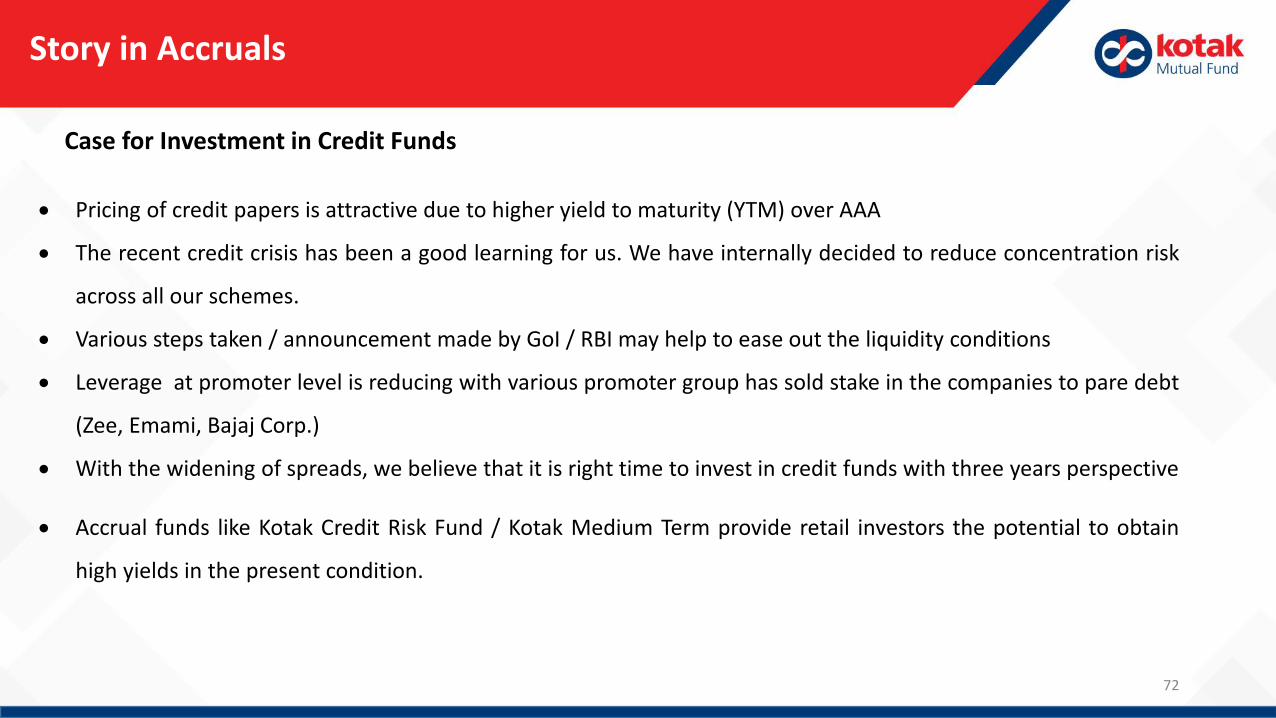
Case for Investment in Credit Funds
Pricing of credit papers is attractive due to higher yield to maturity (YTM) over AAA
The recent credit crisis has been a good learning for us. We have internally decided to reduce concentration risk
across all our schemes.
Various steps taken / announcement made by GoI / RBI may help to ease out the liquidity conditions
Leverage at promoter level is reducing with various promoter group has sold stake in the companies to pare debt
(Zee, Emami, Bajaj Corp.)
With the widening of spreads, we believe that it is right time to invest in credit funds with three years perspective
Accrual funds like Kotak Credit Risk Fund / Kotak Medium Term provide retail investors the potential to obtain
high yields in the present condition.
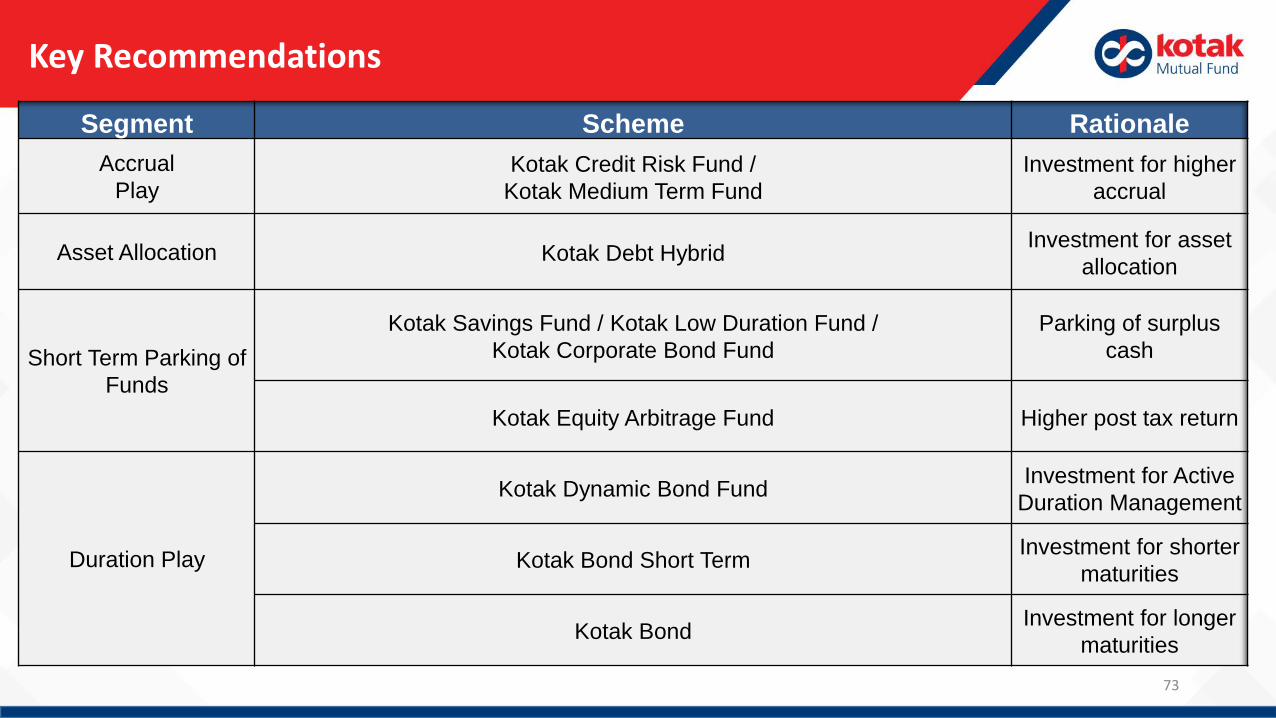
Key Recommendations
Segment Scheme Rationale
Accrual
PlayKotak Credit Risk Fund /
Kotak Medium Term Fund
Investment for higher
accrual
Asset Allocation Kotak Debt HybridInvestment for asset
allocation
Short Term Parking of
Funds
Kotak Savings Fund / Kotak Low Duration Fund /
Kotak Corporate Bond Fund
Parking of surplus
cash
Kotak Equity Arbitrage Fund Higher post tax return
Duration Play
Kotak Dynamic Bond FundInvestment for Active
Duration Management
Kotak Bond Short TermInvestment for shorter
maturities
Kotak BondInvestment for longer
maturities
73

ANNEXURES
74
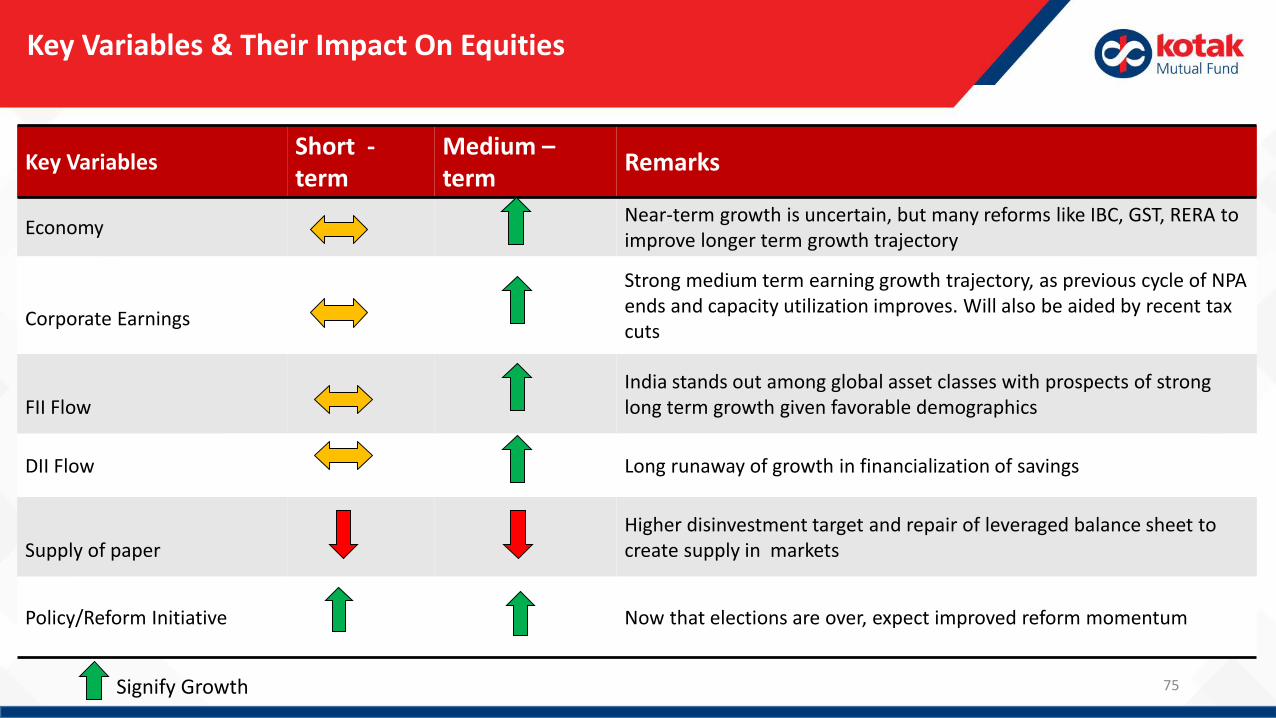
Key Variables & Their Impact On Equities
Key VariablesShort -term
Medium –term
Remarks
EconomyNear-term growth is uncertain, but many reforms like IBC, GST, RERA to improve longer term growth trajectory
Corporate Earnings
Strong medium term earning growth trajectory, as previous cycle of NPA ends and capacity utilization improves. Will also be aided by recent tax cuts
FII FlowIndia stands out among global asset classes with prospects of strong long term growth given favorable demographics
DII Flow Long runaway of growth in financialization of savings
Supply of paperHigher disinvestment target and repair of leveraged balance sheet to create supply in markets
Policy/Reform Initiative Now that elections are over, expect improved reform momentum
Signify Growth 75
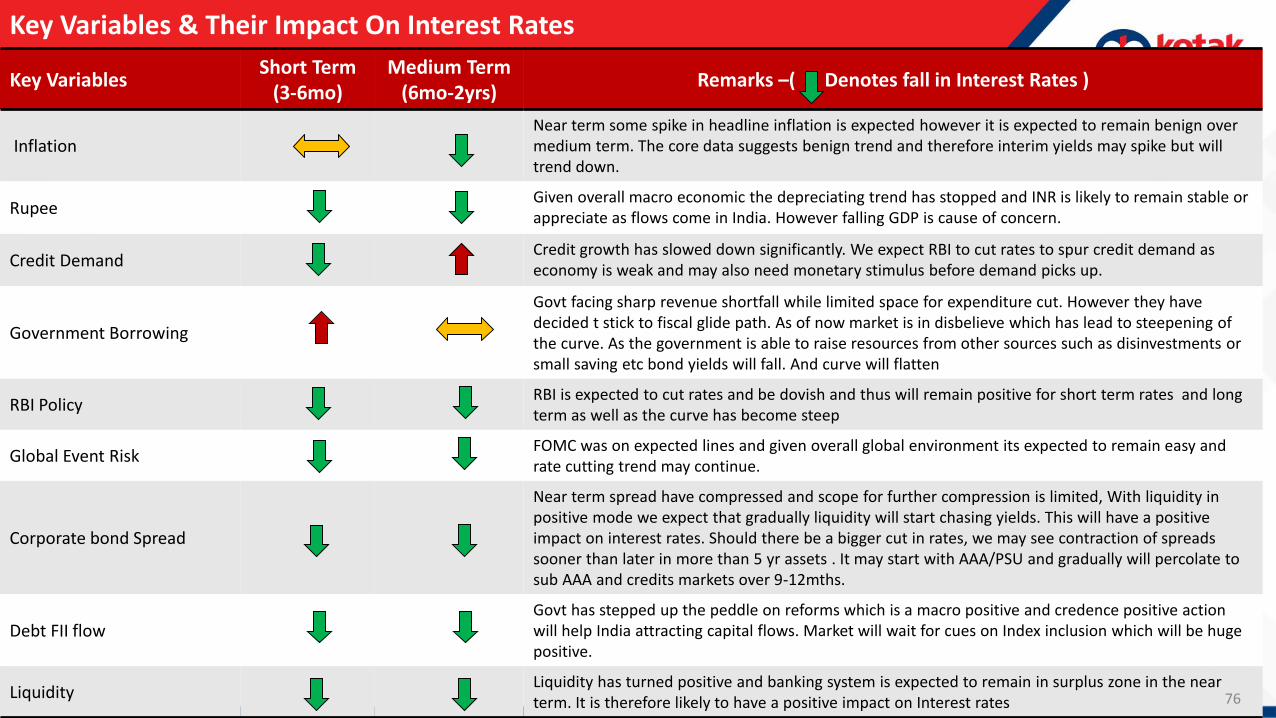
Key Variables & Their Impact On Interest Rates
Key VariablesShort Term
(3-6mo)Medium Term
(6mo-2yrs)Remarks –( Denotes fall in Interest Rates )
InflationNear term some spike in headline inflation is expected however it is expected to remain benign over medium term. The core data suggests benign trend and therefore interim yields may spike but will trend down.
RupeeGiven overall macro economic the depreciating trend has stopped and INR is likely to remain stable or appreciate as flows come in India. However falling GDP is cause of concern.
Credit DemandCredit growth has slowed down significantly. We expect RBI to cut rates to spur credit demand as economy is weak and may also need monetary stimulus before demand picks up.
Government Borrowing
Govt facing sharp revenue shortfall while limited space for expenditure cut. However they have decided t stick to fiscal glide path. As of now market is in disbelieve which has lead to steepening of the curve. As the government is able to raise resources from other sources such as disinvestments or small saving etc bond yields will fall. And curve will flatten
RBI PolicyRBI is expected to cut rates and be dovish and thus will remain positive for short term rates and long term as well as the curve has become steep
Global Event RiskFOMC was on expected lines and given overall global environment its expected to remain easy and rate cutting trend may continue.
Corporate bond Spread
Near term spread have compressed and scope for further compression is limited, With liquidity in positive mode we expect that gradually liquidity will start chasing yields. This will have a positive impact on interest rates. Should there be a bigger cut in rates, we may see contraction of spreads sooner than later in more than 5 yr assets . It may start with AAA/PSU and gradually will percolate to sub AAA and credits markets over 9-12mths.
Debt FII flowGovt has stepped up the peddle on reforms which is a macro positive and credence positive action will help India attracting capital flows. Market will wait for cues on Index inclusion which will be huge positive.
LiquidityLiquidity has turned positive and banking system is expected to remain in surplus zone in the near term. It is therefore likely to have a positive impact on Interest rates 76
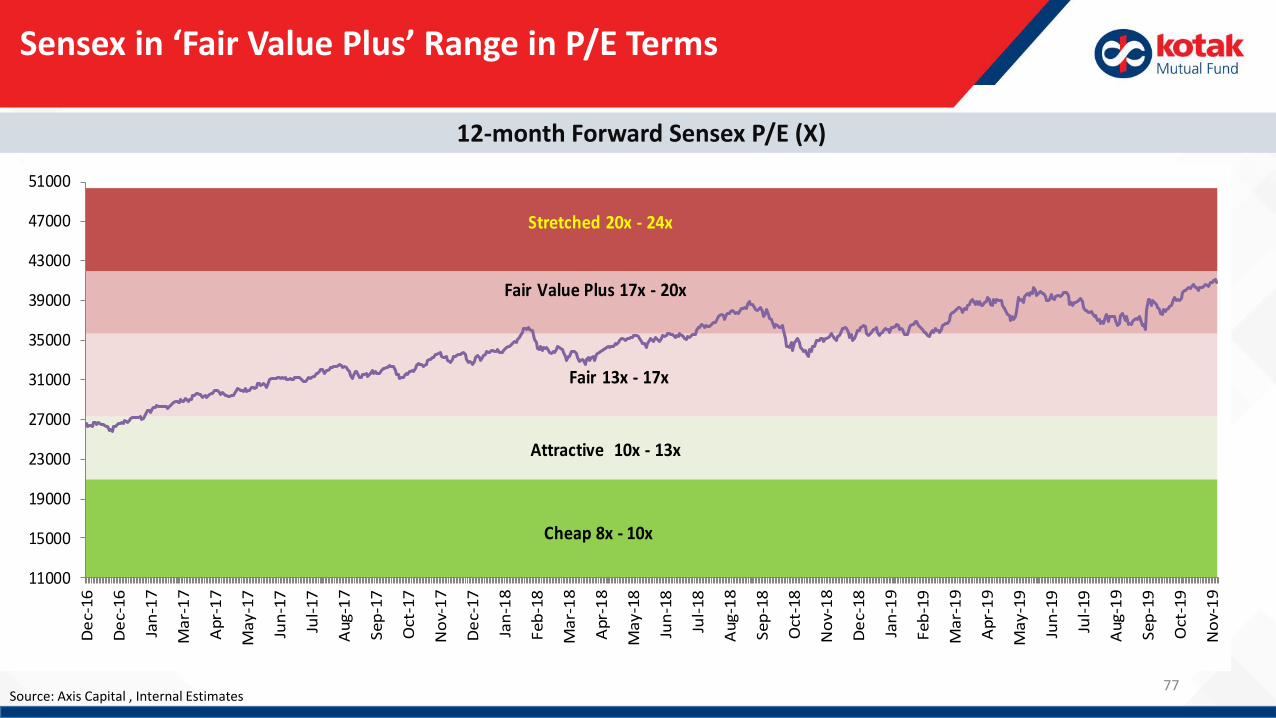
12-month Forward Sensex P/E (X)
Sensex in ‘Fair Value Plus’ Range in P/E Terms
Source: Axis Capital , Internal Estimates77
11000
15000
19000
23000
27000
31000
35000
39000
43000
47000
51000
De
c-1
6
De
c-1
6
Jan
-17
Ma
r-1
7
Ap
r-1
7
Ma
y-1
7
Jun
-17
Jul-
17
Au
g-1
7
Se
p-1
7
Oct
-17
No
v-1
7
De
c-1
7
Jan
-18
Fe
b-1
8
Ma
r-1
8
Ap
r-1
8
Ma
y-1
8
Jun
-18
Jul-
18
Au
g-1
8
Se
p-1
8
Oct
-18
No
v-1
8
De
c-1
8
Jan
-19
Fe
b-1
9
Ma
r-1
9
Ap
r-1
9
Ma
y-1
9
Jun
-19
Jul-
19
Au
g-1
9
Se
p-1
9
Oct
-19
No
v-1
9
Cheap 8x - 10x
Attractive 10x - 13x
Fair 13x - 17x
Fair Value Plus 17x - 20x
Stretched 20x - 24x
78
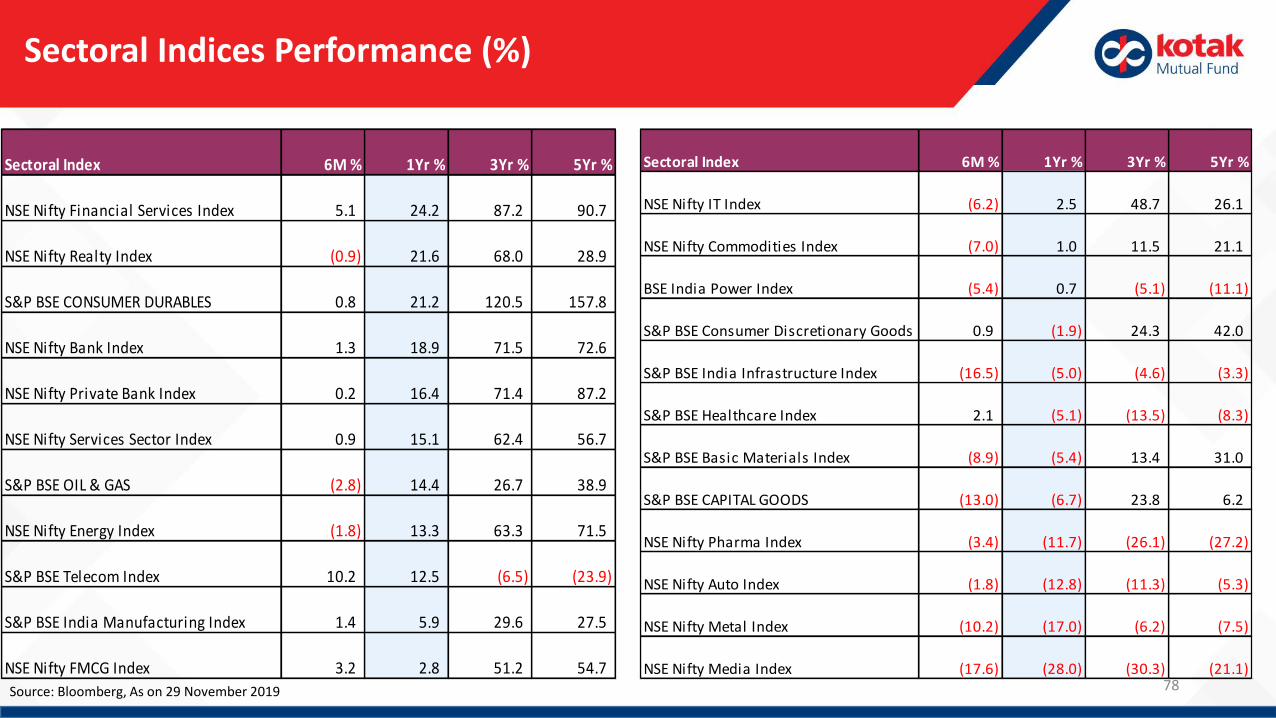
Sectoral Indices Performance (%)
Source: Bloomberg, As on 29 November 2019
Sectoral Index 6M % 1Yr % 3Yr % 5Yr %
NSE Nifty Financial Services Index 5.1 24.2 87.2 90.7
NSE Nifty Realty Index (0.9) 21.6 68.0 28.9
S&P BSE CONSUMER DURABLES 0.8 21.2 120.5 157.8
NSE Nifty Bank Index 1.3 18.9 71.5 72.6
NSE Nifty Private Bank Index 0.2 16.4 71.4 87.2
NSE Nifty Services Sector Index 0.9 15.1 62.4 56.7
S&P BSE OIL & GAS (2.8) 14.4 26.7 38.9
NSE Nifty Energy Index (1.8) 13.3 63.3 71.5
S&P BSE Telecom Index 10.2 12.5 (6.5) (23.9)
S&P BSE India Manufacturing Index 1.4 5.9 29.6 27.5
NSE Nifty FMCG Index 3.2 2.8 51.2 54.7
Sectoral Index 6M % 1Yr % 3Yr % 5Yr %
NSE Nifty IT Index (6.2) 2.5 48.7 26.1
NSE Nifty Commodities Index (7.0) 1.0 11.5 21.1
BSE India Power Index (5.4) 0.7 (5.1) (11.1)
S&P BSE Consumer Discretionary Goods & Services Index0.9 (1.9) 24.3 42.0
S&P BSE India Infrastructure Index (16.5) (5.0) (4.6) (3.3)
S&P BSE Healthcare Index 2.1 (5.1) (13.5) (8.3)
S&P BSE Basic Materials Index (8.9) (5.4) 13.4 31.0
S&P BSE CAPITAL GOODS (13.0) (6.7) 23.8 6.2
NSE Nifty Pharma Index (3.4) (11.7) (26.1) (27.2)
NSE Nifty Auto Index (1.8) (12.8) (11.3) (5.3)
NSE Nifty Metal Index (10.2) (17.0) (6.2) (7.5)
NSE Nifty Media Index (17.6) (28.0) (30.3) (21.1)

79
Stay Updated ! Follow us on
Debt Market Outlook All About Kotak Tax SaverInvestor Education
Product VideoEquity Market Outlook
Opportunity in Mid and Small cap spaceWhy invest in Small and Midcap fund now?

Disclaimers & Disclosures
80
The information contained in this (document) is extracted from different public sources. All reasonable care has been taken to ensure that the information contained hereinis not misleading or untrue at the time of publication. This is for the information of the person to whom it is provided without any liability whatsoever on the part of KotakMahindra Asset Management Co Ltd or any associated companies or any employee thereof.We are not soliciting any action based on this material and is for generalinformation only. Investors should consult their financial advisors if in doubt about whether the product is suitable for them before investing
These materials are not intended for distribution to or use by any person in any jurisdiction where such distribution would be contrary to local law or regulation. Thedistribution of this document in certain jurisdictions may be restricted or totally prohibited and accordingly, persons who come into possession of this document arerequired to inform themselves about, and to observe, any such restrictions
Mutual Fund investments are subject to market risks, read all scheme related documents carefully.
Disclaimers & Risk Factors
81
82
Performance As on 29 Nov 2019
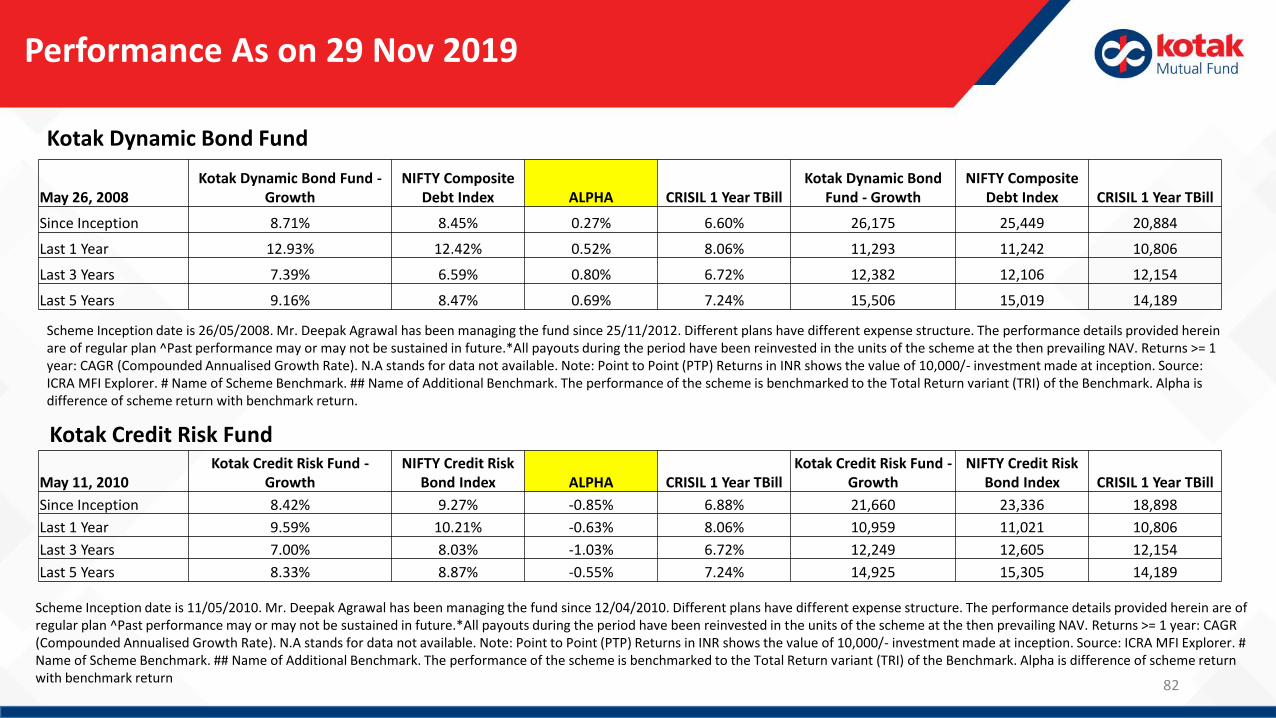
Kotak Dynamic Bond Fund
Kotak Credit Risk Fund
Scheme Inception date is 11/05/2010. Mr. Deepak Agrawal has been managing the fund since 12/04/2010. Different plans have different expense structure. The performance details provided herein are of regular plan ^Past performance may or may not be sustained in future.*All payouts during the period have been reinvested in the units of the scheme at the then prevailing NAV. Returns >= 1 year: CAGR (Compounded Annualised Growth Rate). N.A stands for data not available. Note: Point to Point (PTP) Returns in INR shows the value of 10,000/- investment made at inception. Source: ICRA MFI Explorer. # Name of Scheme Benchmark. ## Name of Additional Benchmark. The performance of the scheme is benchmarked to the Total Return variant (TRI) of the Benchmark. Alpha is difference of scheme return with benchmark return
Scheme Inception date is 26/05/2008. Mr. Deepak Agrawal has been managing the fund since 25/11/2012. Different plans have different expense structure. The performance details provided herein are of regular plan ^Past performance may or may not be sustained in future.*All payouts during the period have been reinvested in the units of the scheme at the then prevailing NAV. Returns >= 1 year: CAGR (Compounded Annualised Growth Rate). N.A stands for data not available. Note: Point to Point (PTP) Returns in INR shows the value of 10,000/- investment made at inception. Source: ICRA MFI Explorer. # Name of Scheme Benchmark. ## Name of Additional Benchmark. The performance of the scheme is benchmarked to the Total Return variant (TRI) of the Benchmark. Alpha is difference of scheme return with benchmark return.
May 26, 2008Kotak Dynamic Bond Fund -
GrowthNIFTY Composite
Debt Index ALPHA CRISIL 1 Year TBillKotak Dynamic Bond
Fund - GrowthNIFTY Composite
Debt Index CRISIL 1 Year TBill
Since Inception 8.71% 8.45% 0.27% 6.60% 26,175 25,449 20,884
Last 1 Year 12.93% 12.42% 0.52% 8.06% 11,293 11,242 10,806
Last 3 Years 7.39% 6.59% 0.80% 6.72% 12,382 12,106 12,154
Last 5 Years 9.16% 8.47% 0.69% 7.24% 15,506 15,019 14,189
May 11, 2010Kotak Credit Risk Fund -
GrowthNIFTY Credit Risk
Bond Index ALPHA CRISIL 1 Year TBillKotak Credit Risk Fund -
GrowthNIFTY Credit Risk
Bond Index CRISIL 1 Year TBill
Since Inception 8.42% 9.27% -0.85% 6.88% 21,660 23,336 18,898
Last 1 Year 9.59% 10.21% -0.63% 8.06% 10,959 11,021 10,806
Last 3 Years 7.00% 8.03% -1.03% 6.72% 12,249 12,605 12,154
Last 5 Years 8.33% 8.87% -0.55% 7.24% 14,925 15,305 14,189
83
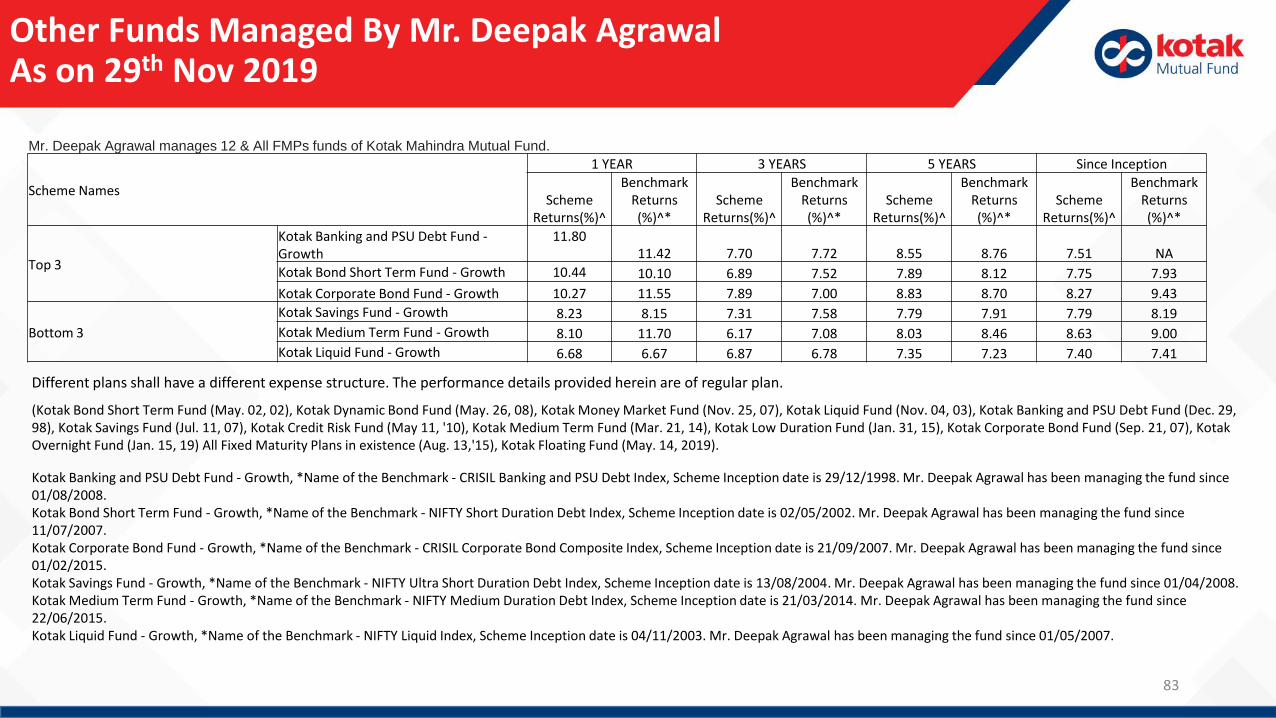
Other Funds Managed By Mr. Deepak Agrawal As on 29th Nov 2019
Mr. Deepak Agrawal manages 12 & All FMPs funds of Kotak Mahindra Mutual Fund.
Scheme Names
1 YEAR 3 YEARS 5 YEARS Since Inception
Scheme Returns(%)^
Benchmark Returns (%)^*
Scheme Returns(%)^
Benchmark Returns (%)^*
Scheme Returns(%)^
Benchmark Returns (%)^*
Scheme Returns(%)^
Benchmark Returns (%)^*
Top 3
Kotak Banking and PSU Debt Fund -Growth
11.8011.42 7.70 7.72 8.55 8.76 7.51 NA
Kotak Bond Short Term Fund - Growth 10.44 10.10 6.89 7.52 7.89 8.12 7.75 7.93
Kotak Corporate Bond Fund - Growth 10.27 11.55 7.89 7.00 8.83 8.70 8.27 9.43
Bottom 3
Kotak Savings Fund - Growth 8.23 8.15 7.31 7.58 7.79 7.91 7.79 8.19
Kotak Medium Term Fund - Growth 8.10 11.70 6.17 7.08 8.03 8.46 8.63 9.00
Kotak Liquid Fund - Growth 6.68 6.67 6.87 6.78 7.35 7.23 7.40 7.41
Different plans shall have a different expense structure. The performance details provided herein are of regular plan.
(Kotak Bond Short Term Fund (May. 02, 02), Kotak Dynamic Bond Fund (May. 26, 08), Kotak Money Market Fund (Nov. 25, 07), Kotak Liquid Fund (Nov. 04, 03), Kotak Banking and PSU Debt Fund (Dec. 29, 98), Kotak Savings Fund (Jul. 11, 07), Kotak Credit Risk Fund (May 11, '10), Kotak Medium Term Fund (Mar. 21, 14), Kotak Low Duration Fund (Jan. 31, 15), Kotak Corporate Bond Fund (Sep. 21, 07), Kotak Overnight Fund (Jan. 15, 19) All Fixed Maturity Plans in existence (Aug. 13,'15), Kotak Floating Fund (May. 14, 2019).
Kotak Banking and PSU Debt Fund - Growth, *Name of the Benchmark - CRISIL Banking and PSU Debt Index, Scheme Inception date is 29/12/1998. Mr. Deepak Agrawal has been managing the fund since 01/08/2008.Kotak Bond Short Term Fund - Growth, *Name of the Benchmark - NIFTY Short Duration Debt Index, Scheme Inception date is 02/05/2002. Mr. Deepak Agrawal has been managing the fund since 11/07/2007.Kotak Corporate Bond Fund - Growth, *Name of the Benchmark - CRISIL Corporate Bond Composite Index, Scheme Inception date is 21/09/2007. Mr. Deepak Agrawal has been managing the fund since 01/02/2015.Kotak Savings Fund - Growth, *Name of the Benchmark - NIFTY Ultra Short Duration Debt Index, Scheme Inception date is 13/08/2004. Mr. Deepak Agrawal has been managing the fund since 01/04/2008.Kotak Medium Term Fund - Growth, *Name of the Benchmark - NIFTY Medium Duration Debt Index, Scheme Inception date is 21/03/2014. Mr. Deepak Agrawal has been managing the fund since 22/06/2015.Kotak Liquid Fund - Growth, *Name of the Benchmark - NIFTY Liquid Index, Scheme Inception date is 04/11/2003. Mr. Deepak Agrawal has been managing the fund since 01/05/2007.
84
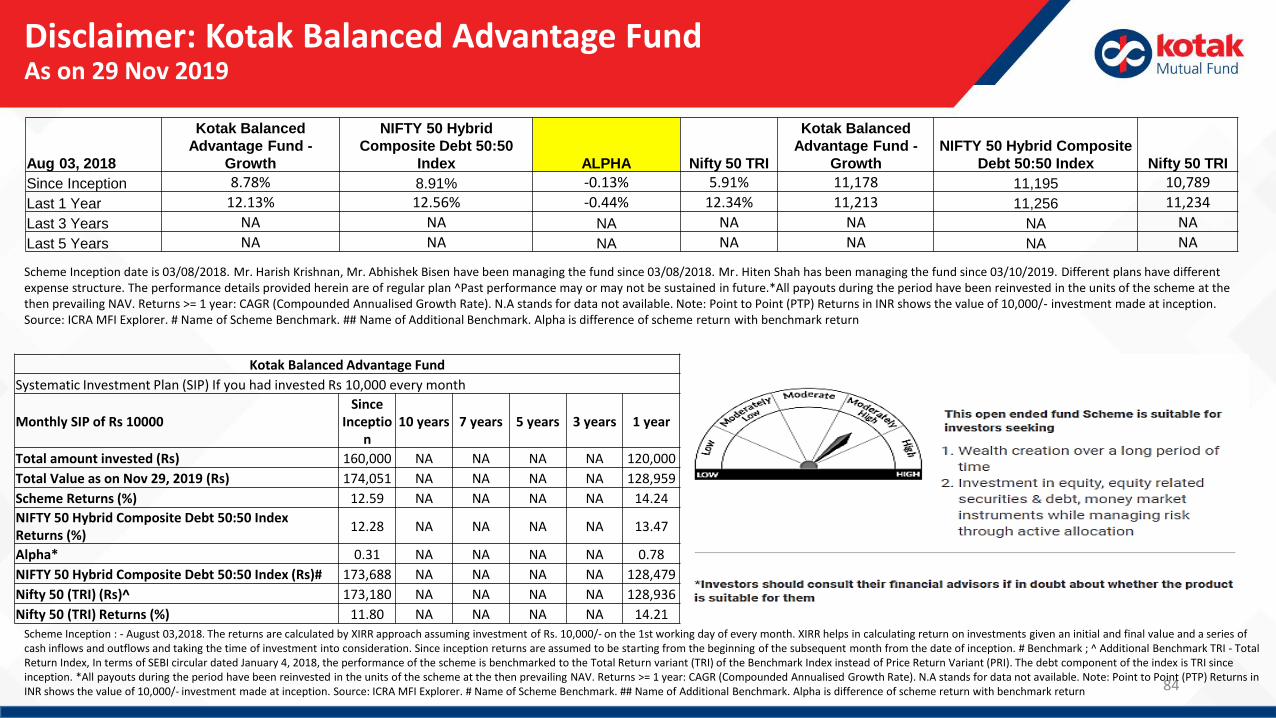
Disclaimer: Kotak Balanced Advantage Fund As on 29 Nov 2019
Scheme Inception date is 03/08/2018. Mr. Harish Krishnan, Mr. Abhishek Bisen have been managing the fund since 03/08/2018. Mr. Hiten Shah has been managing the fund since 03/10/2019. Different plans have different expense structure. The performance details provided herein are of regular plan ^Past performance may or may not be sustained in future.*All payouts during the period have been reinvested in the units of the scheme at the then prevailing NAV. Returns >= 1 year: CAGR (Compounded Annualised Growth Rate). N.A stands for data not available. Note: Point to Point (PTP) Returns in INR shows the value of 10,000/- investment made at inception. Source: ICRA MFI Explorer. # Name of Scheme Benchmark. ## Name of Additional Benchmark. Alpha is difference of scheme return with benchmark return
Scheme Inception : - August 03,2018. The returns are calculated by XIRR approach assuming investment of Rs. 10,000/- on the 1st working day of every month. XIRR helps in calculating return on investments given an initial and final value and a series of cash inflows and outflows and taking the time of investment into consideration. Since inception returns are assumed to be starting from the beginning of the subsequent month from the date of inception. # Benchmark ; ^ Additional Benchmark TRI - Total Return Index, In terms of SEBI circular dated January 4, 2018, the performance of the scheme is benchmarked to the Total Return variant (TRI) of the Benchmark Index instead of Price Return Variant (PRI). The debt component of the index is TRI since inception. *All payouts during the period have been reinvested in the units of the scheme at the then prevailing NAV. Returns >= 1 year: CAGR (Compounded Annualised Growth Rate). N.A stands for data not available. Note: Point to Point (PTP) Returns in INR shows the value of 10,000/- investment made at inception. Source: ICRA MFI Explorer. # Name of Scheme Benchmark. ## Name of Additional Benchmark. Alpha is difference of scheme return with benchmark return
Aug 03, 2018
Kotak Balanced
Advantage Fund -
Growth
NIFTY 50 Hybrid
Composite Debt 50:50
Index ALPHA Nifty 50 TRI
Kotak Balanced
Advantage Fund -
Growth
NIFTY 50 Hybrid Composite
Debt 50:50 Index Nifty 50 TRI
Since Inception 8.78% 8.91% -0.13% 5.91% 11,178 11,195 10,789
Last 1 Year 12.13% 12.56% -0.44% 12.34% 11,213 11,256 11,234
Last 3 Years NA NA NA NA NA NA NA
Last 5 Years NA NA NA NA NA NA NA
Kotak Balanced Advantage Fund
Systematic Investment Plan (SIP) If you had invested Rs 10,000 every month
Monthly SIP of Rs 10000Since
Inception
10 years 7 years 5 years 3 years 1 year
Total amount invested (Rs) 160,000 NA NA NA NA 120,000
Total Value as on Nov 29, 2019 (Rs) 174,051 NA NA NA NA 128,959
Scheme Returns (%) 12.59 NA NA NA NA 14.24
NIFTY 50 Hybrid Composite Debt 50:50 Index Returns (%)
12.28 NA NA NA NA 13.47
Alpha* 0.31 NA NA NA NA 0.78
NIFTY 50 Hybrid Composite Debt 50:50 Index (Rs)# 173,688 NA NA NA NA 128,479
Nifty 50 (TRI) (Rs)^ 173,180 NA NA NA NA 128,936
Nifty 50 (TRI) Returns (%) 11.80 NA NA NA NA 14.21
85
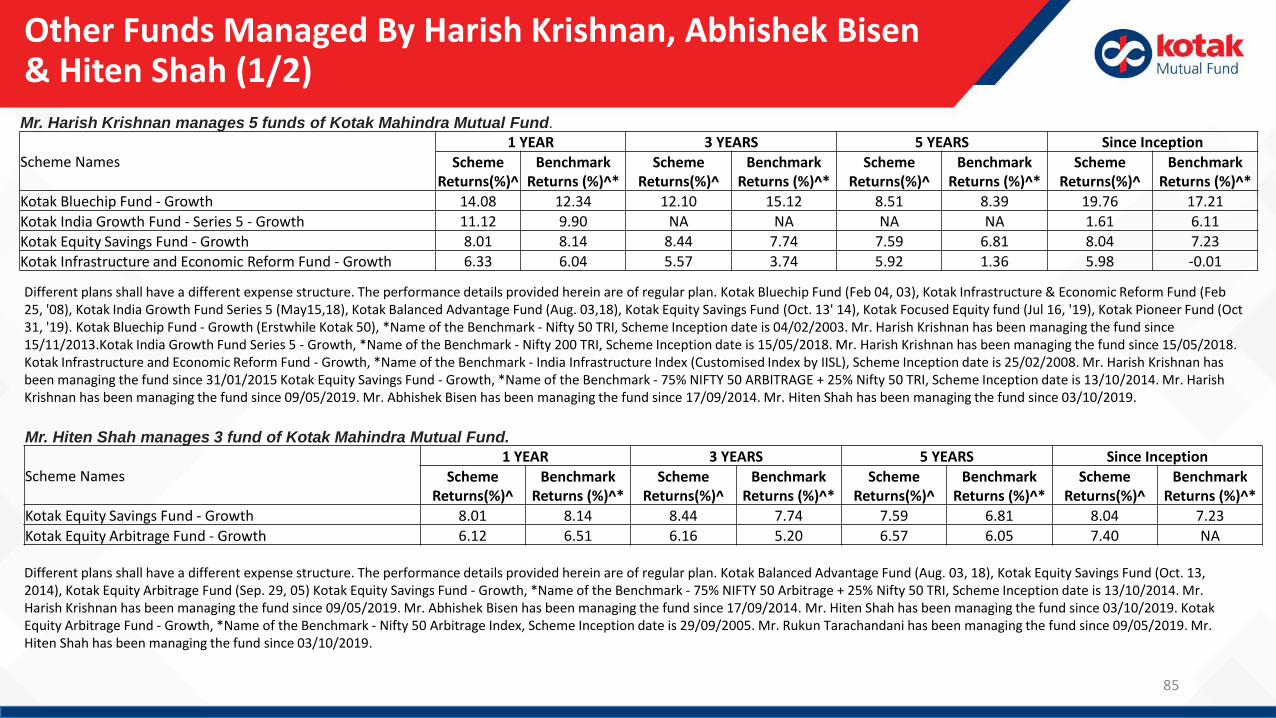
Other Funds Managed By Harish Krishnan, Abhishek Bisen & Hiten Shah (1/2)Mr. Harish Krishnan manages 5 funds of Kotak Mahindra Mutual Fund.
Scheme Names1 YEAR 3 YEARS 5 YEARS Since Inception
Scheme Returns(%)^
Benchmark Returns (%)^*
Scheme Returns(%)^
Benchmark Returns (%)^*
Scheme Returns(%)^
Benchmark Returns (%)^*
Scheme Returns(%)^
Benchmark Returns (%)^*
Kotak Bluechip Fund - Growth 14.08 12.34 12.10 15.12 8.51 8.39 19.76 17.21
Kotak India Growth Fund - Series 5 - Growth 11.12 9.90 NA NA NA NA 1.61 6.11
Kotak Equity Savings Fund - Growth 8.01 8.14 8.44 7.74 7.59 6.81 8.04 7.23
Kotak Infrastructure and Economic Reform Fund - Growth 6.33 6.04 5.57 3.74 5.92 1.36 5.98 -0.01
Different plans shall have a different expense structure. The performance details provided herein are of regular plan. Kotak Bluechip Fund (Feb 04, 03), Kotak Infrastructure & Economic Reform Fund (Feb 25, '08), Kotak India Growth Fund Series 5 (May15,18), Kotak Balanced Advantage Fund (Aug. 03,18), Kotak Equity Savings Fund (Oct. 13' 14), Kotak Focused Equity fund (Jul 16, '19), Kotak Pioneer Fund (Oct 31, '19). Kotak Bluechip Fund - Growth (Erstwhile Kotak 50), *Name of the Benchmark - Nifty 50 TRI, Scheme Inception date is 04/02/2003. Mr. Harish Krishnan has been managing the fund since 15/11/2013.Kotak India Growth Fund Series 5 - Growth, *Name of the Benchmark - Nifty 200 TRI, Scheme Inception date is 15/05/2018. Mr. Harish Krishnan has been managing the fund since 15/05/2018. Kotak Infrastructure and Economic Reform Fund - Growth, *Name of the Benchmark - India Infrastructure Index (Customised Index by IISL), Scheme Inception date is 25/02/2008. Mr. Harish Krishnan has been managing the fund since 31/01/2015 Kotak Equity Savings Fund - Growth, *Name of the Benchmark - 75% NIFTY 50 ARBITRAGE + 25% Nifty 50 TRI, Scheme Inception date is 13/10/2014. Mr. Harish Krishnan has been managing the fund since 09/05/2019. Mr. Abhishek Bisen has been managing the fund since 17/09/2014. Mr. Hiten Shah has been managing the fund since 03/10/2019.
Mr. Hiten Shah manages 3 fund of Kotak Mahindra Mutual Fund.
Scheme Names1 YEAR 3 YEARS 5 YEARS Since Inception
Scheme Returns(%)^
Benchmark Returns (%)^*
Scheme Returns(%)^
Benchmark Returns (%)^*
Scheme Returns(%)^
Benchmark Returns (%)^*
Scheme Returns(%)^
Benchmark Returns (%)^*
Kotak Equity Savings Fund - Growth 8.01 8.14 8.44 7.74 7.59 6.81 8.04 7.23
Kotak Equity Arbitrage Fund - Growth 6.12 6.51 6.16 5.20 6.57 6.05 7.40 NA
Different plans shall have a different expense structure. The performance details provided herein are of regular plan. Kotak Balanced Advantage Fund (Aug. 03, 18), Kotak Equity Savings Fund (Oct. 13, 2014), Kotak Equity Arbitrage Fund (Sep. 29, 05) Kotak Equity Savings Fund - Growth, *Name of the Benchmark - 75% NIFTY 50 Arbitrage + 25% Nifty 50 TRI, Scheme Inception date is 13/10/2014. Mr. Harish Krishnan has been managing the fund since 09/05/2019. Mr. Abhishek Bisen has been managing the fund since 17/09/2014. Mr. Hiten Shah has been managing the fund since 03/10/2019. Kotak Equity Arbitrage Fund - Growth, *Name of the Benchmark - Nifty 50 Arbitrage Index, Scheme Inception date is 29/09/2005. Mr. Rukun Tarachandani has been managing the fund since 09/05/2019. Mr. Hiten Shah has been managing the fund since 03/10/2019.
86
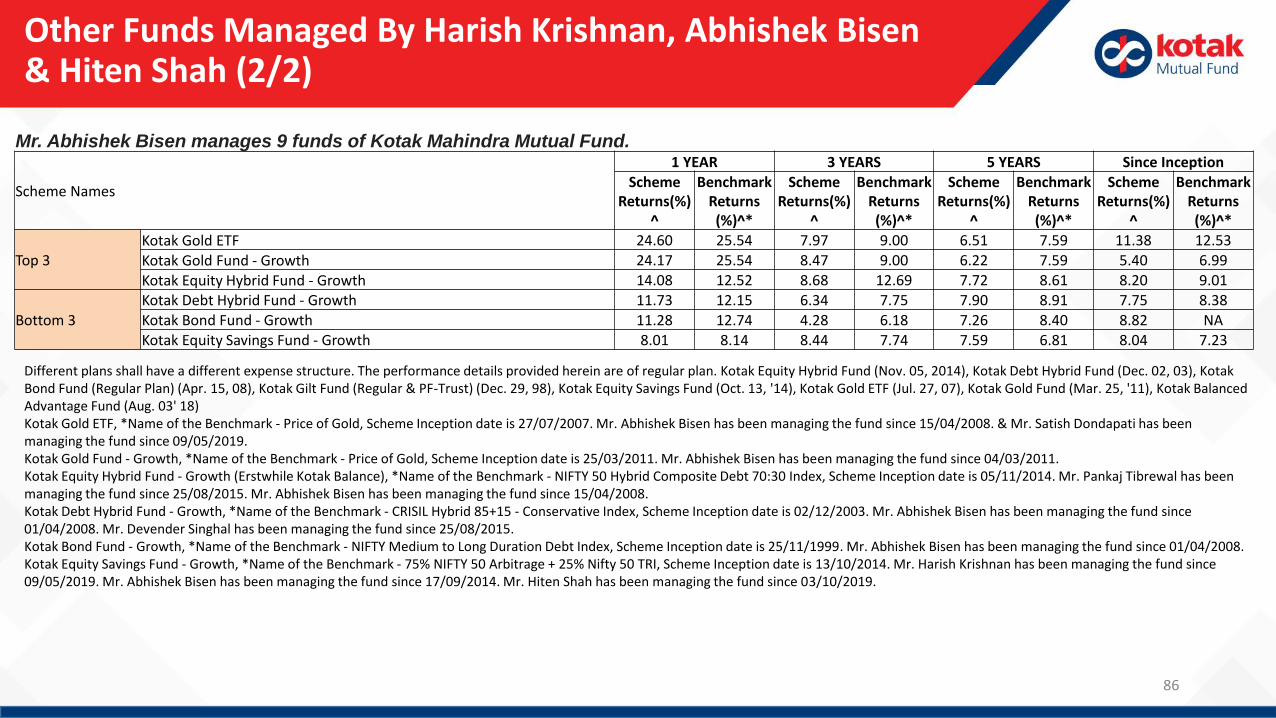
Other Funds Managed By Harish Krishnan, Abhishek Bisen & Hiten Shah (2/2)
Mr. Abhishek Bisen manages 9 funds of Kotak Mahindra Mutual Fund.
Scheme Names
1 YEAR 3 YEARS 5 YEARS Since InceptionScheme
Returns(%)^
Benchmark Returns (%)^*
Scheme Returns(%)
^
Benchmark Returns (%)^*
Scheme Returns(%)
^
Benchmark Returns (%)^*
Scheme Returns(%)
^
Benchmark Returns (%)^*
Top 3Kotak Gold ETF 24.60 25.54 7.97 9.00 6.51 7.59 11.38 12.53
Kotak Gold Fund - Growth 24.17 25.54 8.47 9.00 6.22 7.59 5.40 6.99
Kotak Equity Hybrid Fund - Growth 14.08 12.52 8.68 12.69 7.72 8.61 8.20 9.01
Bottom 3
Kotak Debt Hybrid Fund - Growth 11.73 12.15 6.34 7.75 7.90 8.91 7.75 8.38
Kotak Bond Fund - Growth 11.28 12.74 4.28 6.18 7.26 8.40 8.82 NAKotak Equity Savings Fund - Growth 8.01 8.14 8.44 7.74 7.59 6.81 8.04 7.23
Different plans shall have a different expense structure. The performance details provided herein are of regular plan. Kotak Equity Hybrid Fund (Nov. 05, 2014), Kotak Debt Hybrid Fund (Dec. 02, 03), Kotak Bond Fund (Regular Plan) (Apr. 15, 08), Kotak Gilt Fund (Regular & PF-Trust) (Dec. 29, 98), Kotak Equity Savings Fund (Oct. 13, '14), Kotak Gold ETF (Jul. 27, 07), Kotak Gold Fund (Mar. 25, '11), Kotak Balanced Advantage Fund (Aug. 03' 18) Kotak Gold ETF, *Name of the Benchmark - Price of Gold, Scheme Inception date is 27/07/2007. Mr. Abhishek Bisen has been managing the fund since 15/04/2008. & Mr. Satish Dondapati has been managing the fund since 09/05/2019.Kotak Gold Fund - Growth, *Name of the Benchmark - Price of Gold, Scheme Inception date is 25/03/2011. Mr. Abhishek Bisen has been managing the fund since 04/03/2011.Kotak Equity Hybrid Fund - Growth (Erstwhile Kotak Balance), *Name of the Benchmark - NIFTY 50 Hybrid Composite Debt 70:30 Index, Scheme Inception date is 05/11/2014. Mr. Pankaj Tibrewal has been managing the fund since 25/08/2015. Mr. Abhishek Bisen has been managing the fund since 15/04/2008.Kotak Debt Hybrid Fund - Growth, *Name of the Benchmark - CRISIL Hybrid 85+15 - Conservative Index, Scheme Inception date is 02/12/2003. Mr. Abhishek Bisen has been managing the fund since 01/04/2008. Mr. Devender Singhal has been managing the fund since 25/08/2015.Kotak Bond Fund - Growth, *Name of the Benchmark - NIFTY Medium to Long Duration Debt Index, Scheme Inception date is 25/11/1999. Mr. Abhishek Bisen has been managing the fund since 01/04/2008.Kotak Equity Savings Fund - Growth, *Name of the Benchmark - 75% NIFTY 50 Arbitrage + 25% Nifty 50 TRI, Scheme Inception date is 13/10/2014. Mr. Harish Krishnan has been managing the fund since 09/05/2019. Mr. Abhishek Bisen has been managing the fund since 17/09/2014. Mr. Hiten Shah has been managing the fund since 03/10/2019.

* Investors should consult their financial advisers if in doubt about whether the product is suitable for them
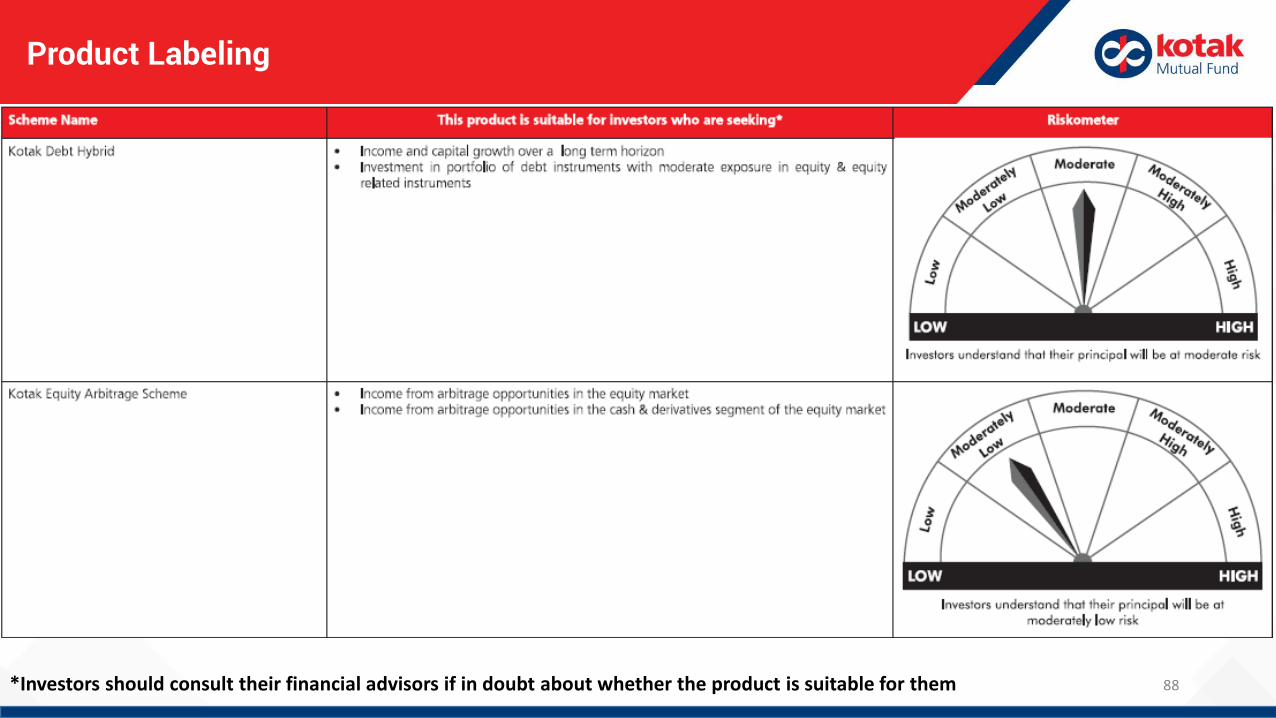
Product Labeling
87*Investors should consult their financial advisors if in doubt about whether the product is suitable for them
* Investors should consult their financial advisers if in doubt about whether the product is suitable for them
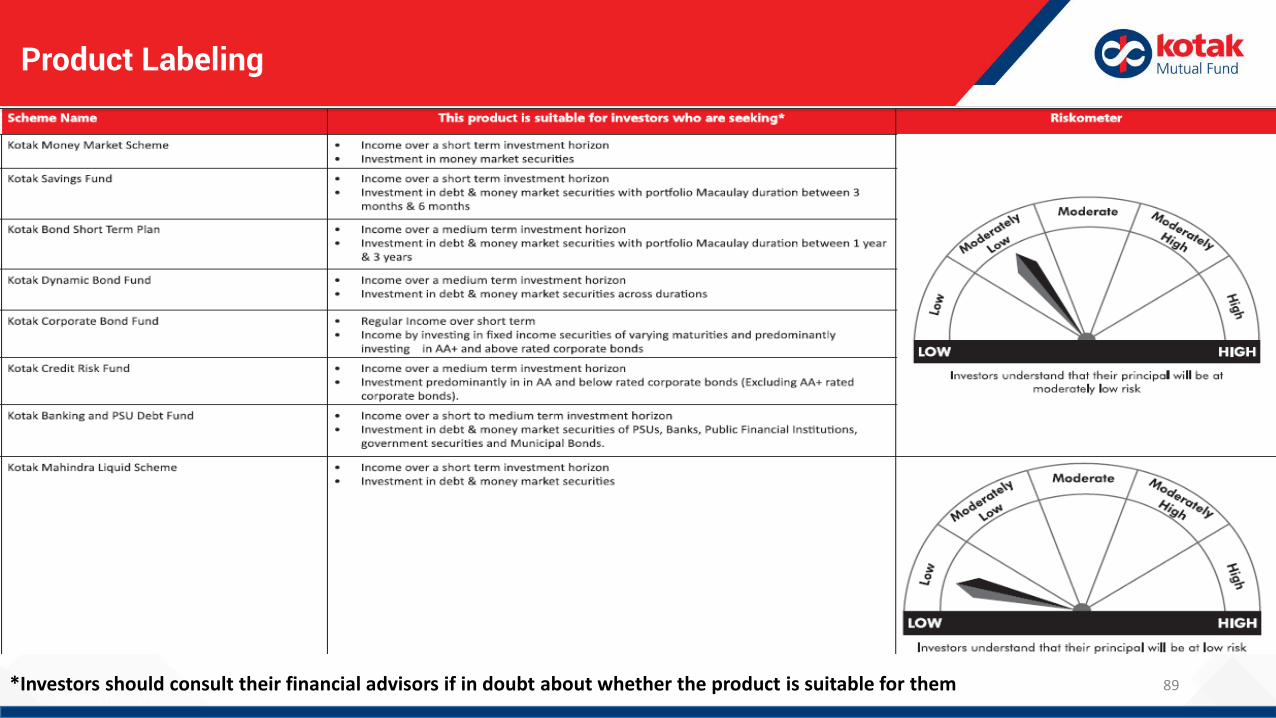
Product Labeling
88*Investors should consult their financial advisors if in doubt about whether the product is suitable for them
Product Labeling
* Investors should consult their financial advisers if in doubt about whether the product is suitable for them89*Investors should consult their financial advisors if in doubt about whether the product is suitable for them
Recommended