Embed Size (px)
Citation preview
CDP CDP 2016 Climate Change 2016 Information Request
Kotak Mahindra Bank
Module: Introduction
Page: Introduction
CC0.1
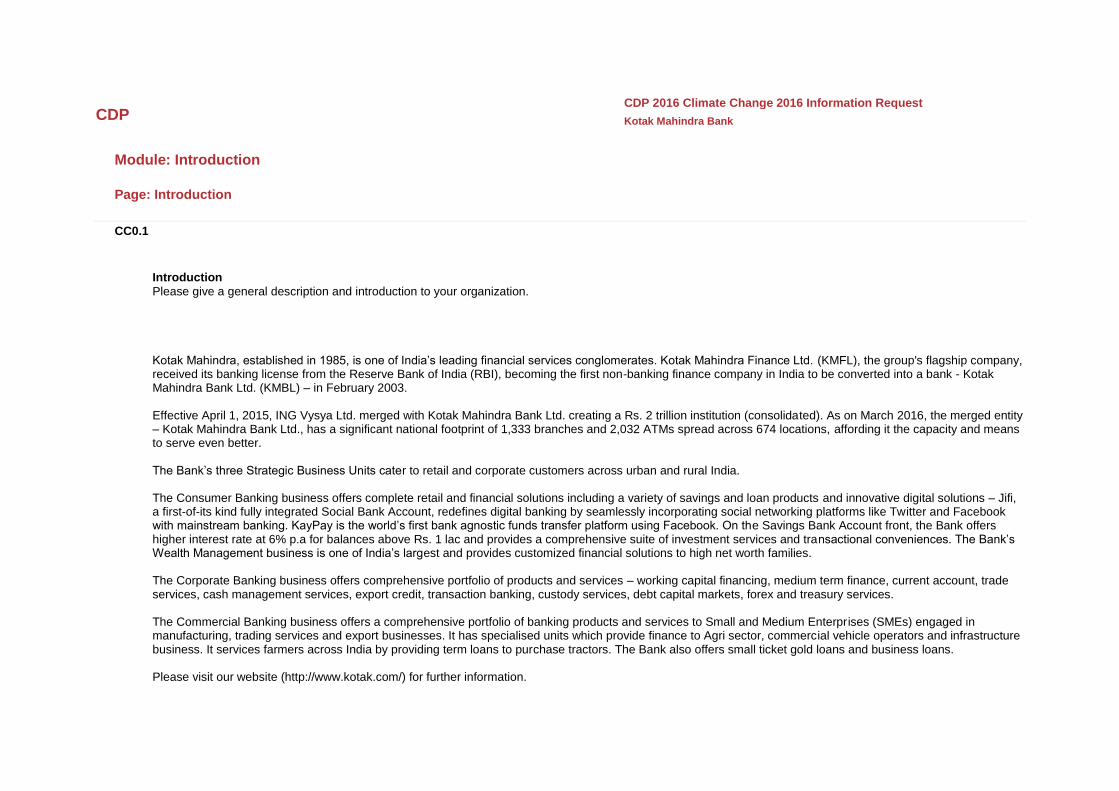
Introduction
Please give a general description and introduction to your organization. Kotak Mahindra, established in 1985, is one of India’s leading financial services conglomerates. Kotak Mahindra Finance Ltd. (KMFL), the group's flagship company, received its banking license from the Reserve Bank of India (RBI), becoming the first non-banking finance company in India to be converted into a bank - Kotak Mahindra Bank Ltd. (KMBL) – in February 2003. Effective April 1, 2015, ING Vysya Ltd. merged with Kotak Mahindra Bank Ltd. creating a Rs. 2 trillion institution (consolidated). As on March 2016, the merged entity – Kotak Mahindra Bank Ltd., has a significant national footprint of 1,333 branches and 2,032 ATMs spread across 674 locations, affording it the capacity and means to serve even better. The Bank’s three Strategic Business Units cater to retail and corporate customers across urban and rural India. The Consumer Banking business offers complete retail and financial solutions including a variety of savings and loan products and innovative digital solutions – Jifi, a first-of-its kind fully integrated Social Bank Account, redefines digital banking by seamlessly incorporating social networking platforms like Twitter and Facebook with mainstream banking. KayPay is the world’s first bank agnostic funds transfer platform using Facebook. On the Savings Bank Account front, the Bank offers higher interest rate at 6% p.a for balances above Rs. 1 lac and provides a comprehensive suite of investment services and transactional conveniences. The Bank’s Wealth Management business is one of India’s largest and provides customized financial solutions to high net worth families. The Corporate Banking business offers comprehensive portfolio of products and services – working capital financing, medium term finance, current account, trade services, cash management services, export credit, transaction banking, custody services, debt capital markets, forex and treasury services. The Commercial Banking business offers a comprehensive portfolio of banking products and services to Small and Medium Enterprises (SMEs) engaged in manufacturing, trading services and export businesses. It has specialised units which provide finance to Agri sector, commercial vehicle operators and infrastructure business. It services farmers across India by providing term loans to purchase tractors. The Bank also offers small ticket gold loans and business loans. Please visit our website (http://www.kotak.com/) for further information.
CC0.2
Reporting Year
Please state the start and end date of the year for which you are reporting data. The current reporting year is the latest/most recent 12-month period for which data is reported. Enter the dates of this year first. We request data for more than one reporting period for some emission accounting questions. Please provide data for the three years prior to the current reporting year if you have not provided this information before, or if this is the first time you have answered a CDP information request. (This does not apply if you have been offered and selected the option of answering the shorter questionnaire). If you are going to provide additional years of data, please give the dates of those reporting periods here. Work backwards from the most recent reporting year. Please enter dates in following format: day(DD)/month(MM)/year(YYYY) (i.e. 31/01/2001).
Enter Periods that will be disclosed
Wed 01 Apr 2015 - Thu 31 Mar 2016
CC0.3
Country list configuration
Please select the countries for which you will be supplying data. If you are responding to the Electric Utilities module, this selection will be carried forward to assist you in completing your response.
Select country
India
CC0.4

Currency selection
Please select the currency in which you would like to submit your response. All financial information contained in the response should be in this currency. INR(Rp)
CC0.6
Modules
As part of the request for information on behalf of investors, electric utilities, companies with electric utility activities or assets, companies in the automobile or auto component manufacture sub-industries, companies in the oil and gas sub-industries, companies in the information technology and telecommunications sectors and companies in the food, beverage and tobacco industry group should complete supplementary questions in addition to the main questionnaire. If you are in these sector groupings (according to the Global Industry Classification Standard (GICS)), the corresponding sector modules will not appear below but will automatically appear in the navigation bar when you save this page. If you want to query your classification, please email [email protected]. If you have not been presented with a sector module that you consider would be appropriate for your company to answer, please select the module below. If you wish to view the questions first, please see https://www.cdp.net/en-US/Programmes/Pages/More-questionnaires.aspx.
Further Information
Module: Management
Page: CC1. Governance
CC1.1
Where is the highest level of direct responsibility for climate change within your organization?
Board or individual/sub-set of the Board or other committee appointed by the Board
CC1.1a
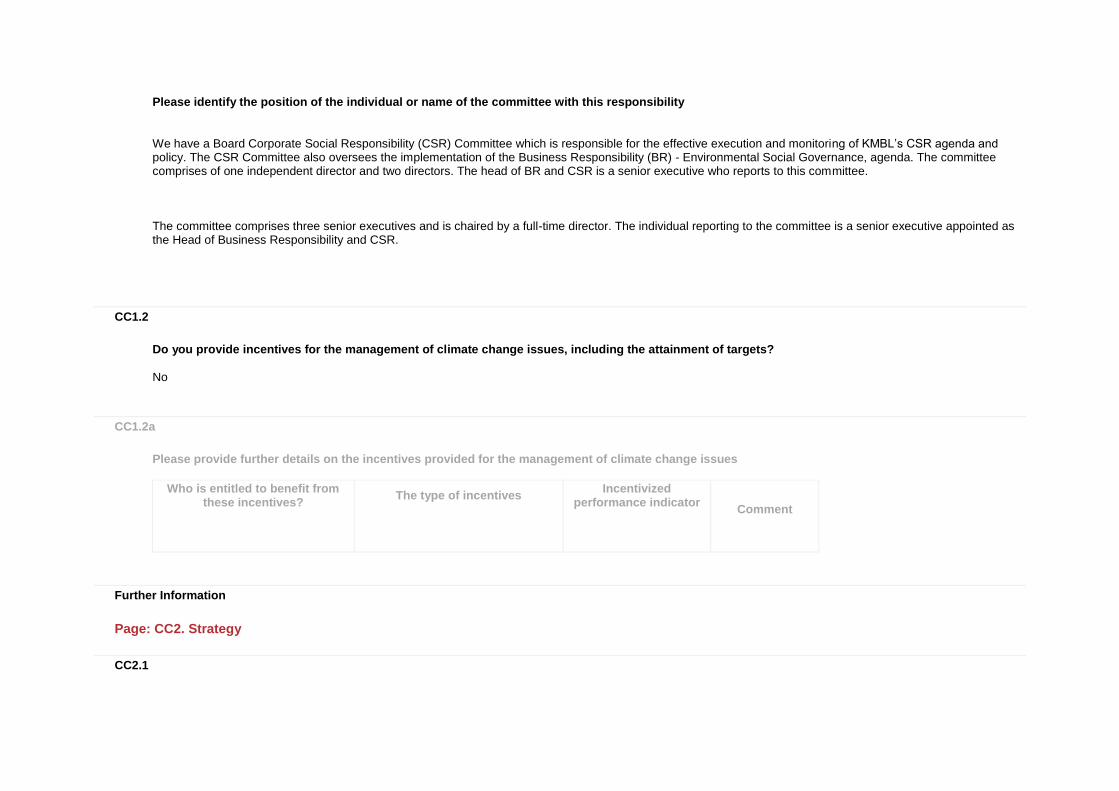
Please identify the position of the individual or name of the committee with this responsibility
We have a Board Corporate Social Responsibility (CSR) Committee which is responsible for the effective execution and monitoring of KMBL’s CSR agenda and policy. The CSR Committee also oversees the implementation of the Business Responsibility (BR) - Environmental Social Governance, agenda. The committee comprises of one independent director and two directors. The head of BR and CSR is a senior executive who reports to this committee. The committee comprises three senior executives and is chaired by a full-time director. The individual reporting to the committee is a senior executive appointed as the Head of Business Responsibility and CSR.
CC1.2
Do you provide incentives for the management of climate change issues, including the attainment of targets?
No
CC1.2a
Please provide further details on the incentives provided for the management of climate change issues
Who is entitled to benefit from these incentives?
The type of incentives
Incentivized performance indicator
Comment
Further Information
Page: CC2. Strategy
CC2.1
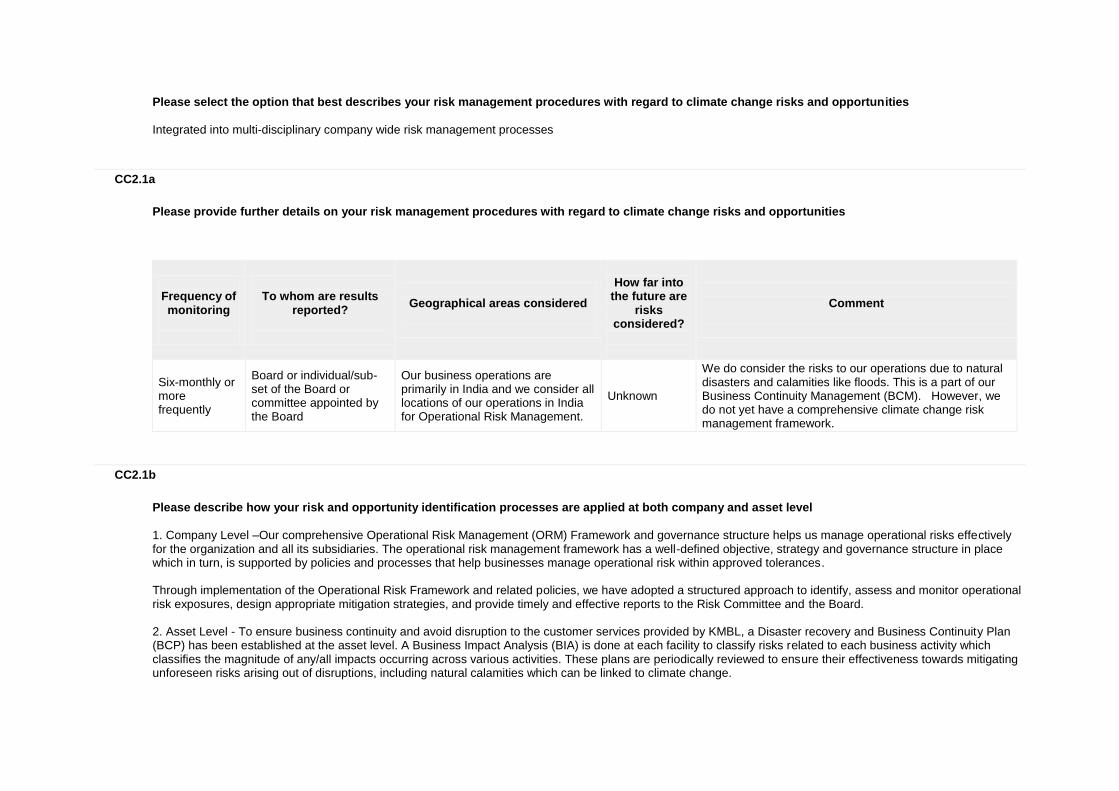
Please select the option that best describes your risk management procedures with regard to climate change risks and opportunities
Integrated into multi-disciplinary company wide risk management processes
CC2.1a
Please provide further details on your risk management procedures with regard to climate change risks and opportunities
Frequency of monitoring
To whom are results
reported?
Geographical areas considered
How far into
the future are risks
considered?
Comment
Six-monthly or more frequently
Board or individual/sub-set of the Board or committee appointed by the Board
Our business operations are primarily in India and we consider all locations of our operations in India for Operational Risk Management.
Unknown
We do consider the risks to our operations due to natural disasters and calamities like floods. This is a part of our Business Continuity Management (BCM). However, we do not yet have a comprehensive climate change risk management framework.
CC2.1b
Please describe how your risk and opportunity identification processes are applied at both company and asset level
1. Company Level –Our comprehensive Operational Risk Management (ORM) Framework and governance structure helps us manage operational risks effectively for the organization and all its subsidiaries. The operational risk management framework has a well-defined objective, strategy and governance structure in place which in turn, is supported by policies and processes that help businesses manage operational risk within approved tolerances. Through implementation of the Operational Risk Framework and related policies, we have adopted a structured approach to identify, assess and monitor operational risk exposures, design appropriate mitigation strategies, and provide timely and effective reports to the Risk Committee and the Board. 2. Asset Level - To ensure business continuity and avoid disruption to the customer services provided by KMBL, a Disaster recovery and Business Continuity Plan (BCP) has been established at the asset level. A Business Impact Analysis (BIA) is done at each facility to classify risks related to each business activity which classifies the magnitude of any/all impacts occurring across various activities. These plans are periodically reviewed to ensure their effectiveness towards mitigating unforeseen risks arising out of disruptions, including natural calamities which can be linked to climate change.
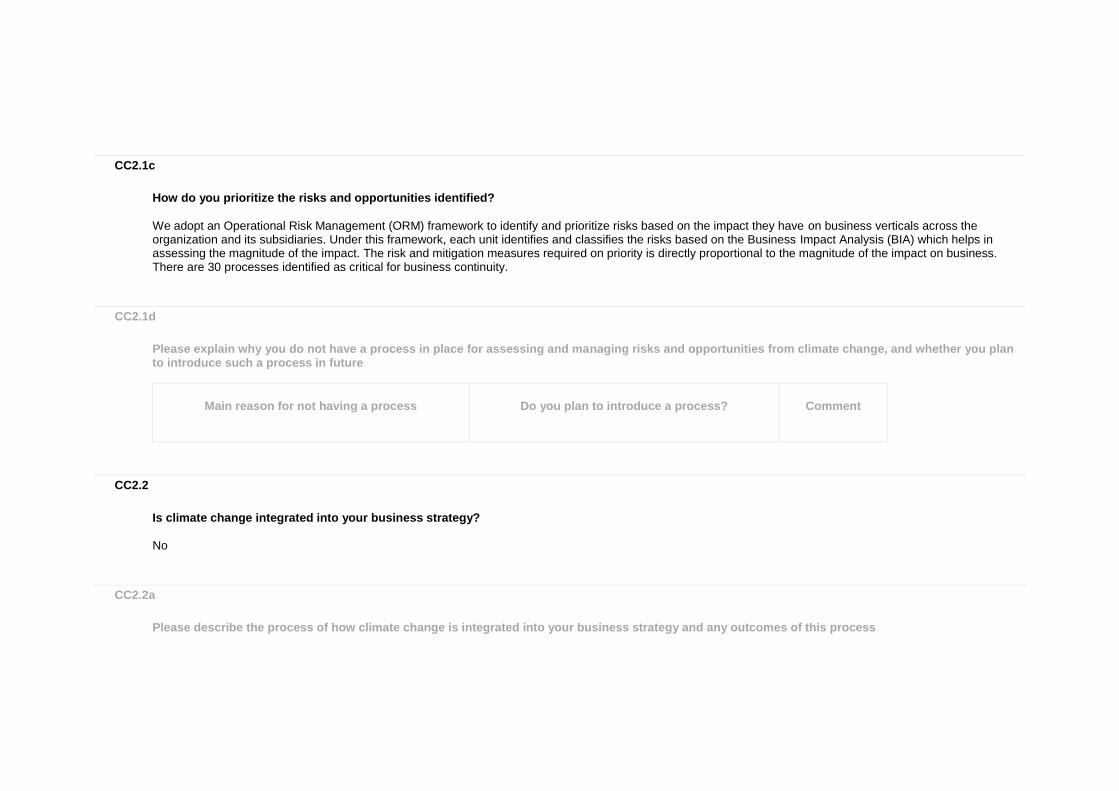
CC2.1c
How do you prioritize the risks and opportunities identified?
We adopt an Operational Risk Management (ORM) framework to identify and prioritize risks based on the impact they have on business verticals across the organization and its subsidiaries. Under this framework, each unit identifies and classifies the risks based on the Business Impact Analysis (BIA) which helps in assessing the magnitude of the impact. The risk and mitigation measures required on priority is directly proportional to the magnitude of the impact on business. There are 30 processes identified as critical for business continuity.
CC2.1d
Please explain why you do not have a process in place for assessing and managing risks and opportunities from climate change, and whether you plan to introduce such a process in future
Main reason for not having a process
Do you plan to introduce a process?
Comment
CC2.2
Is climate change integrated into your business strategy?
No
CC2.2a
Please describe the process of how climate change is integrated into your business strategy and any outcomes of this process
CC2.2b
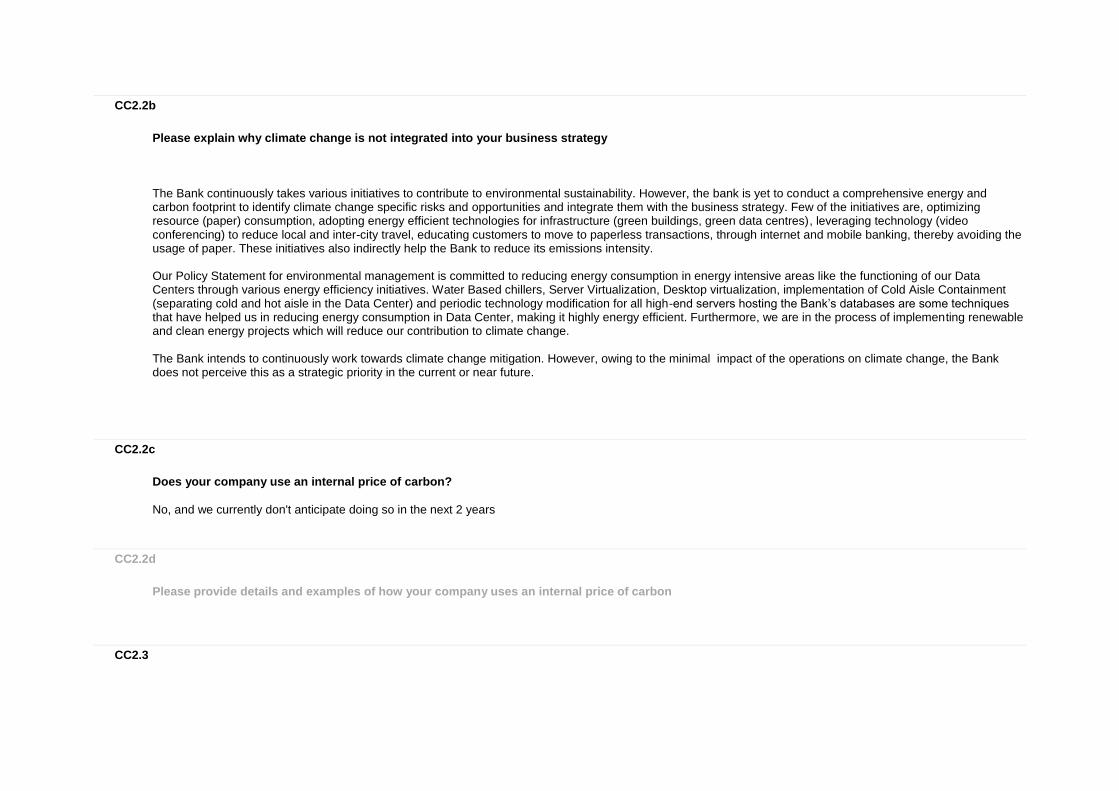
Please explain why climate change is not integrated into your business strategy
The Bank continuously takes various initiatives to contribute to environmental sustainability. However, the bank is yet to conduct a comprehensive energy and carbon footprint to identify climate change specific risks and opportunities and integrate them with the business strategy. Few of the initiatives are, optimizing resource (paper) consumption, adopting energy efficient technologies for infrastructure (green buildings, green data centres), leveraging technology (video conferencing) to reduce local and inter-city travel, educating customers to move to paperless transactions, through internet and mobile banking, thereby avoiding the usage of paper. These initiatives also indirectly help the Bank to reduce its emissions intensity. Our Policy Statement for environmental management is committed to reducing energy consumption in energy intensive areas like the functioning of our Data Centers through various energy efficiency initiatives. Water Based chillers, Server Virtualization, Desktop virtualization, implementation of Cold Aisle Containment (separating cold and hot aisle in the Data Center) and periodic technology modification for all high-end servers hosting the Bank’s databases are some techniques that have helped us in reducing energy consumption in Data Center, making it highly energy efficient. Furthermore, we are in the process of implementing renewable and clean energy projects which will reduce our contribution to climate change. The Bank intends to continuously work towards climate change mitigation. However, owing to the minimal impact of the operations on climate change, the Bank does not perceive this as a strategic priority in the current or near future.
CC2.2c
Does your company use an internal price of carbon?
No, and we currently don't anticipate doing so in the next 2 years
CC2.2d
Please provide details and examples of how your company uses an internal price of carbon
CC2.3
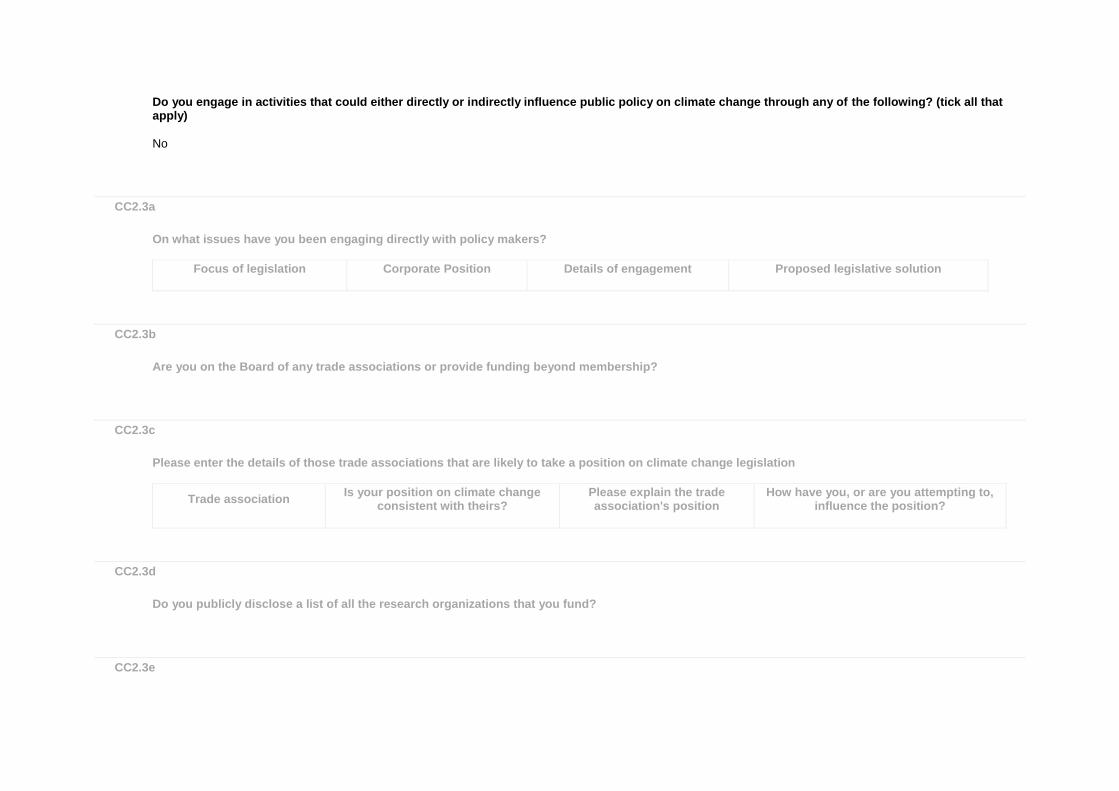
Do you engage in activities that could either directly or indirectly influence public policy on climate change through any of the following? (tick all that apply)
No
CC2.3a
On what issues have you been engaging directly with policy makers?
Focus of legislation
Corporate Position
Details of engagement
Proposed legislative solution
CC2.3b
Are you on the Board of any trade associations or provide funding beyond membership?
CC2.3c
Please enter the details of those trade associations that are likely to take a position on climate change legislation
Trade association
Is your position on climate change consistent with theirs?
Please explain the trade association's position
How have you, or are you attempting to, influence the position?
CC2.3d
Do you publicly disclose a list of all the research organizations that you fund?
CC2.3e
Please provide details of the other engagement activities that you undertake
CC2.3f
What processes do you have in place to ensure that all of your direct and indirect activities that influence policy are consistent with your overall climate change strategy?
CC2.3g
Please explain why you do not engage with policy makers
The Bank is part of various industry trade associations and supports industry level climate change initiatives and thought leaderships produced from time to time. However, the Bank does not engage directly with the policy makers on climate change.
Further Information
Page: CC3. Targets and Initiatives
CC3.1
Did you have an emissions reduction or renewable energy consumption or production target that was active (ongoing or reached completion) in the reporting year?
No
CC3.1a
Please provide details of your absolute target
ID
Scope
% of emissions in
scope
% reduction from base year
Base year
Base year emissions covered by
target (metric tonnes CO2e)
Target year
Is this a science-
based target?
Comment
CC3.1b
Please provide details of your intensity target
ID
Scope
% of emissions in
scope
% reduction from base
year
Metric
Base year
Normalized base year emissions covered by
target
Target year
Is this a science-based target?
Comment
CC3.1c
Please also indicate what change in absolute emissions this intensity target reflects
ID
Direction of change anticipated in absolute Scope 1+2 emissions at
target completion?
% change anticipated in absolute Scope 1+2
emissions
Direction of change anticipated in absolute Scope 3 emissions at target
completion?
% change anticipated in absolute Scope 3
emissions
Comment
CC3.1d
Please provide details of your renewable energy consumption and/or production target

ID
Energy types
covered by target
Base year
Base year energy for energy type covered
(MWh)
% renewable
energy in base year
Target year
% renewable
energy in target year
Comment
CC3.1e
For all of your targets, please provide details on the progress made in the reporting year
ID
% complete (time)
% complete (emissions or renewable energy)
Comment
CC3.1f
Please explain (i) why you do not have a target; and (ii) forecast how your emissions will change over the next five years
The Bank is still in the process of establishing a comprehensive company-wide energy and carbon footprint. The Bank is currently undergoing a phase of integration with expanding operations and a nation-wide footprint. The Bank will assess for suitable targets to be adopted across its locations. Effective April 1, 2015, the Bank has merged ING Vysya Bank with itself. The footprint of the organisation has now almost increased to 1,333 branches and 2,032 ATMs across 674 locations across India. While the Bank has expanded its presence, the increase in brick and mortar branches will not be as accelerated due to the increased focus on digital banking. Hence, over the next five years, the Bank’s emission impact will be moderated.

CC3.2
Do you classify any of your existing goods and/or services as low carbon products or do they enable a third party to avoid GHG emissions?
No
CC3.2a
Please provide details of your products and/or services that you classify as low carbon products or that enable a third party to avoid GHG emissions
Level of
aggregation
Description of product/Group
of products
Are you reporting
low carbon product/s or
avoided emissions?
Taxonomy, project or methodology used to classify product/s as
low carbon or to calculate avoided
emissions
% revenue from
low carbon product/s in the reporting year
% R&D in low
carbon product/s in the reporting
year
Comment
CC3.3
Did you have emissions reduction initiatives that were active within the reporting year (this can include those in the planning and/or implementation phases)
No
CC3.3a
Please identify the total number of projects at each stage of development, and for those in the implementation stages, the estimated CO2e savings
Stage of development
Number of projects
Total estimated annual CO2e savings in metric tonnes CO2e (only for rows marked *)
CC3.3b
For those initiatives implemented in the reporting year, please provide details in the table below
Activity type
Description of activity
Estimated annual CO2e
savings (metric tonnes
CO2e)
Scope
Voluntary/ Mandatory
Annual monetary savings (unit currency - as specified in
CC0.4)
Investment required (unit currency - as specified in
CC0.4)
Payback period
Estimated lifetime of
the initiative
Comment
CC3.3c
What methods do you use to drive investment in emissions reduction activities?
Method
Comment
CC3.3d

If you do not have any emissions reduction initiatives, please explain why not
We continuously strive towards improving operational efficiencies to reduce energy consumption, thereby avoiding GHG emissions through various energy management initiatives. In absence of such initiatives, our operations would have consumed more energy leading to more GHG emissions. We commit to reducing energy consumption of some high energy intensive areas like Data centers through introduction of various energy saving techniques. Water Based chillers, Server Virtualization, Desktop virtualization , Implementation of Cold Aisle Containment (separating cold and hot aisle in the Data Center) are some techniques that have helped us in reducing energy consumption in Data Center, making us greener and highly energy efficient. Though we educate customers to move to paperless transactions, through internet and mobile banking, thereby avoiding the usage of paper, we are yet to conduct a comprehensive carbon footprint which will enable us to report emission reduction initiatives in the coming years.
Further Information
Page: CC4. Communication
CC4.1
Have you published information about your organization’s response to climate change and GHG emissions performance for this reporting year in places other than in your CDP response? If so, please attach the publication(s)
Publication
Status
Page/Section reference
Attach the document
Comment
In mainstream reports (including an integrated report) but have not used the CDSB Framework
Complete Please refer Principle 6 of the Business Responsibility Report.
https://www.cdp.net/sites/2016/95/10295/Climate Change 2016/Shared Documents/Attachments/CC4.1/KMBL Business Responsibility Report_2016.pdf
Further Information
Module: Risks and Opportunities

Page: CC5. Climate Change Risks
CC5.1
Have you identified any inherent climate change risks that have the potential to generate a substantive change in your business operations, revenue or expenditure? Tick all that apply
Risks driven by changes in regulation Risks driven by changes in physical climate parameters Risks driven by changes in other climate-related developments
CC5.1a
Please describe your inherent risks that are driven by changes in regulation
Risk driver
Description
Potential impact
Timeframe
Direct/ Indirect
Likelihood
Magnitude of impact
Estimated financial
implications
Management
method
Cost of
management
Emission reporting obligations
Although currently emissions reporting is not a mandatory obligation in India, but it will be sooner or later, as the expected international climate change agreements in 2015 and voluntary commitment of India to reduce GHG emissions intensity by 20% by
Increased operational cost
3 to 6 years
Direct Likely Low
The financial implications will be primarily related to setting up monitoring, reporting and verification (MRV) mechanism for emissions reporting.
The Bank is taking proactive measures to voluntarily report on emissions and is exploring possibilities to establish a comprehensive MRV mechanism for emissions reporting
The Bank has not yet estimated cost of management for emissions reporting.

Risk driver
Description
Potential impact
Timeframe
Direct/ Indirect
Likelihood
Magnitude of impact
Estimated financial
implications
Management
method
Cost of
management
2020 may result into some form of voluntary or mandatory emissions disclosure in India. This obligation will also be extending to financial institutions like Banks.
Fuel/energy taxes and regulations
The rising energy security issues related to availability and affordability of fuels like coal, natural gas and diesel may lead to additional taxes and regulations on fuels and energy. This may have an impact on operational costs of the Bank.
Increased operational cost
1 to 3 years
Direct Likely Low-medium
The financial implications will be primarily related to increased operational costs for procuring fuel and energy for Bank’s operations
The Bank has taken various energy efficiency measures to reduce its energy intensity in primary areas of energy consumption like improving technology in Data Centers, air conditioning and lighting, server virtualization, cold aisle containment etc. LEED certification for design and operations for two offices in Mumbai and Bangalore are also in place.
The Bank takes various efficiency improvement projects and cost of management is related to capital expenditure projects for energy efficiency, retrofitting costs for lighting and operational costs for maintaining green building efficiencies.
International agreements
The recent climate talks concluded in Paris in December 2015 resulted in
Increased operational cost
3 to 6 years
Indirect (Client)
Likely Low
The financial implications will be primarily
The Bank is taking proactive measures to voluntarily report on emissions and is
The Bank has not yet estimated cost of management for

Risk driver
Description
Potential impact
Timeframe
Direct/ Indirect
Likelihood
Magnitude of impact
Estimated financial
implications
Management
method
Cost of
management
the creation of an internationally binding climate change agreement which now may lead to domestic actions on emissions reductions by various industries, pushing key carbon intensive sectors to take-up emissions reduction projects.
related to setting up monitoring, reporting and verification (MRV) mechanism for emissions reporting.
exploring possibilities to establish a comprehensive MRV mechanism for emissions reporting.
emissions reporting.
CC5.1b
Please describe your inherent risks that are driven by changes in physical climate parameters
Risk driver
Description
Potential impact
Timeframe
Direct/ Indirect
Likelihood
Magnitude of impact
Estimated financial
implications
Management
method
Cost of
management
Change in precipitation extremes and droughts
The global warming causes changes in climate patterns leading to changes in precipitation extremes and droughts. These
Reduced demand for goods/services
Unknown Indirect (Client)
Likely Medium-high
The financial implications could be related to increased delinquency ratio of Bank’s agriculture and
The credit risk for the bank is being continually assessed through its credit portfolio to understand the credit risk.

Risk driver
Description
Potential impact
Timeframe
Direct/ Indirect
Likelihood
Magnitude of impact
Estimated financial
implications
Management
method
Cost of
management
calamities may adversely impact sectors like agriculture and healthcare. The Bank is vulnerable to increased credit risk due to its exposure to agriculture and allied sectors.
allied sector loans and loss for business opportunities in these sectors.
However, currently there is no risk assessment specific to climate change.
CC5.1c
Please describe your inherent risks that are driven by changes in other climate-related developments
Risk driver
Description
Potential impact
Timeframe
Direct/ Indirect
Likelihood
Magnitude of impact
Estimated financial
implications
Management
method
Cost of
management
Reputation
KMBL is one of the leading Bank in private sector in India . Hence the Bank is subjected to reputational risks arising from its non-commitment to the cause of climate change mitigation and adaptation. The Bank may also indirectly
Reduction in capital availability
1 to 3 years
Direct Likely Medium-high
The financial implications could be related to diminished brand value and low confidence of environmentally and social responsible investors
The Bank has adopted Policy Statement on Environment to express its commitment towards sound environmental management. The Bank also discloses on Business
The cost management includes costs associated with monitoring and reporting on Business Responsibility and carbon emissions in various forums.

Risk driver
Description
Potential impact
Timeframe
Direct/ Indirect
Likelihood
Magnitude of impact
Estimated financial
implications
Management
method
Cost of
management
face reputational risks, should it be involved in lending to environmentally sensitive projects which may have significant public opposition.
Responsibility initiatives through Business Responsibility Report and emissions reporting through CDP.
CC5.1d
Please explain why you do not consider your company to be exposed to inherent risks driven by changes in regulation that have the potential to generate a substantive change in your business operations, revenue or expenditure
CC5.1e
Please explain why you do not consider your company to be exposed to inherent risks driven by physical climate parameters that have the potential to generate a substantive change in your business operations, revenue or expenditure
CC5.1f
Please explain why you do not consider your company to be exposed to inherent risks driven by changes in other climate-related developments that have the potential to generate a substantive change in your business operations, revenue or expenditure
Further Information
Page: CC6. Climate Change Opportunities
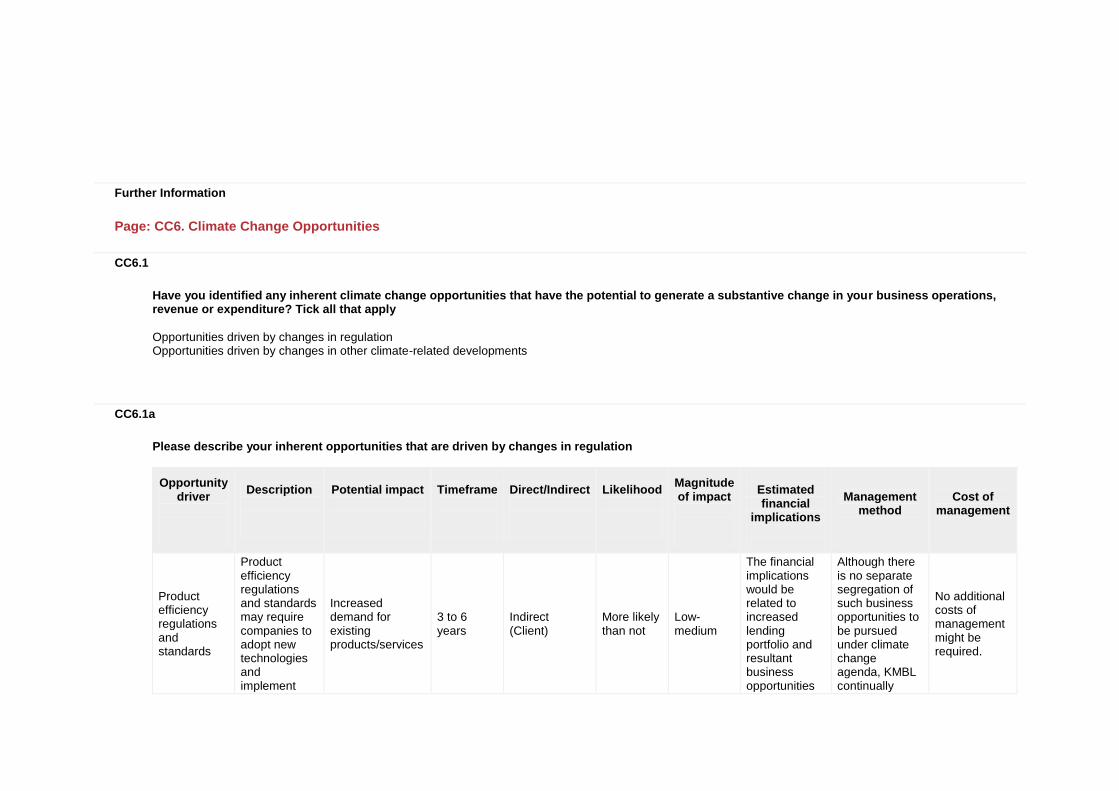
CC6.1
Have you identified any inherent climate change opportunities that have the potential to generate a substantive change in your business operations, revenue or expenditure? Tick all that apply
Opportunities driven by changes in regulation Opportunities driven by changes in other climate-related developments
CC6.1a
Please describe your inherent opportunities that are driven by changes in regulation
Opportunity driver
Description
Potential impact
Timeframe
Direct/Indirect
Likelihood
Magnitude of impact
Estimated financial
implications
Management
method
Cost of
management
Product efficiency regulations and standards
Product efficiency regulations and standards may require companies to adopt new technologies and implement
Increased demand for existing products/services
3 to 6 years
Indirect (Client)
More likely than not
Low-medium
The financial implications would be related to increased lending portfolio and resultant business opportunities
Although there is no separate segregation of such business opportunities to be pursued under climate change agenda, KMBL continually
No additional costs of management might be required.
Opportunity driver
Description
Potential impact
Timeframe
Direct/Indirect
Likelihood
Magnitude of impact
Estimated financial
implications
Management
method
Cost of
management
new projects. This provides the Bank a business opportunity to lend to such projects.
to lend to clients in adopting new technologies
lends to projects related with technology upgradation or process upgradation for product efficiency,
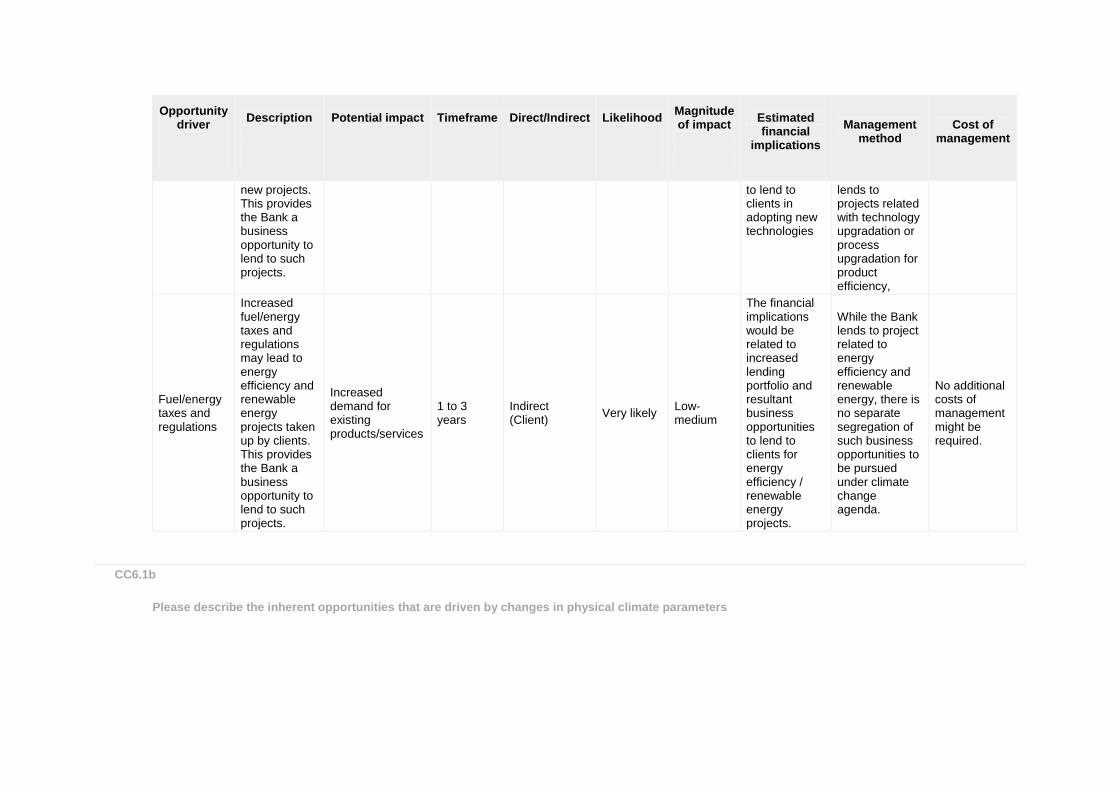
Fuel/energy taxes and regulations
Increased fuel/energy taxes and regulations may lead to energy efficiency and renewable energy projects taken up by clients. This provides the Bank a business opportunity to lend to such projects.
Increased demand for existing products/services
1 to 3 years
Indirect (Client)
Very likely Low-medium
The financial implications would be related to increased lending portfolio and resultant business opportunities to lend to clients for energy efficiency / renewable energy projects.
While the Bank lends to project related to energy efficiency and renewable energy, there is no separate segregation of such business opportunities to be pursued under climate change agenda.
No additional costs of management might be required.
CC6.1b
Please describe the inherent opportunities that are driven by changes in physical climate parameters
Opportunity driver
Description
Potential impact
Timeframe
Direct/ Indirect
Likelihood
Magnitude of impact
Estimated financial
implications
Management
method
Cost of
management
CC6.1c
Please describe the inherent opportunities that are driven by changes in other climate-related developments
Opportunity driver
Description
Potential impact
Timeframe
Direct/ Indirect
Likelihood
Magnitude of impact
Estimated financial
implications
Management
method
Cost of
management
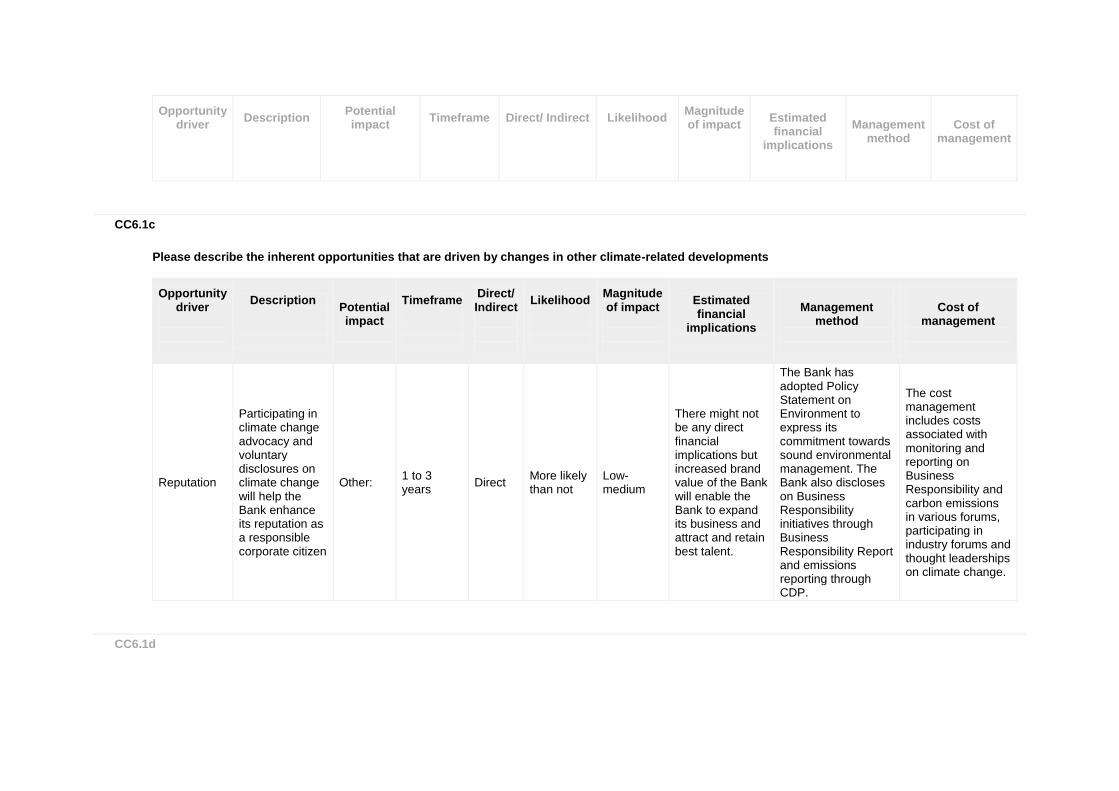
Reputation
Participating in climate change advocacy and voluntary disclosures on climate change will help the Bank enhance its reputation as a responsible corporate citizen
Other: 1 to 3 years
Direct More likely than not
Low-medium
There might not be any direct financial implications but increased brand value of the Bank will enable the Bank to expand its business and attract and retain best talent.
The Bank has adopted Policy Statement on Environment to express its commitment towards sound environmental management. The Bank also discloses on Business Responsibility initiatives through Business Responsibility Report and emissions reporting through CDP.
The cost management includes costs associated with monitoring and reporting on Business Responsibility and carbon emissions in various forums, participating in industry forums and thought leaderships on climate change.
CC6.1d

Please explain why you do not consider your company to be exposed to inherent opportunities driven by changes in regulation that have the potential to generate a substantive change in your business operations, revenue or expenditure
CC6.1e
Please explain why you do not consider your company to be exposed to inherent opportunities driven by physical climate parameters that have the potential to generate a substantive change in your business operations, revenue or expenditure
Currently we do not anticipate significant opportunities driven by physical climate parameter that will have the potential to generate a substantive change in the Bank’s business operations, revenue or expenditure.
CC6.1f
Please explain why you do not consider your company to be exposed to inherent opportunities driven by changes in other climate-related developments that have the potential to generate a substantive change in your business operations, revenue or expenditure
Further Information
Module: GHG Emissions Accounting, Energy and Fuel Use, and Trading
Page: CC7. Emissions Methodology
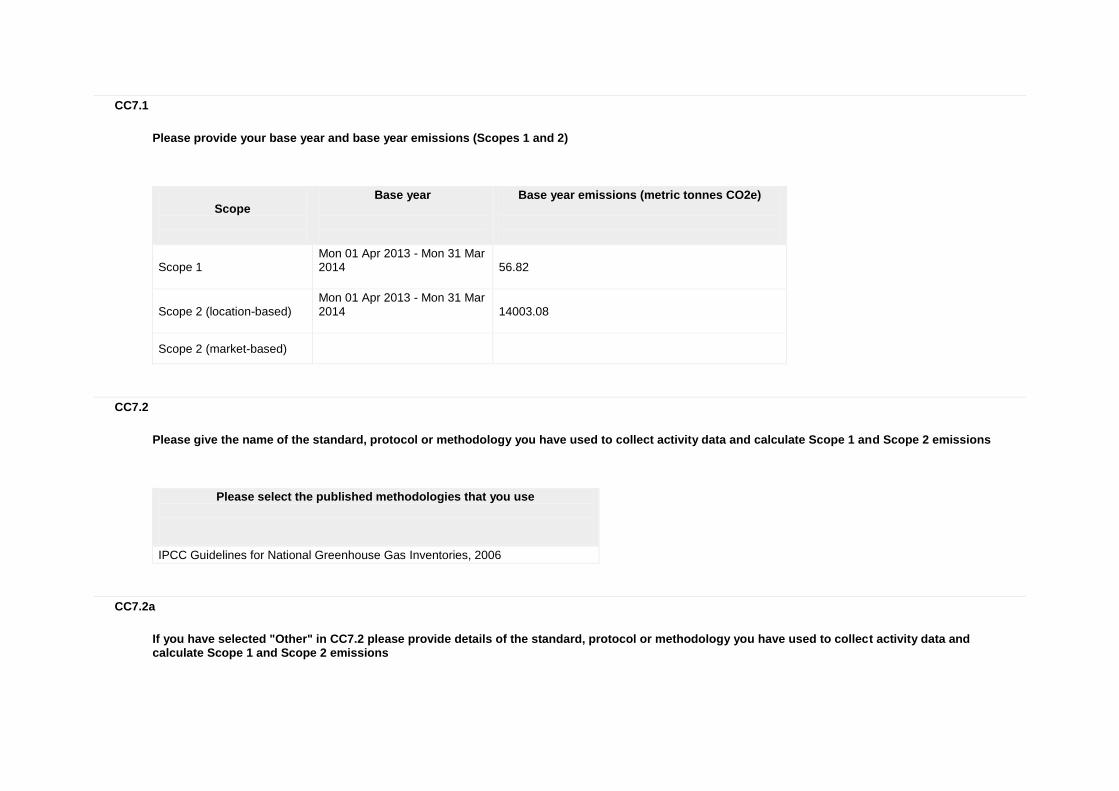
CC7.1
Please provide your base year and base year emissions (Scopes 1 and 2)
Scope
Base year
Base year emissions (metric tonnes CO2e)
Scope 1 Mon 01 Apr 2013 - Mon 31 Mar 2014
56.82
Scope 2 (location-based) Mon 01 Apr 2013 - Mon 31 Mar 2014
14003.08
Scope 2 (market-based)
CC7.2
Please give the name of the standard, protocol or methodology you have used to collect activity data and calculate Scope 1 and Scope 2 emissions
Please select the published methodologies that you use
IPCC Guidelines for National Greenhouse Gas Inventories, 2006
CC7.2a
If you have selected "Other" in CC7.2 please provide details of the standard, protocol or methodology you have used to collect activity data and calculate Scope 1 and Scope 2 emissions
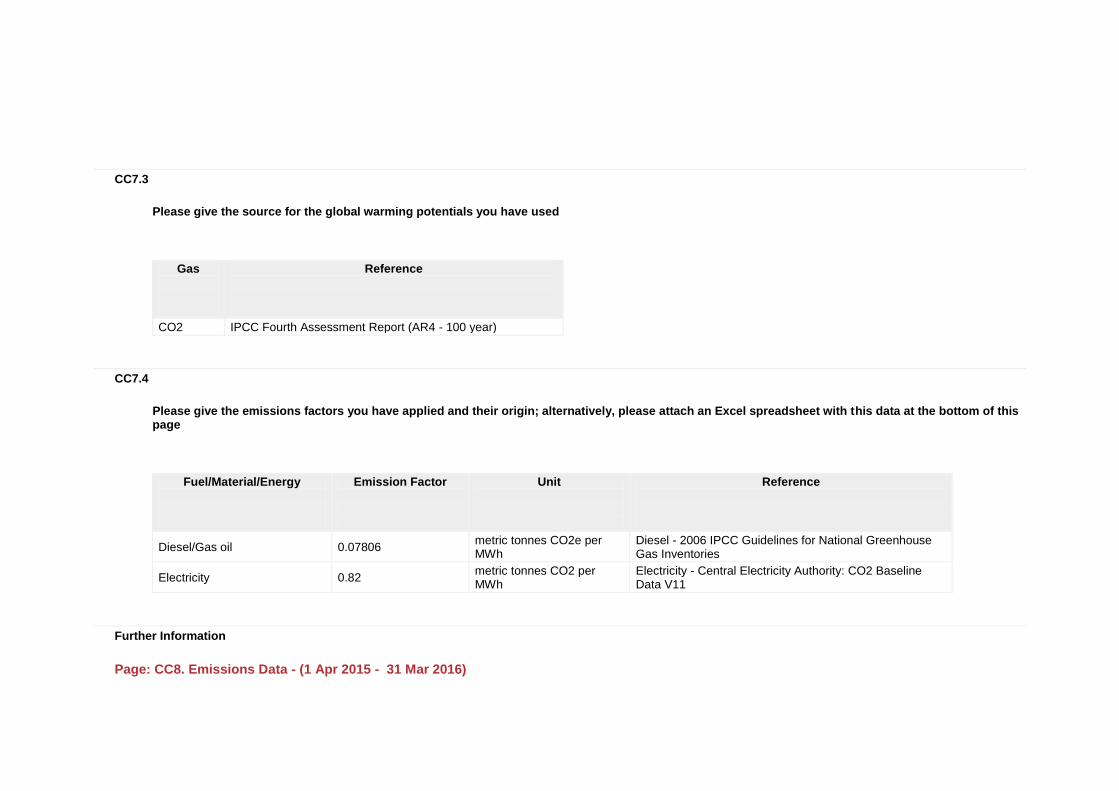
CC7.3
Please give the source for the global warming potentials you have used
Gas
Reference
CO2 IPCC Fourth Assessment Report (AR4 - 100 year)
CC7.4
Please give the emissions factors you have applied and their origin; alternatively, please attach an Excel spreadsheet with this data at the bottom of this page
Fuel/Material/Energy
Emission Factor
Unit
Reference
Diesel/Gas oil 0.07806 metric tonnes CO2e per MWh
Diesel - 2006 IPCC Guidelines for National Greenhouse Gas Inventories
Electricity 0.82 metric tonnes CO2 per MWh
Electricity - Central Electricity Authority: CO2 Baseline Data V11
Further Information
Page: CC8. Emissions Data - (1 Apr 2015 - 31 Mar 2016)
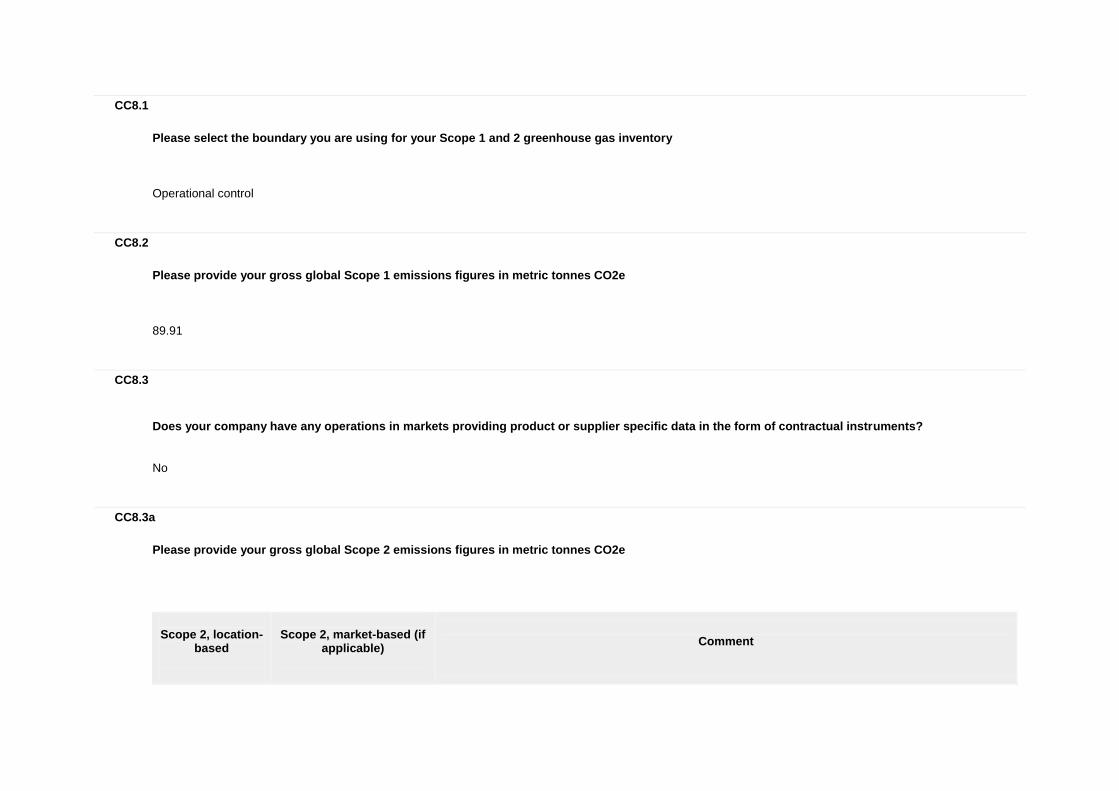
CC8.1
Please select the boundary you are using for your Scope 1 and 2 greenhouse gas inventory
Operational control
CC8.2
Please provide your gross global Scope 1 emissions figures in metric tonnes CO2e
89.91
CC8.3
Does your company have any operations in markets providing product or supplier specific data in the form of contractual instruments?
No
CC8.3a
Please provide your gross global Scope 2 emissions figures in metric tonnes CO2e
Scope 2, location-
based
Scope 2, market-based (if
applicable)
Comment

Scope 2, location-
based
Scope 2, market-based (if
applicable)
Comment
16975.61
Electricity purchased by all our locations is sourced through the national grid. We do not have any specific contractual instruments that may include energy attribute certificates or supplier specific emission factors.
CC8.4
Are there are any sources (e.g. facilities, specific GHGs, activities, geographies, etc.) of Scope 1 and Scope 2 emissions that are within your selected reporting boundary which are not included in your disclosure?
Yes
CC8.4a
Please provide details of the sources of Scope 1 and Scope 2 emissions that are within your selected reporting boundary which are not included in your disclosure
Source
Relevance of
Scope 1 emissions from
this source
Relevance of
location-based Scope 2
emissions from this source
Relevance of market-based
Scope 2 emissions from this source (if
applicable)
Explain why the source is excluded
1,333 Branches and 2,032 ATMS
Emissions are relevant but not yet calculated
Emissions are relevant but not yet calculated
No emissions from this source
The Bank has made an attempt to capture the emissions from two key corporate offices in Mumbai (Kotak Infiniti, Malad (East) and 27BKC, Bandra Kurla Complex) and two key offices from Delhi (Noida and Aerocity) which houses approximately 17.34 % of our workforce including other Kotak group companies. The Bank is in the process of establishing systems to capture emissions details from other relevant locations.
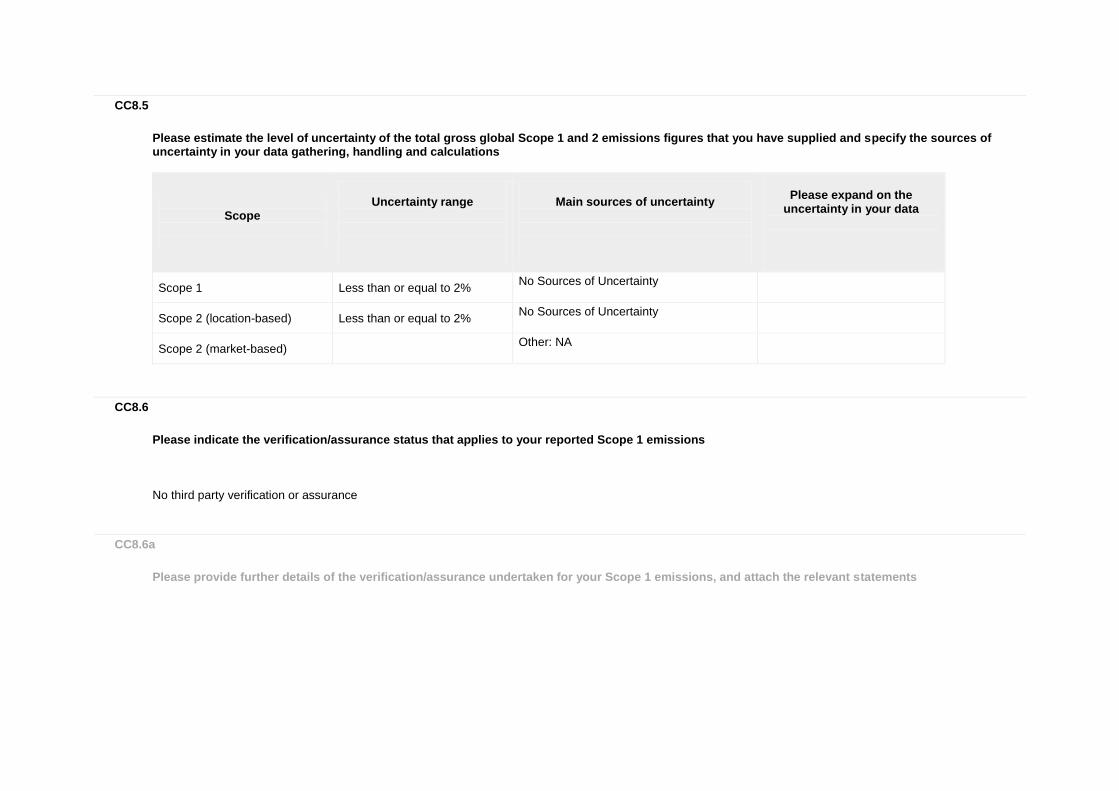
CC8.5
Please estimate the level of uncertainty of the total gross global Scope 1 and 2 emissions figures that you have supplied and specify the sources of uncertainty in your data gathering, handling and calculations
Scope
Uncertainty range
Main sources of uncertainty
Please expand on the
uncertainty in your data
Scope 1 Less than or equal to 2% No Sources of Uncertainty
Scope 2 (location-based) Less than or equal to 2% No Sources of Uncertainty
Scope 2 (market-based)
Other: NA
CC8.6
Please indicate the verification/assurance status that applies to your reported Scope 1 emissions
No third party verification or assurance
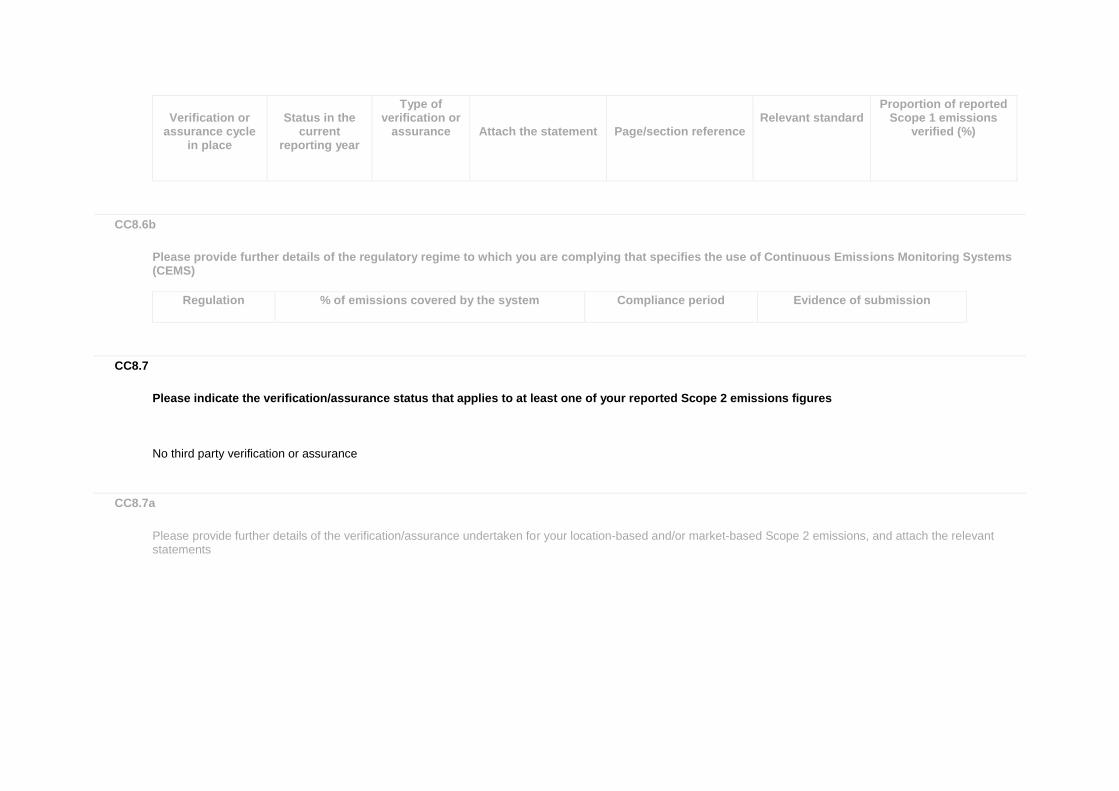
CC8.6a
Please provide further details of the verification/assurance undertaken for your Scope 1 emissions, and attach the relevant statements
Verification or
assurance cycle in place
Status in the
current reporting year
Type of verification or
assurance
Attach the statement
Page/section reference
Relevant standard
Proportion of reported Scope 1 emissions
verified (%)
CC8.6b
Please provide further details of the regulatory regime to which you are complying that specifies the use of Continuous Emissions Monitoring Systems (CEMS)
Regulation
% of emissions covered by the system
Compliance period
Evidence of submission
CC8.7
Please indicate the verification/assurance status that applies to at least one of your reported Scope 2 emissions figures
No third party verification or assurance
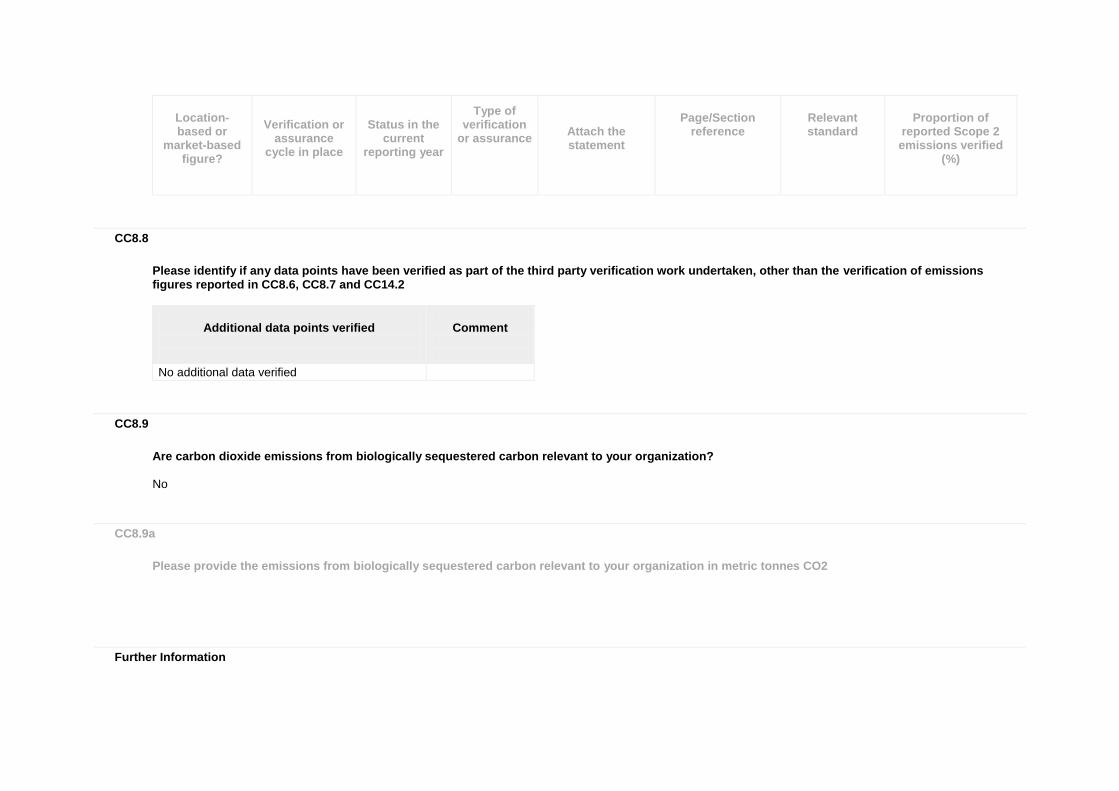
CC8.7a
Please provide further details of the verification/assurance undertaken for your location-based and/or market-based Scope 2 emissions, and attach the relevant statements
Location-based or
market-based figure?
Verification or
assurance cycle in place
Status in the
current reporting year
Type of verification
or assurance
Attach the statement
Page/Section reference
Relevant standard
Proportion of
reported Scope 2 emissions verified
(%)
CC8.8
Please identify if any data points have been verified as part of the third party verification work undertaken, other than the verification of emissions figures reported in CC8.6, CC8.7 and CC14.2
Additional data points verified
Comment
No additional data verified
CC8.9
Are carbon dioxide emissions from biologically sequestered carbon relevant to your organization?
No
CC8.9a
Please provide the emissions from biologically sequestered carbon relevant to your organization in metric tonnes CO2
Further Information
Page: CC9. Scope 1 Emissions Breakdown - (1 Apr 2015 - 31 Mar 2016)
CC9.1
Do you have Scope 1 emissions sources in more than one country?
No
CC9.1a
Please break down your total gross global Scope 1 emissions by country/region
Country/Region
Scope 1 metric tonnes CO2e
CC9.2
Please indicate which other Scope 1 emissions breakdowns you are able to provide (tick all that apply)
By facility By GHG type
CC9.2a
Please break down your total gross global Scope 1 emissions by business division

Business division
Scope 1 emissions (metric tonnes CO2e)
CC9.2b
Please break down your total gross global Scope 1 emissions by facility
Facility
Scope 1 emissions (metric tonnes CO2e)
Latitude
Longitude
27 BKC , Bandra kurla complex, Mumbai
14.41 19.061 72.865
Kotak Infinity Malad (E) Mumbai 30.27 19.177 72.882
Noida (Plot no 7, Sector 125) 41.27 28.54 77.33
Aerocity (Asset no 9, IBIS Commercial Complex)
3.95 28.54 77.12
CC9.2c
Please break down your total gross global Scope 1 emissions by GHG type
GHG type
Scope 1 emissions (metric tonnes CO2e)
CO2 88.37
CH4 0.09

GHG type
Scope 1 emissions (metric tonnes CO2e)
N2O 1.44
CC9.2d
Please break down your total gross global Scope 1 emissions by activity
Activity
Scope 1 emissions (metric tonnes CO2e)
Further Information
Page: CC10. Scope 2 Emissions Breakdown - (1 Apr 2015 - 31 Mar 2016)
CC10.1
Do you have Scope 2 emissions sources in more than one country?
No
CC10.1a
Please break down your total gross global Scope 2 emissions and energy consumption by country/region
Country/Region
Scope 2, location-based (metric
tonnes CO2e)
Scope 2, market-based (metric tonnes CO2e)
Purchased and consumed electricity, heat, steam or cooling
(MWh)
Purchased and consumed low carbon electricity, heat, steam or cooling
accounted in market-based approach (MWh)
CC10.2
Please indicate which other Scope 2 emissions breakdowns you are able to provide (tick all that apply)
By facility
CC10.2a
Please break down your total gross global Scope 2 emissions by business division
Business division
Scope 2 emissions, location based (metric tonnes CO2e)
Scope 2 emissions, market-based
(metric tonnes CO2e)
CC10.2b
Please break down your total gross global Scope 2 emissions by facility

Facility
Scope 2 emissions, location based (metric tonnes CO2e)
Scope 2 emissions, market-based
(metric tonnes CO2e)
27 BKC , Bandra kurla complex, Mumbai 3184.98
Kotak Infinity Malad (E) Mumbai 12617.97
Noida (Plot no 7, Sector 125) 778.59
Aerocity (Asset no 9, IBIS Commercial Complex) 394.08
CC10.2c
Please break down your total gross global Scope 2 emissions by activity
Activity
Scope 2 emissions, location based (metric tonnes CO2e)
Scope 2 emissions, market-based
(metric tonnes CO2e)
Further Information
Page: CC11. Energy
CC11.1
What percentage of your total operational spend in the reporting year was on energy?
More than 0% but less than or equal to 5%
CC11.2

Please state how much heat, steam, and cooling in MWh your organization has purchased and consumed during the reporting year
Energy type
Energy purchased and consumed (MWh)
Heat 0.00
Steam 0.00
Cooling 0.00
CC11.3
Please state how much fuel in MWh your organization has consumed (for energy purposes) during the reporting year
331.26
CC11.3a
Please complete the table by breaking down the total "Fuel" figure entered above by fuel type
Fuels
MWh
Diesel/Gas oil 331.26
CC11.4

Please provide details of the electricity, heat, steam or cooling amounts that were accounted at a low carbon emission factor in the market-based Scope 2 figure reported in CC8.3a
Basis for applying a low carbon emission factor
MWh consumed associated with low carbon electricity, heat, steam or
cooling
Comment
No purchases or generation of low carbon electricity, heat, steam or cooling accounted with a low carbon emissions factor
CC11.5
Please report how much electricity you produce in MWh, and how much electricity you consume in MWh
Total
electricity consumed
(MWh)
Consumed
electricity that is purchased (MWh)
Total
electricity produced
(MWh)
Total renewable
electricity produced (MWh)
Consumed renewable electricity
that is produced by
company (MWh)
Comment
20701.96 20701.96 0.00 0.00 0.00 100% of the electricity consumed at all the locations within the reporting boundary has been purchased from the respective electricity boards.
Further Information
Page: CC12. Emissions Performance
CC12.1

How do your gross global emissions (Scope 1 and 2 combined) for the reporting year compare to the previous year?
Increased
CC12.1a
Please identify the reasons for any change in your gross global emissions (Scope 1 and 2 combined) and for each of them specify how your emissions compare to the previous year
Reason
Emissions value
(percentage)
Direction of change
Please explain and include calculation
Emissions reduction activities
Divestment
Acquisitions
Mergers
Change in output
Change in methodology
Change in boundary
8.03 Increase This year we included two new office facilities - Noida (Uttar Pradesh, India) and Aerocity (New Delhi, India) into our reporting boundary. The combined Scope 1 and 2 emissions of these two offices were 1217.89 tCO2e, which is an 8.03% increase of last reporting year's emission value of 15172.28 tCO2e.
Change in physical operating conditions
4.45 Increase
This year, due to the ongoing activities related to the integration of ertwhile ING Vysya Bank with KMBL, our office facilities have been used more extensively compared to the previous reporing year, leading to an increase in absolute energy consumption. There was an increase in emissions at the two existing office locations at 27BKC and Kotak Infinity by 675.34 tCO2e which is 4.45% of the previous reporting years' emission value of 15172.28 tCO2e.
Unidentified
Other
CC12.1b

Is your emissions performance calculations in CC12.1 and CC12.1a based on a location-based Scope 2 emissions figure or a market-based Scope 2 emissions figure?
Location-based
CC12.2
Please describe your gross global combined Scope 1 and 2 emissions for the reporting year in metric tonnes CO2e per unit currency total revenue
Intensity figure =
Metric numerator (Gross global combined
Scope 1 and 2 emissions)
Metric denominator:
Unit total revenue
Scope 2 figure used
% change
from previous
year
Direction of change
from previous
year
Reason for change
0.000000090 metric tonnes CO2e 18996.42 Location-based
30.44 Decrease
In FY 2015-16, the Bank increased its revenue by over 61% (Due to the merger with ING Vysa Bank) whereas the corresponding increase in emissions was nearly 12%. The scope of reporting for emissions was also increased to included two more offices from Delhi than the last reporting period
CC12.3
Please provide any additional intensity (normalized) metrics that are appropriate to your business operations
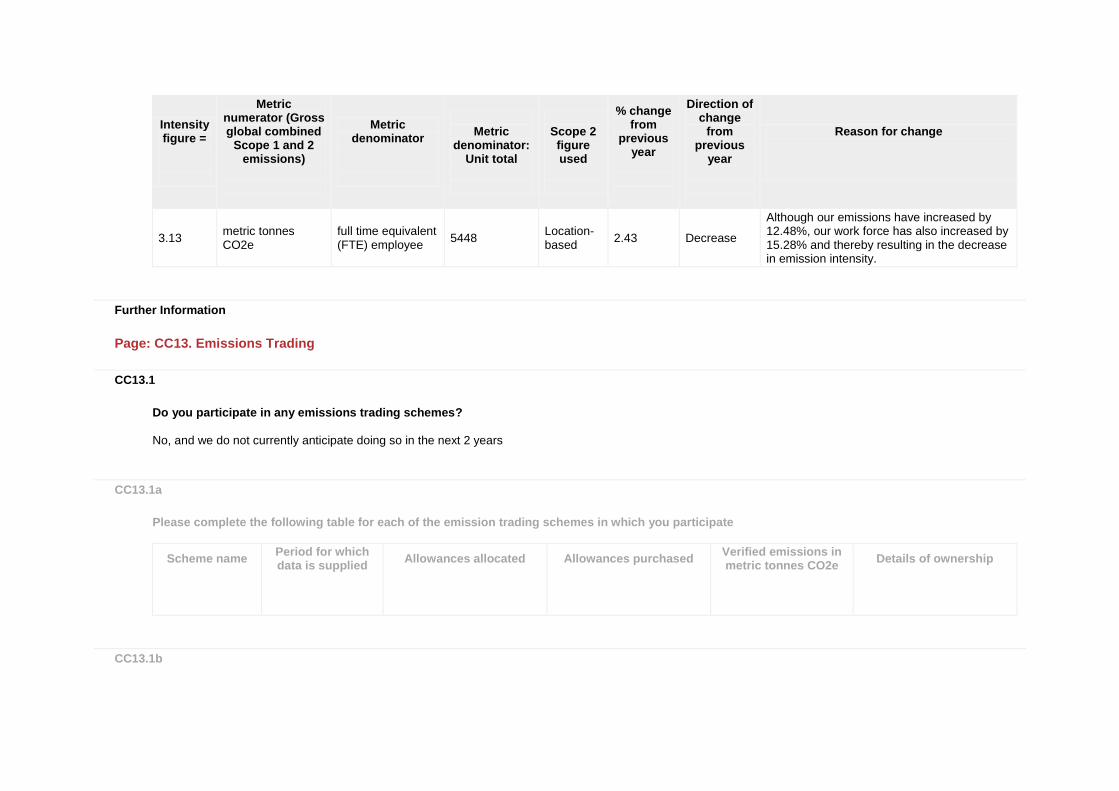
Intensity figure =
Metric numerator (Gross global combined
Scope 1 and 2 emissions)
Metric denominator
Metric
denominator: Unit total
Scope 2 figure used
% change from
previous year
Direction of change
from previous
year
Reason for change
3.13 metric tonnes CO2e
full time equivalent (FTE) employee
5448 Location-based
2.43 Decrease
Although our emissions have increased by 12.48%, our work force has also increased by 15.28% and thereby resulting in the decrease in emission intensity.
Further Information
Page: CC13. Emissions Trading
CC13.1
Do you participate in any emissions trading schemes?
No, and we do not currently anticipate doing so in the next 2 years
CC13.1a
Please complete the following table for each of the emission trading schemes in which you participate
Scheme name
Period for which data is supplied
Allowances allocated
Allowances purchased
Verified emissions in metric tonnes CO2e
Details of ownership
CC13.1b
What is your strategy for complying with the schemes in which you participate or anticipate participating?
CC13.2
Has your organization originated any project-based carbon credits or purchased any within the reporting period?
No
CC13.2a
Please provide details on the project-based carbon credits originated or purchased by your organization in the reporting period
Credit origination
or credit purchase
Project type
Project identification
Verified to which standard
Number of credits (metric
tonnes of CO2e)
Number of credits (metric tonnes
CO2e): Risk adjusted volume
Credits cancelled
Purpose, e.g. compliance
Further Information
Page: CC14. Scope 3 Emissions
CC14.1
Please account for your organization’s Scope 3 emissions, disclosing and explaining any exclusions

Sources of Scope 3
emissions
Evaluation status
metric tonnes CO2e
Emissions calculation methodology
Percentage of emissions
calculated using data obtained
from suppliers or value chain
partners
Explanation
Purchased goods and services
Relevant, not yet calculated
We are yet to conduct comprehensive Carbon Footprint to assess our scope 3 emissions
Capital goods Relevant, not yet calculated
We are yet to conduct comprehensive Carbon Footprint to assess our scope 3 emissions
Fuel-and-energy-related activities (not included in Scope 1 or 2)
Not evaluated
We are yet to conduct comprehensive Carbon Footprint to assess our scope 3 emissions
Upstream transportation and distribution
Not evaluated
We are yet to conduct comprehensive Carbon Footprint to assess our scope 3 emissions
Waste generated in operations
Not evaluated
We are yet to conduct comprehensive Carbon Footprint to assess our scope 3 emissions
Business travel Relevant, calculated
7802.13
For all business air travel the sector of travel and distance travelled is recorded. Using passenger kilometers and default emission factors, the emissions generated are estimated. Source of Emission Factors: http://www.ghgprotocol.org/calculation-tools/all-tools - Emission Factor from cross sector tools excel. Under this methodology the travels are categorized as Domestic (<463 km), International Short Haul >= 463 km & <1108 km) & International Long Haul (>= 1108 km). For each journey, the distance between the starting point and destination is calculated and the total passenger km in each category is then used to calculate the total emissions by multiplying with the emission factors given in the above tool

Sources of Scope 3
emissions
Evaluation status
metric tonnes CO2e
Emissions calculation methodology
Percentage of emissions
calculated using data obtained
from suppliers or value chain
partners
Explanation
Employee commuting
Relevant, calculated
We are yet to conduct comprehensive Carbon Footprint to assess our scope 3 emissions
Upstream leased assets
Not evaluated
We are yet to conduct comprehensive Carbon Footprint to assess our scope 3 emissions
Downstream transportation and distribution
Not evaluated
We are yet to conduct comprehensive Carbon Footprint to assess our scope 3 emissions
Processing of sold products
Not relevant, explanation provided
We are in banking service industry which does not have significant processing of sold products
Use of sold products
Not evaluated
We are yet to conduct comprehensive Carbon Footprint to assess our scope 3 emissions
End of life treatment of sold products
Not relevant, explanation provided
We are in banking service industry which does not have significant end of life treatment of sold products
Downstream leased assets
Not evaluated
We are yet to conduct comprehensive Carbon Footprint to assess our

Sources of Scope 3
emissions
Evaluation status
metric tonnes CO2e
Emissions calculation methodology
Percentage of emissions
calculated using data obtained
from suppliers or value chain
partners
Explanation
scope 3 emissions
Franchises Not relevant, explanation provided
There are no franchise operations for the Bank
Investments Not evaluated
We are yet to conduct comprehensive Carbon Footprint to assess our scope 3 emissions
Other (upstream)
Other (downstream)
CC14.2
Please indicate the verification/assurance status that applies to your reported Scope 3 emissions
No third party verification or assurance
CC14.2a
Please provide further details of the verification/assurance undertaken, and attach the relevant statements
Verification or
assurance cycle in place
Status in the
current reporting year
Type of
verification or assurance
Attach the statement
Page/Section reference
Relevant standard
Proportion of
reported Scope 3 emissions verified (%)
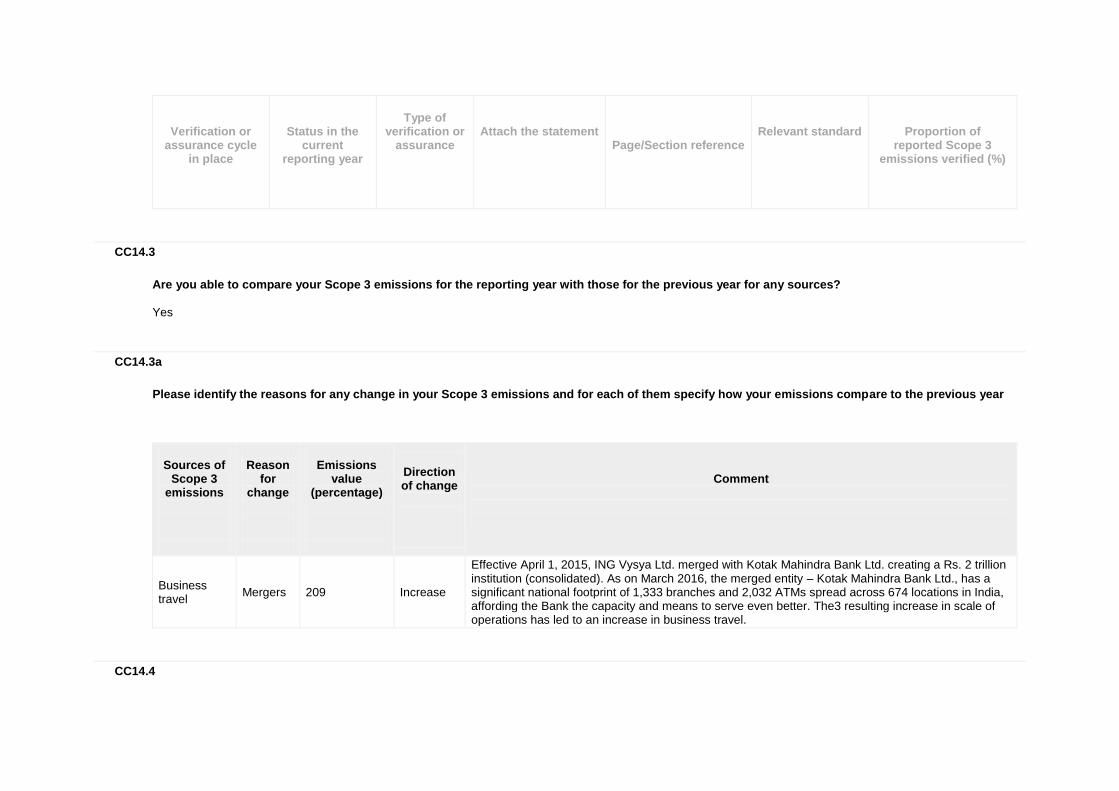
CC14.3
Are you able to compare your Scope 3 emissions for the reporting year with those for the previous year for any sources?
Yes
CC14.3a
Please identify the reasons for any change in your Scope 3 emissions and for each of them specify how your emissions compare to the previous year
Sources of
Scope 3 emissions
Reason
for change
Emissions
value (percentage)
Direction of change
Comment
Business travel
Mergers 209 Increase
Effective April 1, 2015, ING Vysya Ltd. merged with Kotak Mahindra Bank Ltd. creating a Rs. 2 trillion institution (consolidated). As on March 2016, the merged entity – Kotak Mahindra Bank Ltd., has a significant national footprint of 1,333 branches and 2,032 ATMs spread across 674 locations in India, affording the Bank the capacity and means to serve even better. The3 resulting increase in scale of operations has led to an increase in business travel.
CC14.4

Do you engage with any of the elements of your value chain on GHG emissions and climate change strategies? (Tick all that apply)
No, we do not engage
CC14.4a
Please give details of methods of engagement, your strategy for prioritizing engagement and measures of success
CC14.4b
To give a sense of scale of this engagement, please give the number of suppliers with whom you are engaging and the proportion of your total spend that they represent
Number of suppliers
% of total spend (direct and indirect)
Comment
CC14.4c
If you have data on your suppliers’ GHG emissions and climate change strategies, please explain how you make use of that data
How you make use of the data
Please give details
CC14.4d
Please explain why you do not engage with any elements of your value chain on GHG emissions and climate change strategies, and any plans you have to develop an engagement strategy in the future
We are currently focusing on mapping our climate change impacts across our value chain as we are in the service sector and our supply chain is complex. We will devise strategies to reduce our footprint across the value chain through effective collaborations with our customers and supply chain partners.
Further Information
Module: Sign Off
Page: CC15. Sign Off
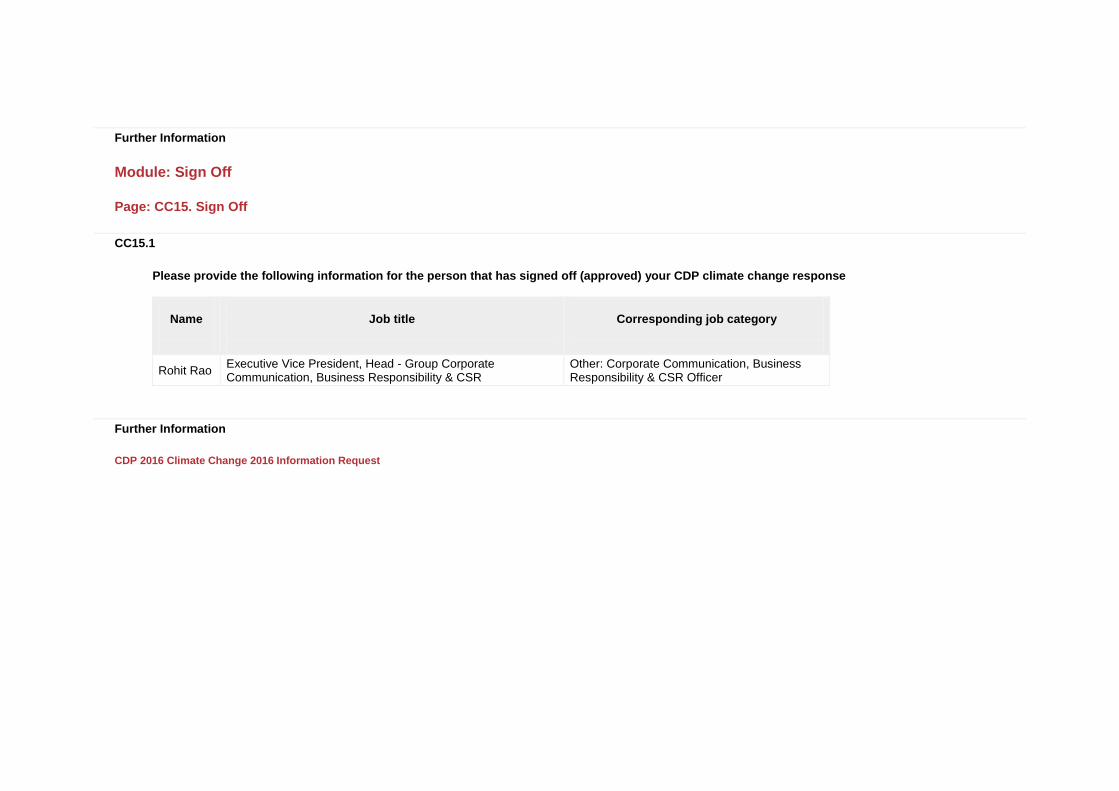
CC15.1
Please provide the following information for the person that has signed off (approved) your CDP climate change response
Name
Job title
Corresponding job category
Rohit Rao Executive Vice President, Head - Group Corporate Communication, Business Responsibility & CSR
Other: Corporate Communication, Business Responsibility & CSR Officer
Further Information
CDP 2016 Climate Change 2016 Information Request