@IJRTER-2016, All Rights Reserved 66
MONITORING HEALTH PARAMETERS USING WIRELESS
SENSOR NETWORKS
Jigar Chauhan1, Sachin Bojewar2 1Master of Engineering Student, Vidyalankar Institute of Technology
2Associate Professor, Vidyalankar Institute of Technology
Abstract— Wireless Sensor Network technologies have become a latest research area in health care
industries due to rapid maturity in improving the quality of life of a patient. Wireless Sensor
Networks when work in medical field provide continuous monitoring of vital health parameters
which over a long period of time provide doctors much needed help to make accurate diagnosis and
giving better treatment. In this paper we propose a model which monitors various health parameters
like heart rate (BPM), body temperature, blood pressure monitor (mm Hg) and ECG
(Electrocardiogram) of an individual. The collected data through the system is then transferred over
the internet to a smartphone application of the patient. This data is transferred to the registered
doctors on to their smartphone application. The doctor can then prescribe the medication based on
the data results shown by the system. The designed prototype will reduce the burden on patients to
visit the doctor every time for monitoring of these health parameters.
Keywords— WSN; Heart Rate (BPM); Blood Pressure Monitor; ECG; BPM Algorithm; Raspberry
Pi 3, Arduino Mega.
I. INTRODUCTION
Wireless sensor network (WSN) [4] is a network comprised of autonomous sensor devices which are
deployed in known locations for the purpose of monitoring and collecting data such as sound, radio
signals, temperature, pressure etc. [1] WSNs can be used in many industrial and civilian applications,
including industrial process monitoring and control, healthcare applications, habitat monitoring,
home automation and many others. [2]
Nowadays, health care systems are highly complex. People in need for continuous health care are
increasing day by day. Medical staff faces with more and more challenges. This raises serious
questions in the domain of medical which must be answered in the best possible ways.Problem
solving must include detailed analyses of the current state so as to form functional system which
resolves the satisfying number of issues which are to be faced in future. In medical WSNs can offer
this kind of solution. [3]
Driven by technology advancements in low-power networked systems and sensors in medical
science we have witnessed the emergence of Wireless Sensor Networks. WSNs are distributed
autonomous sensors to monitor physical or environmental conditions such as temperature, pressure,
sound etc. Intelligent Medical Sensor System models are always built using Wireless Sensor
Networks. The primary aim of our system is to gather the information of individual health
parameters based on WSN and to provide physicians with a clear data and readings which can be
used monitor the diagnosis of health parameters through mobile communication. This can be utilized
for individual investigation to help with rolling out conduct improvements, and to share with parental
figures for early detection and treatment. In the meantime such systems are successful and monetary
methods for observing ailments.

International Journal of Recent Trends in Engineering & Research (IJRTER) Volume 02, Issue 10; October - 2016 [ISSN: 2455-1457]
@IJRTER-2016, All Rights Reserved 67
II. BACKGROUND OVERVIEW
A. Traditional Approach
Wireless sensor network (WSN) [4] is a network comprised of autonomous sensor devices which are
usually deployed in known locations for the purpose of monitoring and collecting data such as radio
signals, sound, temperature, etc. Becoming mature enough to be used for improving the quality of
life, wireless sensor network technologies are considered as one of the key research areas in
computer science and healthcare application industries. The pervasive healthcare systems provide
rich contextual information and alerting mechanisms against odd conditions with continuous
monitoring. This minimizes the need for caregivers and helps the chronically ill and elderly to
survive an independent life. Currently, wireless sensor networks deployment is starting to be
deployed at an accelerated pace. It is reasonable to expect that the world will benefit from services of
Wireless sensor networks with technological access.
While considering Health care application using wireless sensor networks several challenges also
needs to be considered such as low power, limited computation, material constraints, and continuous
operation, robustness and fault tolerance, scalability, security and interference and regulatory
requirements. Our system would try to overcome these performance metrics which needs to be
overcome in implementation health care systems using WSN.
Health car monitoring systems using Wireless Sensor Networks consists of physiological monitors,
which are custom-built sensors, patient worn motes that sample, and pass the data through a wireless
network. Moreover there is also one backend server which stores the data medical data and presents
them to authenticated GUI clients only. The main challenge here is mobile communication where
clients don’t have the flexibility to communicate through smart hand held devices and have to be
location dependent for gaining treatment from doctor thereby visiting him every time for medication.
Hereby we propose a system which overcomes this drawback and allows clients to send their data to
doctors through mobile communication and by using system insights two major factors of such as
time and location dependencies are saved.
B. Drawbacks of Existing System
Existing System has the problems of using single functionality specific machines to monitor various
health parameters of the user. These machines are huge and bulky in size as well as it is also not able
to communicate the sensed or captured data to other devices using mobile communication.
C. The Proposed System
Proposed System presents a distributed set of sensors which will mimic the work of individual
elements by sensing the data captured by them.

International Journal of Recent Trends in Engineering & Research (IJRTER) Volume 02, Issue 10; October - 2016 [ISSN: 2455-1457]
@IJRTER-2016, All Rights Reserved 68
Figure 1. Block Diagram
Proposed system highlights use of different wireless sensors to demonstrate how to check various
health parameters of the user using various sensors like Pulse Sensor, Blood Pressure Sensor,
Temperature Sensor and ECG sensor which we will use to monitor heart rate of the person. All the
sensors are connected to a Raspberry Pi 3 [11] credit card-sized single board computer which
features an ARM compatible CPU and on chip GPU (Graphics Processing Unit) with the CPU speed
ranges from 700 MHz to 1.2 GHz along with an onboard memory of 1GB RAM. It also features an
RJ 45 Ethernet Port and Pi 3 also has onboard WiFi 802.11n and Bluetooth. The given system also
has additional components such as ADC to convert the analog pulse to digital value. To generate
ECG of an individual AD 8232 Heart Rate Monitor is used. To calculate Blood Pressure of an
individual system uses BMP 180 Barometric Pressure Sensor along with its handcuff, pipe
attachments and Electronic Valve which is used to control the air flow to the pressure sensor which
resides inside the pressure container. Next, to measure the temperature of an individual system uses
M513 MLX90615 Humidity & Temperature Sensor. All the sensors collect their individual data and
give to Pi 3 for processing. Health parameter ranges are defined well in advance to determine
whether the collected data is correct or not. The channel bandwidth provided by the system model
depends on the speed of the mobile node connected to the internet. Here we make the mobile node as
our WiFi router and send data to the both the android applications using the mobile node data which
is provided by telecommunication partner. Let’s discuss the proposed system working components
individually.

International Journal of Recent Trends in Engineering & Research (IJRTER) Volume 02, Issue 10; October - 2016 [ISSN: 2455-1457]
@IJRTER-2016, All Rights Reserved 69
III. SYSTEM OVERVIEW
1. Press button on the device
2. Red light glows indicating processing the report, checking body and generating numbers for report
3. Green light glows when data is uploaded to server
4. We can open app to check the report
5. Patient can view report and wait for the doctors feedback
6. Doctor when opens the app get list of submitted report
7. Doctor will send the prescription
8. When patient opens the app he gets the prescription
A. Pulse Sensor
The given proposed system uses Pulse Sensor. [12] Pulse Sensor is a well-designed plug and play
heart rate sensor for Arduino as well as Pi. The sensor clips on to a fingertip or earlobe and plugs
right in to Pi 3 with some jumper cables. The front of the sensor is the pretty side with the Heart
logo. This is the side that makes contact with the skin. On the front you see a small round hole,
which is where the LED shines through from the back, and there is also a little square just under the
LED. The square is an ambient light sensor, exactly like the one used in cellphones, tablets, and
laptops, to adjust the screen brightness in different light conditions. The LED shines light into the
fingertip or earlobe, or other capillary tissue, and sensor reads the light that bounces back. The back
of the sensor is where the rest of the parts are mounted. After the code is run, we see pin 13 blink on
Arduino [9] in time with your heartbeat when user holds the sensor on his fingertip. Spot pressure on
the pulse sensor will give nice and clean data and signals to Pi 3. Here we define a normal resting
heart rate for adults which range from 60 to 100 BPM. The collected data through the pulse sensor is
given to Arduino which we use it as analog to digital convertor because our pulse sensor generates
waveform for heartbeat. Arduino is used here because it has the ability to convert Analog waveform
into Digital value and then processed into BPM algorithm to generate values for heartbeats for every
user. This heartbeat is then stored in Pi’s OS and then transferred to a remote server over the internet
and directly transferred to user Smartphone application so that he can view his real time heartbeats
and then if this data is not in the resting range mentioned above it will get automatically transferred
to registered physicians for diagnosis and treatment.
B. BPM Algorithm
1. Fill the data from sensor in an array for T seconds.
2. Find minimum value and maximum in that array suppose A and B.
3. Map values in array A to some negative value –x and B equivalent positive value +x and all middle
value directly proportional.
4. Increment counter C for every time the value in array changes from negative to positive.
5. BMP = (C/T)*60.
C. Temperature Sensing Unit
This module integrates M513 MLX90615 Digital Infrared Temperature sensor and other required
components on Pi 3. The sensor includes a resistive-type humidity measurement component, an NTC
(Negative Temperature Coefficient) temperature measurement component and a high-performance 8-
bit microcontroller inside, and provides calibrated digital output when connected to Pi 3. This sensor
has high reliability and long-term stability. The system accepts data from MLX90615 sensor through
Pi 3 and gives it to user’s smartphone application for diagnosis. The average normal body temperature
is 98.6°F (37°C). The range defined in our system for the body temperature to be normal is from 97°F
(36.1°C) to 99°F (37.2°C). The temperature over 100.4°F (38°C) is the quoted abnormal human body
temperature for the system; it means the user is suffering from fever caused by infection or illness.

International Journal of Recent Trends in Engineering & Research (IJRTER) Volume 02, Issue 10; October - 2016 [ISSN: 2455-1457]
@IJRTER-2016, All Rights Reserved 70
D. Pressure Sensing Unit
In the given proposed system we are measuring Blood Pressure of the user using The BMP180
Breakout barometric pressure sensor [13] with an I2C (“Wire”) interface. This Pressure sensing unit
consists of various other components which are responsible to calculate the systolic (maximum) and
diastolic (minimum) blood pressure of the user. This unit comprises of one pressure container which
contains pressure sensor which is used to monitor pressure in our system. Second component is Air
pump which is used to fill the handcuff; it is an inflatable strip tied around the hand of the patient for
whom we want to calculate blood pressure, when wrapped around hand and inflated it will stop the
blood flow in hand.
Pressure from handcuff will be induced inside the pressure container and the pressure inside the
pressure container and handcuff will be said that will be calculated by bmp180 sensor inside the
pressure container. Third component is air pump, it consist of centrifugal pump which forces air
inside the handcuff to inflate it. Fourth component is pulse sensor (heart rate sensor), just like doctor
uses his stethoscope to listen the beats from hand’s veins; we are using this sensor which will digitally
detect beats. We will fill air inside the handcuff till a point when the pulse sensor don’t show pulse in
its output, this is when we get the Systolic pressure [13] by reading value from BMP180 sensor inside
the pressure container. When we get the pressure reading, we have to deflate the handcuff. Fifth
component is a solenoid valve, it will open the air flow hole by which air will escape and the handcuff
will deflate and blood flows normally again and we get the pulse from pulse sensor. We will continue
to deflate the handcuff by turning on solenoid valve, till we don’t get pulse reading and stop that is
when we read Diastolic pressure [13] from pressure sensor BMP180. These readings are then
transferred to user smartphone application via Pi 3. If the blood pressure of the user is above or below
the normal resting range of approximately 120/80 mm Hg then necessary action can be taken by the
doctor as this data will be sent to doctor’s smartphone from user application after getting the alert to
the user.
E. ECG Sensing Unit
In the given system we generate a heart rate graph of the user using ADS1292R ECG/Respiration
Breakout kit. This kit consists of breakout board for the TI ADS1292R Analog front-end IC for ECG
and respiration measurement will help you measure both ECG patterns and respiration. The kit when
connected to Pi 3 follows the following steps of execution:
We connect the probes to body on 3 places as specified in Fig. 4. The program reads analog values
from the probes, which are minute fluctuations in our body’s electric current. IC will amplify and
digitally sample the readings. The IC samples the data and normalizes it; it filters out all the outlier
from the digital values. All the values are stored inside an array which is displayed as an image and
saved in one .png image. The values in the array are directly equivalent to the pulses from ECG graph
the program stores the image in a directory that is later on uploaded to server using HTTP Request.
IV. RESULTS AND ANALYSIS
The proposed system when used is operated in two perspectives:
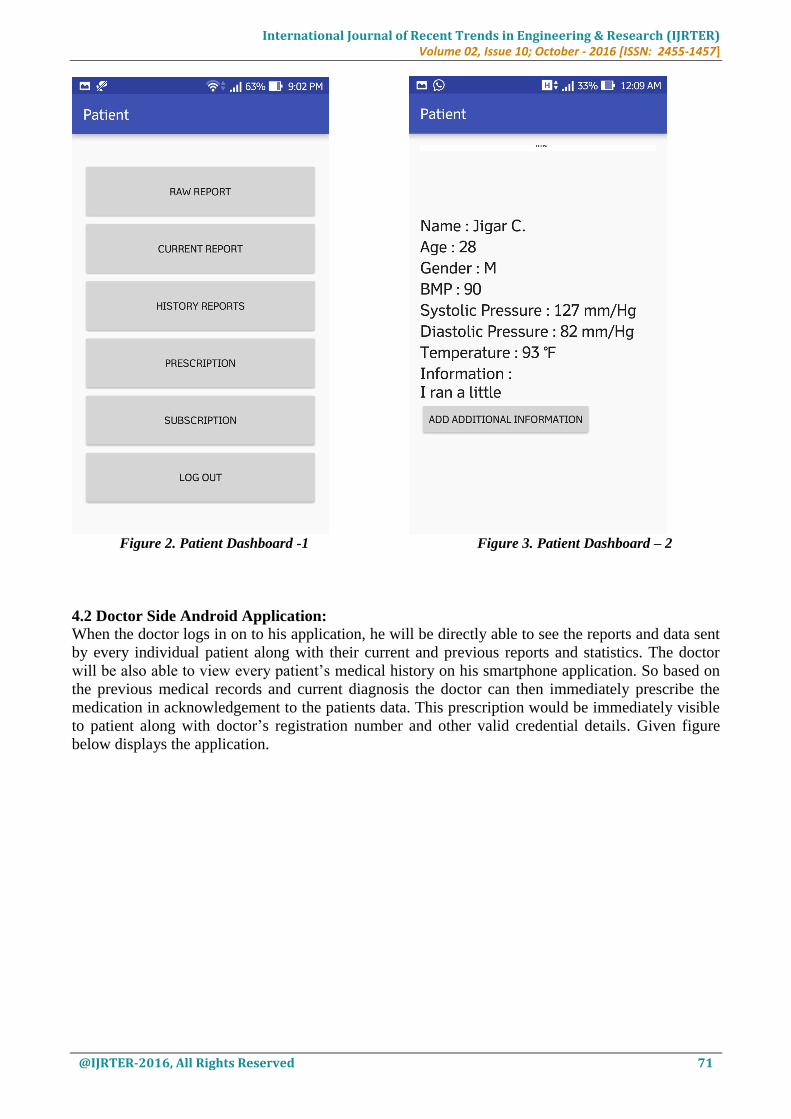
4.1 User Side Android Application:
In user side, application scenario is just collecting data from different sensors all together and
showing it on smart health application specially designed to view the measured parameters. If any
measured parameter falls in abnormal range as discussed in section III, it will automatically get
displayed in the form of an alert and will be sent to registered doctors in the vicinity. Given figure
below is the demonstration of Patient side Android Application:
International Journal of Recent Trends in Engineering & Research (IJRTER) Volume 02, Issue 10; October - 2016 [ISSN: 2455-1457]
@IJRTER-2016, All Rights Reserved 71
Figure 2. Patient Dashboard -1 Figure 3. Patient Dashboard – 2
4.2 Doctor Side Android Application:
When the doctor logs in on to his application, he will be directly able to see the reports and data sent
by every individual patient along with their current and previous reports and statistics. The doctor
will be also able to view every patient’s medical history on his smartphone application. So based on
the previous medical records and current diagnosis the doctor can then immediately prescribe the
medication in acknowledgement to the patients data. This prescription would be immediately visible
to patient along with doctor’s registration number and other valid credential details. Given figure
below displays the application.

International Journal of Recent Trends in Engineering & Research (IJRTER) Volume 02, Issue 10; October - 2016 [ISSN: 2455-1457]
@IJRTER-2016, All Rights Reserved 72
Figure 4. Doctor Dashboard
4.3 Temperature Result Analysis:
In this section we compare the results of temperature sensor generated by our kit along with Hicks
digital thermometer. Here in the first table we are showing outputs obtained from Hicks Digital
thermometer.
Patient Names Specifications
Saloni S 97.9°F
Bhakti C 97.6°F
Rekha C 92.5°F
Mukesh C 97.1°F
Jigar C 97.2°F
Priya A 97.3°F
Table1. Output Parameters calculate using Hicks Digital Thermometer
Table2. Output Parameters calculate using our Kit
Patient Names Specifications
Saloni S 94.6°F
Bhakti C 93.2°F
Rekha C 91.6°F
Mukesh C 93.6°F
Jigar C 94.1°F
Priya A 95.3°F

International Journal of Recent Trends in Engineering & Research (IJRTER) Volume 02, Issue 10; October - 2016 [ISSN: 2455-1457]
@IJRTER-2016, All Rights Reserved 73
Hicks Digital Thermometers was used in axilla area in contact with the skin. Hicks thermometer
takes nearly a minute to capture the body temperature in the axilla area whereas the time required by
our kit is just 2 seconds. The infrared temperature sensor throws a strong beam of light on the object
when the object is hovered over the sensor. Our kits accuracy is ±3 degree F. Given graph below
shows the comparison between both the entities.
Figure 5. Temperature Analysis Graph
4.4 Blood Pressure Results Analysis
In this section we compare the results of pulse sensor and pressure sensing unit along with Omron
M6 Comfort Digital Automatic Blood Pressure machine. Here in the first table we demonstrate the
outputs obtained from Omron M6 machine.
Patient Names Systolic mmHg Diastolic mmHg BPM
Saloni S 109 71 90
Bhakti C 103 66 79
Rekha C 142 99 74
Mukesh C 133 69 72
Jigar C 125 84 89
Priya A 123 60 107
Table 3.Specifications calculated by OMRON M6 Comfot Blood Pressure Machine
OMRON M6 Comfort states their accuracy as ±5 mmHg in their device specification manual.
In the next section we calculate the blood pressure and heart rates of the above mentioned subjects
using our kit. The kit takes a total of 1 minute in calculating all the vital parameters along with the
output to be sent to smart phone android application. On the other hand OMRON M6 takes 30
seconds to measure only blood pressure and pulse rate.
While comparing accuracy for measuring blood pressure our system provides ±10 mmHg based on
the human movement constraint consideration.

International Journal of Recent Trends in Engineering & Research (IJRTER) Volume 02, Issue 10; October - 2016 [ISSN: 2455-1457]
@IJRTER-2016, All Rights Reserved 74
Patient Names Systolic mmHg Diastolic mmHg BPM
Saloni S 136 86 90
Bhakti C 121 81 82
Rekha C 140 93 75
Mukesh C 117 76 73
Jigar C 127 82 90
Priya A 116 78 97
Table 4.Specifications calculated by our Kit
Now we show the comparison graphs between Omron M6 and our kit.
Figure 6. Systolic Analysis Graph
Next we show Diastolic Analysis Graph.
Figure 7. Diastolic Analysis Graph

International Journal of Recent Trends in Engineering & Research (IJRTER) Volume 02, Issue 10; October - 2016 [ISSN: 2455-1457]
@IJRTER-2016, All Rights Reserved 75
Figure 8. Beats Per Minute Analysis Graph
4.5 ECG Results Analysis
For analyzing and comparing Electrocardiogram generated by our system, we state the fact that our
system generated ECG is 3 pin connector 1 lead ECG which generates ECG Heart Rate graph only
as the sensor which we have used in our system is not medically proven for ECG analysis whereas
the other ECG graph generated for comparison is produced using portable BPL ECG machine which
is 12 pin connector 3 lead ECG; medically accurate and proven for diagnosing strokes and accurate
heart rate and as a result we just show here comparison of two graphs. The only advantage our
system possesses is that the generated ECG would be easily viewable on mobile devices.
Next we show the comparative outputs of ECG generated by using two different devices.
Figure 9. BPL Machine generated ECG Graph

International Journal of Recent Trends in Engineering & Research (IJRTER) Volume 02, Issue 10; October - 2016 [ISSN: 2455-1457]
@IJRTER-2016, All Rights Reserved 76
Figure 10. Beats Per Minute Analysis Graph
V. CONCLUSION & FUTURE SCOPE
In this project, we were able to implement the MHWSN prototype system for the tracking of vital
health parameters. Our implementation is able to successfully calculate ECG, beats per minute,
temperature and blood pressure of the user in two modes. Firstly normal mode where patient is not
suffering any chronic disease and he isn’t critical; here the system would only once calculate all the
parameters when the kit is turned ON. Secondly the critical mode where in the patient is bed ridden
and he needs continuous monitoring; here the system needs a kick start only for the first time then it
would automatically calculate parameters every (2/5/10/15) minutes as specified by the doctor while
assigning kit to the patient. Lastly all the parameters are easily fetched to users handheld smart phone
device.
The calculation of medical health parameters using Wireless Sensor Networks is not a new idea, but
rather this paper concentrates on calculating various parameters like Heartbeats, ECG, and Blood
Pressure Monitoring altogether in a single calibrated kit which poses to the user as a single system
when interfaced with android smart phone application providing higher usability both to doctors as
well as patients. The system will eliminate the problems observed in the manual and conventional
machine based monitoring system as the real time data monitoring demand increases because of rise
of chronic diseases which will vary person to person. With the right information at the right time, the
sensor based medical system can help medical patient to easily track and monitor their health record.
The system will curb the menace of visiting doctor every time for diagnosis and will help registered
patients of the doctors to gain treatment effectively.
In the future, we might want to add security enhancement to the kit as the data traversed between
patient and the doctor could be encrypted and it maintains confidentiality of the reports generated
and communicated between doctor and the patient.

International Journal of Recent Trends in Engineering & Research (IJRTER) Volume 02, Issue 10; October - 2016 [ISSN: 2455-1457]
@IJRTER-2016, All Rights Reserved 77
The average accuracy of our system right now in terms of monitoring all the health parameters is
±15. We aim to achieve ±0 accuracy in future by introducing or replacing new hardware components
which are small in size and it would help in effectively making this kit more small and compact. We
see the future of this project as one wearable device in coming years.
REFERENCES 1. Security Architecture for At-Home Medical Care Using Wireless Sensor Network, Soufiene Ben Othman,
Abdelbasset Trad, Habib Youssef. UR PRINCE,ISITcom, Hammam Sousse, University of Sousse, Tunisia. Date of
Conference 4-8 August 2014. Page(s): 304-309. ISBN: 978-1-4799-7324-8. Conference location: Nicosia. INSPEC
Accession Number: 14618916. DOI: 10.1109/IWCMC.2014.6906374. Publisher: IEEE.
2. M. C. Vuran, I. F. Akylidiz, Wireless Sensor Networks.Wiley, 2010. ISBN: 978-0-470-03601-3 516 pages. July
2010.
3. Wireless Sensor Networks for Healthcare, JeongGil Ko, Chenyang Lu, Mani B. Srivastava John A. Stankovic,
Andreas Terzis, Matt Welsh. Published in: Proceedings of the IEEE (Volume:98, Issue:11). Page(s):1947-1960.
ISSN: 0018-9219. Date of Publication: 13 September 2010. Date of current version:18 October 2010. INSPEC
Accession Number: 11588456. Issue date: Nov. 2010. DOI: 10.1109/JPROC.2010.2065210. Sponsored by:IEEE.
Published by:IEEE.
4. A Survey on Ambient Intelligence in Healthcare, By Acampora, G. : Sch. of Sci. \& Technol., Nottingham Trent
Univ., Nottingham, UK. Cook, D.J. ; Rashidi, P. ; Vasilakos, A.V. Published in : Proceedings of the IEEE
(Volume:101,Issue: 12). Page(s): 2470-2494. ISSN: 0018-9219. Date of Publication: 13 August 2013. Date of
current version: 19 November 2013. INSPEC Accession Number: 13914461.Issue date: Dec. 2013. DOI:
10.1109/JPROC.2013.2262913. Sponsored by: IEEE. Published by: IEEE.
5. SECURITY ARCHITECTURE FOR AT-HOME MEDICAL CARE USING BODY SENSOR
NETWORK,S.S.Mohanavalli, Sheila Anand, International Journal of Ad hoc, Sensor & Ubiquitous Computing
(IJASUC) Vol.2, No.1, March 2011.
6. Sensor Networks for Medical Care, Victor Shnayder, Bor-rong Chen, Konrad Lorincz, Thaddeus R. F. Fulford-
Jones, and Matt Welsh, Harvard University
7. Wireless Sensor Networks for medical care services By Sghaier, N. TINC Group, Univ. of Paris-Est Creteil Val de
Marne (UPEC), Vitry sur Seine, France. Mellouk, A. ; Augustin, B. ; Amirat, Y. ; Marty, J. ; Khoussa, M.E.A. ;
Abid, A. ; Zitouni, R. Published in: Wireless Communications and Mobile Computing Conference (IWCMC), 2011
7th International. Date of Conference: 4-8 July 2011. Page(s): 571-576. Conference location: Istanbul. Print ISBN:
978-1-4244-9539-9. INSPEC Accession Number: 12179154. DOI: 10.1109/IWCMC.2011.5982596. Publisher:
IEEE
8. Smys S, Bala GJ. Efficient self-organized backbone formation in mobile ad hoc networks (MANETs). Computers &
Electrical Engineering. 2012.
9. Learn about Arduino, URL: https://www.arduino.cc/
10. S.Park and S.Jayaraman, “Enhancing Quality of life through Wearable Technology”, IEEE Engineering and Biology
Magazine, May-June 2003, vol.22 pp 41-48.
11. Raspberry Pi - Teach, Learn, and Make with Raspberry Pi https://www.raspberrypi.org/
12. https://pulse-sensor.googlecode.com/files/PulseSensorAmpedGettingStartedGuide.pdf
13. BMP 180 Barometric Pressure Sensor https://learn.sparkfun.com/tutorials/bmp180-barometric-pressure-
sensorhookup.
Recommended