Conference for Wetlands: Monitoring, Modelling and Management
22 – 25 September 2005, Wierzba
Modelling Water Balances of Wetlands with
controlled Drainage and Sub-irrigation Systems
O. Dietrich1, M. Redetzky2 & K. Schwärzel3
1 Leibniz-Centre for Agricultural Landscape Research (ZALF) e.V., Institute of Landscape Hydrology
2 WASY Institute for Water Resources Planning and System Research Ltd.
3 Technische Universität Dresden, Institute of Soil Science
Wetlands in North-Eastern GermanyWetlands in Elbe-Lowland:
• ~ 20 % of area• drained for agricultural
land use• low precipitation• sub-irrigation systems
Study site Spreewald
Berlin
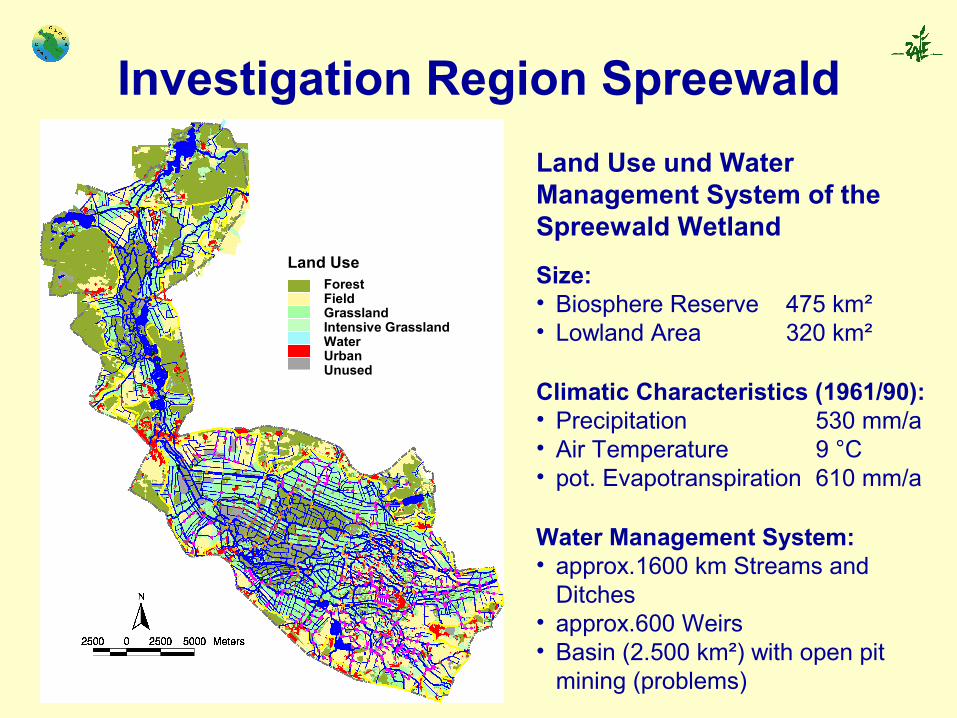
Investigation Region Spreewald
Size:• Biosphere Reserve 475 km²• Lowland Area 320 km²
Water Management System:• approx.1600 km Streams and
Ditches• approx.600 Weirs• Basin (2.500 km²) with open pit
mining (problems)
Climatic Characteristics (1961/90):• Precipitation 530 mm/a• Air Temperature 9 °C• pot. Evapotranspiration 610 mm/a
Land Use und Water Management System of the Spreewald Wetland
Land UseForestFieldGrasslandIntensive GrasslandWaterUrbanUnused
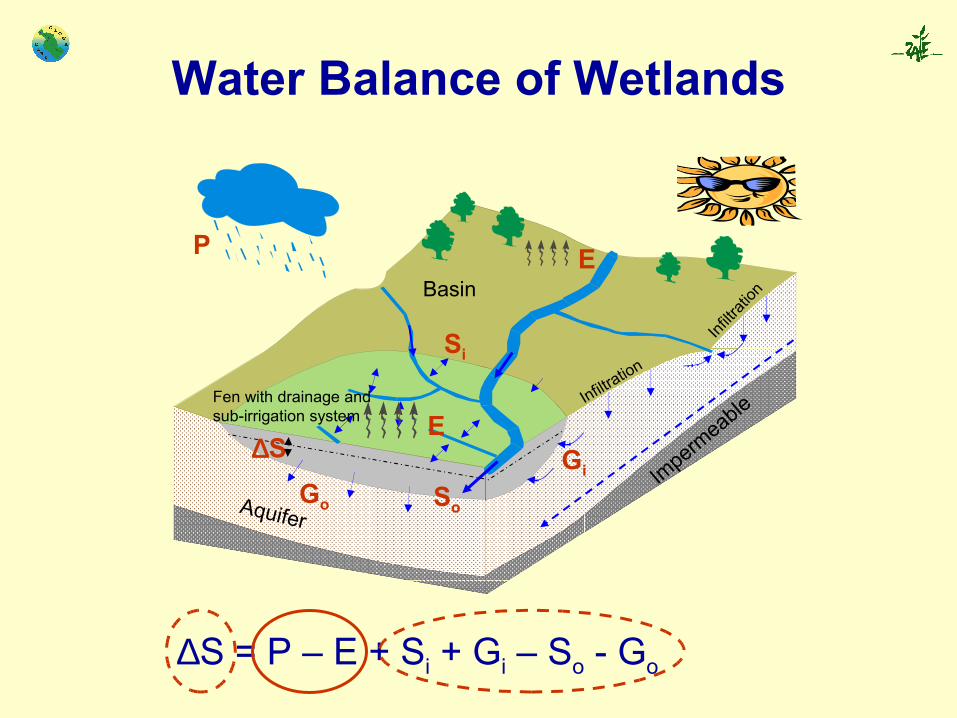
Water Balance of Wetlands
Imperm
eable
Aquifer
Basin
Infiltration
Infiltr
ation
Fen with drainage and sub-irrigation system E
P E
Gi
Si
SoGo
∆S
∆S = P – E + Si + Gi – So - Go
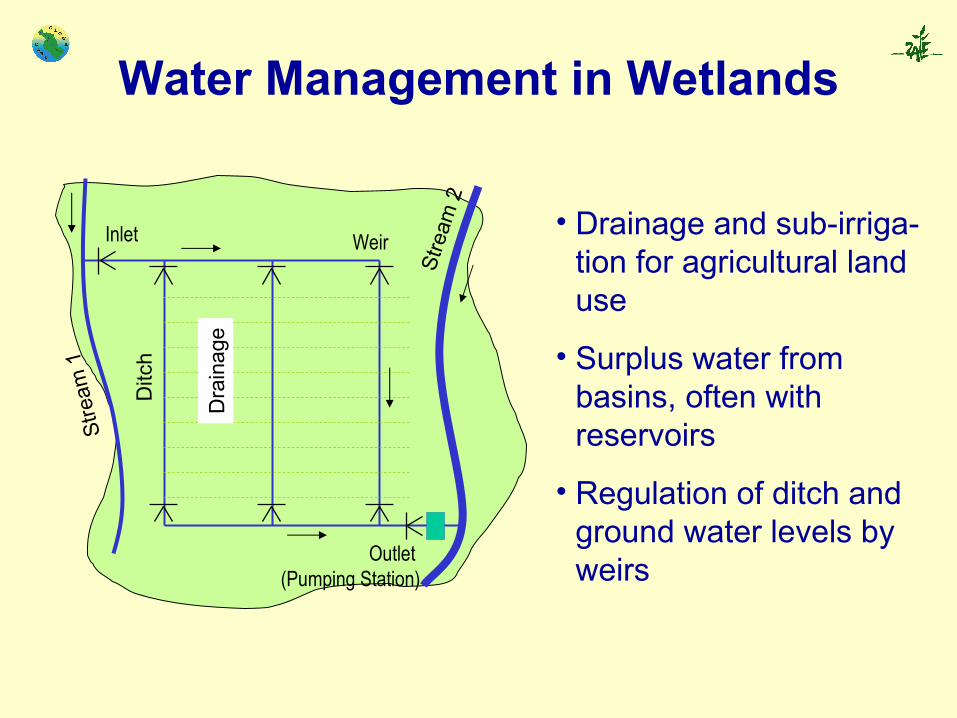
Water Management in Wetlands
Stre
am 2
Stre
am 1
Ditc
h
Dra
inag
eInlet Weir
Outlet (Pumping Station)
• Drainage and sub-irriga-tion for agricultural land use
• Surplus water from basins, often with reservoirs
• Regulation of ditch and ground water levels by weirs
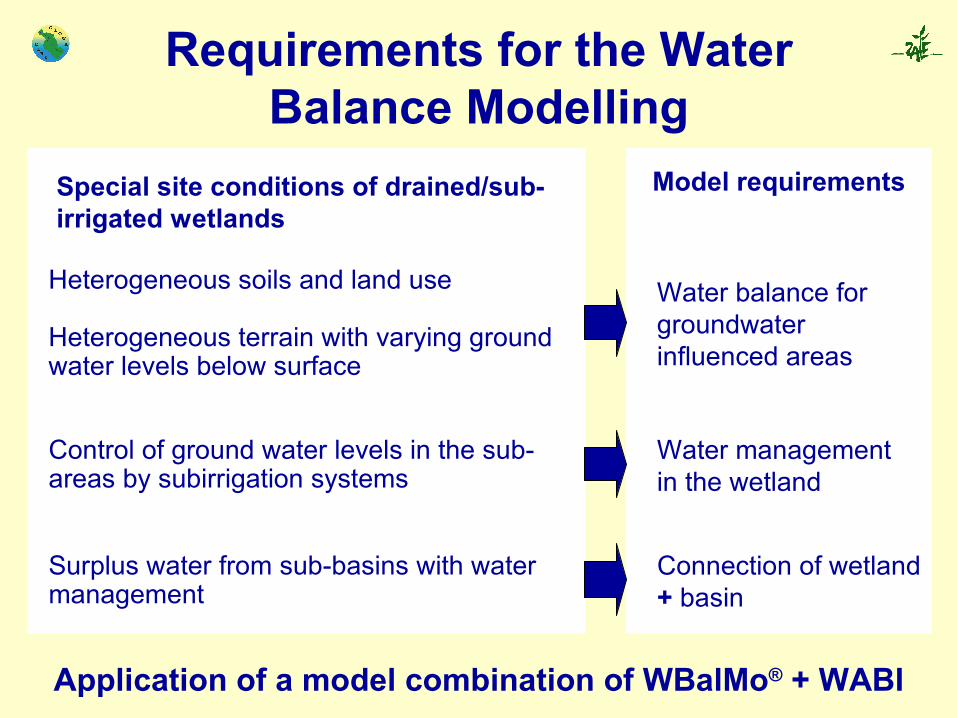
Requirements for the Water Balance Modelling
Model requirements
Application of a model combination of WBalMo® + WABI
Special site conditions of drained/sub-irrigated wetlands
Water balance for groundwater influenced areas
Heterogeneous soils and land use
Heterogeneous terrain with varying ground water levels below surface
Water management in the wetland
Control of ground water levels in the sub-areas by subirrigation systems
Connection of wetland + basin
Surplus water from sub-basins with water management
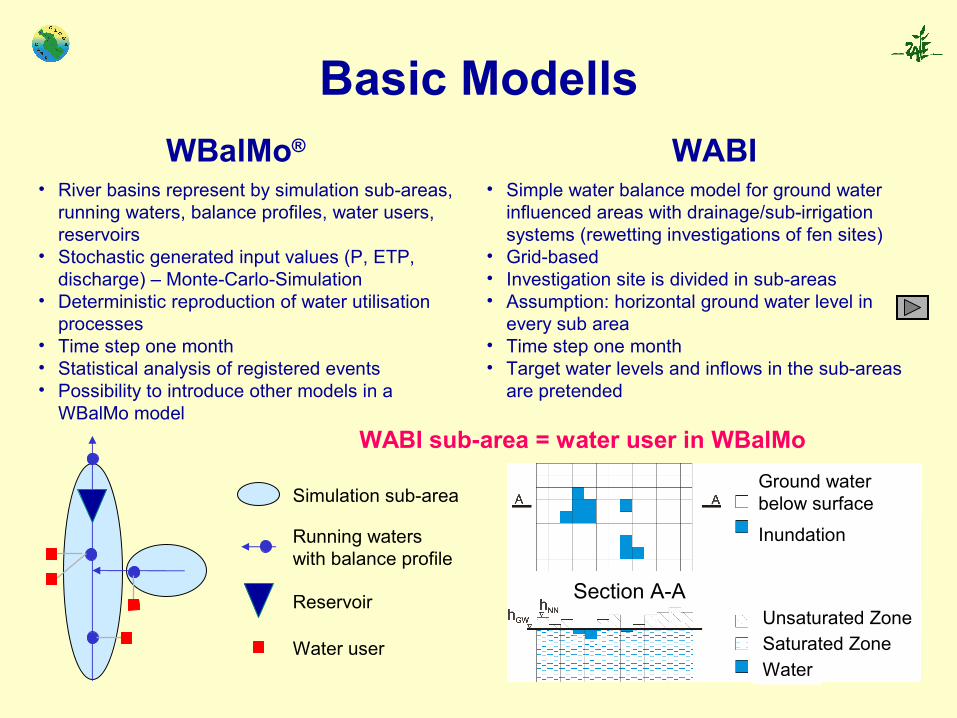
Basic ModellsWABIWBalMo®
WABI sub-area = water user in WBalMo
Simulation sub-area
Running waters with balance profile
Reservoir
Water user
• River basins represent by simulation sub-areas, running waters, balance profiles, water users, reservoirs
• Stochastic generated input values (P, ETP, discharge) – Monte-Carlo-Simulation
• Deterministic reproduction of water utilisation processes
• Time step one month• Statistical analysis of registered events• Possibility to introduce other models in a
WBalMo model
• Simple water balance model for ground water influenced areas with drainage/sub-irrigation systems (rewetting investigations of fen sites)
• Grid-based• Investigation site is divided in sub-areas• Assumption: horizontal ground water level in
every sub area• Time step one month• Target water levels and inflows in the sub-areas
are pretended
WaterSaturated Zone
Ground water below surface
Inundation
Unsaturated ZoneSection A-A
Weir system
Main streamStreamDitch
Small weirLarge weirPumping stationSub-area
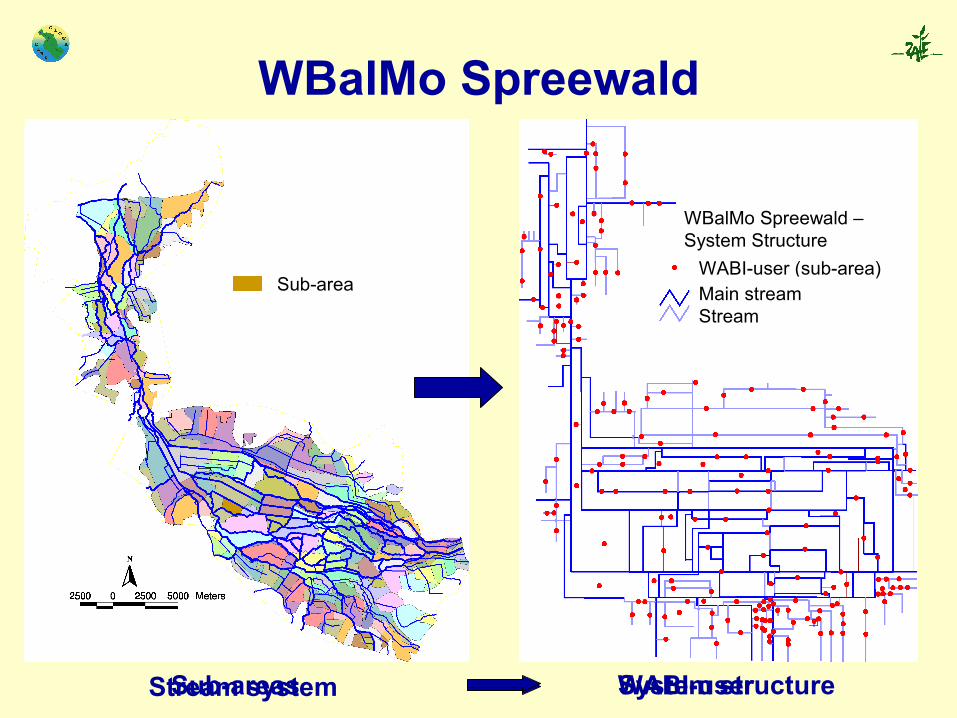
Stream system System structureSub-areas WABI-user
WBalMo Spreewald – System structure
Main streamStream
WBalMo Spreewald –System Structure
WABI-user (sub-area)Main streamStream
WBalMo Spreewald
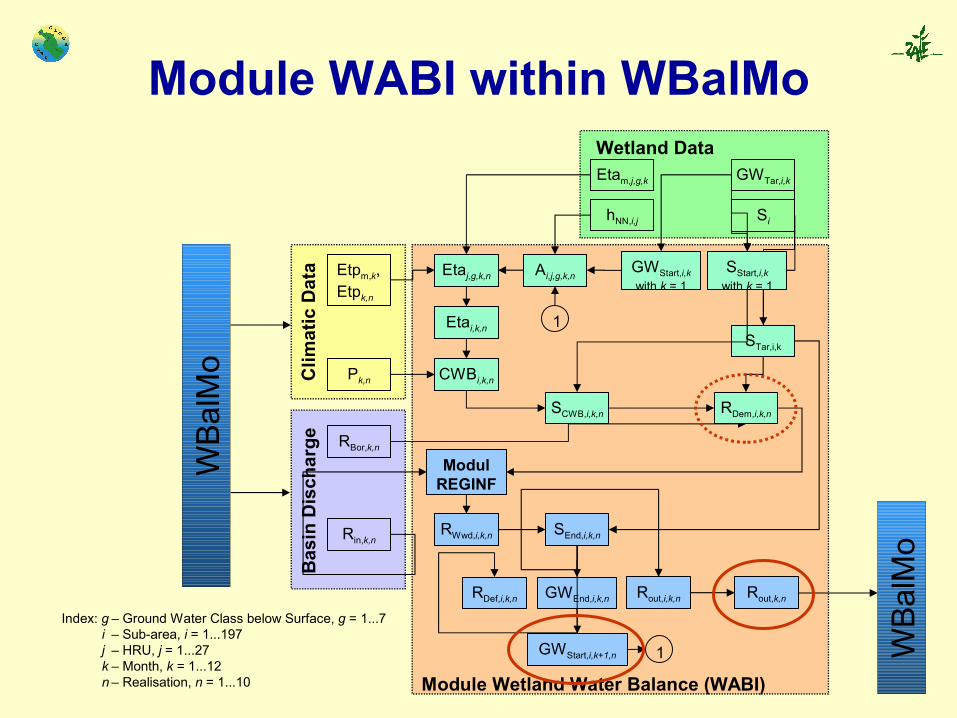
Module WABI within WBalMo
Module Wetland Water Balance (WABI)
Etam,j,g,k GWTar,i,k
hNN,i,j Si
Wetland Data
Index: g – Ground Water Class below Surface, g = 1...7i – Sub-area, i = 1...197j – HRU, j = 1...27k – Month, k = 1...12n – Realisation, n = 1...10
WBa
lMo
WB
alM
o
Pk,n
Etpm,k,Etpk,nC
limat
ic D
ata
Bas
in D
isch
arge RBor,k,n
Rin,k,n
ModulREGINF
RWwd,i,k,n SEnd,i,k,n
GWEnd,i,k,nRDef,i,k,n Rout,i,k,n
GWStart,i,k+1,n 1
Rout,k,n
Etaj,g,k,n Ai,j,g,k,n
Etai,k,n
CWBi,k,n
GWStart,i,kwith k = 1
SStart,i,kwith k = 1
STar,i,k
SCWB,i,k,n RDem,i,k,n
1

Validation - Water Balance of the Wetland in total (So – (Si + Gi + P))
Calibration - Period 1990/94
-25-20-15-10
-505
10Jan Feb Mrz Apr May Jun Jul Aug Sep Oct Nov Dec
m³/s
obs calcValidation - Period 1995/99
-25-20-15-10-505
10Jan Feb Mrz Apr May Jun Jul Aug Sep Oct Nov Dec
m³/s
obs calc
R2 = 0,66
-25
�
Æ÷
ÆÚ
�
K
K
-25 ‰�w O�w ��w � æ 5
obs in m³/s
calc
in m
³/s
R2 = 0,71
-25
�
Ë\
Ëã
�
P
P
-25 Š�~ Q�~ ��~ ë 5
obs in m³/sca
lc in
m³/s
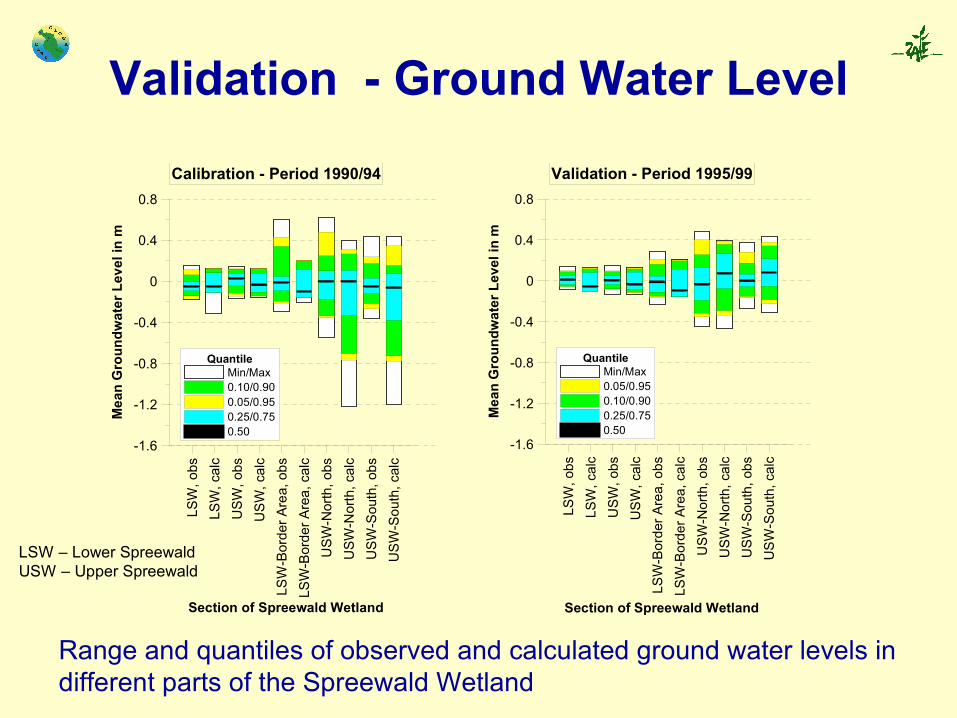
Validation - Ground Water Level
-1.6
-1.2
-0.8
-0.4
0
0.4
0.8
Mea
n G
roun
dwat
er L
evel
in m
LSW
, obs
LSW
, cal
cU
SW
, obs
US
W, c
alc
LSW
-Bor
der A
rea,
obs
LSW
-Bor
der A
rea,
cal
cU
SW
-Nor
th, o
bsU
SW
-Nor
th, c
alc
US
W-S
outh
, obs
US
W-S
outh
, cal
c
Section of Spreewald Wetland
QuantileMin/Max0.05/0.950.10/0.900.25/0.750.50
Validation - Period 1995/99
-1.6
-1.2
-0.8
-0.4
0
0.4
0.8
Mea
n G
roun
dwat
er L
evel
in m
LSW
, obs
LSW
, cal
cU
SW, o
bsU
SW
, cal
cLS
W-B
orde
r Are
a, o
bsLS
W-B
orde
r Are
a, c
alc
US
W-N
orth
, obs
USW
-Nor
th, c
alc
USW
-Sou
th, o
bsU
SW
-Sou
th, c
alc
Section of Spreewald Wetland
QuantileMin/Max0.10/0.900.05/0.950.25/0.750.50
Calibration - Period 1990/94
Range and quantiles of observed and calculated ground water levels in different parts of the Spreewald Wetland
LSW – Lower SpreewaldUSW – Upper Spreewald
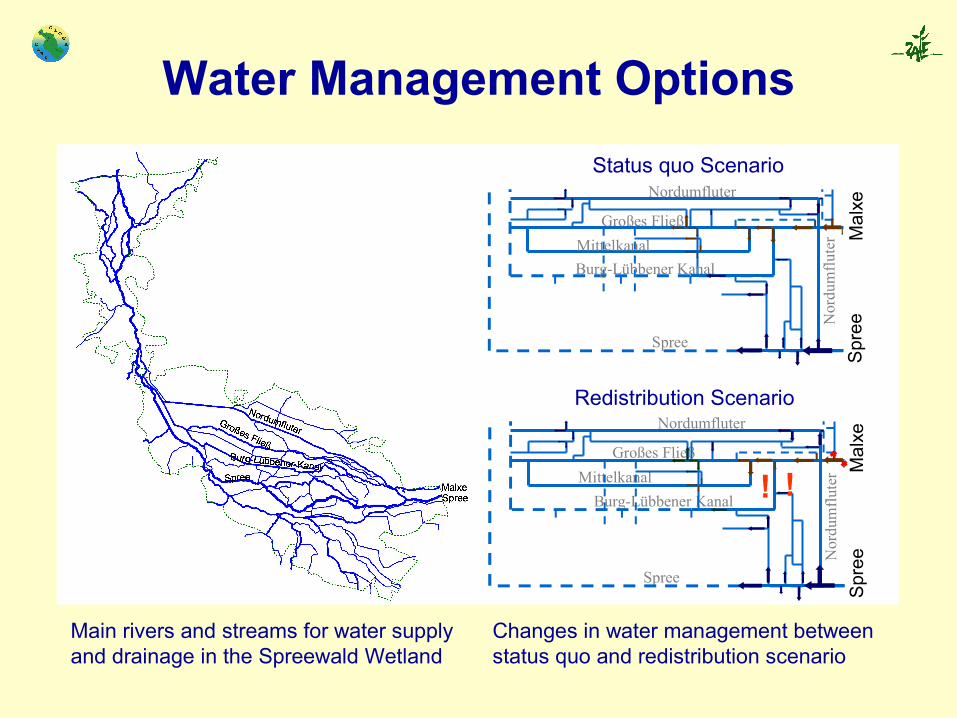
Water Management Options
Main rivers and streams for water supply and drainage in the Spreewald Wetland
Changes in water management between status quo and redistribution scenario
Nordumfluter
Nor
dum
flute
r
Spree
Großes FließMittelkanalBurg-Lübbener Kanal
Mal
xeS
pree
Status quo Scenario
Nordumfluter
Nor
dum
flute
r
Spree
Großes FließMittelkanal
Burg-Lübbener Kanal
Mal
xeS
pree
!!
Redistribution Scenario
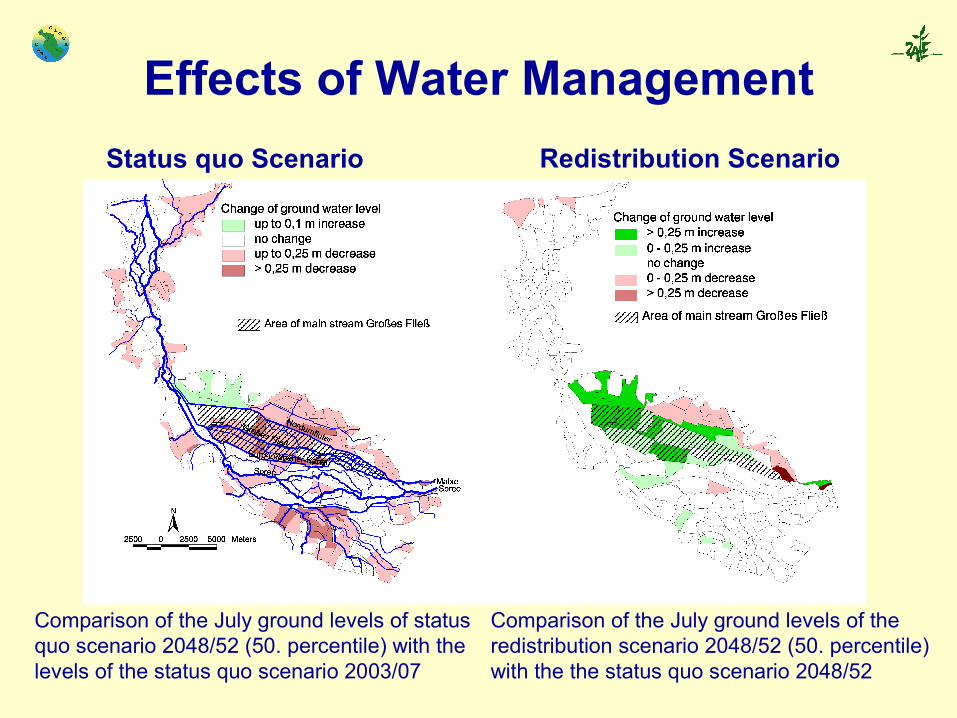
Effects of Water ManagementStatus quo Scenario
Comparison of the July ground levels of status quo scenario 2048/52 (50. percentile) with the levels of the status quo scenario 2003/07
Redistribution Scenario
Comparison of the July ground levels of the redistribution scenario 2048/52 (50. percentile) with the the status quo scenario 2048/52
Summary
• Water balance of many wetlands is influenced by water resources management systems in wetlands and basins
• Integration of water resources management in water balance modelling for planning of development (restoration, WFD, global change) of wetlands is necessary
• Combination of the models WBalMo and WABI shows one example
• Results show, how the possibilities of water resources management can be used for aims of wetland protection
Thank You
Recommended