Modeling sequence dependence of microarray probe signals
Li Zhang
Department of Biostatistics and Applied Mathematics
MD Anderson Cancer Center

Wide use of short oligonucleotide microarrays
• Gene expression assay
• Genotyping (SNP detection)
• Comparative genome hybridization
• DNA methylation detection
• Gene structure discovery
• Genome reseqeuncing

Protocol of a microarray experiment

Affymetrix GeneChip® Probe Arrays
24µm
Each probe cell or feature containsmillions of copies of a specificoligonucleotide probe
Image of Hybridized Probe Array
Over 250,000 different probes complementary to geneticinformation of interest
Single stranded, fluorescentlylabeled DNA target
Oligonucleotide probe
**
**
*
1.28cm
GeneChip Probe Array
Hybridized Probe Cell
*

Double helix on microarrays
The probe is a 25-mer DNA oligo:
ATCAGCATACGAGAGAATGATGGAT|||||||||||||||||||||||||
AAUAGUCGUAUGCUCUCUUACUACCUAGC
cRNA fragment from solution
ATCAGCATACGACAGAATGATGGAT
Average distance between probes is 80Å

Technical factors affecting gene expression measurements
• Interaction between base pairs (stacking)
• Interaction with microarray surface
• Interaction with unintended targets (cross hybridization)
• Kinetic process (equilibration & washing)
• Physical properties of RNA sample Degradation (missing 5’ ends)
Alternative splicing (missing exons)Secondary structure (RNA hairpins & loops)Biotinylation
Technical factors affecting gene expression measurements
• Interaction between base pairs (stacking)Nearest-neighbor model
• Interaction with microarray surfacePositional dependant weights for stacking energies
• Interaction with unintended targets (cross hybridization)PDNN; mean field theory
• Kinetic process (equilibration & washing)Langmuir and Sips model
• Physical properties of RNA sample Degradation (missing 5’ ends)
Alternative splicing (missing exons)Secondary structure (RNA hairpins & loops)Biotinylation

Assumption: two types of binding
1. Gene-specific binding: 25 n.t. exact complementary sequences (binding with the intended target).
2. Non-specific binding: Many (>5) mismatches or short stretches (binding with unintended targets).

Gene-specific binding energy:
Non-specific binding energy:
Weighted sum base-pair stacking energies:
Positional Dependant Nearest-Neighbor (PDNN) model of molecular interactions
),( 1 iiibb
),(*** 1 iii bb

PDNN model of probe signals
2, )ln(ln ijobsij IIT
Be
N
e
NI
ijij EE
j
ij
*1
*
1
Minimization of T •Energy parameters•B, N*, Nj
•N*, B are the same on a microarray; •Nj is the same in a probe set.
Probe Signal:
Fitness:
Constraints:
Software available at: http://odin.mdacc.tmc.edu/~zhangli/PerfectMatch

Fitting PDNN modelln
(si
gnal
)
Probe index

Energy parameters in PDNN model
Weight factors Stacking energy terms
-0.8
-0.4
0.0
0.4
0.8
1.2
aa ac ag at ca cc cg ct ga gc gg gt ta tc tg tt
Dinucleotide
Sta
ckin
g e
ner
gy
GenomeTiling
Expr_U133A
SNP_50k
-0.2
0.2
0.6
1.0
1.4
1.8
1 3 5 7 9 11 13 15 17 19 21 23
Dinucleotide position on probe
Wei
gh
t
GenomeTiling
Expr_U133A
SNP_50k

Baseline of non-specific binding
Non-specific binding energy

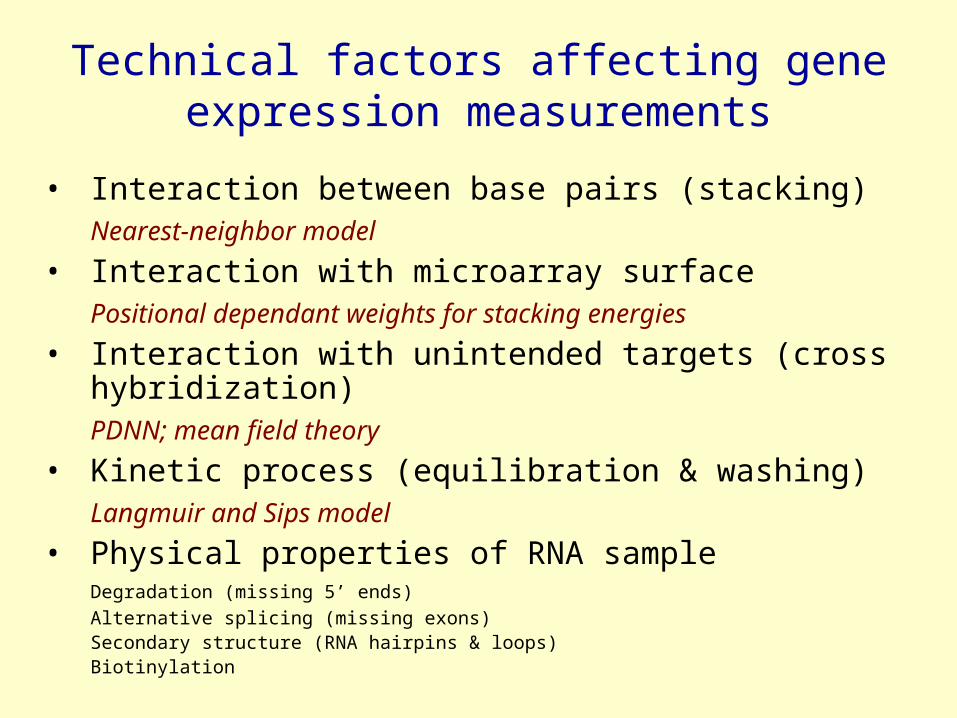
Effects of Mismatches
•A Mismatch disrupts the double helix formation.•Energetically, it is unfavorable for binding.•It depends on the context of DNA sequences.
-3
-2
-1
0
1
2
3
Middle 3 bases of PM probe
< ln(PM/MM) >
E*(PM)-E*(MM)
A
C
G
T
Effect of mismatch at base13 depends on the nearest-neighbors
AA
C
G
T
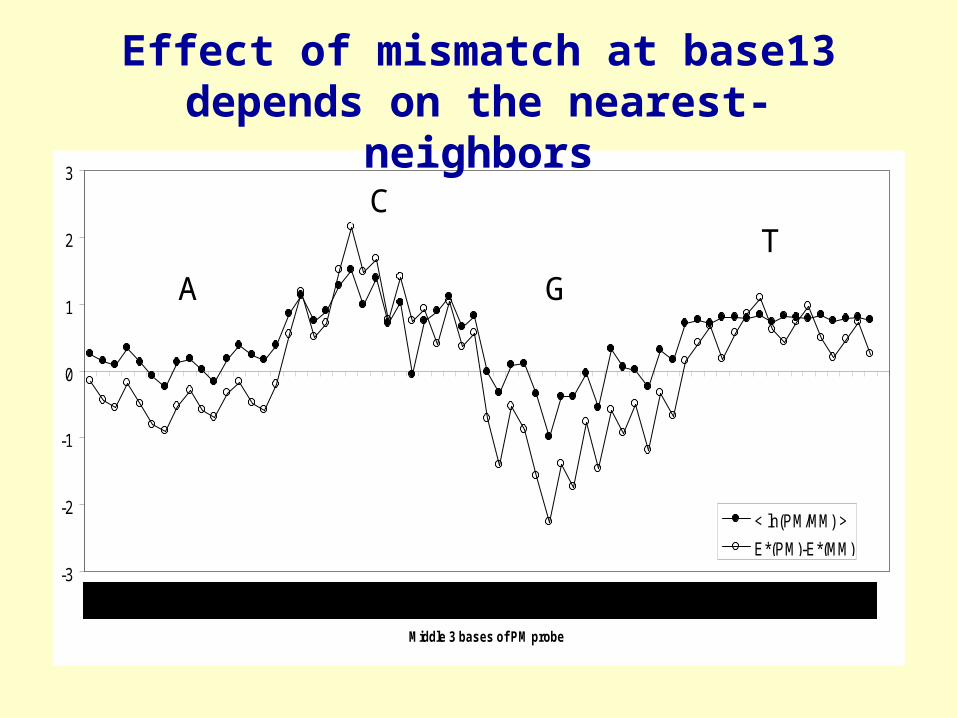
Sequence dependence of free energy cost of single mismatch in DNA duplexes
R2 = 0.35
1
2
3
4
5
6
0.5 1 1.5 2
microarray mismatch G
So
luti
on
mis
mat
ch
G

Pattern of cross hybridization: MM and PM probes bind to different molecules
Var(ln PM)
Var
(ln
MM
)
Data source: Affymetrix HG-U133 spike-in data set. Large variation indicates resonse to spike-ins. Number of arrays: 42. Number of probes on an array: ~ 0.5 million.

Microarray surface effects
• DNA and RNA are negatively charged.
• Glass surface also charged
• Repulsion
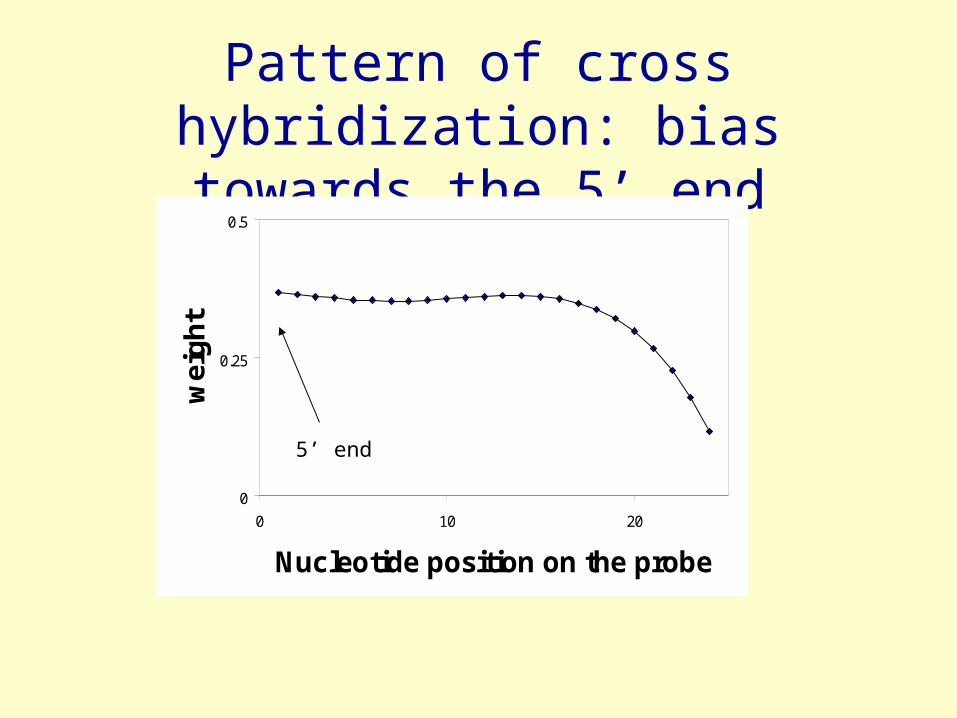
Pattern of cross hybridization: bias towards the 5’ end
0
0.25
0.5
0 10 20
Nucleotide position on the probe
wei
gh
t
5’ end

Sense and antisense
• Upon binding, sense and antisense probes form the same double helix structure.
• The same interactions should lead to the same binding energy.
• The observed data contradict with this prediction.
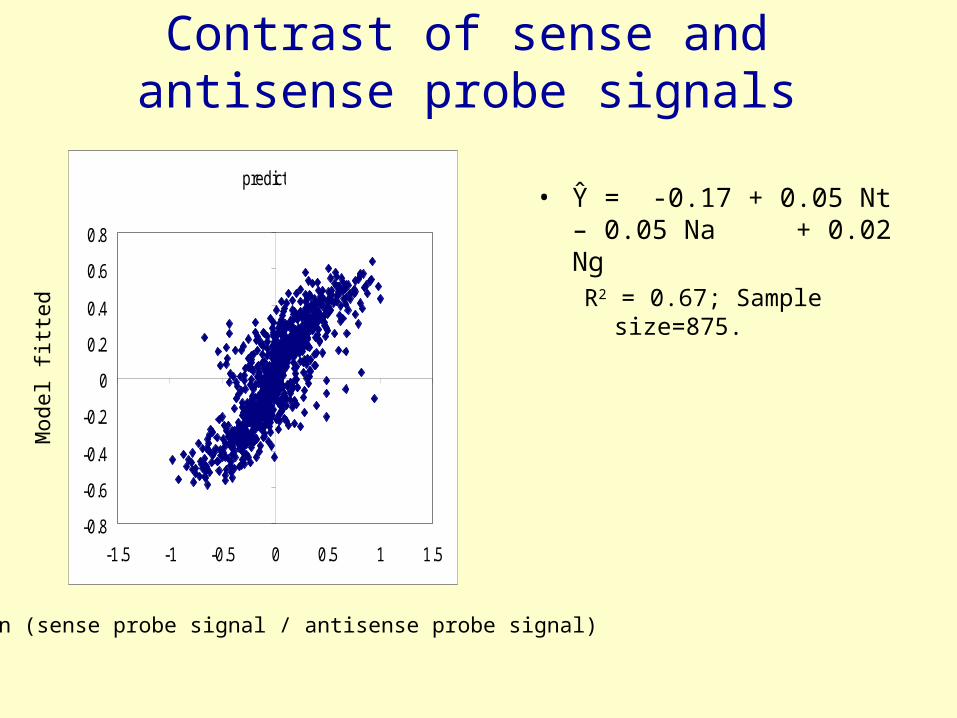
Contrast of sense and antisense probe signals
• Ŷ = -0.17 + 0.05 Nt – 0.05 Na + 0.02 NgR2 = 0.67; Sample size=875.
predict
-0.8
-0.6
-0.4
-0.2
0
0.2
0.4
0.6
0.8
-1.5 -1 -0.5 0 0.5 1 1.5
Ln (sense probe signal / antisense probe signal)
Mod
el fi
tted

Summary
•Binding on array surface: Probe binding free energy can be approximated by a weighted sum of base-pair stacking energies, with the probe ends having less contributions.
•Mismatches: Mismatches disrupt hybridization, especially in cross hybridization. The effects of mismatches depend on sequences. The surface also an effect.
•Surface effects: Cross hybridization is biased towards the 5’ end of the probes. Repulsion of surface depends on nucleotides.
Recommended