Embed Size (px)
Citation preview

Sandrine Dudoit 1
Microarray Experimental Design and Analysis
Sandrine Dudoit jointly with Yee Hwa YangDivision of Biostatistics, UC Berkeley
www.stat.berkeley.edu/~sandrine
CBMB and QB3 Short Course: Analysis of Gene Expression Microarray Data
Genentech Hall Auditorium, Mission Bay, UCSFNovember 15, 2003
Sandrine Dudoit 2
Combining data across arrays
Genes
Arrays
M = log2( Red intensity / Green intensity)expression measure, e.g, RMA
0.46 0.30 0.80 1.51 0.90...
-0.10 0.49 0.24 0.06 0.46...
0.15 0.74 0.04 0.10 0.20...
-0.45 -1.03 -0.79 -0.56 -0.32...
-0.06 1.06 1.35 1.09 -1.09...
… … … … …
Data on G genes for n hybridizations
Array1 Array2 Array3 Array4 Array5 …
Gene2Gene1
Gene3
Gene5Gene4
G x n genes-by-arrays data matrix
…
Sandrine Dudoit 3
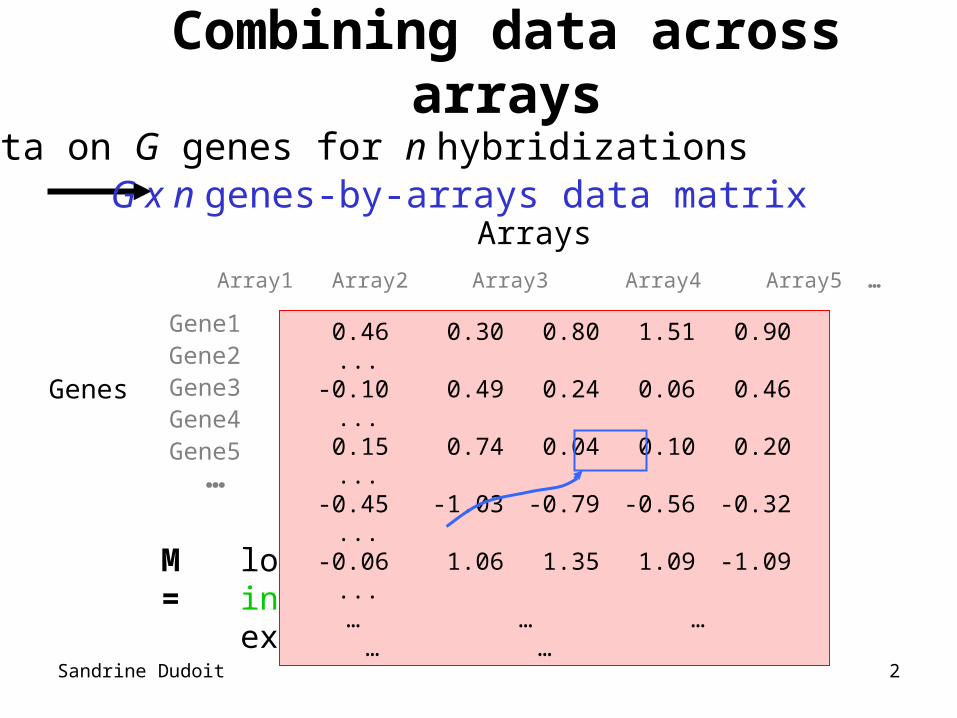
Combining data across arrays
D
F
BA
C
E
… but columns have structureHow can we design experiments and combine data across slides to provide accurate estimates of the effects of interest?
Experimental designRegression analysis
Sandrine Dudoit 4
Combining data across arrays• cDNA array factorial experiment. Each
column corresponds to a pair of mRNA samples with different drug x dose x time combinations.
• Clinical trial. Each column corresponds to a patient, with associated clinical outcome, such as survival and response to treatment.
• Linear models and extensions thereof can be used to effectively combine data across arrays for complex experimental designs.
Sandrine Dudoit 5
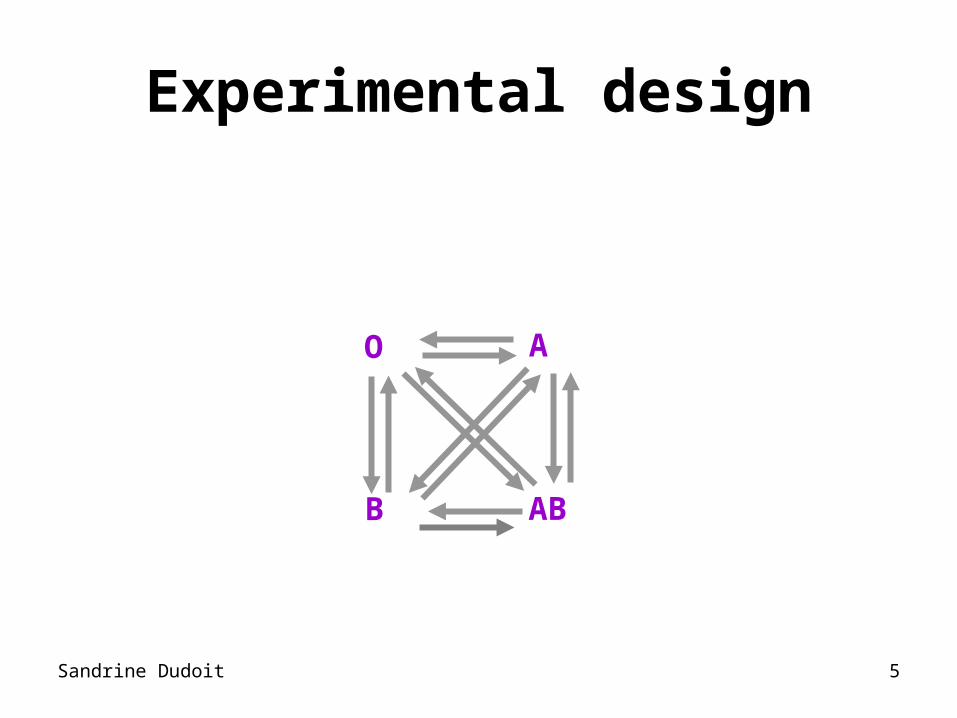
Experimental design
O A
B AB
Sandrine Dudoit 6
Experimental design
Proper experimental design is needed to ensure that questions of interest can be answered and that this can be done accurately, given experimental constraints, such as cost of reagents and availability of mRNA.
Sandrine Dudoit 7
Experimental design
• Design of the array itself – which cDNA probe sequences to print;– whether to use replicated probes;– which control sequences;– how many and where these should be printed.
• Allocation of target samples to the slides – pairing of mRNA samples for hybridization;– dye assignments;– type and number of replicates.
Sandrine Dudoit 8
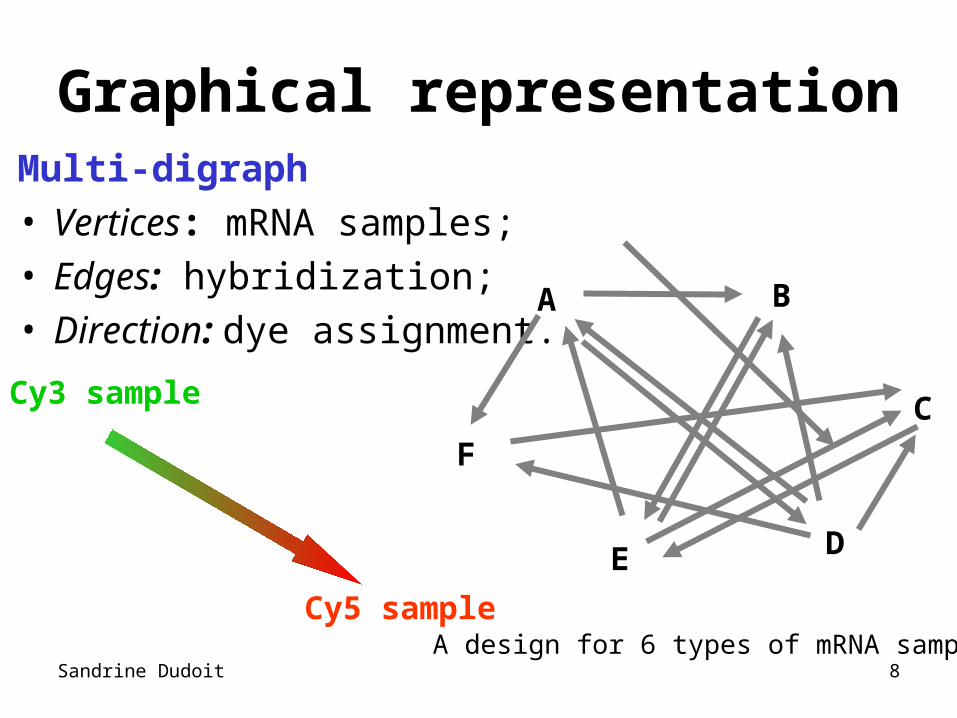
Graphical representationMulti-digraph• Vertices: mRNA samples;• Edges: hybridization;• Direction: dye assignment.
Cy3 sample
Cy5 sample
D
F
BA
C
E
A design for 6 types of mRNA samples
Sandrine Dudoit 9
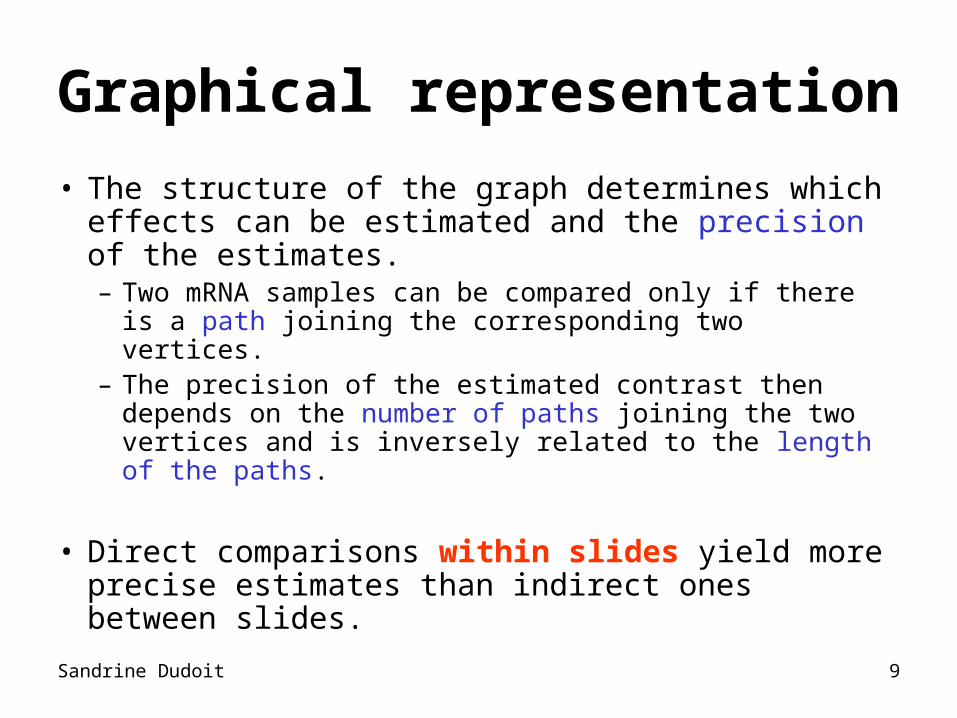
Graphical representation
• The structure of the graph determines which effects can be estimated and the precision of the estimates. – Two mRNA samples can be compared only if there is
a path joining the corresponding two vertices. – The precision of the estimated contrast then depends
on the number of paths joining the two vertices and is inversely related to the length of the paths.
• Direct comparisons within slides yield more precise estimates than indirect ones between slides.
Sandrine Dudoit 10
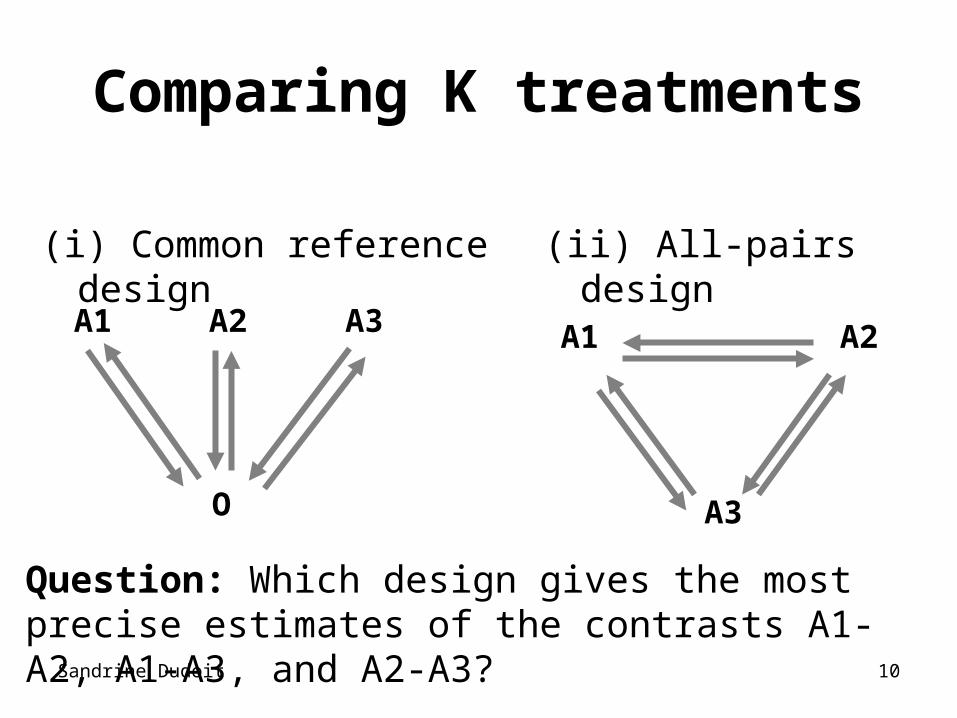
Comparing K treatments
(i) Common reference design (ii) All-pairs design
Question: Which design gives the most precise estimates of the contrasts A1-A2, A1-A3, and A2-A3?
O
A1 A2 A3 A1 A2
A3
Sandrine Dudoit 11
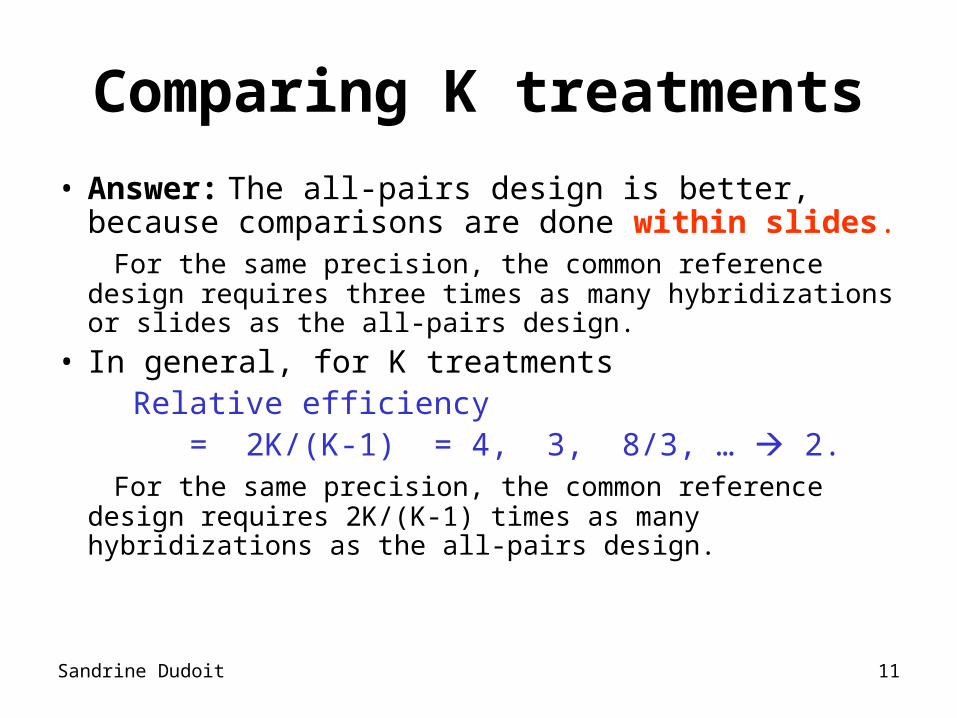
Comparing K treatments
• Answer: The all-pairs design is better, because comparisons are done within slides.
For the same precision, the common reference design requires three times as many hybridizations or slides as the all-pairs design.
• In general, for K treatments Relative efficiency = 2K/(K-1) = 4, 3, 8/3, … 2. For the same precision, the common reference design requires
2K/(K-1) times as many hybridizations as the all-pairs design.
Sandrine Dudoit 12
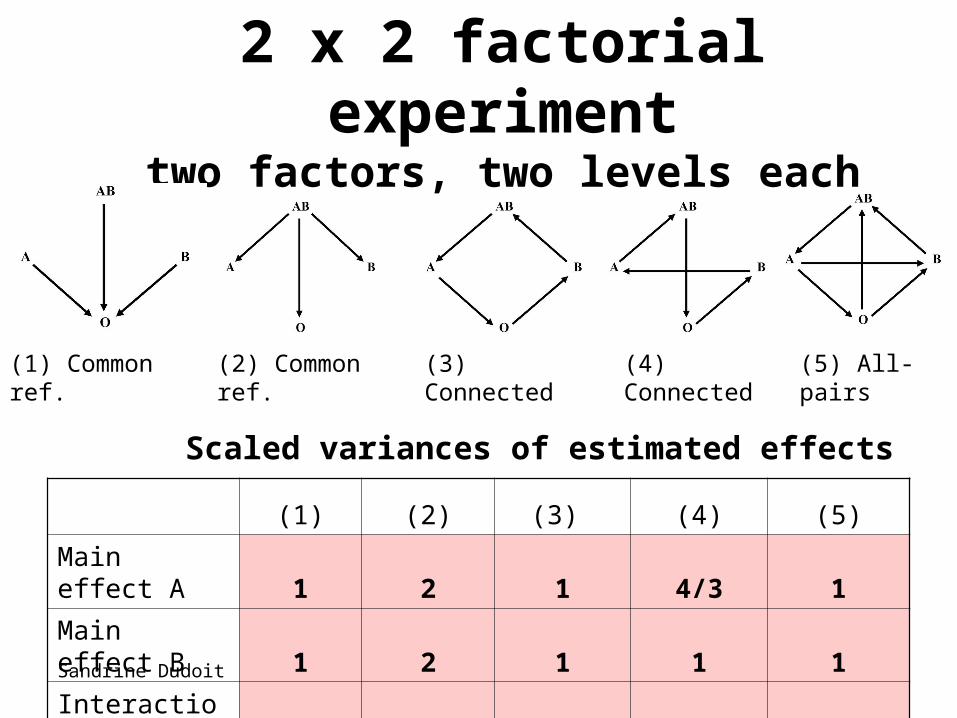
2 x 2 factorial experimenttwo factors, two levels each
(1) (2) (3) (4) (5)
Main effect A 1 2 1 4/3 1
Main effect B 1 2 1 1 1
Interaction AB 3 3 4/3 8/3 2
Contrast A-B 2 2 4/3 1 1
(1) Common ref.
Scaled variances of estimated effects
(2) Common ref. (4) Connected (5) All-pairs(3) Connected
Sandrine Dudoit 13
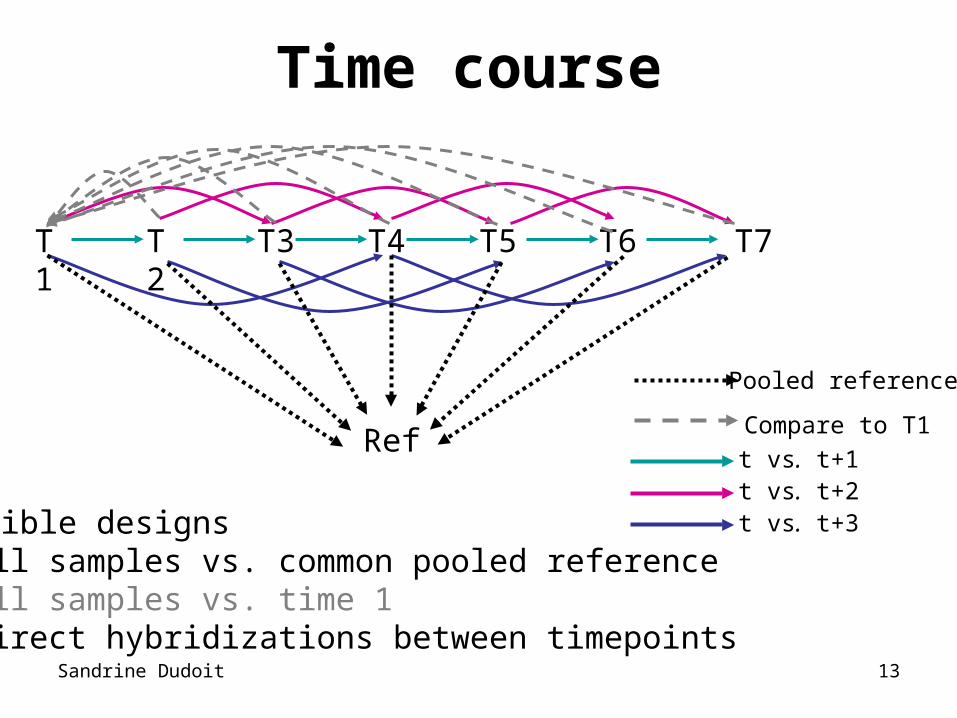
Pooled reference
T2 T4 T5 T6 T7T3T1
Ref Compare to T1
t vs. t+3t vs. t+2t vs. t+1
Time course
Possible designs1) All samples vs. common pooled reference2) All samples vs. time 1 3) Direct hybridizations between timepoints
Sandrine Dudoit 14
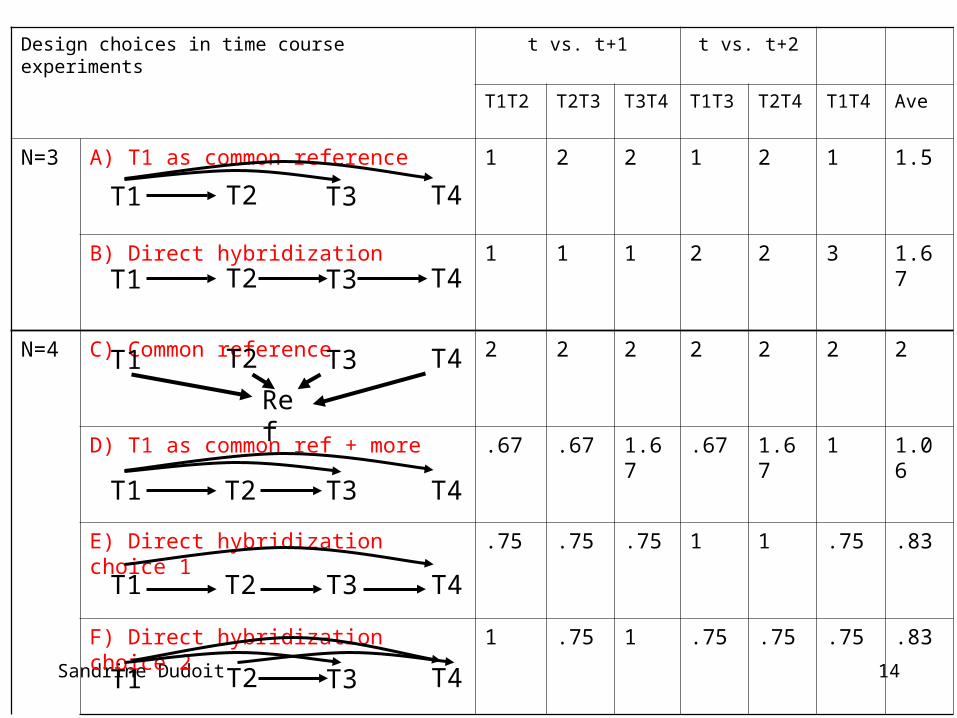
Design choices in time course experiments t vs. t+1 t vs. t+2
T1T2 T2T3 T3T4 T1T3 T2T4 T1T4 Ave
N=3 A) T1 as common reference 1 2 2 1 2 1 1.5
B) Direct hybridization 1 1 1 2 2 3 1.67
N=4 C) Common reference 2 2 2 2 2 2 2
D) T1 as common ref + more .67 .67 1.67 .67 1.67 1 1.06
E) Direct hybridization choice 1 .75 .75 .75 1 1 .75 .83
F) Direct hybridization choice 2 1 .75 1 .75 .75 .75 .83
T2 T3 T4T1
T2 T3 T4T1
Ref
T2 T3 T4T1
T2 T3 T4T1
T2 T3 T4T1
T2 T3 T4T1
Sandrine Dudoit 15
Experimental design
• In addition to experimental constraints, design decisions should be guided by the knowledge of which effects are of greater interest to the investigator.
E.g. which main effects, which interactions.
• The experimenter should thus decide on the comparisons for which he wants the most precision and these should be made within slides to the extent possible.
Sandrine Dudoit 16
Experimental design
• N.B. Efficiency can be measured in terms of different quantities– number of slides or hybridizations;– units of biological material, e.g. amount of
mRNA for one channel.
Sandrine Dudoit 17
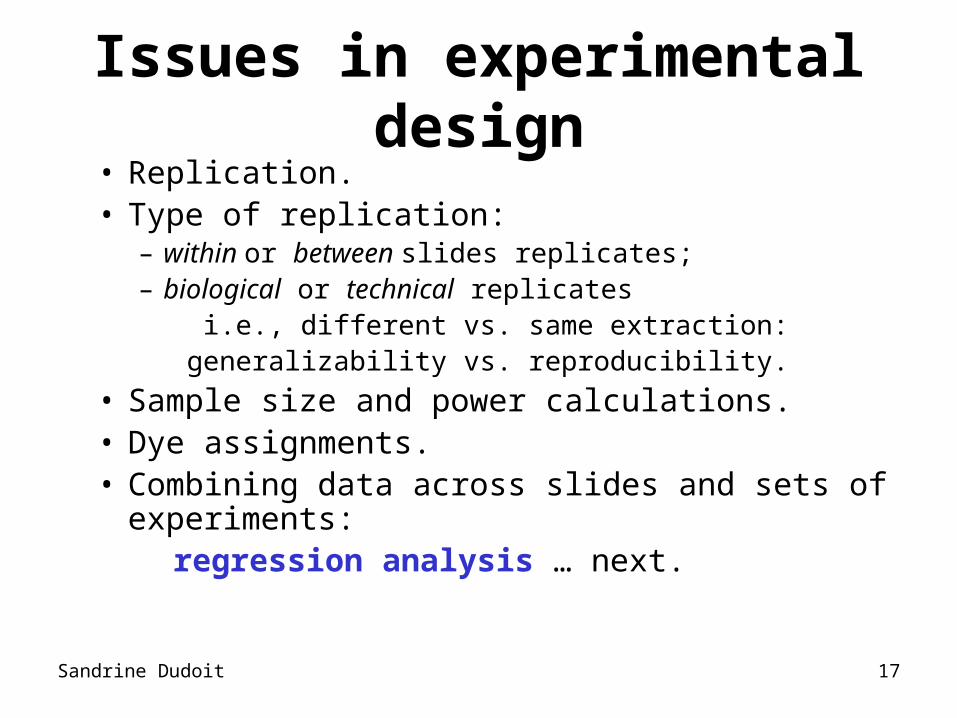
Issues in experimental design• Replication.• Type of replication:
– within or between slides replicates; – biological or technical replicates i.e., different vs. same extraction: generalizability vs. reproducibility.
• Sample size and power calculations.• Dye assignments.• Combining data across slides and sets of
experiments: regression analysis … next.
Sandrine Dudoit 18
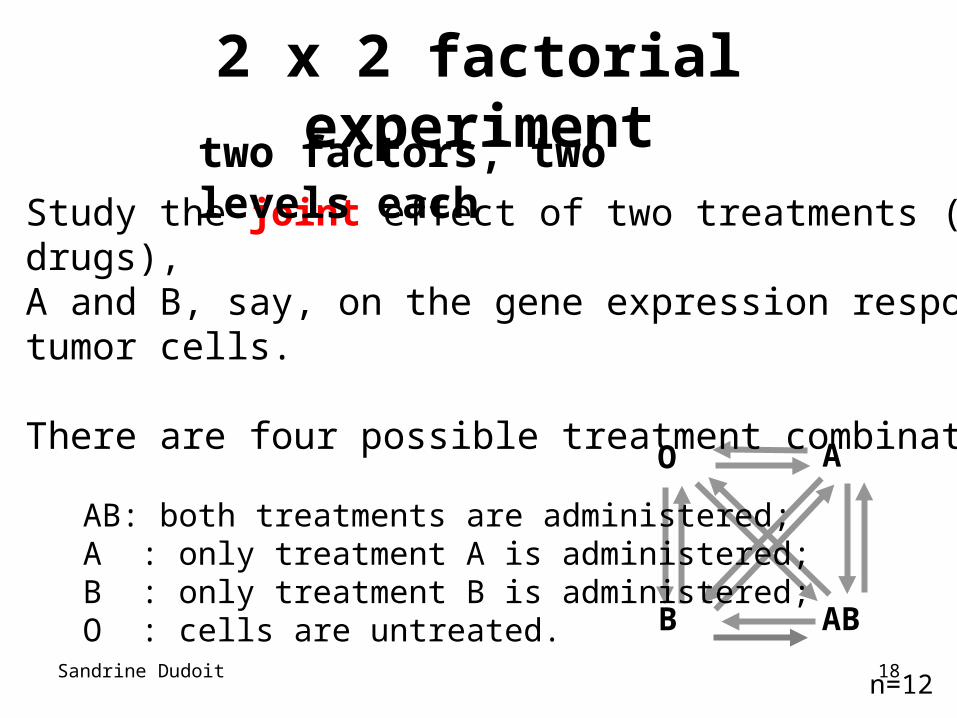
2 x 2 factorial experiment
O A
B AB
Study the joint effect of two treatments (e.g. drugs), A and B, say, on the gene expression response of tumor cells.
There are four possible treatment combinations AB: both treatments are administered; A : only treatment A is administered; B : only treatment B is administered; O : cells are untreated.
two factors, two levels each
n=12
Sandrine Dudoit 19
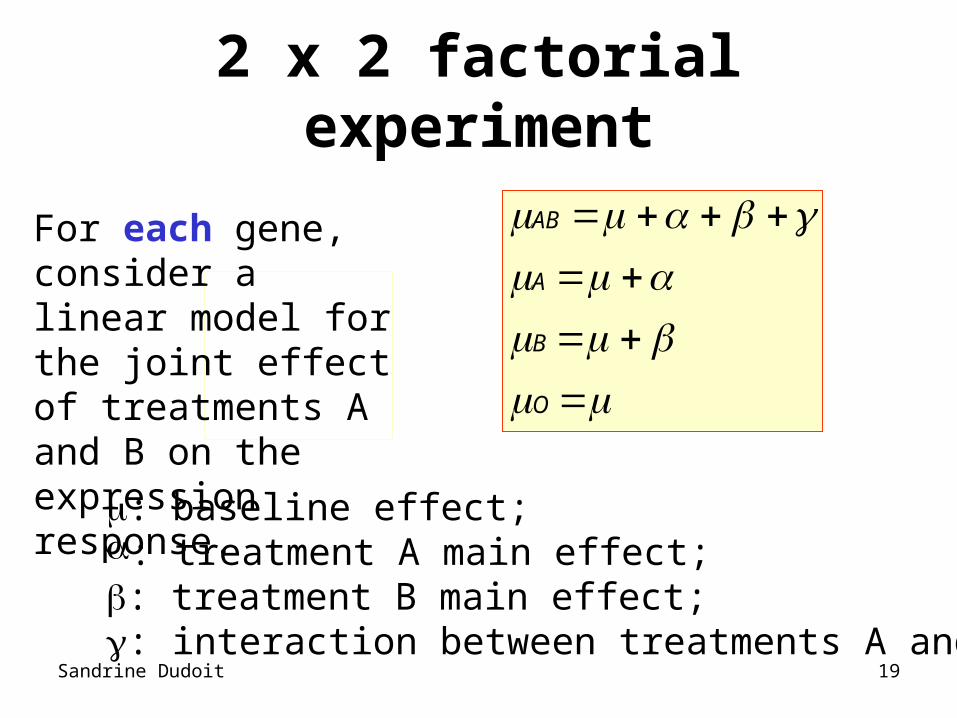
2 x 2 factorial experiment
For each gene, consider a linear model for the joint effect of treatments A and B on the expression response.
O
B
A
AB
: baseline effect;: treatment A main effect; : treatment B main effect;: interaction between treatments A and B.
Sandrine Dudoit 20
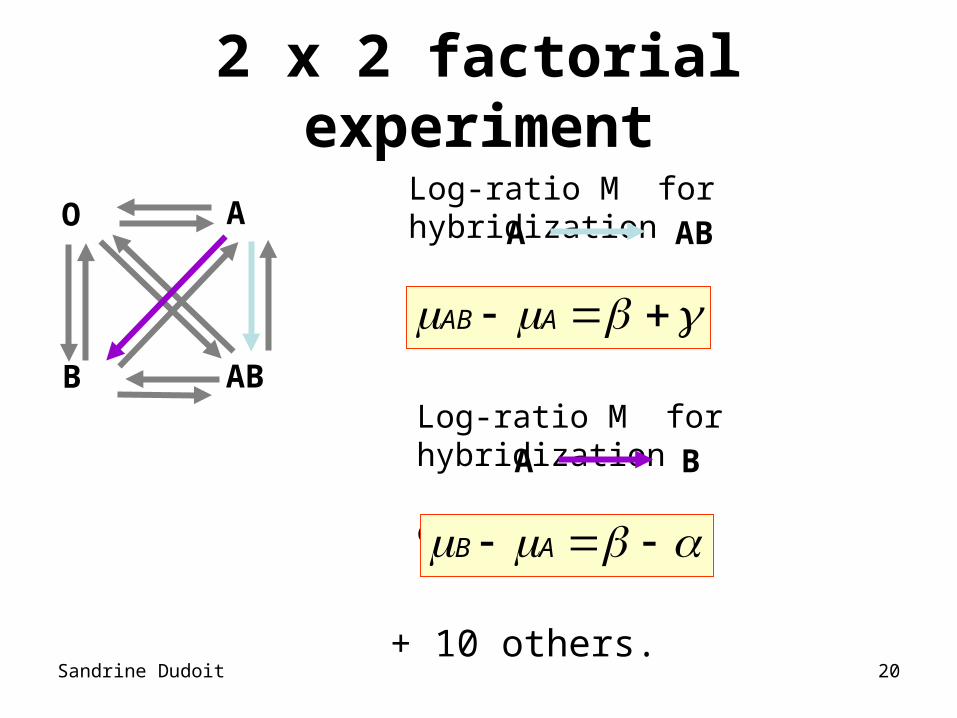
2 x 2 factorial experiment
Log-ratio M for hybridization
estimates
AAB
O A
B AB
A AB
Log-ratio M for hybridization
estimates
AB
A B
+ 10 others.
Sandrine Dudoit 21
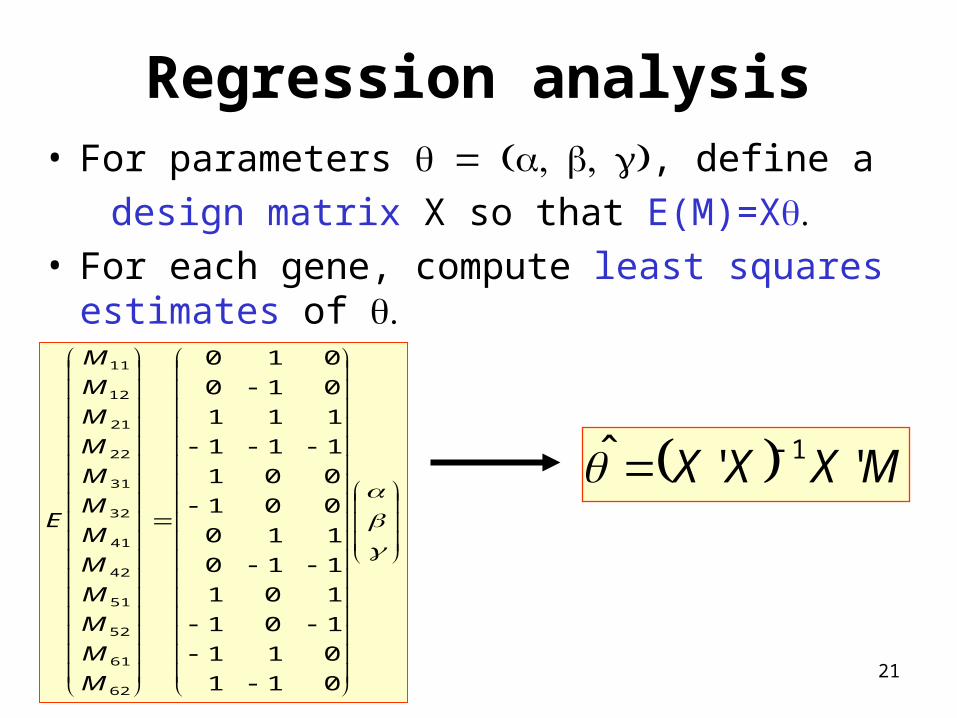
Regression analysis• For parameters , define a
design matrix X so that E(M)=X• For each gene, compute least squares estimates
of
011
011
101
101
110
110
001
001
111
111
010
010
62
61
52
51
42
41
32
31
22
21
12
11
M
M
M
M
M
M
M
M
M
M
M
M
E
MXXX ''ˆ 1
Sandrine Dudoit 22
Regression analysis• Combine data across slides for complex designs
- can “link” different sets of hybridizations.• Obtain unbiased and efficient estimates of the
effects of interest (BLUE).• Obtain measures of precision for estimated effects.• Perform hypothesis testing.• Extensions of linear models
– generalized linear models; – robust weighted regression, etc.
Sandrine Dudoit 23
Differential gene expression• Identify genes whose expression levels are
associated with a response or covariate of interest– clinical outcome such as survival, response to
treatment, tumor class;– covariate such as treatment, dose, time.
• Estimation: estimate effects of interest and variability of these estimates. E.g. slope, interaction, or difference in means in a linear model.
• Testing: assess the statistical significance of the observed associations.
Sandrine Dudoit 24
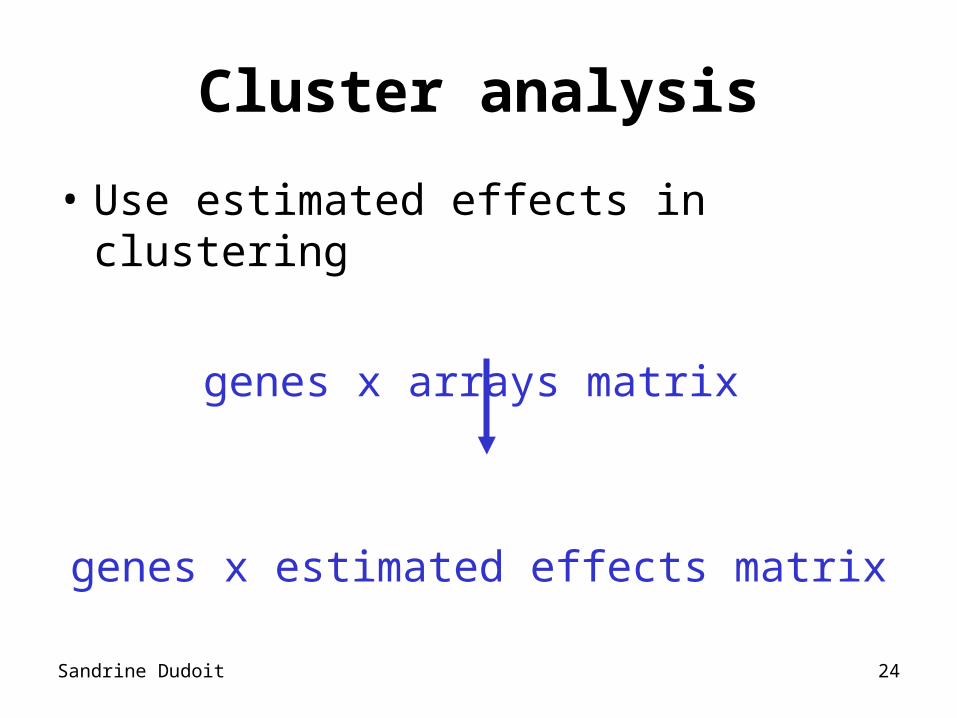
• Use estimated effects in clustering
genes x arrays matrix
genes x estimated effects matrix
Cluster analysis