Indian Journal of Traditional Knowledge
Vol 19(4), October 2020, pp 821-831
Micronutrients and phytochemicals content in various rice (Oryza sativa Linn.) samples
control carbohydrate digestion variedly and present differential antioxidant activities: an
in vitro appraisal
S Deepthia, K Anusha
a,c, A Anand
a,c, A Manasa
b, K Suresh Babu
a,c, M K R Mudiam
b,c & A K Tiwari
*,a,c,+
aCentre for Natural Products & Traditional Knowledge, CSIR-Indian Institute of Chemical Technology, Hyderabad-500 007 India bAnalytical & Structural Chemistry, CSIR-Indian Institute of Chemical Technology, Hyderabad-500 007 India
cAcademy of Scientific & Innovative Research (AcSIR), Ghaziabad 201 002 India
E-mail: [email protected]; [email protected]
Received 17 May 2019; revised 31 July 2019
High starch and carbohydrate content in rice (Oryza sativa Linn.) disparages this food responsible for postprandial
hyperglycemic excursions. However, rice is an Asian food synonym. Additionally, in traditional Indian healing practices, rice is
used for treatment of various disorders. In this research, we analyzed micronutrient and phytochemical contents in different rice
samples available in market. Effect of aqueous-ethanol extract of each type of rice was evaluated against intestinal α-glucosidase to
examine extract’s influence on carbohydrate digestion. Free-radicals scavenging activities as a measure of antioxidant potential in
different rice were also examined. Brown-rice presented highest (54%) α-glucosidase inhibition followed by parboiled-rice (52%),
idly-rice (48%), hand-pounded rice (42%), dosa-rice (40%) and basmati-rice (39%). Polished white sona-masoori rice presented
least enzyme inhibitory (31%) activity. Presence of higher α-glucosidase inhibitory activity was regarded as slow digesting rice that
would impart lesser postprandial glycemic excursion. Brown and parboiled-rice presented highest ABTS֗+ radical scavenging (74%)
activity whereas; idly-rice displayed highest DPPH scavenging (50%) activity. Higher polyphenol and niacin contents in rice were
found significantly (p<0.0001 and p<0.01 respectively) correlated with enzyme inhibitory activity. Higher polyphenol content was
found responsible for enhanced free-radicals scavenging activity. Increasing concentrations of niacin and pantothenic acid
correlated with ABTS֗+ radical scavenging activity.
Keywords: Antioxidant activity, Carbohydrate digestion, α-Glucosidase inhibition, Micronutrients, Phytochemicals, Rice
IPC Code: Int. Cl.20: A61P 17/00, D21C 7/00, C23F 13/00, A01N 43/90, A61K 36/00
Rice (Oryza sativa Linn.), the grain of life; is food
synonym for Asians1. Recently, in an international
study presented at Glasgow UK, in European
Congress on Obesity, it was disclosed that eating
Japanese- or Asian-style diet, based on rice prevents
people become obese2. Apart from its use as food,
since ancient times, rice has been part of traditional
medicine throughout India. In Ayurvedic texts, it is
mentioned as Śāli (transplanted rice), Vrihi (broad
casted rice) and Sashtika (summer rice that matures in
60 days; in Sanskrit language sashtika means sixty)1,3
.
Varieties of rice viz. Rajanam, Krishna Sali, Red
Samba, Munda Sali, Mahasali, Sugandha Sali, Thriya
Sali, White Samba, Aalcha, Karhani, Kalimoonch,
Maharaji, Bhajari, Dhanwar, Mehar, Saraiphol, Kari
bhatta, Karikagga, Atikaya, Mullarya, Nivara,
Erumakkari, Katheri, Kaflaya, Matali, Lal Dhan have
been known in different parts of India and were used
against various ailments1.
The local rice varieties such as Atire, Kayame,
Hallinga, Halaga, Nattijaddu, Peetasale, Pingara,
Hallaga, Rajakayame, Chare, Kalame, Maskat,
Bilehagga, Atikaraya, Gandasale, Mesebattha,
Kajajaya, Gulavadi sanna, Nerambade, Kavalakannu,
Kalakedodru, Moradda, Suggikayame, Atikaya,
Katamunda, Kandalakutti, Chikkasale, Giresale,
Karikagga, Bilikagga, Jerigesanna, Jadagi, Halaga-
1, Hanasu, Kiruvannu have been found beneficial in
many disease conditions and are used traditionally by
local people of coastal Karnataka state of India4.
Similarly, wide genetic diversity among rice varieties representing Śāli (cultivated during monsoon season), Boro (cultivated preferably during winter season), Jum (adapted to dry land) and glutinous (commonly cultivated throughout the region as a source of grain for breakfast and dessert for many ethnic communities) have been reported to be cultivated in North-Eastern part of India
4. Varieties
such as Lahi, Local Basmati, Borjahinga, Joha, Hati Hali, Balam, Lallatoi, Arfa, Mulahail, Guaroi,
————— *Corresponding Author

INDIAN J TRADIT KNOW, OCTOER 2020
822
Harinarayan, and Bherapawa are considered Sali rice. The Boro type rice constitue Aubalam, Bashful and Moircha whereas, Papue, Sorpuna, Kawanglaawang and Mimutim as Jum type rice and Til Bora, Kaki beroin, Bas beroin, Barua beroin, Ranga borah are cultivated as glutinous rice in the region
5.
Rice water or its gruel has been prescribed in
Ayurveda to be taken with Ayurvedic formulations
namely Kamdudha ras, Amritanav ras, Pradraripu ras,
Mahagandhak ras, Swarn malati ras, Sutsekhar ras,
Dughdavati, Pradak nasak churna, Laghumai ras,
Pushpnag churna, Mukta sukti, and Sangrahat bhasm in
order to either improve the efficacy of drugs or
minimize the unwanted effects of such Ayurvedic
preparations1. Traditional healers and farmer were
acquainted with the healing power of rice preparations.
Extract of brown rice have been used by the people as
energy drink, increase lactation in child bearing
mothers and nutritious drink to child, treatment of
chronic gastric complications and jaundice. The sticky
glutinous rice was found helpful in soothing stomach
upset, nausea, heart burn and, brown rice extract has
been reported beneficial in breast and stomach cancer6.
According to Charak Samhita, consumption of red sali
rice with old sashtika rice relieves fever (रक्तशाल्यादयः
शस्ाः पुराणाः षष्टिक ः सह Ch.Chi 3/178)7, and in case of
chest, pelvis and head pain during that condition, the
consumption of liquid gruel of red sali rice has been
advised accordingly (पेयाां वा रक्त शालीनाां पार्श्वबष्टस्ष्टशरोरुष्टज
Ch.Chi.3/181)7. Furthermore, consumption of sali and
sashtika rice along with butter, ghee, goat’s meat and,
fresh wine has been proposed to check bleeding from
hemorrhoids as per the shloka नवनी्घृ्ां छागां माांसां च
सषष्टिकः शाष्टलः । ्रुणश्च सुरामण्डस्रुणी च सुरा ष्टनहन्त्यस्रम ्Ch.Chi.14.211)
7. Similarly, regular consumption of sali
rice along with barley (सेष्टव् शोफाष्टभष्टह्ाांश्च योगान ्
पाण््वामयी शालीयवाांश्च ष्टन्यम,् Su.Su.44.37)8 has been
prescribed to relieve conditions like inflammatory
swellings, anemia and vomiting and intake warm gruel
soup of old sali rice along with roasted meat of wild
animals (जीणवशाल्योदनां ष्टिग्धमल्पमुष्णां द्रवोत्तरम ् । भुञ्जानो
जाङ्गल मावस ः शीघ्रां व्रणमपोहष्ट ् (Su.Su.19.32) has been
stipulated to promote wound healing according to
Sushruta Samhita8.
Unfortunately however, in spite of the presence of
these wide varieties of rice in localized regions,
scientific literatures1,4
and their medicinal
properties3,6-9
, the common consumer of modern day
is hardly acquainted with the presence of such
varieties of rice or even aware of their medicinal
properties. Such information of varieties and the
knowledge about medicinal values of rice is vanishing
along with folks who lived life traditional ways. The
newer generation rather is made scared about
consumption of rice for the fact that it has high glycemic
value. Industrial processing and polishing of rice in
order to make grains whiter, smoother and silky attracts
consumer’s attention and easy cooking of such polished
white rice made it preferable in almost every home
kitchen. Processing and polishing in fact, removes vital
micronutrients, vitamins and minerals from the grain and
leaves grain with concentrated starch/carbohydrate.
Higher consumption of such polished rice induces
higher glycemic response and is associated with
increased risk of type 2 diabetes especially in Asian
population10
. It is reported that consumption of each
serving per day of white rice is responsible to increase
about eleven percent the risk of type 2 diabetes
development in this population10
. On the other hand, the
unpolished rice retains majority of its micronutrients and
phytochemicals present in the bran layer and hence,
appears red or brown in color. It is this rice that has been
described healthy in Ayurvedic literatures beneficial and
advocated by traditional healers7,8
.
The rate of digestion and glycemic response of a
dietary material depends on several factors including
starch/carbohydrate content and number of other
micronutrients and phytochemicals that interfere with
their digestion process. Elevated postprandial glycemic
condition induces oxidative stress which is an
independent risk factor aggravating endothelial
dysfunction and development of diabetic vascular
complications11
. Therefore, rice which digests slowly
and presents potent antioxidant activity may become
preferred grain for consumption to avoid higher
postprandial glycemic response, mitigate postprandial
oxidative burden and development of diabetic
cardiovascular complications.
In this research, we assessed in vitro the carbohydrate
digestion resisting potential and free-radicals scavenging
antioxidant activity in aqueous-ethanol extract of various
type of rice available to the consumers in super markets.
Simultaneously, efforts were also made to find
correlation between the analyzed phytochemicals and
micronutrients that influence carbohydrate digestion and
antioxidant activities.
Material and Methods
Sample collection and preparation
Ready to cook rice samples were procured from
super market with available specifications over the
DEEPTHI et al.: MICRONUTRIENTS AND PHYTOCHEMICALS IN RICE AFFECT IT’S DIGESTION
823
counter. Aromatic, long grain 12 months old Basmati
(BA) rice was of Haryana State origin. This rice after
cooking are non sticky and spreads it’s peculiar
Basmati aroma. Par boiled (BO) rice after cooking
gives non sticky and off white texture. This rice was
6 months old and originated from Aarani, Gingee
Tiruvannamalai (Tamilnadu State). Twelve months
old unpolished brown (BR) rice takes time for
cooking and appears sticky. This rice originated from
Miryalaguda, Kurnool (Telangana and Andhra
Pradesh). Six months old Dosa (DO) rice was of
Warangal (Telangana) origin. Grains of DO rice were
uniform, coarse and give soft texture to dosa (a south
India’s popular dish). Kanchipuram, Tindivanam
(Tamilnadu) originated, 6 months old, bold grain Idly
(ID) rice gives puffy texture to Idlies when cooked.
Nine months old medium size, uniform and elongated
grains of hand pounded (HP) rice was of Nizamabad,
Miryalguda (Telangana) origin. This rice looks very
much similar to brown rice. Polished (PO) silky
shining white rice is called Sona Masoori rice. It was
9 months old and originated from Nizamabad,
Miryalguda (Telangana). This rice gives white and
little sticky texture after cooking. It is very popular
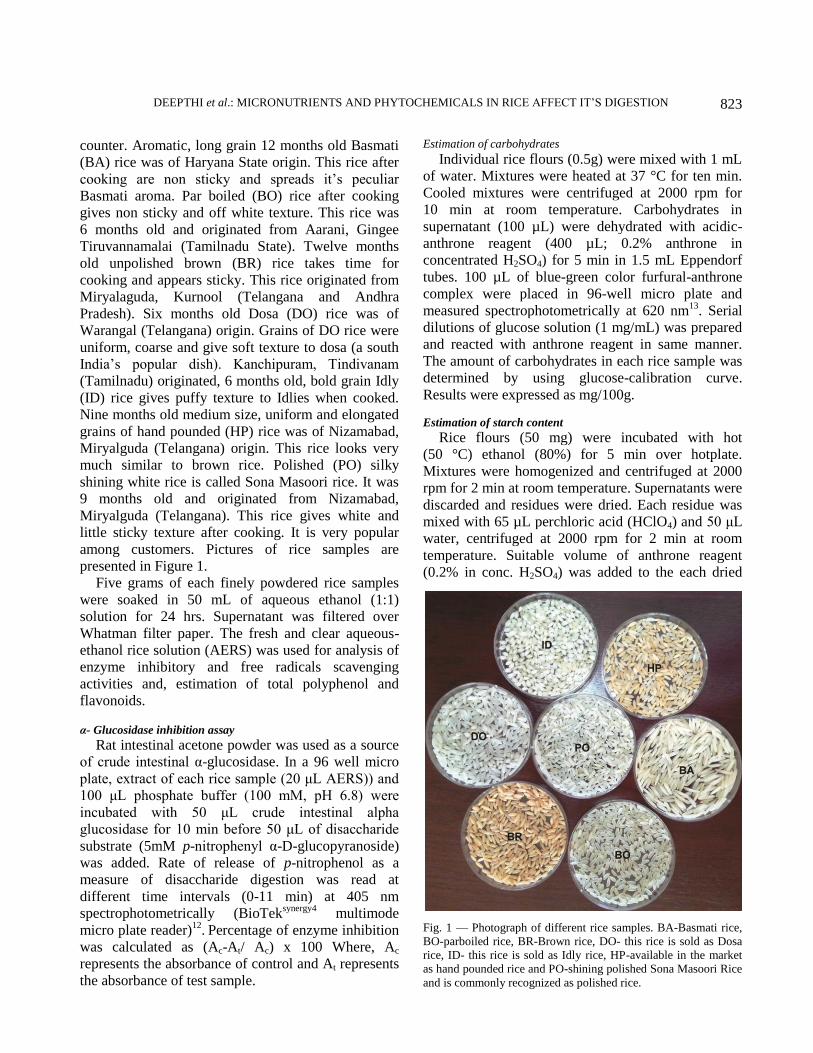
among customers. Pictures of rice samples are
presented in Figure 1.
Five grams of each finely powdered rice samples
were soaked in 50 mL of aqueous ethanol (1:1)
solution for 24 hrs. Supernatant was filtered over
Whatman filter paper. The fresh and clear aqueous-
ethanol rice solution (AERS) was used for analysis of
enzyme inhibitory and free radicals scavenging
activities and, estimation of total polyphenol and
flavonoids.
α- Glucosidase inhibition assay
Rat intestinal acetone powder was used as a source
of crude intestinal α-glucosidase. In a 96 well micro
plate, extract of each rice sample (20 μL AERS)) and
100 μL phosphate buffer (100 mM, pH 6.8) were
incubated with 50 μL crude intestinal alpha
glucosidase for 10 min before 50 μL of disaccharide
substrate (5mM p-nitrophenyl α-D-glucopyranoside)
was added. Rate of release of p-nitrophenol as a
measure of disaccharide digestion was read at
different time intervals (0-11 min) at 405 nm
spectrophotometrically (BioTeksynergy4
multimode
micro plate reader)12
. Percentage of enzyme inhibition
was calculated as (Ac-At/ Ac) x 100 Where, Ac
represents the absorbance of control and At represents
the absorbance of test sample.
Estimation of carbohydrates
Individual rice flours (0.5g) were mixed with 1 mL
of water. Mixtures were heated at 37 °C for ten min.
Cooled mixtures were centrifuged at 2000 rpm for
10 min at room temperature. Carbohydrates in
supernatant (100 µL) were dehydrated with acidic-
anthrone reagent (400 µL; 0.2% anthrone in
concentrated H2SO4) for 5 min in 1.5 mL Eppendorf
tubes. 100 µL of blue-green color furfural-anthrone
complex were placed in 96-well micro plate and
measured spectrophotometrically at 620 nm13
. Serial
dilutions of glucose solution (1 mg/mL) was prepared
and reacted with anthrone reagent in same manner.
The amount of carbohydrates in each rice sample was
determined by using glucose-calibration curve.
Results were expressed as mg/100g.
Estimation of starch content Rice flours (50 mg) were incubated with hot
(50 °C) ethanol (80%) for 5 min over hotplate.
Mixtures were homogenized and centrifuged at 2000
rpm for 2 min at room temperature. Supernatants were
discarded and residues were dried. Each residue was
mixed with 65 µL perchloric acid (HClO4) and 50 μL
water, centrifuged at 2000 rpm for 2 min at room
temperature. Suitable volume of anthrone reagent
(0.2% in conc. H2SO4) was added to the each dried
Fig. 1 — Photograph of different rice samples. BA-Basmati rice,
BO-parboiled rice, BR-Brown rice, DO- this rice is sold as Dosa
rice, ID- this rice is sold as Idly rice, HP-available in the market
as hand pounded rice and PO-shining polished Sona Masoori Rice
and is commonly recognized as polished rice.

INDIAN J TRADIT KNOW, OCTOER 2020
824
residue and heated for 8 min and then cooled to room
temperature. In a 96-well micro plate, 100 µL of clear
cooled reaction mixture of each rice sample was
placed and absorbance of blue-green color furfural-
anthrone complex was measured spectro
photometrically at 630 nm14
. The amount of starch in
each rice sample was determined by using glucose-
calibration curve and expressed as mg/100g.
Estimation of total polyphenolic content
About 25 μL AERS of each rice sample was mixed
with 2.5 mL distilled water and 250 μL Folin-
Ciocalteu reagent and Na2CO3 (250 μL, 20%) in test
tubes. The mixtures were thoroughly shaken for
mixing and allowed to stand for 60 min at room
temperature. 100 μL of each samples were placed in
96-well micro plate and absorbance was recorded at
765 nm spectrophotometrically12
. Gallic acid was
taken as standard and the content was measured in the
samples were expressed as µg of GAE/mL.
Estimation of total flavonoid content
Briefly, in 96-well plate, 125 μL of AERS were
mixed with 125 μL of 2% AlCl3.6H2O and absorbance
was read at 430 nm spectrophotometrically12
. Rutin
was taken as the standard drug and the flavonoid
content in the samples were expressed in terms of
Rutin Equivalent (µg RE/mL).
Antioxidant activity
ABTS֗+ radical cation scavenging
10 μL AERS of each rice sample were mixed with
190 μL of ABTS֗+ radical cation solution. The kinetics
of ABTS֗+ radical cation decolorization was recorded
at the intervals of 1 min for 30 mins
spectrophotometrically at 734 nm15
. The percentage
of inhibition was calculated as (Ac-At/ Ac) x100
Where, Ac represents the absorbance of control and At
represent the absorbance of test sample. Results were
measured in triplicates. DPPH radical scavenging
The reaction mixture contained 25 μL AERS of
each rice sample , 125 μL of 0.1 M tris-HCl buffer
(7.4) and 125 μL of 0.5 mM DPPH solution. The
kinetics of DPPH radical decolorization was recorded
at the interval of 1 min for 15 mins at 517 nm
spectrophotometrically15
. The percentage of inhibition
was calculated as (Ac-At/ Ac) x100 Where, Ac
represents the absorbance of control and At represent
the absorbance of test sample.
Multicomponent micronutrients analysis
Chemicals and reagents
The analytical standards of biotin, folic acid,
hesperetin, niacin, pantothenic acid, quercetin,
riboflavin along with other chemical reagents and
solvents of mass grade (methanol, acetonitrile, ethanol,
ammonium formate, formic acid, sodium hydroxide
and orthophosphoric acid) were procured from Sigma
Aldrich. Ultrapure water obtained after filtration with
0.2 µ filter (Millipore, Synergy® 3 France) was used
throughout the study.
Preparation of Standard Solution
The stock solutions of analytical standards were
prepared by dissolving an amount of 10 mg of
individual nutrients in a 10 ml of suitable solvent and
stored in dark at 4°C. The mixture of nutrients was
prepared by combining individual stock solutions to
form a working standard of 0.1 mg/mL. Water soluble
vitamins were dissolved in water. Flavonoids were
dissolved in acetonitrile and quercetin was dissolved in
methanol.
Instrumentation
Analysis was performed on ultra performance
liquid chromatography-triple quadrupole mass
spectrometer (UPLC-ESI-MS/MS) contain an acquity
H-class UPLC and Xevo TQ-S micro MS system
(Waters India Pvt Ltd., Milford). The UPLC consisted
of a degasser, pump and detector with ESI source.
Instrument was operated by Masslynx software
version 4.1. The vortex mixer (Neuation, iSwix VT),
ultrasonic bath (BANDELIN), centrifugation
(HERMIE-Z300), weighing balance (Sartorius
BSA224-CW), pH meter (Cole Parmer). HLB
cartridges (Supelco super-select HLB 60 mg/3ml)
used for clean-up of samples by solid-phase extraction
were purchased from Sigma Aldrich (MO, USA). The
solid-phase extraction with 12 position vacuum
manifold for cleanup was used (Phenomenex). The
water was purified with 0.2 μ PVDF filter (Millipore,
Synergy® 3 France).
Analytical procedure
The extraction and analysis of selected nutrients
were analyzed using our recently reported method16
.
Briefly, the powder sample (100 mg) placed in 15 mL
centrifuge tube was extracted with 5.20 mL of mobile
phase A (20 mM ammonium formate, 0.1% formic
acid in water) and 3 mL of mobile phase B (20 mM
ammonium formate, 0.1% formic acid in methanol)
and vortexed for 3 min then sonicated for 5 min
DEEPTHI et al.: MICRONUTRIENTS AND PHYTOCHEMICALS IN RICE AFFECT IT’S DIGESTION
825
followed by centrifugation for 5 min at 6,000 rpm.
The resultant solutions were maintained at pH
5 followed by cleanup with solid-phase extraction
system using supel-select SPE tubes (60 mg/3 ml).
The SPE after loading and washing was eluted with
80% methanol. The eluent was injected into
LC-MS/MS system for further analysis. The column
used for analysis is BEH C18 column (100 mm × 2.1
mm, 1.7 μm particle size) in both, positive and
negative modes with a source temperature of 150oC,
capillary voltage at 3 KV and desolvation gas flow of
650 L/hr. The analytes (multi-class nutrients) were
quantified in multiple reactions monitoring (MRM)
mode. Optimal conditions for all the analytes are
summarized in Table 1. Mobile phase A & B run in
gradient program consisted of mobile phase A kept at
95% for 0.1-4 min, at flow 0.350 ml/min; then 4-8
min, 30% A flow at 0.300 ml/min; 8-10 min, 0% A
flow at 0.400 ml/min; 10-13 min, 95% A flow at
0.350 mL/min with an injection volume of 5 l.
Samples were quantified with external standard
method with a calibration range of 10-1000 ng/g with
regression range of 0.997-0.999. Values obtained so
were converted into µg/100g accordingly.
Statistical analysis
One-way ANOVA followed by Tukey’s multiple
comparison tests, and Unpaired-t test with Welch’s
correction was applied suitably to analyze data.
Analyses were performed using Graph pad Prism
5.03.
Results and Discussion
Intestinal α-glucosidase is ultimate carbohydrate
digesting enzyme present in intestinal brush borders
that breaks disaccharides into monosaccharides viz.
glucose and fructose. Therefore, the rate of food
digestion by α-glucosidase is one of the primary
factor governing incursions of glucose into the blood.
Figure 2(a) presents influence of different rice
samples’ extract on kinetics of intestinal α-glucosidase
and bar graph in Figure 2(b) shows end-point values of
decrease in enzyme activity potential by extracts.
Steeper is the slope faster is the digestion of
carbohydrate (Fig. 2a). It is evident from figure 2(a)
that extract of BR rice followed by BO, ID and HP rice
slowed down enzyme activity more potently than
extract of other rice samples. Extract from PO rice
presented least decline in enzyme activity (Fig. 2a). It
was interesting to record that enzyme action started
soon after addition of disaccharide substrate
p-nitrophenyl α-D-glucopyranoside where α-glucosidase
was preconditioned with PO and BA rice extract.
Whereas, it took more than four minutes in the case of
BR rice extract preconditioned enzyme followed by BO
and ID extract preconditioning (Fig. 2a).
Figure 2(b) presents decrease in intestinal α-
glucosidase activity at 11th minute (end-point time)
under influence of different rice extracts. The decline
in α-glucosidase activity due to priming with extract
of BA (39%), DO (40%) and HP (42%) rice samples
was found comparable as they did not differ
significantly among each other (Fig.1b). Similarly, the
fall in enzyme activity by BO (52%) rice extract was
also found closer to BR (54%) and ID (48%) rice.
However, it was significantly higher (p<0.05) with
BR rice extract priming (54%) when compared with
ID (48%) rice (Fig. 2b). Preconditioning of enzyme
with PO rice extract poorly affected enzyme activity
(31%) among studied rice samples (Fig. 2b). These
results demonstrate that BR, BO and ID rice contain
active principles that can appreciably slow down
activity of carbohydrate digesting enzyme and hence
consumption of these rice may impart lesser
postprandial glycemic excursion than other rice like
PO, BA, DO and HP.
For, rice is the prominent source of carbohydrate; it
is first choice of food grains. The carbohydrate is a
general term used as macronutrients content in food
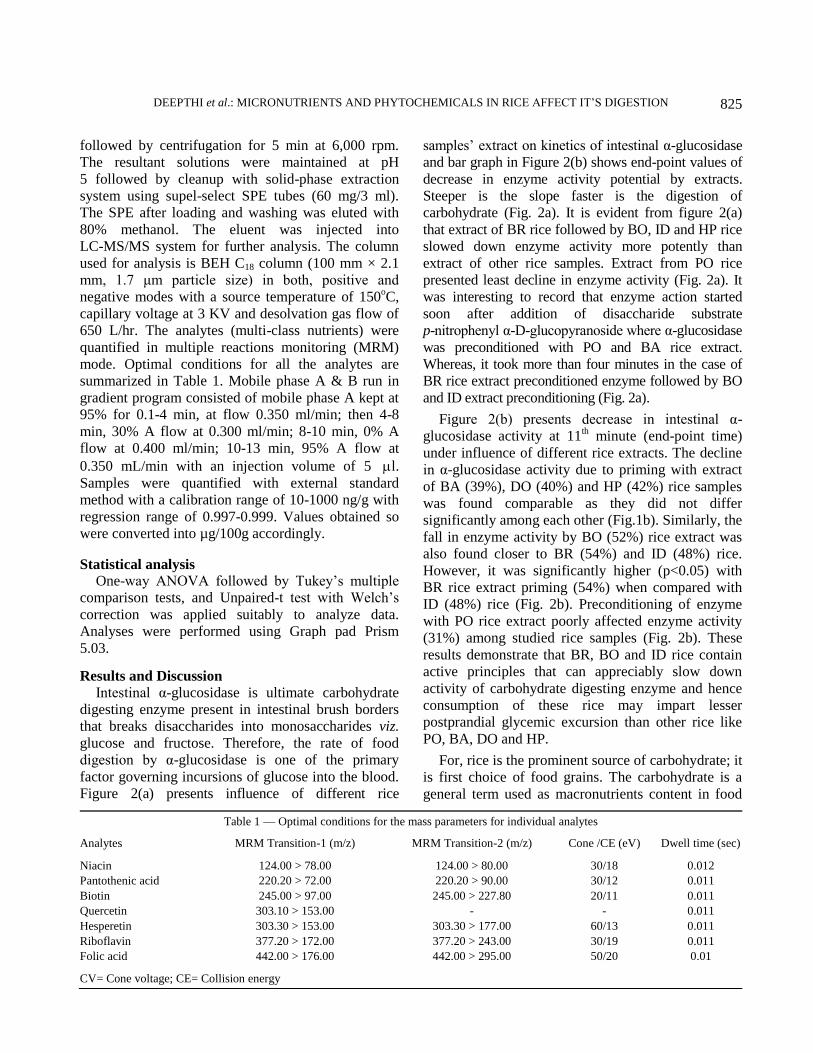
Table 1 — Optimal conditions for the mass parameters for individual analytes
Analytes MRM Transition-1 (m/z) MRM Transition-2 (m/z) Cone /CE (eV) Dwell time (sec)
Niacin 124.00 > 78.00 124.00 > 80.00 30/18 0.012
Pantothenic acid 220.20 > 72.00 220.20 > 90.00 30/12 0.011
Biotin 245.00 > 97.00 245.00 > 227.80 20/11 0.011
Quercetin 303.10 > 153.00 - - 0.011
Hesperetin 303.30 > 153.00 303.30 > 177.00 60/13 0.011
Riboflavin 377.20 > 172.00 377.20 > 243.00 30/19 0.011
Folic acid 442.00 > 176.00 442.00 > 295.00 50/20 0.01
CV= Cone voltage; CE= Collision energy

INDIAN J TRADIT KNOW, OCTOER 2020
826
grain. Starch is a form of complex carbohydrate in
food grains. The viscosity present in rice due to starch
determines the quality of rice17
and viscous nature of
starch present in rice makes food more appealing and
tastier18
. Our analysis shows that starch content in BA
and DO rice sample was significantly (p<0.001 and
p<0.009 respectively) higher than carbohydrate
content present in these two rice samples (Fig. 3)
whereas carbohydrate content in ID rice was
significantly (p<0.007) higher than starch content
(Fig. 3). Amongst seven collected samples from
market, DO rice was found richest source of starch
and carbohydrate (Fig. 3). Starch and carbohydrate
content in studied rice samples were determined in
whole rice grain. Although these parameters cannot
be directly read and corroborated with their influence
on enzyme activity, we made an attempt of finding
correlation between starch/carbohydrate content in
rice samples with enzyme activity. Here, we
subtracted the decreased enzyme activity values with
hundred percent activity of the enzyme from figure
1b. Applying non-parametric correlation test
(Spearman correlation), it was found that high starch
and carbohydrate content in rice was significantly and
positively (p<0.04) correlated with the digestion of
rice (Fig. 4). It is also important to note here that DO
rice despite being richest source of starch and
carbohydrate in our sampling (Fig. 3), decreased
α-glucosidase activity better (40%) than PO rice
(31%) (Fig. 2b). Similarly, the carbohydrate and
starch content in ID and PO rice presented closer
values (Fig. 3), decline in enzyme activity by ID rice
extract however, was found 17% more than that
present in PO rice (Fig. 2b). Analogous results were
found for other rice samples also where starch and
carbohydrate content was in close vicinity (Fig. 3) but
Fig. 3 — Starch and carbohydrate content in different rice samples.
Values are mean±SD, n=3. Unpaired-t test with Welch’s correction
was applied to find difference between starch and carbohydrate
content in individual rice. ap<0.001,bp<0.0076 and cp,0.0096.
Fig. 4 — Correlation between carbohydrate and starch content in
rice and intestinal α-glucosidase activity.
Fig. 2 — Rat intestinal α-glucosidase activity over time (a) under
influence of different rice extracts and (b) % decrease in enzyme
activity due to different rice extracts. Bars bearing letters ‘a’ and ‘b’
are not significantly different among each other however, ‘c’ has
significant (p<0.05) difference. Values represent mean±SD of three
triplicate experiments in case of figure ‘b’ while mean value was
plotted in figure ‘a’. One-way ANOVA followed by Tukey’s multiple
comparison tests was applied to find differences within the bars.

DEEPTHI et al.: MICRONUTRIENTS AND PHYTOCHEMICALS IN RICE AFFECT IT’S DIGESTION
827
their influence on slowing down the enzyme activity
was different (Fig. 2b). These observations disclose
that besides starch and carbohydrates, there are other
constituents in rice which determine their rate and fate
of digestion.
Polyphenol-rich functional foods/nutraceuticals are
emerging as newer food supplements to control
postprandial hyperglycemic excursions in type
2 diabetics by virtue of their abilities to slow down
activity of carbohydrate digesting enzymes19
.
Similarly, natural flavonoids have also been
implicated in influencing activity of number of
enzymes including intestinal α-glucosidase,
responsible for multitude of therapeutic activities20
.
Examination of polyphenol and flavonoids contents in
our study (Table 2) showed that there was great
variation in polyphenol content in studied rice
samples. The PO rice sample presented least
polyphenol content where as BO followed by BR and
ID rice displayed higher polyphenol content among
studied rice samples (Table 2). Although, the total
flavonoids content was recorded to be present in each
rice sample, the differences were not much wider as
observed for polyphenol content except in DO rice
extract where flavonoids content was lowest
(Table 2). It was found that polyphenol content in rice
extract significantly (p<0.0001) affected activity of
intestinal α-glucosidase (Fig. 5). More was the
polyphenol content in rice sample; greater was the
decline in intestinal α-glucosidase activity (Fig.5) and
hence, slower the rate of digestion. Our analysis could
not find correlation however, with flavonoids content
in rice impinging enzyme activity. The flavonoids
hesperetin and quercetin are well reported potent α-
glucosidase inhibitors19,21
, and were found present in
our sampled rice extract (Table 2). Because their
concentration did not differ appreciably among the
extract of studied rice samples (Table 2), their
correlation with enzyme inhibitory could not be found
in our analysis.
Our study finds that concentration of polyphenols
in rice grain negatively influence rate of rice digestion
and hence polyphenol-rich rice may become ideal
substitute for better control of postprandial glycemic
excursion after their consumption. It is important to
mention here that polyphenol is a generic term used to
classify compounds containing phenolic hydroxyl.
The effect of polyphenolic compounds influencing α-
glucosidase activity depends on their structural
features. There are reports which show that
polyphenols behave as double-edged sword and can
also augment α-glucosidase activity21,22
. The
observation in our analysis that polyphenols present in
rice extract slow down activity of intestinal
α-glucosidase activity, warrants identification of
α-glucosidase inhibitory polyphenols in different rice
varieties. Identification of such compounds and their
concentrations may help categories rice for their apt
marketing and consumer education.
Table 2 — Phytochemical and micronutrient content in different market samples of rice.
Total
Polyphenol (µg/mL, GAE)
Total
Flavonoids (µg /mL, RE)
Multicomponent micronutrients (µg/100g)
Niacin
(Vit. B3)
Pantothenic
acid (Vit. B5)
Biotin
(Vit. B7)
Riboflavin
(Vit. B2)
Folic acid
(Vit. B9)
Quercetin Hesperetin
BA 64.8±0.004 875.36±0.04 58.6±0.74 3.4±0.12 35.5±0.86 19.9±0.57 2.0±0.87 0.8±0.20 0.8±0.44
BO 103.2±0.001 811.59±0.01 74.6±1.30 4.7±0.28 34.0±0.38 22.5±0.09 2.3±0.11 0.7±0.13 0.8±0.17
BR 93.1±0.006 901.4±0.001 105.5±0.72 8.0±0.04 24.7±0.62 20.2±0.16 1.9±0.43 0.5±0.15 0.7±0.44
DO 56.7±0.002 597.10±0.003 27.4±0.86 3.3±0.23 34.9±0.87 22.3±0.72 2.2±0.54 0.8±0.25 0.8±0.12
ID 76.9±0.008 721.7±0.02 51.6±1.08 2.3±0.10 36.9±1.03 15.0±0.69 0.1±0.35 0.6±0.23 0.7±0.14
HP 66.8±0.005 805.7±0.04 44.8±0.51 6.7±0.64 24.4±0.21 15.6±0.58 1.4±0.17 0.5±0.14 0.6±0.15
PO 48.6±0.003 936.23±0.27 13.9±0.24 2.3±0.14 26.9±0.81 17.0±0.0.31 1.9±0.56 0.6±0.21 0.7±0.12
Values represent mean±SD, n>3. All the experiments were repeated at least three times.
Fig. 5 — Influence of total polyphenol content in aqueous-ethanol
extract in rice on intestinal α-glucosidase activity. Values
represent mean±SD, n=3.
INDIAN J TRADIT KNOW, OCTOER 2020
828
Micronutrients deficiency among individuals with
diabetes is a well recognized phenomenon23
. Role of
various micronutrients in metabolic disturbances
leading to lifestyle related disorders is amply reported
in literatures24,25
. However, the knowledge about how
micronutrients help glycemic control is least
explored26
. Multicomponent-micronutrients analysis
of different rice samples is presented in table 2. It was
interesting to note that among four analyzed vitamin
Bs [Vitamin B2 (riboflavin), vitamin B3 (niacin),
vitamin B5 (pantothenic acid), vitamin B7 (biotin) and
vitamin B9 (folic acid), Table 2], higher concentration
of niacin (Vit. B3, nicotinic acid) was found positively
correlated with enzyme inhibitory activity (Fig. 6).
Extract from BR and BO rice presented highest
concentration of niacin among analyzed rice samples
(Table 2). These rice extracts also presented potent
enzyme inhibitory activity than other rice’s extract
(Fig. 1a & 1b). Nicotinic acid (niacin) has been
observed to improve disturbed glucose level and
parameters of oxidative stress in diabetic animal
model27
and several hybrids of niacin are reported to
possess α-glucosidase inhibitory and
antihyperglycemic activity28
. These observations
disclose that presence of micronutrients and
phytochemicals substantially affect digestion of rice
and impart multiple beneficial effects in diabetic
conditions. Therefore, selection of micronutrients and
phytochemicals rich rice varieties may help control
postprandial blood glucose excursion in hyperglycemic
population.
Consumption of oxidized (e.g. fried) or oxidizable
(e.g. cooked) meal increases burden of oxidative
stress29
. This stat is further aggravated when food is
poorly equipped with phytonutriens30
. Disturbance in
redox stat arising due to excess oxidative load or the
poor supply of nutritive antioxidants indicates dietary
oxidative stress30
. Sustained hyperglycemia is a
known inducer of postprandial oxidative stress and is
associated with the higher risk for atherosclerosis,
diabetes, and obesity31
. In fact, free radicals generated
beyond body’s normal physiological control lead
oxidative stress32
that overwhelm body’s ability to
regulate and maintain level balance between
physiological oxidants and antioxidants33
. Therefore,
presence of free radicals scavenging antioxidative
principles in diet becomes indispensable to pacify
postprandial oxidative stress and mitigate free radicals
induced damage to biomolecules.
The potentials of sampled rice extract in
scavenging of free radicals were estimated applying
ABTS·+
and DPPH radicals. The ABTS·+
cation is
amphiphilic in nature and is applied to identify both
the hydrophilic as well as lipophilic antioxidants
present in dietary materials34
where as organic
nitrogen centered DPPH radical evaluates the
reducing power of an antioxidant35
. Figure 7 presents
kinetics of ABTS·+
and DPPH radical scavenging
activity by extracts is shown in Figure 8. It is evident
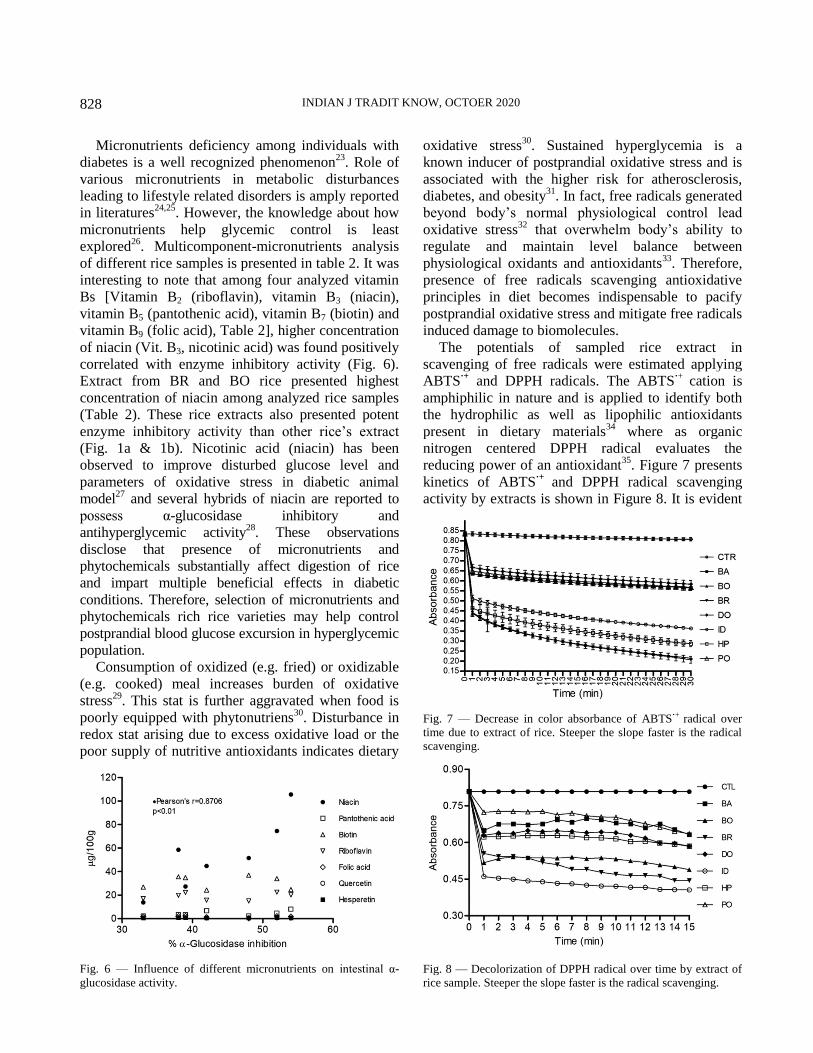
Fig. 6 — Influence of different micronutrients on intestinal α-
glucosidase activity.
Fig. 7 — Decrease in color absorbance of ABTS·+ radical over
time due to extract of rice. Steeper the slope faster is the radical
scavenging.
Fig. 8 — Decolorization of DPPH radical over time by extract of
rice sample. Steeper the slope faster is the radical scavenging.

DEEPTHI et al.: MICRONUTRIENTS AND PHYTOCHEMICALS IN RICE AFFECT IT’S DIGESTION
829
from figure 7 that the ABTS·+
radical scavenging
potential of extract from different rice samples varied
largely. In the order of ABTS·+
cation scavenging
activity, extract of BR and BO rice with 74%
scavenging at 30th minute stood most potent followed
by HP (65%), ID (55%), BA and PO (30%) , and DO
extract was least potent with 28% radical scavenging
(Fig.7). On the other hand, the order of DPPH radical
scavenging activity of extracts (Fig. 8) was not the
same as found for ABTS·+
radical scavenging. In this
case ID rice extract with 50% DPPH scavenging
activity at 15th minute stood first followed by BR
(46%), BO (41%), HP and DO (29%). BA and PO
rice extract were found least potent in scavenging
DPPH radical with 24% activity (Fig. 8). Although,
these radicals (ABTS·+
and DPPH) scavenging
activity was positively correlated with polyphenol
content in rice extract (Fig. 9) and vitamin B3
(niacin, Fig. 10) the differences in activity potentials
may be ascribed to the differences in
micronutrients phytochemicals types, compositions
and concentrations in different rice varieties.
Table 3 presents ranking of rice depending upon
their ability to slow down carbohydrate digestion,
ABTS·+
and DPPH radical scavenging potentials. It is
evident from table 3 that based on the required
qualities to slow down carbohydrate digestion with
substantial free radicals scavenging potentials, only
BR and BO could meet maximum criteria. However,
each variety of rice has its own important quality that
can be utilized depending upon the necessity.
In a recently reported randomized controlled clinical
trial36
, it was found that replacement of parboiled brown
rice at the place of white rice for three months, in the
diet of study participants possessing symptoms of
metabolic syndrome significantly improved HbA1c
level. Improvement in HbA1c, total cholesterol and low
density lipoprotein-cholesterol was noticed in
participants with BMI ≥25. Improvements in parameters
of inflammation were also recorded in study participants
with brown rice in the study36
. Observations made in our
study provide in part, presence of phytochemicals
micronutrients and plausible mechanism of actions by
which parboiled brown rice imparted beneficial effects
to the study participants.
In conclusion, our study reveals that although more
carbohydrate and starch content in rice is responsible
for higher postprandial glycemic excursion, their
digestion is controlled by number of micronutrients and
phytochemicals. Selection of micronutrient and
polyphenol rich rice therefore, may help counter rapid
hyperglycemic excursion induced due to rice
consumptions. Our study also supports clinical
observations that consumption of brown/parboiled rice
may offer therapeutic benefits to people with metabolic
syndrome and high BMI values. Further studies are
required to explore the role of particular micronutrients
and phytochemicals responsible for management of
postprandial glycemic excursion present in different
varieties of rice.
Fig. 9 — Correlation between polyphenol content in rice extract
with free radicals scavenging activity.
Fig. 10 — Correlation between micronutrient vitamin content in
rice and ABTS·+ radical scavenging activity.
Table 3 — Ranking of rice sample based on activities
Rank Decreasing
α-glucosidase
activity
ABTS·+ scavenging
activity
DPPH scavenging
activity
1 BR (54%) BR (74%) &
BO (74%)
ID (50%)
2 BO (52%) HP (65%) BR (46%)
3 ID (48%) ID (55%) BO (41%)
4 HP (42%) BA (30%) &
PO (30%)
HP (29%) &
do (29%)
5 DO (40%) &
BA (39%)
DO (28%) BA (24%) &
PO (24%)
6 PO (31%)

INDIAN J TRADIT KNOW, OCTOER 2020
830
Acknowledgement
Authors thank Director, CSIR-IICT for support
(IICT/Pubs./2019/178) and providing research
facilities. SD thanks D’CSIR-IICT for providing
opportunity to carry out her M Pharm dissertation
work in CSIR-IICT. AA acknowledges University
Grants commission, New Delhi for awarding SRF and
KA to Council of Scientific and Industrial Research,
New Delhi for providing SRF.
Conflict of Interest
All the authors declare that they have no conflict of
interest financial or otherwise.
Author Contribution SD, KA, AA & AM contributed in experimental
analysis, methodology, data generation, interpretation
and preparation of manuscript drafts. KSB, MKRM &
AKT were involved in concept development,
experiment design, data analysis, data interpretation,
manuscript writing, editing, finalization and funding
arrangements.
References 1 Ahuja U, Ahuja S C, Thakrar R, et al., Rice – A nutraceutical,
Asian Agri-History, 12 (2) (2008) 93–108.
2 European association for the study of obesity, News Release 30-
Apr-2019, International study suggests that eating more rice could
be protective against obesity, (https://www.eurekalert.org
/pub_releases/2019-04/eaft-iss043019.php accessed May 16,2019)
3 Sharma P V, Classical uses of medicinal plants first edition,
(Chaukhambha Visvabharati, Varanasi), 1996, 311-313.
4 Jakkeral S A, Patil S U, Hanumantappa M, et al., Medicinal
uses of red rice in coastal Karnataka, J Pharmacogn
Phytochem, SP3 (2018) 436-439.
5 Choudhury B, Khan M L & Dayanandan S, Genetic structure
and diversity of indigenous rice (Oryza sativa) varieties in the
Eastern Himalayan region of Northeast India, Springerplus, 2
(2013) 228. doi: 10.1186/2193-1801-2-228
6 Bhat F M & Riar C S, Health benefits of traditional rice
varieties of temperate regions, Med Aromat Plants, 4 (2015) 3.
http://dx.doi.org/10.4172/2167-0412.1000198.
7 Anonymous, Charaka Samhita of Agnivesha, Chikitsa
Sthanam, 3rd Chapter, 178th & 181st Slokas, 14th Chapter, 211th
Sloka 2009.
8 Anonymous, Sushruta Samhita, Sutra Sthanam, 44th Chapter,
37th Sloka & 19th Chapter, 32nd Sloka, 2009.
9 Hegde S, Yenagi N B & Kasturiba B, Indigenous knowledge
of the traditional and qualified Ayurvedic practitioners on the
nutritional significance and use of red rice in medications,
Indian J Tradit Know, 12 (3) (2013) 506-511.
10 Hu E A, Pan A, Malik V, et al., White rice consumption and
risk of type 2 diabetes: meta-analysis and systematic review,
BMJ, 344 (2012) e1454. doi: 10.1136/bmj.e1454.
11 Rebolledo O R & Actis Dato S M, Postprandial hyperglycemia
and hyperlipidemia-generated glycoxidative stress: its
contribution to the pathogenesis of diabetic complications, Eur
Rev Med Pharmacol Sci, 9 (4) (2005)191-208.
12 Srujana M S, Thota R S P, Anand A, et al., Raphanus sativus
(linn.) fresh juice priming moderates sucrose-induced
postprandial glycemia as well as postprandial glycemic
excursion in rats, Indian J Tradit Know, 18 (2) (2019) 339-345.
13 Yemm E W & Wills A J, The estimation of carbohydrates in
plant extracts by anthrone, Biochem J, 57 (3) (1954) 508–514.
14 Hansen J & Moller I, Percolation of starch and soluble
carbohydrates from plant tissue for quantitative determination
with anthrone, Anal Biochem, 68 (1975) 87-94.
15 Sailakshami A S R, Anand A, Madhusudana K, et al.,
Diospyros melanoxylone (Roxb.): a tribal fruit that maintains
euglycemic state after consumption and cools oxidative stress,
Ind J Nat Prod Res, 9 (3) (2018) 194-203.
16 Arvapally M, Asati A, Nagendla N K, et al., Development of
an analytical method for the quantitative determination of
multi-class nutrients in different food matrices by solid-phase
extraction and liquid chromatography-tandem mass
spectrometry using design of experiments, Food Chem, 341
(2021) 128173. doi.org/10.1016/j.foodchem.2020.128173
17 Fitzgerald M A, Martin M, Ward R M, et al., Viscosity of rice
flour: A rheological and biological study, J Agric Food Chem,
51 (8) (2003) 2295–2299.
18 Wani A A, Singh P, Shah M A, et al., Rice starch diversity:
Effects on structural, morphological, thermal, and
physicochemical properties—A review, Compr Rev Food Sci
Food Saf, 11 (2012) 417-436.
19 Rasouli H, Hosseini-Ghazvini S M, Adibi H, et al.,
Differential α-amylase/α-glucosidase inhibitory activities of
plant-derived phenolic compounds: a virtual screening
perspective for the treatment of obesity and diabetes, Food
Funct, 8 (5) (2017) 1942-1954. doi: 10.1039/c7fo00220c.
20 Middleton E Jr, Kandaswami C & Theoharides T C, The
Effects of plant flavonoids on mammalian cells: Implications
for inflammation, heart disease, and cancer, Pharmacol Rev,
52 (2000) 673–751.
21 Xiao J, Kai G, Yamamoto K, et al., Advance in dietary
polyphenols as α-Glucosidases inhibitors: A review on
structure-activity Relationship Aspect, Crit Rev Food Sci Nutr,
53 (2013) 818–836.
22 Asgar M A, Anti-Diabetic Potential of Phenolic Compounds:
A Review, Int J Food Prop, 16 (2013) 91–103.
23 Matteucci E, Passerai S, Mariotti M, et al., Dietary habits and
nutritional biomarkers in Italian type 1 diabetes families:
evidence of unhealthy diet and combined vitamin-deficient
intakes, Eur J Clin Nutr, 59 (1) (2005) 114–122.
24 Garcia O P, Long K Z & Rosad J L, Impact of micronutrient
deficiencies on obesity, Nutr Rev, 67 (10) (2009) 559–572.
25 Chehade L M, Sheikh-Ali A & Mooradian A D, The role of
micronutrients in managing diabetes, Diabetes Spectr, 22 (4)
(2009) 214-218.
26 Walker A F, Potential micronutrient deficiency lacks
recognition in diabetes, Br J Gen Pract, 57 (534) (2007) 3–4.
27 Abdullah K M, Alam M M, Iqbal Z, et al., Therapeutic effect
of vitamin B3 on hyperglycemia, oxidative stress and DNA
damage in alloxan induced diabetic rat model, Biomed
Pharmacother, 105 (2018) 1223-1231.
28 Narender T, Madhur G, Jaiswal N, et al., Synthesis of novel
triterpene and N-allylated/N-alkylated niacin hybrids as
α-glucosidase inhibitors, Eur J Med Chem, 63 (2013) 162-169.
29 Ursini F & Sevanian A, Postprandial oxidative stress, Biol
Chem, 383 (3-4) (2002) 599-605.
DEEPTHI et al.: MICRONUTRIENTS AND PHYTOCHEMICALS IN RICE AFFECT IT’S DIGESTION
831
30 Khor A, Grant R, Tung C, et al., Postprandial oxidative stress is
increased after a phytonutrient-poor food but not after a
kilojoule-matched phytonutrient-rich food, Nutr Res, 34 (5)
(2014) 391-400.
31 Sies H, Stahl W & Sevanian A, Nutritional, dietary and
postprandial oxidative stress, J Nutr, 135 (5) (2005) 969-72.
32 Galano A, Free radicals induced oxidative stress at a molecular
level: The current status, challenges and perspectives of
computational Chemistry Based protocols, J Mex Chem Soc, 59
(4) (2015) 231-262.
33 Lobo V, Patil A, Phatak A, et al., Free radicals, antioxidants and
functional foods: Impact on human health, Free radicals,
antioxidants and functional foods: Impact on human health,
Pharmacogn Rev, 4 (8) (2010) 118–126.
34 Awika J M, Rooney L W, Wu X, et al., The chemistry behind
antioxidant capacity assays. J Agric Food Chem, 53 (2005)
1841-1856.
35 Prior RL, Wu X & Schaich K, Standardized methods for the
determination of antioxidant capacity and phenolics in foods and
dietary supplements, J Agric Food Chem, 53 (2005) 4290-302.
36 Malik V S, Vasudevan S, Wedick N M, et al., Substituting
brown rice for white rice on diabetes risk factors in India: A
randomized controlled trial, Br J Nutr, 121 (12) (2019)
138 9–1397. doi.org/10.1017/S000711451900076X
Recommended