Embed Size (px)
Citation preview
Determining the effect of
arsenic on micronutrients
and proteins in rice. Tasila Mwale
Niroshini Nirmalan, Gemma Lace-Costigan & Debapriya Mondal
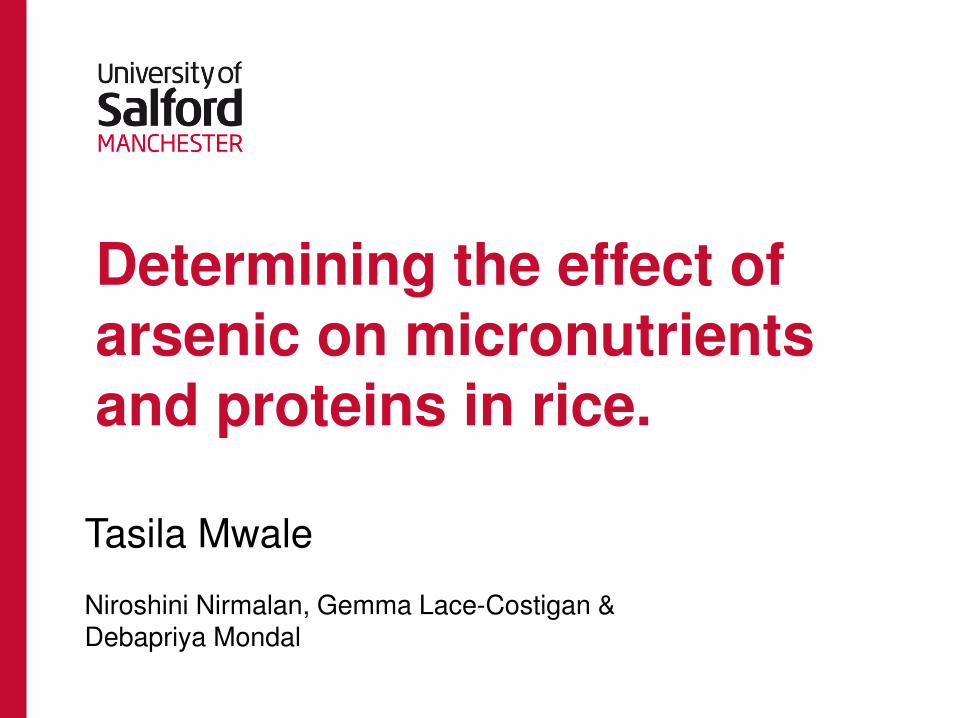
• Arsenic (As)
- Naturally occurring
- Anthropogenic pollution
- Organic and inorganic form
• As toxicity
- Major public health issue
- Cancer and other health disorders
• Exposure
- Water
Background
Polya, D.A., Mondal, D. And Giri, A.K. (2009) Quantification of deaths and DALYs arising from chronic exposure to
arsenic in groundwaters utilized for drinking, cooking and irrigation of food crops in Preedy and Watson (Eds)
Handbook of Disease Burdens and Quality of Life Measures, Springer-Verlag, ISBN: 978-0-387-78665-0, pp. 702-
728.
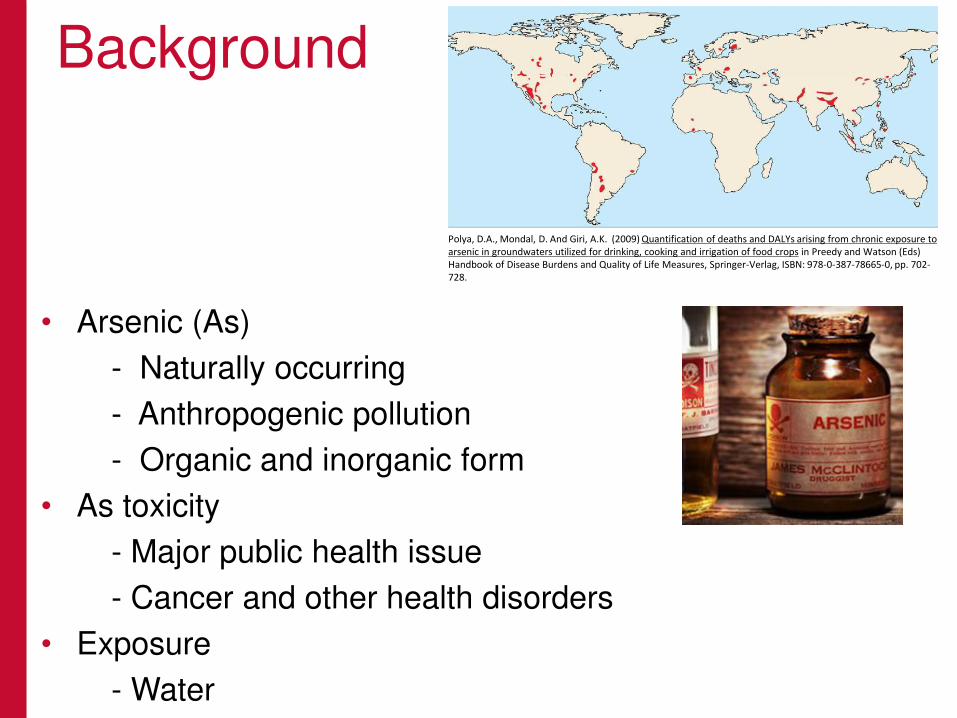
As contamination
Major problem in South East Asia
Bengal basin – WHO “largest mass poisoning in history” Exceed limit of 50ppb in water
Rice cultivated in high As water
Background
http://web.worldbank.org/WBSITE/EXTERNAL/COUNTRIES/SOUTHASIAEXT/0,,contentMDK:22392781~pagePK:146736~piPK: 146830~theSitePK:223547,00.html
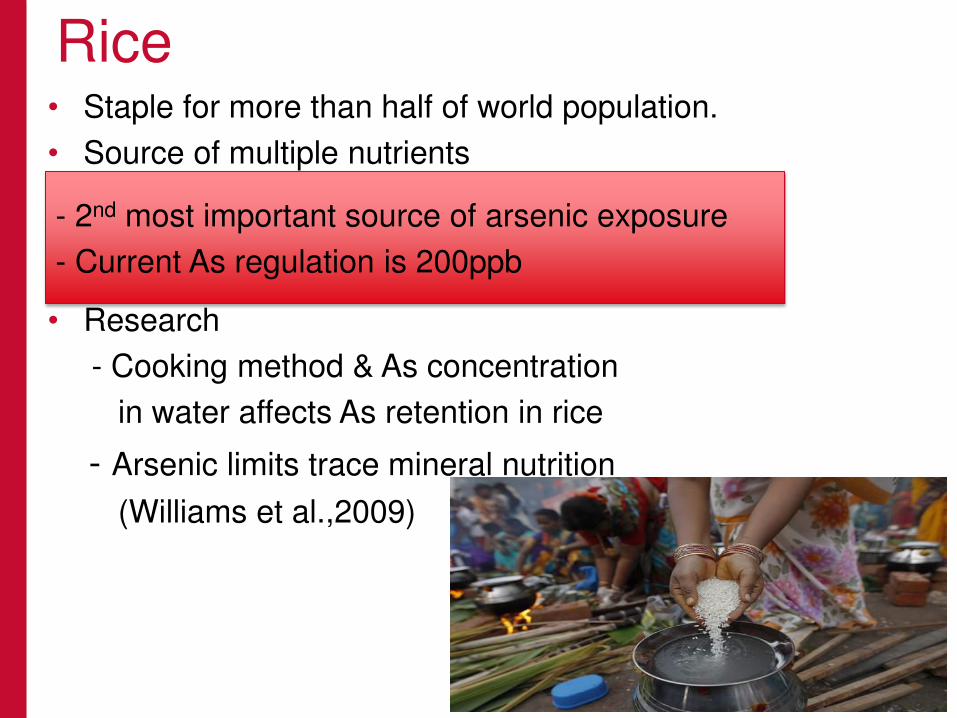
• Staple for more than half of world population.
• Source of multiple nutrients
Rice
• Research
- Cooking method & As concentration
in water affects As retention in rice
- Arsenic limits trace mineral nutrition
(Williams et al.,2009)
- 2nd most important source of arsenic exposure
- Current As regulation is 200ppb
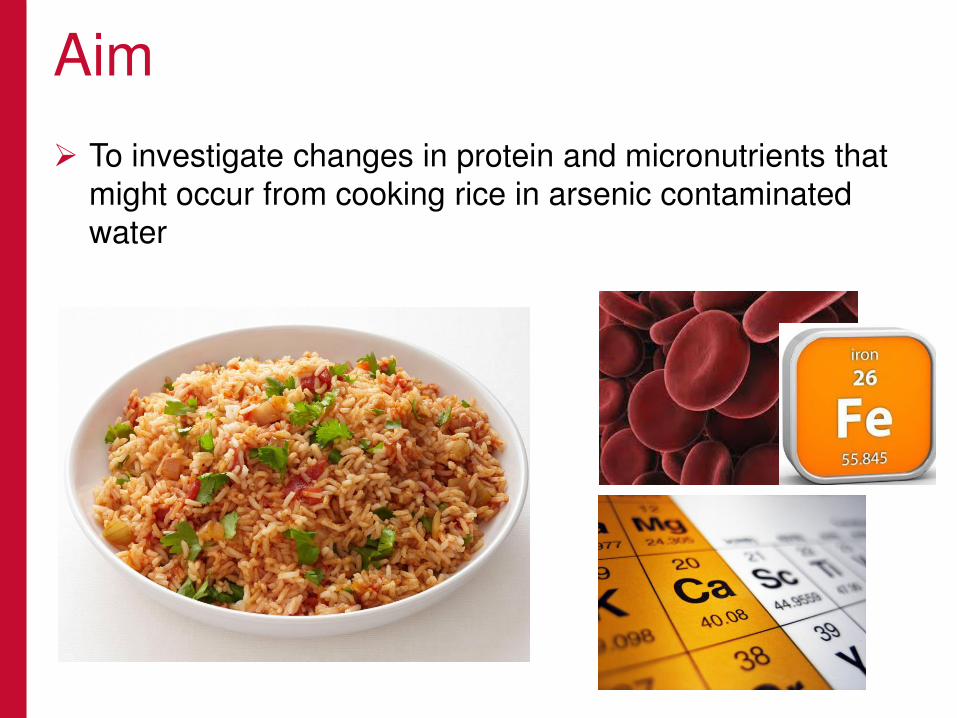
To investigate changes in protein and micronutrients that
might occur from cooking rice in arsenic contaminated
water
Aim
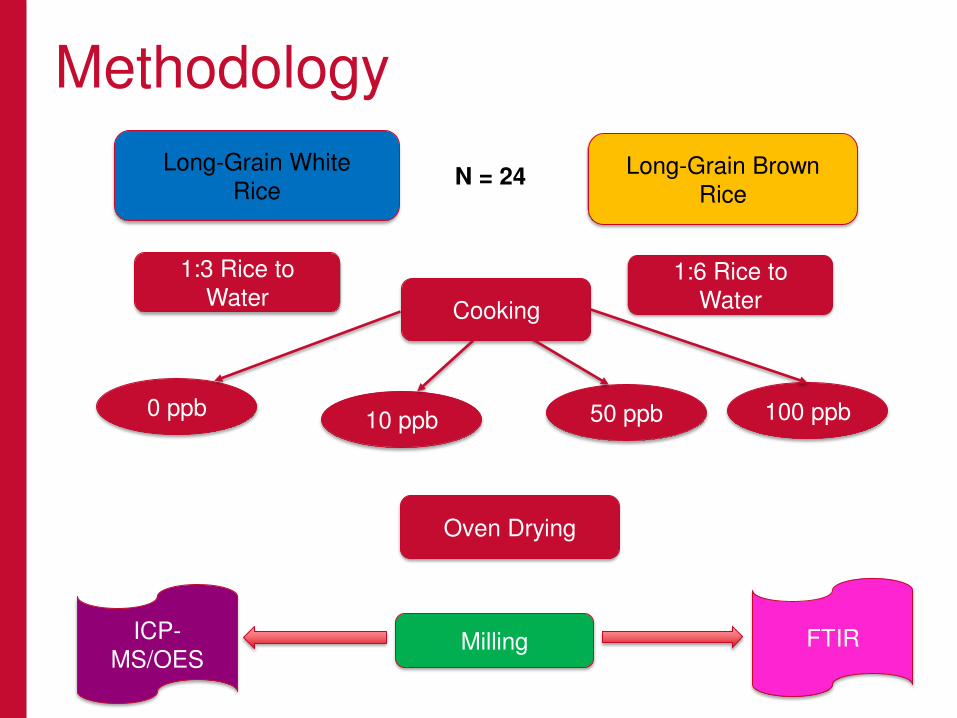
Methodology
Long-Grain Brown
Rice
Long-Grain White
Rice
0 ppb 10 ppb 50 ppb 100 ppb
1:3 Rice to
Water 1:6 Rice to
Water
Oven Drying
Milling FTIR
Cooking
ICP-
MS/OES
N = 24
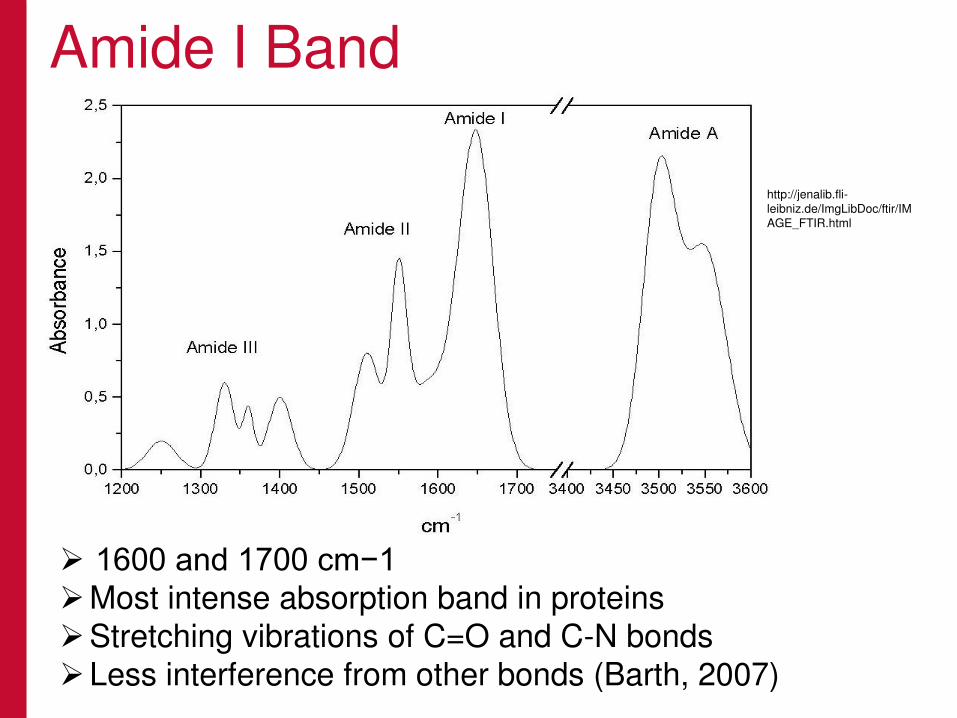
Amide I Band
1600 and 1700 cm−1
Most intense absorption band in proteins
Stretching vibrations of C=O and C-N bonds
Less interference from other bonds (Barth, 2007)
http://jenalib.fli-leibniz.de/ImgLibDoc/ftir/IM
AGE_FTIR.html
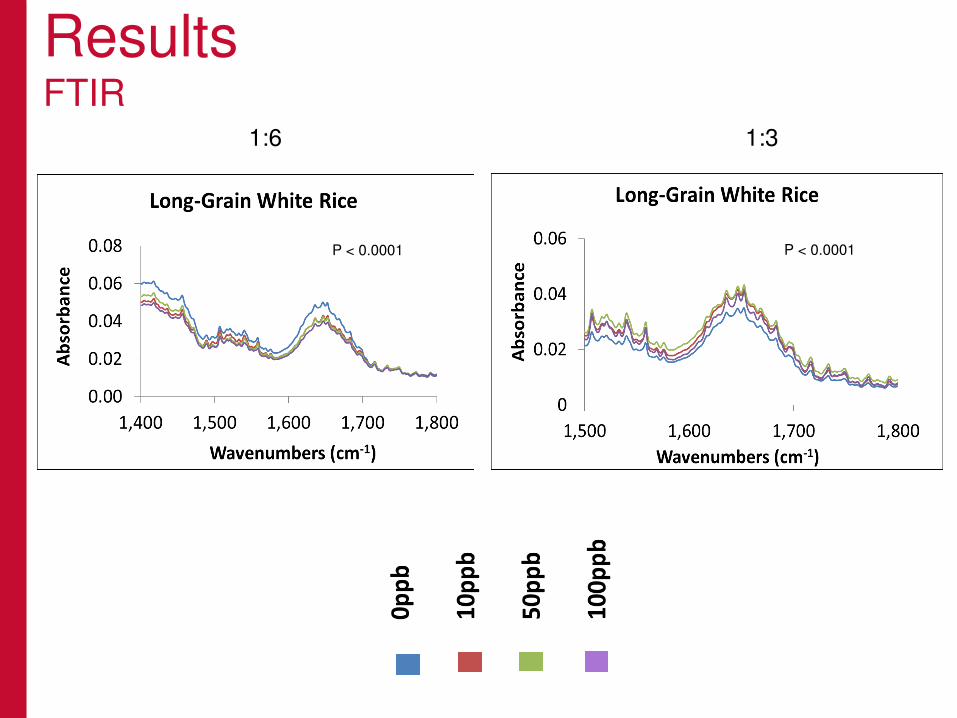
Results FTIR
P < 0.0001
1:6 1:3
P < 0.0001
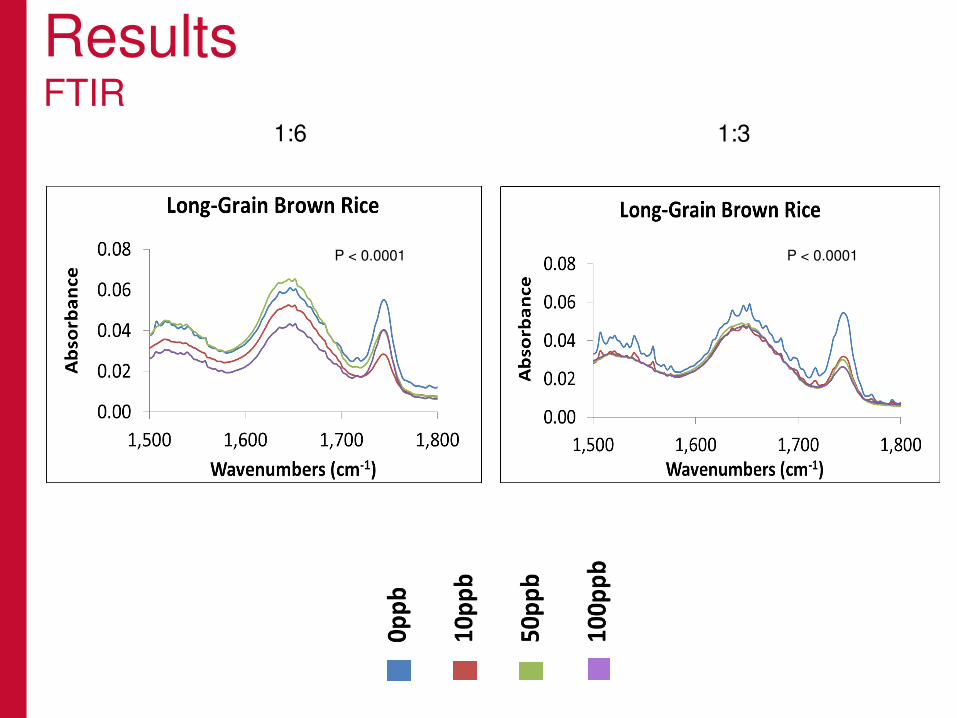
Results FTIR
1:6 1:3
P < 0.0001 P < 0.0001
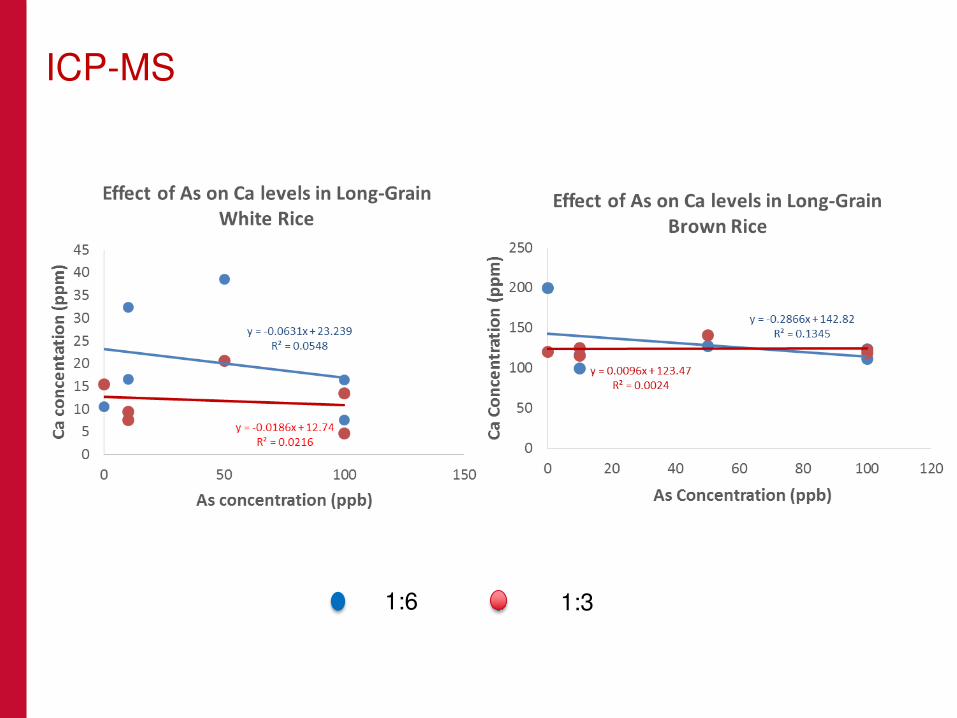
ICP-MS
1:6 1:3
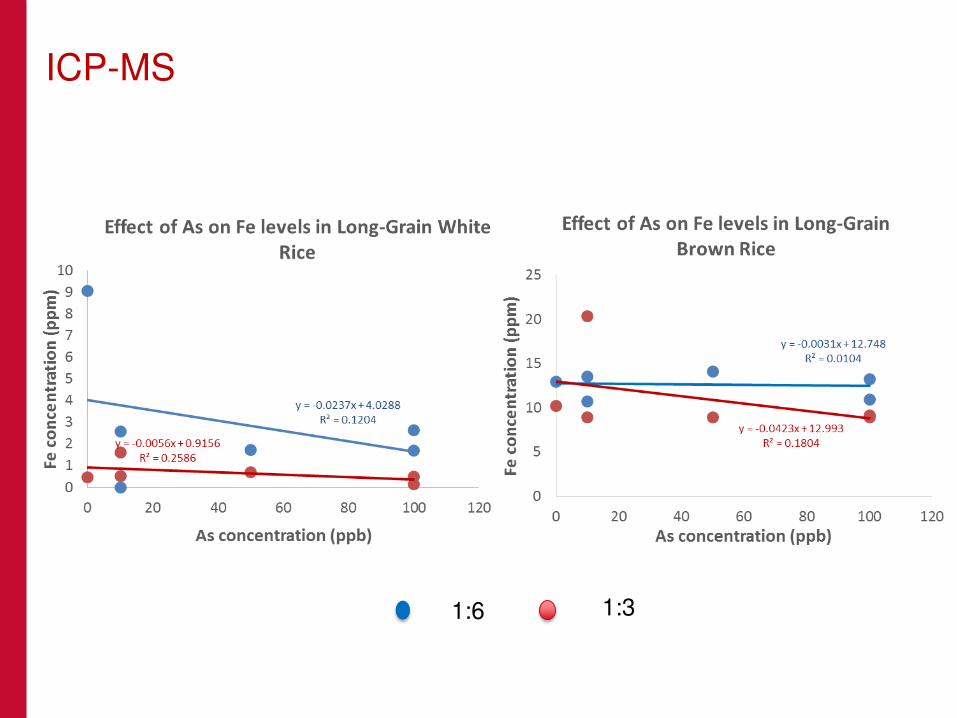
ICP-MS
1:6 1:3
• As had an effect on the amide 1 band in rice,
represented by the difference in absorbance at
different As concentrations.
• Cooking rice in As contaminated water affected
the calcium and iron levels in rice negatively.
• Future studies will explore the effect of arsenic
on protein concentration.
Conclusion

Thank you for making this study possible.
Acknowledgements
Any Questions?