
Profound .
March 2005
P.Middendorp Msc.
:
Project number : Approved by : P.Middendorp Initials : MPP Number of pages : 25 Number of Appendices : 2
All rights reserved. No part of this publication may be reproduced and/or published by print, photoprint, microfilm or any other means without the previous written consent of Profound. In case this report was drafted on instructions, the rights and obligations of contracting parties are subject to either the Standard Conditions of Profound, or the relevant agreement concluded between the contracting parties. Submitting the report for inspection to parties who have a directinterest is permitted.
Profound BV Limaweg 17 2743 CB Waddinxveen Phone +31 182 640 964 Fax + 31 182 649 664 E-mail [email protected] www.profound.nl
Method Statement Sonic Integrity Testing (Pile Integrity Testing)

Method statement Sonic Integrity Testing.doc Page 2 of 25 18-03-2005
Contents 1 Principles of Sonic Integrity Testing 3 2 Discontinuities in the pile shaft. 6 3 Signal processing 7 4 The Characteristic Signal 9 5 Interpretation Guidelines 13 6 Interpretation 14 7 Pile preparation 18 8 Placing the Sensor 19 9 Reliable Testing 20 10 References 21 11 Appendix, Influence of hammer blow width 22 12 Appendix, Influence of soil 24
Method statement Sonic Integrity Testing.doc Page 3 of 25 18-03-2005
1 Principles of Sonic Integrity Testing
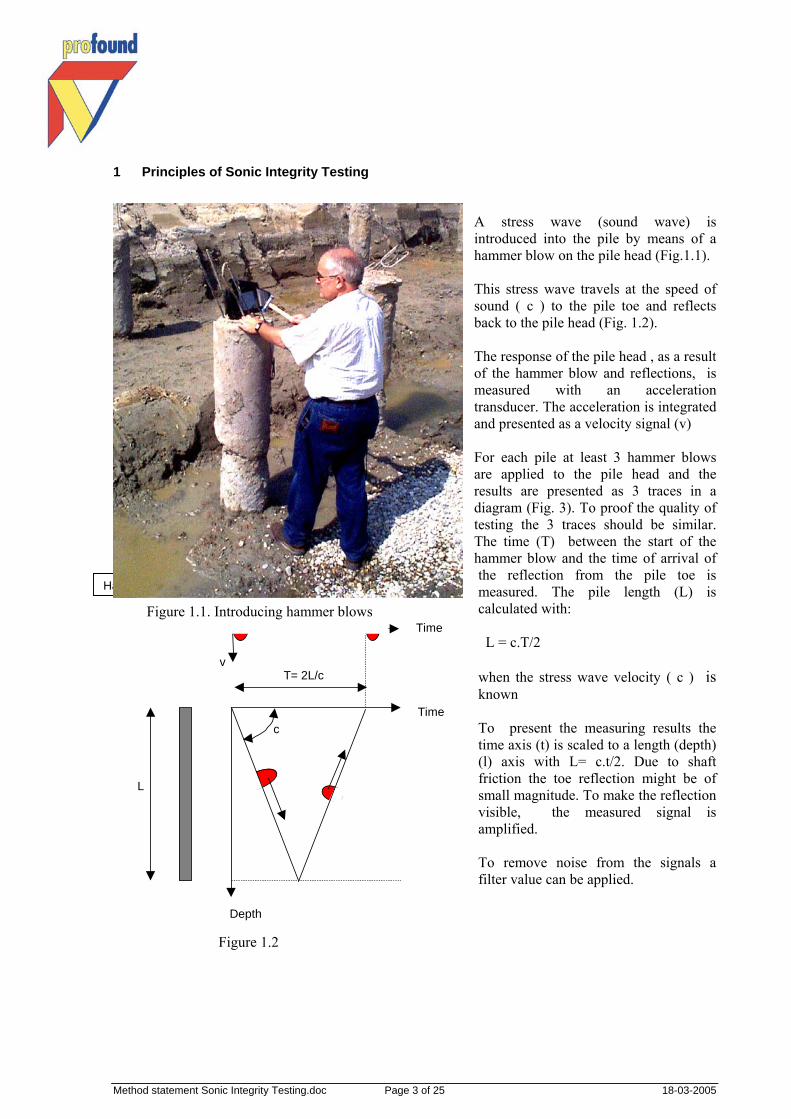
A stress wave (sound wave) is introduced into the pile by means of a hammer blow on the pile head (Fig.1.1). This stress wave travels at the speed of sound ( c ) to the pile toe and reflects back to the pile head (Fig. 1.2). The response of the pile head , as a result of the hammer blow and reflections, is measured with an acceleration transducer. The acceleration is integrated and presented as a velocity signal (v) For each pile at least 3 hammer blows are applied to the pile head and the results are presented as 3 traces in a diagram (Fig. 3). To proof the quality of testing the 3 traces should be similar. The time (T) between the start of the hammer blow and the time of arrival of the reflection from the pile toe is measured. The pile length (L) is calculated with: L = c.T/2 when the stress wave velocity ( c ) is known To present the measuring results the time axis (t) is scaled to a length (depth) (l) axis with L= c.t/2. Due to shaft friction the toe reflection might be of small magnitude. To make the reflection visible, the measured signal is amplified. To remove noise from the signals a filter value can be applied.
L
Depth
Time
T= 2L/c
c
v
Time
Pile toe reflection reflectio
Hammer blow
Figure 1.2
Figure 1.1. Introducing hammer blows
Method statement Sonic Integrity Testing.doc Page 4 of 25 18-03-2005
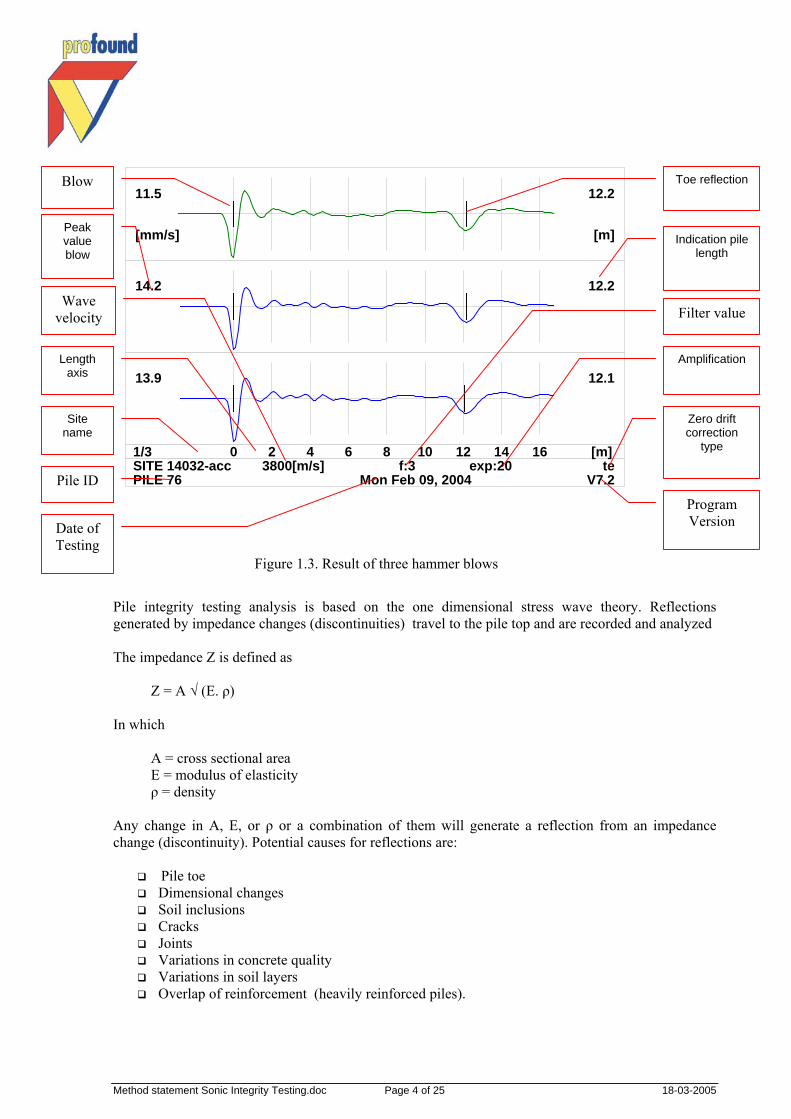
Pile integrity testing analysis is based on the one dimensional stress wave theory. Reflections generated by impedance changes (discontinuities) travel to the pile top and are recorded and analyzed The impedance Z is defined as Z = A √ (E. ρ) In which
A = cross sectional area E = modulus of elasticity ρ = density
Any change in A, E, or ρ or a combination of them will generate a reflection from an impedance change (discontinuity). Potential causes for reflections are:
Pile toe Dimensional changes Soil inclusions Cracks Joints Variations in concrete quality Variations in soil layers Overlap of reinforcement (heavily reinforced piles).
11.5
[mm/s]
12.2
[m]
14.2 12.2
13.9 12.1
0 2 4 6 8 10 12 14 16 [m]1/3SITE 14032-accPILE 76
teV7.2
3800[m/s] f:3 Mon Feb 09, 2004
exp:20
Figure 1.3. Result of three hammer blows
Blow Toe reflection
Wave velocity
Length axis
Indication pile length
Peak value blow
Amplification
Filter value
Zero drift correction
type
Site name
Pile ID Program Version Date of
Testing

Method statement Sonic Integrity Testing.doc Page 5 of 25 18-03-2005
Limitations of sonic integrity testing are:
Minor impedance changes are not detected Gradually increasing and decreasing pile diameters can not be detected Curved pile shapes can not be detected Small soil inclusions are not detected Local loss of reinforcement cover can not be detected Thickness of debris layer at pile toe can not be detected
Method statement Sonic Integrity Testing.doc Page 6 of 25 18-03-2005
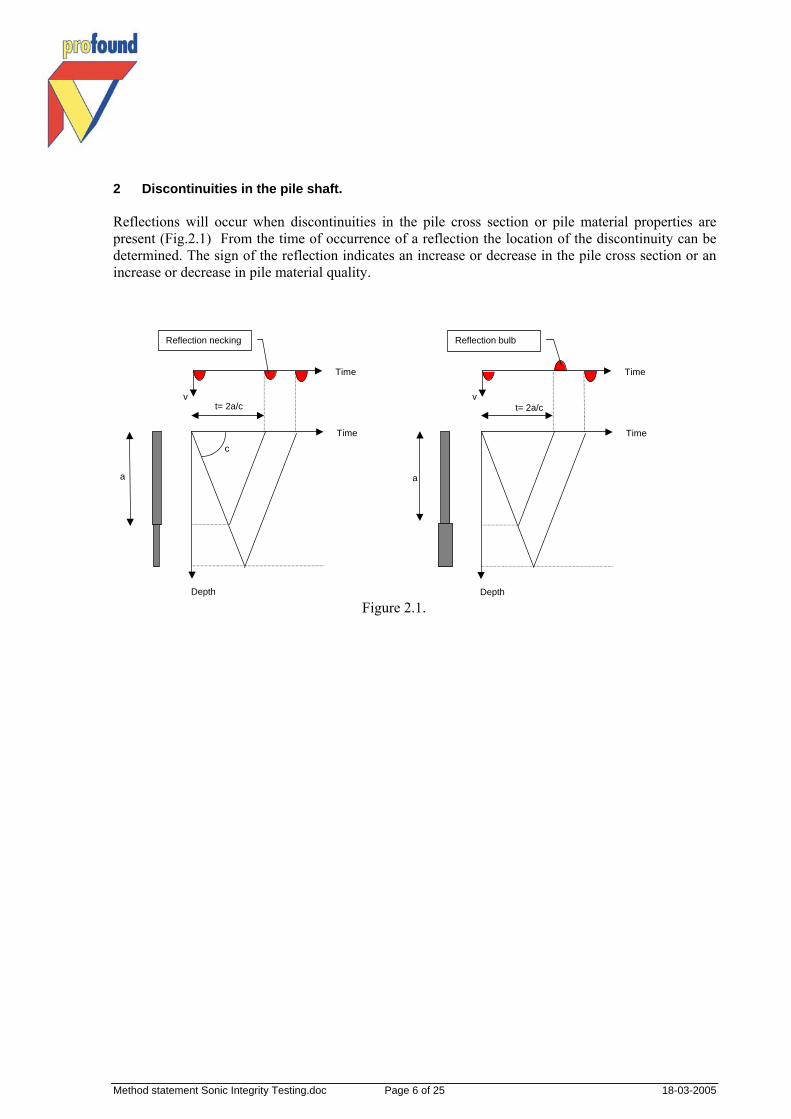
2 Discontinuities in the pile shaft. Reflections will occur when discontinuities in the pile cross section or pile material properties are present (Fig.2.1) From the time of occurrence of a reflection the location of the discontinuity can be determined. The sign of the reflection indicates an increase or decrease in the pile cross section or an increase or decrease in pile material quality.
a
Depth
Time t= 2a/c
v
Time
Reflection bulb
a
Depth
Time
t= 2a/c
c
v Time
Reflection necking
Figure 2.1.
Method statement Sonic Integrity Testing.doc Page 7 of 25 18-03-2005
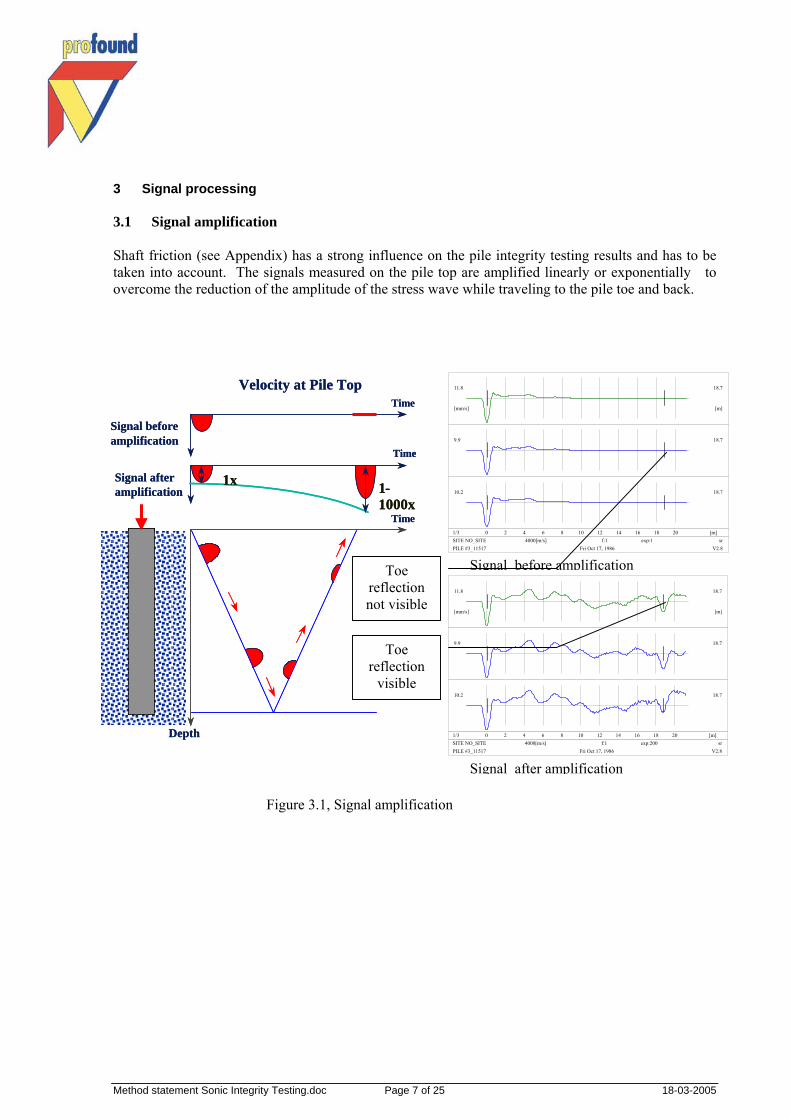
3 Signal processing 3.1 Signal amplification Shaft friction (see Appendix) has a strong influence on the pile integrity testing results and has to be taken into account. The signals measured on the pile top are amplified linearly or exponentially to overcome the reduction of the amplitude of the stress wave while traveling to the pile toe and back.
Depth
Time
TimeVelocity at Pile Top
Signal before amplification
Signal after amplification
1x 1-1000x
Time
Depth
Time
TimeVelocity at Pile Top
Signal before amplification
Signal after amplification
1x 1-1000x
Time
11.8
[mm/s]
18.7
[m]
9.9 18.7
10.2 18.7
0 2 4 6 8 10 12 14 16 18 20 [m]1/3SITE NO_SITEPILE #3_11517
srV2.8
4000[m/s] f:1 Fri Oct 17, 1986
exp:1
Signal before amplification 11.8
[mm/s]
18.7
[m]
9.9 18.7
10.2 18.7
0 2 4 6 8 10 12 14 16 18 20 [m]1/3SITE NO_SITEPILE #3_11517
srV2.8
4000[m/s] f:1 Fri Oct 17, 1986
exp:200
Signal after amplification
Toe reflection
visible
Figure 3.1, Signal amplification
Toe reflection not visible
Method statement Sonic Integrity Testing.doc Page 8 of 25 18-03-2005
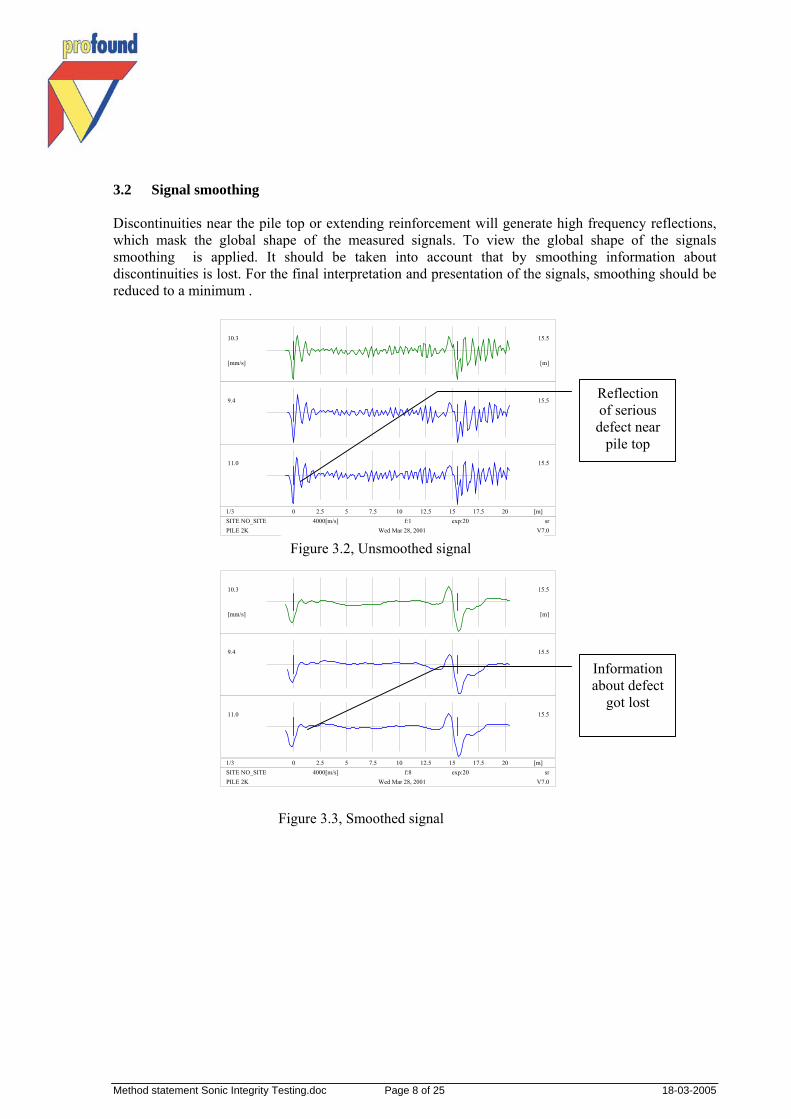
3.2 Signal smoothing Discontinuities near the pile top or extending reinforcement will generate high frequency reflections, which mask the global shape of the measured signals. To view the global shape of the signals smoothing is applied. It should be taken into account that by smoothing information about discontinuities is lost. For the final interpretation and presentation of the signals, smoothing should be reduced to a minimum . 10.3
[mm/s]
15.5
[m]
9.4 15.5
11.0 15.5
0 2.5 5 7.5 10 12.5 15 17.5 20 [m]1/3SITE NO_SITEPILE 2K
srV7.0
4000[m/s] f:1 Wed Mar 28, 2001
exp:20
Figure 3.2, Unsmoothed signal
Reflection of serious defect near
pile top
10.3
[mm/s]
15.5
[m]
9.4 15.5
11.0 15.5
0 2.5 5 7.5 10 12.5 15 17.5 20 [m]1/3SITE NO_SITEPILE 2K
srV7.0
4000[m/s] f:8 Wed Mar 28, 2001
exp:20
Figure 3.3, Smoothed signal
Information about defect
got lost

Method statement Sonic Integrity Testing.doc Page 9 of 25 18-03-2005
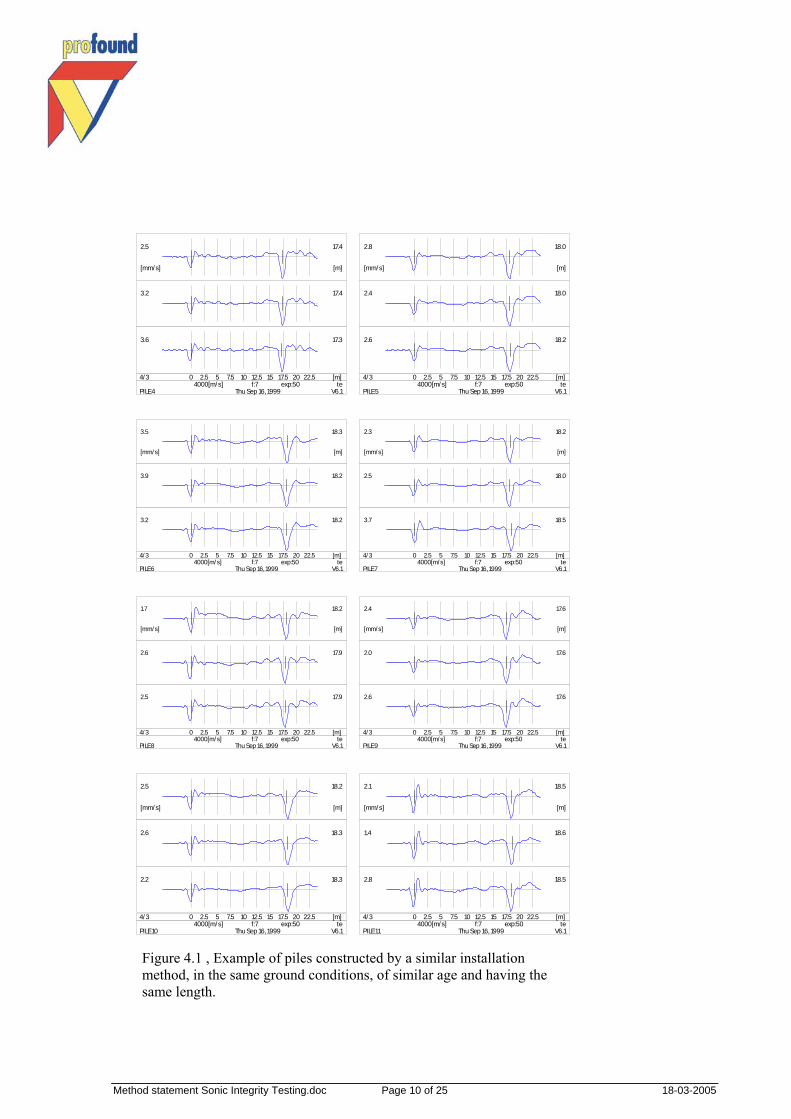
4 The Characteristic Signal To differentiate between a change in soil resistance and a pile discontinuity, the SIT signal from a test pile is compared to a "characteristic signal" deemed to be representative of similar piles in similar soil conditions on site. (The characteristic signal can either be an average of a number of piles on site or the SIT signal of a reference pile chosen prior to testing.) If the test signal is different than the characteristic signal, then any impedance changes are due to the changing pile impedance and not characteristic of the site. Changes not found in the characteristic signal require further analysis to determine the cause.
Method statement Sonic Integrity Testing.doc Page 10 of 25 18-03-2005
Figure 4.1 , Example of piles constructed by a similar installation method, in the same ground conditions, of similar age and having the same length.
2.5
[mm/s]
17.4
[m]
3.2 17.4
3.6 17.3
0 2.5 5 7.5 10 12.5 15 17.5 20 22.5 [m]4/3
PILE 4te
V6.14000[m/s] f:7
Thu Sep 16, 1999exp:50
2.8
[mm/s]
18.0
[m]
2.4 18.0
2.6 18.2
0 2.5 5 7.5 10 12.5 15 17.5 20 22.5 [m]4/3
PILE 5te
V6.14000[m/s] f:7
Thu Sep 16, 1999exp:50
3.5
[mm/s]
18.3
[m]
3.9 18.2
3.2 18.2
0 2.5 5 7.5 10 12.5 15 17.5 20 22.5 [m]4/3
PILE 6te
V6.14000[m/s] f:7
Thu Sep 16, 1999exp:50
2.3
[mm/s]
18.2
[m]
2.5 18.0
3.7 18.5
0 2.5 5 7.5 10 12.5 15 17.5 20 22.5 [m]4/3
PILE 7te
V6.14000[m/s] f:7
Thu Sep 16, 1999exp:50
1.7
[mm/s]
18.2
[m]
2.6 17.9
2.5 17.9
0 2.5 5 7.5 10 12.5 15 17.5 20 22.5 [m]4/3
PILE 8te
V6.14000[m/s] f:7
Thu Sep 16, 1999exp:50
2.4
[mm/s]
17.6
[m]
2.0 17.6
2.6 17.6
0 2.5 5 7.5 10 12.5 15 17.5 20 22.5 [m]4/3
PILE 9te
V6.14000[m/s] f:7
Thu Sep 16, 1999exp:50
2.5
[mm/s]
18.2
[m]
2.6 18.3
2.2 18.3
0 2.5 5 7.5 10 12.5 15 17.5 20 22.5 [m]4/3
PILE 10te
V6.14000[m/s] f:7
Thu Sep 16, 1999exp:50
2.1
[mm/s]
18.5
[m]
1.4 18.6
2.8 18.5
0 2.5 5 7.5 10 12.5 15 17.5 20 22.5 [m]4/3
PILE 11te
V6.14000[m/s] f:7
Thu Sep 16, 1999exp:50
Method statement Sonic Integrity Testing.doc Page 11 of 25 18-03-2005
2.5
[mm/s]
17.9
[m]
2.3 18.0
2.5 17.9
0 2.5 5 7.5 10 12.5 15 17.5 20 22.5 [m]4/3
PILE 31te
V6.14000[m/s] f:7
Thu Sep 16, 1999exp:20
1.6
[mm/s]
18.2
[m]
1.5 18.2
2.2 18.2
0 2.5 5 7.5 10 12.5 15 17.5 20 22.5 [m]4/3
PILE 32te
V6.14000[m/s] f:7
Thu Sep 16, 1999exp:20
1.3
[mm/s]
18.2
[m]
0.8 18.5
1.3 18.3
0 2.5 5 7.5 10 12.5 15 17.5 20 22.5 [m]4/3
PILE 33te
V6.14000[m/s] f:7
Thu Sep 16, 1999exp:20
2.2
[mm/s]
17.7
[m]
2.0 17.7
2.1 17.7
0 2.5 5 7.5 10 12.5 15 17.5 20 22.5 [m]4/3
PILE 34te
V6.14000[m/s] f:7
Thu Sep 16, 1999exp:20
1.6
[mm/s]
18.3
[m]
1.6 18.3
1.5 18.3
0 2.5 5 7.5 10 12.5 15 17.5 20 22.5 [m]4/3
PILE 35te
V6.14000[m/s] f:7
Thu Sep 16, 1999exp:20
1.9
[mm/s]
18.5
[m]
1.9 18.5
1.5 18.5
0 2.5 5 7.5 10 12.5 15 17.5 20 22.5 [m]4/3
PILE 37te
V6.14000[m/s] f:7
Thu Sep 16, 1999exp:20
1.4
[mm/s]
17.7
[m]
1.4 17.6
1.3 17.9
0 2.5 5 7.5 10 12.5 15 17.5 20 22.5 [m]4/3
PILE 38te
V6.14000[m/s] f:7
Thu Sep 16, 1999exp:20
1.7
[mm/s]
17.7
[m]
1.0 17.6
1.1 17.6
0 2.5 5 7.5 10 12.5 15 17.5 20 22.5 [m]4/3
PILE 39te
V6.14000[m/s] f:7
Thu Sep 16, 1999exp:20
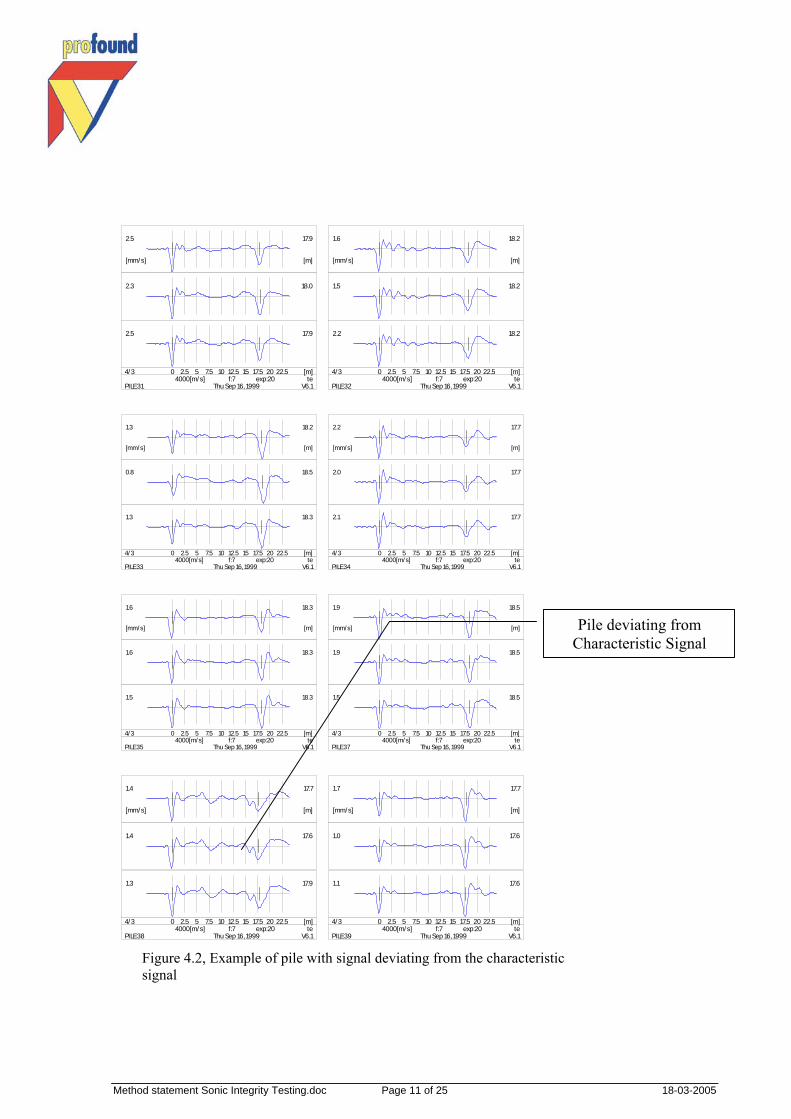
Pile deviating from Characteristic Signal
Figure 4.2, Example of pile with signal deviating from the characteristic signal
Method statement Sonic Integrity Testing.doc Page 12 of 25 18-03-2005
3.8
[mm/s]
17.9
[m]
0 2.5 5 7.5 10 12.5 15 17.5 20 22.5 [m]1/3SITE SITDEMOWINPILE 29
teV6.1
4000[m/s] f:7 Thu Sep 16, 1999
exp:20
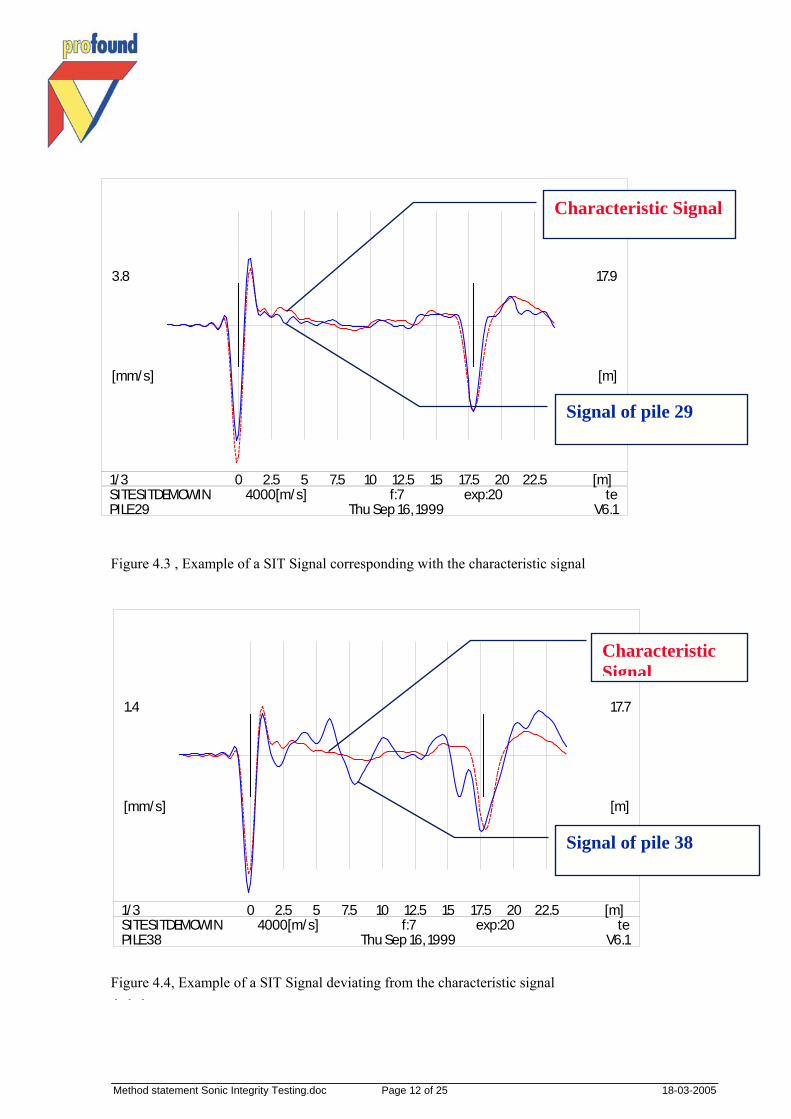
Characteristic Signal
Signal of pile 29
Figure 4.3 , Example of a SIT Signal corresponding with the characteristic signal
1.4
[mm/s]
17.7
[m]
0 2.5 5 7.5 10 12.5 15 17.5 20 22.5 [m]1/3SITE SITDEMOWINPILE 38
teV6.1
4000[m/s] f:7 Thu Sep 16, 1999
exp:20
Characteristic Signal
Signal of pile 38
Figure 4.4, Example of a SIT Signal deviating from the characteristic signal1 1 1

Method statement Sonic Integrity Testing.doc Page 13 of 25 18-03-2005
5 Interpretation Guidelines • Test at least 20 % of the piles on site, with a minimum of 10 at several locations on a site. • Never be satisfied testing only piles which appear suspect. • Determine the characteristic signal for piles of the same type on a site. The characteristic signal
from the site or group average should be compatible with that for other piles of the same type, and should generally correspond with the majority of piles tested on a particular site. The characteristic signal can be established intuitively or made by averaging a number of pile results together, excluding any piles which deviate from the norm.
• Compare the characteristic signal with the available soil data. • Try to understand the causes of deviations—most often a change in pile cross section caused by
soft layers, fill materials, voids in ground, old foundation bases, entry into hard layers, casing lengths, or deliberate pile base enlargements. Note: If a pile enters a rock material, damping will be very high because of greatly increased shaft friction and this will show as an apparent increase in cross section and there will be no reaction from the pile toe.
• If possible, try to determine the pile length from the characteristic signal. • Carry out individual pile interpretation using all individual signals. • Flag as "suspect" signals with important deviations from normal. • Determine the level and type of deviation from normal and physically examine the pile.
Note: Be aware that three dimensional effects will influence the signals for pile diameters larger than 0.4m.
Method statement Sonic Integrity Testing.doc Page 14 of 25 18-03-2005
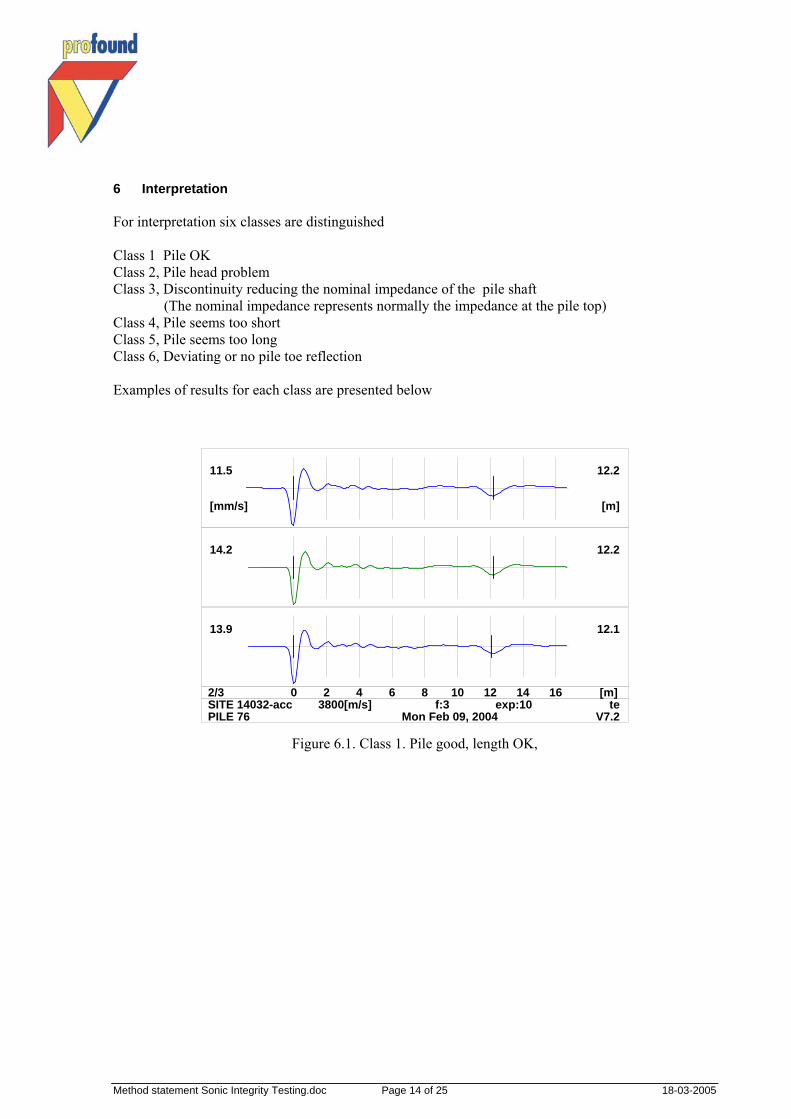
6 Interpretation For interpretation six classes are distinguished Class 1 Pile OK Class 2, Pile head problem Class 3, Discontinuity reducing the nominal impedance of the pile shaft (The nominal impedance represents normally the impedance at the pile top) Class 4, Pile seems too short Class 5, Pile seems too long Class 6, Deviating or no pile toe reflection Examples of results for each class are presented below
11.5
[mm/s]
12.2
[m]
14.2 12.2
13.9 12.1
0 2 4 6 8 10 12 14 16 [m]2/3SITE 14032-accPILE 76
teV7.2
3800[m/s] f:3 Mon Feb 09, 2004
exp:10
Figure 6.1. Class 1. Pile good, length OK,
Method statement Sonic Integrity Testing.doc Page 15 of 25 18-03-2005
12.2
[mm/s]
12.6
[m]
13.6 12.6
13.1 12.6
0 2 4 6 8 10 12 14 16 [m]2/3SITE 14032-accPILE 36
teV7.2
3800[m/s] f:3 Mon Feb 09, 2004
exp:20
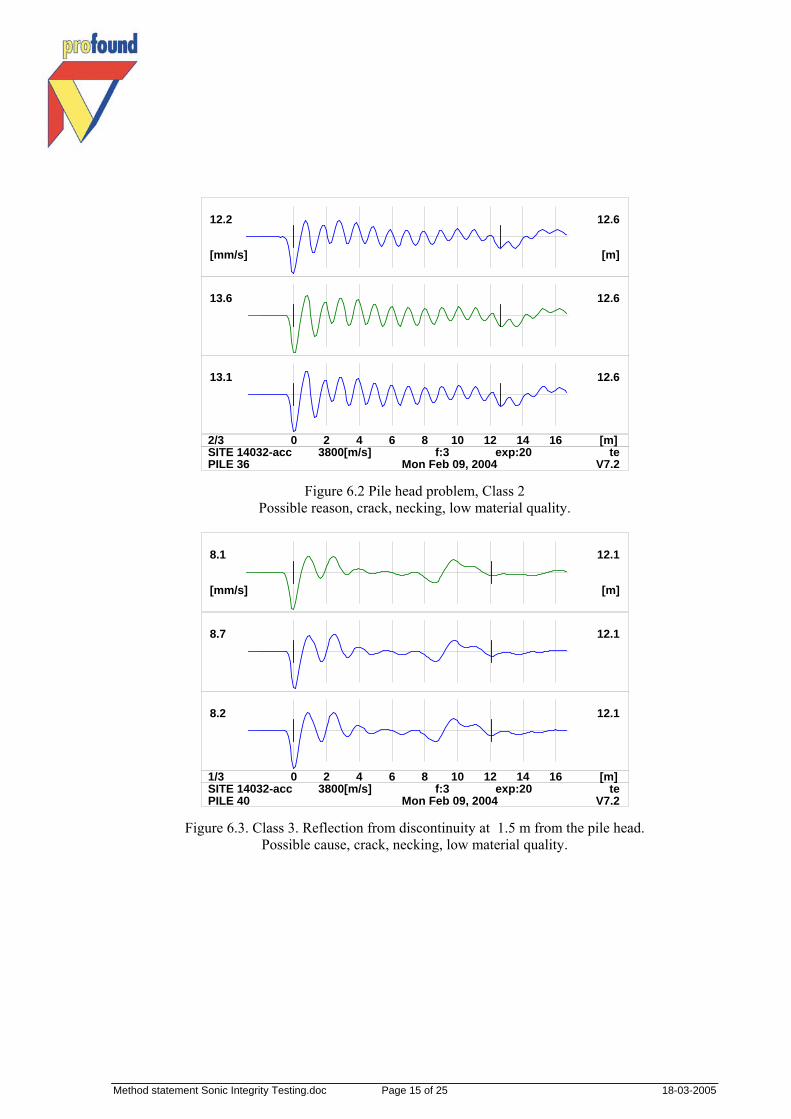
Figure 6.2 Pile head problem, Class 2
Possible reason, crack, necking, low material quality.
8.1
[mm/s]
12.1
[m]
8.7 12.1
8.2 12.1
0 2 4 6 8 10 12 14 16 [m]1/3SITE 14032-accPILE 40
teV7.2
3800[m/s] f:3 Mon Feb 09, 2004
exp:20
Figure 6.3. Class 3. Reflection from discontinuity at 1.5 m from the pile head.
Possible cause, crack, necking, low material quality.
Method statement Sonic Integrity Testing.doc Page 16 of 25 18-03-2005
10.0
[mm/s]
9.9
[m]
9.4 9.9
8.9 9.9
0 2 4 6 8 10 12 14 16 [m]2/3SITE 14032-accPILE 19
teV7.2
3800[m/s] f:3 Mon Feb 09, 2004
exp:20
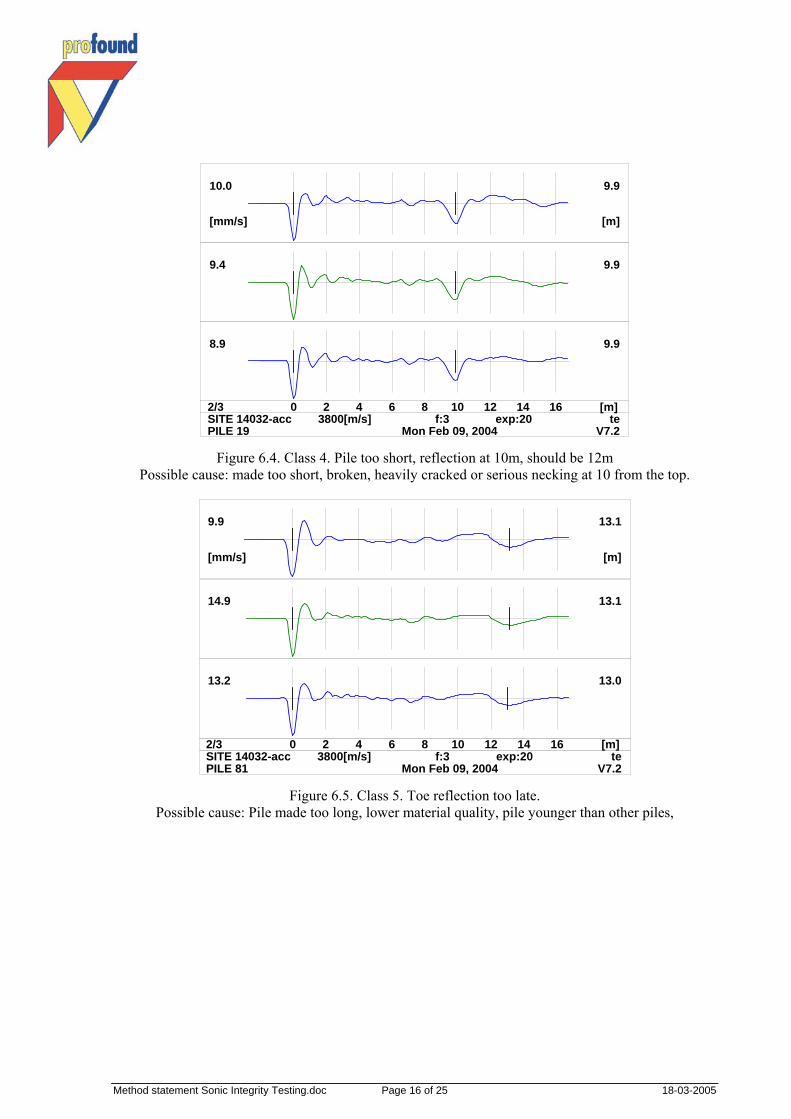
Figure 6.4. Class 4. Pile too short, reflection at 10m, should be 12m
Possible cause: made too short, broken, heavily cracked or serious necking at 10 from the top.
9.9
[mm/s]
13.1
[m]
14.9 13.1
13.2 13.0
0 2 4 6 8 10 12 14 16 [m]2/3SITE 14032-accPILE 81
teV7.2
3800[m/s] f:3 Mon Feb 09, 2004
exp:20
Figure 6.5. Class 5. Toe reflection too late.
Possible cause: Pile made too long, lower material quality, pile younger than other piles,
Method statement Sonic Integrity Testing.doc Page 17 of 25 18-03-2005
7.0
[mm/s]
12.2
[m]
12.4 12.2
12.3 12.2
0 2 4 6 8 10 12 14 16 [m]2/3SITE 14032-accPILE 93
teV7.2
3800[m/s] f:3 Mon Feb 09, 2004
exp:20
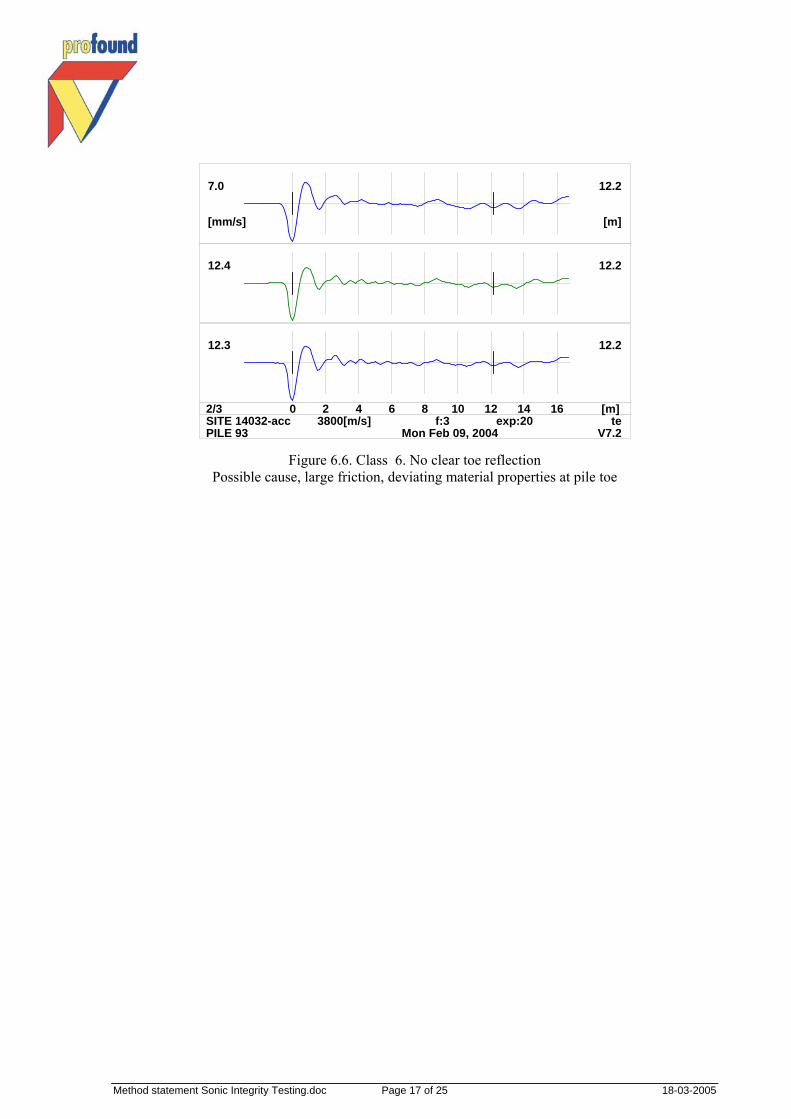
Figure 6.6. Class 6. No clear toe reflection
Possible cause, large friction, deviating material properties at pile toe
Method statement Sonic Integrity Testing.doc Page 18 of 25 18-03-2005
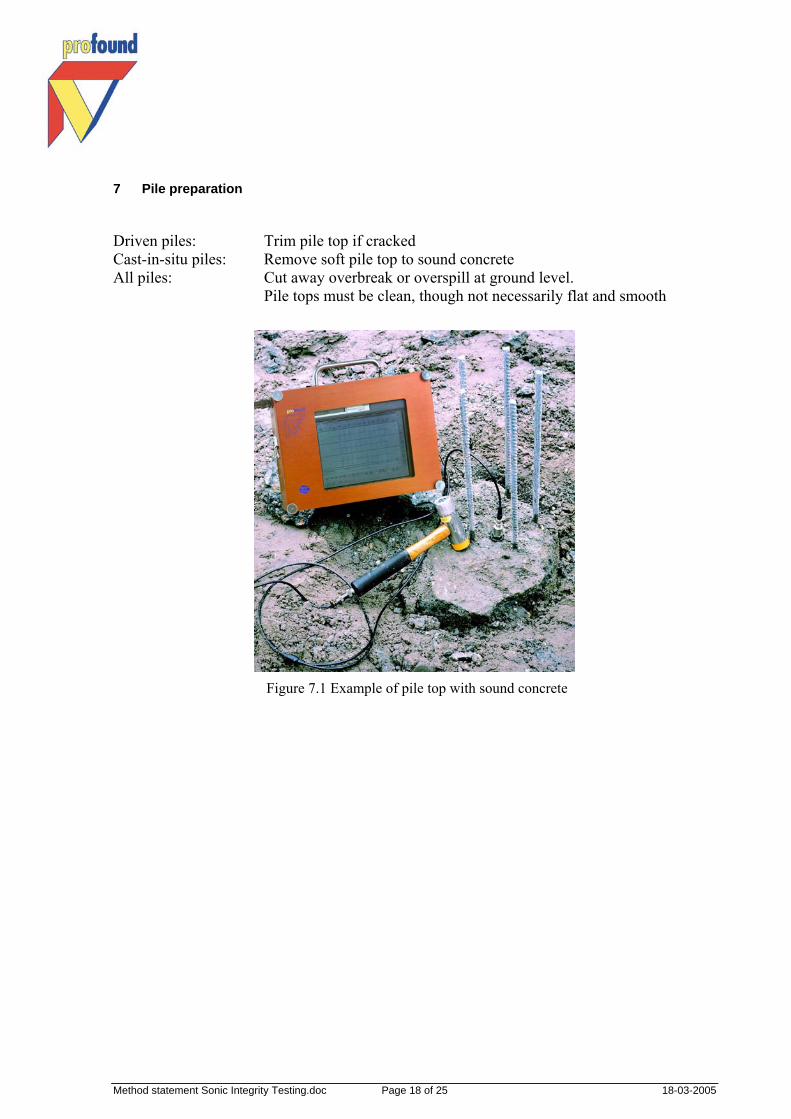
7 Pile preparation Driven piles: Trim pile top if cracked Cast-in-situ piles: Remove soft pile top to sound concrete All piles: Cut away overbreak or overspill at ground level. Pile tops must be clean, though not necessarily flat and smooth
Figure 7.1 Example of pile top with sound concrete
Method statement Sonic Integrity Testing.doc Page 19 of 25 18-03-2005
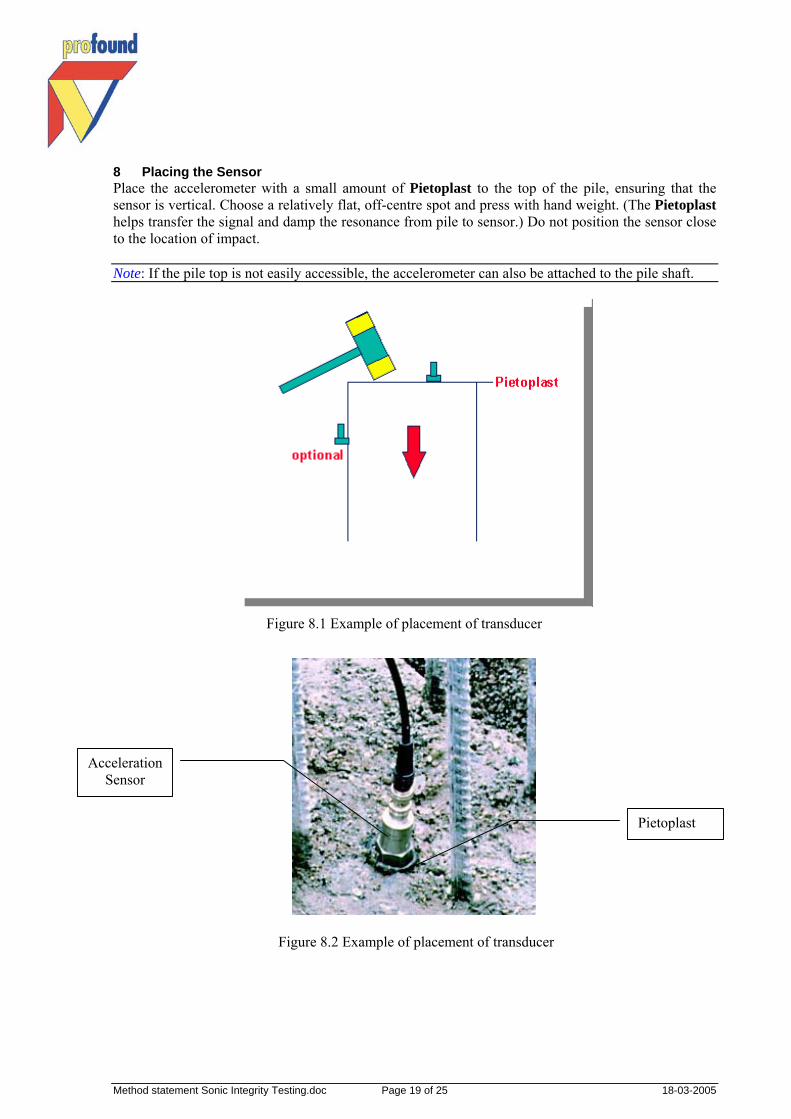
8 Placing the Sensor Place the accelerometer with a small amount of Pietoplast to the top of the pile, ensuring that the sensor is vertical. Choose a relatively flat, off-centre spot and press with hand weight. (The Pietoplast helps transfer the signal and damp the resonance from pile to sensor.) Do not position the sensor close to the location of impact. Note: If the pile top is not easily accessible, the accelerometer can also be attached to the pile shaft.
Figure 8.1 Example of placement of transducer
Pietoplast
Acceleration Sensor
Figure 8.2 Example of placement of transducer

Method statement Sonic Integrity Testing.doc Page 20 of 25 18-03-2005
9 Reliable Testing The requirements for reliable testing include:
test at least 20 % of piles on site, with a minimum of 10 for the highest confidence, test all piles use proper hammer with a blow length of 1 m or less (see Appendix). record at leas 3 similar signals per pile process all signals in a similar way, with minimal filtering and optimal amplification determine characteristic signal check characteristic signal with soil investigation data (see Appendix) check signals that deviate from the characteristic signal perform qualitative interpretation use all available information Follow the guidelines
If necessary, perform quantitative interpretation with integrity testing signal matching using TNOWAVE (SITWAVE). If there are still doubts, excavate the pile, do coring, or conduct a load test (DLT, STN, SLT) or reject the pile.

Method statement Sonic Integrity Testing.doc Page 21 of 25 18-03-2005
10 References
1. Ulrich, G., Stocker, M., (1983), Integritätsuntersuchung an präparierten Betonpfähle, (Integrity Testing Research on Prepared Concrete Piles), Symposium Messtechnik im Erd- und Grundbau, Germany
2. Reiding, F.J., Middendorp, P., P.J. van Brederode, 1984, A digital approach to sonic pile
testing. 2nd International Conference on Stress Waves, The Hague, Netherlands, Balkema
3. Fleming, K, Reidng, F.J., Middendorp, P, 1985, Faults in cast in place piles and their detection. Proceedings of the Second International Conference on Structural Faults and Repair, The Institution of Civil Engineers, Westminster London.
4. Middendorp, P., Reiding, F.J., 1988, Determination of Discontinuities in Piles by TNO Integrity
and Signal Matching Techniques, 3rd International Conference on The Application of Stress Wave Theory on Piles, Ottawa, Canada
5. Starke, W.F., Janes, M.C., 1988, Accuracy and Reliability of Low Strain Testing, 3rd
International Conference on The Application of Stress Wave Theory on Piles, Ottawa, Canada
6. England, M., 1991, A guide to Low-Strain Integrity Testing , Report Cementation Piling and
Foundations Ltd, Field Data Acquisition Department, United Kingdom.
7. ASTM D5882-96 (1996) Standard Test Method for Low Strain Integrity Testing of pile, American Society for Testing and Materials
8. Turner M.J., (1997) Integrity Testing In Piling Practice, CIRIA Report 144 9. German Society for Geotechniques (DGGT) (1998), Recommendations for Static and Dynamic
Pile Tests ,
10. Chow, Y.K., Phoon, K.K., Chow, W.F., (2004) Three-Dimensional Stress Wave Analysis of Pile Integrity Tests, 7th International Conference on The Application of Stress Wave Theory on Piles, Kuala Lumpur, Malaysia
11. Seidel, J.P., Tan, S.K.,(2004), Elimination of the Rayleigh Wave Effect on Low Strain
Integrity Test Results. 7th International Conference on The Application of Stress Wave Theory on Piles, Kuala Lumpur, Malaysia
Method statement Sonic Integrity Testing.doc Page 22 of 25 18-03-2005
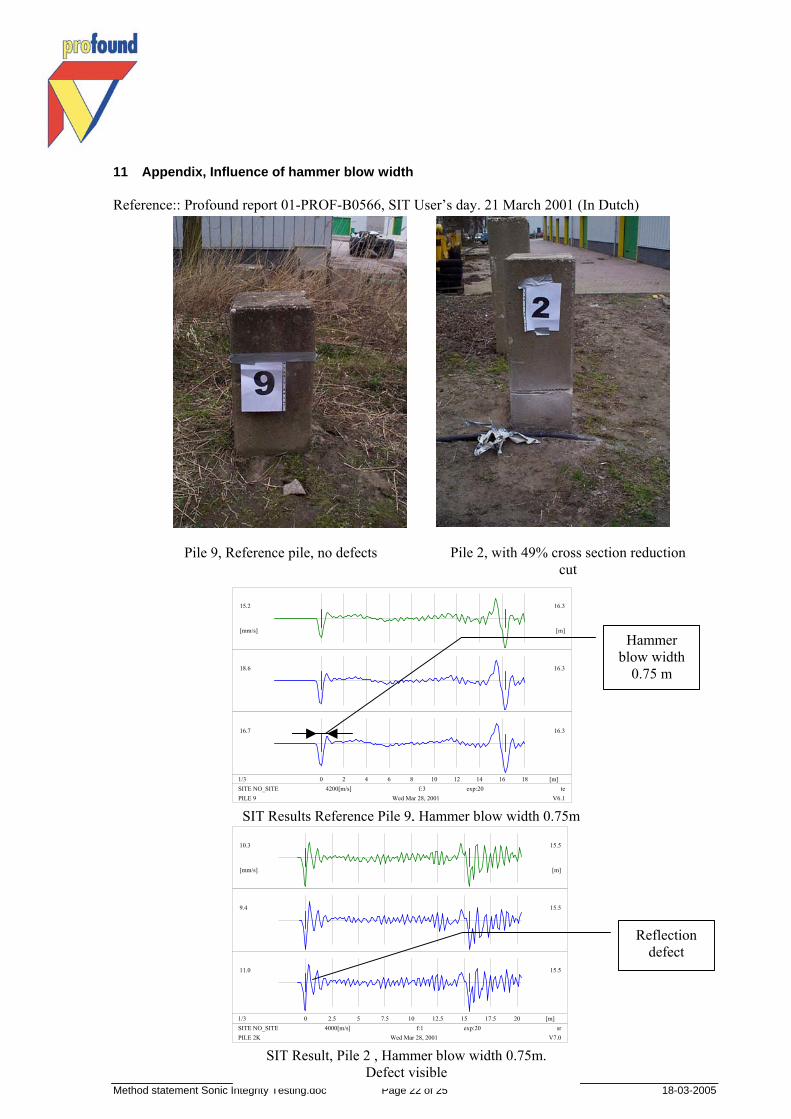
11 Appendix, Influence of hammer blow width Reference:: Profound report 01-PROF-B0566, SIT User’s day. 21 March 2001 (In Dutch)
SIT Results Reference Pile 9, Hammer blow width 0.75m
15.2
[mm/s]
16.3
[m]
18.6 16.3
16.7 16.3
0 2 4 6 8 10 12 14 16 18 [m]1/3SITE NO_SITEPILE 9
teV6.1
4200[m/s] f:3 Wed Mar 28, 2001
exp:20
Hammer blow width
0.75 m
SIT Result, Pile 2 , Hammer blow width 0.75m. Defect visible
10.3
[mm/s]
15.5
[m]
9.4 15.5
11.0 15.5
0 2.5 5 7.5 10 12.5 15 17.5 20 [m]1/3SITE NO_SITEPILE 2K
srV7.0
4000[m/s] f:1 Wed Mar 28, 2001
exp:20
Reflection defect
Pile 9, Reference pile, no defects Pile 2, with 49% cross section reduction cut
Method statement Sonic Integrity Testing.doc Page 23 of 25 18-03-2005
9.9
[mm/s]
16.2
[m]
10.2 16.3
10.4 16.2
0 2 4 6 8 10 12 14 16 18 [m]1/3SITE NO_SITEPILE 2
srV6.1
4000[m/s] f:1 Wed Mar 28, 2001
exp:5
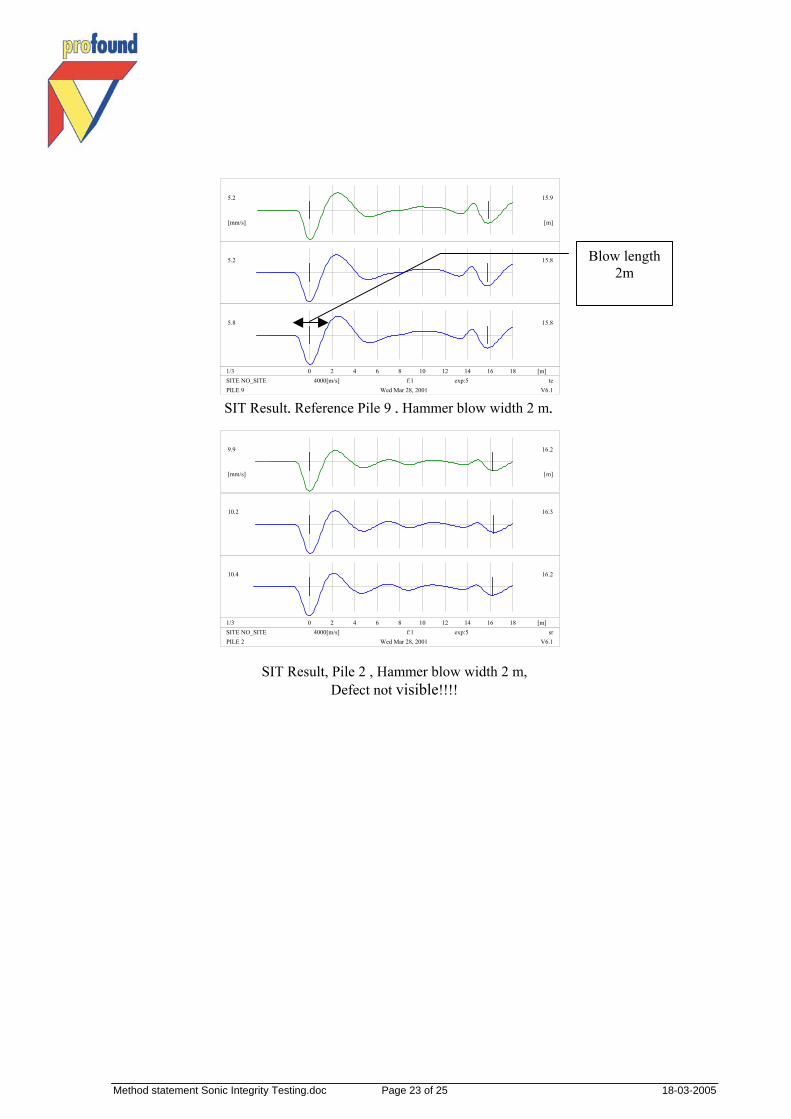
SIT Result, Pile 2 , Hammer blow width 2 m, Defect not visible!!!!
5.2
[mm/s]
15.9
[m]
5.2 15.8
5.8 15.8
0 2 4 6 8 10 12 14 16 18 [m]1/3SITE NO_SITEPILE 9
teV6.1
4000[m/s] f:1 Wed Mar 28, 2001
exp:5
SIT Result, Reference Pile 9 , Hammer blow width 2 m,
Blow length 2m
Method statement Sonic Integrity Testing.doc Page 24 of 25 18-03-2005
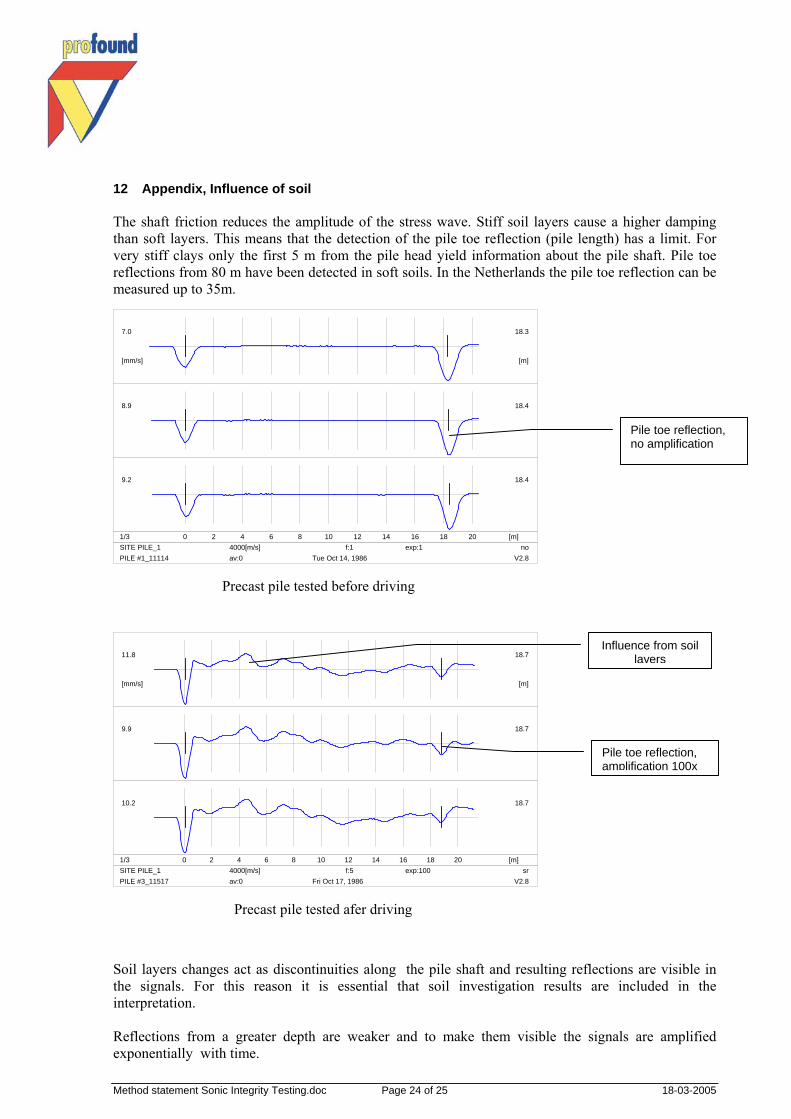
12 Appendix, Influence of soil The shaft friction reduces the amplitude of the stress wave. Stiff soil layers cause a higher damping than soft layers. This means that the detection of the pile toe reflection (pile length) has a limit. For very stiff clays only the first 5 m from the pile head yield information about the pile shaft. Pile toe reflections from 80 m have been detected in soft soils. In the Netherlands the pile toe reflection can be measured up to 35m.
Soil layers changes act as discontinuities along the pile shaft and resulting reflections are visible in the signals. For this reason it is essential that soil investigation results are included in the interpretation. Reflections from a greater depth are weaker and to make them visible the signals are amplified exponentially with time.
7.0
[mm/s]
18.3
[m]
8.9 18.4
9.2 18.4
0 2 4 6 8 10 12 14 16 18 20 [m]1/3SITE PILE_1PILE #1_11114
noV2.8
4000[m/s]av:0
f:1 Tue Oct 14, 1986
exp:1
Precast pile tested before driving
11.8
[mm/s]
18.7
[m]
9.9 18.7
10.2 18.7
0 2 4 6 8 10 12 14 16 18 20 [m]1/3SITE PILE_1PILE #3_11517
srV2.8
4000[m/s]av:0
f:5 Fri Oct 17, 1986
exp:100
Precast pile tested afer driving
Influence from soil layers
Pile toe reflection, no amplification
Pile toe reflection, amplification 100x
Method statement Sonic Integrity Testing.doc Page 25 of 25 18-03-2005
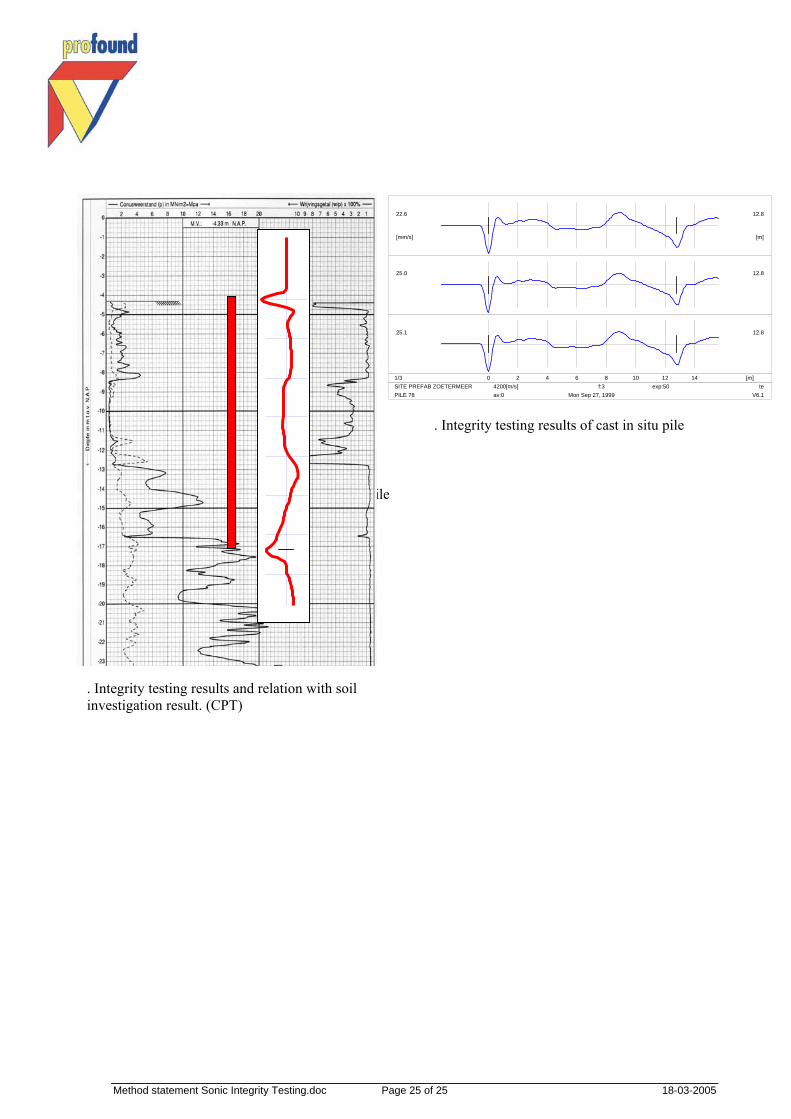
Figure Test result cast in situ pile
22.6
[mm/s]
12.8
[m]
25.0 12.8
25.1 12.8
0 2 4 6 8 10 12 14 [m]1/3SITE PREFAB ZOETERMEERPILE 78
teV6.1
4200[m/s]av:0
f:3 Mon Sep 27, 1999
exp:50
. Integrity testing results of cast in situ pile
. Integrity testing results and relation with soil investigation result. (CPT)
Recommended