For updated information, please visit www.ibef.org September 2018
MEDIA AND
ENTERTAINMENT

Table of Content
Executive Summary……………….….……..3
Advantage India…………………..….……...4
Market Overview …………………….……...6
Recent Trends and Strategies……..……..16
Growth Drivers……………………..............21
Opportunities…….……….......…………….28
Industry Associations……………....….......31
Useful Information……….......………….....33

For updated information, please visit www.ibef.org Media and Entertainment 3
EXECUTIVE SUMMARY
Indian television market has a opportunity of catering to 100 million homes as 197 million homes out of the total
298 million have TV sets as of 2017.
In 2017, television viewership in India grew at the rate of 12 per cent y-o-y.
In FY18, television market generated a revenue of Rs 651.90 billion (US$ 10.11 billion).
Second largest TV
market
Source: KPMG – FICCI Report, 2016 and 2018; Dish TV Investor Presentation, Ministry of Information and Broadcasting (MIB), NASSCOM, Telecom Regulatory Authority of India (TRAI),
Aranca Research, Broadcast India 2018 Survey conducted by Broadcast Audience Research Council (Barc) India
Total of 243 FM channels (21 from the Phase - I and 222 from Phase – II) are operational. Under the phase III,
the Cabinet has already given permission to 162 FM channels in 69 cities to operate and 17 cities were provided
with licenses to operate in 2017.
Telecom Regulatory Authority of India (TRAI) plans to introduce a policy for broadcasting sector with a vision of
2020. The policy aims to usher a new era in the broadcasting sector where MRP of the TV channel will be
declared by broadcasters directly to the consumers, and will bring more transparency and choices to the
consumers.
One of the largest
broadcasting market
Animation and VFX industry in India reached Rs 73.90 billion (US$ 1.15 billion) in FY18 from Rs 62.30 billion
(US$ 928.60 million) in FY17, growing at a CAGR of 18.60 per cent.
During 2018-2023, the segment is expected to grow at a higher CAGR of 15.50 per cent, largely led by the
continued growth in outsourced services and the swelling use of animation and VFX services in the domestic
television and film space, respectively.
Fast growing
animation industry
Digitalisation has played the major role in the growth of Indian film industry. The Indian film industry is expected
to grow at a rate of 11.9 per cent by 2020.
By 2019, cinema exhibition industry in India is expected to have over 3,000 multiplex screens.
Exceptional growth in
film industry
Total subscriber base for Indian television industry is expected to increase to 195 million by 2019 from 183
million in 2017.
As of March 2018 active DTH subscriber base in the country stood at around 67.53 million.
Rising no of
subscribers

Media and Entertainment
ADVANTAGE INDIA

For updated information, please visit www.ibef.org Media and Entertainment 5
ADVANTAGE INDIA
Rising incomes and evolving lifestyles have
led to higher demand for aspirational products
and services.
Higher penetration and a rapidly growing
young population coupled with increased
usage of 3G, 4G and portable devices would
augment demand .
Entertainment Industry is set to expand at a
CAGR of 13.10 per cent over 2018-23, one of
the highest rates globally.
Television and AGV segments are expected
to lead industry growth and offer immense
growth opportunities in digital technologies as
well.
From April 2000 to June 2018, FDI
Inflows in Information and
Broadcasting (including print media)
sector reached US$ 7.17 billion.
Increasing M&A activity.
More big-ticket deals such as Walt
Disney- UTV, Sony-ETV and Zee-
Star.
Entry of big players across all segment
of industry.
The Government of India has increased the
FDI limit from 74 per cent to 100 per cent.
Measures such as digitisation of cable
distribution to improve profitability and ease
of institutional finance.
Increasing liberalisation and tariff relaxation.
In 2011, Indian Government passed the
“The Cable Television Networks
(Regulation) Amendment Act, 2011” for
digitisation of cable television networks.
ADVANTAGE
INDIA
Source: KPMG Report 2015, KPMG – FICCI Report, 2016; Dish TV Investor Presentation, Ministry of Information and Broadcasting (MIB), Aranca Research
Notes: AGV - Animation, Gaming and VFX, VFX - Visual Effects, M&A - Merger and Acquisition, FDI - Foreign Direct Investment,

Media and Entertainment
MARKET OVERVIEW

For updated information, please visit www.ibef.org Media and Entertainment 7
THE ENTERTAINMENT SECTOR IS SPLIT INTO NINE
SEGMENTS
Source: : KPMG – FICCI Report, 2018, Aranca Research
Entertainment
Television
Online Gaming
Animation and VFX
Out of Home
(OOH)
Music Digital
Advertising
Radio
Note: VFX - Visual Effects
Films
For updated information, please visit www.ibef.org Media and Entertainment 8
THE INDIAN ENTERTAINMENT INDUSTRY IS
GROWING RAPIDLY
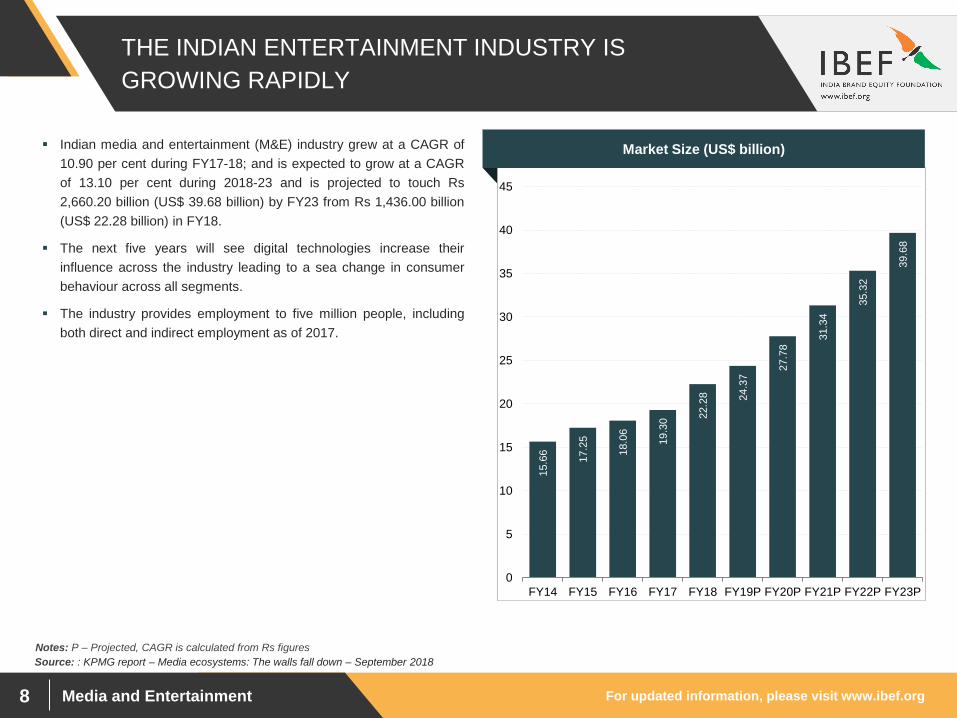
Indian media and entertainment (M&E) industry grew at a CAGR of
10.90 per cent during FY17-18; and is expected to grow at a CAGR
of 13.10 per cent during 2018-23 and is projected to touch Rs
2,660.20 billion (US$ 39.68 billion) by FY23 from Rs 1,436.00 billion
(US$ 22.28 billion) in FY18.
The next five years will see digital technologies increase their
influence across the industry leading to a sea change in consumer
behaviour across all segments.
The industry provides employment to five million people, including
both direct and indirect employment as of 2017.
Market Size (US$ billion)
15.6
6
17.2
5
18.0
6
19.3
0 22.2
8
24.3
7 2
7.7
8 3
1.3
4
35.3
2
39.6
8
0
5
10
15
20
25
30
35
40
45
FY14 FY15 FY16 FY17 FY18 FY19P FY20P FY21P FY22P FY23P
Source: : KPMG report – Media ecosystems: The walls fall down – September 2018
Notes: P – Projected, CAGR is calculated from Rs figures

For updated information, please visit www.ibef.org Media and Entertainment 9
SEGMENTS OF INDIAN ENTERTAINMENT INDUSTRY
10.11
4.95
2.47
1.80
1.15
0.68 0.50 0.40 0.22
TV
Flims
Digital Advertising
Animation and VFX
Gaming
OOH
Radio
Music
Source: KPMG report – Media ecosystems: The walls fall down – September 2018 , Economic Times, Aranca Research
In FY18, major segments were television, print and films with a market size of Rs 651.90 billion (US$ 10.11 billion), Rs 318.90 billion (US$ 4.95
billion) and Rs 158.90 billion (US$ 2.47 billion), respectively. They are projected to reach Rs 1,179.60 billion (US$ 17.60 billion), Rs 424.90 billion
(US$ 6.34 billion) and Rs 228.80 billion (US$ 3.41 billion), respectively in FY23.
PVR Cinemas number of screens increased to 625 in FY18. They have a target to achieve 1,000 screens in India by 2020.
Google's video platform, YouTube, plans to increase its user base in India to 400 million, as rising internet penetration in the rural areas will
enable the consumers to access videos on their smartphones.
The Indian digital advertising industry is expected to grow at a Compound Annual Growth Rate (CAGR) of 32 per cent to reach Rs 18,986 crore
(US$ 2.93 billion) by 2020, backed by affordable data and rising smartphone penetration.
Size of major industry segments FY18 (US$ billion)
17.60
6.34
3.41
6.49
2.26 1.77
0.74 0.63 0.44
TV
Flims
Digital Advertising
Animation and VFX
Gaming
OOH
Radio
Music
Size of major industry segments FY23P (US$ billion)
Notes: P – Projected, OOH – Out of Home, TV – Television

For updated information, please visit www.ibef.org Media and Entertainment 10
TELEVISION, ONE OF THE LARGEST AND FASTEST
GROWING SEGMENT
1.66
5.74
6.67
7.61
8.64
9.68
3.48
3.80
4.34
4.92
5.56
6.34
0
2
4
6
8
10
12
14
16
18
FY18 FY19P FY20P FY21P FY22P FY23P
Subscription Revenue Advertisment Revenue
Source: KPMG report – Media ecosystems: The walls fall down – September 2018
In FY18, television market size increased to Rs 651.90 billion (US$
10.11 billion) from Rs 433.70 billion (US$ 7.17 billion).
In FY18, broadcasters subscription revenue was Rs 107.00 billion
(US$ 1.66 billion) and is forecasted to reach Rs 224.00 billion (US$
9.68 billion) in FY23.
In FY18, broadcasters advertisement revenue was Rs 224.00 billion
(US$ 3.48 billion) and is forecasted to reach Rs 425.00 billion (US$
6.34 billion) in FY23.
Visakhapatnam port traffic (million tonnes) Broadcasters Market Size Forecast (US$ billion)
Notes: P – Projected
5.14
5.74
6.67
7.61
8.64
9.68
For updated information, please visit www.ibef.org Media and Entertainment 11
Radio, OOH, ANIMATION and VFX, GAMING AND
DIGITAL ADVERTISING ON HIGH GROWTH PHASE
Source: KPMG report – Media ecosystems: The walls fall down – September 2018 Note: VFX- Visual Effects, P – Projected, Out-of-home advertising, CAGR is calculated from Rs figures
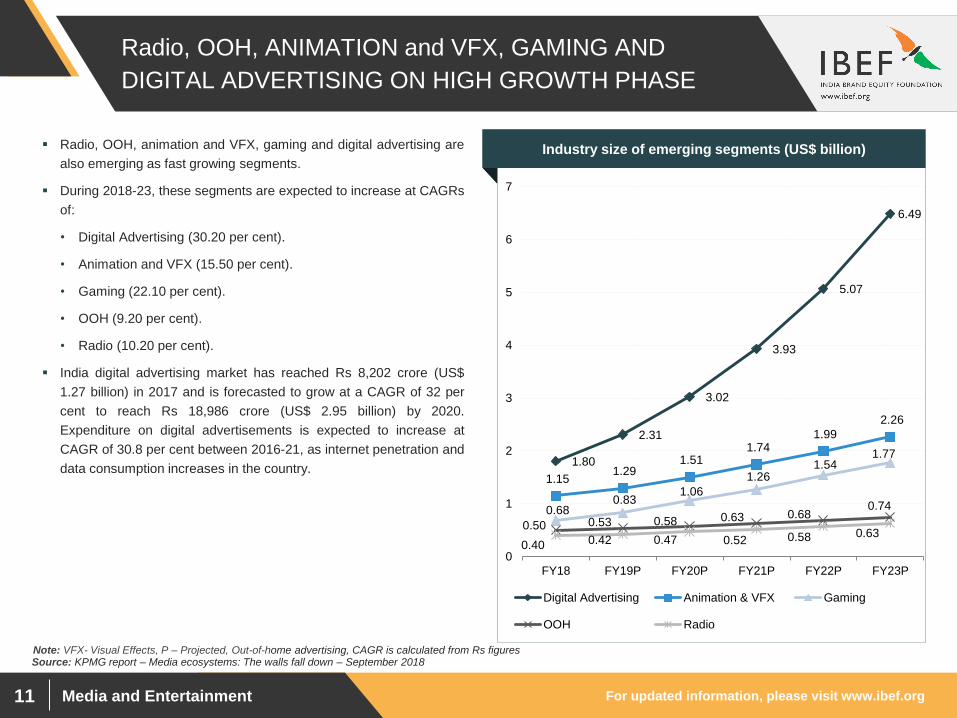
Radio, OOH, animation and VFX, gaming and digital advertising are
also emerging as fast growing segments.
During 2018-23, these segments are expected to increase at CAGRs
of:
• Digital Advertising (30.20 per cent).
• Animation and VFX (15.50 per cent).
• Gaming (22.10 per cent).
• OOH (9.20 per cent).
• Radio (10.20 per cent).
India digital advertising market has reached Rs 8,202 crore (US$
1.27 billion) in 2017 and is forecasted to grow at a CAGR of 32 per
cent to reach Rs 18,986 crore (US$ 2.95 billion) by 2020.
Expenditure on digital advertisements is expected to increase at
CAGR of 30.8 per cent between 2016-21, as internet penetration and
data consumption increases in the country.
Visakhapatnam port traffic (million tonnes) Industry size of emerging segments (US$ billion)
1.80
2.31
3.02
3.93
5.07
6.49
1.15 1.29
1.51 1.74
1.99
2.26
0.68 0.83
1.06
1.26 1.54
1.77
0.50 0.53 0.58 0.63 0.68 0.74
0.40 0.42 0.47 0.52 0.58 0.63
0
1
2
3
4
5
6
7
FY18 FY19P FY20P FY21P FY22P FY23P
Digital Advertising Animation & VFX Gaming
OOH Radio

For updated information, please visit www.ibef.org Media and Entertainment 12
ADVERTISING REVENUES
Source: KPMG report – Media ecosystems: The walls fall down – September 2018, Economic Times
Advertising Revenue Share FY18 (US$ billion)
Notes: TV – Television, CAGR is calculated from Rs figures, P – Projected, Out-of-home advertising
6.1
8
7.0
1
7.4
7
8.1
3
9.4
4
10
.40
11
.95
13
.73
15
.84
18
.39
0
2
4
6
8
10
12
14
16
18
20
FY14 FY15 FY16 FY17 FY18 FY19P FY20P FY21P FY22P FY23P
Advertising Revenue Forecast (US$ billion)
3.47
3.27
1.80
0.50 0.40
TV
Digital Advertising
OOH
Radio
India’s advertising revenue is projected to reach Rs 1,232.70 billion (US$ 18.39 billion) in FY23 from Rs 608.30 billion (US$ 9.44 billion) in FY18.
India’s advertising revenue is forecasted to grow at a CAGR of 15.20 per cent during 2018-2023.
Television advertising was the largest contributor, it generated a revenue of Rs 223.50 billion (US$ 3.47 billion) in FY18.
Print advertising was the second largest contributor, it generated a revenue of Rs 210.60 billion (US$ 3.27 billion) in FY18.
Digital advertising has emerged as the 3rd largest advertising medium in India. It generated revenues worth Rs 116.30 billion (US$ 1.80 billion) in
FY18.
India is one of the top five markets for the media, content and technology agency, Wavemaker, where it services clients like Hero MotoCorp,
Paytm, IPL and Myntra among others.

For updated information, please visit www.ibef.org Media and Entertainment 13
REGIONAL ENTERTAINMENT TRENDING NORTH
3,1
14
93
0
79
3
77
0
45
0
38
2
15
9
15
2
14
9
94
80
49
0
500
1,000
1,500
2,000
2,500
3,000
3,500
Source: KPMG – FICCI Report 2018, Economic Times, Broadcast India 2018 Survey conducted by Broadcast Audience Research Council (Barc) India
Regional Entertainment channels comprising mostly of regional
GECs (General Entertainment Channels), regional movies and
regional music.
As of 2017, about 31 per cent of TV owning individuals are present in
Tamil Nadu, Andhra Pradesh, Telangana, Karnataka and Kerala.
Total viewiership in these five states grew eight per cent year-on-
year to reach 259 million in 2017.
Total viewership in west, north and east had reached 221 million,
209 million and 146 million, respectively in the same period.
Visakhapatnam port traffic (million tonnes) Viewership growth in regional channels as of 2017

For updated information, please visit www.ibef.org Media and Entertainment 14
MUSIC INDUSTRY
14
0.5
0
16
6.8
0
17
1.1
0
18
7.8
1
22
3.4
3
24
7.6
1
28
4.9
0 32
9.6
5 3
81
.86
44
1.5
3
0
50
100
150
200
250
300
350
400
450
500
FY14 FY15 FY16 FY17 FY18 FY19PFY20PFY21PFY22PFY23P
Music entertainment market size is expected to touch Rs 29.60
billion (US$ 441.53 million) by FY23 from Rs 14.40 billion (US$
223.43 million) in FY18.
Music entertainment industry is forFineecasted to grow at a CAGR of
15.5 per cent, during 2018-2023.
By 2020, the number of online music listeners in India will reach 273
million, while the digital music revenues is likely to cross US$ 507.7
million.
Visakhapatnam port traffic (million tonnes) Revenues for the music industry (US$ million)
Source: KPMG report – Media ecosystems: The walls fall down – September 2018
Note: P – Projected, CAGR is calculated from Rs figures,

For updated information, please visit www.ibef.org Media and Entertainment 15
KEY PLAYERS IN THE MEDIA AND ENTERTAINMENT
INDUSTRY
Television Print Films Music
Star India Pvt Ltd
Bennett, Coleman and Co
Ltd
Yash Raj Films Studios
Saregama India Ltd
Zee Entertainment Enterprises
Ltd
HT Media Ltd
Eros International
Media Ltd
Super Cassettes
Industries Ltd
Multi Screen Media Pvt Ltd
Living Media India Ltd
Red Chillies
Entertainments Pvt Ltd
Tips Industries Ltd
Source: Company websites

Media and Entertainment
RECENT TRENDS
AND STRATEGIES

For updated information, please visit www.ibef.org Media and Entertainment 17
With increasing penetration of internet and digital mediums, digital segment is expected to outperform other
sectors of entertainment.
Although Out-of-Home segment has a low contribution to the total of entertainment industry, in coming years it
is going to witness a significant growth.
The market size for Out of Home (OOH) entertainment reached Rs 32.00 billion (US$ 496.51 million) in FY18
from Rs 28.60 billion (US$ 426.29 million).in FY17, at a CAGR of 11.90 per cent.
NOTABLE TRENDS IN THE MEDIA AND
ENTERTAINMENT INDUSTRY… (1/2)
Source: KPMG report – Media ecosystems: The walls fall down – September 2018, Economic Times, Indian Readership Survey 2017 (IRS 2017)
The government announced digitisation of cable television in India in 4 phases, which was slated for
completion by the end of December 2016. Phase III was almost completed in December 2015, while Phase IV
is under progress.
The Direct-To-Home (DTH) subscription is growing rapidly driven by content innovation and product offerings.
The television industry grew to Rs 651.90 billion (US$ 10.11 billion) in FY18 from Rs 595.30 billion (US$ 8.87
billion) in FY17 at a CAGR of 9.50 per cent.
Television
The print industry accounted for the second largest share in M&E to reach Rs 318.90 billion (US$ 4.95 billion) in
FY18 from Rs 308.40 billion (US$ 4.60 billion) in FY17, at a CAGR of 3.40 per cent.
Newspaper readership in India has increased by 40 per cent to 407 million in 2017 from 295 million in 2014.
Increasing income levels and evolving lifestyles have led to robust growth in niche magazines segment.
Considering the huge potential in regional print markets, national advertisers are entering these markets to
increase their advertising share.
The Indian film industry is largest producer of films globally with 400 production and corporate houses involved
in film production.
The Indian film industry reached Rs 158.90 billion (US$ 2.47 billion) in FY18 from Rs 145.00 billion (US$ 2.16
billion) in FY17, at a CAGR 9.60 per cent. Increasing share of Hollywood content in the Indian box office and
3D cinema is driving the growth of digital screens in the country.
Film
Out of Home and digital
Note: CAGR is calculated from Rs figures

For updated information, please visit www.ibef.org Media and Entertainment 18
Increasing FM enabled phones and car music systems.
In FY17, the total number of radio frequencies auctioned were 266 across 92 cities, only 66 frequencies got
sold to 11 companies.
In FY18, the radio industry in India accounted for a market size of Rs 25.90 billion (US$ 401.86 million) and
Rs 24.00 billion (US$ 357.73 million) in FY17, registering growth of CAGR 7.90 per cent.
NOTABLE TRENDS IN THE MEDIA AND
ENTERTAINMENT INDUSTRY… (2/2)
Growing focus on the ‘kids genre’ and rise in dedicated TV channels for them. As the advertising industry
grows, the share of animation driven advertisements are expected to also grow.
Surge in 3D/HD animated movies in theatres and use of animation and VFX in TV advertising and gaming.
Growing outsourcing of VFX and gaming to India is due to cost effectiveness of Indian players.
Gaming industry in India reached Rs 43.80 billion (US$ 679.60 million) in FY18 from Rs 32.40 billion (US$
482.93 million) in FY17, at a CAGR of 35.10 per cent.
Animation and VFX industry in India reached Rs 73.90 billion (US$ 1.15 billion) in FY18 from Rs 62.30 billion
(US$ 928.60 million) in FY17, at a CAGR of 18.60 per cent.
Animation, Gaming and
VFX (AGV)
The music industry is on fast paced growth with increasing international associations. The Indian music
industry is a consortium of 142 music companies.
Players are looking at new ways and mediums to monetise music, such as utilising social media to promote
music. Mobile phones, iPods and mp3 players – devices that enable music on-the-go – are becoming the
primary means to access music.
Digital music on mobile continues to drive music industry revenue and digital revenues are expected to reach
US$394.22 million by 2021. Digital revenues contribute 55 per cent of the music industry and is expected to
contribute close to 62 per cent by 2018.
Music
Radio
Source: KPMG report – Media ecosystems: The walls fall down – September 2018, Economic Times Note: CAGR is calculated from Rs figures

For updated information, please visit www.ibef.org Media and Entertainment 19
Visakhapatnam port traffic (million tonnes) Online Video Audience (million) Growing mobile and smartphone penetration has boosted adaptation
of online video viewing in India.
Online video market is driven by increasing geographical coverage of
high speed data, increasing smartphone, affordable data charges
and availability of creative video content.
The number of online video viewing is forecasted to reach 550
million in FY23 from estimated 225 million in FY18.
OTT ON AN UPTREND POST - DIGITISATION
Notes: E – Estimate, P - Projected, OTT- Over-the-top content
Source: KPMG report – Media ecosystems: The walls fall down – September 2018
22
5
32
5
40
0
46
0
51
0 5
50
0
100
200
300
400
500
600
FY18E FY19P FY20P FY21P FY22P FY23P

For updated information, please visit www.ibef.org Media and Entertainment 20
STRATEGIES ADOPTED
Source: Aranca Research, KPMG Report on Engineering sector
The manufacturing companies such as Videocon is offering combo deals such as LED/LCD sets with
Videocon set-up boxes and dish services.
The Dish TV is also offering the set up boxes with many additional channels.
Increasing digitisation in the country is helping such companies to further add up to their revenues.
Marketing strategies
As television industry is a dominant segment in the entertainment industry even the film makers promote their
films at this platform so as to reach to the mass audiences for example the reality shows, TV advertisements,
etc.
Many film producers, actors, etc have shifted to the television industry so as to remain in the race and
maintain their fan following.
TV programmes being used as a medium of promoting films or other entertainment events.
After bagging media rights of Indian Premier League (IPL), Star India has also won broadcast and digital
rights for New Zealand Cricket upto April 2020.
Television: A common
medium
Audience is the ultimate consumer in this industry and therefore films, advertisements, music and all the
products of entertainment sector is based on the tastes and preferences of the audiences of the nation.
Audience: the ultimate
consumer
Regional entertainment is growing and therefore, the suppliers are able to expand their forte in the products.
Zee Television, Star TV have their regional channels both for entertainment and news.
The South Indian television industry is one of the oldest operational television sectors across the nation and
is further growing due to the regional content.
Viewership in regional
entertainment

Media and Entertainment
GROWTH DRIVERS
For updated information, please visit www.ibef.org Media and Entertainment 22
GROWTH DRIVERS OF MEDIA AND ENTERTIANMENT
SECTOR IN INDIA
Source: PE Roundup – July’18 by EY, FICCI Report 2018, Providing M&A and Private Equity Deal insights report by Grant Thorton
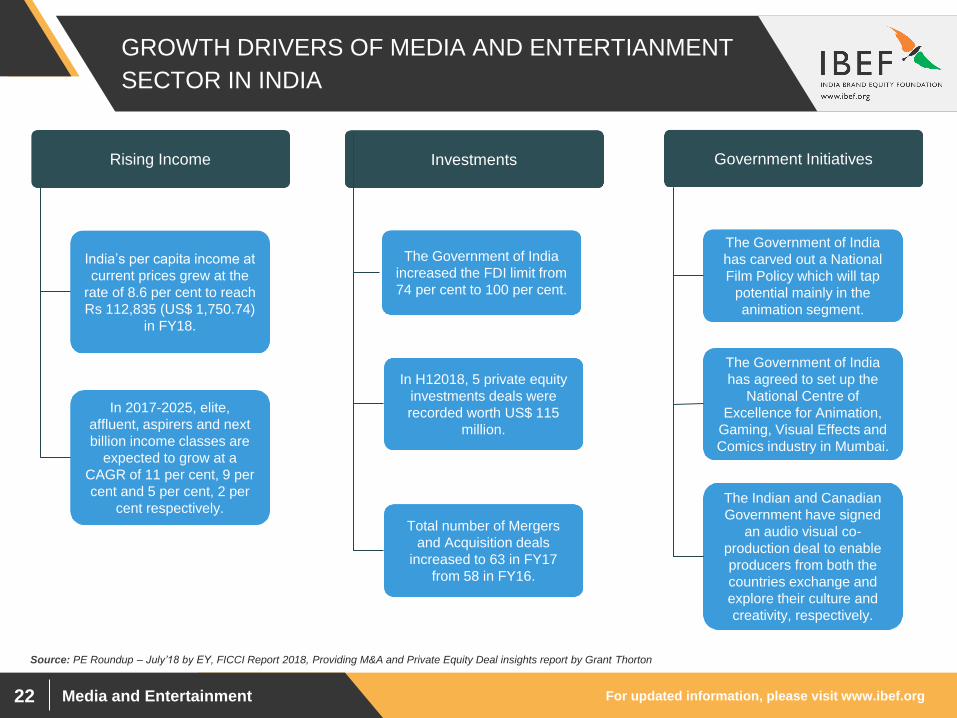
Growing demand Rising Income Investments Government Initiatives
India’s per capita income at
current prices grew at the
rate of 8.6 per cent to reach
Rs 112,835 (US$ 1,750.74)
in FY18.
In 2017-2025, elite,
affluent, aspirers and next
billion income classes are
expected to grow at a
CAGR of 11 per cent, 9 per
cent and 5 per cent, 2 per
cent respectively.
In H12018, 5 private equity
investments deals were
recorded worth US$ 115
million.
The Government of India
has carved out a National
Film Policy which will tap
potential mainly in the
animation segment.
The Indian and Canadian
Government have signed
an audio visual co-
production deal to enable
producers from both the
countries exchange and
explore their culture and
creativity, respectively.
The Government of India
increased the FDI limit from
74 per cent to 100 per cent.
The Government of India
has agreed to set up the
National Centre of
Excellence for Animation,
Gaming, Visual Effects and
Comics industry in Mumbai.
Total number of Mergers
and Acquisition deals
increased to 63 in FY17
from 58 in FY16.

For updated information, please visit www.ibef.org Media and Entertainment 23
INCOME FACTOR DRIVING GROWTH
1.5% 2.0% 2.6% 5.0% 3.0% 6.0% 6.4%
11.0% 8.0%
15.0% 15.0%
20.0%
42.0%
45.0% 45.3%
46.0%
44.0% 31.0% 30.7% 18.0%
2005 2016 2017 2025F
Elite(>30800) Affluent(15400-30800)
Aspirers(7700-15400) Next billion(2300-7700)
Strugglers(<2300)
Apart from the impact of rising incomes, widening of the consumer
base will also be aided by expansion of the middle class, increasing
urbanisation and changing lifestyles.
The entertainment industry will also benefit from continued rise in the
propensity to spend among individuals; empirical evidence points to
the fact that decreasing dependency ratio leads to higher
discretionary spending on entertainment.
Traditionally only advertising has been a key source of revenue for
Media and Entertainment industry, but off late revenue from
subscription and value added services has also contributed
significantly. With consumers willing to pay for content and extra
services, the subscription segment will play an important role in the
post digitisation era.
Visakhapatnam port traffic (million tonnes) Indian residents shifting from low to high income groups (%)
Million Household, 100%
Source: McKinsey Quarterly Report
Note: Income distribution is calculated in constant 2015 dollars; $1=65. Because of rounding, not all percentages add up to 100. F - Forecast
209.10 266.50 304.80 267

For updated information, please visit www.ibef.org Media and Entertainment 24
FDI limit in radio, including private FM channels have been increased from 26 per cent to 49 per cent.
Private operators allowed to own multiple channels in a city, subject to a limit of 40 per cent of total channels in
the city.
Private players allowed to carry news bulletins of All India Radio .
Further boost may be given to the radio sector by charging license fees on the basis of ‘net income’ so as to
provide relief to loss making radio players.
POLICY SUPPORT AIDING SECTOR GROWTH … (1/2)
Notes: FDI – Foreign Direct Investment, GST – Goods and Service Tax, DTH - Direct-to-Home
Digitisation of the cable distribution sector to attract greater institutional funding, improve profitability and help
players improve their value chain.
FDI limit for DTH satellite and digital cable network was raised from 74 per cent to 100 per cent by the
government.
No restriction on foreign investment for up-linking and downlinking of TV channels other than news and current
affairs.
Television
Co-production treaties with various countries such as Italy, Brazil, UK and Germany to increase the export
potential of the film industry.
Granted ‘industry’ status in 2001 for easy access to institutional finance.
FDI of up to 100 per cent through the automatic route has been granted by government.
Entertainment tax to be subsumed in the GST; this would create a uniform tax rate regime across all states and
will also reduce the tax burden.
Film
Radio
Source: KPMG – FICCI Report 2017 & 2018

For updated information, please visit www.ibef.org Media and Entertainment 25
POLICY SUPPORT AIDING SECTOR GROWTH … (2/2)
Source: PwC India Entertainment and Media Outlook 2011, KPMG – FICCI Report 2018
Parliamentary approval on the Copyright Act (Amendment) Bill, 2012, which strengthens the royalty claims of
musicians, lyricists and others in the field.
Policies are adopted against digital piracy and file-sharing to block illegal music websites .
Adoption of revenue sharing model by Copyright Board requiring FM radio companies to share 2.0 per cent of
their net advertising revenues with music companies.
Music
100 per cent FDI allowed in the sector through automatic route provided it is in compliance with RBI
guidelines.
The government has carved out a National Film Policy to tap the potential of the film sector mainly for the
animation segment.
State-level initiative by governments to encourage animation industry.
Animation, Gaming and
VFX (AGV)
FDI/NRI investment of up to 26 per cent in an Indian firm dealing with publication of newspaper and
periodicals.
FDI/NRI investment of up to 26 per cent in publications of Indian editions of foreign magazines.
FDI/NRI investment of up to 100 per cent in publications of scientific and technical magazines/ specialty
journals/ periodicals.
For updated information, please visit www.ibef.org Media and Entertainment 26
KEY M&A DEALS IN THE SECTOR
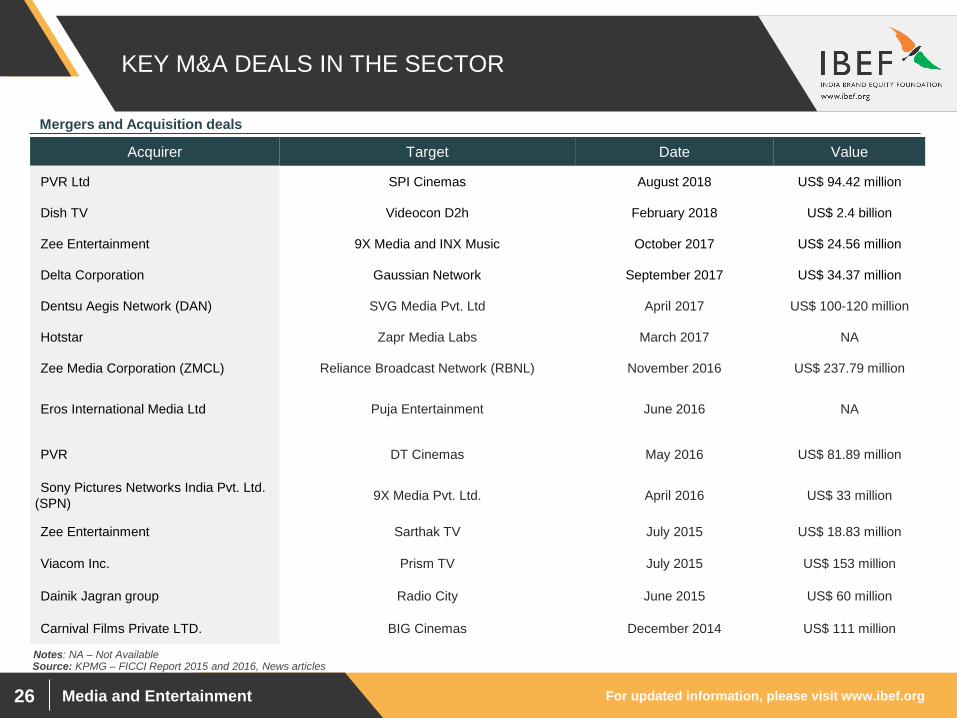
Acquirer Target Date Value
PVR Ltd SPI Cinemas August 2018 US$ 94.42 million
Dish TV Videocon D2h February 2018 US$ 2.4 billion
Zee Entertainment 9X Media and INX Music October 2017 US$ 24.56 million
Delta Corporation Gaussian Network September 2017 US$ 34.37 million
Dentsu Aegis Network (DAN) SVG Media Pvt. Ltd April 2017 US$ 100-120 million
Hotstar Zapr Media Labs March 2017 NA
Zee Media Corporation (ZMCL) Reliance Broadcast Network (RBNL) November 2016 US$ 237.79 million
Eros International Media Ltd Puja Entertainment June 2016 NA
PVR DT Cinemas May 2016 US$ 81.89 million
Sony Pictures Networks India Pvt. Ltd.
(SPN) 9X Media Pvt. Ltd. April 2016 US$ 33 million
Zee Entertainment Sarthak TV July 2015 US$ 18.83 million
Viacom Inc. Prism TV July 2015 US$ 153 million
Dainik Jagran group Radio City June 2015 US$ 60 million
Carnival Films Private LTD. BIG Cinemas December 2014 US$ 111 million
Mergers and Acquisition deals
Source: KPMG – FICCI Report 2015 and 2016, News articles Notes: NA – Not Available

For updated information, please visit www.ibef.org Media and Entertainment 27
INCREASING FDI INFLOWS INTO THE SECTOR
FDI inflows into the Information and Broadcasting sector during April
2000 to June 2018 rose up to US$ 7.17 billion.
Demand growth, supply advantages and policy support are the key
drivers in attracting FDI.
Visakhapatnam port traffic (million tonnes) FDI inflows into Information and Broadcasting sector (US$
billion)
Source: Department of Industrial Policy and Promotion (DIPP),
0.40 0.70
0.70
0.10 0.30 0.97
1.52
0.64
0.04
2.20
2.90
3.60 3.70 4.00
4.97
6.49
7.13 7.17
1.00
2.00
3.00
4.00
5.00
6.00
7.00
8.00
FY11 FY12 FY13 FY14 FY15 FY16 FY17 FY18 FY19*
Annual FDI Inflow
Cumulative from April 2000 – June 2018
Note: * - till June 2018

Media and Entertainment
OPPORTUNITIES

For updated information, please visit www.ibef.org Media and Entertainment 29
GROWTH OPPORTUNITIES IN THE MEDIA AND
ENTERTAINMENT SEGMENTS…(1/2)
Television industry is expected to increase from Rs 651.90 billion (US$ 10.11 billion) in FY18 and reaching
Rs 1,179.60 billion (US$ 17.60 billion) by FY23.
Television is projected to grow at a CAGR of 12.60 per cent during 2018-2023.
Television
The print industry was worth Rs 318.90 billion (US$ 4.95 billion) in FY18 and is expected to reach Rs 424.90
billion (US$ 6.34 billion) by FY23.
Accelerated growth is forecasted in regional print and local news segments.
Print industry is projected to grow at a CAGR of 5.90 per cent during 2018-2023.
The Indian animation and VFX industry was worth Rs 73.90 billion (US$ 1.15 billion) in FY18 and is expected
to expand to Rs 151.80 billion (US$ 2.26 billion) by FY23.
It is projected to grow at a CAGR of 15.50 per cent during 2018-2023.
Growth in international animation films, especially 3D productions and the subsequent work for Indian
production houses will help the growth in this segment.
Animation and VFX
Source: KPMG report – Media ecosystems: The walls fall down – September 2018, News articles
The Indian Premier League value increased to US$ 5.3 billion in 2017 from US$ 4.2 billion in 2016.
The 17th edition of U-17 World Cup was held in India, which became the worlds most attended event in the
history.
Sports
Note: CAGR is calculated from Rs figures
For updated information, please visit www.ibef.org Media and Entertainment 30
GROWTH OPPORTUNITIES IN THE MEDIA AND
ENTERTAINMENT SEGMENTS…(2/2)
Source: KPMG report – Media ecosystems: The walls fall down – September 2018
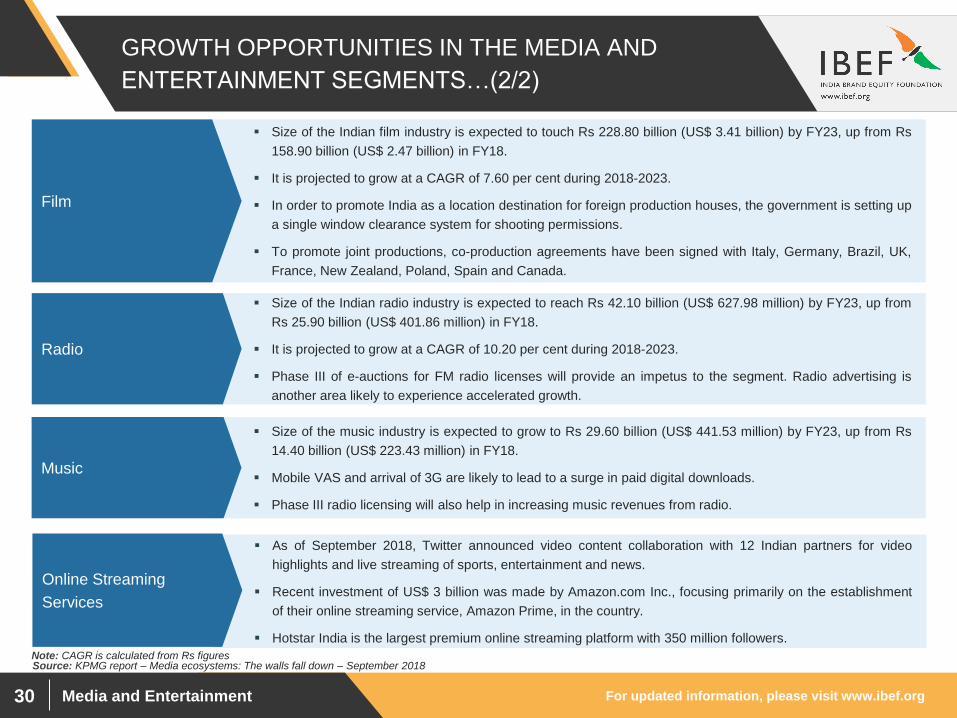
Size of the Indian radio industry is expected to reach Rs 42.10 billion (US$ 627.98 million) by FY23, up from
Rs 25.90 billion (US$ 401.86 million) in FY18.
It is projected to grow at a CAGR of 10.20 per cent during 2018-2023.
Phase III of e-auctions for FM radio licenses will provide an impetus to the segment. Radio advertising is
another area likely to experience accelerated growth.
Radio
Size of the music industry is expected to grow to Rs 29.60 billion (US$ 441.53 million) by FY23, up from Rs
14.40 billion (US$ 223.43 million) in FY18.
Mobile VAS and arrival of 3G are likely to lead to a surge in paid digital downloads.
Phase III radio licensing will also help in increasing music revenues from radio.
Music
Size of the Indian film industry is expected to touch Rs 228.80 billion (US$ 3.41 billion) by FY23, up from Rs
158.90 billion (US$ 2.47 billion) in FY18.
It is projected to grow at a CAGR of 7.60 per cent during 2018-2023.
In order to promote India as a location destination for foreign production houses, the government is setting up
a single window clearance system for shooting permissions.
To promote joint productions, co-production agreements have been signed with Italy, Germany, Brazil, UK,
France, New Zealand, Poland, Spain and Canada.
Film
As of September 2018, Twitter announced video content collaboration with 12 Indian partners for video
highlights and live streaming of sports, entertainment and news.
Recent investment of US$ 3 billion was made by Amazon.com Inc., focusing primarily on the establishment
of their online streaming service, Amazon Prime, in the country.
Hotstar India is the largest premium online streaming platform with 350 million followers.
Online Streaming
Services
Note: CAGR is calculated from Rs figures

Media and Entertainment
INDUSTRY
ASSOCIATIONS

For updated information, please visit www.ibef.org Media and Entertainment 32
INDUSTRY ASSOCIATIONS
Agency Contact Information
Indian Motion Picture Producers’ Association (IMPPA)
"IMPPA HOUSE”, Dr Ambedkar Road, Bandra (West), Mumbai - 400 050 Tel: 91-22-26486344/45/1760 Fax: 91-22-26480757 Website: www.indianmotionpictures.com/imppa/index.html
The Film and Television Producers Guild of India
G-1, Morya House, Veera Industrial Estate, Off Oshiwara Link Road, Andheri (W), Mumbai - 400 053 Tel: 91-22-66910662 Fax: 91-22-66910661 E-mail: [email protected] Website: www.filmtvguildindia.org
Newspapers Association of India (NAI)
A -115, Vakil Chamber, Top Floor, Vikas Marg, Shakarpur, Delhi - 110092 Tel: 91-9971847045, 9810226962 E-mail: [email protected] Website: www.naiindia.com
Association of Radio Operators for India (AROI)
304, Competent House, F-14, Connaught Place, New Delhi - 110001 Tel: 91- 124-4385887 e-mail: [email protected] Website: www.aroi.in
The Indian Music Industry (IMI)
Crescent Towers, 7th Floor, B-68, Veera Estate, Off New Link Road, Andheri West, Mumbai - 400 053 Tel: 91-22- 26736301 / 02 / 03 Fax: 91-22-26736304 Website: www.indianmi.org
The Indian Society of Advertisers
Army and Navy Building, 3rd Floor, 148, Mahatma Gandhi Road Mumbai- 400001 Tel: +91 (022) 2285 6045 / 2284 3583 / 2204 2116 Fax: +91 (022) 2204 2116 E-mail: [email protected]

Media and Entertainment
USEFUL
INFORMATION

For updated information, please visit www.ibef.org Media and Entertainment 34
GLOSSARY
AGV: Animation, Gaming and VFX
ARPU- Average Revenue Per User
CAGR: Compound Annual Growth Rate
DIPP: Department of Industrial Policy and Promotion, Ministry of Commerce and Industry
DTH: Direct to Home
FDI: Foreign Direct Investment
FM: Frequency Modulatio
FY: Indian Financial Year (April to March)
GST: Goods and Service Tax
IPO: Initial Public Offering
M&A: Merger and Acquisition
M&E: Media and Entertainment
PPP: Purchasing Power Parity
US$: US Dollar
VAS: Value Added Services
VFX: Visual Effects
Wherever applicable, numbers have been rounded off to the nearest whole number

For updated information, please visit www.ibef.org Media and Entertainment 35
EXCHANGE RATES
Exchange Rates (Fiscal Year) Exchange Rates (Calendar Year)
Year INR INR Equivalent of one US$
2004–05 44.95
2005–06 44.28
2006–07 45.29
2007–08 40.24
2008–09 45.91
2009–10 47.42
2010–11 45.58
2011–12 47.95
2012–13 54.45
2013–14 60.50
2014-15 61.15
2015-16 65.46
2016-17 67.09
2017-18 64.45
Q1 2018-19 67.04
Year INR Equivalent of one US$
2005 44.11
2006 45.33
2007 41.29
2008 43.42
2009 48.35
2010 45.74
2011 46.67
2012 53.49
2013 58.63
2014 61.03
2015 64.15
2016 67.21
2017 65.12
Source: Reserve Bank of India, Average for the year

For updated information, please visit www.ibef.org Media and Entertainment 36
DISCLAIMER
India Brand Equity Foundation (IBEF) engaged Aranca to prepare this presentation and the same has been prepared by Aranca in consultation
with IBEF.
All rights reserved. All copyright in this presentation and related works is solely and exclusively owned by IBEF. The same may not be reproduced,
wholly or in part in any material form (including photocopying or storing it in any medium by electronic means and whether or not transiently or
incidentally to some other use of this presentation), modified or in any manner communicated to any third party except with the written approval
of IBEF.
This presentation is for information purposes only. While due care has been taken during the compilation of this presentation to ensure that the
information is accurate to the best of Aranca and IBEF’s knowledge and belief, the content is not to be construed in any manner whatsoever as a
substitute for professional advice.
Aranca and IBEF neither recommend nor endorse any specific products or services that may have been mentioned in this presentation and nor do
they assume any liability or responsibility for the outcome of decisions taken as a result of any reliance placed on this presentation.
Neither Aranca nor IBEF shall be liable for any direct or indirect damages that may arise due to any act or omission on the part of the user due to any
reliance placed or guidance taken from any portion of this presentation.
Recommended