1
Measurements and Modelling to Determine the Reduction Potential of
Uncomplexed Bi(III) in Nitrate Solutions for Application in Bi(III)-Ligand
Equilibria Studies by Voltammetry
Caren Billing,a* Ignacy Cukrowski
b
a Molecular Sciences Institute, School of Chemistry, University of the Witwatersrand, P.O. Wits, Johannesburg,
2050, South Africa
b Department of Chemistry, University of Pretoria, Pretoria, 0002, South Africa
ABSTRACT
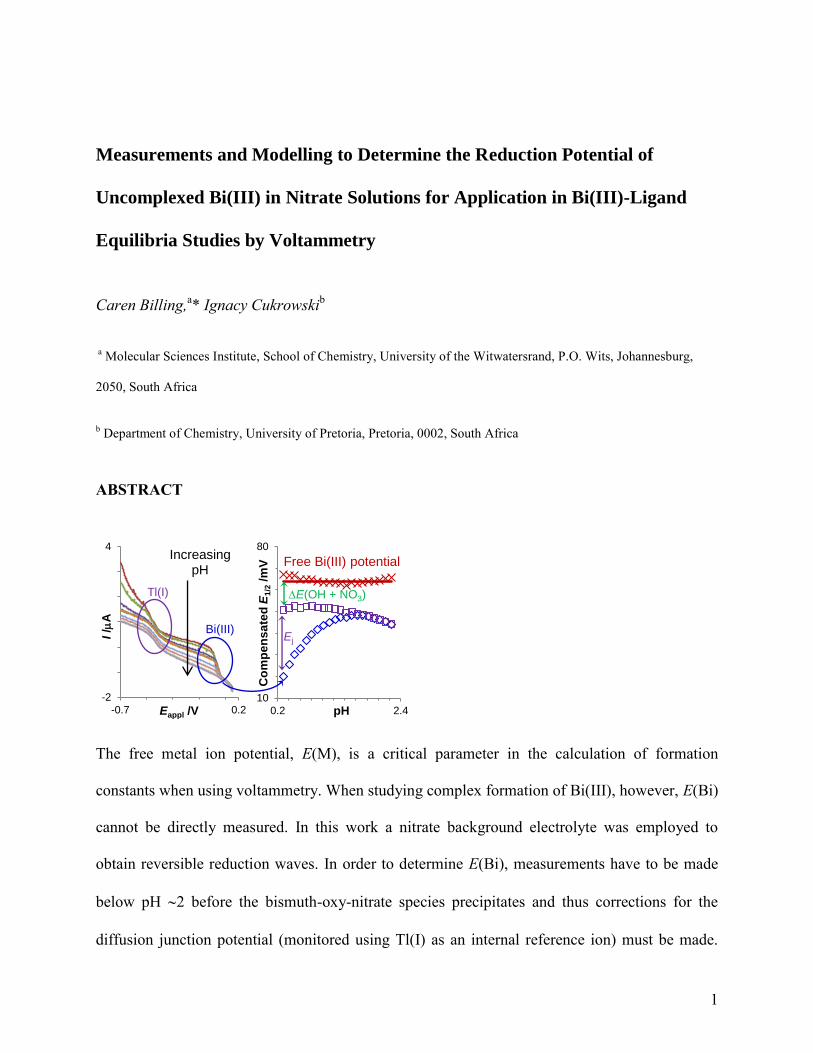
The free metal ion potential, E(M), is a critical parameter in the calculation of formation
constants when using voltammetry. When studying complex formation of Bi(III), however, E(Bi)
cannot be directly measured. In this work a nitrate background electrolyte was employed to
obtain reversible reduction waves. In order to determine E(Bi), measurements have to be made
below pH 2 before the bismuth-oxy-nitrate species precipitates and thus corrections for the
diffusion junction potential (monitored using Tl(I) as an internal reference ion) must be made.
-2
4
-0.7 0.2
I /m
A
Eappl /V
Increasing pH
Bi(III)
Tl(I)
10
80
0.2 2.4
Co
mp
en
sa
ted
E1
/2 /m
V
pH
Free Bi(III) potential
Ej
E(OH + NO3)
2
Additionally shifts in potential due to both Bi(III) hydrolysis and Bi(III) nitrate formation must
also be compensated for before E(Bi) can be evaluated. The value of E(Bi) was determined
relative to E(Tl) so that in an experiments where ligand is added to determine formation
constants, E(Bi) can be determined as accurately as possible (since E(Tl) can generally still be
measured). The value of E(Bi) E(Tl) was found to be 495.6 1.4 mV for the conditions
employed.
1. Introduction
Considering the myriads of studies conducted on metal-ligand equilibria, it may seem
surprising at first that very little is known about the coordination chemistry of Bi(III), the most
stable form of bismuth. This is despite bismuth having found applications in medicinal
chemistry, in particular in treating peptic ulcers and more recently in cancer treatments.1-7
This
lack of information is due to the difficulty in studying complex formation caused by the extreme
propensity of Bi(III) to undergo hydrolysis in aqueous environments.
Bi(III) hydrolysis, however, has been extensively studied and was instrumental in developing
techniques to investigate hydrolysis of metal ions in general.8 The formation of the Bi(OH)
2+
species was confirmed early on.9-11
There was also indication of the formation of bismuth
polynuclear species with much debate as to the exact stoichiometry of these species.12-14
Evidence from various techniques supported the presence of the hexamer, Bi6(OH)126+
, as the
dominant species under the specific experimental conditions.10,11,14-17
This species could also be
referred to as Bi6O66+
because numerous techniques have difficulty in differentiating whether O2
or OH is bound to the metal ion.
8 It was also recognised that the hexameric species was in
3
equilibrium with even larger complexes proposed to be Bi9(OH)207+
, Bi9(OH)216+
and
Bi9(OH)225+
.8,14,18
Other mononuclear species were also found in more dilute solutions and Bidleman19
determined formation constants for BiOH2+
, Bi(OH)3 and Bi(OH)4 (for Bi(III) <10
-4 M). The
Bi(OH)2+ species was initially not detected and it was suggested that the stoichiometrically
equivalent hexamer is much more stable than this species.11
Only when Hataye et al.18
analysed
solutions at trace Bi(III) concentrations (<10-7
M) did they find Bi(OH)2+, as well as Bi
3+,
Bi(OH)2+
and Bi(OH)3, in solution between pH 0 and 5.7, with no evidence of polymeric species.
It therefore appears that at very low Bi(III) concentrations Bi(OH)2+ is formed, but at higher
concentrations the hexameric species is more stable.
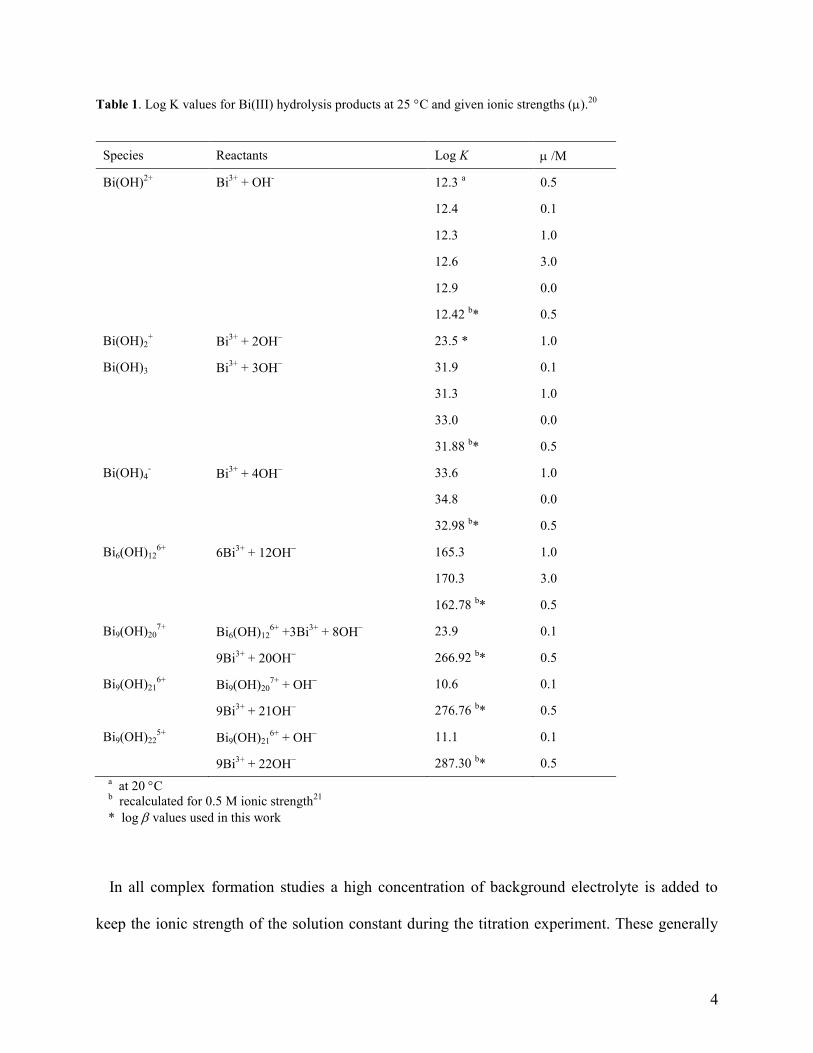
Table 1 summarises the critically assessed stability constants for the various Bi(III) hydrolysis
products included in the NIST database.20
Log values at 0.5 M ionic strength, calculated using
experimental values and applying the Davies modification of the Debye-Hückel equation,21
are
also shown as these were used in the work presented here. Although these values were quoted to
two decimal places, a single decimal place is a better indication of the actual precision. As will
be seen, hydrolysis takes place from pH zero already in aqueous solutions.
4
Table 1. Log K values for Bi(III) hydrolysis products at 25 C and given ionic strengths (m).20
Species Reactants Log K m /M
Bi(OH)2+
Bi3+
+ OH-
12.3 a 0.5
12.4 0.1
12.3 1.0
12.6 3.0
12.9 0.0
12.42 b* 0.5
Bi(OH)2+ Bi
3+ + 2OH
23.5 * 1.0
Bi(OH)3 Bi3+
+ 3OH 31.9 0.1
31.3 1.0
33.0 0.0
31.88 b* 0.5
Bi(OH)4- Bi
3+ + 4OH
33.6 1.0
34.8 0.0
32.98 b* 0.5
Bi6(OH)126+
6Bi3+
+ 12OH 165.3 1.0
170.3 3.0
162.78 b* 0.5
Bi9(OH)207+
Bi6(OH)126+
+3Bi3+
+ 8OH 23.9 0.1
9Bi3+
+ 20OH 266.92
b*
0.5
Bi9(OH)216+
Bi9(OH)207+
+ OH 10.6 0.1
9Bi3+
+ 21OH 276.76
b* 0.5
Bi9(OH)225+
Bi9(OH)216+
+ OH 11.1
0.1
9Bi3+
+ 22OH 287.30
b* 0.5
a at 20 C
b recalculated for 0.5 M ionic strength
21
* log values used in this work
In all complex formation studies a high concentration of background electrolyte is added to
keep the ionic strength of the solution constant during the titration experiment. These generally

5
consist of sodium or potassium salts of perchlorates or nitrates which are weakly complexing.
Unfortunately, the presence of these anions result in the precipitation of Bi(III) oxy or hydroxy
anion species. Kragten et al.22
referred to this as BiOA, which could also be considered as
Bi(OH)2A, where A refers to the anion. They showed that this species precipitated from solution
at much lower pHs than Bi(OH)3 and that the pH of precipitation decreased with increasing
Bi(III) concentration. The precipitate was shown to be a polycondensation of Bi6(OH)126+
ions in
solutions of basic Bi(III) salts to form the species [Bi6Ox(OH)8-x](10-x)+
.17,23,24
The structures of
crystals grown from solutions below pH 1.2 and between pH 1.2-2.4 were found to be
Bi6O4(OH)4A6 and Bi6O5(OH)3A5, respectively.24-28
For simplicity, the “empirical” formula
BiOA will be used to refer to the insoluble product in general.
Usually chloride is used in background electrolytes for studies pertaining to biological
applications, but due to the very limited solubility of BiOCl22
it was avoided in this work. The
use of perchlorate was initially considered here since BiOClO4 is slightly more soluble than
BiONO322
and perchlorate is also less complexing than nitrate18,19
(as would be required of an
inert background electrolyte). Nitrate forms far stronger complexes with Bi(III) than with other
metal ions and even exhibits some covalent character;29
there is also evidence for negatively
charged nitrate complexes of Bi(III) in solution.30
Voltammetry is ideally suited to studying Bi(III)-ligand equilibria because relatively low
concentrations of Bi(III) can be used in order to postpone precipitation. Additionally, since mass
balance equations (MBEs) for the metal ion concentration are solved when determining
formation constants (rather than the MBEs for H+ concentration as when using glass electrode
potentiometry), measurements can be made in very acidic solutions (below pH 2).
6
In using this technique, cognisance must be taken of factors affecting the electrochemical
measurement. In this case it is that the reduction of metal ions of oxidation state three is not
reversible in “non-complexing” media such as perchlorate at moderate ionic strengths (around 1
M) and this also pertains to Bi(III).30-33
It was shown that the rate of electron transfer for Bi(III)
reduction in highly acidic solutions increased with the addition of the following anions in
solution: ClO4 < NO3
< Cl
.31
Interestingly, at very high HClO4 concentrations (8 M) the
reduction of Bi(III) becomes fully reversible,34
as well as in solutions of 1 M HClO4 + 7 M
NaClO4 when using DC polarography.35
When solutions of 1 M HClO4 with varying
concentrations of NaClO4 (1 to 8 M) were studied it was clear that the half-wave potential was
dependant on ionic strength.35,36
At moderate ionic strengths, it was reported that the Bi(III)
reduction was found to be fully reversible when chloride was added, but that it never reached full
reversibility in a nitrate medium.30-33
When determining formation constants by polarography,
the relationship employed (Eq. 1) is only valid for reversible reduction potentials.37,38
Since we
wanted to work at moderate ionic strengths so that formation constants generated could have
some application to the biological field, a nitrate background was chosen as the compromise
between solubility of hydrolysis products and reversibility of the reduction process. The
successful study of quasi-reversible systems had been previously been demonstrated,39,40
however, as will be discussed, in this work it was found that the DC reduction waves could
actually be considered as reversible when working in 0.25 - 0.5 M nitrate solutions.
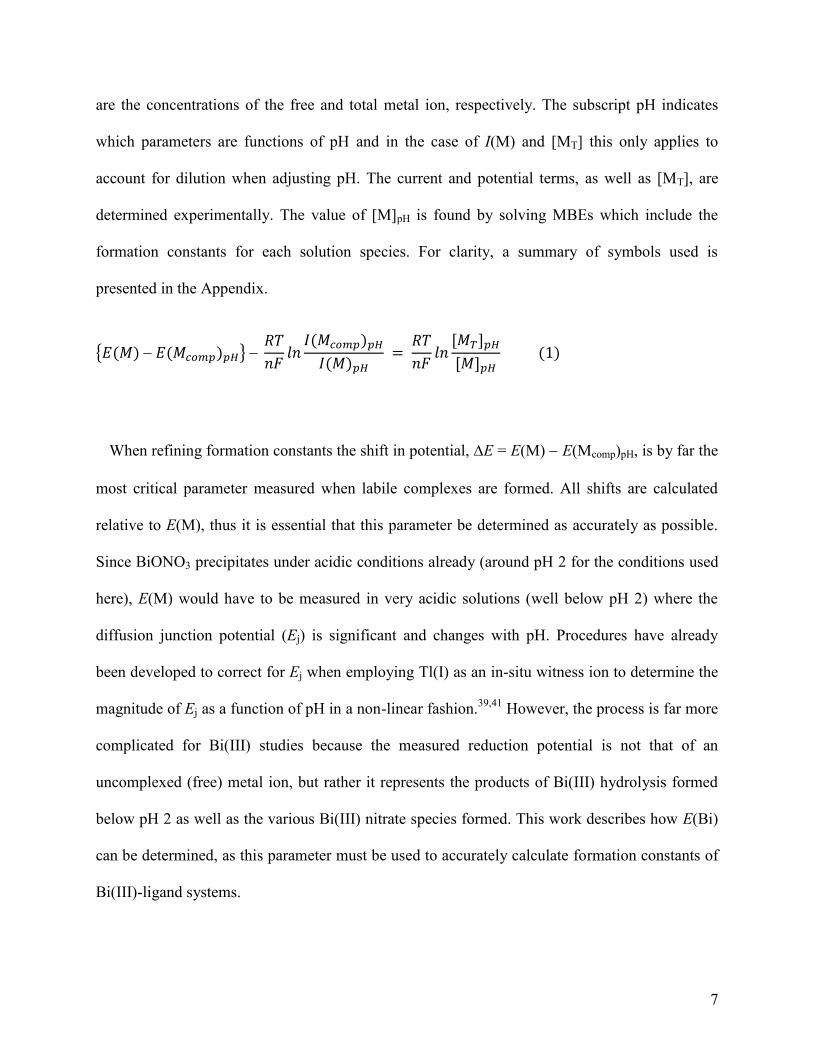
To determine formation constants when employing polarographic-pH titrations, the
relationship used is shown in Eq. 1 below,38,42
where E(M) and E(Mcomp) are the reduction
potentials of the uncomplexed and complexed metal ion, respectively; I(M) and I(Mcomp) are the
reduction currents of the uncomplexed and complexed metal ion, respectively, and [M] and [MT]
7
are the concentrations of the free and total metal ion, respectively. The subscript pH indicates
which parameters are functions of pH and in the case of I(M) and [MT] this only applies to
account for dilution when adjusting pH. The current and potential terms, as well as [MT], are
determined experimentally. The value of [M]pH is found by solving MBEs which include the
formation constants for each solution species. For clarity, a summary of symbols used is
presented in the Appendix.
{ }
When refining formation constants the shift in potential, E = E(M) E(Mcomp)pH, is by far the
most critical parameter measured when labile complexes are formed. All shifts are calculated
relative to E(M), thus it is essential that this parameter be determined as accurately as possible.
Since BiONO3 precipitates under acidic conditions already (around pH 2 for the conditions used
here), E(M) would have to be measured in very acidic solutions (well below pH 2) where the
diffusion junction potential (Ej) is significant and changes with pH. Procedures have already
been developed to correct for Ej when employing Tl(I) as an in-situ witness ion to determine the
magnitude of Ej as a function of pH in a non-linear fashion.39,41
However, the process is far more
complicated for Bi(III) studies because the measured reduction potential is not that of an
uncomplexed (free) metal ion, but rather it represents the products of Bi(III) hydrolysis formed
below pH 2 as well as the various Bi(III) nitrate species formed. This work describes how E(Bi)
can be determined, as this parameter must be used to accurately calculate formation constants of
Bi(III)-ligand systems.
8
2. Experimental
2.1. Materials
All reagents were of analytical grade and deionized water of resistivity 18 M cm was always
used. A stock solution of 0.100 M Tl(I) was made by dissolving TlNO3 (Merck) in 0.5 M HNO3.
A 0.100 M Bi(III) stock solution was made by dissolving Bi(NO3)3.5H2O (Fluka) in concentrated
HNO3 (65%, Merck) and then diluting with water such that a 1 M HNO3 concentration was
obtained.
2.2. Instrumentation
Polarographic experiments were carried out in a jacketed-cell maintained at 25.0 0.1C
which contained a dropping mercury electrode (set to the largest drop size on the Metrohm VA
stand), a Ag/AgCl (3 M KCl) reference electrode in a 0.5 M KNO3 salt bridge, a platinum
counter electrode, a glass electrode (GE) and a thermocouple to monitor the solution
temperature, all supplied by Metrohm. A BAS CV27 potentiostat was used as part of an
automated setup as describe elsewhere.42
Sampled DC polarography was employed with a step
time of 1 s, current integration times of 60100 ms and a step potential of 4 mV.
The GE (Metrohm cat. no. 6.0234.100) was calibrated by the titration of standardised solutions
of 0.5 M HNO3 with 0.5 M KOH (thus pH signifies –log[H+] in this work) and it functioned
extremely well in the highly acidic medium. Since the accurate determination of pH is critical in
this work, any slight deviation from linearity in the very acidic region on the calibration plot was
accounted for as previously described.43

9
2.3. Procedure
Polarographic-pH titration experiments were performed starting with solutions of 0.5 M HNO3
containing Bi(III) and Tl(I). Initially concentrations were 5 105
M Bi(III) and 1 104
M
Tl(I), but later reduced to 1 105
M and 2 105
M, respectively. These solutions were then
titrated with 0.5 M KOH using a pH step of about 0.1, where at each step a polarogram and the
GE potential were recorded. As a consequence of attempting to work at a reasonable ionic
strength (m) of 0.5 M while employing very acidic conditions, m did vary somewhat (especially
between pH 0.3-1) and this will be discussed later. Selected polarograms are shown in Fig. S1.
Because the DC reduction waves for Bi(III) and Tl(I) were well-separated, they were fitted
individually using Eq 2 below44
to determine half-wave potentials (E1/2) and diffusion limited
currents (Id) at each pH step; where Eappl is the applied potential, n is the number of electrons
transferred and measures the steepness of the reduction wave (which should be unity for
reversible electron transfer processes). The terms a + bEappl described the capacitance current and
c{exp(d Eappl)} accounted for the onset of mercury oxidation when fitting the Bi(III) wave or
hydrogen evolution when fitting the Tl(I) wave. The reduction of Tl(I) was fully reversible
across the pH range, as noted before.39,41
Although it was expected that Bi(III) reduction would
be quasi-reversible in a nitrate medium,30,45
the values obtained were very close to one
(typically 0.951.00) provided data points at the onset of mercury oxidation were omitted when
fitting the wave. Therefore, since Id does not change with the extent of reversibility and E1/2 is
dependent on the steepness of the wave, which in this case is Nernstian (since 1 in Eq 2), the
reduction of Bi(III) was considered as reversible for our purpose (see Section 2 of the Supporting
Information for further discussion).

10
3. Results and Discussion
3.1. Initial investigations at “higher” Bi(III) concentrations
Initial investigations were conducted in solutions containing the higher concentrations of
Bi(III) and Tl(I), namely 5 10-5
M and 1 10-4
M, respectively. Precipitation of BiONO3 was
not visually seen, rather it was detected by the rapid drop in Id above pH 1.5 as indicated in Fig.
1a. Powder X-ray diffraction analysis of a precipitate produced from 0.1 M Bi(III) solutions
confirmed that both Bi6O4(OH)4(NO3)6(H2O)4 and Bi6O5(OH)3(NO3)5(H2O)3 were present (see
section 3 of the Supporting Information for details). The initial decrease in Id for both metal ions
at the lowest pH range is due to dilution because large volumes of OH solution are required to
change the pH. Above pH 2.5 only small volumes (2 mL) were required between each pH step,
resulting in very small changes in Id for Tl(I).
Fig. 1b shows E1/2 versus pH for the reduction of Tl(I) and Bi(III), where the range of the
potential scale was set to 40 mV for both axes to enable more direct comparison. The value of
E(M) is independent of pH (when Ej is negligible) and for Tl(I) it was calculated by averaging
the data above pH 2. The variation in potential below pH 2 was due to Ej. Ej of the reference
system in the cell was thus evaluated as follows: Ej = E(Tl) E1/2(Tl) (described in detail
elsewhere39,41
). Ej was determined at each point for each experiment using the Tl(I) data to
account for any slight changes in the setup and reference system. The E1/2(Bi) values were
11
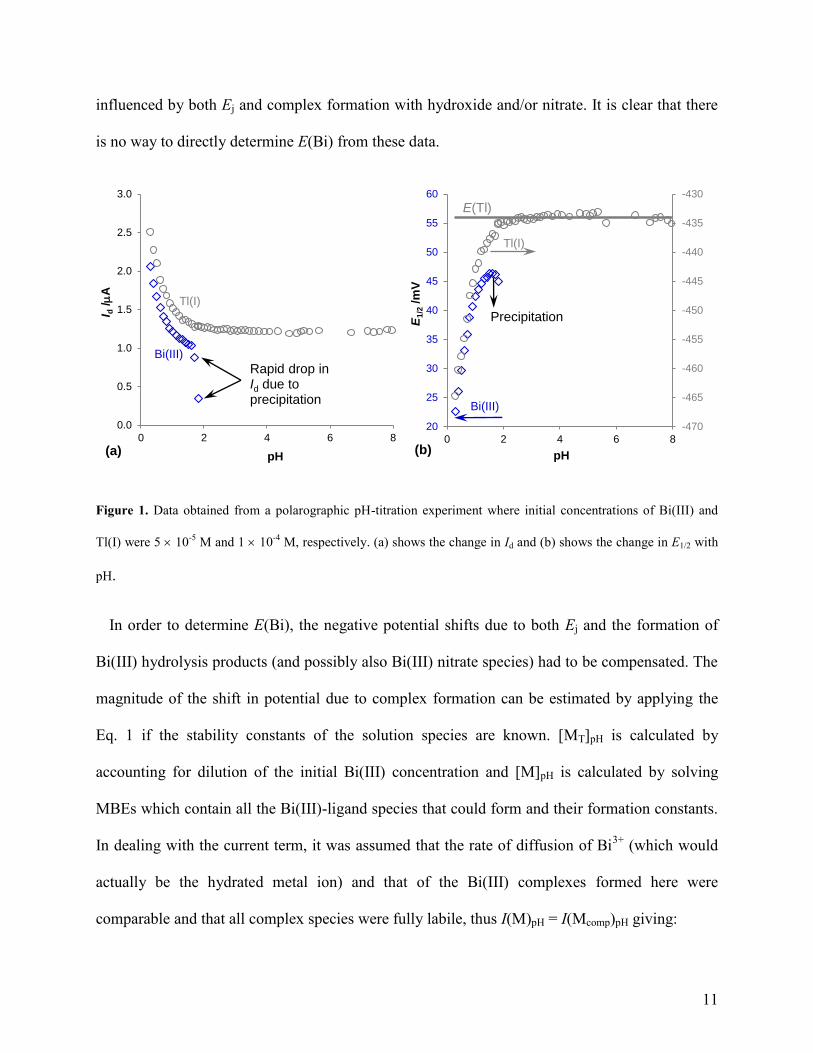
influenced by both Ej and complex formation with hydroxide and/or nitrate. It is clear that there
is no way to directly determine E(Bi) from these data.
Figure 1. Data obtained from a polarographic pH-titration experiment where initial concentrations of Bi(III) and
Tl(I) were 5 10-5
M and 1 10-4
M, respectively. (a) shows the change in Id and (b) shows the change in E1/2 with
pH.
In order to determine E(Bi), the negative potential shifts due to both Ej and the formation of
Bi(III) hydrolysis products (and possibly also Bi(III) nitrate species) had to be compensated. The
magnitude of the shift in potential due to complex formation can be estimated by applying the
Eq. 1 if the stability constants of the solution species are known. [MT]pH is calculated by
accounting for dilution of the initial Bi(III) concentration and [M]pH is calculated by solving
MBEs which contain all the Bi(III)-ligand species that could form and their formation constants.
In dealing with the current term, it was assumed that the rate of diffusion of Bi3+
(which would
actually be the hydrated metal ion) and that of the Bi(III) complexes formed here were
comparable and that all complex species were fully labile, thus I(M)pH = I(Mcomp)pH giving:
0.0
0.5
1.0
1.5
2.0
2.5
3.0
0 2 4 6 8
I d /m
A
pH
Rapid drop in Id due to precipitation
Bi(III)
Tl(I)
(a)
-470
-465
-460
-455
-450
-445
-440
-435
-430
20
25
30
35
40
45
50
55
60
0 2 4 6 8
E1
/2 /m
V
pH
Tl(I)
Bi(III)
E(Tl)
Precipitation
(b)
12
To find the shift in potential due to Bi(III) hydrolysis (EOH) all the Bi(III)-hydroxide species
were included in the MBEs.
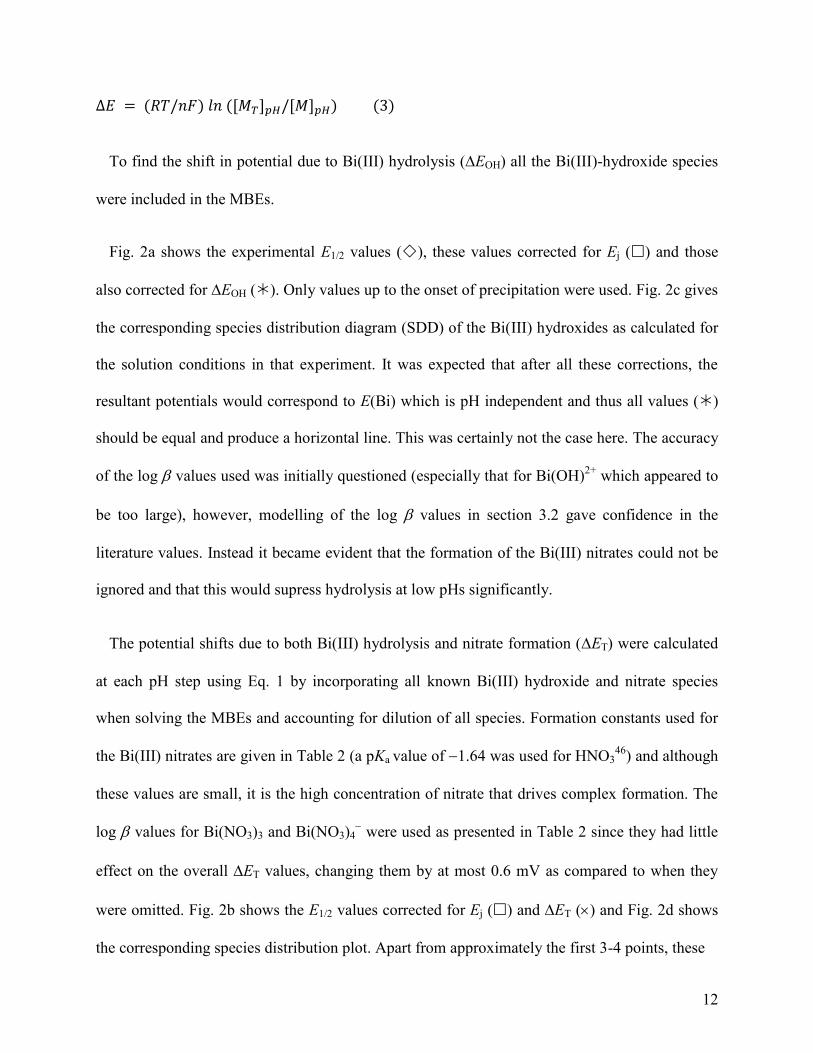
Fig. 2a shows the experimental E1/2 values (), these values corrected for Ej () and those
also corrected for EOH (). Only values up to the onset of precipitation were used. Fig. 2c gives
the corresponding species distribution diagram (SDD) of the Bi(III) hydroxides as calculated for
the solution conditions in that experiment. It was expected that after all these corrections, the
resultant potentials would correspond to E(Bi) which is pH independent and thus all values ()
should be equal and produce a horizontal line. This was certainly not the case here. The accuracy
of the log values used was initially questioned (especially that for Bi(OH)2+
which appeared to
be too large), however, modelling of the log values in section 3.2 gave confidence in the
literature values. Instead it became evident that the formation of the Bi(III) nitrates could not be
ignored and that this would supress hydrolysis at low pHs significantly.
The potential shifts due to both Bi(III) hydrolysis and nitrate formation (ET) were calculated
at each pH step using Eq. 1 by incorporating all known Bi(III) hydroxide and nitrate species
when solving the MBEs and accounting for dilution of all species. Formation constants used for
the Bi(III) nitrates are given in Table 2 (a pKa value of 1.64 was used for HNO346
) and although
these values are small, it is the high concentration of nitrate that drives complex formation. The
log values for Bi(NO3)3 and Bi(NO3)4 were used as presented in Table 2 since they had little
effect on the overall ET values, changing them by at most 0.6 mV as compared to when they
were omitted. Fig. 2b shows the E1/2 values corrected for Ej () and ET () and Fig. 2d shows
the corresponding species distribution plot. Apart from approximately the first 3-4 points, these
13
Figure 2. Experimental E1/2(Bi) values () (initial [Bi(III)] = 5 10-5
M) and those corrected for Ej ().
Corrections were then made for potential shifts due to (a) Bi(OH)2+
and Bi(OH)2+ formation only (*) and (b)
Bi(OH)2+
, Bi(OH)2+ and Bi(III) nitrate species () or just Bi(OH)
2+ and Bi(OH)2
+ in the presence of nitrate (). The
corresponding SDDs are given directly below the E1/2pH plots. (SDDs for the pH range 0-14 are modelled in Fig.
S4a and b.)
values were relatively constant. These values were averaged (omitting the first points such that
the standard deviation was <1 mV) as indicated by the solid line and this represents the true
20
30
40
50
60
70
80
0.2 0.4 0.6 0.8 1.0 1.2 1.4 1.6
Co
mp
en
sa
ted
E1
/2 /m
V
pH (a)
20
30
40
50
60
70
80
0.2 0.4 0.6 0.8 1.0 1.2 1.4 1.6
Co
mp
en
sa
ted
E1
/2 /m
V
pH
EC(Bi)
E(Bi)
(b)
0
10
20
30
40
50
60
70
80
90
100
0.2 0.4 0.6 0.8 1.0 1.2 1.4 1.6
% S
pe
cie
s
pH
Bi3+
Bi(OH)2+
Bi(OH)2+
(c)
0
10
20
30
40
50
0.2 0.4 0.6 0.8 1.0 1.2 1.4 1.6
% S
pe
cie
s
pH
Bi3+
Bi(OH)2+
Bi(OH)2+
Bi(NO3)2+
Bi(NO3)2+
Bi(NO3)3
Bi(NO3)4
(d)

14
E(Bi). Reasons for the first points being too high are due to (i) overcompensation of Ej by about
23 mV, as was noted in previous investigations,39,41
and (ii) changes in ionic strength even
though the variation in nitrate concentration was accounted for when calculating ET (see Fig.
S5 for a comparison of plots for compensated E1/2(Bi) and m against pH).
Table 2. Log values for Bi(III) nitrate species at 25 C.20
Species Log m /M
Bi(NO3)2+
0.72 0.5
Bi(NO3)2+
(0.94) 0.5
Bi(NO3)3 0.7 1.0
Bi(NO3)4 0.6 2.0
The E due to the formation of only the Bi(III) hydroxides in the nitrate supporting electrolyte
(called EOH,C) was also considered, where the presence of nitrates supresses Bi(III) hydroxide
formation. This first required the conditional metal ion concentration ([M]C) at each pH be
determined, which essentially includes the Bi(III) nitrate species, and is calculated as follows:
and %Bi(OH)2+
and %Bi(OH)2+ are shown in Fig. 2d. EOH,C was then calculated using Eq. 1
(and substituting the value of [M]C instead of [M]). Corrections due only to Ej and EOH,C are
also indicated in Fig. 2b (). These values were also relatively constant and the averaged value
(omitting the first 2 points due to Ej overcompensation) is given as a solid line which was called
the conditional E(Bi) (EC(Bi)) as this would only apply to nitrate solutions of these
concentrations.

15
3.2. Justification of log values for mononuclear Bi(III) hydroxides
Barnum47
established that for most metal ions, the standard free energy of formation of the
M(OH)y species (for the hydrolysis reaction Mn+
+ yH2O ⇌ M(OH)y +yH+ with formation
constant *1y) plotted against the number of coordinated hydroxide ions (y) yielded a smooth
curve. Consequently he defined the function given in Eq. 5 below where the plot of U{M(OH)y}
versus y gives a straight line with slope C and intercept B (on the U-axis), and B, C and D are
empirical constants. Barnum47
found the value of D to be 8.37 kJ mol-1
for di- and trivalent metal
ions and zero for tetravalent metal ions (at m = 0 M and 25C).
Alternatively, U{M(OH)y} can also be calculated using the formation constants, as shown in Eq.
6.47
The plot of U{M(OH)y} versus y would allow unknown formation constants to be predicted
or disparate values to be highlighted. Disparity may, however, not only signify experimental
error in data, but may simply indicate failure of the empirical equations or something unusual
about the structure or stability of the complex.47
The log 1y values (for reactions written as Mn+
+ yOH ⇌ M(OH)y) in Table 1 at both m = 0
and 0.5 M were converted to log *1y values using log *1y = log 1y y log Kw where log Kw is
13.994 for m = 0 M and 13.74 for m = 0.5 M at 25C.20
Log 12 values of 24.5 and 23.5 were used
at m = 0 and 0.5 M, respectively, where the former was roughly estimated using the Davies

16
equation. U{M(OH)y} was then calculated using the Eq. 6 (setting fo = -237.19 kJ mol
-
1)47
and the results are presented in Fig. 3a. Although the values of the empirical constant D and
fo really apply to m = 0 M at 25C, both plots were given since the value of log 11 at m
= 0.5 M was in question.
Figure 3. (a) U{Bi(OH)y} plotted as a function of y for both m = 0 and 0.5 M. The trendlines were fitted by omitting
the values at y = 3. (b) U{M(OH)y} plotted as a function of y for several trivalent metal ions at m = 0 M and 25 C.
Trendlines were fitted by omitting the value at y = 3, except for Fe3+
data.
Fig. 3a illustrates that the points were on a straight line except for U{M(OH)3} which could
imply that the log 13 value was too high (it was predicted to be 30.1 for m = 0.5 M when
applying the trendline equation). However, this unusual stability may be due to the
electroneutrality of this species. Similar plots are given in Fig. 3b for other trivalent metal ions
(calculated at 25 C and m = 0 M) and with the exception of Fe(III), all plots showed a lower
than predicted log 13 value. Thus confidence in the literature log 1y values was established and
initial speculation that the log 11 was too large was unfounded. This procedure suggested by
y = 10.649x - 330.09 R² = 0.9995
y = 10.535x - 248.6 R² = 0.9998
-340
-320
-300
-280
-260
-240
-220
-200
0 1 2 3 4
U {
Bi(
OH
) y}
y
m = 0.5 M
m = 0 M
(a)
-270
-260
-250
-240
-230
-220
-210
-200
0 1 2 3 4
U {
M(O
H) y
}
y
In3+
Fe3+
Tl3+
As3+
(b)
17
Barnum47
certainly is a useful tool in assessing the validity of metal hydroxide formation
constants.
3.3. Kinetics of precipitate formation
It was observed that the rate of the titration experiment affected the pH at which precipitation
occurred. To test if this was merely due to kinetically slow precipitate formation, as suggested by
Moussa and Sammour31
, the time interval between addition of OH to the test solution and the
collection of polarographic data was set to range from 1060 minutes for different titration
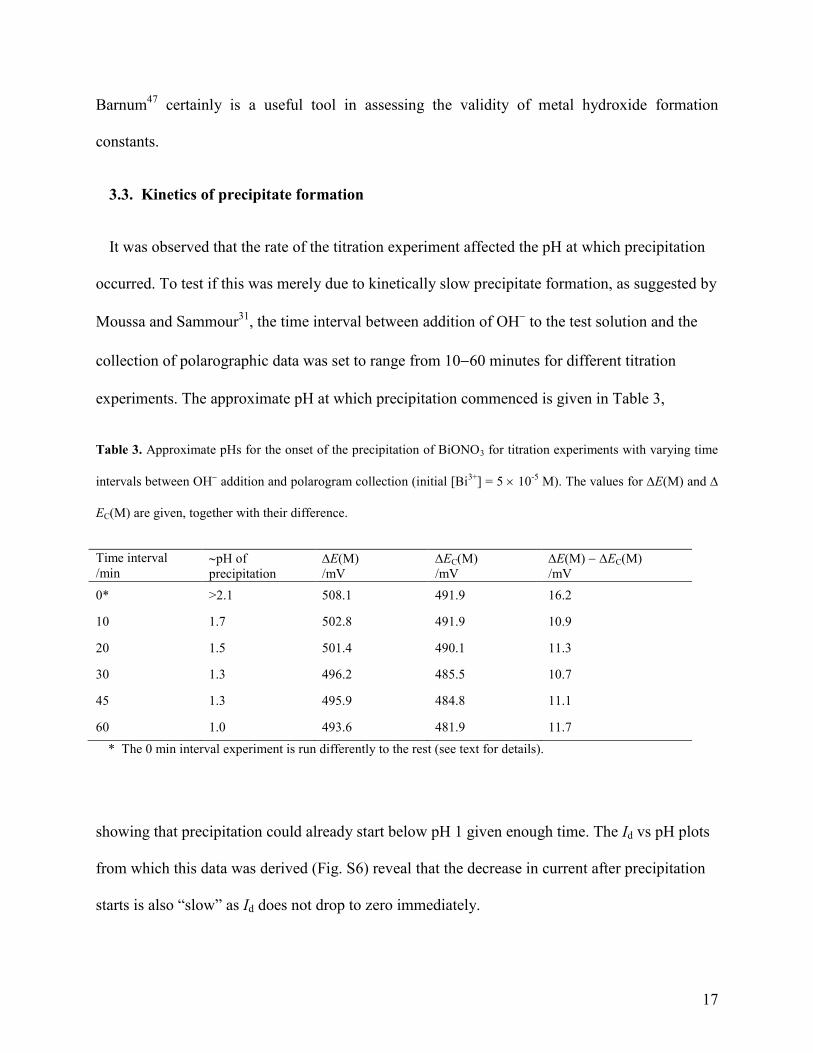
experiments. The approximate pH at which precipitation commenced is given in Table 3,
Table 3. Approximate pHs for the onset of the precipitation of BiONO3 for titration experiments with varying time
intervals between OH addition and polarogram collection (initial [Bi
3+] = 5 10
-5 M). The values for E(M) and
EC(M) are given, together with their difference.
Time interval
/min pH of
precipitation
E(M)
/mV
EC(M)
/mV
E(M) EC(M)
/mV
0* >2.1 508.1 491.9 16.2
10 1.7 502.8 491.9 10.9
20 1.5 501.4 490.1 11.3
30 1.3 496.2 485.5 10.7
45 1.3 495.9 484.8 11.1
60 1.0 493.6 481.9 11.7
* The 0 min interval experiment is run differently to the rest (see text for details).
showing that precipitation could already start below pH 1 given enough time. The Id vs pH plots
from which this data was derived (Fig. S6) reveal that the decrease in current after precipitation
starts is also “slow” as Id does not drop to zero immediately.
18
It was also important to establish whether the value of E(Bi) or EC(Bi) was affected by the rate
of the experiment. Since the experimental E1/2 values varied slightly between experiments due to
small variations in the reference system, the differences E(M) = E(Bi) E(Tl) and EC(M) =
EC(Bi) E(Tl) were rather considered thus using Tl(I) as an internal reference. From the results
in Table 3 it was noted that as the time interval between addition of OH and recording of the
polarogram increased, both E(M) and EC(M) decreased. This could point to some BiONO3
initially forming in solution before precipitation occurs and that formation of this product in both
the solution and solid phase is slow. The slow kinetics probably signifies that the hexanuclear
species also forms at the Bi(III) concentrations used here. Consequently, the higher the
concentration of BiONO3 in solution, the greater the shift in E1/2(Bi) to less positive values and
since this species was not accounted for when calculating ET or EOH, it would make the values
regarded as E(Bi) and EC(Bi) less positive and hence E(M) and EC(M) smaller.
An experiment was also run as fast as possible by preparing solutions between pH 0.32.1 by
mixing 0.5 M HNO3 and 0.5 M KNO3, thus keeping the nitrate concentration relatively constant.
The solutions were deoxygenated and just before pH was accurately measured and a polarogram
was collected, the Bi(III) stock solution was added. No precipitation was initially evident up to
pH 2.11, even with the concentration of Bi(III) kept constant at 5 10-5
M for all solutions in
this case. The polarogram at pH 2.11 was remeasured after 2 min and a 28% drop in Id was
observed, and after another 2 min wait the Id dropped a further 58%. A polarogram at pH 1.52
was also remeasured after 2 min and only a 11% drop in Id was noted. Although this procedure is
not feasible to run on a routine basis or to allow metal-ligand systems to reach equilibrium
(unless the reaction is extremely fast) it did show that precipitate formation is slow.
19
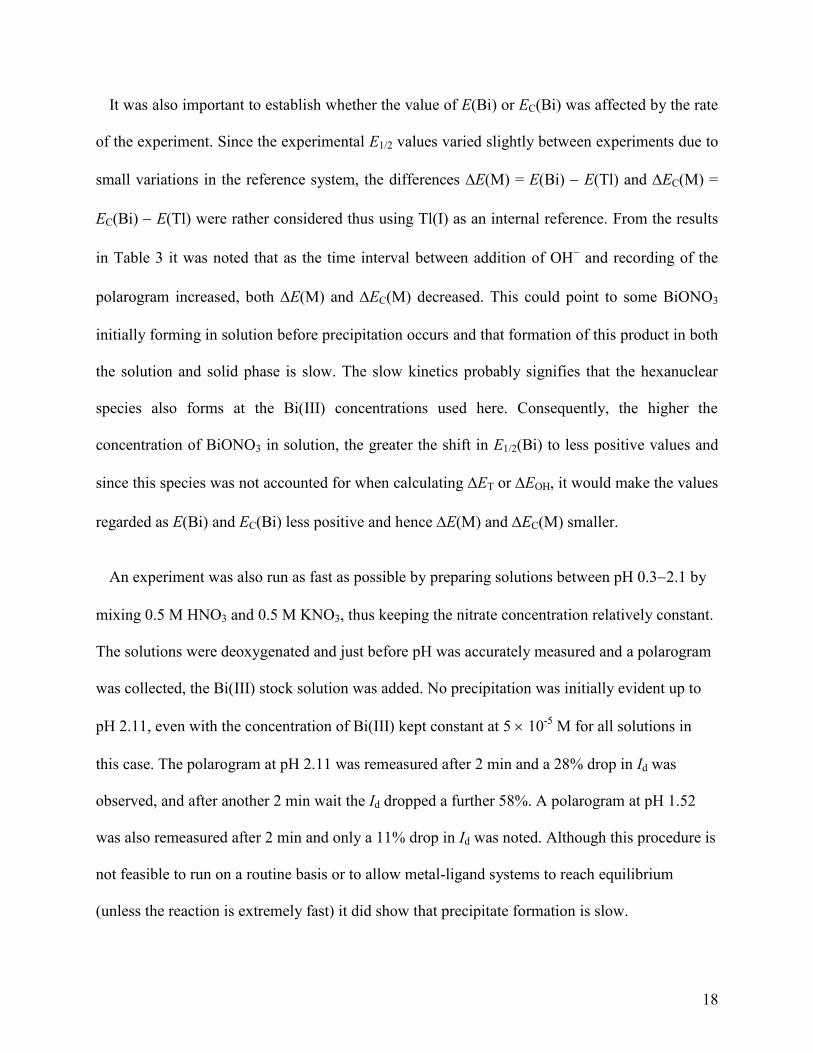
Figure 4. For the experiment with time interval of 0 min the following data is shown: (a) Experimentally determined
E1/2(Bi) values () (constantly at [Bi(III)] = 5 10-5
M and [NO3] 0.5 M) and that corrected for Ej ().
Corrections were then made for ET () or EOH (). (b) The corresponding SDD is given.
The compensated E1/2(Bi) values for this experiment are shown in Fig. 4, as before, together
with the corresponding SDD. In this case the first few points at the lowest pH where E1/2 values
were corrected for Ej and ET () were not higher than the rest as previously seen in Fig. 2. This
supports the suggestion that the variation is due to the change in ionic strength since in this case
it is kept constant at 0.5 M. This also explains the high E(M) value shown in Table 3. In Fig. 4a
the data corrected for ET () and EOH () show a decreasing trend above pH 1.7 and these
points were omitted when determining E(M) and EC(M). This decreasing trend could be due
to the formation of a solution species at the higher pHs that was not accounted for in the potential
shift calculations and is probably the slightly soluble hexameric BiONO3 species. Given
sufficient time this would form colloids which precipitate from solution as seen by the
decreasing Id discussed above. It is interesting to note how well this correlates to the pH of
precipitation for the experiment with the 10 min interval (Table 3).
20
30
40
50
60
70
80
0.2 0.4 0.6 0.8 1.0 1.2 1.4 1.6 1.8 2.0 2.2
Co
mp
en
sa
ted
E1
/2 /m
V
pH
E(Bi)
EC(Bi)
(a)
0
10
20
30
40
50
0.2 0.4 0.6 0.8 1.0 1.2 1.4 1.6 1.8 2.0 2.2
% S
pe
cie
s
pH
Bi(NO3)2+
Bi(NO3)2+
Bi(NO3)3
Bi(NO3)4
Bi3+
Bi(OH)2+
Bi(OH)2+
(b)
20
The E(M) and EC(M) values for the interval times 1020 min are within experimental error
and therefore the timing for the usual titration experiments should not affect the values of EC(Bi)
and E(Bi) obtained. Even the EC(M) value for the 0 min experiment was comparable to the
values at 1020 min intervals. The E(M) value for the 0 min experiment was significantly
higher than the rest because of the higher nitrate concentration. Interestingly for the 1060 min
interval experiments, the difference between E(M) and EC(M) is constant (11.4 0.4 mV)
irrespective of the time interval.
Berbel et al.48
showed that polarographic data (considering both the negative shifts in potential
and decreasing currents) can be used to determine the solubility product of a sparingly soluble
salt. If this was to be done for this system, an out-of-cell approach would have to be used due to
the slow formation of the insoluble product and thus allowing sufficient time for equilibrium to
be established. This was not the aim here and experiments were run as quickly as possible to
prevent precipitate formation as far as possible.
3.4. Investigations at “lower” Bi(III) concentrations
In order to postpone precipitation and increase the pH range in which data could be collected,
the concentration of Bi(III) (and Tl(I)) was decreased five times and the current integration time
was increased from 60 ms to 100 ms to still obtain reasonable polarograms. According to the
pBi-pH diagram by Kragten et al.,22
by changing the Bi(III) concentration from 5 105
M to 1
105
M, the pH of precipitation would be shifted by almost a pH unit. Two issues immediately
came to the fore. Firstly, oxygen contamination introduced by OH addition became more
evident and the test solution had to be purged for longer after pH adjustment (increased from 15
s to 5 min) yet still minimising BiONO3 formation. Secondly, in order to obtain values close to
21
unity (indicating reversibility), data points at the most positive potentials that showed curvature
due to mercury oxidation had to be removed when fitting the Bi(III) reduction waves because the
parameters for fitting the background current are strongly correlated to Id and . The position of
mercury oxidation wave also shifts to more negative potentials with increasing pH, so amending
the initial potential of the polarogram slightly only solves the problem to a point.
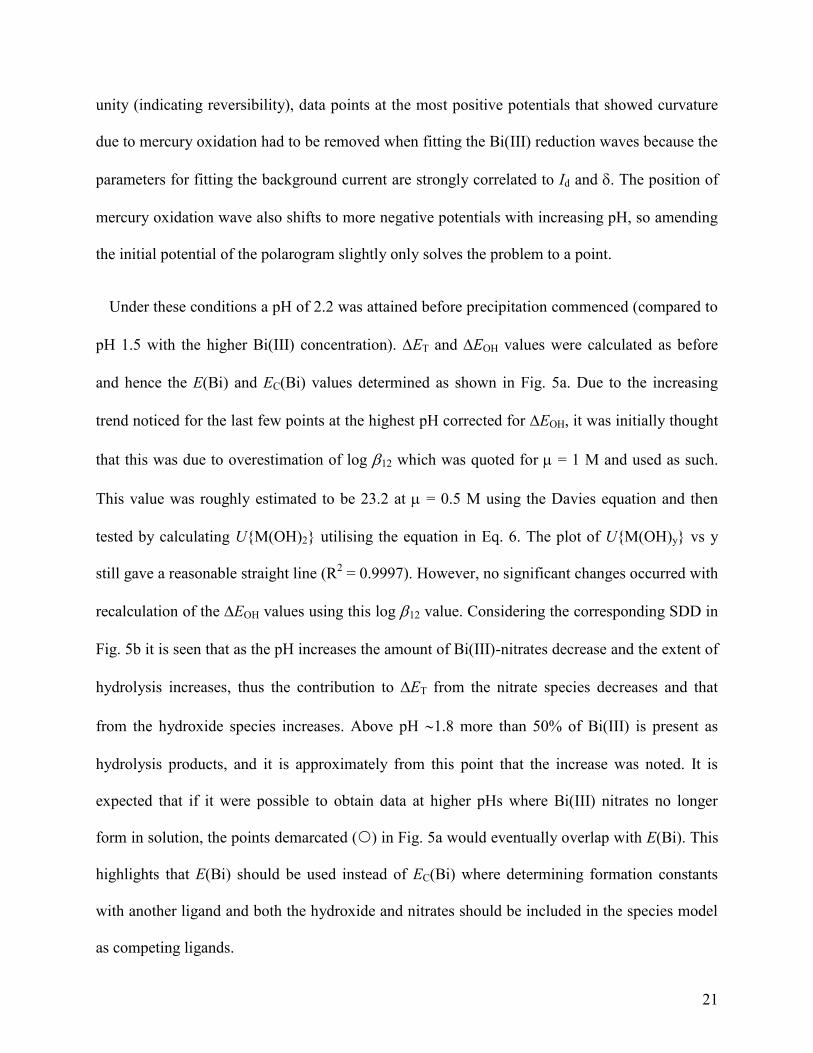
Under these conditions a pH of 2.2 was attained before precipitation commenced (compared to
pH 1.5 with the higher Bi(III) concentration). ET and EOH values were calculated as before
and hence the E(Bi) and EC(Bi) values determined as shown in Fig. 5a. Due to the increasing
trend noticed for the last few points at the highest pH corrected for EOH, it was initially thought
that this was due to overestimation of log 12 which was quoted for m = 1 M and used as such.
This value was roughly estimated to be 23.2 at m = 0.5 M using the Davies equation and then
tested by calculating U{M(OH)2} utilising the equation in Eq. 6. The plot of U{M(OH)y} vs y
still gave a reasonable straight line (R2 = 0.9997). However, no significant changes occurred with
recalculation of the EOH values using this log 12 value. Considering the corresponding SDD in
Fig. 5b it is seen that as the pH increases the amount of Bi(III)-nitrates decrease and the extent of
hydrolysis increases, thus the contribution to ET from the nitrate species decreases and that
from the hydroxide species increases. Above pH 1.8 more than 50% of Bi(III) is present as
hydrolysis products, and it is approximately from this point that the increase was noted. It is
expected that if it were possible to obtain data at higher pHs where Bi(III) nitrates no longer
form in solution, the points demarcated () in Fig. 5a would eventually overlap with E(Bi). This
highlights that E(Bi) should be used instead of EC(Bi) where determining formation constants
with another ligand and both the hydroxide and nitrates should be included in the species model
as competing ligands.

22
Figure 5. (a) Experimental E1/2(Bi) values () (initial [Bi(III)] = 1 10-5
M) and that corrected for Ej ().
Corrections were then made for potential shifts due to (i) Bi(OH)2+
, Bi(OH)2+ and Bi(III) nitrate species (), or (ii)
Bi(OH)2+
and Bi(OH)2+ in the presence of nitrate (). Points that are bold were omitted when calculating E(Bi) or
EC(Bi) (such that the standard deviation was <1). (b) The corresponding SDD is given. (The SDD for the pH range
0-14 is modelled in Figure S4c.)
For completeness, it was again tested if the interval time affected the E(Bi) or EC(Bi) values by
comparing E(M) or EC(M) values, respectively, and the results are given in Table 4. For both
E(M) and EC(M) the values in the 520 min interval times were within experimental error
and, for some unknown reason, corresponded to those given in Table 3 with 30 and 45 minute
intervals. Using the lower Bi(III) concentration in these experiments provided more data points
to calculate the E(Bi) and EC(Bi) values in each experiment, thus giving more confidence to the
results.
10
20
30
40
50
60
70
0.2 0.4 0.6 0.8 1.0 1.2 1.4 1.6 1.8 2.0 2.2 2.4
Co
mp
en
sa
ted
E1
/2 /m
V
pH
EC(Bi)
E(Bi)
(a)
0
10
20
30
40
50
60
70
0.2 0.4 0.6 0.8 1.0 1.2 1.4 1.6 1.8 2.0 2.2 2.4
% S
pe
cie
s
pH
Bi(OH)2+
Bi(NO3)2+
Bi(NO3)2+
Bi(NO3)3
Bi(NO3)4
Bi(OH)2+ Bi3+
(b)
23
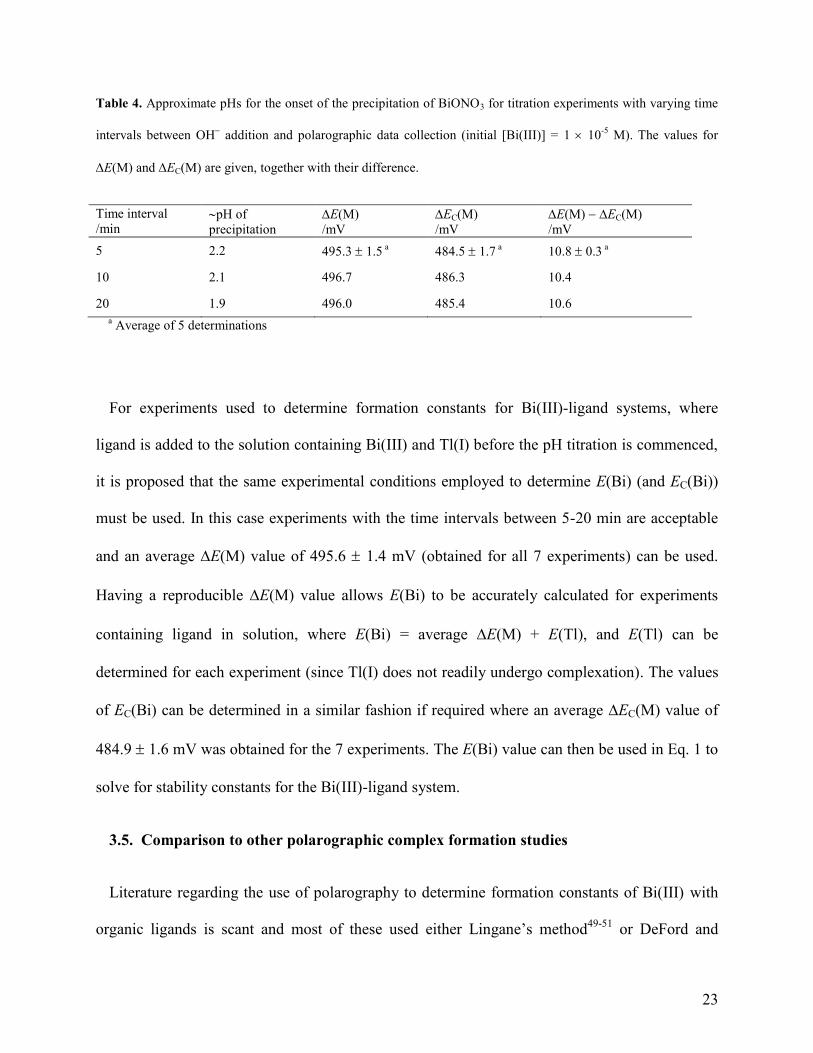
Table 4. Approximate pHs for the onset of the precipitation of BiONO3 for titration experiments with varying time
intervals between OH addition and polarographic data collection (initial [Bi(III)] = 1 10
-5 M). The values for
E(M) and EC(M) are given, together with their difference.
Time interval
/min pH of
precipitation
E(M)
/mV
EC(M)
/mV
E(M) EC(M)
/mV
5 2.2 495.3 1.5 a 484.5 1.7
a 10.8 0.3
a
10 2.1 496.7 486.3 10.4
20 1.9 496.0 485.4 10.6
a Average of 5 determinations
For experiments used to determine formation constants for Bi(III)-ligand systems, where
ligand is added to the solution containing Bi(III) and Tl(I) before the pH titration is commenced,
it is proposed that the same experimental conditions employed to determine E(Bi) (and EC(Bi))
must be used. In this case experiments with the time intervals between 5-20 min are acceptable
and an average E(M) value of 495.6 1.4 mV (obtained for all 7 experiments) can be used.
Having a reproducible E(M) value allows E(Bi) to be accurately calculated for experiments
containing ligand in solution, where E(Bi) = average E(M) + E(Tl), and E(Tl) can be
determined for each experiment (since Tl(I) does not readily undergo complexation). The values
of EC(Bi) can be determined in a similar fashion if required where an average EC(M) value of
484.9 1.6 mV was obtained for the 7 experiments. The E(Bi) value can then be used in Eq. 1 to
solve for stability constants for the Bi(III)-ligand system.
3.5. Comparison to other polarographic complex formation studies
Literature regarding the use of polarography to determine formation constants of Bi(III) with
organic ligands is scant and most of these used either Lingane’s method49-51
or DeFord and
24
Hume’s method52-54
to calculate formation constants. Lingane’s method is limited as it applies
only to ligand titrations where there is a single predominant complex in solution at a time.
DeFord and ume’s method also includes the reduction potential of the uncomplexed metal ion
in the calculations,55
but the actual value used was not mentioned in any of the publications.52-54
Bond and Waugh56
also used DeFord and ume’s method to determined formation constants
for the Bi(III)-chloride complexes using AC polarography by ligand titration in 2.0 M
perchlorate solutions at pH 1. They assumed hydrolysis is negligible at pH 1 and according to
Fig. S4a in a non-complexing background 30% Bi(OH)2–
would be present, but since this would
result in a very small shift in potential (around 1 mV) the assumption would hold. However, the
reduction of Bi(III) is not reversible in 2.0 M perchlorate solutions and the reversible E(Bi) could
not be directly measured. On addition of low concentrations of chloride (0.004 M – double the
concentration of Bi(III) in solution) the reduction of Bi(III) becomes reversible and thus from the
plot of the reduction peak potentials vs. chloride concentration, the reversible E(Bi) value was
determine by extrapolating to zero chloride concentration. As the authors state, this reduces the
precision of the value of E(Bi). Additionally, this methodology would only apply to Bi(III)-
ligand systems which form strong complexes at pH 1 already at low ligand-to-Bi(III)
concentration ratios, which would not be the case for many organic ligands.
Cukrowski et al.57
determined the E(Bi) by collecting polarographic data in the absence of
ligand (in 0.5 M nitrate background solution), correcting the measured E1/2(Bi) values for shifts
in potential due to Bi(III) hydroxide formation and then fitted a third order polynomial to these
corrected E1/2(Bi) values. The function was extrapolated to a constant value which was defined
as E(Bi). The difference between this E(Bi) and the corrected E1/2(Bi) values was ascribed to Ej,
but this would mean they obtained an Ej of 55 mV at pH 0.3, whereas the value should be
25
closer to 30 mV. It therefore appears that shifts due to Bi(III) nitrate formation were
inadvertently largely accounted for in the acidic region.
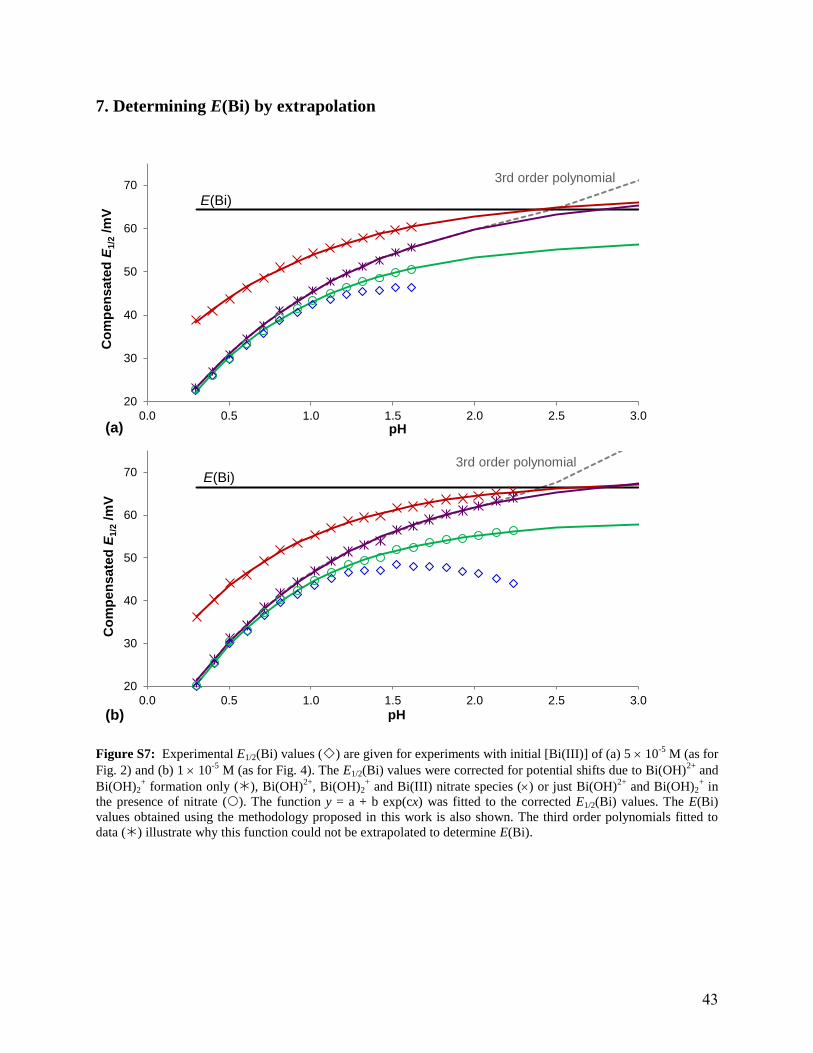
For comparison, it was attempted to determine E(Bi) using the same procedure as Cukrowski
et al.57
Experimental E1/2(Bi) values, as presented in Fig.’s and 4, were firstly corrected for
shifts in potential due to hydroxide formation, ignoring the formation of nitrate species (see Fig
S7 in the Supporting Information). Extrapolating the third order polynomial was impossible as
the function increased after the last data point, so instead the function y = a + b exp(cx) was fitted
to the data, with the value of a (i.e. the extrapolated value) corresponding to E(Bi). It should be
noted that although Bi(OH)2+ was not incorporated in the species model used by Cukrowski et
al.,57
it was included here. The experimental E1/2(Bi) values were also correct for shifts in
potential due to the formation of both Bi(III) hydroxide and Bi(III) nitrate species, and
extrapolated in the same way. The results in Table 6 showed that E(Bi) was slightly
overestimated when extrapolating in each case and there was some agreement between the
values determined from data corrected for just the Bi(III) hydroxide species and that corrected
for Bi(III) hydroxide and nitrate species. Values at the higher p ’s, where the extent of nitrate
formation is minimal, has the greatest influence on the extrapolated value, so this was not
surprising. In solutions with the lower Bi(III) concentration, data could be collected to higher
pHs before precipitation occurred. Testing to what extent the extrapolated value was affected by
having fewer data points (points only up to pH 1.6 were considered) showed there was a greater
influence on the data where only the Bi(III) hydroxides were accounted for, probably due to the
steeper curve at higher pHs. By correcting the experimental E1/2(Bi) values for shifts in potential
due only to the Bi(III) hydroxides in the presence of nitrate, the extrapolated value was compared
to the EC(Bi) and again the extrapolated values were overestimated.
26
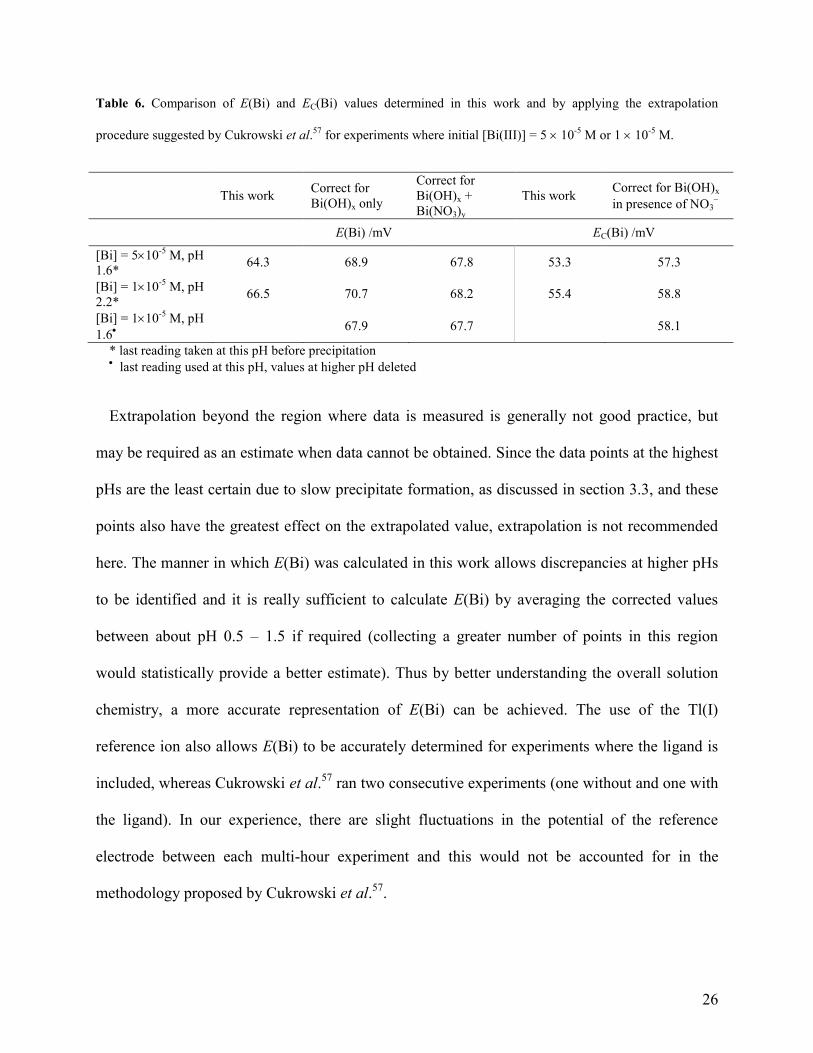
Table 6. Comparison of E(Bi) and EC(Bi) values determined in this work and by applying the extrapolation
procedure suggested by Cukrowski et al.57
for experiments where initial [Bi(III)] = 5 10-5
M or 1 10-5
M.
This work Correct for
Bi(OH)x only
Correct for
Bi(OH)x +
Bi(NO3)y
This work Correct for Bi(OH)x
in presence of NO3
E(Bi) /mV EC(Bi) /mV
[Bi] = 510-5
M, pH
1.6* 64.3 68.9 67.8 53.3 57.3
[Bi] = 110-5
M, pH
2.2* 66.5 70.7 68.2 55.4 58.8
[Bi] = 110-5
M, pH
1.6
67.9 67.7 58.1
* last reading taken at this pH before precipitation last reading used at this pH, values at higher pH deleted
Extrapolation beyond the region where data is measured is generally not good practice, but
may be required as an estimate when data cannot be obtained. Since the data points at the highest
pHs are the least certain due to slow precipitate formation, as discussed in section 3.3, and these
points also have the greatest effect on the extrapolated value, extrapolation is not recommended
here. The manner in which E(Bi) was calculated in this work allows discrepancies at higher pHs
to be identified and it is really sufficient to calculate E(Bi) by averaging the corrected values
between about pH 0.5 – 1.5 if required (collecting a greater number of points in this region
would statistically provide a better estimate). Thus by better understanding the overall solution
chemistry, a more accurate representation of E(Bi) can be achieved. The use of the Tl(I)
reference ion also allows E(Bi) to be accurately determined for experiments where the ligand is
included, whereas Cukrowski et al.57
ran two consecutive experiments (one without and one with
the ligand). In our experience, there are slight fluctuations in the potential of the reference
electrode between each multi-hour experiment and this would not be accounted for in the
methodology proposed by Cukrowski et al.57
.
27
3. Conclusion
This work clearly illustrates the complexities involved in studying Bi(III) complex formation.
Precipitation of the hexameric BiONO3 species occurred around pH 2, thus it was thus necessary
to commence the study at pH <2 where Bi(III) is still in solution and resulting in Ej having to be
evaluated and compensated. Also, the formation of soluble hydrolysis products occurs from pH
0.3 already and nitrate complexes are formed at low pH, which suppresses the extent of
hydrolysis somewhat but also results in only about 15% of Bi(III) being uncomplexed at pH 0.3
(see Fig. S4b and c). Therefore all these factors had to considered when determining E(Bi).
In order to best predict E(Bi) as accurately as possible for an experiment used to study Bi(III)-
ligand equilibria, the average difference between E(Bi) and E(Tl) (i.e. E(M), where Tl(I) was
the in-situ reference ion since it is not readily complexed) was first determined for several
experiments in the absence of ligand. For experiments including ligand, E(Tl) for that
experiment was measured and E(Bi) can be determined using the average E(M). Also, when
refining stability constants, both nitrate and hydroxide must be incorporated in the species model
as competing ligands. This process will be applied to the study of Bi(III)-ligand equilibria, thus
enabling a knowledge-base for Bi(III) coordination chemistry to be built.
4. Appendix: Description of selected symbols
Ej Diffusion junction potential
E1/2(M) Half-wave potential of the metal ion
E(M) eduction potential of the free or uncomplexed metal ion (true free metal ion
potential)
28
E(Mcomp) Reduction potential of the complexed metal ion
EC(M) Conditional free metal ion potential
E Shift in potential due to complex formation: E = E(M) E(Mcomp)
EOH Shift in potential due to the formation of Bi(III) hydroxide species
EOH,C Shift in potential due to the formation of Bi(III) hydroxide species in the nitrate
supporting electrolyte, taking into account the suppression of hydroxide formation in
the presence of nitrates.
ET Shift in potential due to the formation of Bi(III) hydroxide and nitrate species
combined
E(M) Difference in the free metal ion potentials for Bi(III) and Tl(I): E(M) = E(Bi)
E(Tl)
EC(M) Difference in the conditional and true free metal ion potentials for Bi(III) and Tl(I)
respectively: EC(M)= EC(Bi) E(Tl)
I(M) Reduction current of the uncomplexed metal ion
I(Mcomp) Reduction current of the complexed metal ion
[M] Concentration of the free metal ion
[MT] Concentration of the total metal ion
29
[M]C Conditional concentration of the free metal ion which includes the Bi(III) nitrate
species
AUTHOR INFORMATION
Corresponding Author
*e-mail: [email protected]
Tel: +27 11 717-6768
Author Contributions
The manuscript was written through contributions of all authors. All authors have given approval
to the final version of the manuscript.
ACKNOWLEDGEMENT
This work is based on the research supported by the National Research Foundation (NRF) of
South Africa and the University of the Witwatersrand. Any opinion, finding and conclusion or
recommendation expressed in this material is that of the authors and the NRF does not accept
responsibility in this regard.
REFERENCES
(1) Berners-Price, S.J.; Sadler, P.J. Coordination Chemistry of Metallodrugs: Insights into Biological
Speciation from NMR Spectroscopy. Coord Chem. Rev. 1996, 151, 1-40.
(2) Briand, G.; Burford, N. Bismuth Compounds and Preparations with Biological or Medicinal
Relevance. Chem. Rev. 1999, 99, 2601-2657.
30
(3) Sadler, P.J.; Li, H.; Sun, H. Coordination Chemistry of Metals in Medicine: Target Sites for
Bismuth. Coord Chem. Rev. 1999, 185-186, 689-709.
(4) Hassfjell, S.; Brechbiel, M.W. The Development of the α-Particle Emitting Radionuclides 212Bi
and 213Bi, and their Decay Chain Related Radionuclides for Therapeutic Applications. Chem. Rev.
2001, 101, 2019-2036.
(5) Tiekink, E.R.T. Antimony and Bismuth Compounds in Oncology. Crit. Rev. Oncol. Hematol. 2002,
42, 217-224.
(6) Yang, N.; Sun, H. Biocoordination Chemistry of Bismuth: Recent Advances. Coord Chem. Rev.
2007, 251, 2354-2366.
(7) Yang, Y.; Ouyang, R.; Xu, L.; Guo, N.; Li, W.; Feng, K.; Ouyang, L.; Yang, Z.; Zhou, S.; Miao,
Y.; Review: Bismuth Complexes: Synthesis and Applications in Biomedicine. J. Coord. Chem.
2015, 68, 379–397.
(8) Baes, C.F. Jr; Mesmer, R.E. The Hydrolysis of Cations, John Wiley and Sons Inc., New York,
USA, 1976
(9) Smith, D.F. The Condition of Bismuth Salts in Aqueous Solutions and the Molal Electrode-
Potential of Bismuth. J. Am. Chem. Soc. 1923, 45, 360-370.
(10) Graner, F.; Olin, A.; Sillén, L.G. On the Hydrolysis of the Bi3+
Ion – A Preliminary Note. Acta
Chem. Scand. 1956, 10, 476.
(11) Olin, A. Studies on the Hydrolysis of Metal Ions. 19. The Hydrolysis of Bismuth(III) in
Perchlorate Medium. Acta Chem. Scand. 1957, 11, 1445-1456.
(12) Graner, F.; Sillén, L.G. On the Hydrolysis of the Bi3+
Ion. Repeated Oxygen Bridging: A New
Type of Ionic Equilibrium. Acta Chem. Scand. 1947, 1, 631-655.

31
(13) Holmberg, R.W.; Kraus, K.A.; Johnson, J.S. Hydrolytic Behavior of Metal Ions. VIII.
Ultracentrifugation of Bismuth(III) in Perchlorate Solution. J. Am. Chem. Soc. 1956, 78, 5506-
5510.
(14) Olin, A. Studies on the Hydrolysis of Metal Ions. 23. Hydrolysis of the Ion Bi6(OH)126+
in
Perchlorate Medium. Acta Chem. Scand. 1959, 13, 1791-1808.
(15) Tobias, S. J. Studies on Hydrolyzed Bismuth(III) Solutions. Part I. E.m.f. Titrations. Am. Chem.
Soc. 1960, 82, 1070-1072.
(16) Tobias, S.; Tyree, S.Y. Studies on Hydrolyzed Bismuth(III) Solutions. II. Light Scattering. J. Am.
Chem. Soc. 1960, 82, 3244-3249.
(17) Maroni V.A.; Spiro, T.G. The Vibrational Spectrum of the Hydrolytic Hexamer of Bismuth(III).
J. Am. Chem. Soc. 1966, 88, 1410 -1412.
(18) Hataye, I.; Suganuma, H.; Ikegami, H.; Kuchiki, T. Solvent Extraction Study on the Hydrolysis of
Tracer Concentrations of Bismuth(III) in Perchlorate and Nitrate Solutions. Bull. Chem. Soc. Jpn.
1982, 55, 1475-1479.
(19) Bidleman, T.F. Bismuth-Dithizone Equilibria and Hydrolysis of Bismuth Ion in Aqueous
Solution. Anal. Chim. Acta 1971, 56, 221-231.
(20) Martell, A.E.; Smith, R.M. Motekaitis, R.J. NIST Standard Reference Database 46 Version 8.0.
NIST Critically Selected Stability Constants of Metal Complexes Database, Gaithersburg, USA,
2004
(21) Cukrowski, I.; Hancock, R.D.; Luckay, R.C. Formation Constant Calculation for Non-Labile
Complexes Based on a Labile Part of the Metal-Ligand System. A Differential Pulse Polarographic

32
Study at Fixed Ligand to Metal Ratio and Varied pH: Application to Polarographically Inactive
Complexes. Anal. Chim. Acta 1996, 319, 39-48.
(22) Kragten, J.; Decnop-Weever, L.G.; Gründler, P. Mixed Hydroxide Complex Formation and
Solubility of Bismuth in Nitrate and Perchlorate Medium. Talanta 1993, 40, 485-490.
(23) Levy, H.A.; Danfold, M.D.; Argon, P.P. X-ray Diffraction Study of Bismuth Polymer in Aqueous
Perchlorate Solution. J. Chem. Phys. 1959, 31, 1458-1461.
(24) Henry, N.; Evain, M.; Deniard, P.; Jobic, S.; Mentré, O.; Abraham, F. [Bi6O4.5(OH)3.5]2(NO3)11: A
New Anhydrous Bismuth Basic Nitrate. Synthesis and Structure Determination from Twinned
Crystals. J. Solid State Chem. 2003, 176, 127-136.
(25) Lazarini, F. Basic Bismuth Nitrate [Bi6(H2O)(NO3)O4(OH)4](NO3)5. Acta Cryst. 1979, B35, 448-
450.
(26) Sundvall, B. Crystal and Molecular Structure of Tetraoxotetrahydroxobismuth(III) Nitrate
Monohydrate, Bi6O4(HO)4(NO3)6.H2O. Acta Chem. Scand. 1979, A33, 219-224.
(27) Sundvall, B. Crystal Structure of Tetraoxotetrahydroxohexabismuth(III) Perchlorate
Heptahydrate, Bi6O4(HO)4(ClO4)6.7H2O: An X-ray and Neutron Diffraction Study. Inorg. Chem.
1983, 22, 1906-1912.
(28) Lazarini, F. The Crystal Structure of a Bismuth Basic Nitrate, [Bi6O5(OH)3](NO3)5.3H2O. Acta
Cryst. 1978, B34, 3169-3173.
(29) Oertel, R.P.; Plane, R.A. Raman and Infrared Study of Nitrate Complexes of Bismuth(III). Inorg.
Chem. 1968, 7, 1192-1196.
(30) Bond, A.M. The AC and DC Polarographic Reduction of Bismuth(III) in Acidic Halide and Other
Media. Electrochim. Acta 1972, 17, 769-785.
33
(31) Moussa, A.A.; Sammour, H.M. Reactivity of Anions Towards Electron Transfer in the Bismuth
Tervalent Bismuth Exchange Reaction. J. Chem. Soc. 1960, 2151-2157.
(32) Randles, J.E.B.; Somerton, K.W. Kinetics of Rapid Electrode Reactions. Part 4. Metal Ion
Exchange Reaction at Amalgam Electrodes. Trans. Faraday Soc. 1952, 48, 951-955.
(33) Bauer, H.H.; Elving, P.J. The Polarographic Reduction of Bi(III) in the Presence of Chloride Ion.
Electrochim. Acta 1960, 2, 240-247.
(34) Lovrić, M.; Komorsky-Lovrić, Š.; Branica, M. Reduction of Bi(III) from ighly Concentrated
Perchloric Acid. Indian J. Chem. 1990, 29A, 435-438.
(35) Komorsky-Lovrić, Š.; Lovrić, M.; Branica, M. Effect of Ionic Strength on Bi(III) Reduction from
Perchlorate Medium, J. Electrochem. Soc. 1993, 140, 1850-1853.
(36) A. Nosal-Wiercińska, The Kinetics and Mechanism of the Electroreduction of Bi(III) Ions from
Chlorates(VII) with Varied Water Activity. Electrochim. Acta 2010, 55, 5917–5921.
(37) Lingane, J. J. Interpretation of the Polarographic Waves of Complex Metal Ions. Chem. Rev.
1941, 29, 1-35.
(38) Cukrowski, I. A Polarographic Method of Speciation for Labile Metal-Ligand Systems Based on
Mass-Balance Equations. A Differential Pulse Polarographic Study at Fixed Ligand to Metal Ratio
and Varied pH. Anal. Chim. Acta 1996, 336, 23-36.
(39) Billing, C.; Cukrowski, I. A Novel Approach to Monitoring of the Diffusion Junction Potential in
Speciation Studies by Polarography Under Very Acidic Conditions. Part II: The Quasi-Reversible
Cu(II)-Picolinic Acid System. Electroanalysis 2015, 27, 494 – 502.
(40) Cukrowski, I.; Zhang, J. M. Voltammetry as a Virtual Potentiometric Sensor in Modeling of a
Metal-Ligand System and Refinement of Stability Constants. Part 1. Polarographic and Glass
34
Electrode Potentiometric Study of a Dynamic Cd-Glycine System. Electroanalysis 2004, 16, 612-
626.
(41) Billing, C.; Cukrowski, I.; Jordan, B. A Novel Approach to Monitoring of the Diffusion Junction
Potential in Speciation Studies by Polarography Under Very Acidic Conditions. Part I: The
Reversible Cd(II)-Picolinic Acid System. Electroanalysis 2013, 25, 2221-2230.
(42) Cukrowski, I.; Mkwizu, T.; Magampa, P. Voltammetry as Virtual Potentiometric Sensor in
Modelling of a Metal/Ligand System and Refinement of Stability Constants. Part 5. Complexation
Studies of Hydrolysis-Prone Lead(II) with Glycine and Sarcosine by Sampled-Direct-Current
Polarography Involving Virtual Potential. Helv. Chim. Acta 2006, 89, 2934-2952.
(43) Billing, C.; Cukrowski, I. Glass Electrode Calibration for Use in the Voltammetric Determination
of Stability Constants Under Extreme Acidic Conditions. S. Afr. J. Chem. 2009, 62, 168.
(44) Brett, C.M.A.; Brett, A.M.O. Electrochemistry Principles, Methods and Applications, Oxford
University Press, Oxford,UK, 1993.
(45) Bond, A.M. An Application of Rapid Polarographic Techniques and the Derivation of an
Equation for the Polarographic Study of the Fluoride Complexes of Bismuth(III) in acid Media. J.
Electroanal. Chem. 1969, 23, 269-276.
(46) Housecroft, C.E.; Sharpe, A.G. Inorganic Chemistry (2nd
ed.), Prentice Hall, 2004
(47) Barnum, D.W. Hydrolysis of cations. Formation Constants and Standard Free Energies of
Formation of Hydroxy Complexes. Inorg. Chem. 1983, 22, 2297-2305.
(48) Berbel, F.; Diaz-Cruz, J.M.; Ariño, C.; Esteban, M. Voltammetry of Sparingly Soluble Metal
Complexes: A Differential Pulse Polarographic Study of the Zn(II)+Oxalate System. J. Electroanal.
Chem. 1999, 475, 99-106.
35
(49) Brannan, J.R.; Sawyer, D.T. Polarography of Bismuth(III)-Gluconate Complexes. J. Electroanal.
Chem. 1964, 8, 286-290.
(50) Sundaresan, R.; Sundaram, A.K. Polarography of Bismuth in Oxalate and Thiourea Media. Proc.
Indian Acad. Sci. 1973, 78A, 225-230.
(51) Chazhoor, J.S. Polarography of Bismuth in Malonic and Chloroacetic Acid Media. Proc. Indian
Acad. Sci. 1975, 81A, 93-97.
(52) Gomez-Nieto, M.A.; Cruz Soto, J.L.; Luque De Castro, M.D.; Valcarcel M. Application of the
DeFord and Hume Method Modified for Quasi-Reversible and Irreversible Processes to the
Chelates of Bi(III) with Azomethine Derivatives of 2-Benzoylpyridine. Talanta. 1984, 31, 379-385.
(53) Kajala, A.; Singh, J.; Gupta, O.D. Polarographic Studies of Bi(III) Complexes with a-Alanine and
L-Valine at Different Temperatures. Asian J. Chem. 2011, 23, 455-456.
(54) Paliwal, M.K.; Gupta, O.D. Electrochemical and Thermodynamic Behaviour of Bi(III) with
Oxalic Acid and Malonic Acid at DME in Aqueous Media. Asian J. Chem. 2011, 23, 590-592.
(55) DeFord, D.D.; Hume, D.N. The Determination of Consecutive Formation Constants of Complex
Ions from Polarographic Data. J. Am. Chem. Soc. 1951, 73, 5321-5322.
(56) Bond, A.M.; Waugh, A.B. AC Polarography and its Application to Overcome the Problem of DC
Polarography Maxima in the Study of Complex Ions. Electrochim. Acta. 1970, 15, 1471-1482.
(57) Cukrowski, I.; Zhang, J.M.; van Aswegen, A. Voltammetry as a Virtual Potentiometric Sensor in
Modelling of a Metal/Ligand System and Refinement of Stability Constants. Part 2. Differential-
Pulse- and Sampled-Current-Polarographic and Virtual Free-Metal-Ion Potentiometric Study of a
Bismuth(III)/Picolinic Acid/Hydroxide System. Helv. Chim. Acta. 2004, 87, 2135-2158.
36
Supporting Information
1. Polarographic data
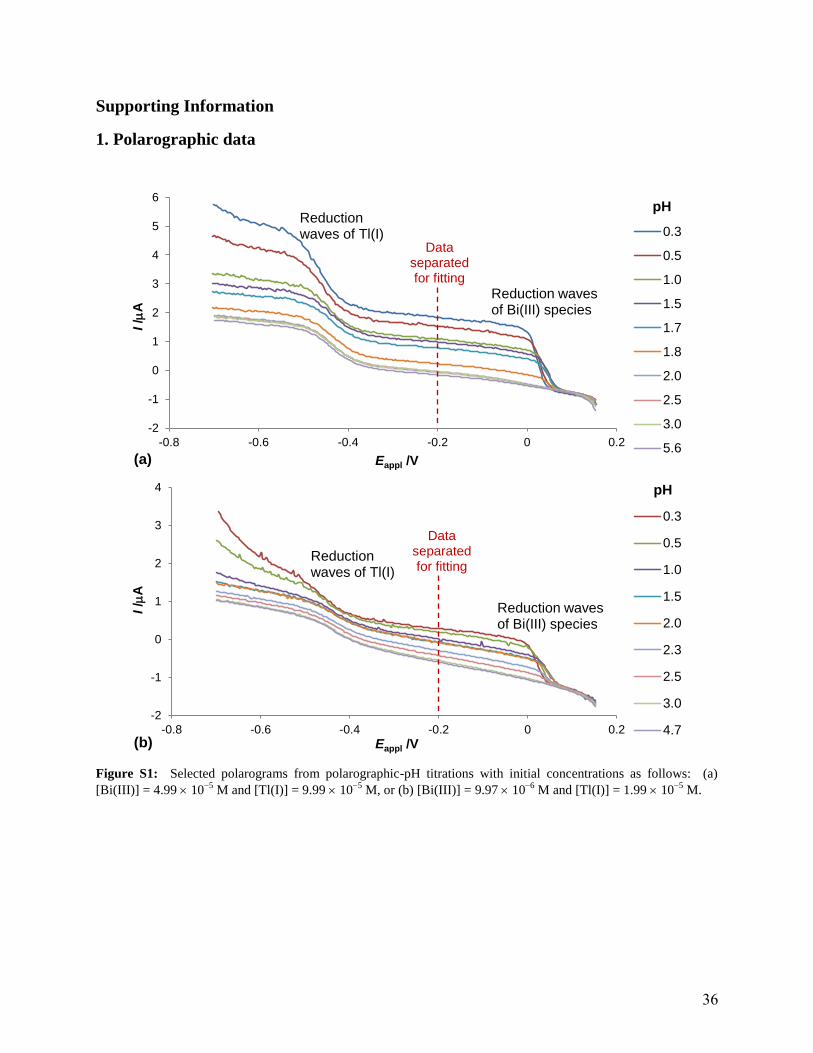
Figure S1: Selected polarograms from polarographic-pH titrations with initial concentrations as follows: (a)
[Bi(III)] = 4.99 105
M and [Tl(I)] = 9.99 105
M, or (b) [Bi(III)] = 9.97 106
M and [Tl(I)] = 1.99 105
M.
-2
-1
0
1
2
3
4
5
6
-0.8 -0.6 -0.4 -0.2 0 0.2
I /m
A
Eappl /V
0.3
0.5
1.0
1.5
1.7
1.8
2.0
2.5
3.0
5.6
pH
Reduction waves of Bi(III) species
Reduction waves of Tl(I)
(a)
Data separated for fitting
-2
-1
0
1
2
3
4
-0.8 -0.6 -0.4 -0.2 0 0.2
I /m
A
Eappl /V
0.3
0.5
1.0
1.5
2.0
2.3
2.5
3.0
4.7
pH
Reduction waves of Bi(III) species
Reduction waves of Tl(I)
(b)
Data separated for fitting
37
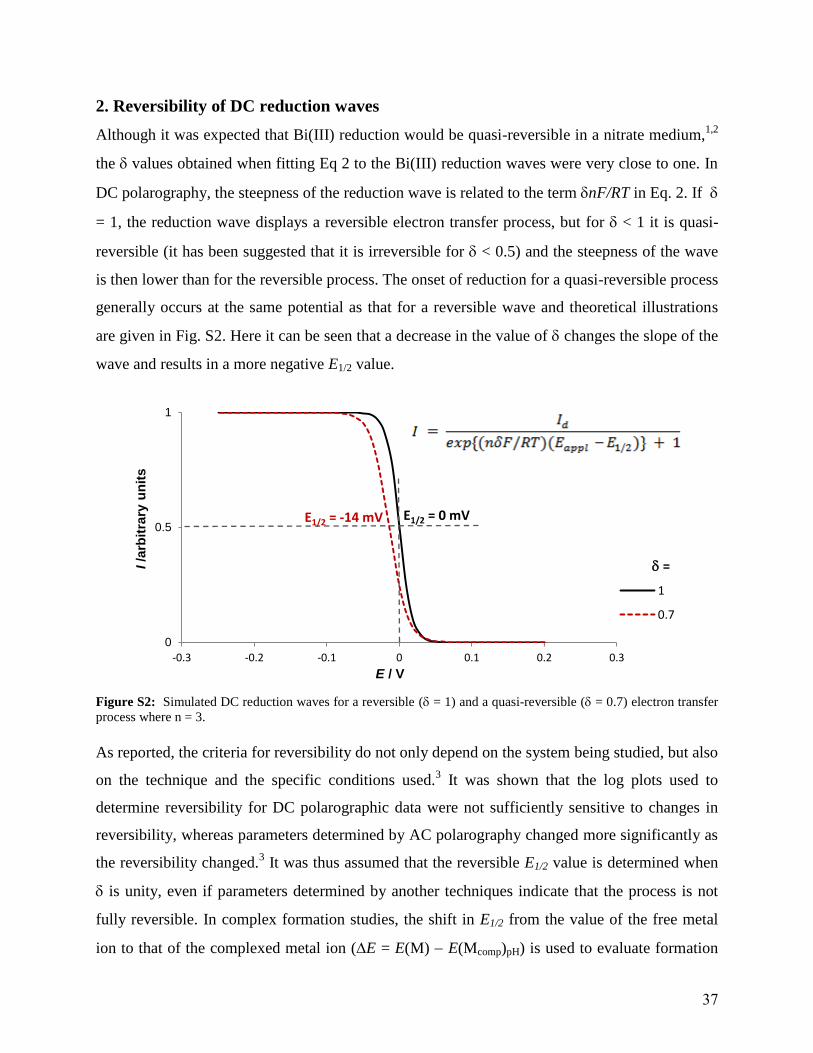
2. Reversibility of DC reduction waves
Although it was expected that Bi(III) reduction would be quasi-reversible in a nitrate medium,1,2
the values obtained when fitting Eq 2 to the Bi(III) reduction waves were very close to one. In
DC polarography, the steepness of the reduction wave is related to the term nF/RT in Eq. 2. If
= 1, the reduction wave displays a reversible electron transfer process, but for < 1 it is quasi-
reversible (it has been suggested that it is irreversible for < 0.5) and the steepness of the wave
is then lower than for the reversible process. The onset of reduction for a quasi-reversible process
generally occurs at the same potential as that for a reversible wave and theoretical illustrations
are given in Fig. S2. Here it can be seen that a decrease in the value of changes the slope of the
wave and results in a more negative E1/2 value.
Figure S2: Simulated DC reduction waves for a reversible ( = 1) and a quasi-reversible ( = 0.7) electron transfer
process where n = 3.
As reported, the criteria for reversibility do not only depend on the system being studied, but also
on the technique and the specific conditions used.3 It was shown that the log plots used to
determine reversibility for DC polarographic data were not sufficiently sensitive to changes in
reversibility, whereas parameters determined by AC polarography changed more significantly as
the reversibility changed.3 It was thus assumed that the reversible E1/2 value is determined when
is unity, even if parameters determined by another techniques indicate that the process is not
fully reversible. In complex formation studies, the shift in E1/2 from the value of the free metal
ion to that of the complexed metal ion (E = E(M) E(Mcomp)pH) is used to evaluate formation
0
0.5
1
-0.3 -0.2 -0.1 0 0.1 0.2 0.3
I /a
rbit
rary
un
its
E / V
1
0.7
=
E1/2 = 0 mV E1/2 = -14 mV
38
constants. Therefore, as long as all reduction waves give = 1, the E value calculated does not
include an additional shift due to the change in steepness of the DC wave (due to changes in
reversibility as measured by ) and the assumption that this is reversible is adequate for our
purpose.
(58) Bond, A. M. The AC and DC Polarographic Reduction of Bismuth(III) in Acidic Halide and
Other Media. Electrochim. Acta 1972, 17, 769-785.
(59) Bond, A. M. An Application of Rapid Polarographic Techniques and the Derivation of an
Equation for the Polarographic Study of the Fluoride Complexes of Bismuth(III) in acid Media. J.
Electroanal. Chem. 1969, 23, 269-276.
(60) Bauer, H. H.; Elving, P. J. The Polarographic Reduction of Bi(III) in the Presence of Chloride
Ion. Electrochim. Acta 1960, 2, 240-247.
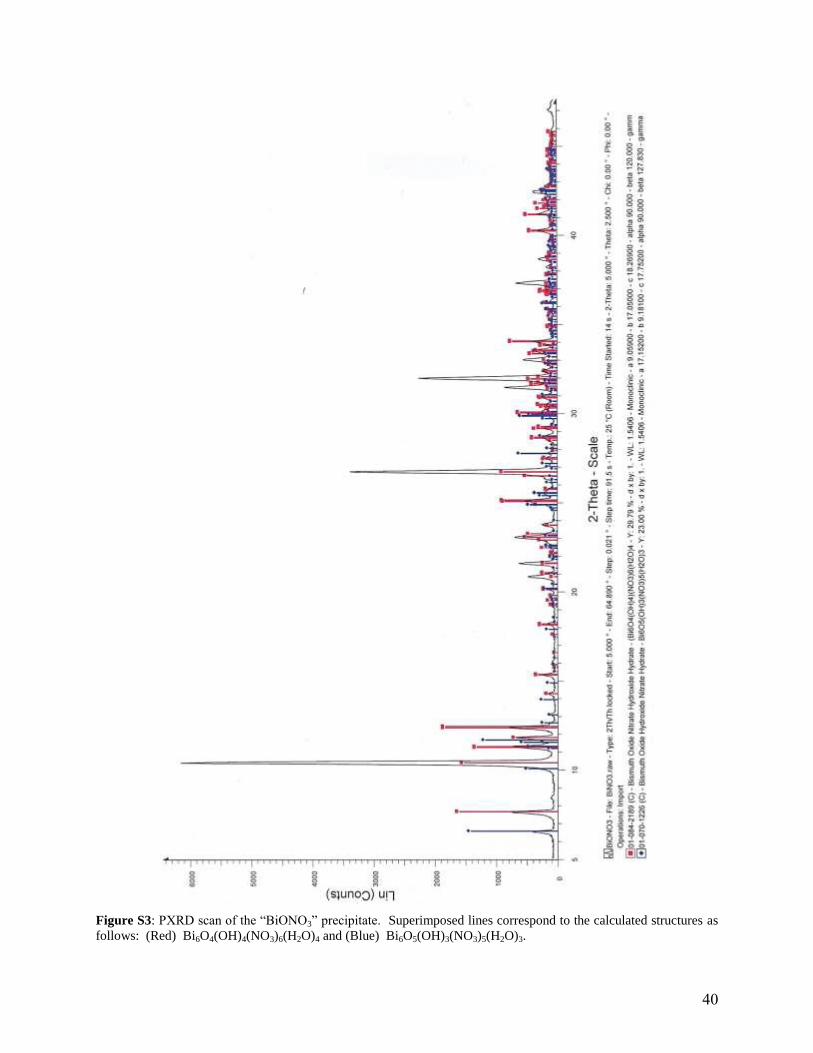
3. Analysis of the precipitate
Since the amount of precipitate produced was negligible in the dilute solutions used in
polarographic experiments, a 0.1 M Bi(III) solution in 0.5 M HNO3 was made up and 0.5 M
NaOH was slowly added until precipitation occurred below pH 2. The solution was then filtered
and allowed to dry and yielded white shiny platelets as noted by Swinehart and Garrett.4
The precipitate was analysed using a Bruker D2 Phaser powder X-ray diffractometer with a Co
X-ray source (1.78897 Å) and a Bruker Lynxeye PSD detector. The sample was prepared on a
zero background holder. Analysis showed that both Bi6O4(OH)4(NO3)6(H2O)4 and
Bi6O5(OH)3(NO3)5(H2O)3 were present as shown by the superimposed powder patterns in Figure
S2 that were calculated from single crystal data by Lazarini5,6
(as given in the Inorganic Crystal
Structure Database7). This precipitate was formed using Bi(III) concentrations about 10
4 times
greater than in the polarographic cell, so the question remains whether the hexamers are still
formed under significantly more dilute conditions.
(61) Swinehart, D. F.; Garrett, A. B. The Equilibria of Two Basic Bismuth Nitrates in Dilute Nitric
Acid at 25 C. J. Am. Chem. Soc. 1951, 73, 507-510.
(62) Lazarini, F. The Crystal Structure of a Bismuth Basic Nitrate, [Bi6O5(OH)3](NO3)5.3H2O. Acta
Cryst. 1978, B34, 3169-3173.
39
(63) Lazarini, F. Basic Bismuth Nitrate [Bi6(H2O)(NO3)O4(OH)4](NO3)5. Acta Cryst. 1979, B35, 448-
450.
(64) Belsky, A.; Hellenbrandt, M.; Karen, V. L.; Luksch, P. New Developments In The Inorganic
Crystal Structure Database (ICSD): Accessibility In Support Of Materials Research And Design . Acta
Cryst. 2002, B58, 364-369
40
Figure S3: PXRD scan of the “ N 3” prec p tate. Superimposed lines correspond to the calculated structures as
follows: (Red) Bi6O4(OH)4(NO3)6(H2O)4 and (Blue) Bi6O5(OH)3(NO3)5(H2O)3.

41
4. Species distribution diagrams
Figure S4: Species distribution diagrams plotted using log values in Table 1 (indicated by *) and Table 3. (a)
[Bi(III)] = 5 10-5
M (Bi(III) nitrates omitted); (b) [Bi(III)] = 5 10-5
M and [NO3] = 0.5 M; (c) [Bi(III)] = 1 10
-
5 M and [NO3
] = 0.5 M.
0
10
20
30
40
50
60
70
80
90
100
0 2 4 6 8 10 12 14
% S
pecie
s
pH
Bi3+
Bi(OH)2+
Bi(OH)2+
Bi9(OH)225+
Bi(OH)3 Bi(OH)4
-
Bi6(OH)126+
Bi9(OH)207+
Bi9(OH)216+
(a)
0
10
20
30
40
50
60
70
80
90
100
0 2 4 6 8 10 12 14
% S
pecie
s
pH
Bi3+
Bi(OH)2+ Bi(OH)2
+
Bi9(OH)225+
Bi(OH)3 Bi(OH)4-
Bi6(OH)126+
Bi9(OH)207+
Bi9(OH)216+
Bi(NO3)4-
Bi(NO3)3
Bi(NO3)2+
Bi(NO3)2+
(b)
0
10
20
30
40
50
60
70
80
90
100
0 2 4 6 8 10 12 14
% S
pecie
s
pH
Bi3+
Bi(OH)2+
Bi(OH)2+
Bi9(OH)225+
Bi(OH)3 Bi(OH)4
-
Bi(NO3)4-
Bi(NO3)3
Bi(NO3)2+
Bi(NO3)2+
(c)

42
5. Effect of varying ionic strength
Figure S5: As for Fig. 2a, the E1/2(Bi) values compensated for Ej and for potential shifts due to Bi(OH)2+
, Bi(OH)2+
and Bi(III) nitrate species () is given. Also shown is the concentration of nitrate () and the ionic strength () of
the solution as the titration proceeds.
6. Kinetics of precipitate formation
Figure S6: Normalised Id for the reduction of Bi(III) (initial [Bi(III)] = 4.99 10-5
M) for titration experiments with
varying time intervals between OH addition and polarographic data collection. The approximate pH at which
precipitation starts is also indicated by the arrows.
0.20
0.25
0.30
0.35
0.40
0.45
0.50
0.55
62
63
64
65
66
67
68
69
70
71
72
0.2 0.4 0.6 0.8 1.0 1.2 1.4 1.6
Ion
ic s
tren
gth
or
[NO
3]/
M
Co
mp
en
sate
d E
1/2
/m
V
pH
m
[NO3]
E(Bi)
0
0.2
0.4
0.6
0.8
1
1.2
0 0.2 0.4 0.6 0.8 1 1.2 1.4 1.6 1.8 2
No
rmalised
Id /m
A
pH
10 m
in
20 m
in
30 m
in
45 m
in
60 m
in
43
7. Determining E(Bi) by extrapolation
Figure S7: Experimental E1/2(Bi) values () are given for experiments with initial [Bi(III)] of (a) 5 10-5
M (as for
Fig. 2) and (b) 1 10-5
M (as for Fig. 4). The E1/2(Bi) values were corrected for potential shifts due to Bi(OH)2+
and
Bi(OH)2+ formation only (), Bi(OH)
2+, Bi(OH)2
+ and Bi(III) nitrate species () or just Bi(OH)
2+ and Bi(OH)2
+ in
the presence of nitrate (). The function y = a + b exp(cx) was fitted to the corrected E1/2(Bi) values. The E(Bi)
values obtained using the methodology proposed in this work is also shown. The third order polynomials fitted to
data () illustrate why this function could not be extrapolated to determine E(Bi).
20
30
40
50
60
70
0.0 0.5 1.0 1.5 2.0 2.5 3.0
Co
mp
en
sate
d E
1/2
/m
V
pH
E(Bi)
(a)
3rd order polynomial
20
30
40
50
60
70
0.0 0.5 1.0 1.5 2.0 2.5 3.0
Co
mp
en
sate
d E
1/2
/m
V
pH
E(Bi)
(b)
3rd order polynomial
Recommended