1 1
www.angelbroking.com
Market Outlook
January 27, 2016
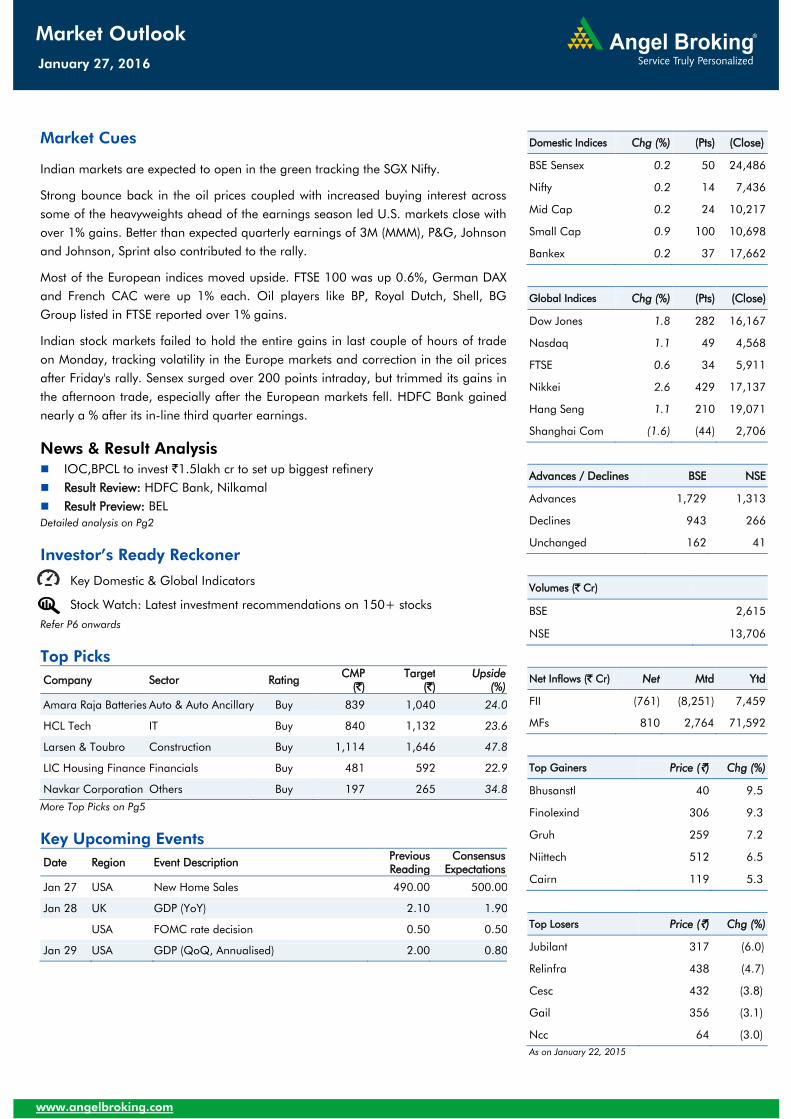
Market Cues
Indian markets are expected to open in the green tracking the SGX Nifty.
Strong bounce back in the oil prices coupled with increased buying interest across
some of the heavyweights ahead of the earnings season led U.S. markets close with
over 1% gains. Better than expected quarterly earnings of 3M (MMM), P&G, Johnson
and Johnson, Sprint also contributed to the rally.
Most of the European indices moved upside. FTSE 100 was up 0.6%, German DAX
and French CAC were up 1% each. Oil players like BP, Royal Dutch, Shell, BG
Group listed in FTSE reported over 1% gains.
Indian stock markets failed to hold the entire gains in last couple of hours of trade
on Monday, tracking volatility in the Europe markets and correction in the oil prices
after Friday's rally. Sensex surged over 200 points intraday, but trimmed its gains in
the afternoon trade, especially after the European markets fell. HDFC Bank gained
nearly a % after its in-line third quarter earnings.
News & Result Analysis
IOC,BPCL to invest `1.5lakh cr to set up biggest refinery
Result Review: HDFC Bank, Nilkamal
Result Preview: BEL
Detailed analysis on Pg2
Investor’s Ready Reckoner
Key Domestic & Global Indicators
Stock Watch: Latest investment recommendations on 150+ stocks
Refer P6 onwards
Top Picks
Company Sector Rating CMP
(`)
Target
(`)
Upside
(%)
Amara Raja Batteries Auto & Auto Ancillary Buy 839 1,040 24.0
HCL Tech IT Buy 840 1,132 23.6
Larsen & Toubro Construction Buy 1,114 1,646 47.8
LIC Housing Finance Financials Buy 481 592 22.9
Navkar Corporation Others Buy 197 265 34.8
More Top Picks on Pg5
Key Upcoming Events
Date Region
Event Description
Previous
Reading
Consensus
Expectations
Jan 27 USA
New Home Sales 490.00 500.00
Jan 28 UK
GDP (YoY) 2.10 1.90
USA
FOMC rate decision 0.50 0.50
Jan 29 USA
GDP (QoQ, Annualised) 2.00 0.80
(
Domestic Indices Chg (%) (Pts) (Close)
BSE Sensex 0.2 50 24,486
Nifty 0.2 14 7,436
Mid Cap 0.2 24 10,217
Small Cap 0.9 100 10,698
Bankex 0.2 37 17,662
Global Indices Chg (%) (Pts) (Close)
Dow Jones 1.8 282 16,167
Nasdaq 1.1 49 4,568
FTSE 0.6 34 5,911
Nikkei 2.6 429 17,137
Hang Seng 1.1 210 19,071
Shanghai Com (1.6) (44) 2,706
Advances / Declines BSE NSE
Advances 1,729 1,313
Declines 943 266
Unchanged 162 41
Volumes (` Cr)
BSE 2,615
NSE 13,706
Net Inflows (` Cr) Net Mtd Ytd
FII (761) (8,251) 7,459
MFs 810 2,764 71,592
Top Gainers Price (`) Chg (%)
Bhusanstl 40 9.5
Finolexind 306 9.3
Gruh 259 7.2
Niittech 512 6.5
Cairn 119 5.3
Top Losers Price (`) Chg (%)
Jubilant 317 (6.0)
Relinfra 438 (4.7)
Cesc 432 (3.8)
Gail 356 (3.1)
Ncc 64 (3.0)
As on January 22, 2015
2
www.angelbroking.com
Market Outlook
January 27, 2016
IOC, BPCL to invest `1.5lakh cr to set up biggest refinery
PSU oil firms IOCL, BPCL, HPCL and Engineers India will invest `1.5lakh cr to set-
up 60mn tn oil refinery unit in Maharashtra, which will also be India's biggest
refinery on the west coast. This refinery is expected to be built in 2 phases, where
the first phase would have 40mn tn of capacity and does envisage over `1.0lakh
cr of investment. This refinery will also be accompanied by a petrochemical
complex.
IOCL is exploring this alternative as it finds catering to customers in Western and
Southern India difficult, given that most of its refineries are based in North India.
Further, HPCL and BPCL face constraints from their Mumbai units.
This refinery is expected to produce petrol, diesel, LPG, ATF and feedstock for
petrochemical plant in plastic, chemical and textile industries in Maharashtra.
We are of view that setting-up a refinery in the west coast would act as natural
advantage, given that we source majority of crude from Middle East. Also,
movement of products to consumption heartland will get easier once the refinery
commences operations. Given that we are at very early stages, where the project
location is yet to be identified, land has to be allocated, we sense it would take at
least not less than 5 years for this new refinery to come-up.
If we look historical capex execution trends of the PSU Hydro-Carbon players, EIL
has been the preferred choice for design and engineering works of large ticket
complex Hydro-Carbon projects. On the same lines, for this new upcoming
refinery, we expect EIL to emerge as a beneficiary.
This is a positive development for IOCL and it would contribute to their financials
in the long-run. We continue to maintain our Neutral on the stock.
Result Review
HDFC Bank (CMP: `1,040/ TP: `1,262/Upside:21.4%)
HDFC bank continued its trend of delivering consistent earnings performance
quarter after quarter and registered a net interest income growth of 24.0% YoY for
3QFY2016 which was slightly above our expectations. The bank’s loan book grew
by 25.7% YoY which was aided by NII growth of 24.0% YoY. Non-interest income
for the bank grew at a pace of 13.3% YoY. While operating expenses grew by
21.7% YoY, pre-provision profits were up by 20.0% YoY. On the asset quality
front, the bank continued its steady performance inspite of the challenging macro
environment with the Gross and net NPA levels inching marginally for the bank to
0.97% and 0.29% from 0.91% and 0.25% QoQ respectively. Overall, the bank
reported earnings growth of 20.1% YoY. In light of current macro environment, the
current earnings trajectory of 20%+ YoY is strong which in our view, justifies a
premium valuation multiple. Hence, we maintain our BUY rating on the
stock.
Y/E Op. Inc NIM PAT EPS ABV ROA ROE P/E P/ABV
March (` cr) (%) (` cr) (`) (`) (%) (%) (x) (x)
FY2016E 38,309 4.3 12,363 49.3 285.4 1.9 18.5 21.1 3.6
FY2017E 47,302 4.3 15,302 61.0 332.2 1.9 19.7 17.0 3.1
3
www.angelbroking.com
Market Outlook
January 27, 2016
Nilkamal – 3QFY2016 (CMP: `1,338/ TP: -/ Upside: -)
For 3QFY2016, Nilkamal reported numbers that were mostly in-line with our
estimate. The top-line grew by 1.8% yoy to `428cr, which is below our estimate of
`456cr. Aided by sharp decline in raw material prices, EBITDA grew by an
impressive 49.2% yoy to `46cr which is in-line with our estimate of `46cr. As per
our reckoning, the average polyethylene prices declined by 15.7% on yoy basis
(7.8% decline on qoq basis) during the quarter resulting in raw material cost
declining by 738bp yoy to 54.8% of sales. However, the employee cost and other
expenses increased by 176bp yoy and 217bp yoy to 8.6% and 25.8% of sales,
respectively. As a result, the EBITDA margin expanded by 345bp yoy to 10.8%
which is mostly in-line with our estimate of 10.1%. The finance cost declined by
53.2% yoy to `4cr and consequently, the net profit grew by 138.6% yoy to `20cr
which is also in-line with our estimate of `21cr.
As far as segmental performance is concerned, the plastics division witnessed 0.3%
yoy growth to `365cr and the margins for the segment improved by 641bp yoy to
12.3%. The lifestyle segments’ revenues grew by 13.4% yoy to `60cr while the
segment reported loss of `2 cr. Others, which is includes the mattress business,
saw revenue growth of 9.4% on yoy basis to `9cr while the segment reported loss
of `0.8cr.
At current market price, the stock is trading at 18.8x and 16.6x its FY2017E and
FY2018E earnings, respectively. We have a Neutral rating on the stock
Y/E Sales OPM PAT EPS ROE P/E P/BV EV/EBITDA EV/Sales
Mar (` cr) (%) (` cr) (`) (%) (x) (x) (x) (x)
FY2016E 1,871 10.7 94 63.2 17.6 21.2 3.4 10.4 1.1
FY2017E 2,031 10.7 106 71.0 16.9 18.8 2.9 9.2 1.0
FY2018E 2,220 10.6 121 80.8 16.4 16.6 2.5 8.1 0.9
Result Preview
Bharat Electronics Ltd. (CMP: `1,208 / TP: `1,414/ Upside: 17%)
We expect Bharat Electronics Ltd. (BEL) to report strong set of 3QFY2016 numbers.
On the top-line front, we expect BEL to report 8.3% yoy growth to `1,713cr (on
higher 3QFY2015 base). Despite quarterly volatility in the revenues of the
company, we expect 3QFY2016 to benefit from bulk clearances across some of
the projects. During the quarter, BEL reported a ~`8,000cr IACCS (Integrated Air
Command Control Systems) order. Considering the shift in revenue mix, we expect
BEL to report ``90cr of EBITDA (reflecting yoy decline in EBITDA margins to
16.3%). In-line with EBITDA movement, we expect BEL to report 5.9% yoy increase
in its PAT to `288cr (reflecting yoy decline in PAT margins to 16.2%). Key things to
watch out would be margin profile as well as outlook on the order inflows. Post the
recent correction in stock price, we upgrade to Buy on the stock with target of
`1,414.
Y/E Sales OPM PAT EPS ROE P/E P/BV EV/EBITDA EV/Sales
Mar (` cr) (%) (` cr) (`) (%) (x) (x) (x) (x)
FY2016E 7,737 16.8 1,296 54 39.3 22.4 3.2 17.0 2.9
FY2017E 8,634 17.2 1,475 61 45.6 19.6 2.8 14.2 2.5
4
www.angelbroking.com
Market Outlook
January 27, 2016
Quarterly Bloomberg Brokers Consensus Estimate
Bharti InfraTel (Consol.) - January 27, 2016
Particulars (` cr) 3QFY16E 3QFY15 y-o-y (%) 2QFY16 q-o-q (%)
Net sales 3,114 2,948 5.6 3,038 2.5
EBITDA 1,469 1,327 10.7 1,468 0.1
EBITDA margin (%) 47.2 45.0 48.3
Net profit 582 507 14.8 579 0.5
Colgate-Palmolive Ltd - January 27, 2016
Particulars (` cr) 3QFY16E 3QFY15 y-o-y (%) 2QFY16 q-o-q (%)
Net sales 1,038 988 5.1 1,032 0.6
EBITDA 224 195 14.9 255 (12.2)
EBITDA margin (%) 21.6 19.7 24.7
Net profit 146 131 11.5 157 (7.0)
Godrej Consumer (Consol.) - January 27, 2016
Particulars (` cr) 3QFY16E 3QFY15 y-o-y (%) 2QFY16 q-o-q (%)
Net sales 2,430 2,225 9.2 2,242 8.4
EBITDA 461 398 15.8 407 13.3
EBITDA margin (%) 19.0 17.9 18.2
Net profit 322 264 22.0 287 12.2
Economic and Political News
French firm EDF signs deal to build 6 nuclear plants in India
Government mulls coastal economic zones to boost manufacturing
Germany to invest 130 bn euro on Defence
French to upgrade Delhi-Chandigarh rail route to 200 kmph
World steel output falls 2.8% in 2015; first decline since 2009
Corporate News
Apollo to divest 23.3% stake in Apollo Munich to JV partner
Reliance Power seeks to exit Krishnapatnam UMPP; writes to Andhra govt
Neyveli Lignite Corporation to add 19,000MW by 2025
Madhya Pradesh govt. agrees on tax deferment to BPCL's Bina refinery

5
www.angelbroking.com
Market Outlook
January 27, 2016
Top Picks
Large Cap
Company Market Cap
(` Cr)
CMP
(`)
Target
(`)
Upside
(%) Rationale
Amara Raja Batteries 14,324 839 1,040 24.0
To outpace battery industry growth due to better technological
products leading to market share gains in both the automotive
OEM and replacement segments.
Ashok Leyland 24,617 87 111 28.3
Earnings to grow strongly given the MHCV cyclical upturn.
Focus on exports and LCV's provides additional growth
avenue.
HCL Tech 1,18,376 840 1,038 23.6 The stock is trading at attractive valuations and is factoring all
the bad news.
HDFC Bank 2,62,596 1,040 1,262 21.4
Strong visibility for a robust 20% earnings trajectory, coupled
with high quality of earnings on account of high quality retail
business and strategic focus on highly rated corporates.
Infosys 2,61,312 1,138 1,347 18.4 Back on the growth trend, expect a long term growth of 14%
to be a US$20bn in FY2020.
Larsen & Toubro 1,03,723 1,114 1,646 47.8
Well positioned to benefit from such expected gradual
recovery in the overall domestic capex cycle, given its presence
across various infrastructure segments, its execution
capabilities, and its strong balance sheet.
LIC Housing Finance 24,297 481 592 22.9
LICHF continues to grow its retail loan book at a healthy pace
with improvement in asset quality. We expect the company to
post a healthy loan book which is likely to reflect in a strong
earnings growth.
Source: Company, Angel Research
Mid Cap
Company Market Cap
(` Cr)
CMP
(`)
Target
(`)
Upside
(%) Rationale
Blue Star 3,203 356 439 23.3
Favourable outlook for the AC industry to augur well for
Cooling products business which is out pacing the market
growth. EMPPAC division's profitability to improve once
operating environment turns around.
Garware Wall Ropes 764 349 473 35.4
Change in business focus towards high-margin chronic &
lifestyle segments and increasing penetration in Europe and
US
Jagran Prakashan 5,392 165 189 14.6
Economic recovery to have favourable impact on advertising &
circulation revenue growth. Further, the acquisition of a radio
business (Radio City) would also boost the company's revenue
growth.
Navkar Corporation 2,804 197 265 34.8 Massive capacity expansion along with rail advantage at ICD
as well CFS augurs well for the company
Radico Khaitan 1,487 112 156 39.6
Earnings boost on back of stable material prices and
favourable pricing environment. Valuation discount to peers
provides additional comfort
Siyaram Silk Mills 1,024 1,093 1,354 23.9
Strong brands and distribution network would boost growth
going ahead. Stock currently trades at an inexpensive
valuation.
Surya Roshni 629 144 201 40.0 Structural shift in the Lighting industry towards LED lighting will
drive growth.
Source: Company, Angel Research
Date Company
Jan 27, 2016 Colgate, Godrej Consumer, HT Media, Kirloskar Engines India Ltd, L G Balakrishnan & Bros, Power Grid Corpn
Jan 28, 2016Maruti, ICICI Bank, Syndicate Bank, Dabur India, Sesa Goa, Jyothy Laboratories, Tide Water Oil India, Glenmark Pharma.
Jan 29, 2016United Phosphorus, TVS Motor, Siemens, Suzlon Energy, Thermax, Blue Star, Yes Bank, Jagran Prakashan, PVR, JSW Steel , Banco, Elecon Engineering, Indoco Remedies, NTPC
Jan 30, 2016 IDFC, Shriram Trans., Marico, Electrosteel Castings, Relaxo
Feb 1, 2016 Tech Mahindra, Transport Corporation of India
Feb 2, 2016 Amara Raja Batteries, Cummins India, Crompton Greaves
Feb 3, 2016 Mangalam Cement, Hexaware, IOC
Feb 4, 2016 Bajaj Auto, ABB, J K Lakshmi Cements, Mphasis, Tata Steel, Styrolution, Visaka Industries, Aventis
Feb 5, 2016 Bosch India, Lupin, Cadila Healthcare, Tata Power Co., PTC India
Feb 8, 2016 GlaxoSmith Con, Sterling Tools
Feb 9, 2016 Motherson Sumi, Apollo Tyres, Ramco Cements, Britannia, Dr Reddy's, CESC
Feb 10, 2016 Ambuja Cements, ACC, India Cements, Rural Elec.Corp., GSK Pharma, NHPC
Feb 11, 2016 Page Industries
Feb 12, 2016 M&M, FAG Bearings, Nestle
Result Calendar
Source: Bloomberg, Angel Research
Global economic events release calendar
Date Time Country Event Description Unit Period Bloomberg Data
Last Reported Estimated
Jan 27, 2016 8:30PM US New home sales Thousands Dec 490.00 500.00
Jan 28, 2016 3:00PM UK GDP (YoY) % Change 4Q A 2.10 1.90
12:30AM US FOMC rate decision % Jan 27 0.50 0.50
Jan 29, 2016 7:00PM US GDP Qoq (Annualised) % Change 4Q A 2.00 0.80
Feb 1, 2016 3:00PM UK PMI Manufacturing Value Jan 51.90 --
6:30AM China PMI Manufacturing Value Jan 49.70 49.60
Feb 2, 2016 2:25PM Germany Unemployment change (000's) Thousands Jan (14.00) --
11:00AM India RBI Reverse Repo rate % Feb 2 5.75 --
11:00AM India RBI Repo rate % Feb 2 6.75 --
11:00AM India RBI Cash Reserve ratio % Feb 2 4.00 --
Feb 4, 2016 5:30PM UK BOE Announces rates % Ratio Feb 4 0.50 0.50
Feb 5, 2016 7:00PM US Change in Nonfarm payrolls Thousands Jan 292.00 --
7:00PM US Unnemployment rate % Jan 5.00 --
Feb 10, 2016 India Imports YoY% % Change Jan (3.90) --
India Exports YoY% % Change Jan (14.70) --
3:00PM UK Industrial Production (YoY) % Change Dec 0.90 --
Feb 12, 2016 7:30AM India Industrial Production YoY % Change Dec (3.20) --
3:30PM Euro Zone Euro-Zone GDP s.a. (QoQ) % Change 4Q A 0.30 --
12:30PM Germany GDP nsa (YoY) % Change 4Q P 1.80 --
Source: Bloomberg, Angel Research
January 27, 2016
Market Outlook
Key Upcoming Events
h
1
Market Outlook
January 27, 2016
www.angelbroking.com www.angelbroking.com
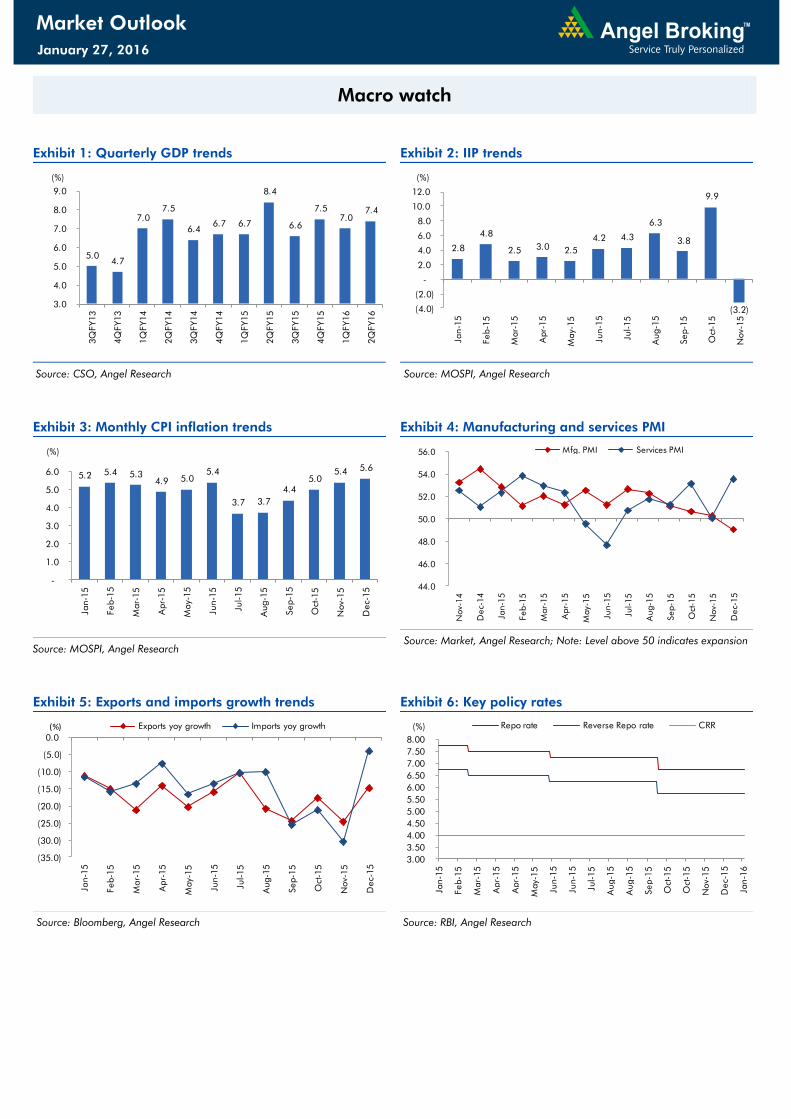
Macro watch
Exhibit 1: Quarterly GDP trends
Source: CSO, Angel Research
Exhibit 2: IIP trends
Source: MOSPI, Angel Research
Exhibit 3: Monthly CPI inflation trends
Source: MOSPI, Angel Research
Exhibit 4: Manufacturing and services PMI
Source: Market, Angel Research; Note: Level above 50 indicates expansion
Exhibit 5: Exports and imports growth trends
Source: Bloomberg, Angel Research
Exhibit 6: Key policy rates
Source: RBI, Angel Research
5.0 4.7
7.0 7.5
6.4 6.7 6.7
8.4
6.6
7.5 7.0
7.4
3.0
4.0
5.0
6.0
7.0
8.0
9.0
3Q
FY13
4Q
FY13
1Q
FY14
2Q
FY14
3Q
FY14
4Q
FY14
1Q
FY15
2Q
FY15
3Q
FY15
4Q
FY15
1Q
FY16
2Q
FY16
(%)
2.8
4.8
2.5 3.0 2.5
4.2 4.3
6.3
3.8
9.9
(3.2)(4.0)
(2.0)
-
2.0
4.0
6.0
8.0
10.0
12.0
Jan-1
5
Feb-1
5
Mar-
15
Apr-
15
May-
15
Jun-1
5
Jul-15
Aug-1
5
Sep-1
5
Oct
-15
Nov-
15
(%)
5.2 5.4 5.3 4.9 5.0
5.4
3.7 3.7
4.4 5.0
5.4 5.6
-
1.0
2.0
3.0
4.0
5.0
6.0
Jan-1
5
Feb-1
5
Mar-
15
Apr-
15
May-
15
Jun-1
5
Jul-15
Aug-1
5
Sep-1
5
Oct
-15
Nov-
15
Dec-
15
(%)
44.0
46.0
48.0
50.0
52.0
54.0
56.0 N
ov-
14
Dec-
14
Jan-1
5
Feb-1
5
Mar-
15
Apr-
15
May-
15
Jun-1
5
Jul-15
Aug-1
5
Sep-1
5
Oct
-15
Nov-
15
Dec-
15
Mfg. PMI Services PMI
(35.0)
(30.0)
(25.0)
(20.0)
(15.0)
(10.0)
(5.0)
0.0
Jan-1
5
Feb-1
5
Mar-
15
Apr-
15
May-
15
Jun-1
5
Jul-15
Aug-1
5
Sep-1
5
Oct
-15
Nov-
15
Dec-
15
Exports yoy growth Imports yoy growth(%)
3.00
3.50
4.00
4.50
5.00
5.50
6.00
6.50
7.00
7.50
8.00
Jan-1
5
Feb-1
5
Mar-
15
Apr-
15
Apr-
15
May-
15
Jun-1
5
Jun-1
5
Jul-15
Aug-1
5
Aug-1
5
Sep-1
5
Oct
-15
Oct
-15
Nov-
15
Dec-
15
Jan-1
6
Repo rate Reverse Repo rate CRR (%)

h
2
Market Outlook
January 27, 2016
www.angelbroking.com www.angelbroking.com
Global watch
Exhibit 1: Latest quarterly GDP Growth (%, yoy) across select developing and developed countries
Source: Bloomberg, Angel Research
Exhibit 2: 2015 GDP Growth projection by IMF (%, yoy) across select developing and developed countries
Source: IMF, Angel Research
Exhibit 3: One year forward P-E ratio across select developing and developed countries
Source: IMF, Angel Research
(4.5) (4.1)
5.3
6.9
1.0
4.7 4.7
2.9 2.1 2.1 1.8
1.1 1.6
(6.0)
(4.0)
(2.0)
-
2.0
4.0
6.0
8.0
Bra
zil
Russ
ia
India
Chin
a
South
Afr
ica
Indonesi
a
Mala
ysia
Thailand
UK
USA
Germ
any
Fra
nce
Japan
(%)
(3.0)(3.8)
7.3 6.8
1.4
4.7 4.7
2.5 2.5 2.6 1.5 1.2
0.6
(6.0)
(4.0)
(2.0)
-
2.0
4.0
6.0
8.0
Bra
zil
Russ
ia
India
Chin
a
South
Afr
ica
Indonesi
a
Mala
ysia
Thailand
UK
USA
Germ
any
Fra
nce
Japan
(%)
9.5
4.8
16.9
10.9
16.6
14.7
15.3
12.4
15.0
14.4
12.1
13.7
13.7
-
2.0
4.0
6.0
8.0
10.0
12.0
14.0
16.0
18.0
Bra
zil
Russia
Ind
ia
Ch
ina
So
uth
A
fric
a
Ind
onesi
a
Mala
ysia
Th
ailand
UK
US
A
Germ
an
y
Fra
nce
Jap
an
(x)
h
3
Market Outlook
January 27, 2016
www.angelbroking.com www.angelbroking.com
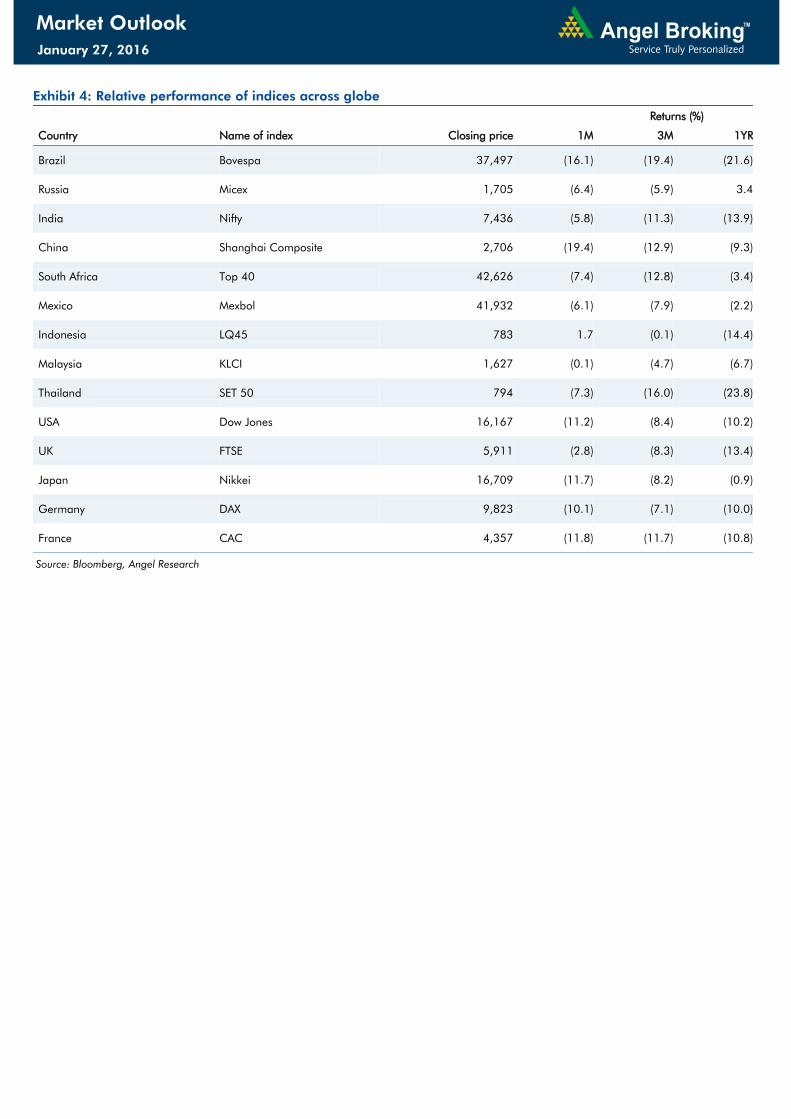
Exhibit 4: Relative performance of indices across globe
Returns (%)
Country Name of index Closing price 1M 3M 1YR
Brazil Bovespa 37,497 (16.1) (19.4) (21.6)
Russia Micex 1,705 (6.4) (5.9) 3.4
India Nifty 7,436 (5.8) (11.3) (13.9)
China Shanghai Composite 2,706 (19.4) (12.9) (9.3)
South Africa Top 40 42,626 (7.4) (12.8) (3.4)
Mexico Mexbol 41,932 (6.1) (7.9) (2.2)
Indonesia LQ45 783 1.7 (0.1) (14.4)
Malaysia KLCI 1,627 (0.1) (4.7) (6.7)
Thailand SET 50 794 (7.3) (16.0) (23.8)
USA Dow Jones 16,167 (11.2) (8.4) (10.2)
UK FTSE 5,911 (2.8) (8.3) (13.4)
Japan Nikkei 16,709 (11.7) (8.2) (0.9)
Germany DAX 9,823 (10.1) (7.1) (10.0)
France CAC 4,357 (11.8) (11.7) (10.8)
Source: Bloomberg, Angel Research
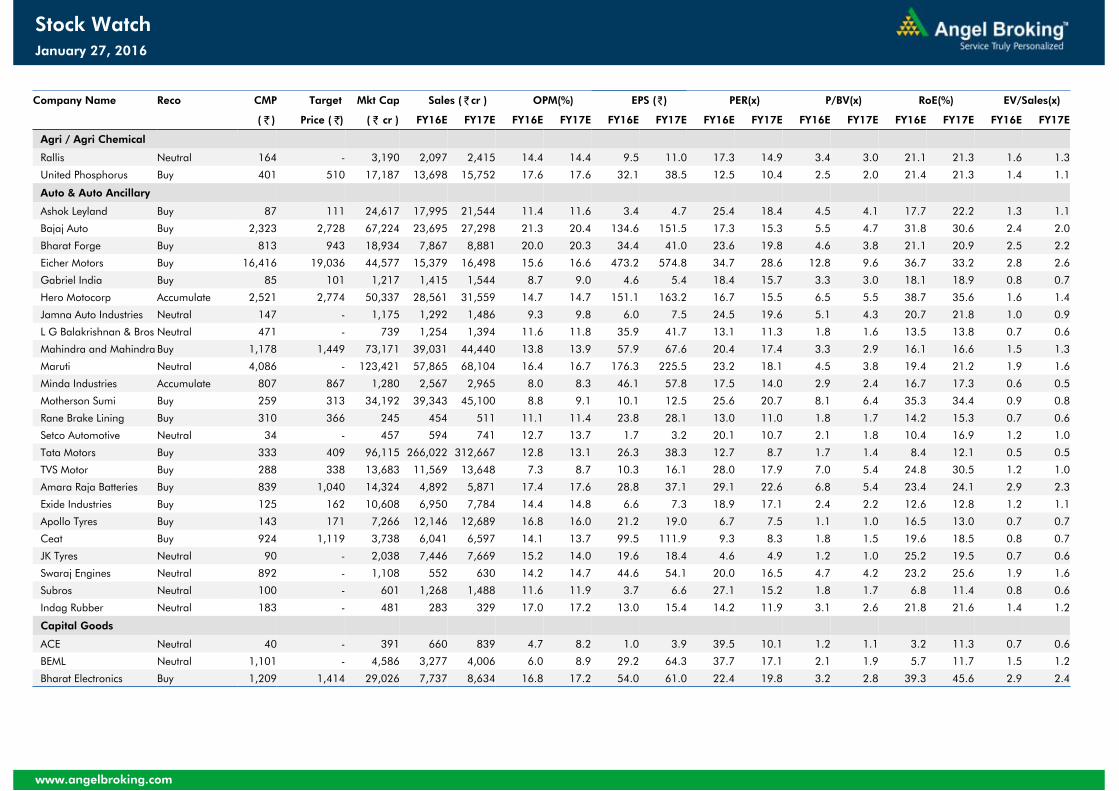
Company Name Reco CMP Target Mkt Cap Sales ( ₹cr ) OPM(%) EPS (₹) PER(x) P/BV(x) RoE(%) EV/Sales(x)
( ₹ ) Price ( ₹) ( ₹ cr ) FY16E FY17E FY16E FY17E FY16E FY17E FY16E FY17E FY16E FY17E FY16E FY17E FY16E FY17E
Agri / Agri Chemical
Rallis Neutral 164 - 3,190 2,097 2,415 14.4 14.4 9.5 11.0 17.3 14.9 3.4 3.0 21.1 21.3 1.6 1.3
United Phosphorus Buy 401 510 17,187 13,698 15,752 17.6 17.6 32.1 38.5 12.5 10.4 2.5 2.0 21.4 21.3 1.4 1.1
Auto & Auto Ancillary
Ashok Leyland Buy 87 111 24,617 17,995 21,544 11.4 11.6 3.4 4.7 25.4 18.4 4.5 4.1 17.7 22.2 1.3 1.1
Bajaj Auto Buy 2,323 2,728 67,224 23,695 27,298 21.3 20.4 134.6 151.5 17.3 15.3 5.5 4.7 31.8 30.6 2.4 2.0
Bharat Forge Buy 813 943 18,934 7,867 8,881 20.0 20.3 34.4 41.0 23.6 19.8 4.6 3.8 21.1 20.9 2.5 2.2
Eicher Motors Buy 16,416 19,036 44,577 15,379 16,498 15.6 16.6 473.2 574.8 34.7 28.6 12.8 9.6 36.7 33.2 2.8 2.6
Gabriel India Buy 85 101 1,217 1,415 1,544 8.7 9.0 4.6 5.4 18.4 15.7 3.3 3.0 18.1 18.9 0.8 0.7
Hero Motocorp Accumulate 2,521 2,774 50,337 28,561 31,559 14.7 14.7 151.1 163.2 16.7 15.5 6.5 5.5 38.7 35.6 1.6 1.4
Jamna Auto Industries Neutral 147 - 1,175 1,292 1,486 9.3 9.8 6.0 7.5 24.5 19.6 5.1 4.3 20.7 21.8 1.0 0.9
L G Balakrishnan & Bros Neutral 471 - 739 1,254 1,394 11.6 11.8 35.9 41.7 13.1 11.3 1.8 1.6 13.5 13.8 0.7 0.6
Mahindra and Mahindra Buy 1,178 1,449 73,171 39,031 44,440 13.8 13.9 57.9 67.6 20.4 17.4 3.3 2.9 16.1 16.6 1.5 1.3
Maruti Neutral 4,086 - 123,421 57,865 68,104 16.4 16.7 176.3 225.5 23.2 18.1 4.5 3.8 19.4 21.2 1.9 1.6
Minda Industries Accumulate 807 867 1,280 2,567 2,965 8.0 8.3 46.1 57.8 17.5 14.0 2.9 2.4 16.7 17.3 0.6 0.5
Motherson Sumi Buy 259 313 34,192 39,343 45,100 8.8 9.1 10.1 12.5 25.6 20.7 8.1 6.4 35.3 34.4 0.9 0.8
Rane Brake Lining Buy 310 366 245 454 511 11.1 11.4 23.8 28.1 13.0 11.0 1.8 1.7 14.2 15.3 0.7 0.6
Setco Automotive Neutral 34 - 457 594 741 12.7 13.7 1.7 3.2 20.1 10.7 2.1 1.8 10.4 16.9 1.2 1.0
Tata Motors Buy 333 409 96,115 266,022 312,667 12.8 13.1 26.3 38.3 12.7 8.7 1.7 1.4 8.4 12.1 0.5 0.5
TVS Motor Buy 288 338 13,683 11,569 13,648 7.3 8.7 10.3 16.1 28.0 17.9 7.0 5.4 24.8 30.5 1.2 1.0
Amara Raja Batteries Buy 839 1,040 14,324 4,892 5,871 17.4 17.6 28.8 37.1 29.1 22.6 6.8 5.4 23.4 24.1 2.9 2.3
Exide Industries Buy 125 162 10,608 6,950 7,784 14.4 14.8 6.6 7.3 18.9 17.1 2.4 2.2 12.6 12.8 1.2 1.1
Apollo Tyres Buy 143 171 7,266 12,146 12,689 16.8 16.0 21.2 19.0 6.7 7.5 1.1 1.0 16.5 13.0 0.7 0.7
Ceat Buy 924 1,119 3,738 6,041 6,597 14.1 13.7 99.5 111.9 9.3 8.3 1.8 1.5 19.6 18.5 0.8 0.7
JK Tyres Neutral 90 - 2,038 7,446 7,669 15.2 14.0 19.6 18.4 4.6 4.9 1.2 1.0 25.2 19.5 0.7 0.6
Swaraj Engines Neutral 892 - 1,108 552 630 14.2 14.7 44.6 54.1 20.0 16.5 4.7 4.2 23.2 25.6 1.9 1.6
Subros Neutral 100 - 601 1,268 1,488 11.6 11.9 3.7 6.6 27.1 15.2 1.8 1.7 6.8 11.4 0.8 0.6
Indag Rubber Neutral 183 - 481 283 329 17.0 17.2 13.0 15.4 14.2 11.9 3.1 2.6 21.8 21.6 1.4 1.2
Capital Goods
ACE Neutral 40 - 391 660 839 4.7 8.2 1.0 3.9 39.5 10.1 1.2 1.1 3.2 11.3 0.7 0.6
BEML Neutral 1,101 - 4,586 3,277 4,006 6.0 8.9 29.2 64.3 37.7 17.1 2.1 1.9 5.7 11.7 1.5 1.2
Bharat Electronics Buy 1,209 1,414 29,026 7,737 8,634 16.8 17.2 54.0 61.0 22.4 19.8 3.2 2.8 39.3 45.6 2.9 2.4
www.angelbroking.com
January 27, 2016
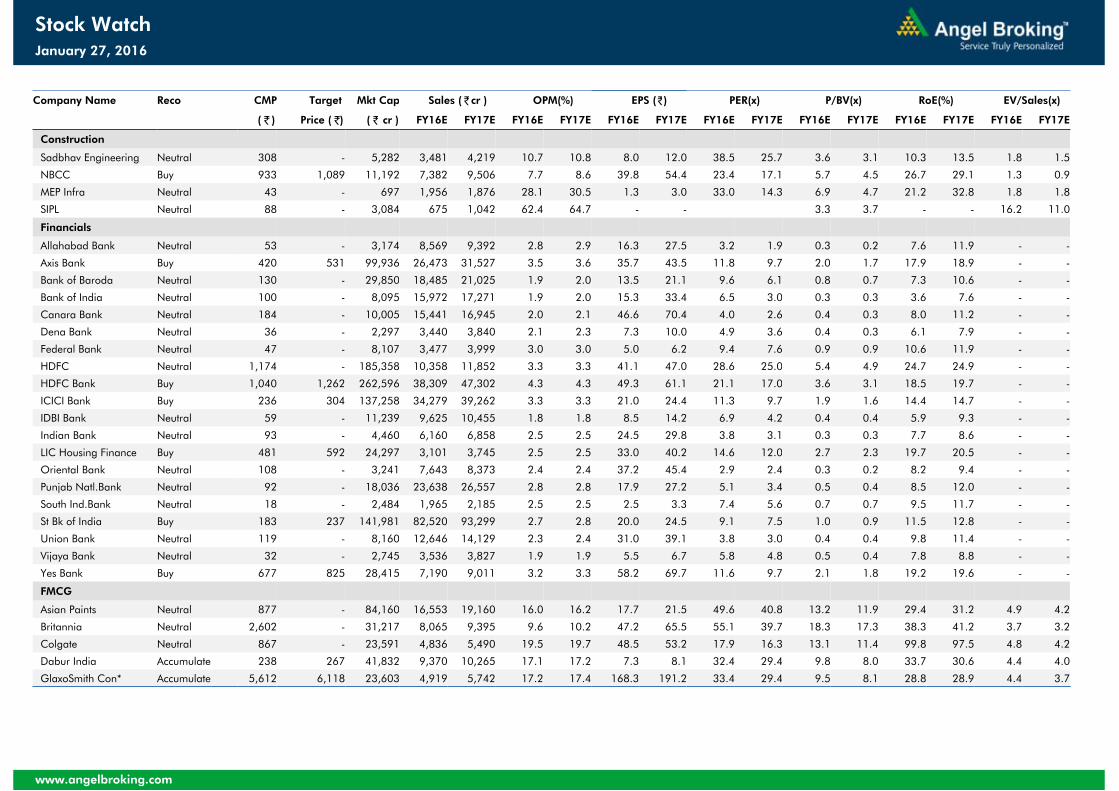
Stock Watch
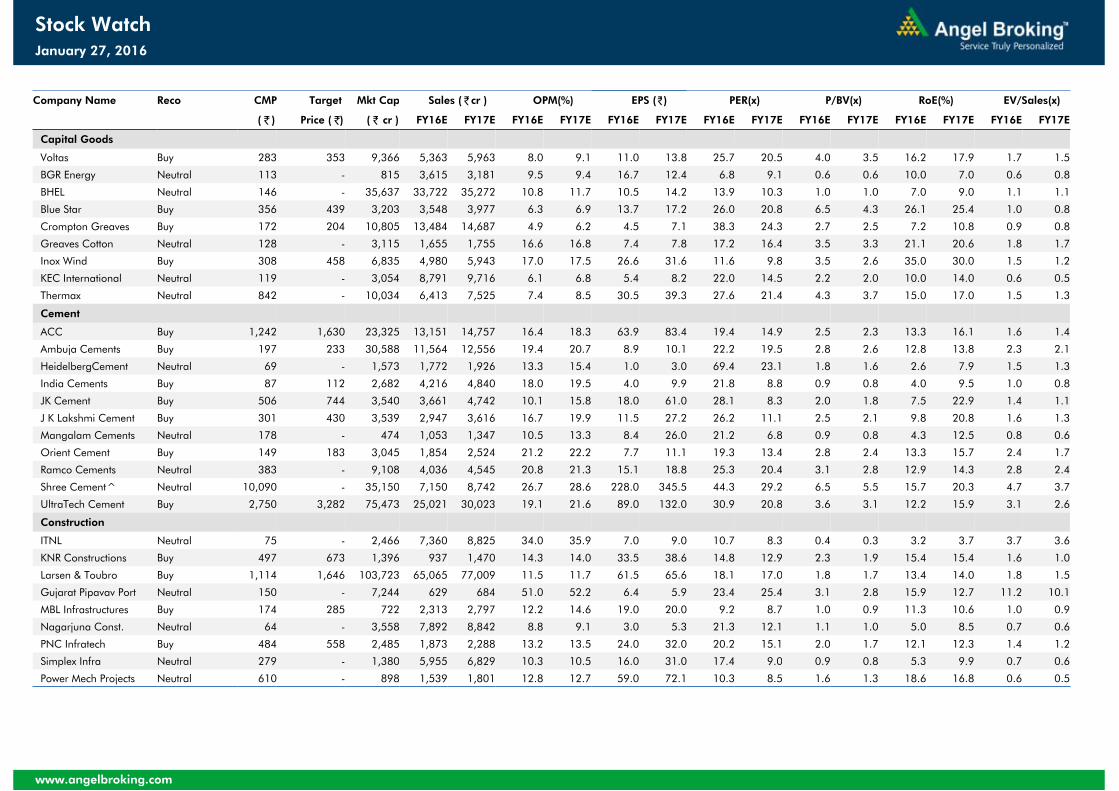
Company Name Reco CMP Target Mkt Cap Sales ( ₹cr ) OPM(%) EPS (₹) PER(x) P/BV(x) RoE(%) EV/Sales(x)
( ₹ ) Price ( ₹) ( ₹ cr ) FY16E FY17E FY16E FY17E FY16E FY17E FY16E FY17E FY16E FY17E FY16E FY17E FY16E FY17E
Capital Goods
Voltas Buy 283 353 9,366 5,363 5,963 8.0 9.1 11.0 13.8 25.7 20.5 4.0 3.5 16.2 17.9 1.7 1.5
BGR Energy Neutral 113 - 815 3,615 3,181 9.5 9.4 16.7 12.4 6.8 9.1 0.6 0.6 10.0 7.0 0.6 0.8
BHEL Neutral 146 - 35,637 33,722 35,272 10.8 11.7 10.5 14.2 13.9 10.3 1.0 1.0 7.0 9.0 1.1 1.1
Blue Star Buy 356 439 3,203 3,548 3,977 6.3 6.9 13.7 17.2 26.0 20.8 6.5 4.3 26.1 25.4 1.0 0.8
Crompton Greaves Buy 172 204 10,805 13,484 14,687 4.9 6.2 4.5 7.1 38.3 24.3 2.7 2.5 7.2 10.8 0.9 0.8
Greaves Cotton Neutral 128 - 3,115 1,655 1,755 16.6 16.8 7.4 7.8 17.2 16.4 3.5 3.3 21.1 20.6 1.8 1.7
Inox Wind Buy 308 458 6,835 4,980 5,943 17.0 17.5 26.6 31.6 11.6 9.8 3.5 2.6 35.0 30.0 1.5 1.2
KEC International Neutral 119 - 3,054 8,791 9,716 6.1 6.8 5.4 8.2 22.0 14.5 2.2 2.0 10.0 14.0 0.6 0.5
Thermax Neutral 842 - 10,034 6,413 7,525 7.4 8.5 30.5 39.3 27.6 21.4 4.3 3.7 15.0 17.0 1.5 1.3
Cement
ACC Buy 1,242 1,630 23,325 13,151 14,757 16.4 18.3 63.9 83.4 19.4 14.9 2.5 2.3 13.3 16.1 1.6 1.4
Ambuja Cements Buy 197 233 30,588 11,564 12,556 19.4 20.7 8.9 10.1 22.2 19.5 2.8 2.6 12.8 13.8 2.3 2.1
HeidelbergCement Neutral 69 - 1,573 1,772 1,926 13.3 15.4 1.0 3.0 69.4 23.1 1.8 1.6 2.6 7.9 1.5 1.3
India Cements Buy 87 112 2,682 4,216 4,840 18.0 19.5 4.0 9.9 21.8 8.8 0.9 0.8 4.0 9.5 1.0 0.8
JK Cement Buy 506 744 3,540 3,661 4,742 10.1 15.8 18.0 61.0 28.1 8.3 2.0 1.8 7.5 22.9 1.4 1.1
J K Lakshmi Cement Buy 301 430 3,539 2,947 3,616 16.7 19.9 11.5 27.2 26.2 11.1 2.5 2.1 9.8 20.8 1.6 1.3
Mangalam Cements Neutral 178 - 474 1,053 1,347 10.5 13.3 8.4 26.0 21.2 6.8 0.9 0.8 4.3 12.5 0.8 0.6
Orient Cement Buy 149 183 3,045 1,854 2,524 21.2 22.2 7.7 11.1 19.3 13.4 2.8 2.4 13.3 15.7 2.4 1.7
Ramco Cements Neutral 383 - 9,108 4,036 4,545 20.8 21.3 15.1 18.8 25.3 20.4 3.1 2.8 12.9 14.3 2.8 2.4
Shree Cement^ Neutral 10,090 - 35,150 7,150 8,742 26.7 28.6 228.0 345.5 44.3 29.2 6.5 5.5 15.7 20.3 4.7 3.7
UltraTech Cement Buy 2,750 3,282 75,473 25,021 30,023 19.1 21.6 89.0 132.0 30.9 20.8 3.6 3.1 12.2 15.9 3.1 2.6
Construction
ITNL Neutral 75 - 2,466 7,360 8,825 34.0 35.9 7.0 9.0 10.7 8.3 0.4 0.3 3.2 3.7 3.7 3.6
KNR Constructions Buy 497 673 1,396 937 1,470 14.3 14.0 33.5 38.6 14.8 12.9 2.3 1.9 15.4 15.4 1.6 1.0
Larsen & Toubro Buy 1,114 1,646 103,723 65,065 77,009 11.5 11.7 61.5 65.6 18.1 17.0 1.8 1.7 13.4 14.0 1.8 1.5
Gujarat Pipavav Port Neutral 150 - 7,244 629 684 51.0 52.2 6.4 5.9 23.4 25.4 3.1 2.8 15.9 12.7 11.2 10.1
MBL Infrastructures Buy 174 285 722 2,313 2,797 12.2 14.6 19.0 20.0 9.2 8.7 1.0 0.9 11.3 10.6 1.0 0.9
Nagarjuna Const. Neutral 64 - 3,558 7,892 8,842 8.8 9.1 3.0 5.3 21.3 12.1 1.1 1.0 5.0 8.5 0.7 0.6
PNC Infratech Buy 484 558 2,485 1,873 2,288 13.2 13.5 24.0 32.0 20.2 15.1 2.0 1.7 12.1 12.3 1.4 1.2
Simplex Infra Neutral 279 - 1,380 5,955 6,829 10.3 10.5 16.0 31.0 17.4 9.0 0.9 0.8 5.3 9.9 0.7 0.6
Power Mech Projects Neutral 610 - 898 1,539 1,801 12.8 12.7 59.0 72.1 10.3 8.5 1.6 1.3 18.6 16.8 0.6 0.5
www.angelbroking.com
January 27, 2016
Stock Watch
Company Name Reco CMP Target Mkt Cap Sales ( ₹cr ) OPM(%) EPS (₹) PER(x) P/BV(x) RoE(%) EV/Sales(x)
( ₹ ) Price ( ₹) ( ₹ cr ) FY16E FY17E FY16E FY17E FY16E FY17E FY16E FY17E FY16E FY17E FY16E FY17E FY16E FY17E
Construction
Sadbhav Engineering Neutral 308 - 5,282 3,481 4,219 10.7 10.8 8.0 12.0 38.5 25.7 3.6 3.1 10.3 13.5 1.8 1.5
NBCC Buy 933 1,089 11,192 7,382 9,506 7.7 8.6 39.8 54.4 23.4 17.1 5.7 4.5 26.7 29.1 1.3 0.9
MEP Infra Neutral 43 - 697 1,956 1,876 28.1 30.5 1.3 3.0 33.0 14.3 6.9 4.7 21.2 32.8 1.8 1.8
SIPL Neutral 88 - 3,084 675 1,042 62.4 64.7 - - 3.3 3.7 - - 16.2 11.0
Financials
Allahabad Bank Neutral 53 - 3,174 8,569 9,392 2.8 2.9 16.3 27.5 3.2 1.9 0.3 0.2 7.6 11.9 - -
Axis Bank Buy 420 531 99,936 26,473 31,527 3.5 3.6 35.7 43.5 11.8 9.7 2.0 1.7 17.9 18.9 - -
Bank of Baroda Neutral 130 - 29,850 18,485 21,025 1.9 2.0 13.5 21.1 9.6 6.1 0.8 0.7 7.3 10.6 - -
Bank of India Neutral 100 - 8,095 15,972 17,271 1.9 2.0 15.3 33.4 6.5 3.0 0.3 0.3 3.6 7.6 - -
Canara Bank Neutral 184 - 10,005 15,441 16,945 2.0 2.1 46.6 70.4 4.0 2.6 0.4 0.3 8.0 11.2 - -
Dena Bank Neutral 36 - 2,297 3,440 3,840 2.1 2.3 7.3 10.0 4.9 3.6 0.4 0.3 6.1 7.9 - -
Federal Bank Neutral 47 - 8,107 3,477 3,999 3.0 3.0 5.0 6.2 9.4 7.6 0.9 0.9 10.6 11.9 - -
HDFC Neutral 1,174 - 185,358 10,358 11,852 3.3 3.3 41.1 47.0 28.6 25.0 5.4 4.9 24.7 24.9 - -
HDFC Bank Buy 1,040 1,262 262,596 38,309 47,302 4.3 4.3 49.3 61.1 21.1 17.0 3.6 3.1 18.5 19.7 - -
ICICI Bank Buy 236 304 137,258 34,279 39,262 3.3 3.3 21.0 24.4 11.3 9.7 1.9 1.6 14.4 14.7 - -
IDBI Bank Neutral 59 - 11,239 9,625 10,455 1.8 1.8 8.5 14.2 6.9 4.2 0.4 0.4 5.9 9.3 - -
Indian Bank Neutral 93 - 4,460 6,160 6,858 2.5 2.5 24.5 29.8 3.8 3.1 0.3 0.3 7.7 8.6 - -
LIC Housing Finance Buy 481 592 24,297 3,101 3,745 2.5 2.5 33.0 40.2 14.6 12.0 2.7 2.3 19.7 20.5 - -
Oriental Bank Neutral 108 - 3,241 7,643 8,373 2.4 2.4 37.2 45.4 2.9 2.4 0.3 0.2 8.2 9.4 - -
Punjab Natl.Bank Neutral 92 - 18,036 23,638 26,557 2.8 2.8 17.9 27.2 5.1 3.4 0.5 0.4 8.5 12.0 - -
South Ind.Bank Neutral 18 - 2,484 1,965 2,185 2.5 2.5 2.5 3.3 7.4 5.6 0.7 0.7 9.5 11.7 - -
St Bk of India Buy 183 237 141,981 82,520 93,299 2.7 2.8 20.0 24.5 9.1 7.5 1.0 0.9 11.5 12.8 - -
Union Bank Neutral 119 - 8,160 12,646 14,129 2.3 2.4 31.0 39.1 3.8 3.0 0.4 0.4 9.8 11.4 - -
Vijaya Bank Neutral 32 - 2,745 3,536 3,827 1.9 1.9 5.5 6.7 5.8 4.8 0.5 0.4 7.8 8.8 - -
Yes Bank Buy 677 825 28,415 7,190 9,011 3.2 3.3 58.2 69.7 11.6 9.7 2.1 1.8 19.2 19.6 - -
FMCG
Asian Paints Neutral 877 - 84,160 16,553 19,160 16.0 16.2 17.7 21.5 49.6 40.8 13.2 11.9 29.4 31.2 4.9 4.2
Britannia Neutral 2,602 - 31,217 8,065 9,395 9.6 10.2 47.2 65.5 55.1 39.7 18.3 17.3 38.3 41.2 3.7 3.2
Colgate Neutral 867 - 23,591 4,836 5,490 19.5 19.7 48.5 53.2 17.9 16.3 13.1 11.4 99.8 97.5 4.8 4.2
Dabur India Accumulate 238 267 41,832 9,370 10,265 17.1 17.2 7.3 8.1 32.4 29.4 9.8 8.0 33.7 30.6 4.4 4.0
GlaxoSmith Con* Accumulate 5,612 6,118 23,603 4,919 5,742 17.2 17.4 168.3 191.2 33.4 29.4 9.5 8.1 28.8 28.9 4.4 3.7
www.angelbroking.com
January 27, 2016
Stock Watch

Company Name Reco CMP Target Mkt Cap Sales ( ₹cr ) OPM(%) EPS (₹) PER(x) P/BV(x) RoE(%) EV/Sales(x)
( ₹ ) Price ( ₹) ( ₹ cr ) FY16E FY17E FY16E FY17E FY16E FY17E FY16E FY17E FY16E FY17E FY16E FY17E FY16E FY17E
FMCG
Godrej Consumer Neutral 1,150 - 39,168 10,168 12,886 16.1 16.1 32.1 38.4 35.8 30.0 7.3 6.7 19.7 21.0 4.0 3.1
HUL Neutral 782 - 169,139 34,940 38,957 17.5 17.7 20.8 24.7 37.6 31.7 41.8 33.4 110.5 114.2 4.6 4.1
ITC Buy 310 382 248,776 41,068 45,068 37.8 37.4 13.9 15.9 22.2 19.5 7.5 6.6 34.1 33.8 5.7 5.1
Marico Neutral 215 - 27,745 6,551 7,766 15.7 16.0 10.4 12.5 20.7 17.2 6.0 5.0 33.2 32.4 4.2 3.5
Nestle* Buy 5,464 6,646 52,682 11,291 12,847 22.2 22.3 158.9 184.6 34.4 29.6 18.0 16.2 55.0 57.3 4.5 3.9
Tata Global Buy 124 144 7,845 8,635 9,072 9.8 9.9 6.5 7.6 19.1 16.4 1.9 1.8 6.8 7.4 0.8 0.8
IT
HCL Tech^ Buy 840 1,038 118,376 42,038 47,503 21.2 21.5 51.5 57.7 16.3 14.6 3.5 2.7 21.5 18.8 2.4 2.0
Infosys Buy 1,138 1,347 261,312 61,850 69,981 27.5 27.5 59.4 65.7 19.2 17.3 4.1 3.5 21.2 20.1 3.5 3.0
TCS Buy 2,306 2,854 454,371 108,487 122,590 28.3 28.5 122.8 138.4 18.8 16.7 7.1 6.5 38.0 38.9 3.8 3.3
Tech Mahindra Buy 514 646 49,739 25,566 28,890 16.0 17.0 26.3 31.9 19.6 16.1 3.5 3.0 17.9 18.6 1.7 1.5
Wipro Buy 547 719 135,098 50,808 58,713 23.7 23.8 37.3 42.3 14.7 12.9 2.8 2.5 19.0 17.9 2.2 1.8
Media
D B Corp Accumulate 316 356 5,811 2,241 2,495 27.8 27.9 21.8 25.6 14.5 12.4 3.8 3.4 26.7 28.5 2.5 2.3
HT Media Neutral 79 - 1,845 2,495 2,603 11.2 11.2 7.3 8.6 10.9 9.2 0.9 0.8 7.4 8.1 0.2 0.2
Jagran Prakashan Accumulate 165 189 5,392 2,170 2,355 27.2 26.2 8.9 9.9 18.5 16.7 3.9 3.4 20.9 20.5 2.4 2.2
Sun TV Network Neutral 355 - 14,004 2,779 3,196 70.2 70.5 22.8 27.3 15.6 13.0 3.8 3.5 26.7 28.3 4.8 4.1Hindustan Media Ventures Neutral 270 - 1,983 920 1,031 20.0 20.0 19.2 20.9 14.1 12.9 2.3 2.0 16.4 15.3 1.7 1.5
Metals & Mining
Coal India Buy 305 380 192,333 76,167 84,130 19.9 22.3 22.4 25.8 13.6 11.8 4.9 4.8 35.5 41.0 1.9 1.7
Hind. Zinc Buy 151 175 63,845 14,641 14,026 50.4 50.4 17.7 16.0 8.6 9.4 1.3 1.2 16.2 13.2 2.0 1.8
Hindalco Neutral 72 - 14,878 104,356 111,186 8.7 9.5 6.7 11.1 10.7 6.5 0.4 0.4 3.5 5.9 0.7 0.6
JSW Steel Neutral 1,107 - 26,768 42,308 45,147 16.4 20.7 (10.3) 49.5 22.4 1.2 1.2 (1.0) 5.6 1.7 1.6
NMDC Neutral 81 - 31,936 8,237 10,893 46.6 44.5 10.0 11.7 8.1 6.9 0.9 0.8 12.5 13.0 3.7 2.8
SAIL Neutral 44 - 17,966 45,915 53,954 7.2 10.5 1.5 4.4 28.9 9.9 0.4 0.4 2.3 4.1 1.0 0.9
Vedanta Neutral 64 - 19,093 71,445 81,910 26.2 26.3 12.9 19.2 5.0 3.4 0.4 0.3 7.2 8.9 0.7 0.5
Tata Steel Neutral 254 - 24,654 126,760 137,307 8.9 11.3 6.4 23.1 39.9 11.0 0.8 0.8 2.0 7.1 0.8 0.7
Oil & Gas
Cairn India Neutral 119 - 22,292 11,323 12,490 49.4 51.0 20.7 20.7 5.7 5.8 0.4 0.4 6.4 6.1 1.0 0.4
GAIL Neutral 356 - 45,170 64,856 70,933 9.1 9.6 24.0 28.9 14.9 12.3 1.3 1.2 8.8 9.6 0.9 0.8
ONGC Neutral 220 - 188,092 154,564 167,321 36.8 37.4 28.6 32.5 7.7 6.8 1.0 0.9 12.7 13.5 1.4 1.3
Petronet LNG Neutral 251 - 18,844 29,691 31,188 5.8 6.2 12.8 13.4 19.7 18.7 2.9 2.6 15.8 14.8 0.7 0.7
Indian Oil Corp Buy 396 455 96,026 359,607 402,760 5.9 6.1 42.5 48.7 9.3 8.1 1.2 1.1 14.1 14.4 0.4 0.3
www.angelbroking.com
January 27, 2016
Stock Watch
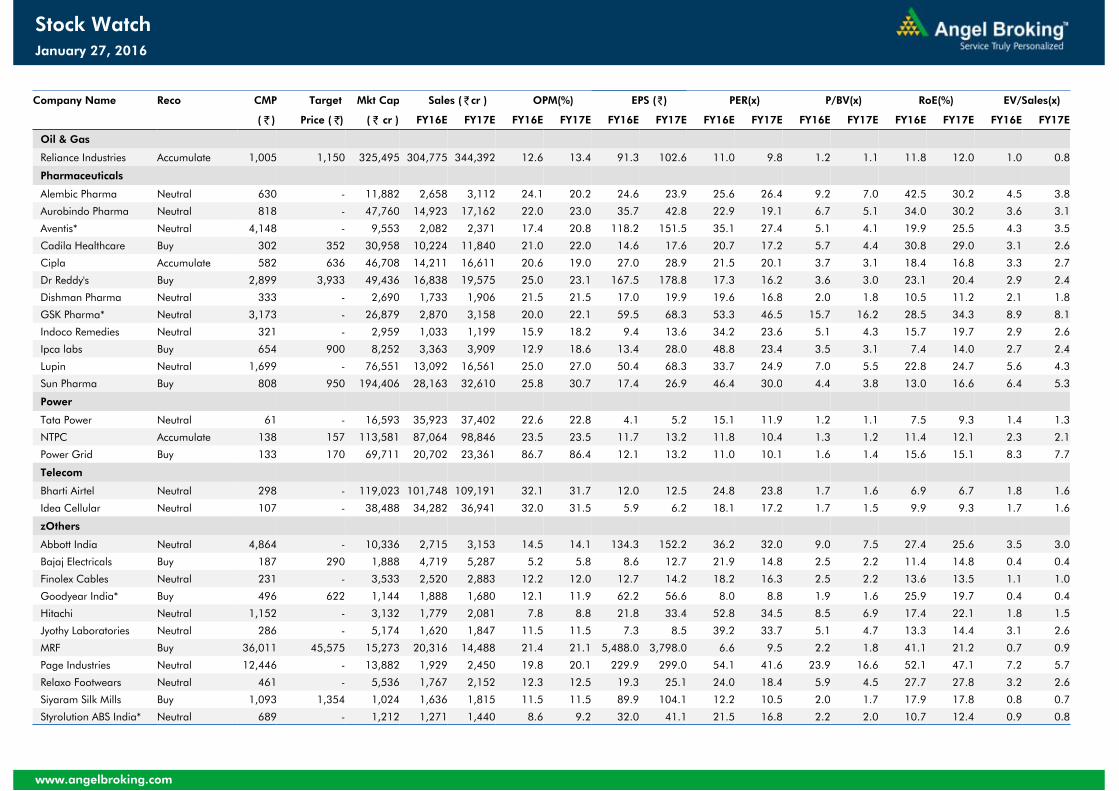
Company Name Reco CMP Target Mkt Cap Sales ( ₹cr ) OPM(%) EPS (₹) PER(x) P/BV(x) RoE(%) EV/Sales(x)
( ₹ ) Price ( ₹) ( ₹ cr ) FY16E FY17E FY16E FY17E FY16E FY17E FY16E FY17E FY16E FY17E FY16E FY17E FY16E FY17E
Oil & Gas
Reliance Industries Accumulate 1,005 1,150 325,495 304,775 344,392 12.6 13.4 91.3 102.6 11.0 9.8 1.2 1.1 11.8 12.0 1.0 0.8
Pharmaceuticals
Alembic Pharma Neutral 630 - 11,882 2,658 3,112 24.1 20.2 24.6 23.9 25.6 26.4 9.2 7.0 42.5 30.2 4.5 3.8
Aurobindo Pharma Neutral 818 - 47,760 14,923 17,162 22.0 23.0 35.7 42.8 22.9 19.1 6.7 5.1 34.0 30.2 3.6 3.1
Aventis* Neutral 4,148 - 9,553 2,082 2,371 17.4 20.8 118.2 151.5 35.1 27.4 5.1 4.1 19.9 25.5 4.3 3.5
Cadila Healthcare Buy 302 352 30,958 10,224 11,840 21.0 22.0 14.6 17.6 20.7 17.2 5.7 4.4 30.8 29.0 3.1 2.6
Cipla Accumulate 582 636 46,708 14,211 16,611 20.6 19.0 27.0 28.9 21.5 20.1 3.7 3.1 18.4 16.8 3.3 2.7
Dr Reddy's Buy 2,899 3,933 49,436 16,838 19,575 25.0 23.1 167.5 178.8 17.3 16.2 3.6 3.0 23.1 20.4 2.9 2.4
Dishman Pharma Neutral 333 - 2,690 1,733 1,906 21.5 21.5 17.0 19.9 19.6 16.8 2.0 1.8 10.5 11.2 2.1 1.8
GSK Pharma* Neutral 3,173 - 26,879 2,870 3,158 20.0 22.1 59.5 68.3 53.3 46.5 15.7 16.2 28.5 34.3 8.9 8.1
Indoco Remedies Neutral 321 - 2,959 1,033 1,199 15.9 18.2 9.4 13.6 34.2 23.6 5.1 4.3 15.7 19.7 2.9 2.6
Ipca labs Buy 654 900 8,252 3,363 3,909 12.9 18.6 13.4 28.0 48.8 23.4 3.5 3.1 7.4 14.0 2.7 2.4
Lupin Neutral 1,699 - 76,551 13,092 16,561 25.0 27.0 50.4 68.3 33.7 24.9 7.0 5.5 22.8 24.7 5.6 4.3
Sun Pharma Buy 808 950 194,406 28,163 32,610 25.8 30.7 17.4 26.9 46.4 30.0 4.4 3.8 13.0 16.6 6.4 5.3
Power
Tata Power Neutral 61 - 16,593 35,923 37,402 22.6 22.8 4.1 5.2 15.1 11.9 1.2 1.1 7.5 9.3 1.4 1.3
NTPC Accumulate 138 157 113,581 87,064 98,846 23.5 23.5 11.7 13.2 11.8 10.4 1.3 1.2 11.4 12.1 2.3 2.1
Power Grid Buy 133 170 69,711 20,702 23,361 86.7 86.4 12.1 13.2 11.0 10.1 1.6 1.4 15.6 15.1 8.3 7.7
Telecom
Bharti Airtel Neutral 298 - 119,023 101,748 109,191 32.1 31.7 12.0 12.5 24.8 23.8 1.7 1.6 6.9 6.7 1.8 1.6
Idea Cellular Neutral 107 - 38,488 34,282 36,941 32.0 31.5 5.9 6.2 18.1 17.2 1.7 1.5 9.9 9.3 1.7 1.6
zOthers
Abbott India Neutral 4,864 - 10,336 2,715 3,153 14.5 14.1 134.3 152.2 36.2 32.0 9.0 7.5 27.4 25.6 3.5 3.0
Bajaj Electricals Buy 187 290 1,888 4,719 5,287 5.2 5.8 8.6 12.7 21.9 14.8 2.5 2.2 11.4 14.8 0.4 0.4
Finolex Cables Neutral 231 - 3,533 2,520 2,883 12.2 12.0 12.7 14.2 18.2 16.3 2.5 2.2 13.6 13.5 1.1 1.0
Goodyear India* Buy 496 622 1,144 1,888 1,680 12.1 11.9 62.2 56.6 8.0 8.8 1.9 1.6 25.9 19.7 0.4 0.4
Hitachi Neutral 1,152 - 3,132 1,779 2,081 7.8 8.8 21.8 33.4 52.8 34.5 8.5 6.9 17.4 22.1 1.8 1.5
Jyothy Laboratories Neutral 286 - 5,174 1,620 1,847 11.5 11.5 7.3 8.5 39.2 33.7 5.1 4.7 13.3 14.4 3.1 2.6
MRF Buy 36,011 45,575 15,273 20,316 14,488 21.4 21.1 5,488.0 3,798.0 6.6 9.5 2.2 1.8 41.1 21.2 0.7 0.9
Page Industries Neutral 12,446 - 13,882 1,929 2,450 19.8 20.1 229.9 299.0 54.1 41.6 23.9 16.6 52.1 47.1 7.2 5.7
Relaxo Footwears Neutral 461 - 5,536 1,767 2,152 12.3 12.5 19.3 25.1 24.0 18.4 5.9 4.5 27.7 27.8 3.2 2.6
Siyaram Silk Mills Buy 1,093 1,354 1,024 1,636 1,815 11.5 11.5 89.9 104.1 12.2 10.5 2.0 1.7 17.9 17.8 0.8 0.7
Styrolution ABS India* Neutral 689 - 1,212 1,271 1,440 8.6 9.2 32.0 41.1 21.5 16.8 2.2 2.0 10.7 12.4 0.9 0.8
www.angelbroking.com
January 27, 2016
Stock Watch
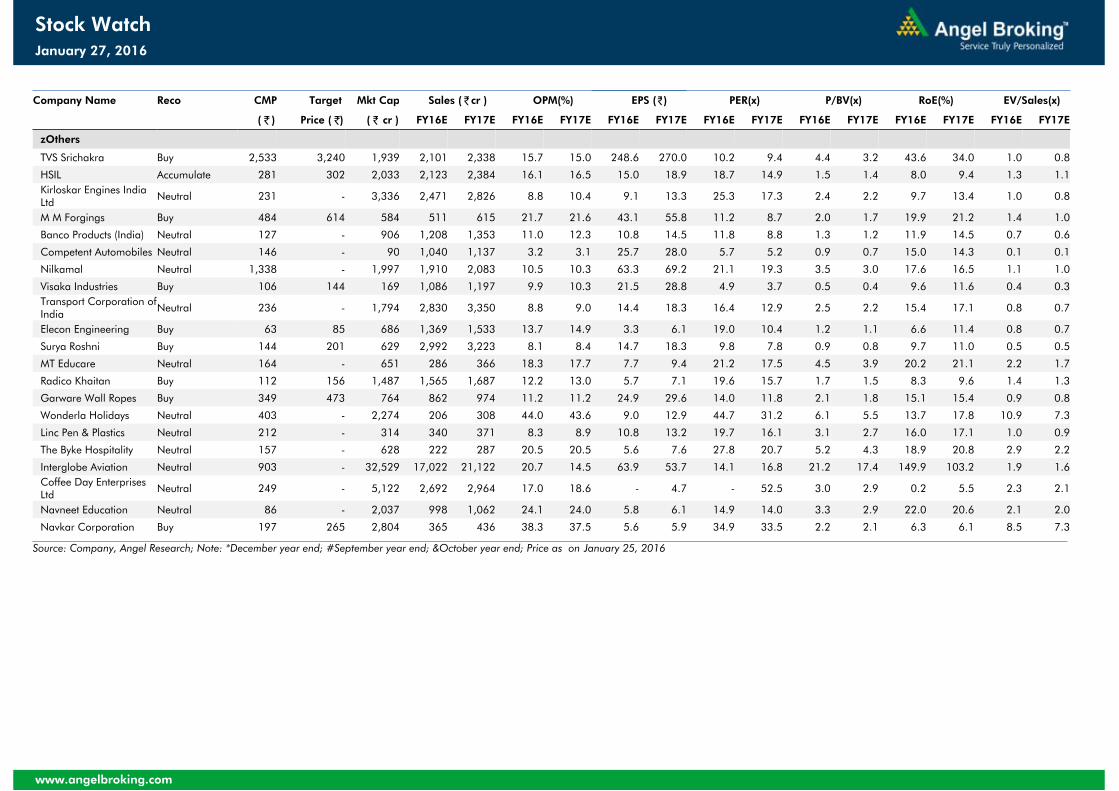
Company Name Reco CMP Target Mkt Cap Sales ( ₹cr ) OPM(%) EPS (₹) PER(x) P/BV(x) RoE(%) EV/Sales(x)
( ₹ ) Price ( ₹) ( ₹ cr ) FY16E FY17E FY16E FY17E FY16E FY17E FY16E FY17E FY16E FY17E FY16E FY17E FY16E FY17E
zOthers
TVS Srichakra Buy 2,533 3,240 1,939 2,101 2,338 15.7 15.0 248.6 270.0 10.2 9.4 4.4 3.2 43.6 34.0 1.0 0.8
HSIL Accumulate 281 302 2,033 2,123 2,384 16.1 16.5 15.0 18.9 18.7 14.9 1.5 1.4 8.0 9.4 1.3 1.1Kirloskar Engines India Ltd Neutral 231 - 3,336 2,471 2,826 8.8 10.4 9.1 13.3 25.3 17.3 2.4 2.2 9.7 13.4 1.0 0.8
M M Forgings Buy 484 614 584 511 615 21.7 21.6 43.1 55.8 11.2 8.7 2.0 1.7 19.9 21.2 1.4 1.0
Banco Products (India) Neutral 127 - 906 1,208 1,353 11.0 12.3 10.8 14.5 11.8 8.8 1.3 1.2 11.9 14.5 0.7 0.6
Competent Automobiles Neutral 146 - 90 1,040 1,137 3.2 3.1 25.7 28.0 5.7 5.2 0.9 0.7 15.0 14.3 0.1 0.1
Nilkamal Neutral 1,338 - 1,997 1,910 2,083 10.5 10.3 63.3 69.2 21.1 19.3 3.5 3.0 17.6 16.5 1.1 1.0
Visaka Industries Buy 106 144 169 1,086 1,197 9.9 10.3 21.5 28.8 4.9 3.7 0.5 0.4 9.6 11.6 0.4 0.3Transport Corporation of India Neutral 236 - 1,794 2,830 3,350 8.8 9.0 14.4 18.3 16.4 12.9 2.5 2.2 15.4 17.1 0.8 0.7
Elecon Engineering Buy 63 85 686 1,369 1,533 13.7 14.9 3.3 6.1 19.0 10.4 1.2 1.1 6.6 11.4 0.8 0.7
Surya Roshni Buy 144 201 629 2,992 3,223 8.1 8.4 14.7 18.3 9.8 7.8 0.9 0.8 9.7 11.0 0.5 0.5
MT Educare Neutral 164 - 651 286 366 18.3 17.7 7.7 9.4 21.2 17.5 4.5 3.9 20.2 21.1 2.2 1.7
Radico Khaitan Buy 112 156 1,487 1,565 1,687 12.2 13.0 5.7 7.1 19.6 15.7 1.7 1.5 8.3 9.6 1.4 1.3
Garware Wall Ropes Buy 349 473 764 862 974 11.2 11.2 24.9 29.6 14.0 11.8 2.1 1.8 15.1 15.4 0.9 0.8
Wonderla Holidays Neutral 403 - 2,274 206 308 44.0 43.6 9.0 12.9 44.7 31.2 6.1 5.5 13.7 17.8 10.9 7.3
Linc Pen & Plastics Neutral 212 - 314 340 371 8.3 8.9 10.8 13.2 19.7 16.1 3.1 2.7 16.0 17.1 1.0 0.9
The Byke Hospitality Neutral 157 - 628 222 287 20.5 20.5 5.6 7.6 27.8 20.7 5.2 4.3 18.9 20.8 2.9 2.2
Interglobe Aviation Neutral 903 - 32,529 17,022 21,122 20.7 14.5 63.9 53.7 14.1 16.8 21.2 17.4 149.9 103.2 1.9 1.6Coffee Day Enterprises Ltd Neutral 249 - 5,122 2,692 2,964 17.0 18.6 - 4.7 - 52.5 3.0 2.9 0.2 5.5 2.3 2.1
Navneet Education Neutral 86 - 2,037 998 1,062 24.1 24.0 5.8 6.1 14.9 14.0 3.3 2.9 22.0 20.6 2.1 2.0
Navkar Corporation Buy 197 265 2,804 365 436 38.3 37.5 5.6 5.9 34.9 33.5 2.2 2.1 6.3 6.1 8.5 7.3
Source: Company, Angel Research; Note: *December year end; #September year end; &October year end; Price as on January 25, 2016
www.angelbroking.com
January 27, 2016
Stock Watch

Research Team Tel: 022 - 39357800 E-mail: [email protected] Website: www.angelbroking.com
DISCLAIMER
Angel Broking Private Limited (hereinafter referred to as “Angel”) is a registered Member of National Stock Exchange of India Limited, Bombay Stock Exchange Limited and Metropolitian Stock Exchange of India Limited. It is also registered as a Depository Participant with CDSL and Portfolio Manager with SEBI. It also has registration with AMFI as a Mutual Fund Distributor. Angel Broking Private Limited is a registered entity with SEBI for Research Analyst in terms of SEBI (Research Analyst) Regulations, 2014 vide registration number INH000000164. Angel or its associates has not been debarred/ suspended by SEBI or any other regulatory authority for accessing /dealing in securities Market. Angel or its associates including its relatives/analyst do not hold any financial interest/beneficial ownership of more than 1% in the company covered by Analyst. Angel or its associates/analyst has not received any compensation / managed or co-managed public offering of securities of the company covered by Analyst during the past twelve months. Angel/analyst has not served as an officer, director or employee of company covered by Analyst and has not been engaged in market making activity of the company covered by Analyst.
This document is solely for the personal information of the recipient, and must not be singularly used as the basis of any investment decision. Nothing in this document should be construed as investment or financial advice. Each recipient of this document should make such investigations as they deem necessary to arrive at an independent evaluation of an investment in the securities of the companies referred to in this document (including the merits and risks involved), and should consult their own advisors to determine the merits and risks of such an investment.
Reports based on technical and derivative analysis center on studying charts of a stock's price movement, outstanding positions and trading volume, as opposed to focusing on a company's fundamentals and, as such, may not match with a report on a company's fundamentals.
The information in this document has been printed on the basis of publicly available information, internal data and other reliable sources believed to be true, but we do not represent that it is accurate or complete and it should not be relied on as such, as this document is for general guidance only. Angel Broking Pvt. Limited or any of its affiliates/ group companies shall not be in any way responsible for any loss or damage that may arise to any person from any inadvertent error in the information contained in this report. Angel Broking Pvt. Limited has not independently verified all the information contained within this document. Accordingly, we cannot testify, nor make any representation or warranty, express or implied, to the accuracy, contents or data contained within this document. While Angel Broking Pvt. Limited endeavors to update on a reasonable basis the information discussed in this material, there may be regulatory, compliance, or other reasons that prevent us from doing so.
This document is being supplied to you solely for your information, and its contents, information or data may not be reproduced, redistributed or passed on, directly or indirectly.
Neither Angel Broking Pvt. Limited, nor its directors, employees or affiliates shall be liable for any loss or damage that may arise from or in connection with the use of this information.
Note: Please refer to the important ‘Stock Holding Disclosure' report on the Angel website (Research Section). Also, please refer to the latest update on respective stocks for the disclosure status in respect of those stocks. Angel Broking Pvt. Limited and its affiliates may have investment positions in the stocks recommended in this report.
www.angelbroking.com
Market OutlookJanuary 27, 2016
Recommended