
Manufacturing Analytics: Synergies between Engineering and Statistics
Dr. Jianjun Shi
H. Milton Stewart School of Industrial and Systems EngineeringGeorgia Institute of Technology
(http://www2.isye.gatech.edu/~jshi33/)
2
Outline
1. Introduction and Manufacturing Analytics2. Synergies between Engineering and Statistics
• Bleeds detection in continuous casting• Causation-based process control for rolling• Tonnage signature analysis for stamping• Nano powder manufacturing scale-up• Stream of Variation methodologies for multistage
manufacturing processes 3. Summary
3
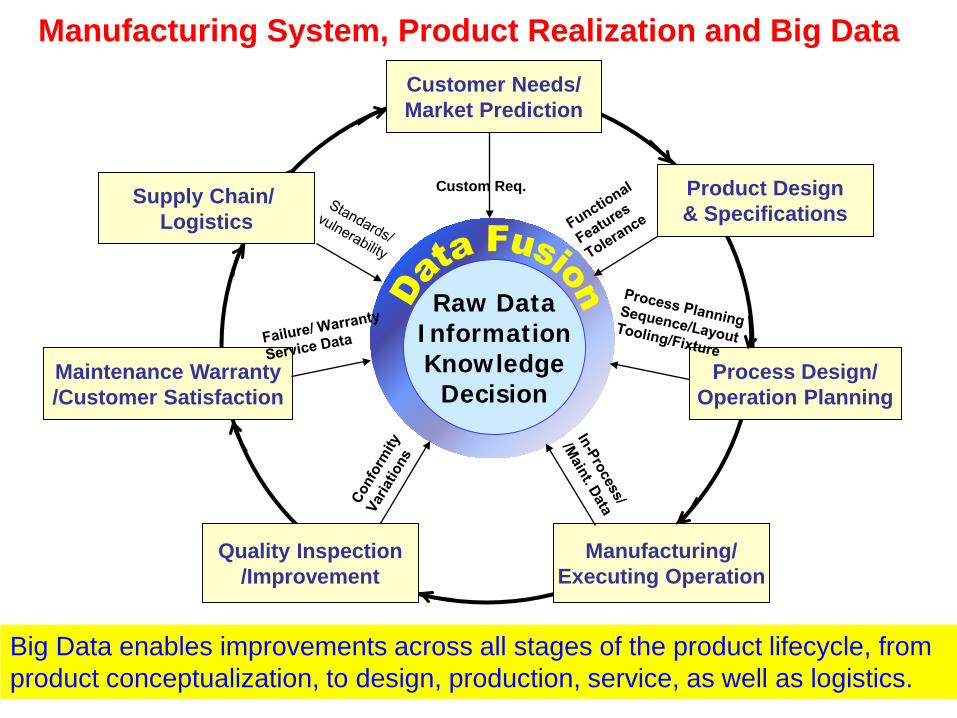
Manufacturing System, Product Realization and Big DataCustomer Needs/Market Prediction
Manufacturing/Executing Operation
Process Design/Operation Planning
Quality Inspection/Improvement
Maintenance Warranty/Customer Satisfaction
Custom Req. Product Design& Specifications
Raw DataInformationKnowledge
Decision
Supply Chain/ Logistics
Big Data enables improvements across all stages of the product lifecycle, from product conceptualization, to design, production, service, as well as logistics.

4
Manufacturing Analytics• Vision: o To achieve “first and every part correct” manufacturing with
“minimum cost and lead time” by effectively integrating engineering models, product and process design information, and data analytics tools to drive strategic decisions in design, operations, and control of manufacturing processes.
• Key Components: o product design, process science, systems informatics, data
analytics and visualization, adaptive sensing and metrology, predictive simulation, dynamic data driven optimization

5
Challenges in Manufacturing Analytics• Massive manufacturing data: How to get information from massive data in time
to make meaningful decisions.• Data uncertainty and noise: As the size of the data increases exponentially, the
amount of “noisy” data that is not valuable also becomes significant. • Clear engineering objectives: It is essential to find the right information from
massive data - majority of value comes from minority of data for a given task.• The “imbalance” in data availability: Massive normal production data vs.
abnormal production data, even more sparse data for a given type of failures.• Heterogeneous data: How to develop a unified model and strategy to make an
informative decision. Complex data structure, data type, and acquisition rate bring more challenges in data fusion and decision making.
• Decision making in data rich environment: Data collection decision such as sensor placement and data driven predictive and proactive maintenance.
• (more challenges…)

6
Research Proposition in Mfg Analytics• Engineering models and physics: As an engineered system, there is a good
understanding of engineering physics/models for a given product and process.• System operational data: The operations of a manufacturing system generate
massive data that reveals both system functions and unexpected disturbances.• Two typical ways to model a given system: Physics-based modeling based on
the 1st principle, and data-driven modeling based on the operational data.• Physics-based modeling performs well in describing a specific device or a
machine, but not a real system with various unexpected disturbances; • Data-driven modeling works well with data fitting or prediction, but lacking
of interpretations and finding inherent system characteristics. • “Synergies between Engineering and Statistics”: An integration of physics-
based modeling with data-driven methods provides new opportunities in manufacturing analytics.
7
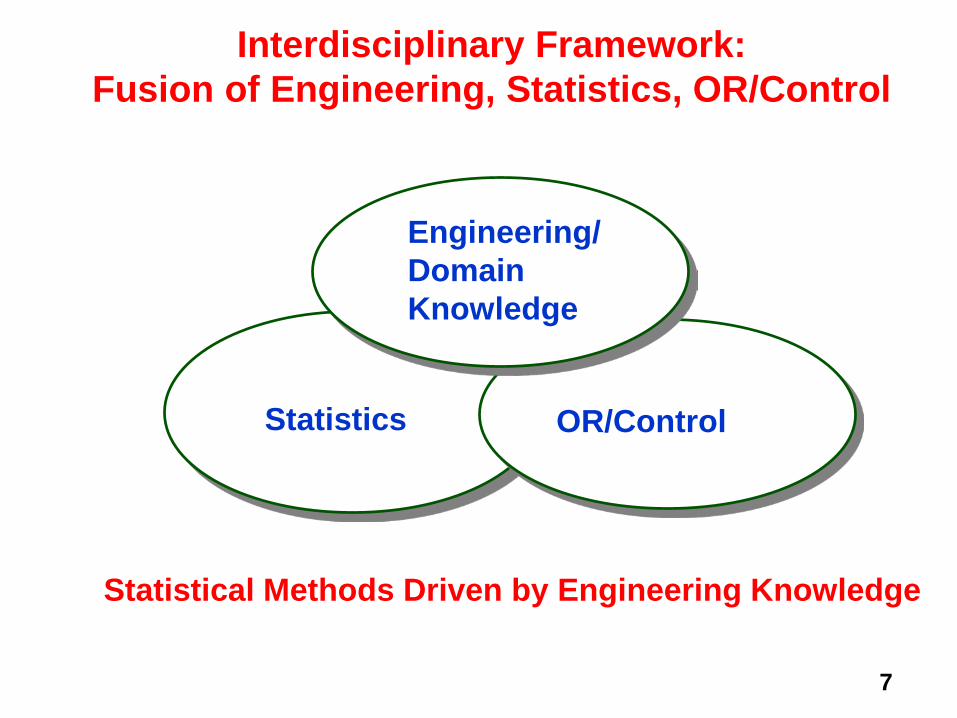
Statistics
Engineering/Domain Knowledge
OR/Control
Interdisciplinary Framework:Fusion of Engineering, Statistics, OR/Control
Statistical Methods Driven by Engineering Knowledge

On-line Bleeds Detection in Continuous Casting
Pan, E., Ye, L., Shi, J., Chang, T., 2009, “On-line bleeds detection in continuous casting processes using engineering-driven rule-based algorithm”, ASME Transactions, J. of Manufacturing Science and Engineering, Vol. 131, Issue 6.
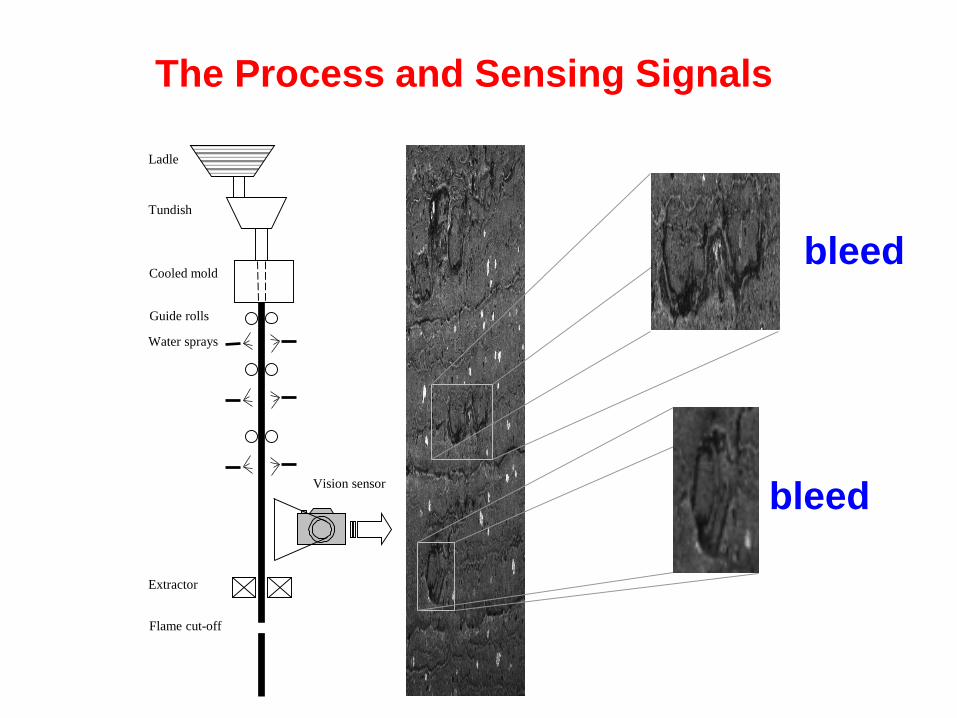
The Process and Sensing Signals
Ladle
Tundish
Cooled mold
Flame cut-off
Guide rolls
Water sprays
Extractor
Vision sensor
bleed
bleed
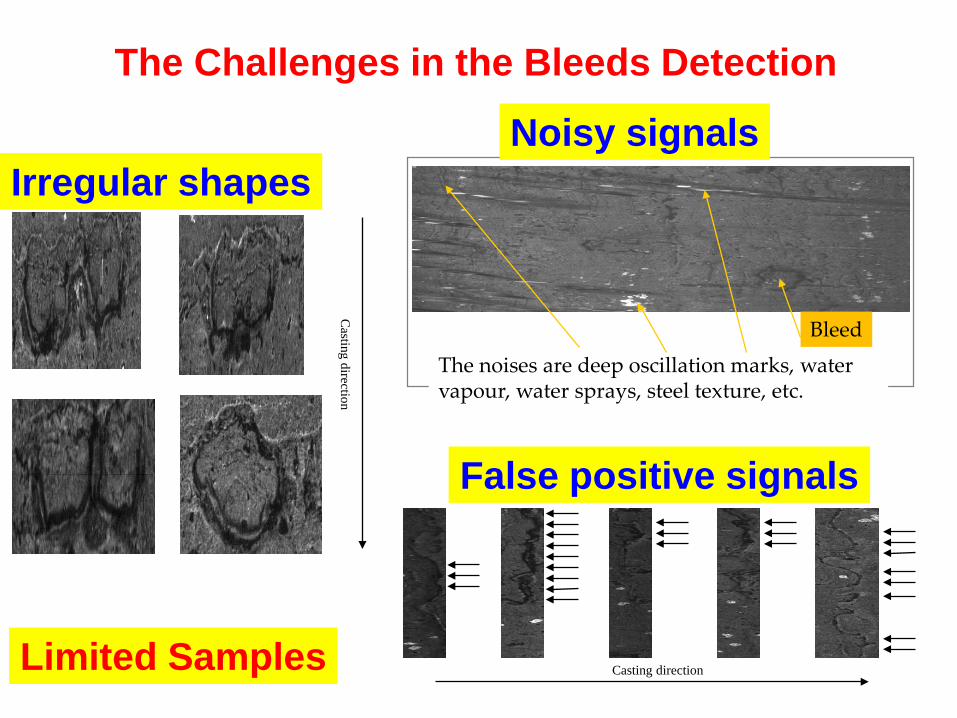
The Challenges in the Bleeds Detection
Casting direction
The noises are deep oscillation marks, water vapour, water sprays, steel texture, etc.
Bleed
Casting direction
Irregular shapes
False positive signals
Noisy signals
Limited Samples
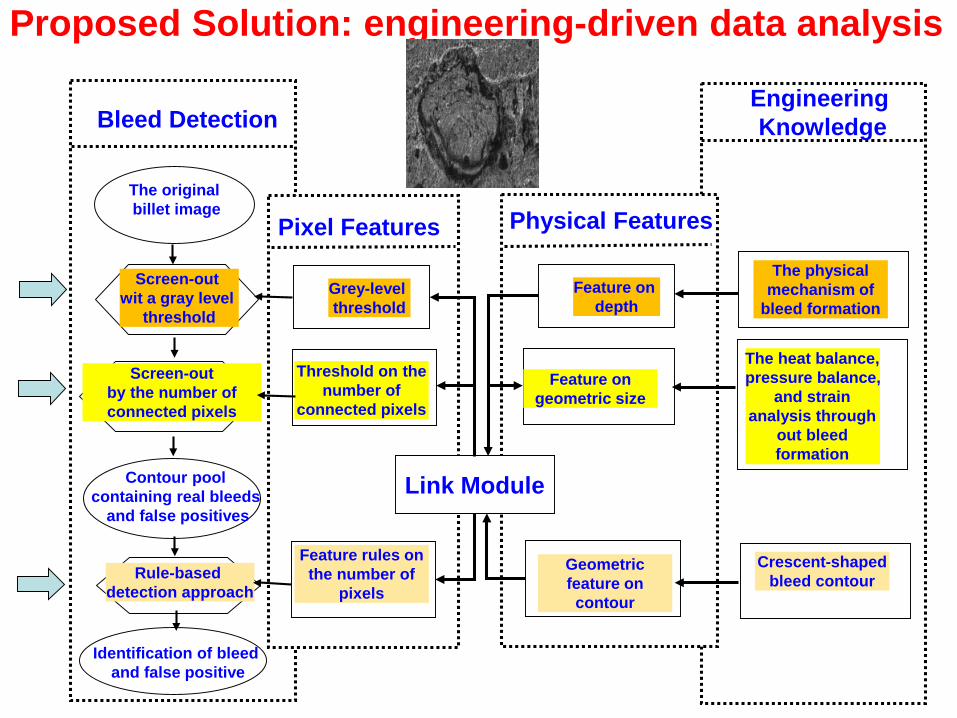
Proposed Solution: engineering-driven data analysis
Bleed Detection
The original billet image
Screen-out wit a gray level
threshold
Screen-out by the number of connected pixels
Contour pool containing real bleeds
and false positives
Rule-based detection approach
Identification of bleed and false positive
Pixel Features
Grey-level threshold
Threshold on the number of
connected pixels
Feature rules on the number of
pixels
Physical Features
Feature on depth
Feature on geometric size
Geometric feature on contour
Engineering Knowledge
The physical mechanism of
bleed formation
The heat balance, pressure balance,
and strain analysis through
out bleed formation
Crescent-shaped bleed contour
Link Module
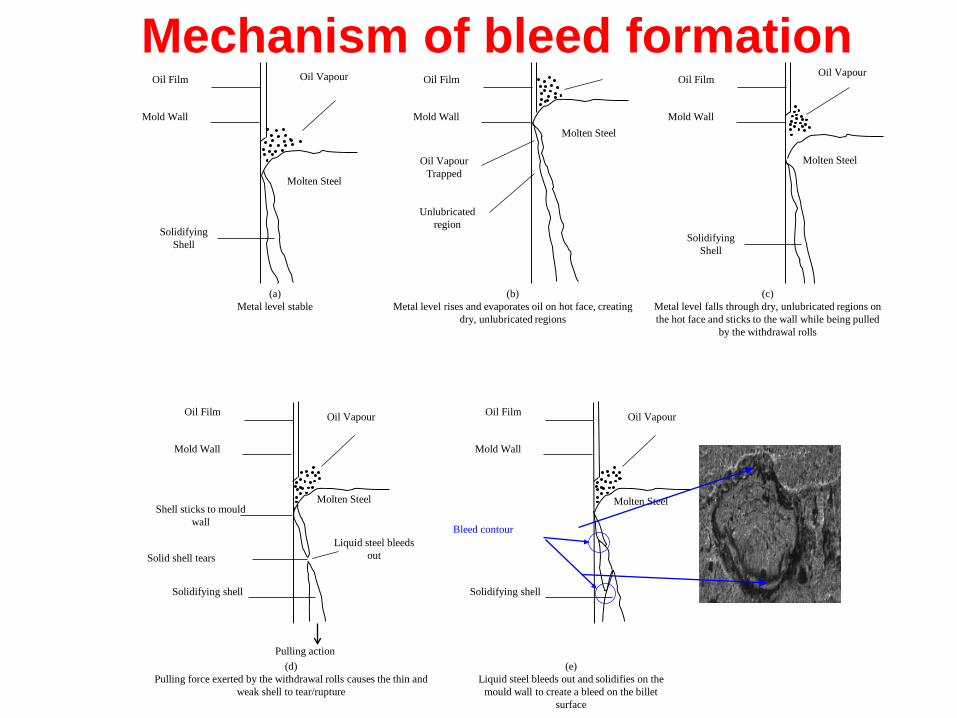
Oil Film Oil Vapour
Mold Wall
SolidifyingShell
Molten Steel
(a)Metal level stable
Oil Film
Mold Wall
Oil Vapour Trapped
Unlubricated region
(b)Metal level rises and evaporates oil on hot face, creating
dry, unlubricated regions
Oil VapourOil Film
Mold Wall
(c)Metal level falls through dry, unlubricated regions on the hot face and sticks to the wall while being pulled
by the withdrawal rolls
Oil Film
Mold Wall
Oil Vapour
Shell sticks to mould wall
Solid shell tears
Solidifying shell
Liquid steel bleeds out
Molten Steel
Molten Steel
Molten Steel
Pulling action
SolidifyingShell
(d)Pulling force exerted by the withdrawal rolls causes the thin and
weak shell to tear/rupture
Oil VapourOil Film
Mold Wall
Molten Steel
Solidifying shell
Bleed contour
(e)Liquid steel bleeds out and solidifies on the
mould wall to create a bleed on the billet surface
Mechanism of bleed formation
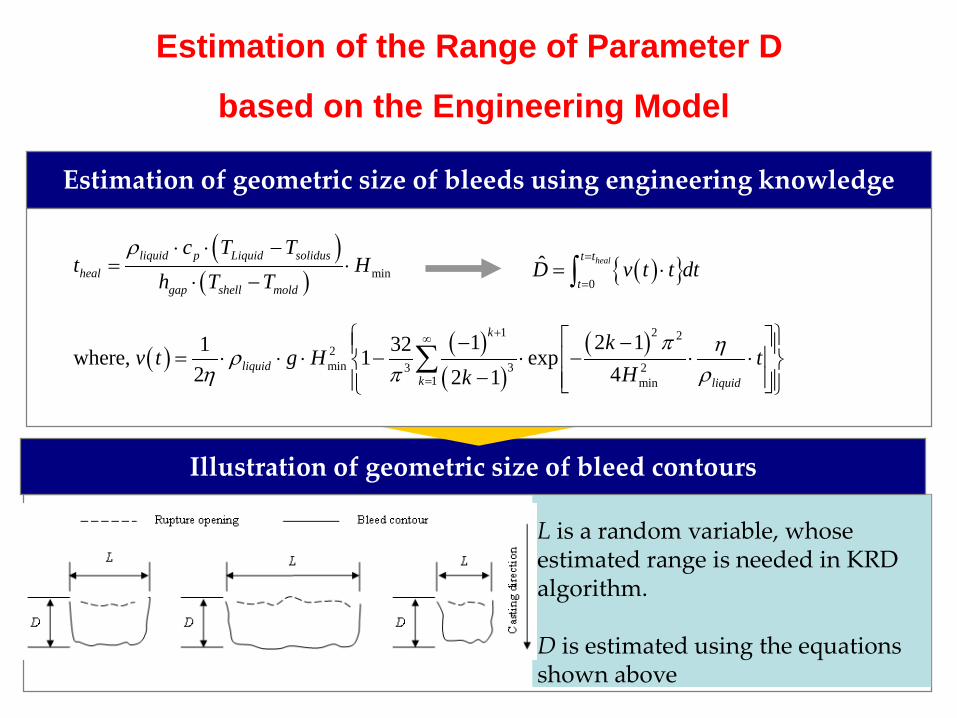
Illustration of geometric size of bleed contours
Estimation of geometric size of bleeds using engineering knowledge
L is a random variable, whose estimated range is needed in KRD algorithm.
D is estimated using the equations shown above
( )( ) min
liquid p Liquid solidusheal
gap shell mold
c T Tt H
h T Tρ ⋅ ⋅ −
= ⋅⋅ − ( ){ }
0ˆ healt t
tD v t t dt
=
== ⋅∫
( ) ( )( )
( )1 2 22min 33 2
1 min
1 2 11 32where, 1 exp2 42 1
k
liquidk liquid
kv t g H t
Hkπ ηρ
η π ρ
+∞
=
− − = ⋅ ⋅ ⋅ − ⋅ − ⋅ ⋅ −
∑
Estimation of the Range of Parameter D
based on the Engineering Model

The link module for transferring physical feature into pixel feature
( )ˆ ˆ ˆ( ) 260 2 160G P D L= ⋅ ⋅ + ⋅D̂
minL̂ maxL̂
minψ̂
maxψ̂
Link function coefficients determined by sensor settings, sensing condition, image scale, etc.
Screen-out with the number of connected pixels
3k1k 1β1αKey features are optimized throughDOE with constraints given by physical models
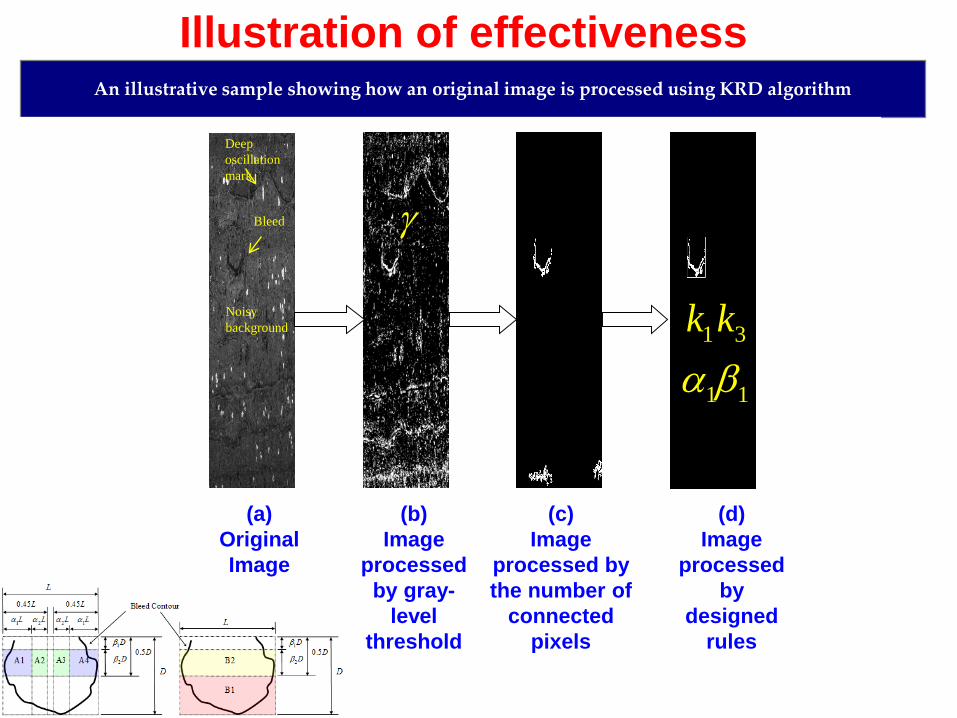
An illustrative sample showing how an original image is processed using KRD algorithm
(a)Original Image
(b)Image
processed by gray-
level threshold
(c)Image
processed by the number of
connected pixels
(d)Image
processed by
designed rules
Bleed
Deep oscillation mark
Noisy background
γ
3k1k
1β1α
Illustration of effectiveness
Causation-based Quality Control
• Li, J., Jin, J., and Shi, J., 2008, “Causation-based T2 Decomposition for Multivariate Process Monitoring and Diagnosis,” Journal of Quality Technology, Vol. 40, No. 1, pp. 46-58
• Li, J., and Shi, J., 2007, “Knowledge Discovery from Observational Data for Process Control through Causal Bayesian Networks”, IIE Transactions, Vol. 39, pp681-690.
• Liu, K. and Shi, J., 2013, “Objective-Oriented Optimal Sensor Allocation Strategy for Process Monitoring and Diagnosis by Multivariate Analysis in a Bayesian Network”, IIE Transactions, 45, 630–643.
• Liu, K., Zhang, X. and Shi, J., 2013, “Adaptive Sensor Allocation Strategy for Process Monitoring and Diagnosis in a Bayesian Network”, (in press) IEEE Transactions on Automation Science and Engineering. (This paper received Best Student Paper Award in the Industrial and Systems Engineering Research Conference (ISERC) 2013)
17
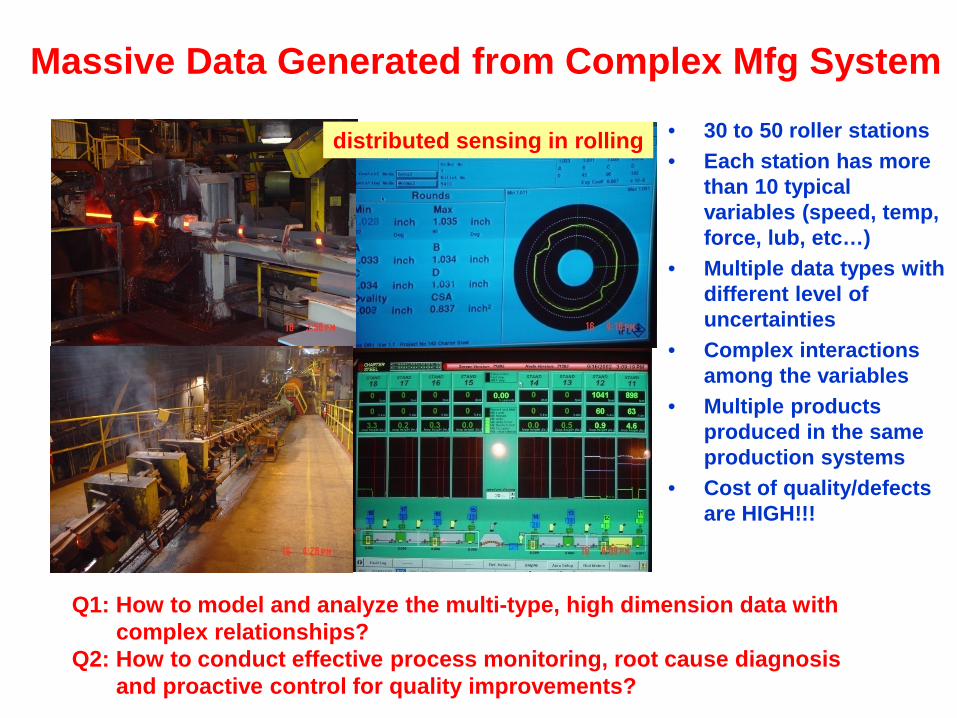
Massive Data Generated from Complex Mfg System• 30 to 50 roller stations• Each station has more
than 10 typical variables (speed, temp, force, lub, etc…)
• Multiple data types with different level of uncertainties
• Complex interactions among the variables
• Multiple products produced in the same production systems
• Cost of quality/defects are HIGH!!!
Q1: How to model and analyze the multi-type, high dimension data withcomplex relationships?
Q2: How to conduct effective process monitoring, root cause diagnosisand proactive control for quality improvements?
distributed sensing in rolling
18
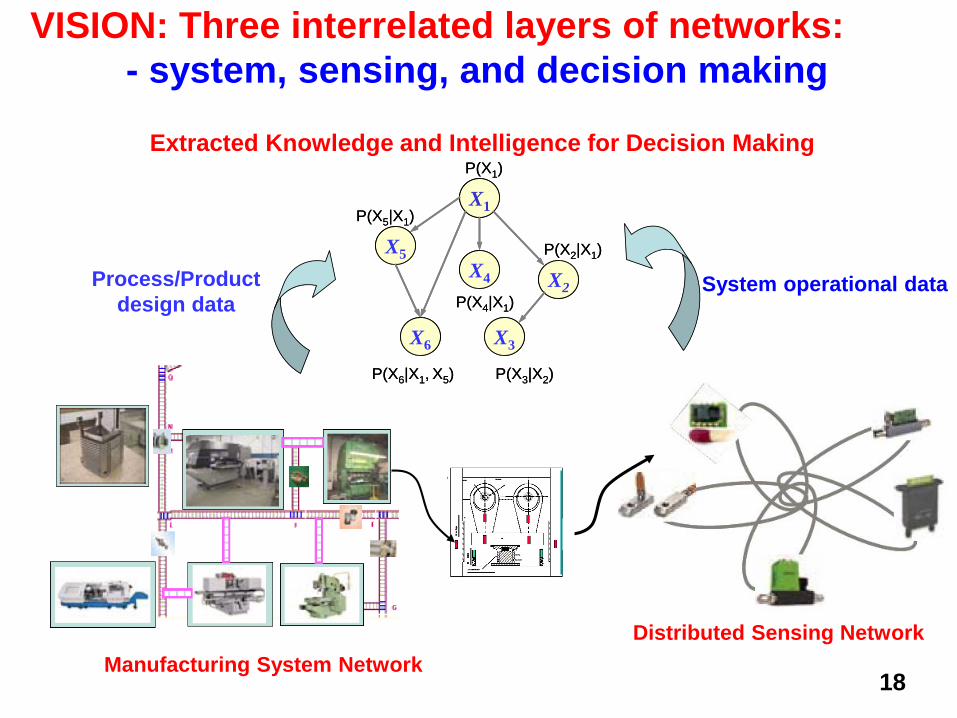
VISION: Three interrelated layers of networks: - system, sensing, and decision making
Manufacturing System Network
P(X1)
P(X5|X1)
P(X2|X1)
P(X3|X2)P(X6|X1, X5)
X6
X1
X2X4
X5
X3
P(X4|X1)
P(X1)
P(X5|X1)
P(X2|X1)
P(X3|X2)P(X6|X1, X5)
X6
X1
X2X4
X5
X3
P(X4|X1)
Extracted Knowledge and Intelligence for Decision Making
Process/Product design data
Distributed Sensing Network
System operational data
19
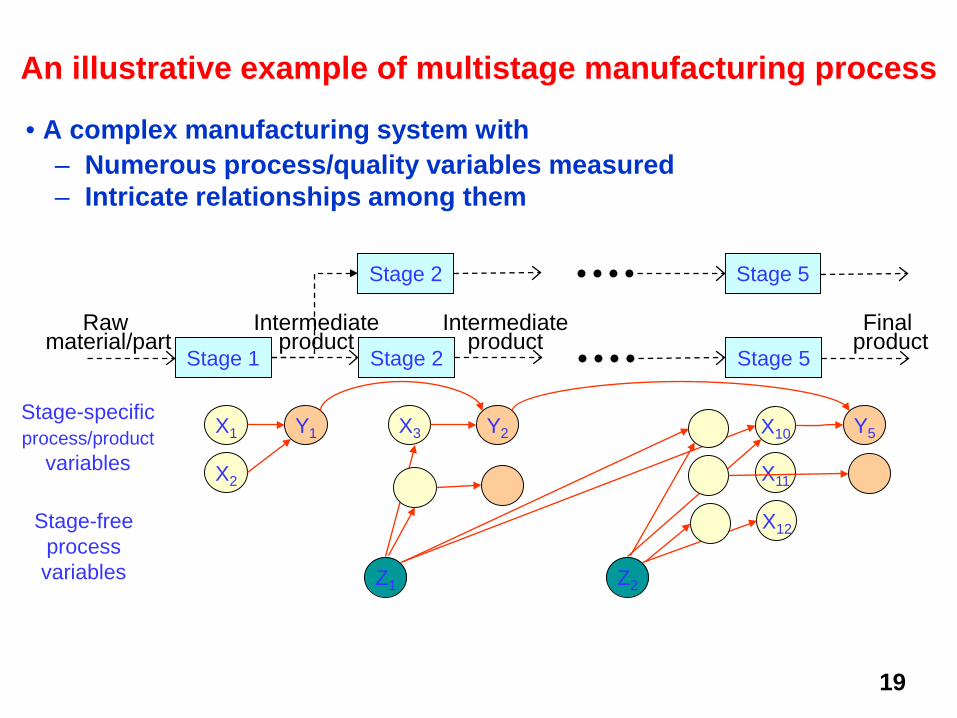
• A complex manufacturing system with – Numerous process/quality variables measured– Intricate relationships among them
Stage-freeprocess variables Z1 Z2
Stage-specificprocess/product
variables
X1
X2
X3 X10
X11
Y1 Y2 Y5
X12
Raw material/part
Final product
Intermediateproduct
Intermediateproduct
Stage 1 Stage 2 Stage 5
Stage 2 Stage 5
An illustrative example of multistage manufacturing process
20
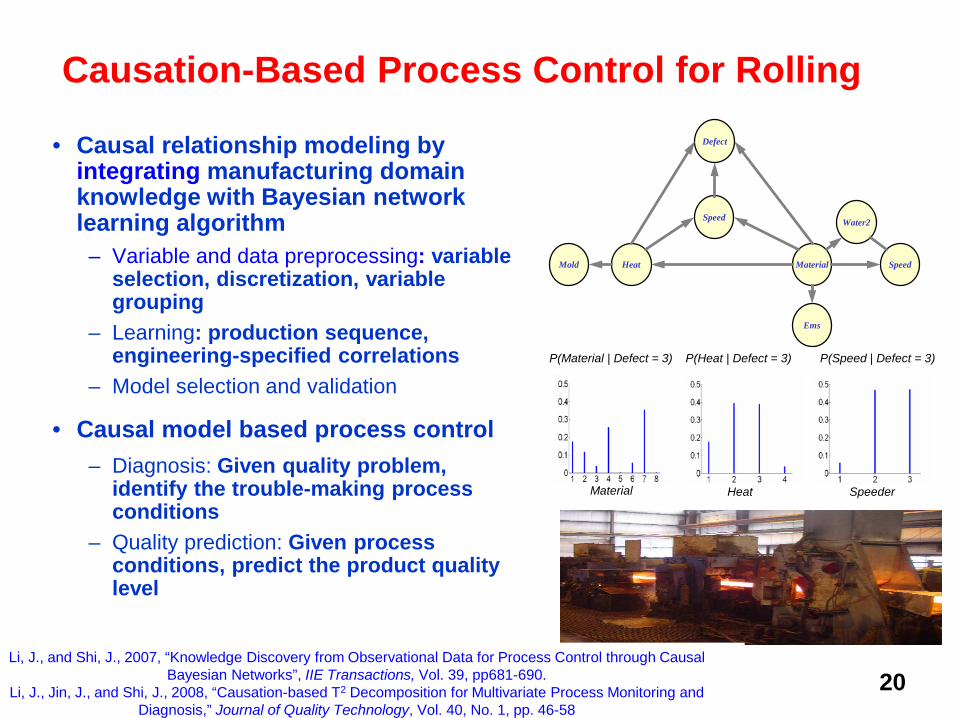
Causation-Based Process Control for Rolling
• Causal relationship modeling by integrating manufacturing domain knowledge with Bayesian network learning algorithm
– Variable and data preprocessing: variable selection, discretization, variable grouping
– Learning: production sequence, engineering-specified correlations
– Model selection and validation
• Causal model based process control– Diagnosis: Given quality problem,
identify the trouble-making process conditions
– Quality prediction: Given process conditions, predict the product quality level
HeatMold
Ems
Material
Water2
Speed
Defect
Speed
Material Heat Speeder
P(Material | Defect = 3) P(Heat | Defect = 3) P(Speed | Defect = 3)
Li, J., and Shi, J., 2007, “Knowledge Discovery from Observational Data for Process Control through Causal Bayesian Networks”, IIE Transactions, Vol. 39, pp681-690.
Li, J., Jin, J., and Shi, J., 2008, “Causation-based T2 Decomposition for Multivariate Process Monitoring and Diagnosis,” Journal of Quality Technology, Vol. 40, No. 1, pp. 46-58

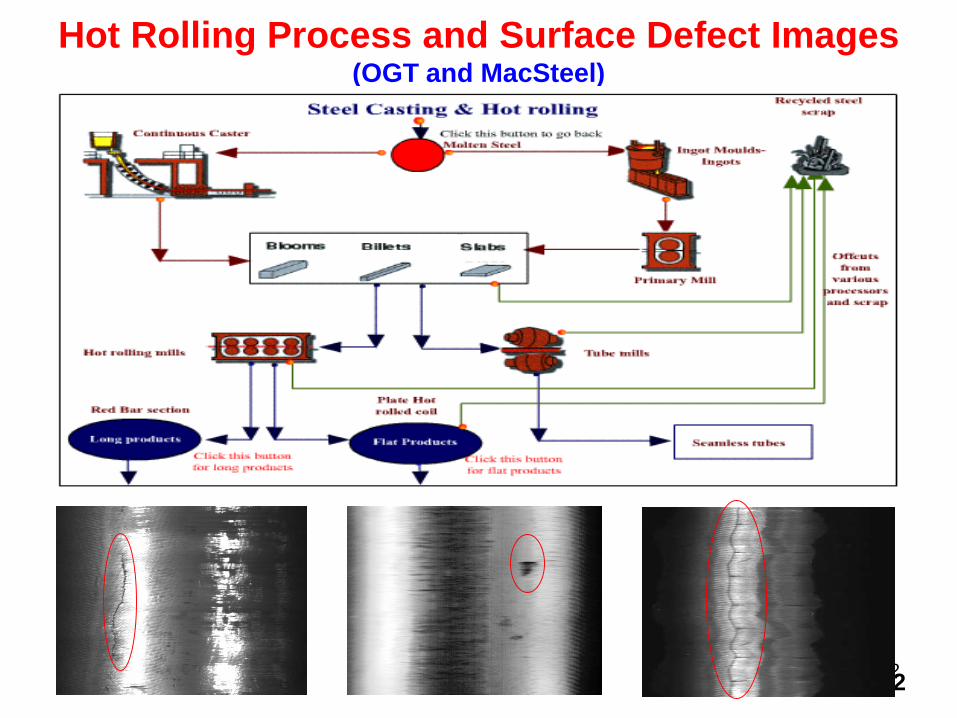
On-line Root Cause Diagnosis for Repeating Defect Pattern in Rolling
H. Jia and J. Shi, “On-line repeating fault pattern detection and its root cause diagnosis in hot rolling processes”, Technical Report, OGT, 2005.
2222
Hot Rolling Process and Surface Defect Images(OGT and MacSteel)
2323
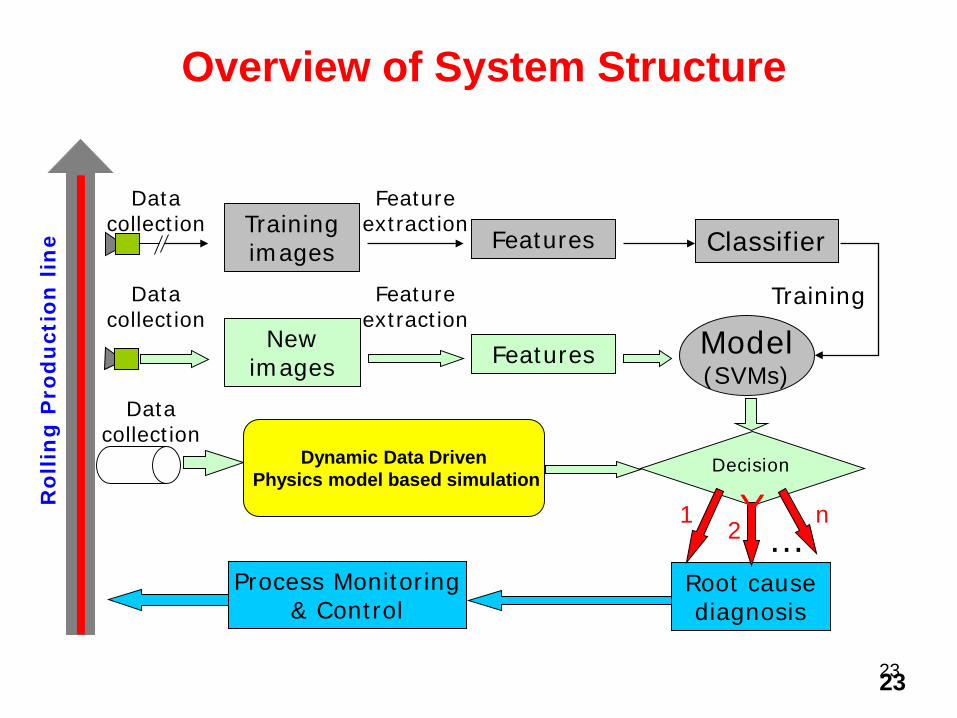
Overview of System StructureR
ollin
g P
rod
uct
ion
lin
e
Data collection
Process Monitoring & Control
Root cause diagnosis
Feature extraction
Data collection
New images Features
Decision
Y…
1 2 n
Model(SVMs)
Training images
Feature extraction
Features
Training
Classifier
Data collection
Dynamic Data DrivenPhysics model based simulation
2424
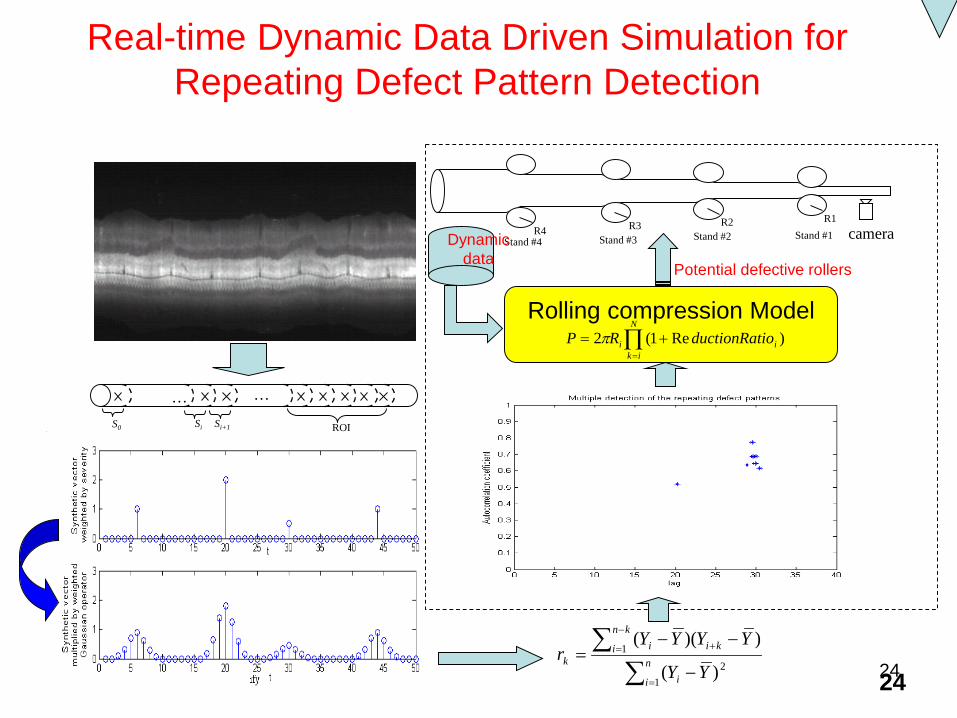
Real-time Dynamic Data Driven Simulation for Repeating Defect Pattern Detection
∑∑
=
−
= +
−
−−= n
i i
kn
i kiik
YY
YYYYr
12
1
)(
))((
ROI
… …
S0 Si Si+1
R4 R3 R2 R1
Stand #4 Stand #3 Stand #2 Stand #1 camera
Rolling compression Model
Potential defective rollers
Dynamic data
∏=
+=N
ikii ioductionRatRP )Re1(2π

25
Signature Analysis for On-line Cyclic Waveform Signals
1. Koh, C., Shi, J. and Williams, W., 1995, "Tonnage Signature Analysis Using the Orthogonal (Harr) Transforms”, NAMRI/SME Transactions, Vol. 23, pp229-234.
2. Koh, C., Shi, J., and Black, J., 1996, “Tonnage Signature Attribute Analysis for Stamping Process”, NAMRI/SME Transactions, Vol. 23, pp193-198.
3. Koh, C., Shi, J., Williams, W., Ni, J., 1999, “Multiple Fault Detection and Isolation Using the Haar Transform - Part 1: Theory”, ASME Transactions, Journal of Manufacturing Science and Engineering, Vol. 121, No.2, pp290-294.
4. Koh, C. , Shi, J., Williams, W., Ni, J., 1999, “Multiple Fault Detection and Isolation Using the Haar Transform - Part 2: Application to the Stamping Process”, ASME Transactions, Journal of Manufacturing Science and Engineering, Vol. 121, No.2, pp295-299.
5. Jin, J. and Shi, J., 1999 “Feature-Preserving Data Compression of Stamping Tonnage Information Using Wavelets”, Technometrics, Nov. 1999, Vol. 41, No.4, pp 327-339.
6. Jin, J., and Shi, J., 2000, “Diagnostic Feature Extraction from Stamping Tonnage Signals Based on Design of Experiment,” ASME Transactions, Journal of Manufacturing Science and Engineering, Vol. 122, No. 2, pp.360-369.
7. Jin, J., and Shi, J., 2005, “Press Tonnage Signal Decomposition and Validation Analysis For Transfer or Progressive Die Processes”, ASME Transactions, Journal of Manufacturing Science and Engineering, Vol. 127(1), pp. 231-235.
8. Jin, J. and Shi, J., 2001, “Automatic Feature Extraction of Waveform Signals for In-process Diagnostic Performance Improvement”, Journal of Intelligent Manufacturing, Vol. 12, pp267-268.
9. Kim, J., Huang,Q., and Shi, J., 2008, “Latent Variable-based Key Process Variable Identification and Process Monitoring for Forging”, SME Transactions Journal of Manufacturing Systems.Vol. 26, No. 1, pp53- 61.
10. Zhou, S., Sun, B., Shi, J., 2006, "An SPC Monitoring System for Cycle-Based Waveform Signals Using Haar Transform", IEEE Transactions on Automation Science and Engineering, Vol. 3(1), pp. 60-72.
11. Kim, J., Huang, Q., Shi, J., and Chang, T.-S., 2006, “Online Multi-Channel Forging Tonnage Monitoring and Fault Pattern Discrimination Using Principal Curve,” Transactions of the ASME, Journal of Manufacturing Science and Engineering, Vol. 128, pp944-950, 2006.

26
120 140 160 180 200 220 240-50050100150200250300350400
crank angle (degree)
tonnage (ton)Loose Tie Rod Worn Bearing
Excessive Snap Worn Gib
Process VariableMeasurement
BlankShut
Height
Punch Speed Die
Stamping Press
TonnageSensors
Gib
Bearing
Tie Rod
Linkage
Slide
Upright
Tonnage Signature Analysis for Stamping
• High production rates (50 to 500 parts/minutes)• Low throughput in part measurement and inspection• Complex mfg process (40+ variables impact on quality)• Lots of sensors installed in dies and presses for automation and die/press protection
27
SegmentSr
Crank Angle[Data Range] Potential Process Faults Fault Signal Characteristics
Resolutionof Interest
Jr (s=3)
Pr %
S1: slide goesdown
118.12o-141.76o
[1,198]
gib chatter due to theexcessive clearance
dominant low frequency component J=6,5 5
S2: blank hold& draw bidforming
141.88o-162.40o
[199,370]
excessive dynamicinteraction dependent onthe nitrogen cushionsystem, working speed
1. transient rising edge dependent on theshut height and material thickness;2. dominant frequency componentsdependent on the process dynamiccharacteristics;3. signal mean value dependent on thenitrogen pressure setting, working speed
J=3,4,5,6,7 10
S3: partdrawing
162.52o-176.20o
[371,485]
forming force sensitive tothe material thickness
signal slope and curvature J=3,4,5,6 5
S4: slide closeto bottom
176.32o-182.20o
[486,535]
force change due to loosetie rod, worn bearing,shut height change, dieworn-out;
shape and peak value change J=3,4,5,6 2
S5: slideleaving awayfrom lowerdie
182.32o-188.20o
[536,585]
force change sensitive toblank material properties(spring back)
signal slope and curvature J=3,4,5,6 5
S6: slidecontactinglower binder
188.32o-213.40o
[586,795]
force variation due to thenitrogen pressure change
no obvious periodic component, themean value representing the nitrogenpressure.
J=3,4 5
S7: slideleaving awayfrom lowerbinder
213.52o-221.80o
[796,865]
excessive snap due to thenegative force generatedby the die bounce at thetime of nitrogen cushionreleased
the transient dropping edge sensitive tothe shut height and material thickness,and the area of the negative forcesensitive to die bounce degree
J=3,4,5,6,7 10
S8: slidecontinuouslygoing up
221.92o-240.88o
[866,1024]
gib chatter dominant low frequency component J=5,6 5
Die
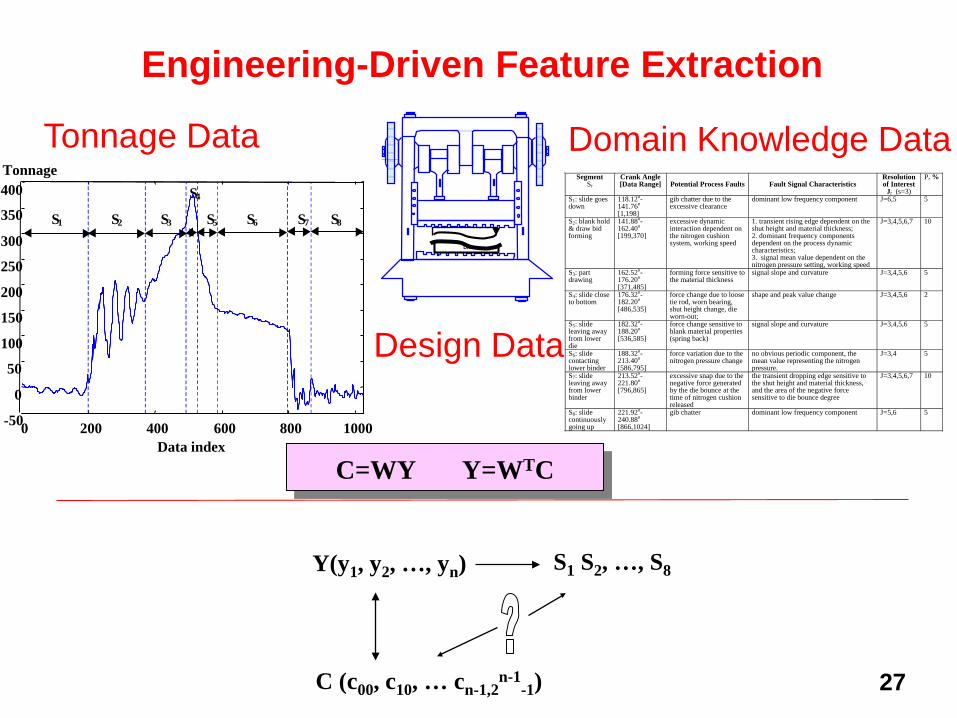
Y(y1, y2, …, yn) S1 S2, …, S8
C (c00, c10, … cn-1,2n-1
-1)
Tonnage Data Domain Knowledge Data
Design Data
Engineering-Driven Feature Extraction
C=WY Y=WTC
Tonnage
Data index0 200 400 600 800 1000-50
0
50
100
150
200
250
300
350
400
S6S5
S4
S1 S2 S3 S7 S8

28
System Domain Knowledge
Wavelets Analysis
Signal feature specifications:• time domain
profile natural variability• frequency domain
characteristic freq. range
Wavelet coefficients thresholding rules
λ≤
λ>= E
jk
EjkjkE
cif,0cif,c
T
%100energytotal
lossenergyPI
AI
×−
== 2
2
F
FF
⋅≤λ=λ
2/1
z
2IE
nP
supC
mapping thresholds
Detection Power Loss Analysis
∫λ
λ−
−=µ∆ dx)x(xgσµ∆=∆ /K
K))nKL(g)nKL(g(nD ∆⋅−−−−=∆
Data Fusion
Feature Preserving Data Compression
Jin and Shi, “Feature-Preserving Data Compression of Stamping Tonnage Information Using Wavelets,” Technometrics, Nov.1999, Vol.41, No.4, pp.327-339.
Quantitative relationships between engineering specifications
and the thresholds in wavelet domain
Quantitative relationships between the wavelet thresholds and the detection power change
in process monitoring

29
0 200 400 600 800 1000 1200
data index
1200
-50
50
100
150
200
250
300
350
400
-50
50
100
150
200
250
300
350
400
Tonnage (ton)
data index0
Feature-Preserving Data CompressionNonzero wavelet coefficient number of signal 1 = 66Nonzero wavelet coefficient number of signal 2 = 73
Signal 1
Signal 2
0 200 400 600 800 1000
0
Signal 1
Signal 2
Traditional DenoisingNonzero wavelet coefficient number of signal 1 = 621Nonzero wavelet coefficient number of signal 2 = 640
(Signal 1: Thicker blank; Signal 2: Thinner blank; Original Data number = 1024)
The detection power loss is 0.91% with and without feature-preserving data compression.
Feature Preserving Data Compression: Results
30
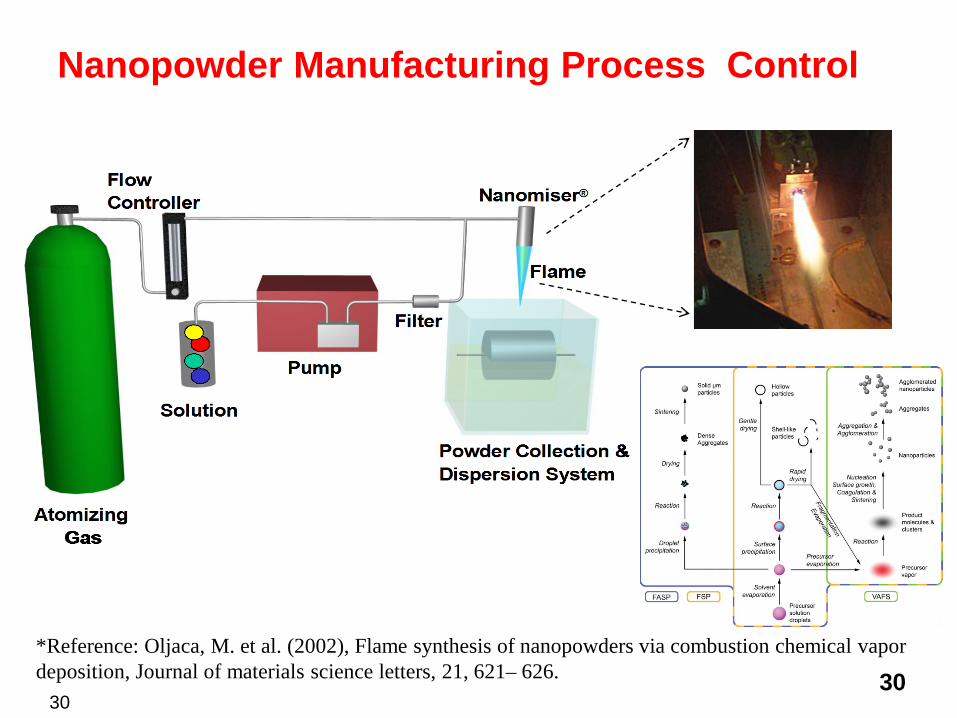
Nanopowder Manufacturing Process Control
30
*Reference: Oljaca, M. et al. (2002), Flame synthesis of nanopowders via combustion chemical vapor deposition, Journal of materials science letters, 21, 621– 626.
31
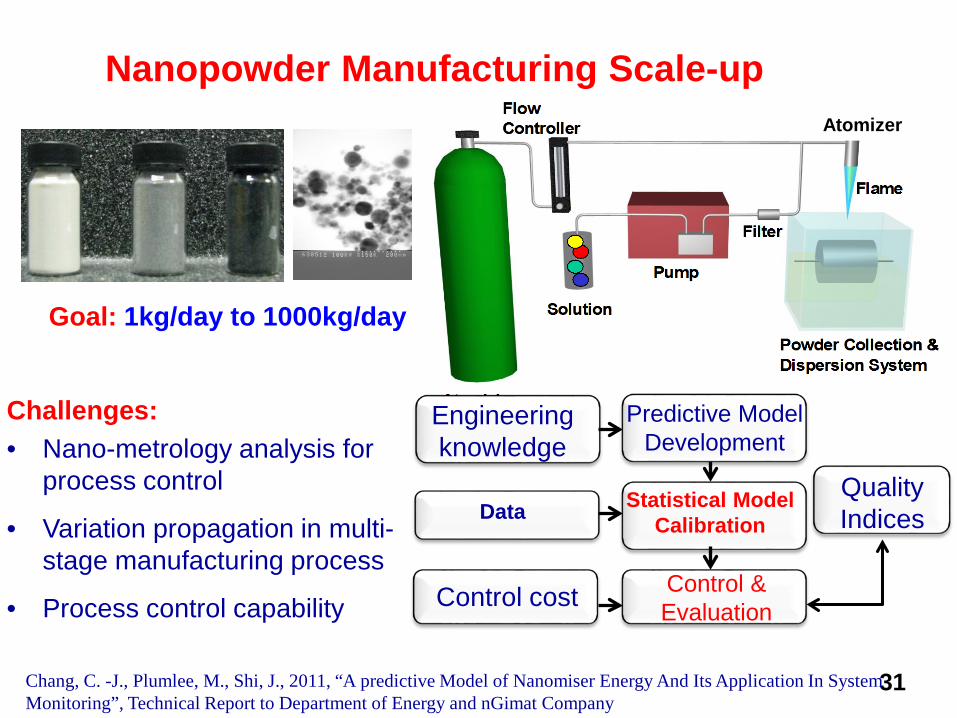
Nanopowder Manufacturing Scale-upAtomizer
Control cost
Engineering knowledge
Data Statistical Model Calibration
Control & Evaluation
Quality Indices
Predictive Model Development
Chang, C. -J., Plumlee, M., Shi, J., 2011, “A predictive Model of Nanomiser Energy And Its Application In System Monitoring”, Technical Report to Department of Energy and nGimat Company
Challenges:• Nano-metrology analysis for
process control
• Variation propagation in multi-stage manufacturing process
• Process control capability
Goal: 1kg/day to 1000kg/day
32
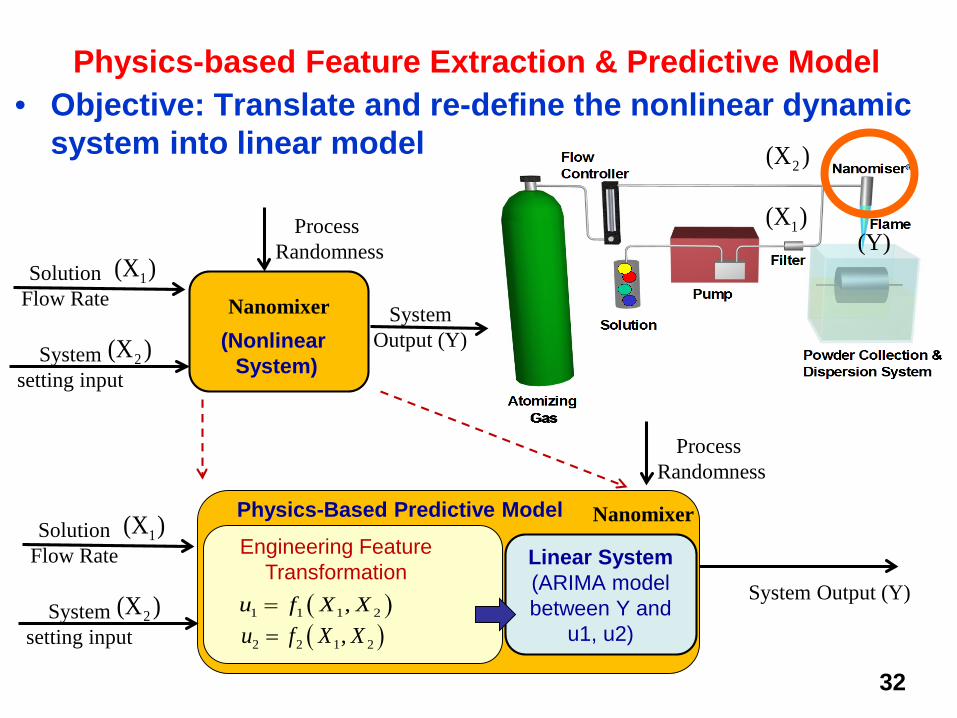
Physics-based Feature Extraction & Predictive Model• Objective: Translate and re-define the nonlinear dynamic
system into linear model
NanomixerSolution
Flow Rate
System setting input
Process Randomness
SystemOutput (Y)
1(X )
2(X )
Linear System(ARIMA model between Y and
u1, u2)
Process Randomness
System Output (Y)( )1 1 1 2,u f X X=
( )2 2 1 2,u f X X=
Engineering Feature Transformation
(Nonlinear System)
NanomixerPhysics-Based Predictive ModelSolution
Flow Rate
System setting input
1(X )
2(X )
1(X )
2(X )
(Y)
33
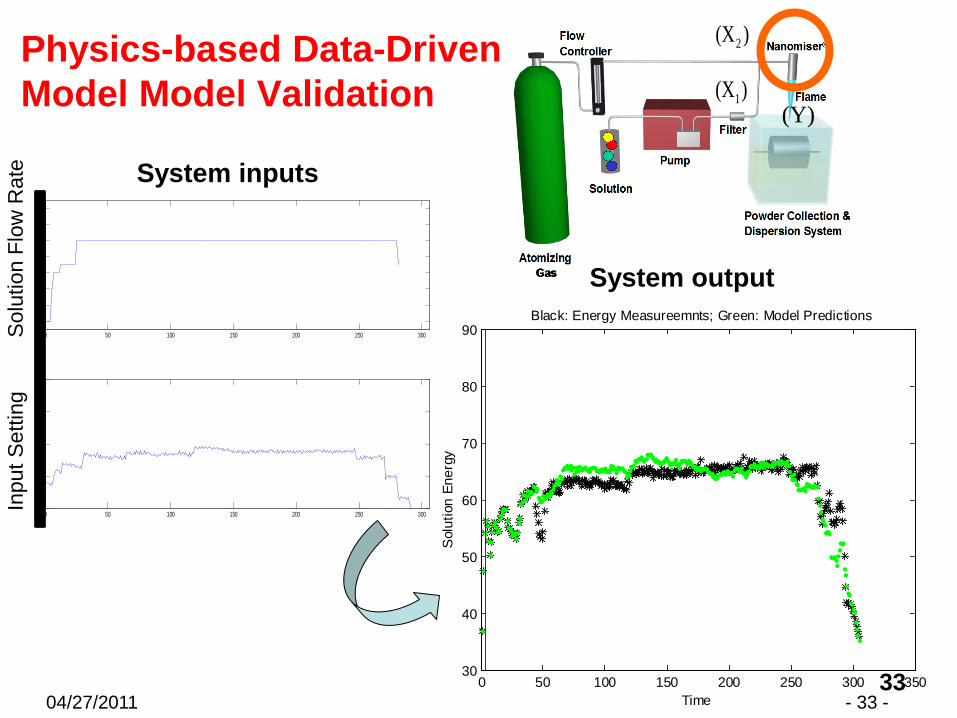
Physics-based Data-Driven Model Model Validation
04/27/2011 - 33 -
System inputs
0 50 100 150 200 250 300
80
100
120
140
160
180
200
220
0 50 100 150 200 250 30010
15
20
25
30
0 50 100 150 200 250 300 35030
40
50
60
70
80
90
Time
Sol
utio
n En
ergy
Black: Energy Measureemnts; Green: Model Predictions
Inpu
t Set
ting
Sol
utio
n Fl
ow R
ate
System output
1(X )
2(X )
(Y)
Stream of Variation Methodologiesfor
Multistage Manufacturing Processes (MMP)
Shi, J. “Stream of Variation Modeling and Analysis for Multistage Manufacturing Processes”, CRC Press, 2006. 469pp.
Shi, J. and Zhou, S., 2009, “Quality Control and Improvement for Multistage Systems: A Survey”, IIE Transactions on Quality and Reliability Engineering, Vol. 41, pp744-753.
35
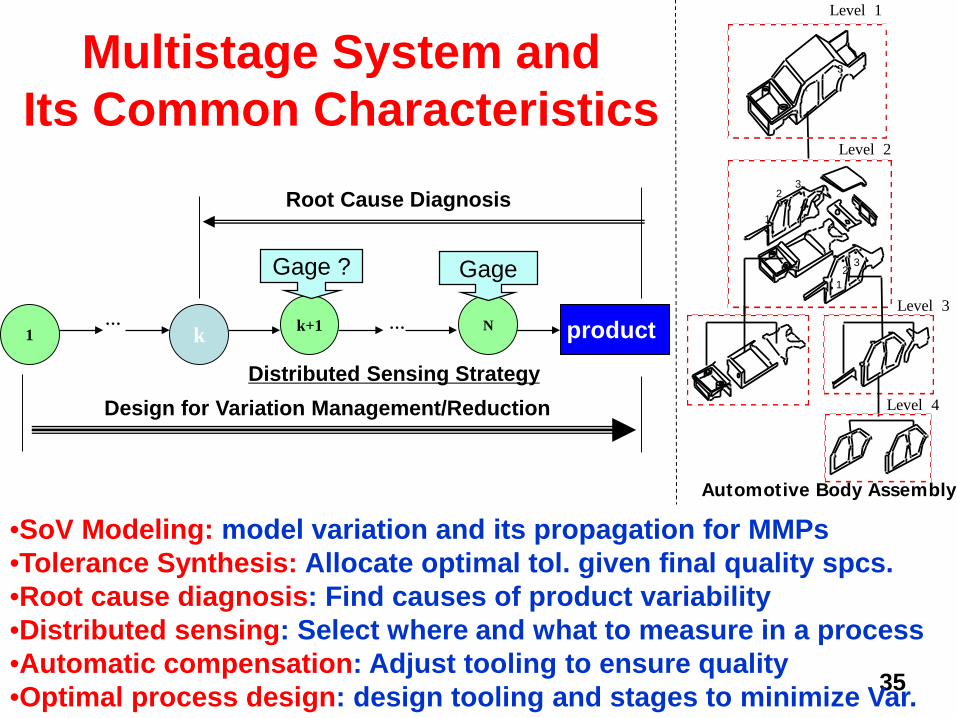
Multistage System and Its Common Characteristics
1 k+1k … N… product
Root Cause Diagnosis
Design for Variation Management/Reduction
GageGage ?
Distributed Sensing Strategy
•SoV Modeling: model variation and its propagation for MMPs•Tolerance Synthesis: Allocate optimal tol. given final quality spcs.•Root cause diagnosis: Find causes of product variability•Distributed sensing: Select where and what to measure in a process •Automatic compensation: Adjust tooling to ensure quality•Optimal process design: design tooling and stages to minimize Var.
•
••
•
12
3 4
•
••
•1
23
4
Level 2
Level 3
Level 4
3
Level 1
Automotive Body Assembly
36
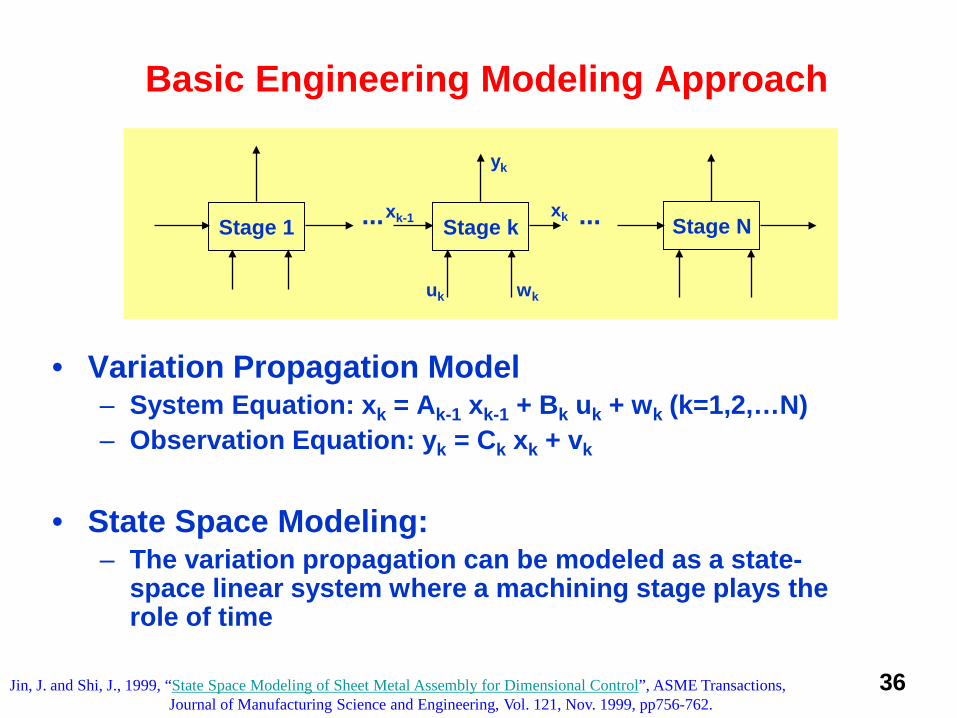
Basic Engineering Modeling Approach
• Variation Propagation Model– System Equation: xk = Ak-1 xk-1 + Bk uk + wk (k=1,2,…N)– Observation Equation: yk = Ck xk + vk
• State Space Modeling: – The variation propagation can be modeled as a state-
space linear system where a machining stage plays the role of time
Stage N... ...
yk
uk wk
xk-1 xkStage 1 Stage k
Jin, J. and Shi, J., 1999, “State Space Modeling of Sheet Metal Assembly for Dimensional Control”, ASME Transactions, Journal of Manufacturing Science and Engineering, Vol. 121, Nov. 1999, pp756-762.
37
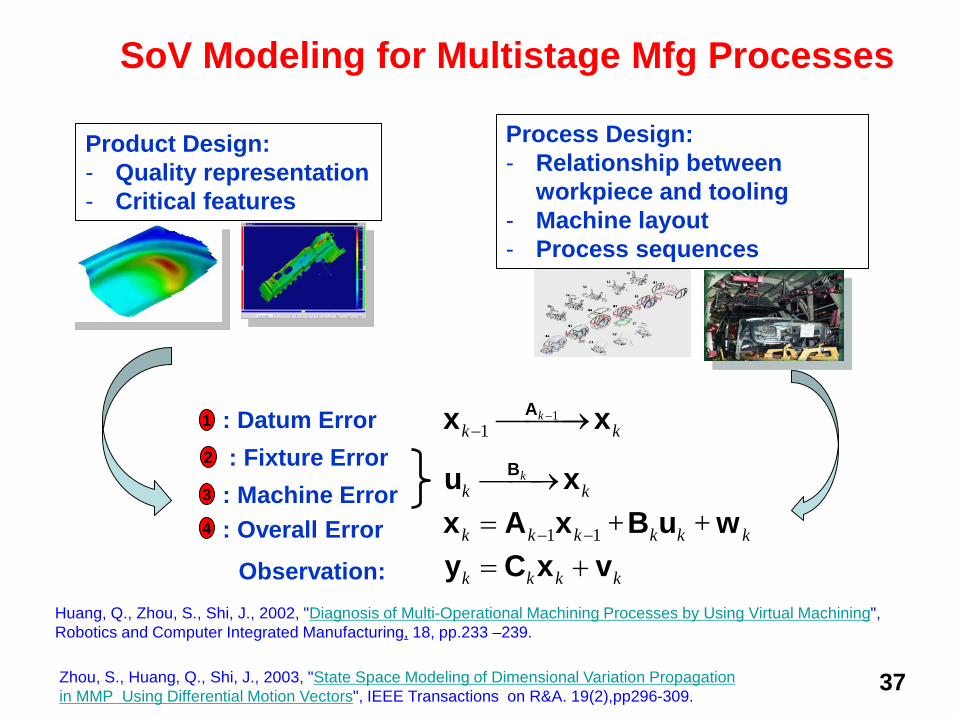
Product Design:- Quality representation- Critical features
Process Design: - Relationship between
workpiece and tooling- Machine layout- Process sequences
SoV Modeling for Multistage Mfg Processes
Zhou, S., Huang, Q., Shi, J., 2003, "State Space Modeling of Dimensional Variation Propagation in MMP Using Differential Motion Vectors", IEEE Transactions on R&A. 19(2),pp296-309.
Huang, Q., Zhou, S., Shi, J., 2002, "Diagnosis of Multi-Operational Machining Processes by Using Virtual Machining",Robotics and Computer Integrated Manufacturing, 18, pp.233 –239.
4 : Overall Error 1 1k k k k k k+ +− −=x A x B u wObservation: y C x v= +k k k k
1 : Datum Error 11
Ax x−− →k
k k
3 : Machine Error Bu x→k
k k
2 : Fixture Error
38
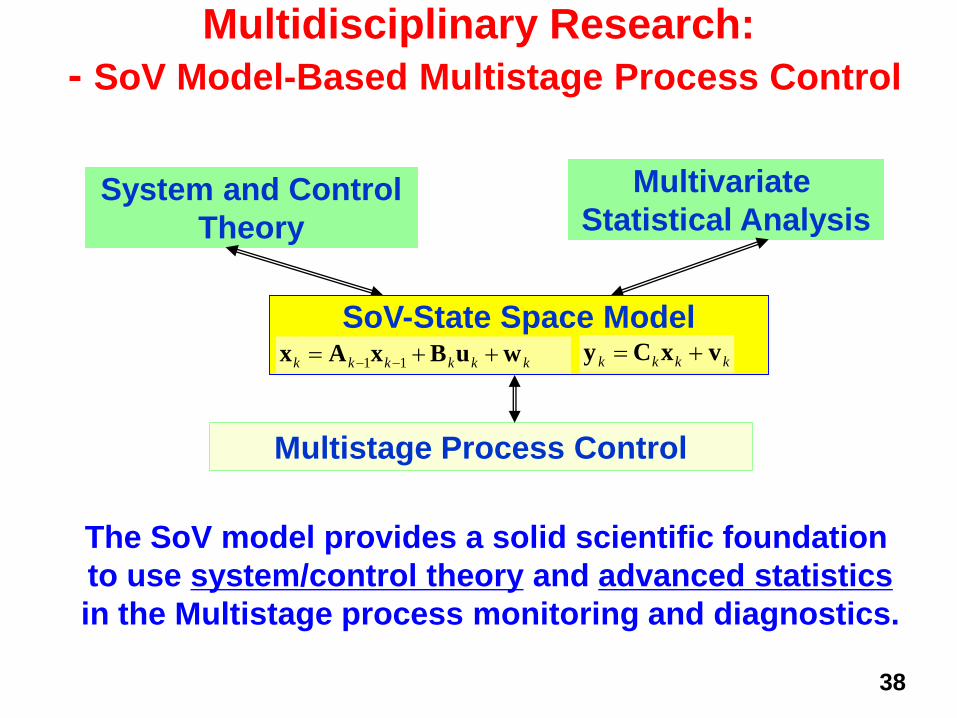
Multidisciplinary Research:- SoV Model-Based Multistage Process Control
Multistage Process Control
System and ControlTheory
Multivariate Statistical Analysis
The SoV model provides a solid scientific foundation to use system/control theory and advanced statisticsin the Multistage process monitoring and diagnostics.
SoV-State Space Modelkkkkkk wuBxAx ++= −− 11 kkkk vxCy +=
39
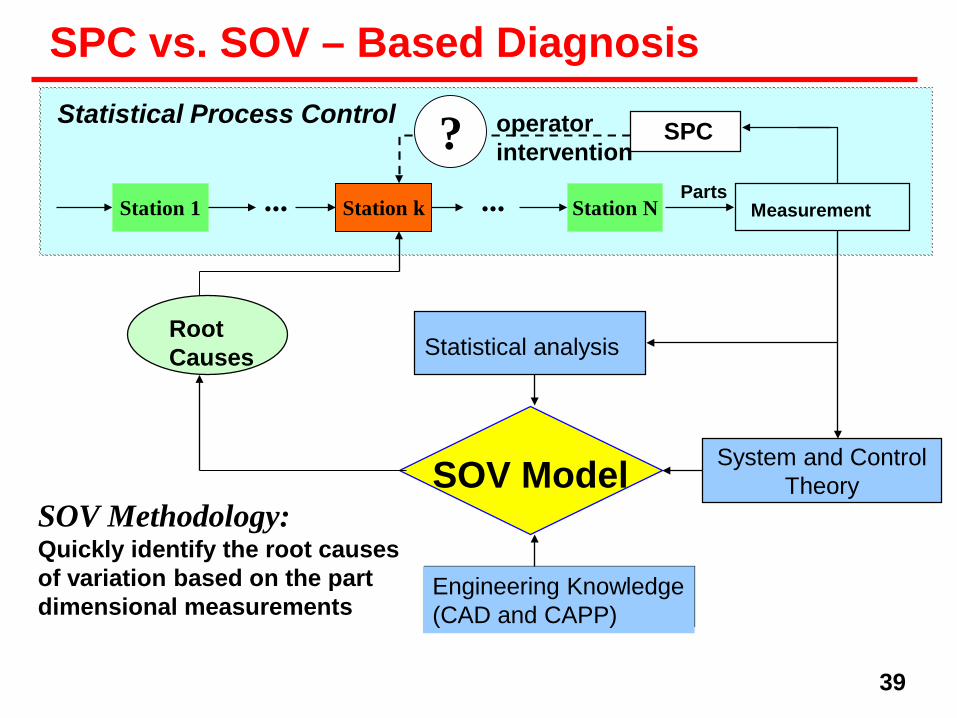
SPC vs. SOV – Based Diagnosis
SPCoperator intervention
Statistical Process Control ?
Statistical analysis
Engineering Knowledge(CAD and CAPP)
SOV Model
Root Causes
System and ControlTheory
SOV Methodology:Quickly identify the root causes of variation based on the part dimensional measurements
PartsMeasurementStation 1 Station k Station N... ...

40
Variation Pattern Based Diagnosis
Ding, Y., Ceglarek, D., and Shi, J. (2002), “Fault diagnosis of Multi-station Manufacturing Processes by Using State Space Approach,” ASME Transactions, Journal of Manufacturing Science and Engineering, 124(2), pp. 313-322.
in-lineIn-process sensing data
Estimation of occurred fault symptom
Statistical Data Analysis)(yCov
ykkkkkk wuBxAx ++= −− 11
EngineeringKnowledge
SoV Model
Variation symptomsof potential faults
off-line
w+= Γuy
Estimation of root causes through in-line statistical
analysis driven by off-line model
Root cause of the fault*u
')cov()cov( ΓuΓy ⋅⋅=
41
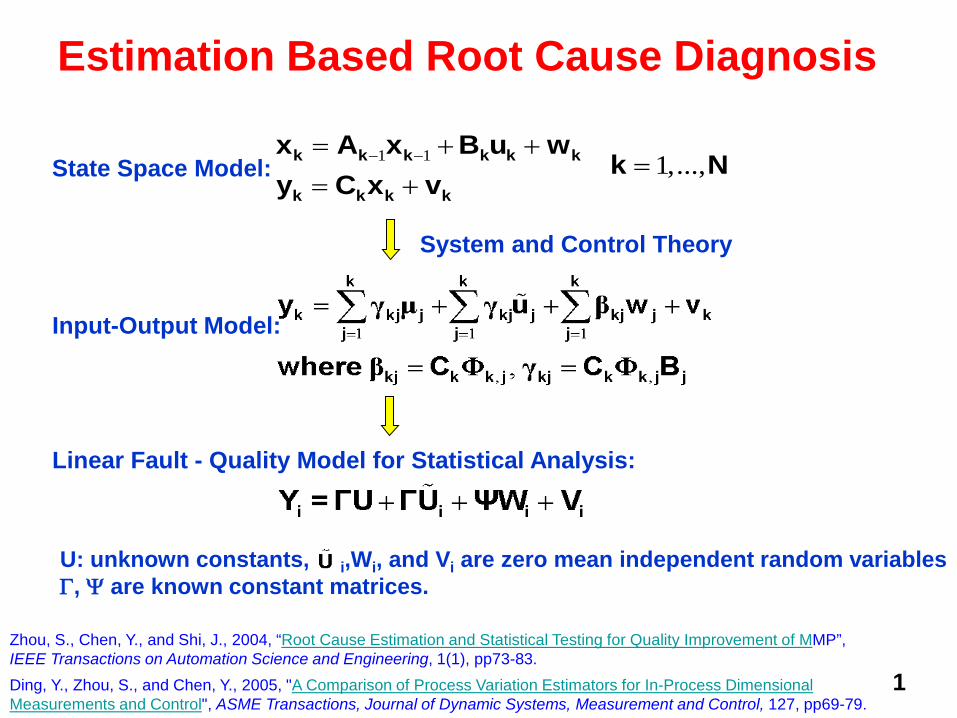
Estimation Based Root Cause Diagnosis
Zhou, S., Chen, Y., and Shi, J., 2004, “Root Cause Estimation and Statistical Testing for Quality Improvement of MMP”, IEEE Transactions on Automation Science and Engineering, 1(1), pp73-83.
1 1 1,...,k k k k k k
k k k k
x A x B u wk N
y C x v− −= + +
== +
State Space Model:
Input-Output Model:
System and Control Theory
Linear Fault - Quality Model for Statistical Analysis:
U: unknown constants, i,Wi, and Vi are zero mean independent random variablesΓ, Ψ are known constant matrices.
Ding, Y., Zhou, S., and Chen, Y., 2005, "A Comparison of Process Variation Estimators for In-Process Dimensional Measurements and Control", ASME Transactions, Journal of Dynamic Systems, Measurement and Control, 127, pp69-79.
42
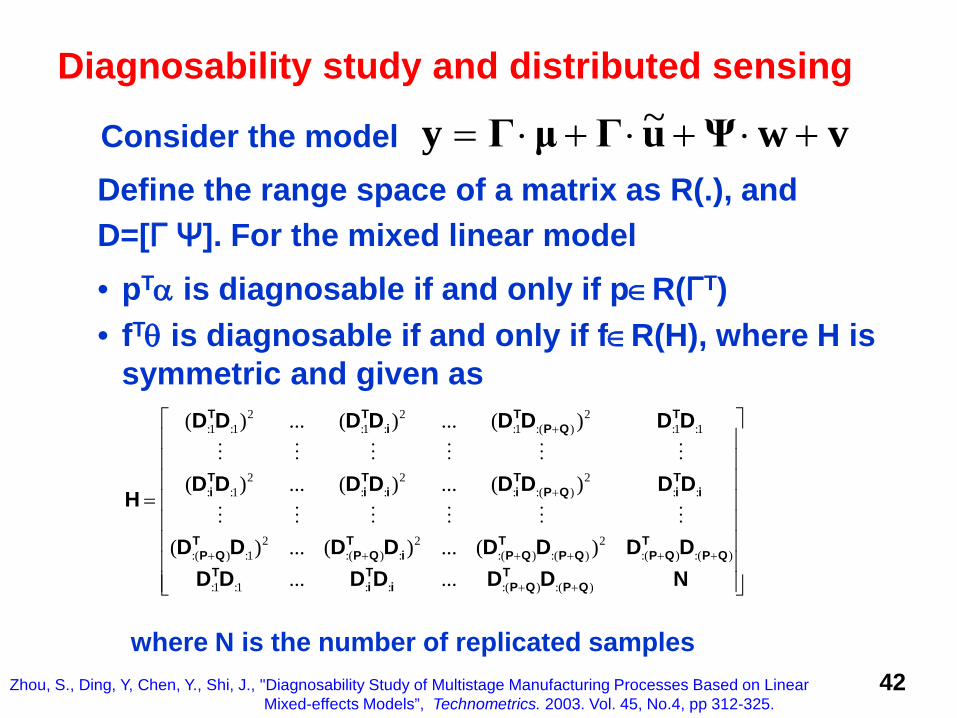
Diagnosability study and distributed sensing
Define the range space of a matrix as R(.), and D=[Г Ψ]. For the mixed linear model• pTα is diagnosable if and only if p∈R(ГT)• fTθ is diagnosable if and only if f∈R(H), where H is
symmetric and given as2 2 2
:1 :1 :1 : :1 :( ) :1 :1
2 2 2: :1 : : : :( ) : :
2 2 2:( ) :1 :( ) : :( ) :( ) :( ) :( )
:1 :1 : : :(
( ) ... ( ) ... ( )
( ) ... ( ) ... ( )
( ) ... ( ) ... ( )... ...
T T T Ti P Q
T T T Ti i i i P Q i i
T T T TP Q P Q i P Q P Q P Q P Q
T Ti i P
D D D D D D D D
D D D D D D D DH
D D D D D D D DD D D D D
+
+
+ + + + + +
+
=
) :( )T
Q P QD N+
where N is the number of replicated samples
Consider the model vwΨuΓμΓy +⋅+⋅+⋅= ~
Zhou, S., Ding, Y, Chen, Y., Shi, J., "Diagnosability Study of Multistage Manufacturing Processes Based on Linear Mixed-effects Models”, Technometrics. 2003. Vol. 45, No.4, pp 312-325.
43
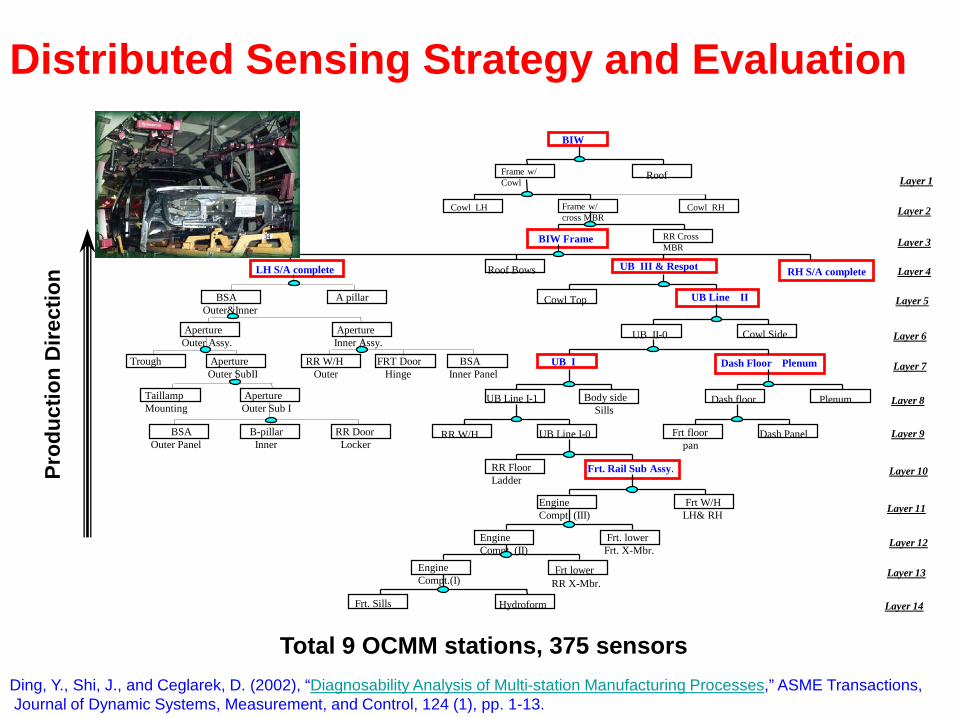
Distributed Sensing Strategy and Evaluation
Frt floorpan
Dash Panel
PlenumDash floor
Dash Floor Plenum
Frt. Sills Hydroform
Engine Compt.(I)
EngineCompt. (II)
Frt. lowerFrt. X-Mbr.
Frt lower RR X-Mbr.
EngineCompt. (III)
Frt W/HLH& RH
Frt. Rail Sub Assy.RR Floor Ladder
UB Line I-0RR W/H
UB Line I-1 Body side Sills
UB I
UB II-0 Cowl Side
UB Line IICowl Top
UB III & RespotLH S/A complete
Roof
BIW
BIW Frame
Roof Bows
RR Cross MBR
Frame w/Cowl
RH S/A complete
Layer 1
Layer 2
Layer 3
Layer 4
Layer 5
Layer 6
Layer 7
Layer 8
Layer 9
Layer 10
Layer 11
Layer 12
Layer 13
Layer 14
Cowl LH Frame w/cross MBR
Cowl RH
BSAOuter&Inner
A pillar
Aperture Outer Assy.
Aperture Inner Assy.
Aperture Outer SubII
Taillamp Mounting
Trough
Aperture Outer Sub I
RR W/H Outer
FRT DoorHinge
BSAInner Panel
BSAOuter Panel
B-pillarInner
RR DoorLocker
Total 9 OCMM stations, 375 sensors
Prod
uctio
n D
irect
ion
Ding, Y., Shi, J., and Ceglarek, D. (2002), “Diagnosability Analysis of Multi-station Manufacturing Processes,” ASME Transactions,Journal of Dynamic Systems, Measurement, and Control, 124 (1), pp. 1-13.
44
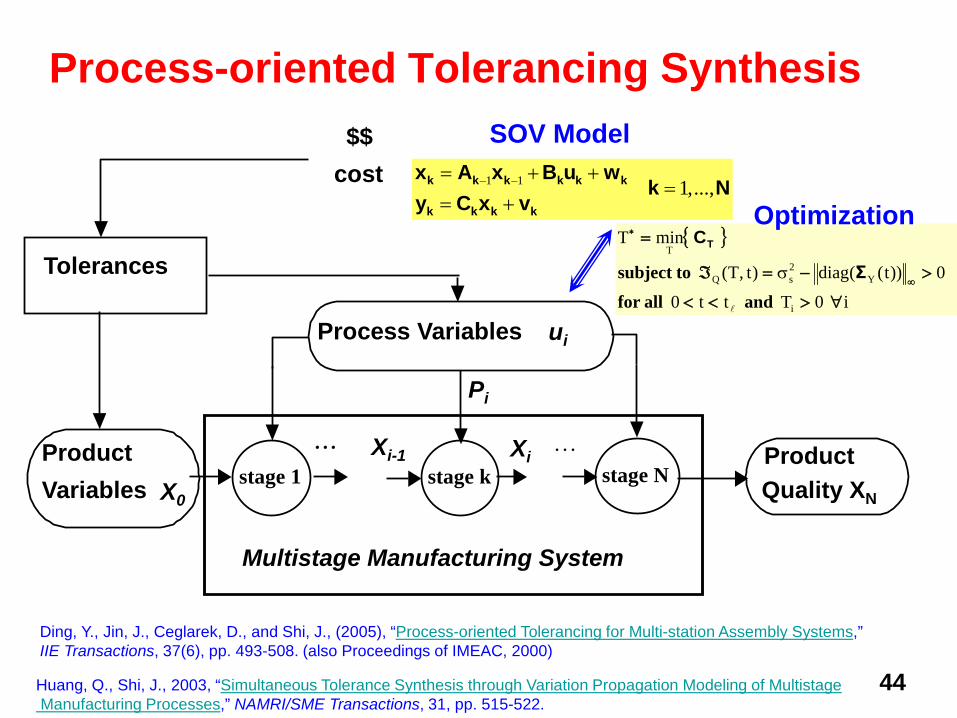
Process-oriented Tolerancing SynthesisSOV Model
stage 1Product Variables X0
Pi
Multistage Manufacturing System
stage k stage N… Xi-1 Xi
…
Process Variables ui
Product Quality XN
Tolerances
$$cost 1 1 1,...,k k k k k k
k k k k
x A x B u wk N
y C x v− −= + +
== +
Ding, Y., Jin, J., Ceglarek, D., and Shi, J., (2005), “Process-oriented Tolerancing for Multi-station Assembly Systems,” IIE Transactions, 37(6), pp. 493-508. (also Proceedings of IMEAC, 2000)
Huang, Q., Shi, J., 2003, “Simultaneous Tolerance Synthesis through Variation Propagation Modeling of MultistageManufacturing Processes,” NAMRI/SME Transactions, 31, pp. 515-522.
{ }
i0Ttt0
0))t((diag)t,T(
minT
i
Y2sQ
T
∀><<
>−=ℑ
=
∞
∗
and all for
to subject
Σ
CT
σ
Optimization
45
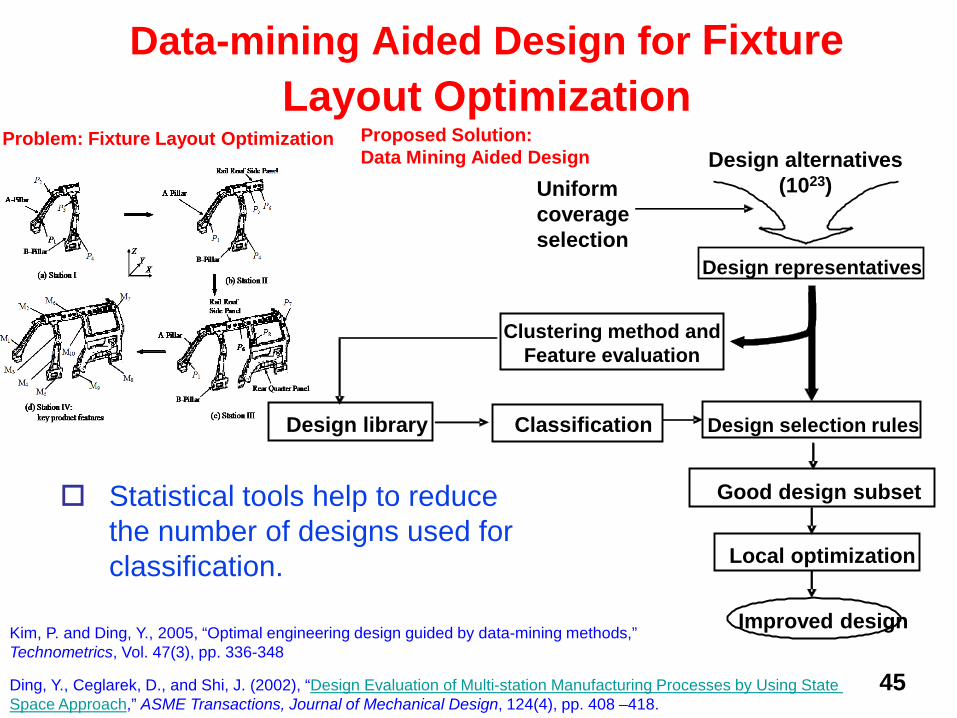
Data-mining Aided Design for Fixture Layout Optimization
Statistical tools help to reduce the number of designs used for classification.
Design library Classification Design selection rules
Good design subset
Local optimization
Improved design
Design alternatives(1023)Uniform
coverageselection
Design representatives
Clustering method andFeature evaluation
Ding, Y., Ceglarek, D., and Shi, J. (2002), “Design Evaluation of Multi-station Manufacturing Processes by Using State Space Approach,” ASME Transactions, Journal of Mechanical Design, 124(4), pp. 408 –418.
Kim, P. and Ding, Y., 2005, “Optimal engineering design guided by data-mining methods,” Technometrics, Vol. 47(3), pp. 336-348
Problem: Fixture Layout Optimization Proposed Solution:Data Mining Aided Design
46
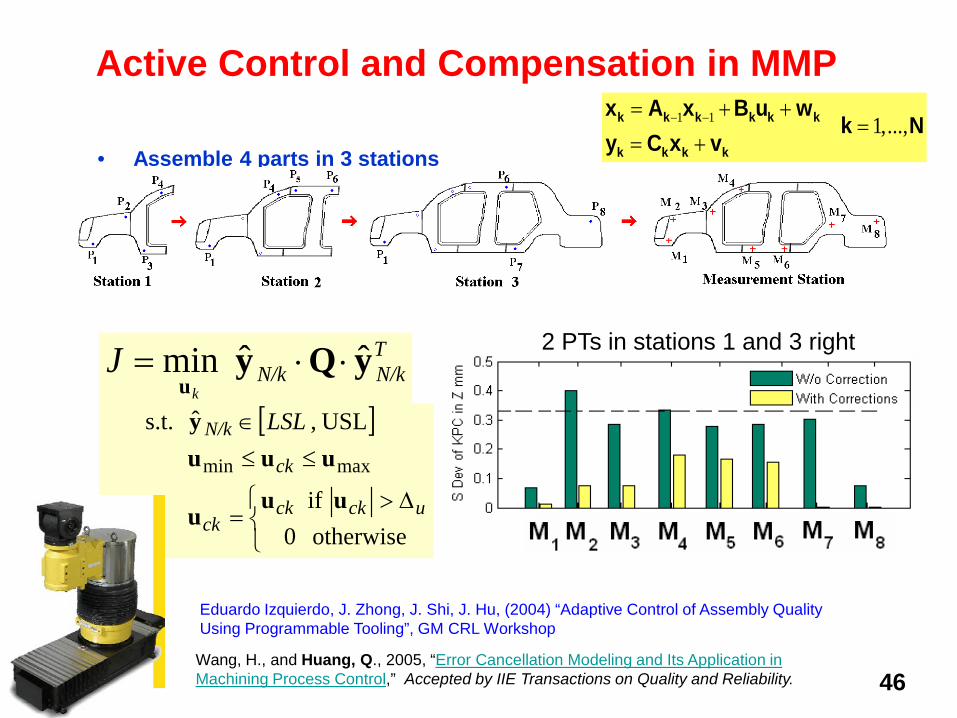
• Assemble 4 parts in 3 stations
2 PTs in stations 1 and 3 right
Active Control and Compensation in MMP1 1 1,...,k k k k k k
k k k k
x A x B u wk N
y C x v− −= + +
== +
Eduardo Izquierdo, J. Zhong, J. Shi, J. Hu, (2004) “Adaptive Control of Assembly Quality Using Programmable Tooling”, GM CRL Workshop
Wang, H., and Huang, Q., 2005, “Error Cancellation Modeling and Its Application in Machining Process Control,” Accepted by IIE Transactions on Quality and Reliability.
TN/kN/k
k
J yQyu
ˆˆ min ⋅⋅=
[ ]
∆>
=
≤≤∈
otherwise 0 if
USL, ˆ s.t.
maxmin
uckckck
ck
N/k LSL
uuu
uuuy
4747
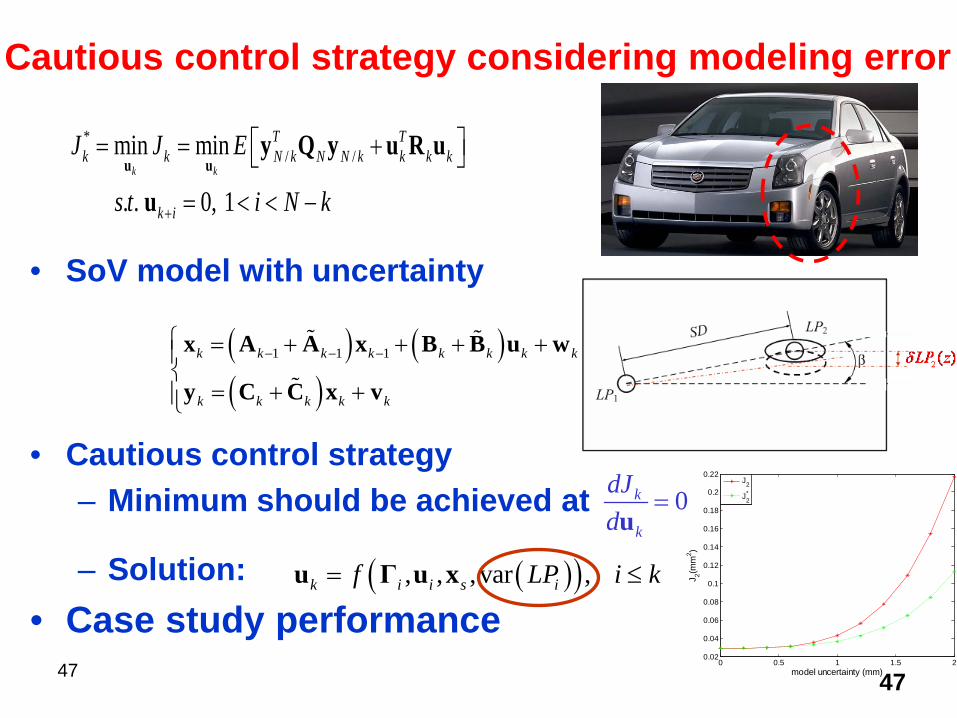
Cautious control strategy considering modeling error
• SoV model with uncertainty
• Cautious control strategy– Minimum should be achieved at
– Solution: • Case study performance
0k
k
dJd
=u
( )( ), , , var , k i i s if LP i k= ≤u Γ u x
*/ /min min
. . 0, 1k k
T Tk k N k N N k k k k
k i
J J E
s t i N k+
= = +
= < < −u u
y Q y u R u
u
( ) ( )( )
1 1 1k k k k k k k k
k k k k k
− − − = + + + +
= + +
x A A x B B u w
y C C x v
0 0.5 1 1.5 20.02
0.04
0.06
0.08
0.1
0.12
0.14
0.16
0.18
0.2
0.22
model uncertainty (mm)
J 2(mm
2 )
J2
J2*
48
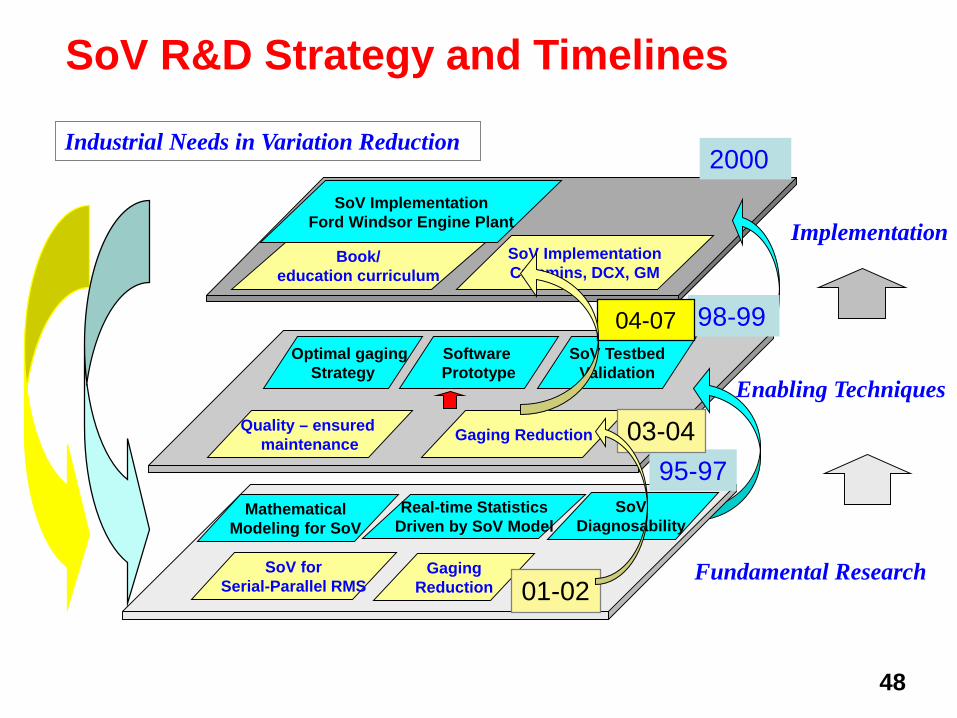
Implementation
2000
Enabling Techniques
Fundamental Research
Industrial Needs in Variation Reduction
Mathematical Modeling for SoV
SoV Diagnosability
Real-time StatisticsDriven by SoV Model
95-97
Software Prototype
SoV TestbedValidation
Optimal gagingStrategy
98-99
SoV forSerial-Parallel RMS
GagingReduction 01-02
SoV R&D Strategy and Timelines
Gaging Reduction 03-04
SoV ImplementationFord Windsor Engine Plant
SoV ImplementationCummins, DCX, GM
04-07
Quality – ensured maintenance
Book/education curriculum

49
Stream of Variation Theory and Applications
DCS SOVA Product for modeling, analysis and partial of the diagnosis and test at auto and aero industry
Error Components Manufacturing System
tolerancing
Die Fabricating Tooling error
Single station model
Assembly line
Inspection
Stamping error
Multi-station model
0
1
2
3
4
5
6
7
8
Sensitivity
Assembly system
Diagnosis
Variation analysis
Applications in Manufacturing
Modeling
Applications in Design
Methodology Development: 50+ papers with best paper awards from ASME, IIE, INFORMS, IEEEEducation: A graduate course was developed and adopted by multiple universities;Industrial Impacts: SoV theory has been implemented in auto and aerospace and their supplies companies

50
Summary• Manufacturing Analytics is an emerging research
area, which provides opportunities, as well as challenges, for performance improvement throughout the life cycle of a manufacturing system.
• Manufacturing Analytics R&D requires multidisciplinary efforts including engineering knowledge, statistics, and decision making.
• Some initial efforts in manufacturing analytics R&D have been made and demonstrated in both methodological developments and industrial applications.
• More collaborative efforts are required in both research and education.
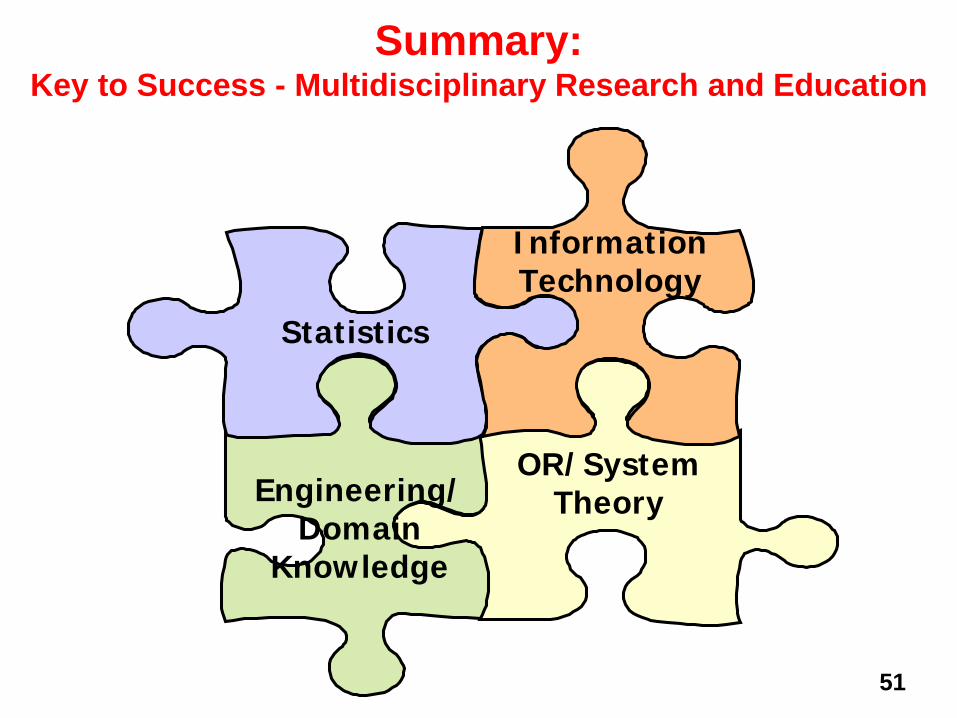
51
Summary: Key to Success - Multidisciplinary Research and Education
Engineering/Domain
Knowledge
Statistics
OR/System Theory
Information Technology
52
Thank you!

53
Acknowledgements:
• Professors– D. Apley (NWU) – D. Ceglarek (Univ. of Warwick, UK)– C. Chang (Pen State Univ)– Y. Chen (U of Iowa) – P. Chaipradubkiat (Khon Kean Univ)– Y. Ding (Texas A&M Univ) – Q. Huang (Univ. of Southern California) – E. Izquierd (Univ. of Warwick)– J. Jin (Univ. of Michigan)– R. Jin (Virginia Tech) – J. Kim (Kwangwoon University. Korea) – J. Li (Arizona State Univ.)– J. Liu (Univ. of Arizona)– K. Liu (UW-Madison)– S. Pimsakul (King MIT, Thailand)– M. Plumee (Univ of Michigan)– B. Shiu (Polytech Univ., HK) – F. Tsung (Hong Kong Univ. of Sci & Tech.)– S. Zhou (UW-Madison)
• Doctors– H. Jia (OGT)– S. Dyer (ATKEARNEY ) – D. Khorzad (Pharmaceutical Sys. Inc.)– C. Koh (PTC, Singapore) – H. Li (GM)– Q. Rong (MorningStar)– B. Sun (Ford)– J. Zhong (Microsoft Research)– L. Hao (Cox Communications)
• and Current Ph.D. Students– M. Nabhan– M. Reisi– X. Shi– Y. Wen– H. Yan– X. Yue
The presented work were collaborated with some of my former and current Ph.D. students:
The work are partially sponsored by: NSF, NIST-ATP, DOE, Air Force, GM, DCX, Ford, Lockheed-Martin, Boeing, Autobody Consortium, and other industrial members.
Recommended