NetSec2005 ·1·
Fund: National Computer network Emergency Response technical Team/Coordination Center of China (2004 - 2-917-F-005)
Author: Xinguang,Xiao (1974-), male, Jilin, Engineer, Bachelor, [email protected]
Macroscopic Network Virus Statistics
Xinguang,Xiao1; Bing,Wu2; Yongliang,Qiu3;Xiaobing,Zhang4
(1、2、3: Antiy Labs Harbin P.O.Box 898 150001; 4: Harbin Institute of Technology Harbin Fanrong Street 150 150001)
Abstract: Network viruses have become the primary security threats, so monitoring and macro
statistics are important means to protect the Internet. Since network virus incidents are distributed
incidents based on a large and complex system, so the macro description of network viruses is
becoming a research topic. This paper introduces a comprehensive statistical analysis system of
virus sample statistics, virus distribution statistics, virus network measurement, etc.
Keywords: network virus; macro statistics; network assessment; infected node
1. Foreword
Network virus outbreak is a serious and frequent network security incident which is basically in line
with Moore's theorem, i.e. the number of viruses doubles every 18 months. Meanwhile, the
network security incident is also in line with Metcalfe's theorem, i.e. the efficiency of the network is
inversely proportional to the square of the number of users. It can be seen security incidents are
inevitable for the internet because it is open and complex. As a result, virus monitoring and
macro-statistics are essential for mastering the virus development trend and protecting the
Internet.
The difficulty of network virus statistics lies in the massive and discrete incidents.
2. The Purpose of Macro Statistics
2.1 Observe the Virus Infection Trend
Through the macro statistics of network viruses, we can learn of the virus transmission situation in
every region, and then develop virus defense solutions.
2.2 Control the Virus Transmission Situation
After we master the global virus trend, we can figure out the solution. For example,
Worm.Win32.Blast infected plenty of systems and took up most of the bandwidth of the network. In
this manner of situation, we can drop antivirus tools in specific locations to prevent it from
spreading.
·2· NetSec2005
2.3 Estimate the Virus Transmission Trend
We take an area subnet as the data set, virus attack times or types as the Y axis, and the time as the
X axis. Then we can draw a curve graph of a virus. If we change a variant, we can get a
corresponding statistical graph. We can then analyze the graph, and learn something about the virus
transmission trend. Eventually, we can scientifically estimate the virus trend in the future,
3. Sample/Database Audit
As to analysis of the virus transmission trend, sample/database auditing is the most traditional and
basic method.
As for the statistics for network viruses, a two-dimensional analysis is needed. One development
dimension is the depth, i.e. the generation of new viruses. The other development dimension is the
breadth, i.e. the transmission scope of a virus during its life cycle. The sample/database audit is a
statistical method on the virus development depth. Generally anti-virus companies will determine
the types of new viruses according to a sample and signature audit. Viruses come from infected
users’ reports and sample exchanges with partner companies.
We audit the statistics of reported virus numbers, names of new viruses, etc. The number statistics
can help us with the virus infection situation, while the name statistics can help us with the virus
generation and database situation.
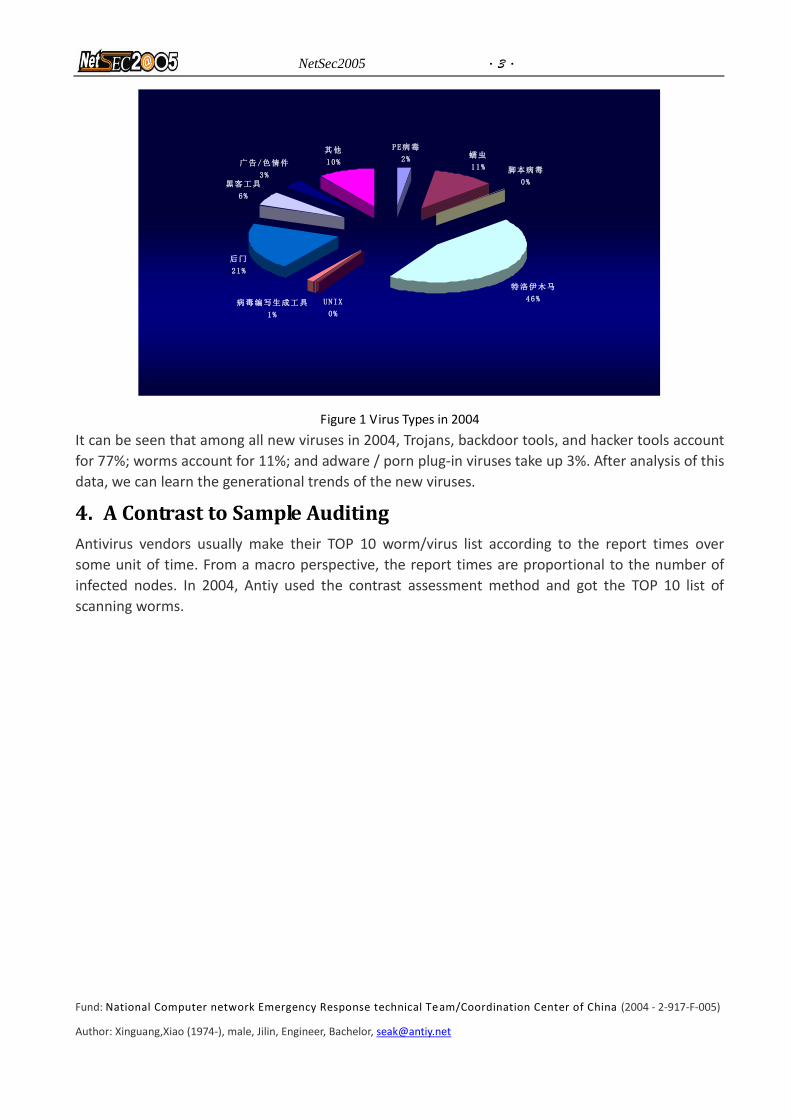
For example, in 2004, Antiy Labs used this method to learn of the virus situation. We added 20,047
new independent viruses (including variants) to the database. The virus types are as follows:
Table 1 Virus Distribution
PE Virus 478
UNIX/Linux Virus 33
Worm 2239
Script 81
Trojan Horse 8969
Backdoor Tools 4010
Hacker Tools 1241
Virus Compiling Tools 279
Adware/Porn Plug-in Virus 668
Others 2049
The pie chart of new virus types in 2004 is as follows.
NetSec2005 ·3·
Fund: National Computer network Emergency Response technical Team/Coordination Center of China (2004 - 2-917-F-005)
Author: Xinguang,Xiao (1974-), male, Jilin, Engineer, Bachelor, [email protected]
PE病毒
2% 蠕虫
11% 脚本病毒
0%
特洛伊木马
46%病毒编写生成工具
1%
后门
21%
黑客工具
6%
广告/色情件
3%
其他
10%
UNIX
0%
Figure 1 Virus Types in 2004
It can be seen that among all new viruses in 2004, Trojans, backdoor tools, and hacker tools account
for 77%; worms account for 11%; and adware / porn plug-in viruses take up 3%. After analysis of this
data, we can learn the generational trends of the new viruses.
4. A Contrast to Sample Auditing
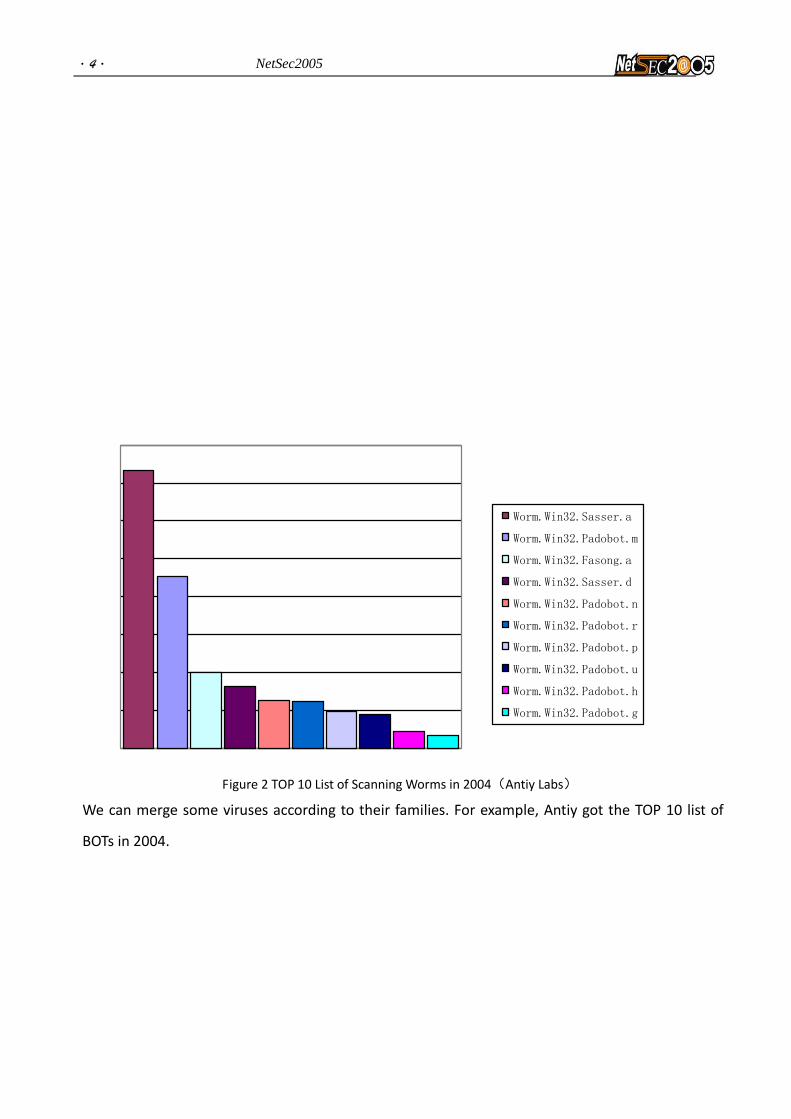
Antivirus vendors usually make their TOP 10 worm/virus list according to the report times over
some unit of time. From a macro perspective, the report times are proportional to the number of
infected nodes. In 2004, Antiy used the contrast assessment method and got the TOP 10 list of
scanning worms.
·4· NetSec2005
Worm.Win32.Sasser.a
Worm.Win32.Padobot.m
Worm.Win32.Fasong.a
Worm.Win32.Sasser.d
Worm.Win32.Padobot.n
Worm.Win32.Padobot.r
Worm.Win32.Padobot.p
Worm.Win32.Padobot.u
Worm.Win32.Padobot.h
Worm.Win32.Padobot.g
Figure 2 TOP 10 List of Scanning Worms in 2004(Antiy Labs)
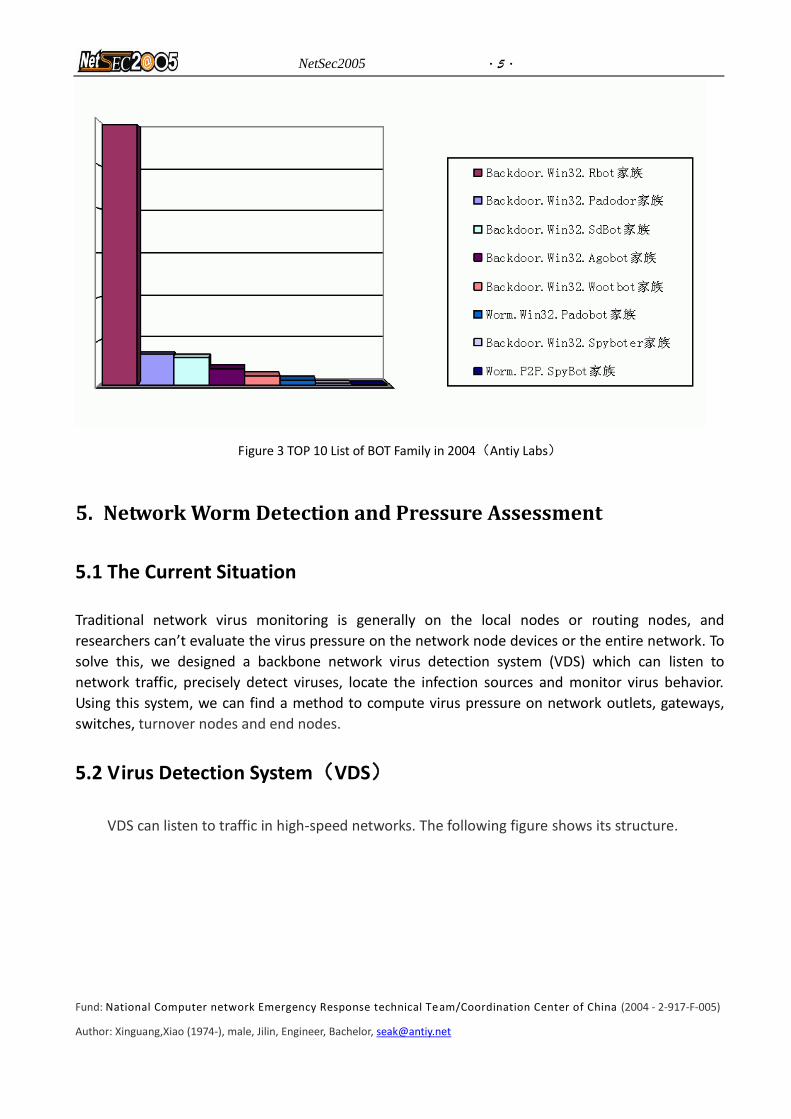
We can merge some viruses according to their families. For example, Antiy got the TOP 10 list of
BOTs in 2004.
NetSec2005 ·5·
Fund: National Computer network Emergency Response technical Team/Coordination Center of China (2004 - 2-917-F-005)
Author: Xinguang,Xiao (1974-), male, Jilin, Engineer, Bachelor, [email protected]
Figure 3 TOP 10 List of BOT Family in 2004(Antiy Labs)
5. Network Worm Detection and Pressure Assessment
5.1 The Current Situation
Traditional network virus monitoring is generally on the local nodes or routing nodes, and
researchers can’t evaluate the virus pressure on the network node devices or the entire network. To
solve this, we designed a backbone network virus detection system (VDS) which can listen to
network traffic, precisely detect viruses, locate the infection sources and monitor virus behavior.
Using this system, we can find a method to compute virus pressure on network outlets, gateways,
switches, turnover nodes and end nodes.
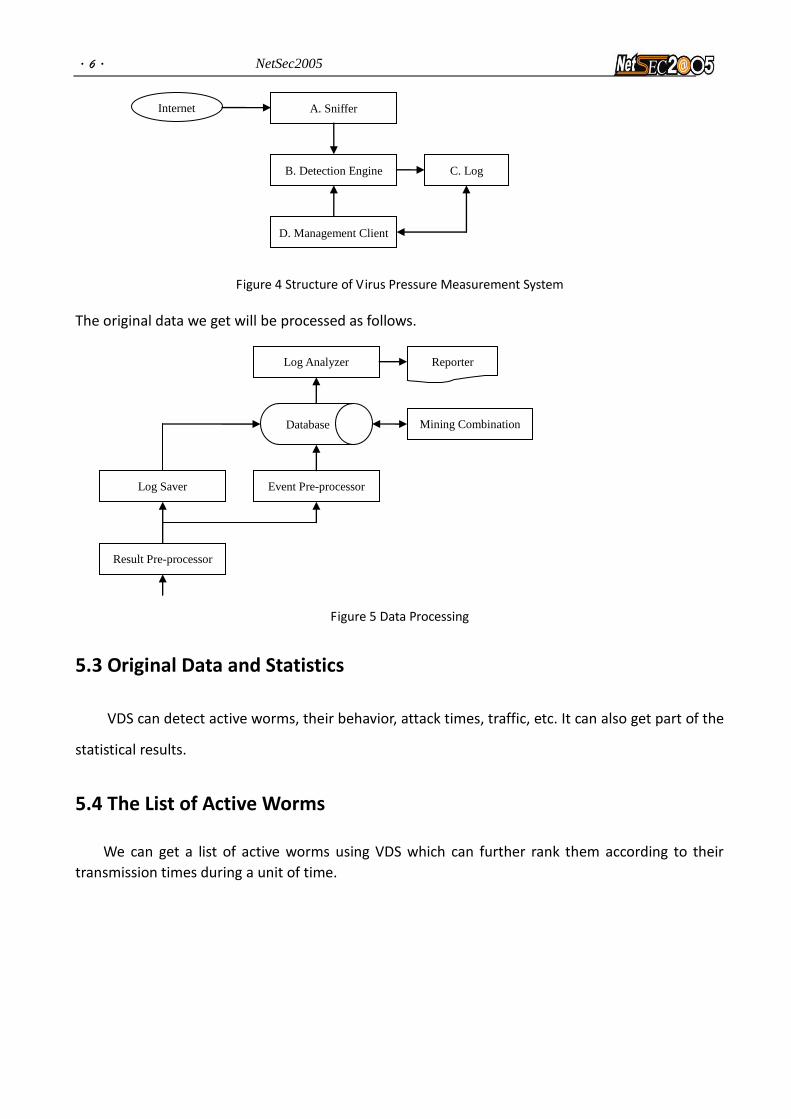
5.2 Virus Detection System(VDS)
VDS can listen to traffic in high-speed networks. The following figure shows its structure.
·6· NetSec2005
Figure 4 Structure of Virus Pressure Measurement System
The original data we get will be processed as follows.
Figure 5 Data Processing
5.3 Original Data and Statistics
VDS can detect active worms, their behavior, attack times, traffic, etc. It can also get part of the
statistical results.
5.4 The List of Active Worms
We can get a list of active worms using VDS which can further rank them according to their
transmission times during a unit of time.
Event Pre-processor
Database
Log Analyzer
Log Saver
Reporter
Result Pre-processor
Mining Combination
A. Sniffer
B. Detection Engine C. Log
D. Management Client
Engine
Internet
NetSec2005 ·7·
Fund: National Computer network Emergency Response technical Team/Coordination Center of China (2004 - 2-917-F-005)
Author: Xinguang,Xiao (1974-), male, Jilin, Engineer, Bachelor, [email protected]
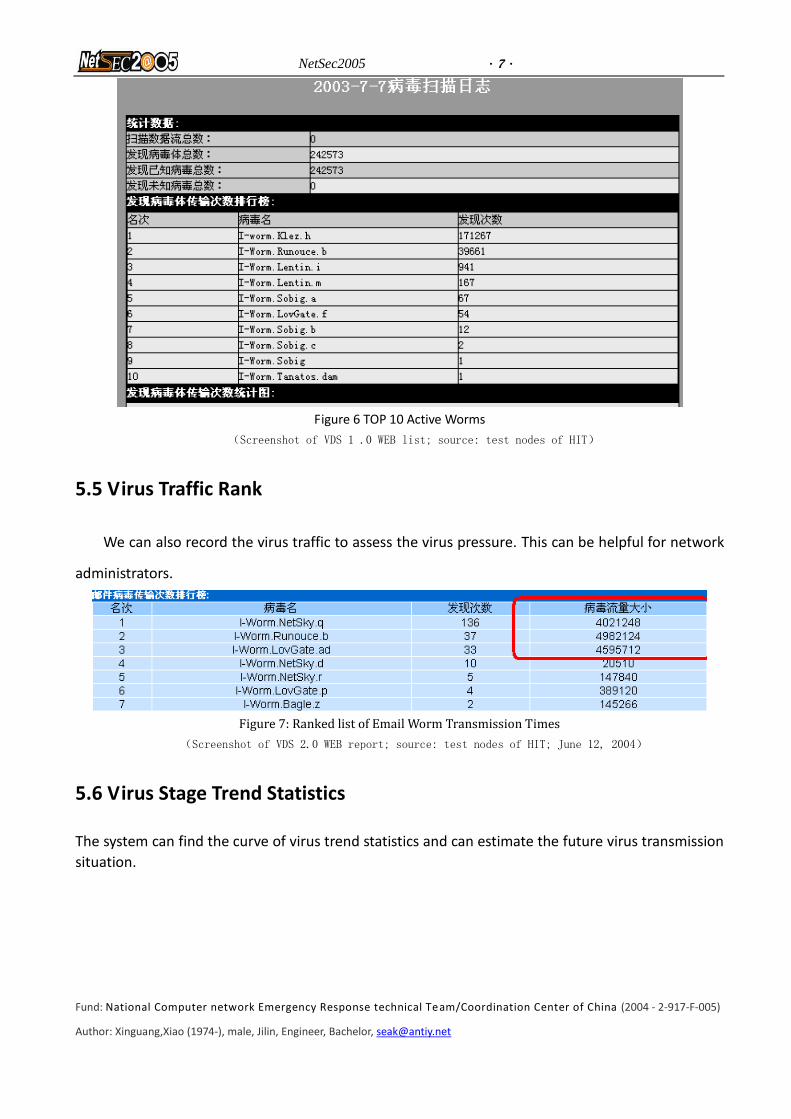
Figure 6 TOP 10 Active Worms
(Screenshot of VDS 1 .0 WEB list; source: test nodes of HIT)
5.5 Virus Traffic Rank
We can also record the virus traffic to assess the virus pressure. This can be helpful for network
administrators.
Figure 7: Ranked list of Email Worm Transmission Times
(Screenshot of VDS 2.0 WEB report; source: test nodes of HIT; June 12, 2004)
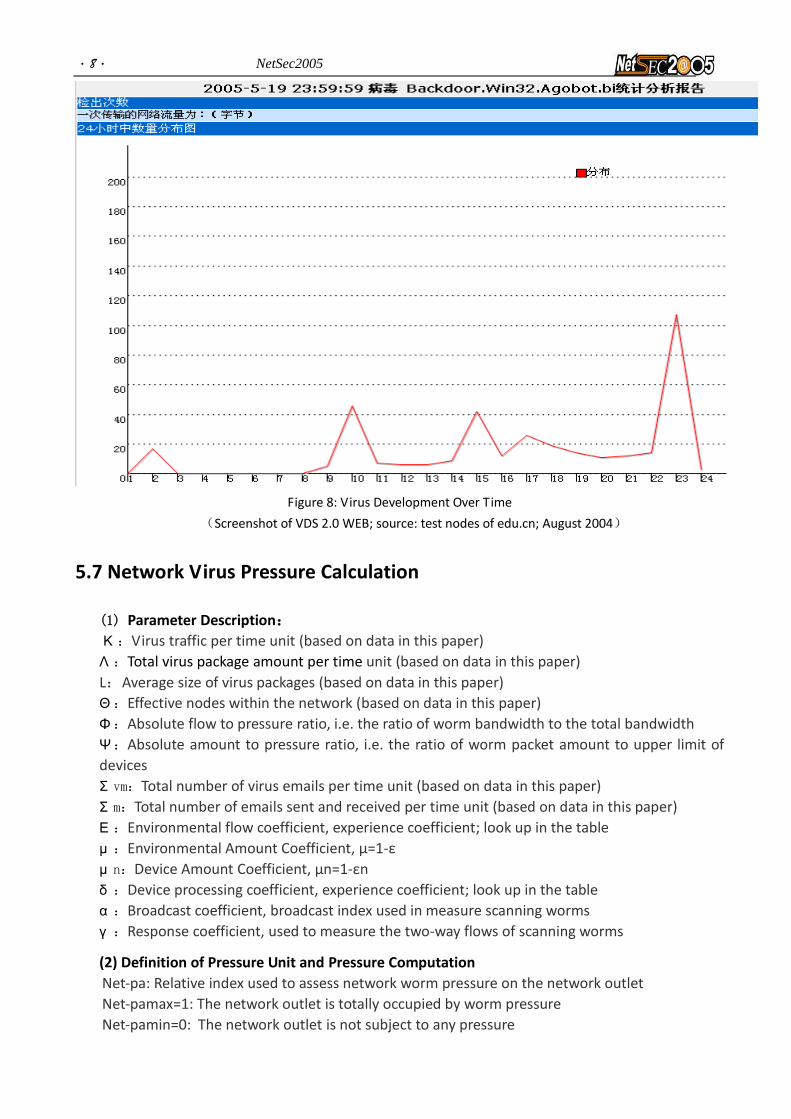
5.6 Virus Stage Trend Statistics
The system can find the curve of virus trend statistics and can estimate the future virus transmission
situation.
·8· NetSec2005
Figure 8: Virus Development Over Time
(Screenshot of VDS 2.0 WEB; source: test nodes of edu.cn; August 2004)
5.7 Network Virus Pressure Calculation
(1) Parameter Description:
Κ :Virus traffic per time unit (based on data in this paper)
Λ :Total virus package amount per time unit (based on data in this paper)
L:Average size of virus packages (based on data in this paper)
Θ:Effective nodes within the network (based on data in this paper)
Φ:Absolute flow to pressure ratio, i.e. the ratio of worm bandwidth to the total bandwidth
Ψ:Absolute amount to pressure ratio, i.e. the ratio of worm packet amount to upper limit of
devices
Σ vm:Total number of virus emails per time unit (based on data in this paper)
Σ m:Total number of emails sent and received per time unit (based on data in this paper)
Ε :Environmental flow coefficient, experience coefficient; look up in the table
μ :Environmental Amount Coefficient, μ=1-ε
μ n:Device Amount Coefficient, μn=1-εn
δ :Device processing coefficient, experience coefficient; look up in the table
α :Broadcast coefficient, broadcast index used in measure scanning worms
γ :Response coefficient, used to measure the two-way flows of scanning worms
(2) Definition of Pressure Unit and Pressure Computation
Net-pa: Relative index used to assess network worm pressure on the network outlet
Net-pamax=1: The network outlet is totally occupied by worm pressure
Net-pamin=0: The network outlet is not subject to any pressure
NetSec2005 ·9·
Fund: National Computer network Emergency Response technical Team/Coordination Center of China (2004 - 2-917-F-005)
Author: Xinguang,Xiao (1974-), male, Jilin, Engineer, Bachelor, [email protected]
Since the outlet devices are quite different in their capabilities, we use ε =0.5 for
comprehensive computation.
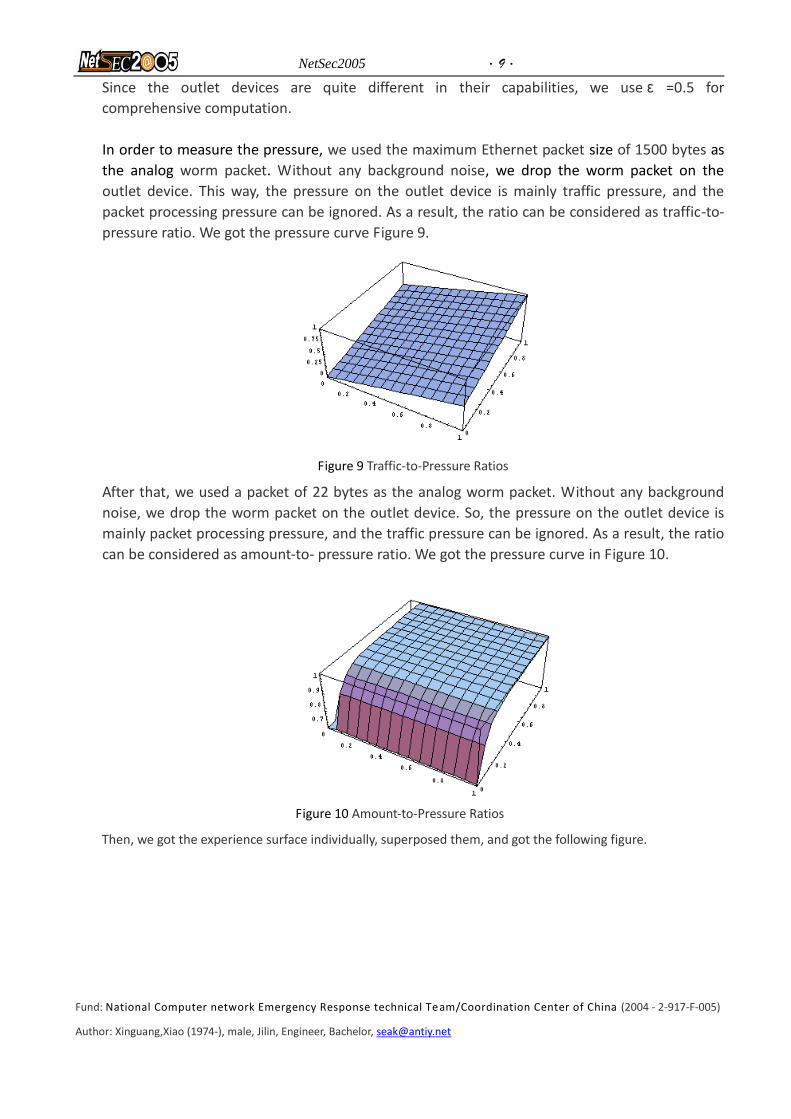
In order to measure the pressure, we used the maximum Ethernet packet size of 1500 bytes as
the analog worm packet. Without any background noise, we drop the worm packet on the
outlet device. This way, the pressure on the outlet device is mainly traffic pressure, and the
packet processing pressure can be ignored. As a result, the ratio can be considered as traffic-to-
pressure ratio. We got the pressure curve Figure 9.
Figure 9 Traffic-to-Pressure Ratios
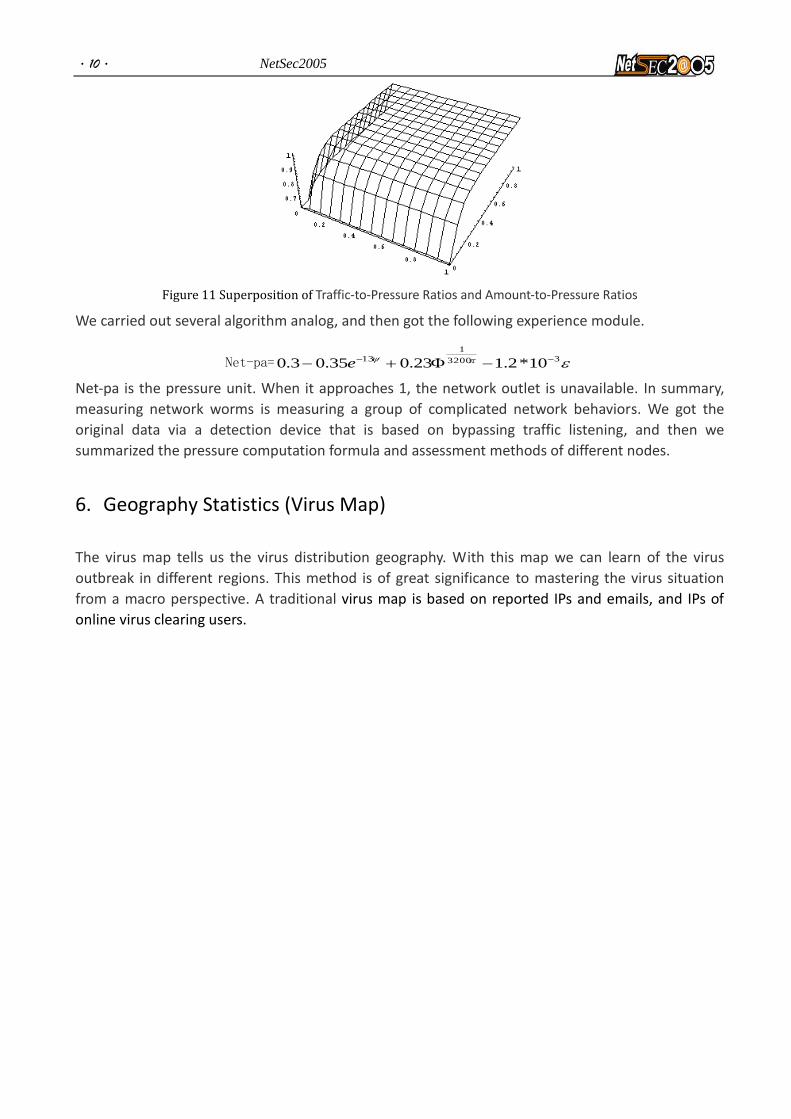
After that, we used a packet of 22 bytes as the analog worm packet. Without any background
noise, we drop the worm packet on the outlet device. So, the pressure on the outlet device is
mainly packet processing pressure, and the traffic pressure can be ignored. As a result, the ratio
can be considered as amount-to- pressure ratio. We got the pressure curve in Figure 10.
Figure 10 Amount-to-Pressure Ratios
Then, we got the experience surface individually, superposed them, and got the following figure.
·10· NetSec2005
Figure 11 Superposition of Traffic-to-Pressure Ratios and Amount-to-Pressure Ratios
We carried out several algorithm analog, and then got the following experience module.
Net-pa= 33200
1
13 10*2.123.035.03.0 e
Net-pa is the pressure unit. When it approaches 1, the network outlet is unavailable. In summary,
measuring network worms is measuring a group of complicated network behaviors. We got the
original data via a detection device that is based on bypassing traffic listening, and then we
summarized the pressure computation formula and assessment methods of different nodes.
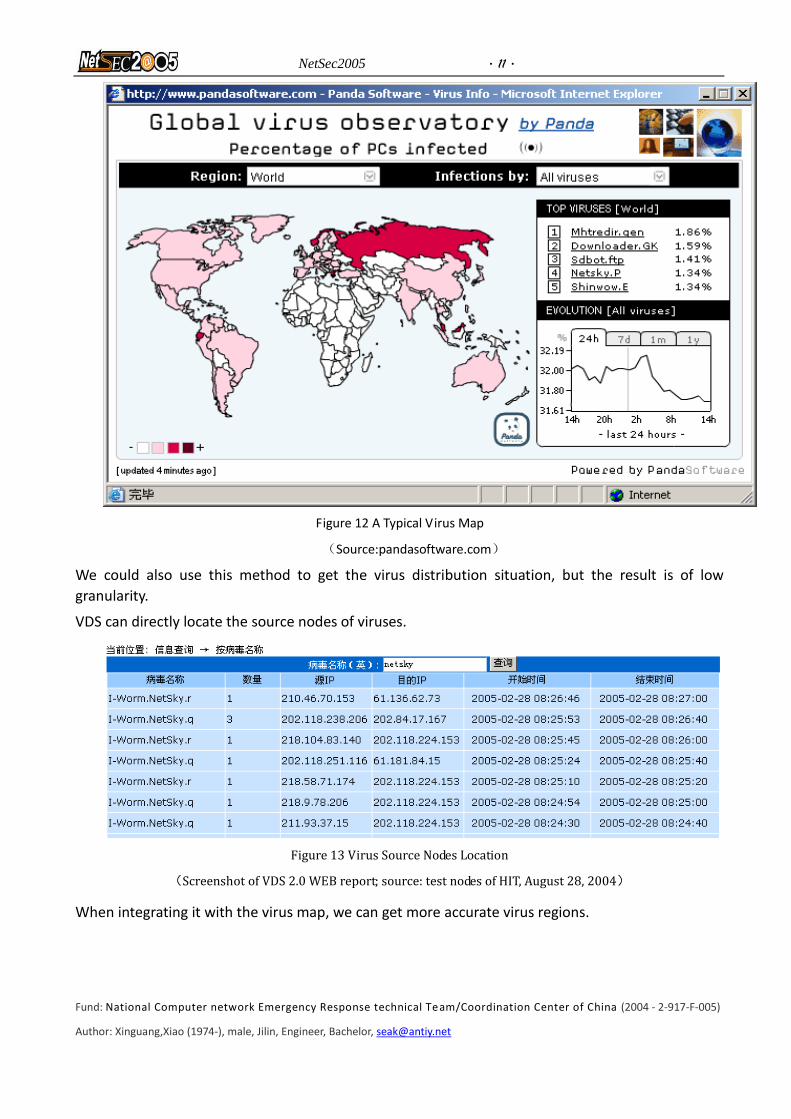
6. Geography Statistics (Virus Map)
The virus map tells us the virus distribution geography. With this map we can learn of the virus
outbreak in different regions. This method is of great significance to mastering the virus situation
from a macro perspective. A traditional virus map is based on reported IPs and emails, and IPs of
online virus clearing users.
NetSec2005 ·11·
Fund: National Computer network Emergency Response technical Team/Coordination Center of China (2004 - 2-917-F-005)
Author: Xinguang,Xiao (1974-), male, Jilin, Engineer, Bachelor, [email protected]
Figure 12 A Typical Virus Map
(Source:pandasoftware.com)
We could also use this method to get the virus distribution situation, but the result is of low
granularity.
VDS can directly locate the source nodes of viruses.
Figure 13 Virus Source Nodes Location
(Screenshot of VDS 2.0 WEB report; source: test nodes of HIT, August 28, 2004)
When integrating it with the virus map, we can get more accurate virus regions.
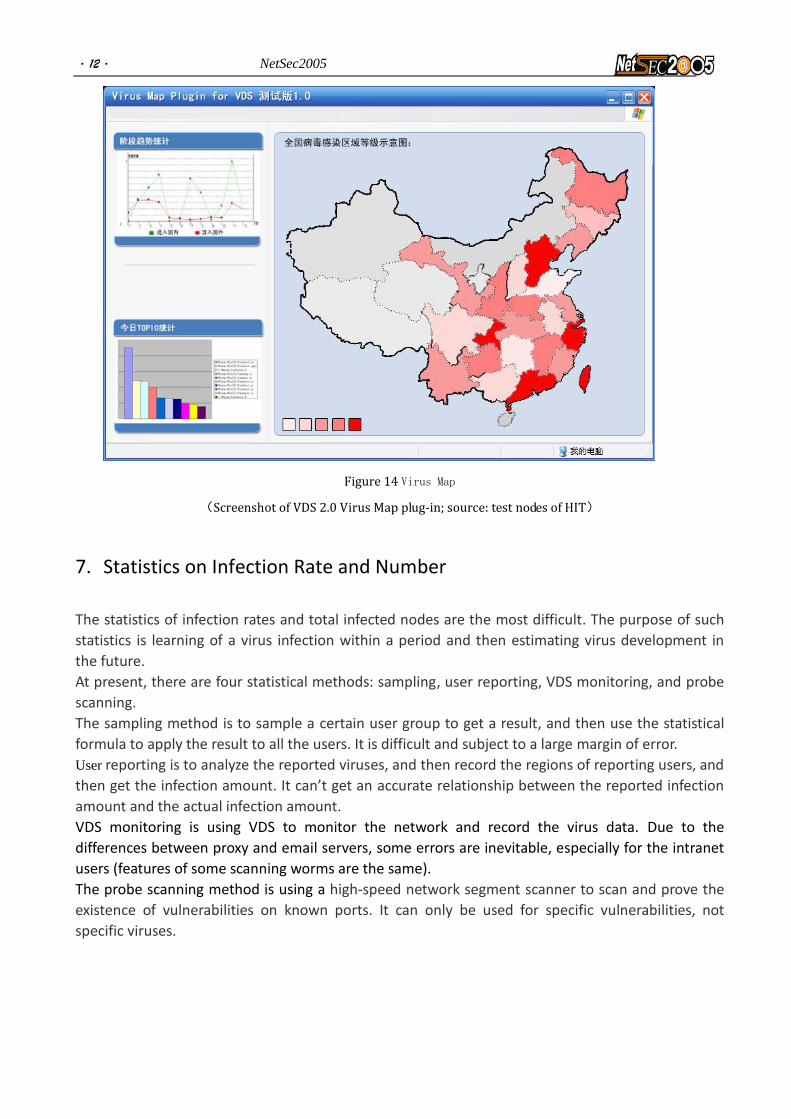
·12· NetSec2005
Figure 14 Virus Map
(Screenshot of VDS 2.0 Virus Map plug-in; source: test nodes of HIT)
7. Statistics on Infection Rate and Number
The statistics of infection rates and total infected nodes are the most difficult. The purpose of such
statistics is learning of a virus infection within a period and then estimating virus development in
the future.
At present, there are four statistical methods: sampling, user reporting, VDS monitoring, and probe
scanning.
The sampling method is to sample a certain user group to get a result, and then use the statistical
formula to apply the result to all the users. It is difficult and subject to a large margin of error.
User reporting is to analyze the reported viruses, and then record the regions of reporting users, and
then get the infection amount. It can’t get an accurate relationship between the reported infection
amount and the actual infection amount.
VDS monitoring is using VDS to monitor the network and record the virus data. Due to the
differences between proxy and email servers, some errors are inevitable, especially for the intranet
users (features of some scanning worms are the same).
The probe scanning method is using a high-speed network segment scanner to scan and prove the
existence of vulnerabilities on known ports. It can only be used for specific vulnerabilities, not
specific viruses.
NetSec2005 ·13·
Fund: National Computer network Emergency Response technical Team/Coordination Center of China (2004 - 2-917-F-005)
Author: Xinguang,Xiao (1974-), male, Jilin, Engineer, Bachelor, [email protected]
8. Calculation of Infection Nodes
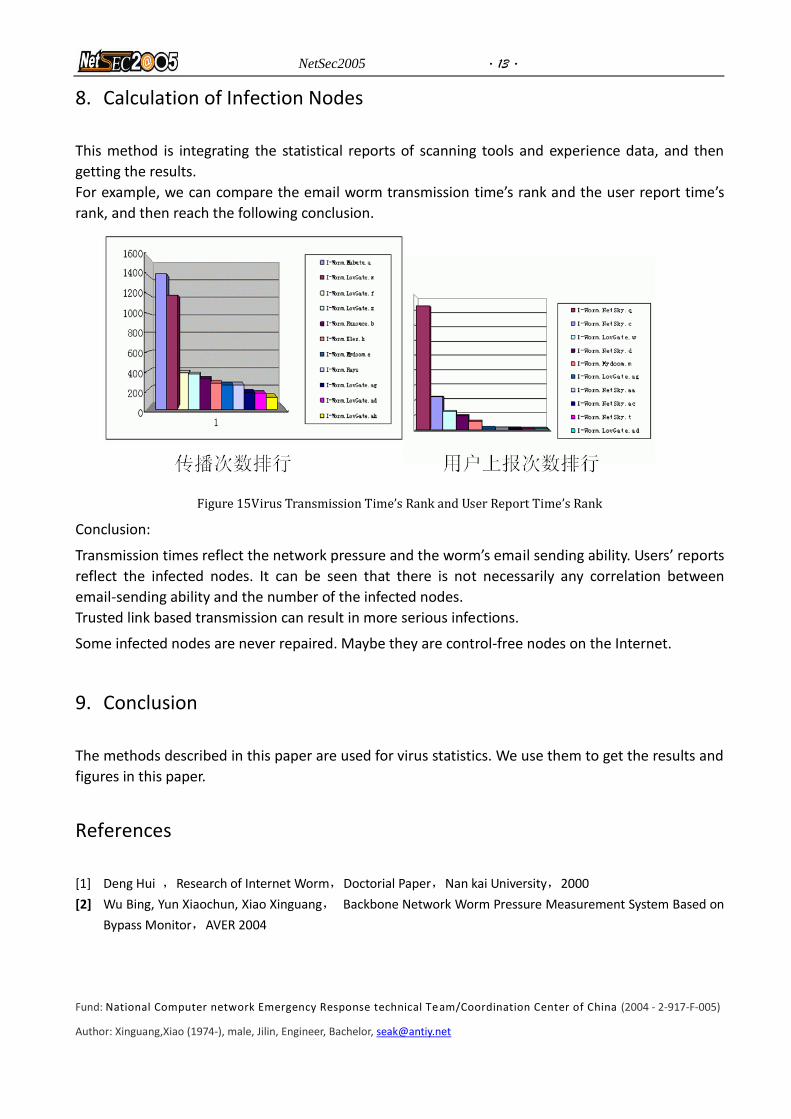
This method is integrating the statistical reports of scanning tools and experience data, and then
getting the results.
For example, we can compare the email worm transmission time’s rank and the user report time’s
rank, and then reach the following conclusion.
Figure 15Virus Transmission Time’s Rank and User Report Time’s Rank
Conclusion:
Transmission times reflect the network pressure and the worm’s email sending ability. Users’ reports
reflect the infected nodes. It can be seen that there is not necessarily any correlation between
email-sending ability and the number of the infected nodes.
Trusted link based transmission can result in more serious infections.
Some infected nodes are never repaired. Maybe they are control-free nodes on the Internet.
9. Conclusion
The methods described in this paper are used for virus statistics. We use them to get the results and
figures in this paper.
References
[1] Deng Hui ,Research of Internet Worm,Doctorial Paper,Nan kai University,2000
[2] Wu Bing, Yun Xiaochun, Xiao Xinguang, Backbone Network Worm Pressure Measurement System Based on
Bypass Monitor,AVER 2004
Recommended