8/10/2019 Laporan Mekanika Fluida H-02
http://slidepdf.com/reader/full/laporan-mekanika-fluida-h-02 1/19
8/10/2019 Laporan Mekanika Fluida H-02
http://slidepdf.com/reader/full/laporan-mekanika-fluida-h-02 2/19
HYDROSTATIC PRESSURE
1. Objective
This experimental work is intended to determine a hydrostatic force magnitude on thevertical plane. As well as determining the correlation between water level and mass load
on the apparatus.
2.Basic Theory
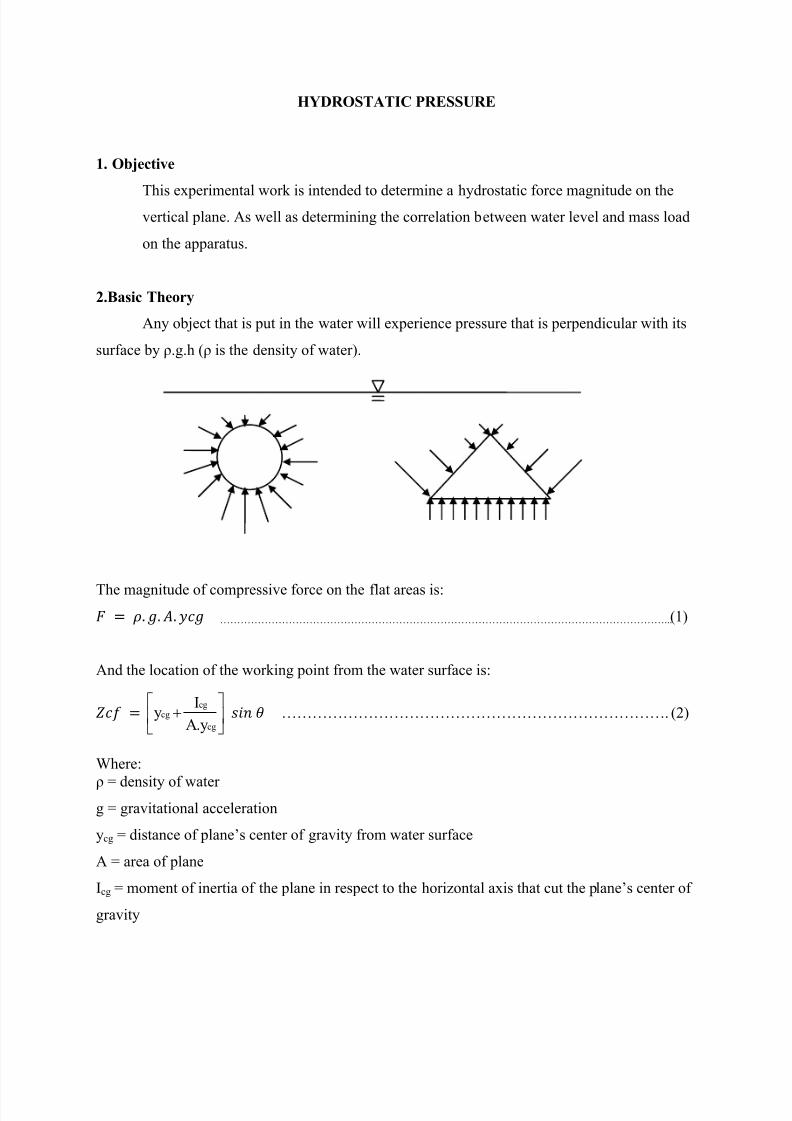
Any object that is put in the water will experience pressure that is perpendicular with its
surface by ρ.g.h (ρ is the density of water).
The magnitude of compressive force on the flat areas is:
…………………………………………………………………………………………………………………... (1)
And the location of the working point from the water surface is:
cg
gccg
y.AI
y …………………………………………………………………. (2)
Where:
ρ = density of water g = gravitational acceleration
ycg = distance of plane’s center of gravity from water surface
A = area of plane
Icg = moment of inertia of the plane in respect to the horizontal axis that cut the p lane’s center of
gravity
8/10/2019 Laporan Mekanika Fluida H-02
http://slidepdf.com/reader/full/laporan-mekanika-fluida-h-02 3/19
θ = angle of the plane to the water surface
Zcf = distance of force’s working point from water surface
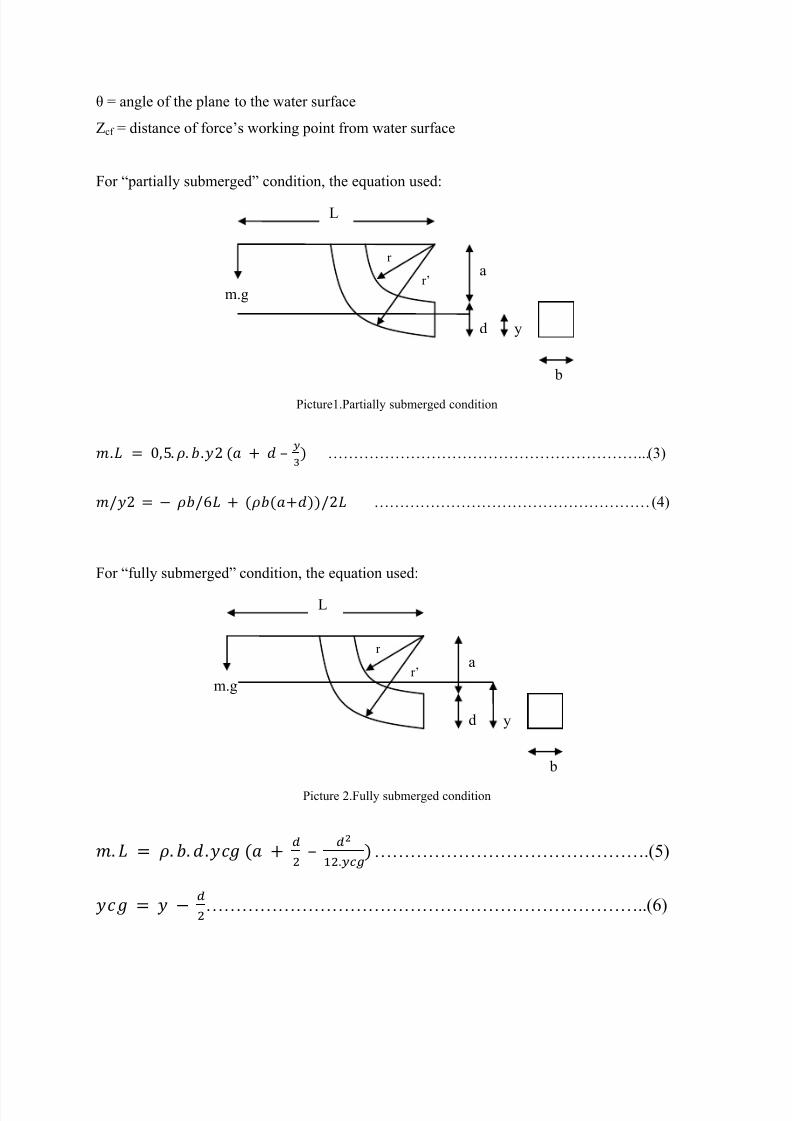
For “partially submerged” condition, the equation used:
Picture1.Partially submerged condition
– ……………………………………………………... (3)
……………………………………………… (4)
For “fully submerged” condition, the equation used:
Picture 2.Fully submerged condition
– ………………………………………. (5)
……………………………………………………………….. (6)
m.g
b
yd
ar’
r
L
m.g
b
yd
ar’
r
L
8/10/2019 Laporan Mekanika Fluida H-02
http://slidepdf.com/reader/full/laporan-mekanika-fluida-h-02 4/19
8/10/2019 Laporan Mekanika Fluida H-02
http://slidepdf.com/reader/full/laporan-mekanika-fluida-h-02 5/19
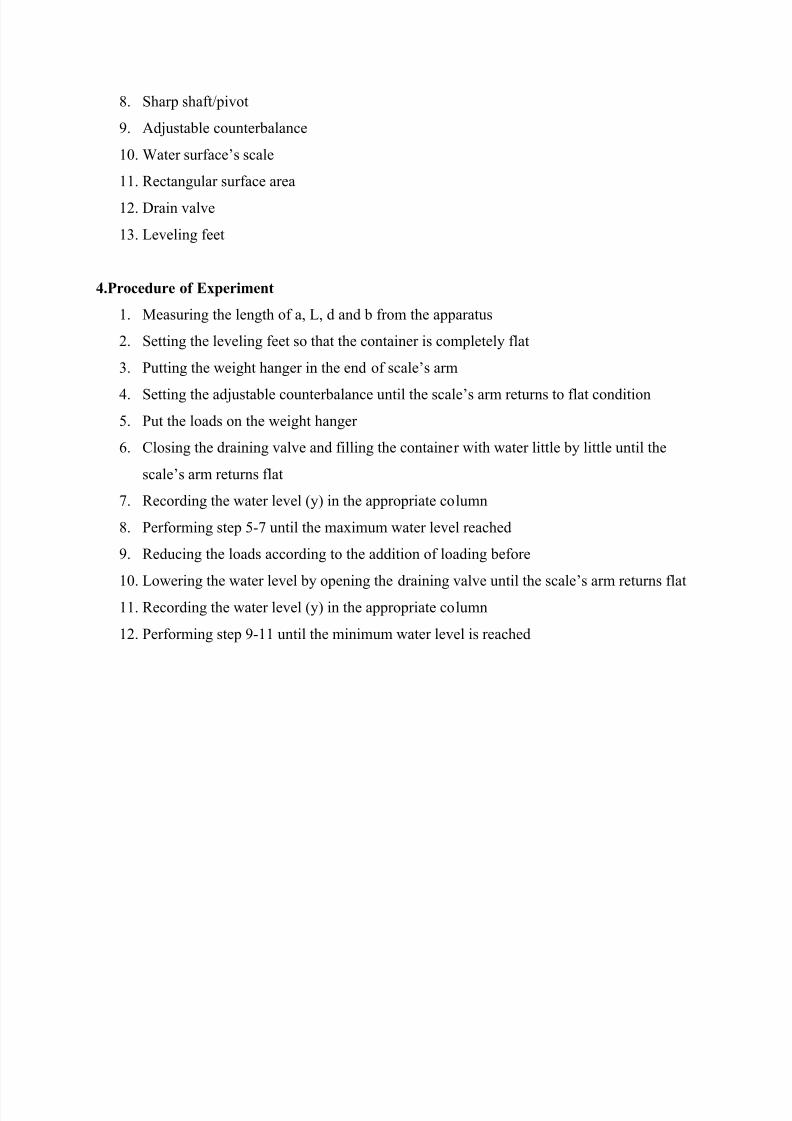
8. Sharp shaft/pivot
9. Adjustable counterbalance
10. Water surface’s scale
11. Rectangular surface area
12. Drain valve
13. Leveling feet
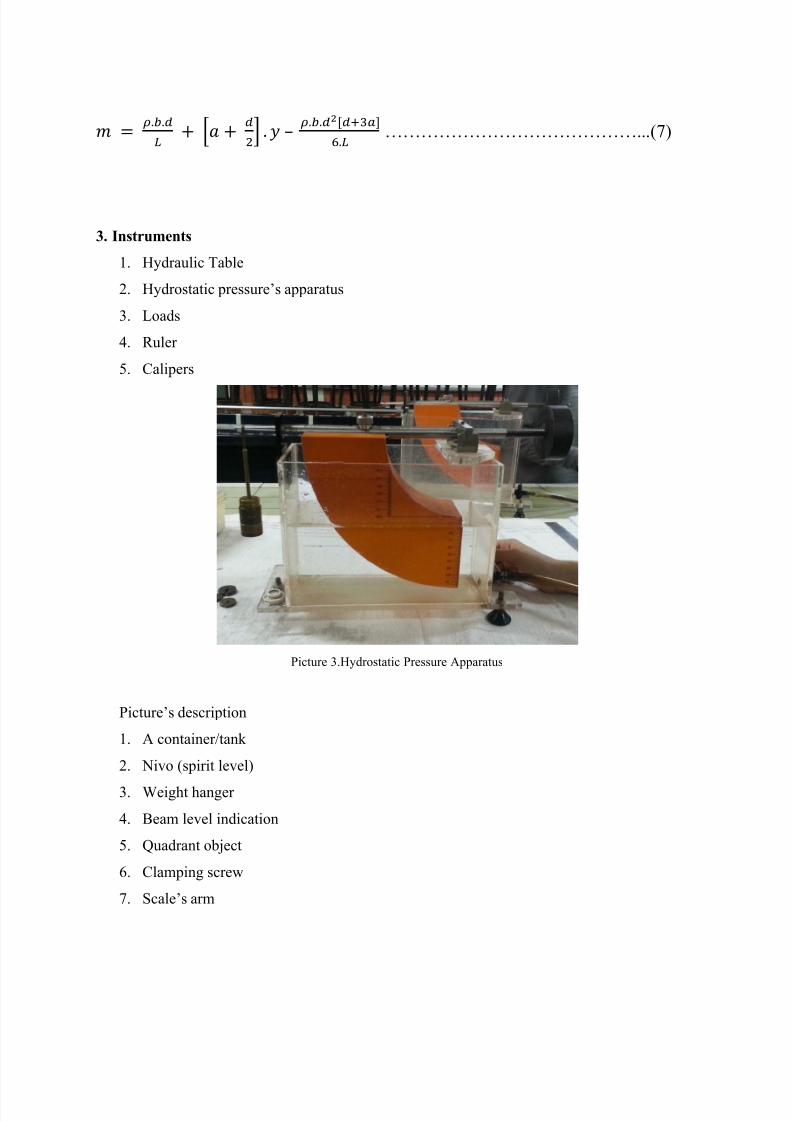
4.Procedure of Experiment
1. Measuring the length of a, L, d and b from the apparatus
2. Setting the leveling feet so that the container is completely flat
3. Putting the weight hanger in the end of scale’s arm
4. Setting the adjustable counterbalance until the scale’s arm returns to flat condition 5. Put the loads on the weight hanger
6. Closing the draining valve and filling the container with water little by little until the
scale’s arm returns flat
7. Recording the water level (y) in the appropriate column
8. Performing step 5-7 until the maximum water level reached
9. Reducing the loads according to the addition of loading before
10. Lowering the water level by opening the draining valve until the scale’s arm returns flat
11. Recording the water level (y) in the appropriate column
12. Performing step 9-11 until the minimum water level is reached
8/10/2019 Laporan Mekanika Fluida H-02
http://slidepdf.com/reader/full/laporan-mekanika-fluida-h-02 6/19
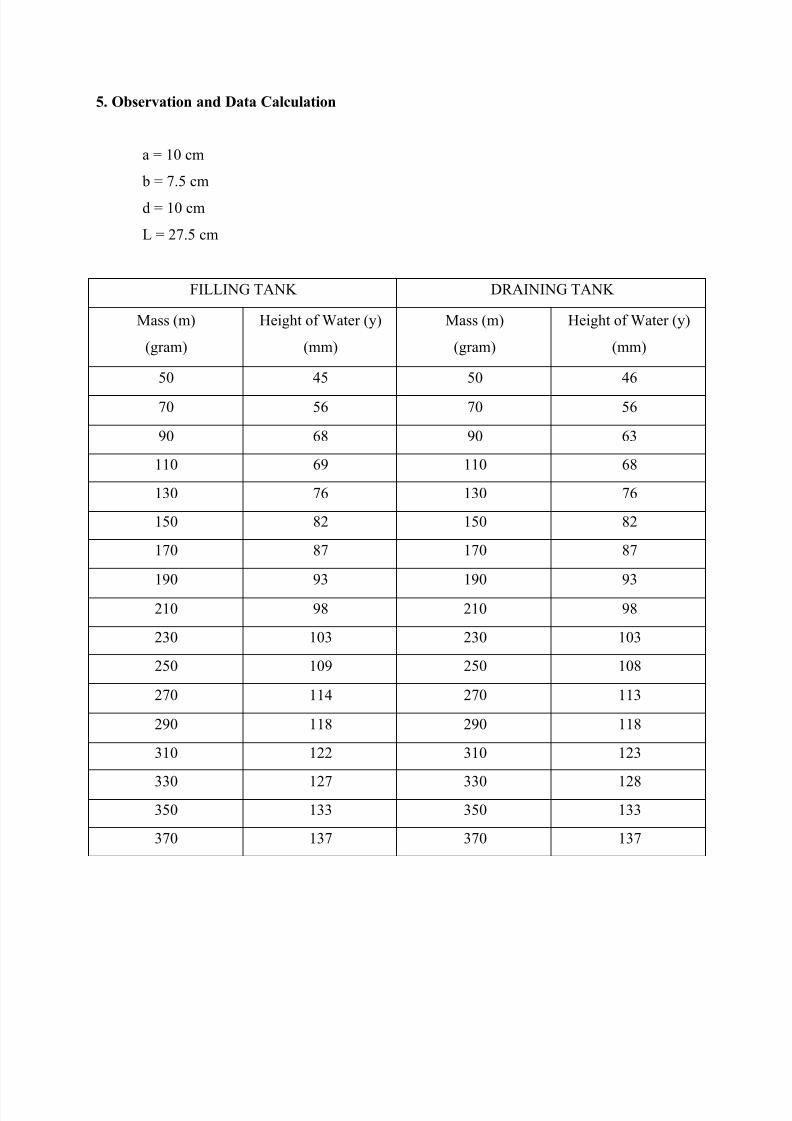
5. Observation and Data Calculation
a = 10 cm
b = 7.5 cm
d = 10 cm
L = 27.5 cm
FILLING TANK DRAINING TANK
Mass (m)
(gram)
Height of Water (y)
(mm)
Mass (m)
(gram)
Height of Water (y)
(mm)
50 45 50 46
70 56 70 56
90 68 90 63
110 69 110 68
130 76 130 76
150 82 150 82
170 87 170 87
190 93 190 93
210 98 210 98
230 103 230 103
250 109 250 108
270 114 270 113
290 118 290 118
310 122 310 123
330 127 330 128350 133 350 133
370 137 370 137
8/10/2019 Laporan Mekanika Fluida H-02
http://slidepdf.com/reader/full/laporan-mekanika-fluida-h-02 7/19
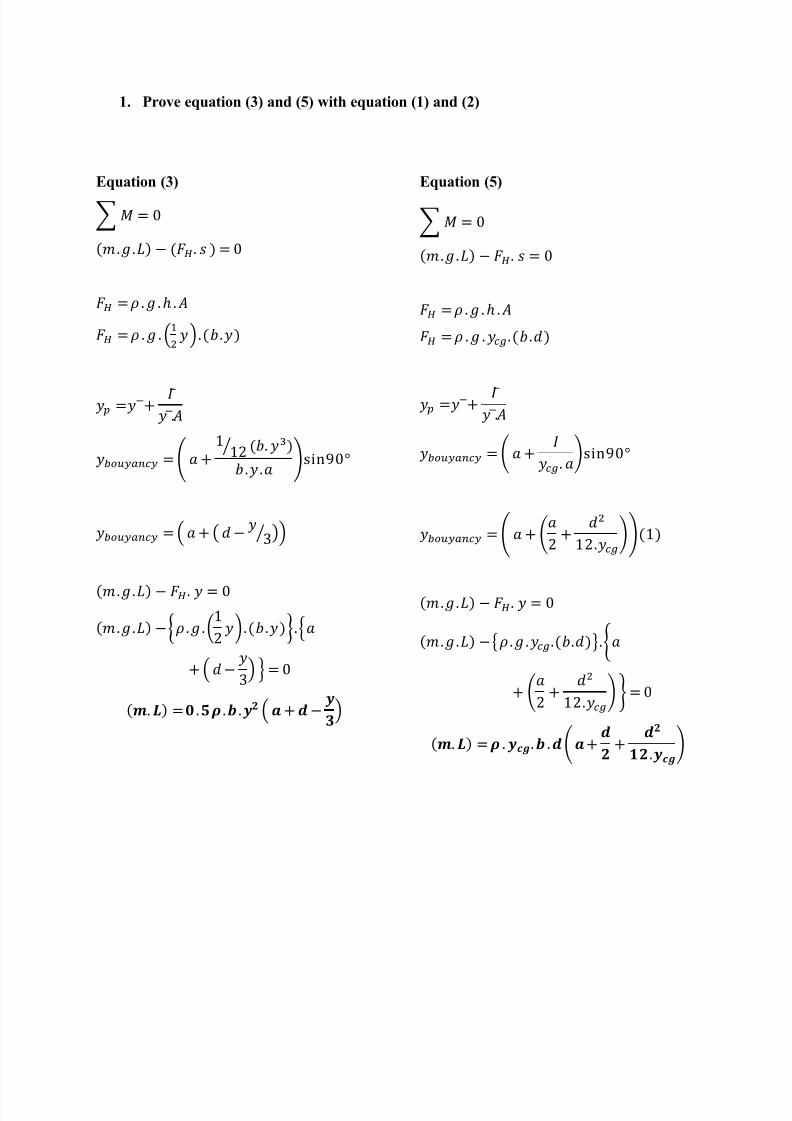
1. Prove equation (3) and (5) with equation (1) and (2)
Equation (3)
∑
̅ ⁄
(⁄ )
,-
Equation (5)
∑
̅ . /
./
{ }. /
. /
8/10/2019 Laporan Mekanika Fluida H-02
http://slidepdf.com/reader/full/laporan-mekanika-fluida-h-02 8/19
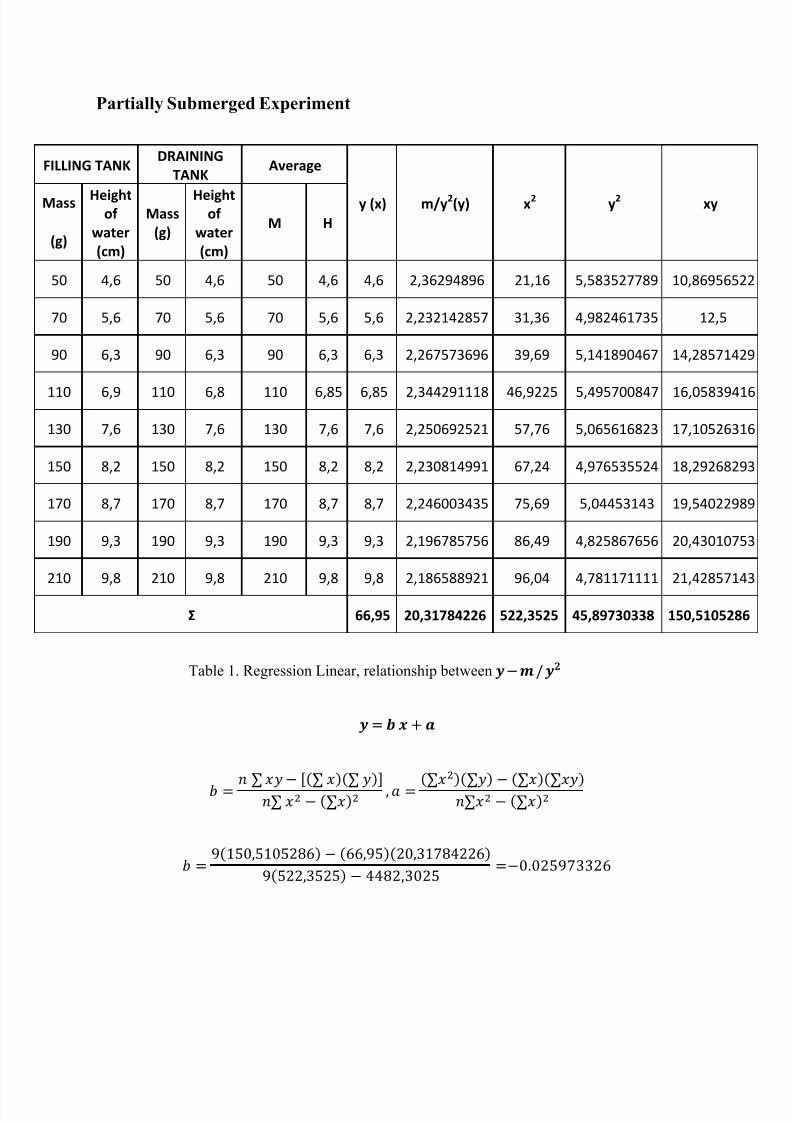
Partially Submerged Experiment
Table 1. Regression Linear, relationship between
FILLING TANKDRAINING
TANKAverage
y (x) m/y 2(y) x2 y2 xyMass Heightof
water(cm)
Mass(g)
Heightof
water(cm)
M H(g)
50 4,6 50 4,6 50 4,6 4,6 2,36294896 21,16 5,583527789 10,86956522
70 5,6 70 5,6 70 5,6 5,6 2,232142857 31,36 4,982461735 12,5
90 6,3 90 6,3 90 6,3 6,3 2,267573696 39,69 5,141890467 14,28571429
110 6,9 110 6,8 110 6,85 6,85 2,344291118 46,9225 5,495700847 16,05839416
130 7,6 130 7,6 130 7,6 7,6 2,250692521 57,76 5,065616823 17,10526316
150 8,2 150 8,2 150 8,2 8,2 2,230814991 67,24 4,976535524 18,29268293
170 8,7 170 8,7 170 8,7 8,7 2,246003435 75,69 5,04453143 19,54022989
190 9,3 190 9,3 190 9,3 9,3 2,196785756 86,49 4,825867656 20,43010753
210 9,8 210 9,8 210 9,8 9,8 2,186588921 96,04 4,781171111 21,42857143
Σ 66,95 20,31784226 522,3525 45,89730338 150,5105286
8/10/2019 Laporan Mekanika Fluida H-02
http://slidepdf.com/reader/full/laporan-mekanika-fluida-h-02 9/19
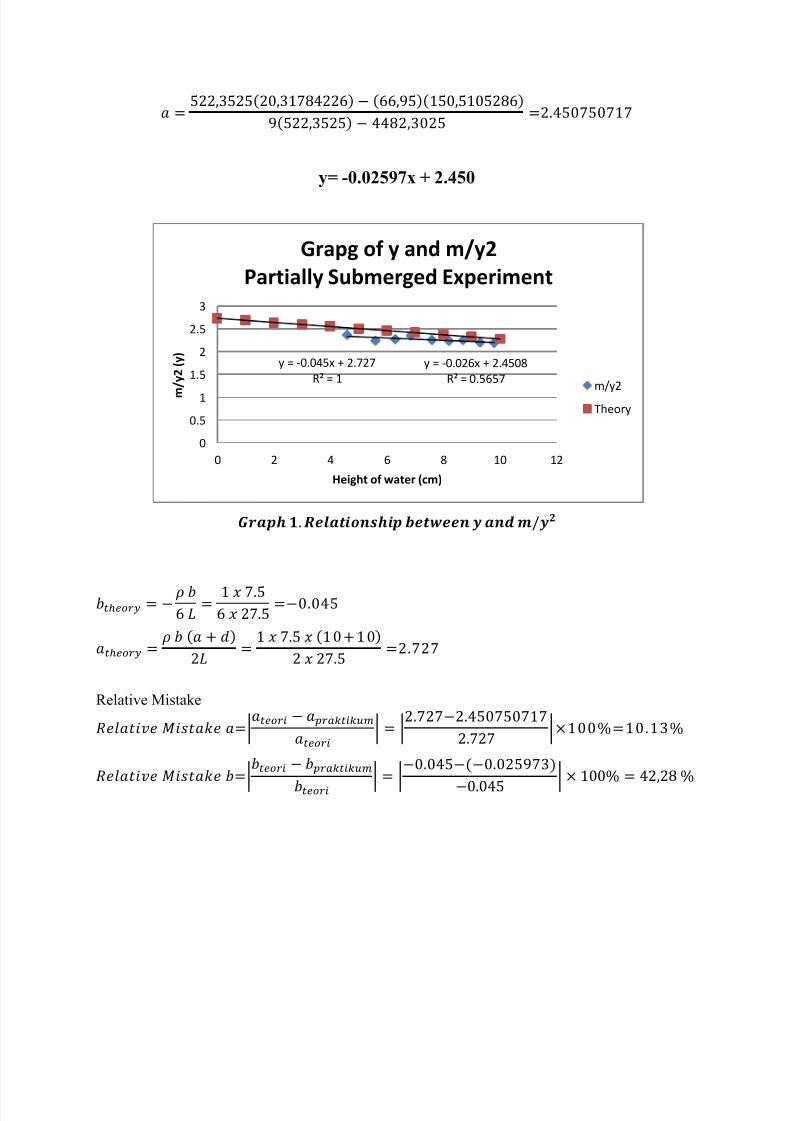
y= -0.02597x + 2.450
Relative Mistake
|| | |
|| | |
y = -0.026x + 2.4508R² = 0.5657
y = -0.045x + 2.727R² = 1
0
0.5
1
1.5
2
2.5
3
0 2 4 6 8 10 12
m / y 2 ( y )
Height of water (cm)
Grapg of y and m/y2Partially Submerged Experiment
m/y2
Theory
8/10/2019 Laporan Mekanika Fluida H-02
http://slidepdf.com/reader/full/laporan-mekanika-fluida-h-02 10/19
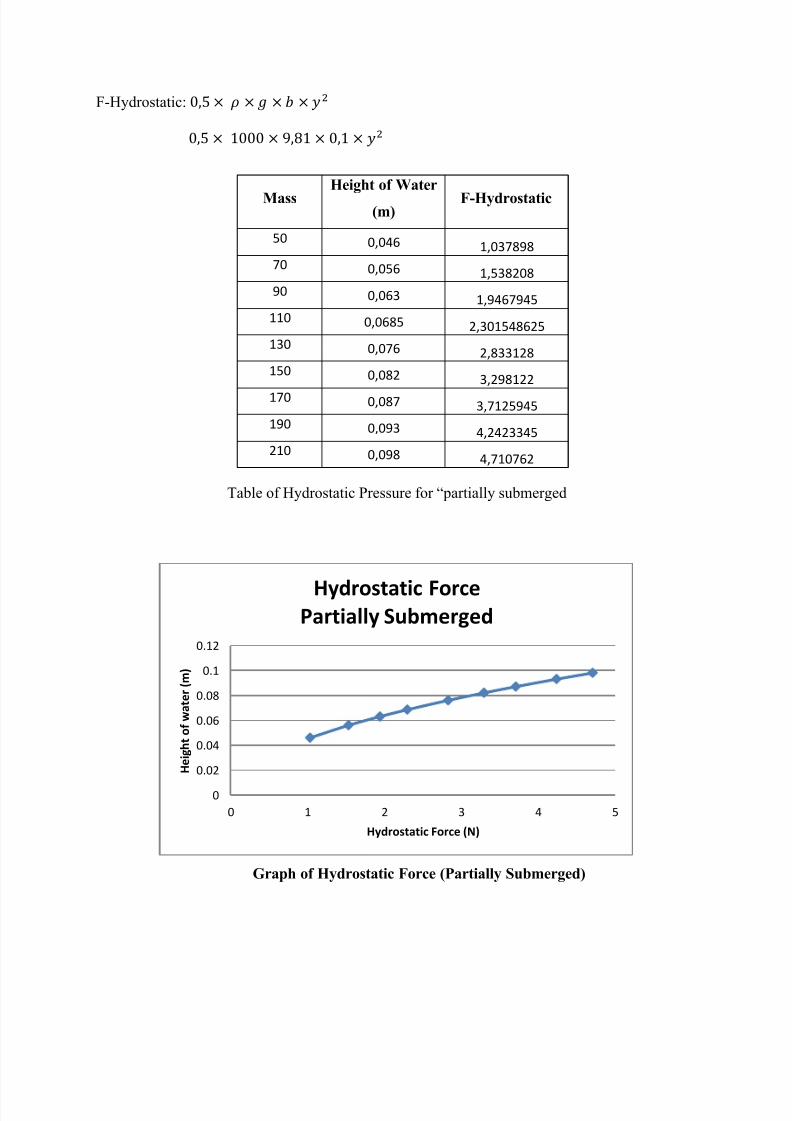
F-Hydrostatic:
Table of Hydrostatic Pressure for “partially submerged
Graph of Hydrostatic Force (Partially Submerged)
0
0.02
0.04
0.06
0.08
0.1
0.12
0 1 2 3 4 5
H e i g h t o
f w a t e r
( m )
Hydrostatic Force (N)
Hydrostatic ForcePartially Submerged
MassHeight of Water
(m)F-Hydrostatic
50 0,046 1,03789870 0,056 1,53820890 0,063 1,9467945
110 0,0685 2,301548625130 0,076 2,833128150 0,082 3,298122170 0,087 3,7125945190 0,093 4,2423345210 0,098 4,710762
8/10/2019 Laporan Mekanika Fluida H-02
http://slidepdf.com/reader/full/laporan-mekanika-fluida-h-02 11/19
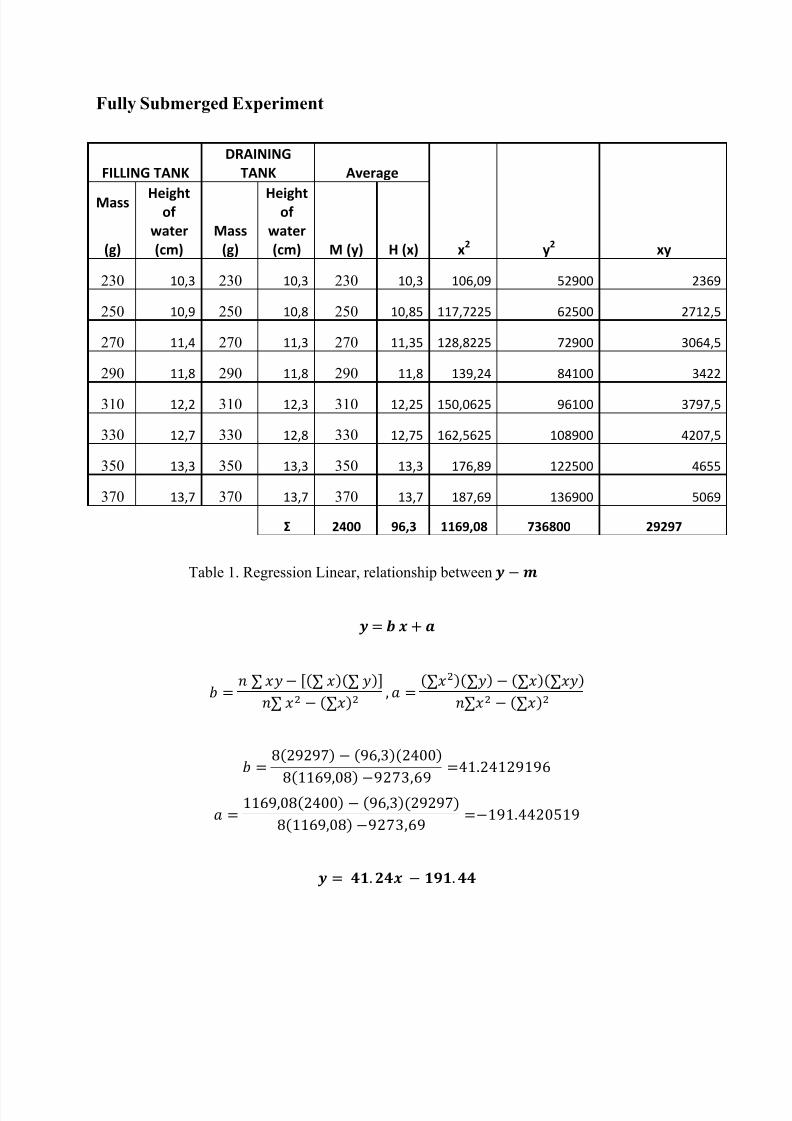
Fully Submerged Experiment
Table 1. Regression Linear, relationship between
FILLING TANKDRAINING
TANK Average
x2 y2 xy
Mass Heightof
water(cm)
Mass(g)
Heightof
water(cm) M (y) H (x)(g)
230 10,3 230 10,3 230 10,3 106,09 52900 2369
250 10,9 250 10,8 250 10,85 117,7225 62500 2712,5
270 11,4 270 11,3 270 11,35 128,8225 72900 3064,5
290 11,8 290 11,8 290 11,8 139,24 84100 3422
310 12,2 310 12,3 310 12,25 150,0625 96100 3797,5
330 12,7 330 12,8 330 12,75 162,5625 108900 4207,5
350 13,3 350 13,3 350 13,3 176,89 122500 4655
370 13,7 370 13,7 370 13,7 187,69 136900 5069
Σ 2400 96,3 1169,08 736800 29297
8/10/2019 Laporan Mekanika Fluida H-02
http://slidepdf.com/reader/full/laporan-mekanika-fluida-h-02 12/19
*+ *+
Relative Mistake || | |
|| | |
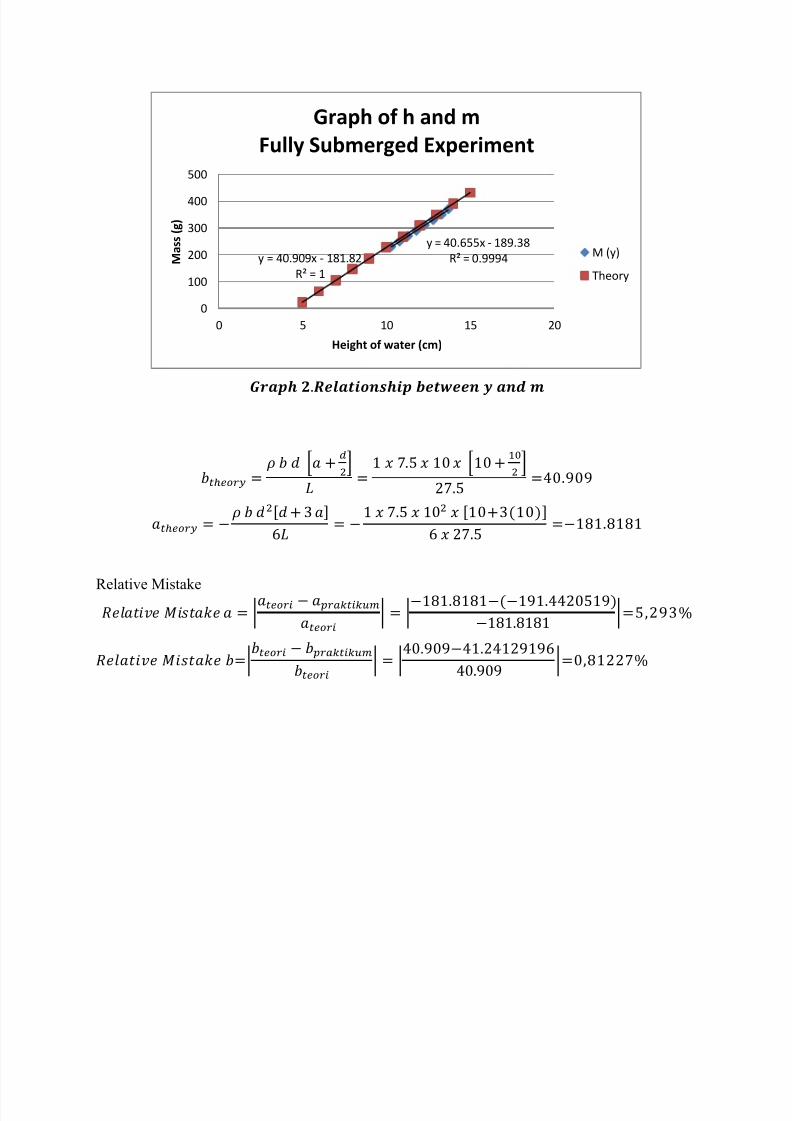
y = 40.655x - 189.38R² = 0.9994y = 40.909x - 181.82
R² = 1
0
100
200
300
400
500
0 5 10 15 20
M a s s
( g )
Height of water (cm)
Graph of h and mFully Submerged Experiment
M (y)
Theory
8/10/2019 Laporan Mekanika Fluida H-02
http://slidepdf.com/reader/full/laporan-mekanika-fluida-h-02 13/19
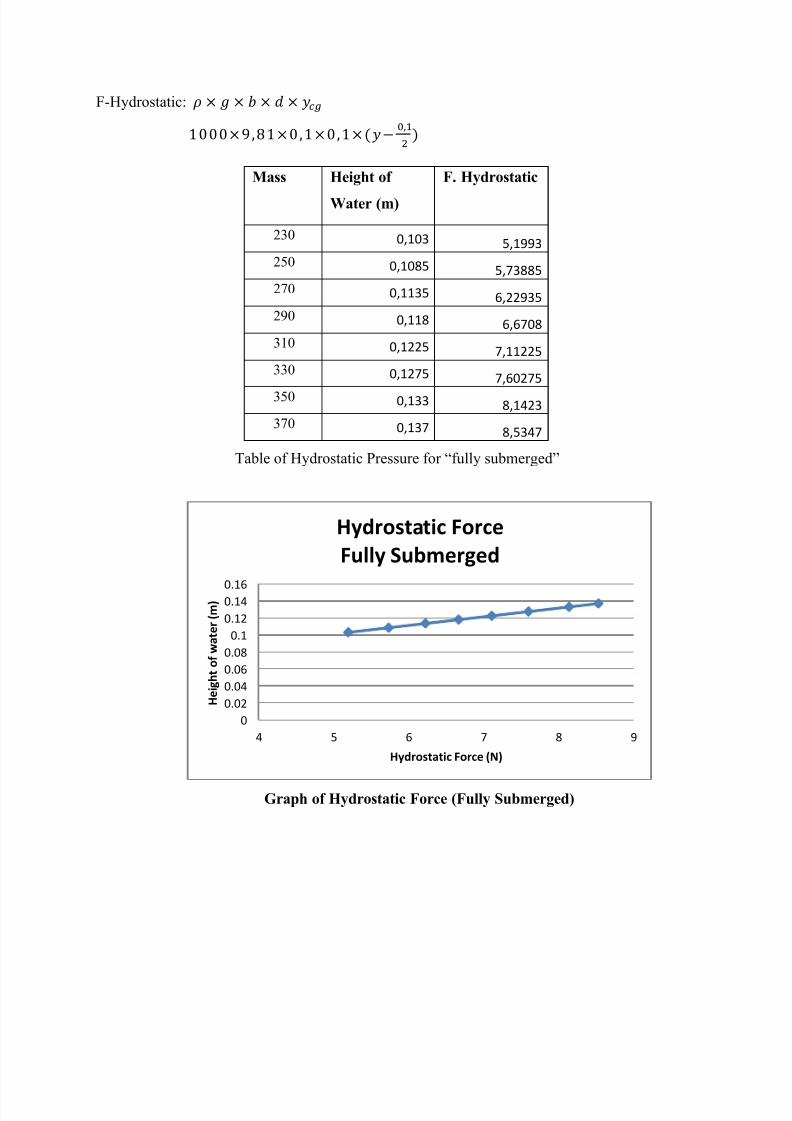
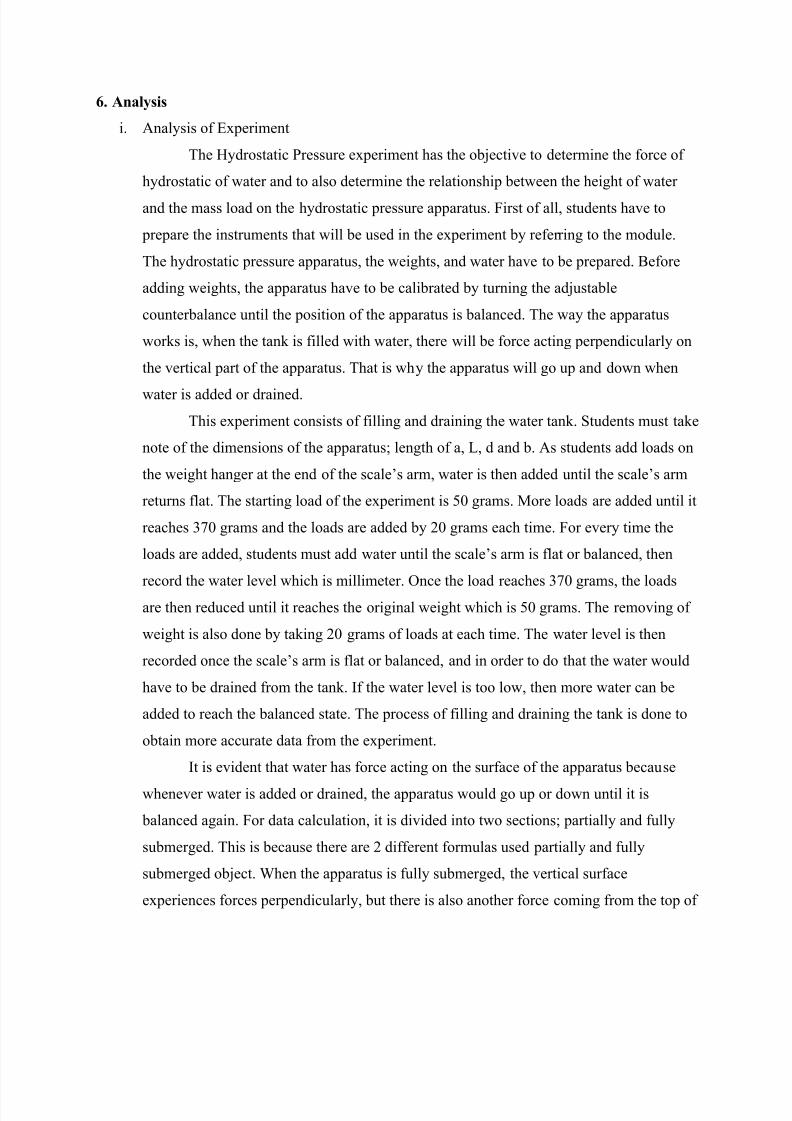
F-Hydrostatic:
Table of Hydrostatic Pressure for “fully submerged”
Graph of Hydrostatic Force (Fully Submerged)
00.020.040.060.08
0.10.120.140.16
4 5 6 7 8 9
H e i g h t o
f w a t e r
( m )
Hydrostatic Force (N)
Hydrostatic ForceFully Submerged
Mass Height of
Water (m)
F. Hydrostatic
230 0,103 5,1993250 0,1085 5,73885270 0,1135 6,22935290 0,118 6,6708310 0,1225 7,11225330 0,1275 7,60275350 0,133 8,1423370 0,137 8,5347
8/10/2019 Laporan Mekanika Fluida H-02
http://slidepdf.com/reader/full/laporan-mekanika-fluida-h-02 14/19
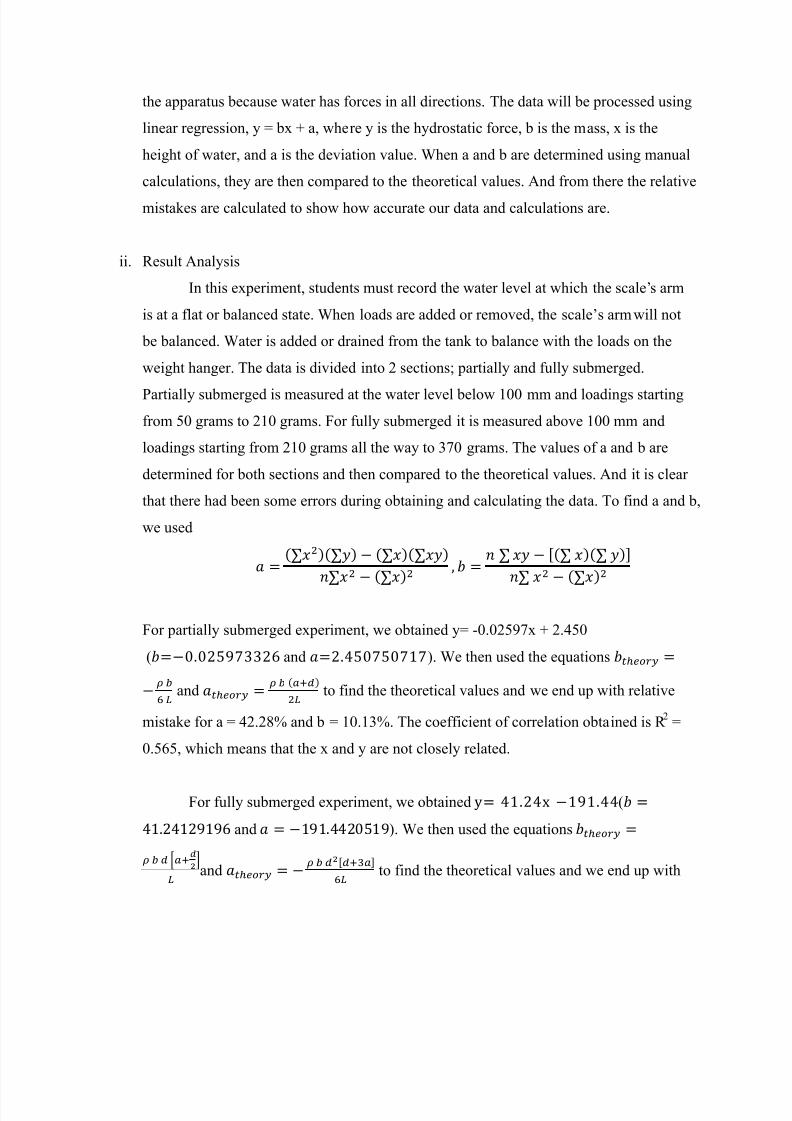
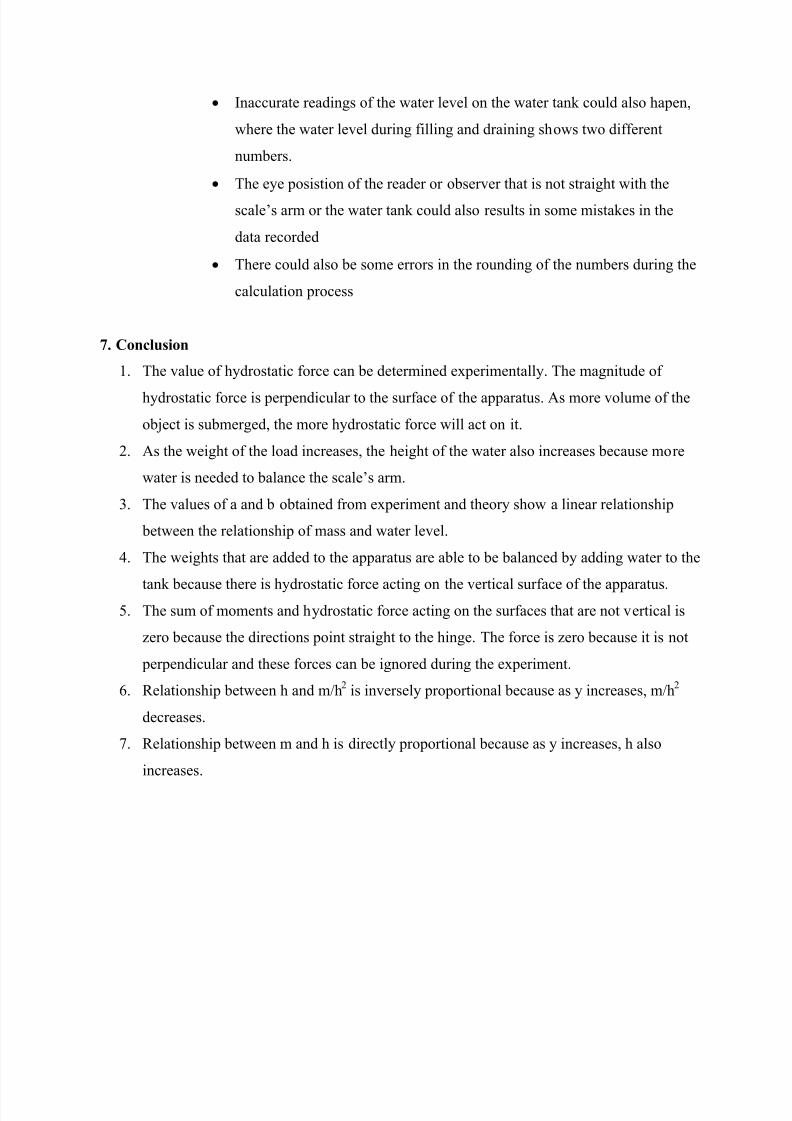
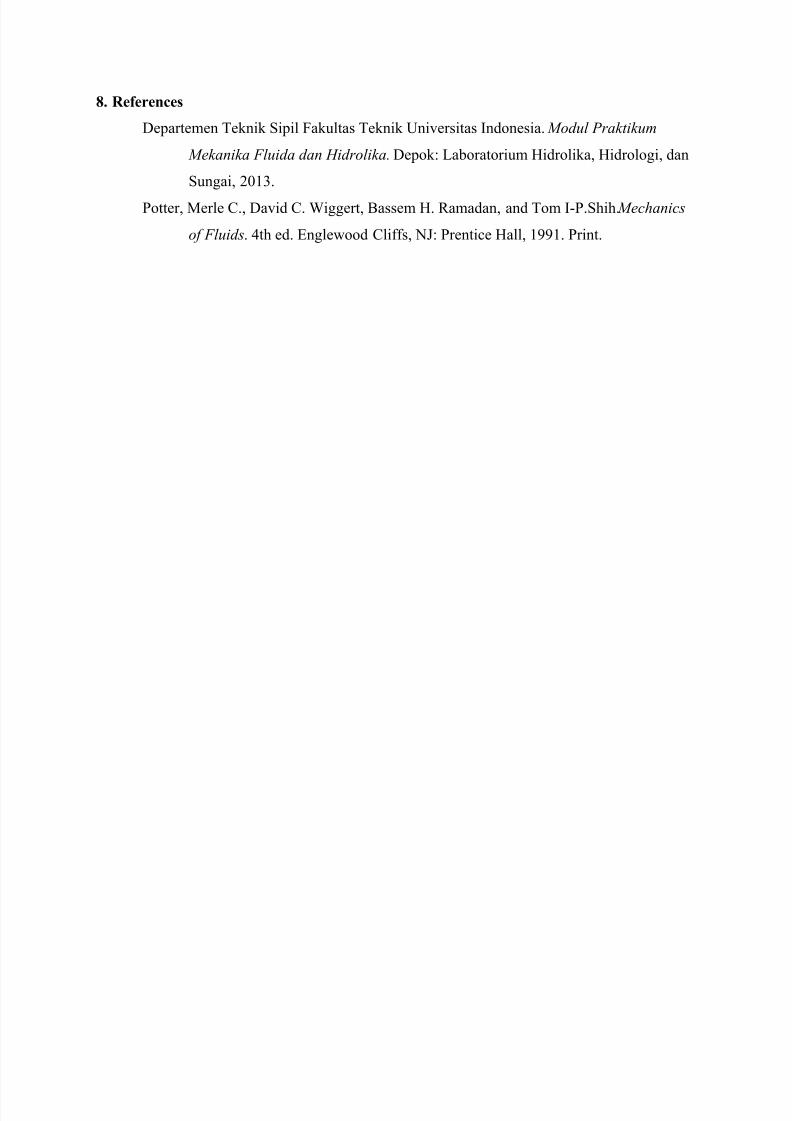
6. Analysis
i. Analysis of Experiment
The Hydrostatic Pressure experiment has the objective to determine the force of
hydrostatic of water and to also determine the relationship between the height of water
and the mass load on the hydrostatic pressure apparatus. First of all, students have to
prepare the instruments that will be used in the experiment by referring to the module.
The hydrostatic pressure apparatus, the weights, and water have to be prepared. Before
adding weights, the apparatus have to be calibrated by turning the adjustable
counterbalance until the position of the apparatus is balanced. The way the apparatus
works is, when the tank is filled with water, there will be force acting perpendicularly on
the vertical part of the apparatus. That is why the apparatus will go up and down when
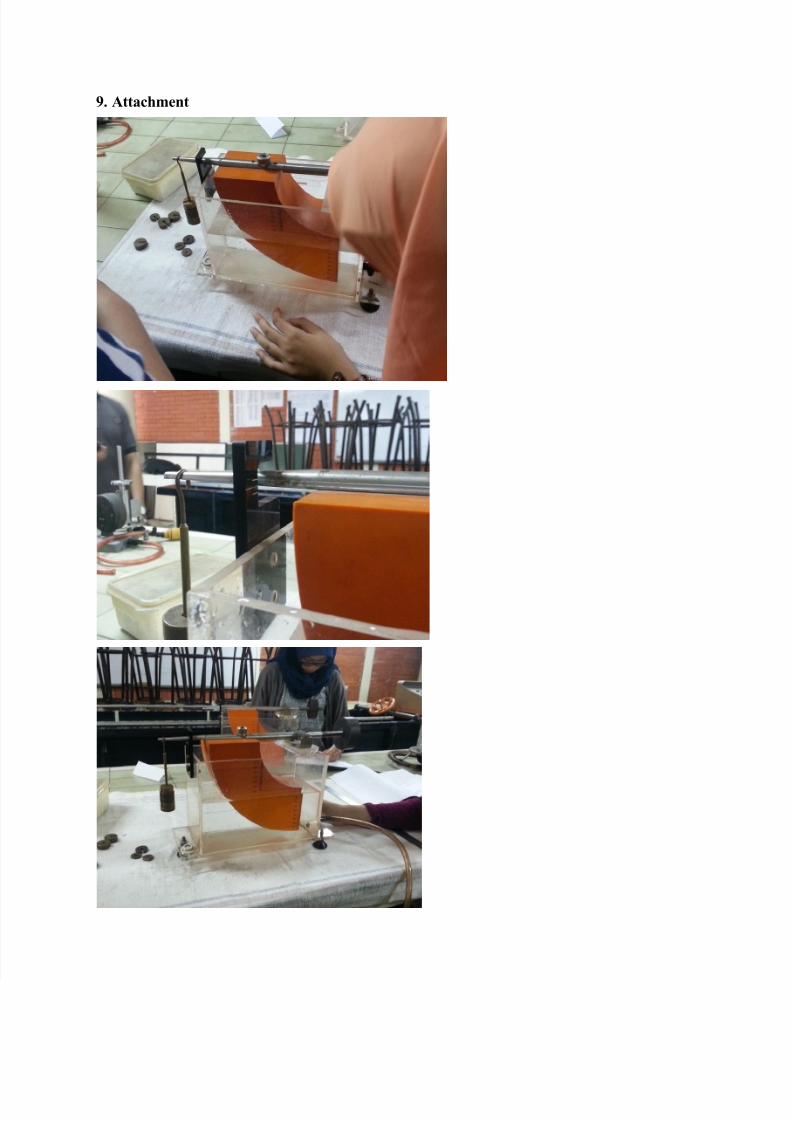
water is added or drained.This experiment consists of filling and draining the water tank. Students must take
note of the dimensions of the apparatus; length of a, L, d and b. As students add loads on
the weight hanger at the end of the scale’s arm, water is then added until the scale’s arm
returns flat. The starting load of the experiment is 50 grams. More loads are added until it
reaches 370 grams and the loads are added by 20 grams each time. For every time the
loads are added, students must add water until the scale’s arm is flat or balanced, then
record the water level which is millimeter. Once the load reaches 370 grams, the loads
are then reduced until it reaches the original weight which is 50 grams. The removing of
weight is also done by taking 20 grams of loads at each time. The water level is then
recorded once the scale’s arm is flat or balanced, and in order to do that the water would
have to be drained from the tank. If the water level is too low, then more water can be
added to reach the balanced state. The process of filling and draining the tank is done to
obtain more accurate data from the experiment.
It is evident that water has force acting on the surface of the apparatus because
whenever water is added or drained, the apparatus would go up or down until it is
balanced again. For data calculation, it is divided into two sections; partially and fully
submerged. This is because there are 2 different formulas used partially and fully
submerged object. When the apparatus is fully submerged, the vertical surface
experiences forces perpendicularly, but there is also another force coming from the top of
8/10/2019 Laporan Mekanika Fluida H-02
http://slidepdf.com/reader/full/laporan-mekanika-fluida-h-02 15/19
the apparatus because water has forces in all directions. The data will be processed using
linear regression, y = bx + a, where y is the hydrostatic force, b is the mass, x is the
height of water, and a is the deviation value. When a and b are determined using manual
calculations, they are then compared to the theoretical values. And from there the relative
mistakes are calculated to show how accurate our data and calculations are.
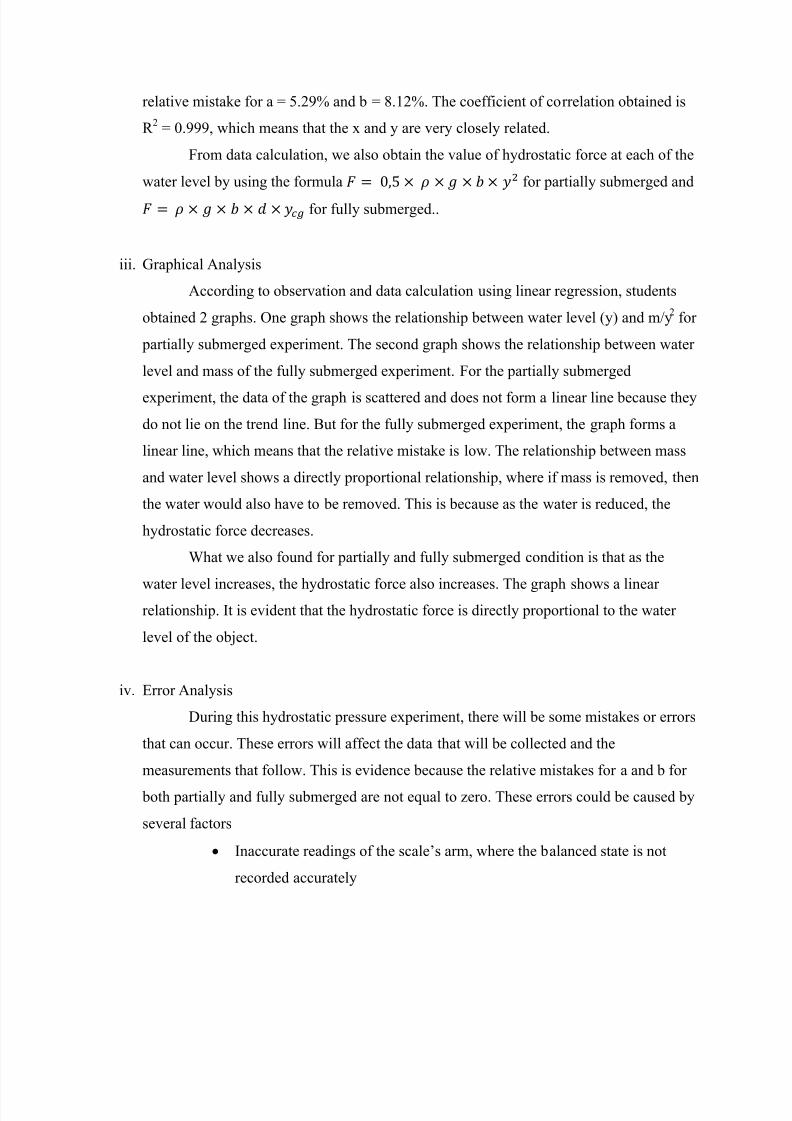
ii. Result Analysis
In this experiment, students must record the water level at which the scale’ s arm
is at a flat or balanced state. When loads are added or removed, the scale’s arm will not
be balanced. Water is added or drained from the tank to balance with the loads on the
weight hanger. The data is divided into 2 sections; partially and fully submerged.
Partially submerged is measured at the water level below 100 mm and loadings startingfrom 50 grams to 210 grams. For fully submerged it is measured above 100 mm and
loadings starting from 210 grams all the way to 370 grams. The values of a and b are
determined for both sections and then compared to the theoretical values. And it is clear
that there had been some errors during obtaining and calculating the data. To find a and b,
we used
For partially submerged experiment, we obtained y= -0.02597x + 2.450
( and ). We then used the equations
and to find the theoretical values and we end up with relative
mistake for a = 42.28% and b = 10.13%. The coefficient of correlation obtained is R 2 =
0.565, which means that the x and y are not closely related.
For fully submerged experiment, we obtained (
and ). We then used the equations
*+and to find the theoretical values and we end up with
8/10/2019 Laporan Mekanika Fluida H-02
http://slidepdf.com/reader/full/laporan-mekanika-fluida-h-02 16/19
relative mistake for a = 5.29% and b = 8.12%. The coefficient of correlation obtained is
R 2 = 0.999, which means that the x and y are very closely related.
From data calculation, we also obtain the value of hydrostatic force at each of the
water level by using the formula
for partially submerged and
for fully submerged..
iii. Graphical Analysis
According to observation and data calculation using linear regression, students
obtained 2 graphs. One graph shows the relationship between water level (y) and m/y 2 for
partially submerged experiment. The second graph shows the relationship between water
level and mass of the fully submerged experiment. For the partially submerged
experiment, the data of the graph is scattered and does not form a linear line because they
do not lie on the trend line. But for the fully submerged experiment, the graph forms a
linear line, which means that the relative mistake is low. The relationship between mass
and water level shows a directly proportional relationship, where if mass is removed, then
the water would also have to be removed. This is because as the water is reduced, the
hydrostatic force decreases.
What we also found for partially and fully submerged condition is that as the
water level increases, the hydrostatic force also increases. The graph shows a linearrelationship. It is evident that the hydrostatic force is directly proportional to the water
level of the object.
iv. Error Analysis
During this hydrostatic pressure experiment, there will be some mistakes or errors
that can occur. These errors will affect the data that will be collected and the
measurements that follow. This is evidence because the relative mistakes for a and b for
both partially and fully submerged are not equal to zero. These errors could be caused by
several factors
Inaccurate readings of the scale’s arm, where the balanced state is not
recorded accurately
8/10/2019 Laporan Mekanika Fluida H-02
http://slidepdf.com/reader/full/laporan-mekanika-fluida-h-02 17/19
Inaccurate readings of the water level on the water tank could also hapen,
where the water level during filling and draining shows two different
numbers.
The eye posistion of the reader or observer that is not straight with the
scale’s arm or the water tank could also results in some mistakes in the
data recorded
There could also be some errors in the rounding of the numbers during the
calculation process
7. Conclusion
1. The value of hydrostatic force can be determined experimentally. The magnitude of
hydrostatic force is perpendicular to the surface of the apparatus. As more volume of the
object is submerged, the more hydrostatic force will act on it.
2. As the weight of the load increases, the height of the water also increases because more
water is needed to balance the scale’s arm.
3. The values of a and b obtained from experiment and theory show a linear relationship
between the relationship of mass and water level.
4. The weights that are added to the apparatus are able to be balanced by adding water to the
tank because there is hydrostatic force acting on the vertical surface of the apparatus.5. The sum of moments and hydrostatic force acting on the surfaces that are not vertical is
zero because the directions point straight to the hinge. The force is zero because it is not
perpendicular and these forces can be ignored during the experiment.
6. Relationship between h and m/h 2 is inversely proportional because as y increases, m/h 2
decreases.
7. Relationship between m and h is directly proportional because as y increases, h also
increases.
8/10/2019 Laporan Mekanika Fluida H-02
http://slidepdf.com/reader/full/laporan-mekanika-fluida-h-02 18/19
8. References
Departemen Teknik Sipil Fakultas Teknik Universitas Indonesia. Modul Praktikum
Mekanika Fluida dan Hidrolika. Depok: Laboratorium Hidrolika, Hidrologi, dan
Sungai, 2013.
Potter, Merle C., David C. Wiggert, Bassem H. Ramadan, and Tom I-P.Shih. Mechanics
of Fluids . 4th ed. Englewood Cliffs, NJ: Prentice Hall, 1991. Print.
8/10/2019 Laporan Mekanika Fluida H-02
http://slidepdf.com/reader/full/laporan-mekanika-fluida-h-02 19/19
Recommended