LABOUR MARKET PROFILE
2016 Tanzania and Zanzibar
LO/FTF Council’s Analytical Unit
Copenhagen, Denmark
Danish Trade Council for International Development and Cooperation
Labour Market Profile 2016
Tanzania & Zanzibar 2016 Page ii
PREFACE
The LO/FTF Council is the Danish trade union council for
international development co-operation. It was
established, under a slightly different name, in 1987 by
the two largest Danish confederations, the Danish
Federation of Trade Unions (LO) and the Danish
Confederation of Salaried Employees and Civil
Servants (FTF). The organization activities are related
to: i) to support democratic development of the trade
union movements in Africa, Middle East, Asia and Latin
America; and ii) to contribute to democratic
development in the societies in which the unions operate.
The LO/FTF Council presents this Labour Market Profile
as a yearly updated report that provides an overview
of the labour market's situation.
This country profile presents the recent main
developments and is not an in-depth analysis.
Nevertheless, it shows a wide range of data in a
reader-friendly style. Certain key findings of this report
can be found on the Executive Summary.
The report is divided in 11 thematic sections, which
includes trade unions, employers’ organizations,
tripartite structures, national labour legislation,
violations of trade union rights, working conditions,
situation of the workforce (with subsections such as
unemployment, sectoral employment, migration,
informal economy, child labour, gender, and youth),
education (with subsection vocational training), social
protection, general economic performance, and trade.
Additionally, the reader finds an Appendix with a list
of the ratified ILO Conventions and an updated status
of trade unions in Tanzania in terms of members and
CBAs.
As indicated, the report is driven by statistical data
selection from international databanks, surveys and
reports (e.g. the International Labour Organization
(ILO), the International Trade Union Confederation
(ITUC), the World Bank, the U.S. Department of State’s
Annual Country Reports on Human Rights Practices,
WageIndicator Foundation, the Africa Labour Research
& Educational Institute (ALREI), etc.) as well as national
statistical institutions and ministries, and others.
Moreover, narrative inputs are collected from
international news sources (e.g. The Economist, the British
Broadcasting Corporation (BBC), LabourStart, The
Guardian, etc.) together with local sources such as trade
unions centers, NGOs, national news, the LO/FTF
Council’s Sub-Regional Office, among others.
This report also collects references from several
indexes, e.g. the Global Rights Index, the Doing
Business Index, the Governance Indicators, and the
Human Development Index. The indexes’ methodologies
and the data quality can be followed by the sources
websites.
Most statistical data of trade union membership is
gathered through collaboration with trade centers and
research. Notwithstanding, the measurements of trend
of trade union membership, Collective Bargaining
Agreements (CBAs), women’s trade union membership
and occupational health and safety (OHS) committees
are a challenge. The used data of these
abovementioned indicators should be interpreted with
some reservations.
ACKNOWLEDGMENT This Labour Market Profile is prepared by the LO/FTF
Council’s Analytical Unit in Copenhagen with support
from our Sub-Region Office in Tanzania as well as the
Trade Unions Congress of Tanzania (TUCTA) and the
Zanzibar Trade Union Congress (ZATUC) in terms of
data collection of trade union membership.
All other labour market profiles of the countries where
LO/FTF Council operates are available at our website:
http://www.ulandssekretariatet.dk/content/landeanaly
ser
Should you have questions about the profiles you can
contact Kasper Andersen ([email protected]), Manager of
the Analytical Unit.
Cover Photo: Carsten Snejbjerg
Design and layout: Adriana Romero
Danish Trade Council for International Development and Cooperation
Labour Market Profile 2016
Tanzania and Zanzibar 2016 Page iii
Tanzania & Zanzibar Labour Market Profile
EXECUTIVE SUMMARY
he United Republic of Tanzania has experienced a
rapid economic growth during the last decade
followed by a steady increasing labour productivity.
The number of working poor has dropped fast; a
middle-class is on a rise and with an improving equality
in terms of the income distribution. The volatile inflation
in Tanzania has affected the real wages purchasing
power, though. In additiion, the country continues being
far below the sub-Saharan Africa average in terms of
the Gross Domestic Product (GDP) per capita in the
purchasing power parity (PPP). It remains complicated
doing business, especially trading across borders,
getting credit and paying taxes.
The government in Tanzania mainland implemented five
labour market related legislations in 2015 along with
one new act in Zanzaniar, but none in 2016. The
International Trade Union Confederation (ITUC) has
various observations with legislations that affect
negatively the labour markets environment. Two key
points are that the state has lack of resources to
implement the labour market regulations in practice in
the formal sector and indirectly not covering a vast
majority (85 percent) of the labour force that operate
in the informal economy. It has also been noted that
workers are confronting regular violations of trade
union rights.
The labour force employment rate fell during the last
decade, especially among the youth. More and more
people were instead inactive on the labour market.
Unemployment is not a critical issue in Tanzania, but is
more affected by skills mismatch between job
requirements and qualifications due to a high incidence
of under-education.
The employment in the agricultural sector has been
fallen significantly, entering into the service sector and
slightly also in the industry sector. This is reflected in a
considerable drop of own-account workers that instead
became contributing family workers or wage &
salaried workers. These changes have been illustrated
by an increasing GDP growth in the industry sector
while the agricultural sector has more or less been flat
and the service sector was dwindling. On the positive
side, the changes in the industry sector is a step towards
a more economic transformation On the negative side,
that latter sector is not offering enough new jobs and a
majority find their possibilities in the service sector with
a lower labour productivity.
Changes are also demonstrated by an internal
migration from rural to urban areas in the country. This
is driven by by the youth that is seeking for better jobs.
Also child labour remains very acute. Gender-based
discriminations in terms of wages and protections in
employment are present. The education system has
been hard affected by resource shortages during
recent years and the enrolment in schools on all levels
experienced drops. The membership of social protection
shemes have increased fast, but remain with very low
national coverages.
Tanzania mainland
The growth of trade union membership in Tanzania
mainland were on a fast increase on absolute terms
during the last decade. This influx has mainly been
related to a growing number of wage & salaried
workers. In recent years, the total membership’s
intensification has been stalled, though. Likewise the
coverage of collective bargaining agreements (CBAs)
also increased but lost its tempo. These negative
impacts have been related to financial constraints as
well as challenges in the education system, among
others.
Zanzibar
The trade union movement in Zanzibar had an influx of
new members due to an improved social dialogue with
the government and employers’ organizations as well
as creating possibilities of affiliated organized workers
from the informal economy. Despite these
improvements, organizational reforms in 2015 affected
hard the membership that fell by 11 percent in the
period from 2015 to 2016 (September). On the
positive side, social security schemes have opened up
for workers from the informal economy.
T
Danish Trade Council for International Development and Cooperation
Labour Market Profile 2016
Tanzania and Zanzibar 2016 Page iv
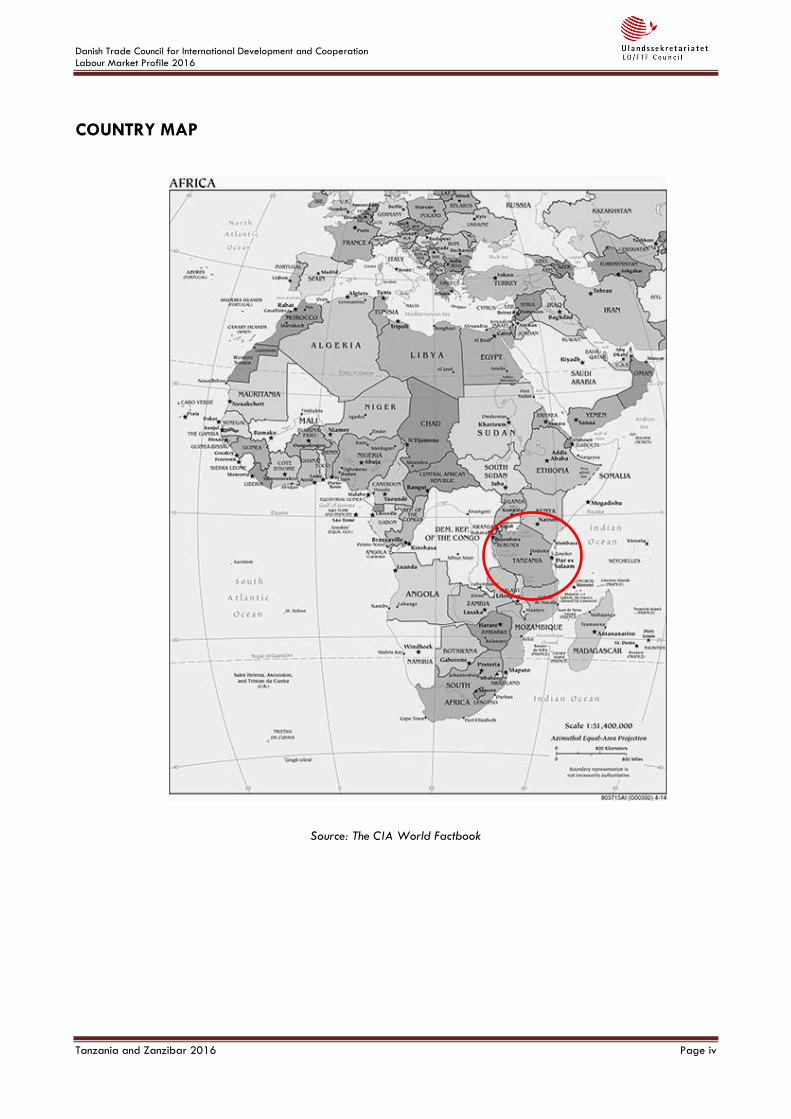
COUNTRY MAP
Source: The CIA World Factbook
Danish Trade Council for International Development and Cooperation
Labour Market Profile 2016
Tanzania and Zanzibar 2016 Page v
TABLE OF CONTENTS Preface ................................................................................................................................................................................................................ ii
Acknowledgment ................................................................................................................................................................................................ ii
Executive Summary ........................................................................................................................................................................................... iii
Country Map ......................................................................................................................................................................................................iv
Trade Unions .......................................................................................................................................................................................................1
Tanzania, mainland ............................................................................................................................................................................................................... 1
Zanzibar ................................................................................................................................................................................................................................. 2
Employers’ Organisations ..................................................................................................................................................................................3
Tanzania, mainland ............................................................................................................................................................................................................... 3
Zanzibar ................................................................................................................................................................................................................................. 4
Central Tripartite Structures ................................................................................................................................................................................4
Tanzania, mainland ............................................................................................................................................................................................................... 4
Zanzibar ................................................................................................................................................................................................................................. 6
National Labour Legislation ...............................................................................................................................................................................6
Tanzania, mainland ............................................................................................................................................................................................................... 7
Zanzibar ................................................................................................................................................................................................................................. 7
Observations on the labour legislation .............................................................................................................................................................................. 7
Ratified ILO Conventions ...................................................................................................................................................................................................... 8
TRADE UNION RIGHTS VIOLATIONS .................................................................................................................................................................8
Working Conditions ............................................................................................................................................................................................9
Workforce ......................................................................................................................................................................................................... 10
Unemployment ..................................................................................................................................................................................................................... 12
Sectoral Employment ........................................................................................................................................................................................................... 13
Migration .............................................................................................................................................................................................................................. 15
Informal Economy ................................................................................................................................................................................................................ 15
Child Labour ......................................................................................................................................................................................................................... 16
Gender .................................................................................................................................................................................................................................. 17
Youth...................................................................................................................................................................................................................................... 18
Education ......................................................................................................................................................................................................... 19
Vocational training .............................................................................................................................................................................................................. 20
Social Protection .............................................................................................................................................................................................. 20
Tanzania, mainland ............................................................................................................................................................................................................. 20
Zanzibar ............................................................................................................................................................................................................................... 22
Economic Performance .................................................................................................................................................................................... 22
Trade ................................................................................................................................................................................................................ 25
Trade Agreements ............................................................................................................................................................................................................... 25
Export Processing Zones (EPZ) ........................................................................................................................................................................................... 26
Appendix: Additional Data ............................................................................................................................................................................. 28
Status of Tanzania’s Ratified ILO Conventions ................................................................................................................................................................ 28
Status of Trade Unions in Tanzania, 2016 ...................................................................................................................................................................... 29
Trade Union Centre and affiliates in Zanzibar, 2016 ................................................................................................................................................... 30
References ........................................................................................................................................................................................................ 31
Danish Trade Council for International Development and Cooperation
Labour Market Profile 2016
Tanzania and Zanzibar 2016 Page vi
Tables Table 1: Status of trade unionism in Tanzania mainland, 2016 (est.).................................................................................................................................................. 1 Table 2: Paid employees with trade unions or employees associations, 2014 .................................................................................................................................. 1
Table 3: Status of trade unionism in Zanzibar, 2016 ............................................................................................................................................................................. 2 Table 4: Membership of Association of Tanzania Employers (ATE), 2008 ......................................................................................................................................... 3
Table 5: Number of cases in Tanzania Commission for Meditation and Arbitration, 2013-2015.................................................................................................. 4 Table 6: Status of Collective Bargaining Agreements (CBAs) in Tanzania, 2016 ............................................................................................................................. 5
Table 7: Status of Collective Bargaining Agreements in Zanzibar, 2016 .......................................................................................................................................... 6 Table 8: Status of the national labour, social security and human rights related legislations in Tanzania .................................................................................... 7
Table 9: Global Rights Index, Tanzania ranking, 2014-2016 ............................................................................................................................................................. 8 Table 10: Wages and earnings Monthly average and legal minimum wages .................................................................................................................................. 9
Table 11: Working Conditions in Tanzania ...........................................................................................................................................................................................10 Table 12: Employment-to-population ratio, Age and Sexes distribution, 2016 ..............................................................................................................................10
Table 13: Inactivity rate in Tanzania, 2016, % ....................................................................................................................................................................................11 Table 14: Skills mismatch between job requirements and qualifications in Tanzania, 2013 .........................................................................................................11
Table 15: Unemployment in Tanzania, 2016 ........................................................................................................................................................................................12 Table 16 : Employed persons and GDP share per sector, 2014 .......................................................................................................................................................13
Table 17: Key Migration Facts in Tanzania ...........................................................................................................................................................................................15 Table 18: Employment in the informal economy in Tanzania ..............................................................................................................................................................16 Table 19: Proportion of households with informal sector activities, 2001-2014 .............................................................................................................................16
Table 20: Working children Proportion of all children, age 5-17 years ..........................................................................................................................................17 Table 21 : Highest level of schooling attained ......................................................................................................................................................................................19
Table 22: Status of Vocational Training in Tanzania, 2013 ...............................................................................................................................................................20 Table 23: Public spending and coverage on social protection schemes in Tanzania, 2010, % ....................................................................................................21
Table 24: Pension Schemes: Benefits, Coverage and Contributions, 2010, % .................................................................................................................................21 Table 25: Key Economic Facts in Tanzania, 2015 ................................................................................................................................................................................22
Table 26: Ease of Doing Business in Tanzania .......................................................................................................................................................................................24 Table 27: Tanzania's Governance Indicators, 2009-2014 .................................................................................................................................................................24
Table 28: Trade and Foreign Direct Investment in Tanzania, 2015 ..................................................................................................................................................25 Table 29: Status of Tanzania’s Ratified ILO Conventions, 2016 ........................................................................................................................................................28
Table 30: Status of Trade Unions in Tanzania, 2016 ..........................................................................................................................................................................29 Table 31: Trade Union Centre and affiliates in Zanzibar, 2016 .......................................................................................................................................................30
Figures Figure 1: Trend of number of members in TUCTA and the trade union density, 2008-2016 .......................................................................................................... 1
Figure 2: TUCTA membership covered by Collective Bargaining Agreements (CBA), 2008-2016 ................................................................................................ 5 Figure 3: Minimum wage trend in Tanzania, 2000-2016 ...................................................................................................................................................................10
Figure 4: Labour force employment rate, 2007-2016, % ..................................................................................................................................................................11 Figure 5: Inactivity rate trend in Tanzania, 2007-2016, Sexes, % ...................................................................................................................................................11
Figure 6: Labour productivity, 2007-2016 ............................................................................................................................................................................................12 Figure 7: Unemployment rate trend in Tanzania and Eastern Africa, 2007-2016 .........................................................................................................................12
Figure 8: Employment by aggregate sector in Tanzania, 2001-2014 .............................................................................................................................................14 Figure 9: Sector Share in Tanzania, 2000-2015, % of GDP .............................................................................................................................................................14 Figure 10: Status of employment in Tanzania, % .................................................................................................................................................................................14
Figure 11 : Distribution of enterprises by size in Tanzania, 2011 .....................................................................................................................................................14 Figure 12: Employment in the informal economy ..................................................................................................................................................................................16
Figure 13: Labour force participation rate, sexes, % ..........................................................................................................................................................................17 Figure 14: Women in Management and Ownership, 2013 ................................................................................................................................................................18
Figure 15: Youth unemployment rate, 2007-2016, sexes, % .............................................................................................................................................................18 Figure 16: School Levels and Enrolment .................................................................................................................................................................................................19
Figure 17: Ratio of vocational student to all pupils in secondary education ....................................................................................................................................20 Figure 18: Total health-care expenditure not financed by private household's out-of-pocket payments ...................................................................................21
Figure 19: GDP per capita growth, 2006-2015, % ............................................................................................................................................................................22 Figure 20: GDP per capita (PPP) growth, Current US$; and Gini Index ..........................................................................................................................................23
Figure 21: Working poor, 2000-2012, % ............................................................................................................................................................................................23 Figure 22: Middle-class growth in Tanzania and the sub-Saharan Africa, 2000-2012 ................................................................................................................23
Figure 23: Inflation trend, 2006-2015, % .............................................................................................................................................................................................23 Figure 24: Gross Fixed Capital Formation, 2006-2015, % of GDP .................................................................................................................................................24
Figure 25: Export, Import and Foreign Direct Investment (FDI) trends ...............................................................................................................................................25 Figure 26: Tanzania's main products share of exports, 2014 ............................................................................................................................................................25
Figure 27: Tanzania's main export markets, 2015 ...............................................................................................................................................................................25 Figure 28: Number of Zone Developers and Operators since established of EPZA, 2006-2010 ................................................................................................26
Danish Trade Council for International Development and Cooperation
Labour Market Profile 2016
Tanzania and Zanzibar 2016 Page 1
TRADE UNIONS
Tanzania, mainland
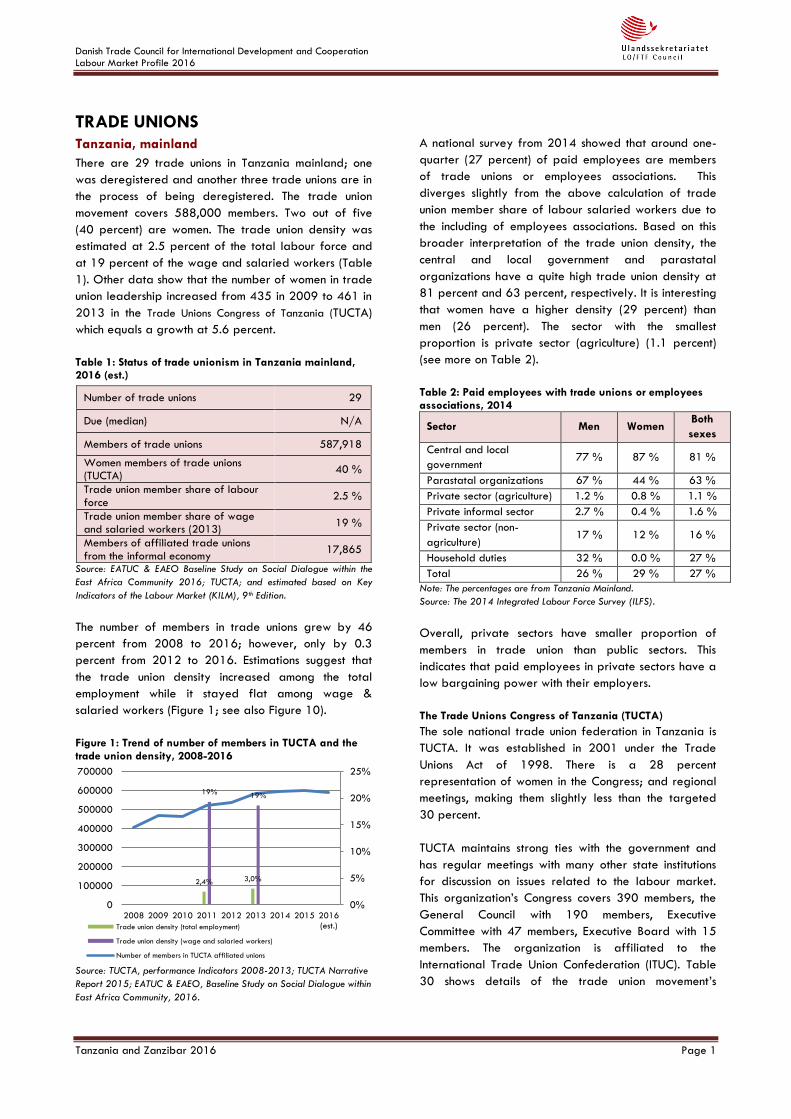
There are 29 trade unions in Tanzania mainland; one
was deregistered and another three trade unions are in
the process of being deregistered. The trade union
movement covers 588,000 members. Two out of five
(40 percent) are women. The trade union density was
estimated at 2.5 percent of the total labour force and
at 19 percent of the wage and salaried workers (Table
1). Other data show that the number of women in trade
union leadership increased from 435 in 2009 to 461 in
2013 in the Trade Unions Congress of Tanzania (TUCTA)
which equals a growth at 5.6 percent.
Table 1: Status of trade unionism in Tanzania mainland, 2016 (est.)
Number of trade unions 29
Due (median) N/A
Members of trade unions 587,918
Women members of trade unions (TUCTA)
40 %
Trade union member share of labour force
2.5 %
Trade union member share of wage and salaried workers (2013)
19 %
Members of affiliated trade unions from the informal economy
17,865
Source: EATUC & EAEO Baseline Study on Social Dialogue within the
East Africa Community 2016; TUCTA; and estimated based on Key
Indicators of the Labour Market (KILM), 9th Edition.
The number of members in trade unions grew by 46
percent from 2008 to 2016; however, only by 0.3
percent from 2012 to 2016. Estimations suggest that
the trade union density increased among the total
employment while it stayed flat among wage &
salaried workers (Figure 1; see also Figure 10).
Figure 1: Trend of number of members in TUCTA and the trade union density, 2008-2016
Source: TUCTA, performance Indicators 2008-2013; TUCTA Narrative
Report 2015; EATUC & EAEO, Baseline Study on Social Dialogue within
East Africa Community, 2016.
A national survey from 2014 showed that around one-
quarter (27 percent) of paid employees are members
of trade unions or employees associations. This
diverges slightly from the above calculation of trade
union member share of labour salaried workers due to
the including of employees associations. Based on this
broader interpretation of the trade union density, the
central and local government and parastatal
organizations have a quite high trade union density at
81 percent and 63 percent, respectively. It is interesting
that women have a higher density (29 percent) than
men (26 percent). The sector with the smallest
proportion is private sector (agriculture) (1.1 percent)
(see more on Table 2).
Table 2: Paid employees with trade unions or employees associations, 2014
Sector Men Women Both
sexes
Central and local
government 77 % 87 % 81 %
Parastatal organizations 67 % 44 % 63 %
Private sector (agriculture) 1.2 % 0.8 % 1.1 %
Private informal sector 2.7 % 0.4 % 1.6 %
Private sector (non-
agriculture) 17 % 12 % 16 %
Household duties 32 % 0.0 % 27 %
Total 26 % 29 % 27 %
Note: The percentages are from Tanzania Mainland.
Source: The 2014 Integrated Labour Force Survey (ILFS).
Overall, private sectors have smaller proportion of
members in trade union than public sectors. This
indicates that paid employees in private sectors have a
low bargaining power with their employers.
The Trade Unions Congress of Tanzania (TUCTA)
The sole national trade union federation in Tanzania is
TUCTA. It was established in 2001 under the Trade
Unions Act of 1998. There is a 28 percent
representation of women in the Congress; and regional
meetings, making them slightly less than the targeted
30 percent.
TUCTA maintains strong ties with the government and
has regular meetings with many other state institutions
for discussion on issues related to the labour market.
This organization’s Congress covers 390 members, the
General Council with 190 members, Executive
Committee with 47 members, Executive Board with 15
members. The organization is affiliated to the
International Trade Union Confederation (ITUC). Table
30 shows details of the trade union movement’s
2,4% 3,0%
19% 19%
0%
5%
10%
15%
20%
25%
0
100000
200000
300000
400000
500000
600000
700000
2008 2009 2010 2011 2012 2013 2014 2015 2016
(est.)Trade union density (total employment)
Trade union density (wage and salaried workers)
Number of members in TUCTA affiliated unions
Danish Trade Council for International Development and Cooperation
Labour Market Profile 2016
Tanzania and Zanzibar 2016 Page 2
membership, number of Collective Bargaining
Agreements, and number of Occupational Health and
Safety Committees at workplaces.
One third of TUCTA’s total membership is organized by
the Tanzania Teacher Union (TTU), which is one of the
strongest trade unions in Tanzania. TTU, together with
the trade unions for government workers (TUGHE) and
local government workers (TALGWU), represent more
than 50 percent of the total TUCTA membership (see
more on Appendix Table 30).
TUCTA has had regular consultations with the president
and officials as well as the employers’ association, the
Association of Tanzania Employers (ATE), on labour
issues. Meetings in tripartite institutions such as the
Institution Labour, Economic and Social Council (LESCO)
have been seldom, though (see also the section: Central
Tripartite Structures).
TUCTA conducted advocacy campaigns through
national media on topics like domestic workers, gender
labour rights and labour rights compliance, workman’s
compensation fund, informal economy contributions to
social security schemes, among others. TUCTA managed
to pressurize government to allow workers from the
informal economy to pay contributions to - and benefit
from - social security schemes. On the same token,
TUCTA has supported regional trainers’ network through
training of (master) trainers, researchers and regional
trade union representatives.
The TUCTA strategic plan 2012-2016 continues to
promote attention to strengthen the financial situation of
the organization. The management of the real estate
owned by the organization has been improved and a
business plan has been developed for the revamping of
the Mbeya Labour College. Furthermore, a membership
database is under development. Also a draft policy has
been developed on how TUCTA and affiliated unions
can engage and organize in the informal sector.
The organization is recognized as an institutional player
in the labour market. However, TUCTA is faced with
serious financial constraints due to lack of income from
fees from affiliated unions, real estates, and losing
external donor support, among others. TUCTA is
working on financial recovery plans. Internal conflicts
have also arisen because affiliated unions oppose
TUCTA’s constitutional right to direct check-off from the
source (5 percent of member fees paid to unions). In
addition, TUCTA hardly pay salaries to the secretariat,
and most activities have been donor funded. It is
equally important to note, that TUCTA faces challenges
and competition from new and fragmented unions.
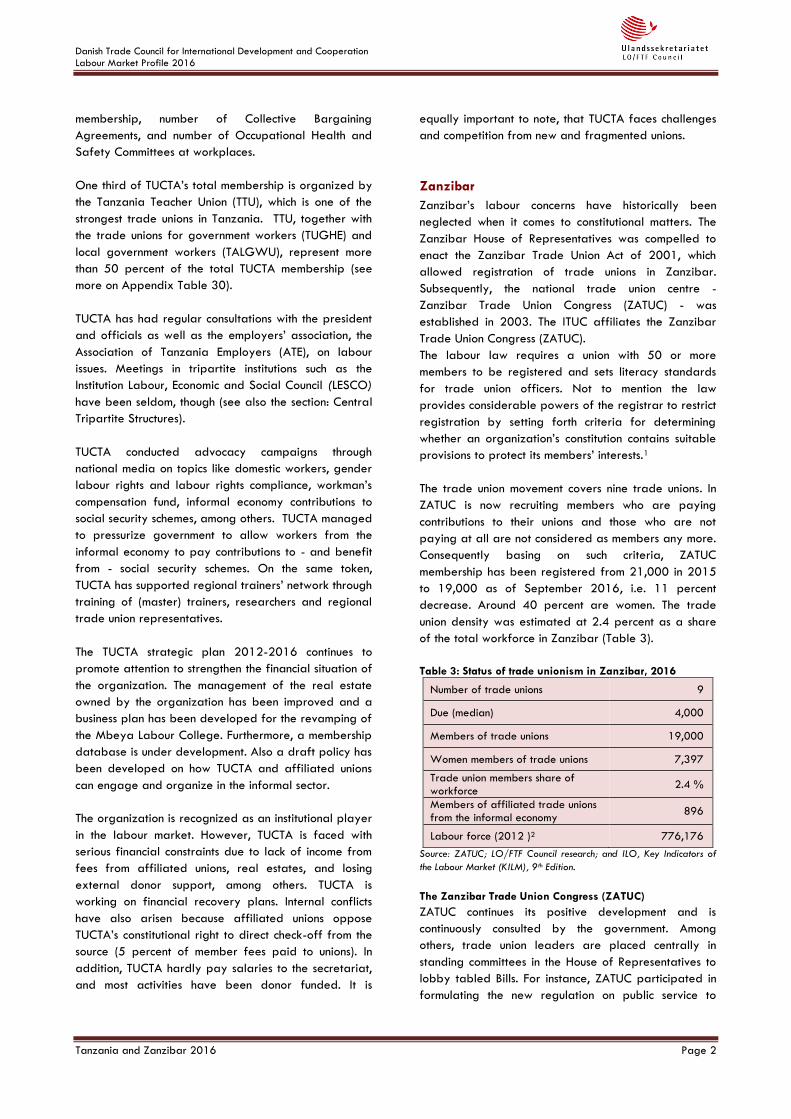
Zanzibar
Zanzibar’s labour concerns have historically been
neglected when it comes to constitutional matters. The
Zanzibar House of Representatives was compelled to
enact the Zanzibar Trade Union Act of 2001, which
allowed registration of trade unions in Zanzibar.
Subsequently, the national trade union centre -
Zanzibar Trade Union Congress (ZATUC) - was
established in 2003. The ITUC affiliates the Zanzibar
Trade Union Congress (ZATUC).
The labour law requires a union with 50 or more
members to be registered and sets literacy standards
for trade union officers. Not to mention the law
provides considerable powers of the registrar to restrict
registration by setting forth criteria for determining
whether an organization’s constitution contains suitable
provisions to protect its members’ interests.1
The trade union movement covers nine trade unions. In
ZATUC is now recruiting members who are paying
contributions to their unions and those who are not
paying at all are not considered as members any more.
Consequently basing on such criteria, ZATUC
membership has been registered from 21,000 in 2015
to 19,000 as of September 2016, i.e. 11 percent
decrease. Around 40 percent are women. The trade
union density was estimated at 2.4 percent as a share
of the total workforce in Zanzibar (Table 3).
Table 3: Status of trade unionism in Zanzibar, 2016
Number of trade unions 9
Due (median) 4,000
Members of trade unions 19,000
Women members of trade unions 7,397
Trade union members share of workforce
2.4 %
Members of affiliated trade unions from the informal economy
896
Labour force (2012 )2 776,176
Source: ZATUC; LO/FTF Council research; and ILO, Key Indicators of
the Labour Market (KILM), 9th Edition.
The Zanzibar Trade Union Congress (ZATUC)
ZATUC continues its positive development and is
continuously consulted by the government. Among
others, trade union leaders are placed centrally in
standing committees in the House of Representatives to
lobby tabled Bills. For instance, ZATUC participated in
formulating the new regulation on public service to
Danish Trade Council for International Development and Cooperation
Labour Market Profile 2016
Tanzania and Zanzibar 2016 Page 3
establish committee of negotiating machinery for public
sector employees.
The trade union movement in Zanzibar is under reforms.
Internally ZATUC is merging resources together to make
fewer and stronger unions. So far it has managed to
reduce the number of affiliates from eleven to nine. The
new Zanzibar Public Sector Workers Union (ZAPSWU)
is in place, while another merger process for private
sector unions has been initiated. It is without the
Zanzibar Teachers’ Union (ZATU). In addition, TUICO-Z
and ZAFICOWU are in last stages of merger. Should
this merger be completed, then ZATUC Affiliates will
further drop from current 9 to 7.
ZATUC continues to strengthening its working relations
with the Government of Zanzibar as well as employers’
organization. ZATUC presented a proposal for public
sector negotiation machinery to the Government and
succeeded having it established. ZATUC also played a
major role in the development of the Zanzibar Youth
Employment Action Plan and developed a strategic
plan and guidelines for combating HIV/AIDS in private
sector work places.
ZATUC Congress was held in December 2013. The
number of women leaders increased at national level
from 27 percent to 54 percent. ZATUC continued in
2015 of promoting young and women leaders in the
affiliated unions in line with its new policies on gender
and youth.
A new five year strategic plan and a work plan were
adopted, which is related on how to engage with
informal economy. So far 896 members from the
informal economy have been organized. In 2015
ZATUC set up a national union committee and informal
economy desk on informal economy to organize its
workers, and informal economy associations have been
trained on trade unionism and labour rights.
It is noteworthy to mention that the teachers union ZATU
has reached a membership rate of 52 percent of all
public teachers in Zanzibar and the largest affiliated
union in ZATUC. However, ZATU is facing a membership
saturation point, and has reached a deadlock in
collecting dues/payment arrears especially from
secondary teachers who are opposed to a flat rate of
2 percent direct check-off. In 2015 ZATU intensified its
membership service by disseminating newsletters,
training manuals and cluster visits to schools.
Regionally, ZATU is active in the federation for East
African Teachers’ Unions (FEATU) that recently gained
legal registration in Tanzania and is in the process to
finalize establishment of permanent office in Arusha
and receiving official observer status in the East Africa
Community (EAC) in line with the East African Trade
Union Confederation (EATUC) (only on issues pertaining
teachers’ rights and education matters).
Table 31 shows details of the trade union movement’s
membership, number of Collective Bargaining
Agreements, and number of Occupational Health and
Safety Committees at workplaces.
EMPLOYERS’ ORGANISATIONS
Tanzania, mainland
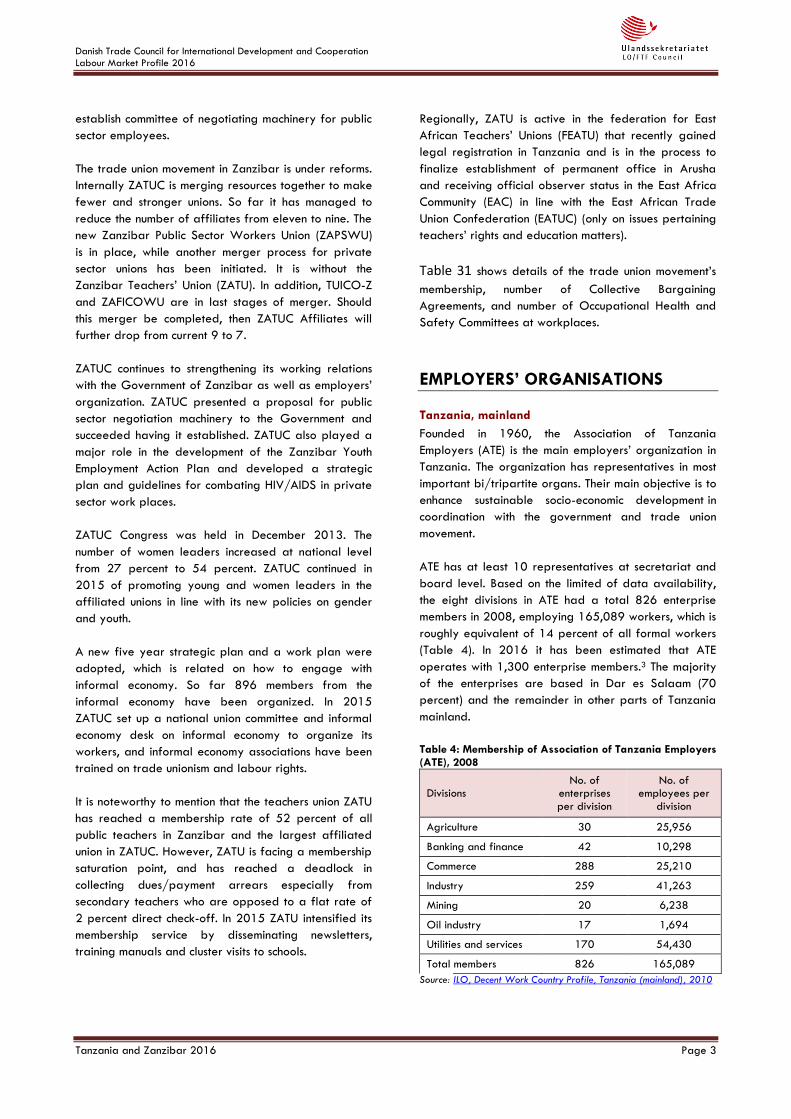
Founded in 1960, the Association of Tanzania
Employers (ATE) is the main employers’ organization in
Tanzania. The organization has representatives in most
important bi/tripartite organs. Their main objective is to
enhance sustainable socio-economic development in
coordination with the government and trade union
movement.
ATE has at least 10 representatives at secretariat and
board level. Based on the limited of data availability,
the eight divisions in ATE had a total 826 enterprise
members in 2008, employing 165,089 workers, which is
roughly equivalent of 14 percent of all formal workers
(Table 4). In 2016 it has been estimated that ATE
operates with 1,300 enterprise members.3 The majority
of the enterprises are based in Dar es Salaam (70
percent) and the remainder in other parts of Tanzania
mainland.
Table 4: Membership of Association of Tanzania Employers (ATE), 2008
Divisions No. of
enterprises per division
No. of employees per
division
Agriculture 30 25,956
Banking and finance 42 10,298
Commerce 288 25,210
Industry 259 41,263
Mining 20 6,238
Oil industry 17 1,694
Utilities and services 170 54,430
Total members 826 165,089
Source: ILO, Decent Work Country Profile, Tanzania (mainland), 2010
Danish Trade Council for International Development and Cooperation
Labour Market Profile 2016
Tanzania and Zanzibar 2016 Page 4
The organization provides advisory and representation
services to its members with industrial relations, legal,
management, among others. ATE is governed by an
annual general meeting and an executive council.
ATE is an active member of Tanzania Private Sector
Foundation (TPSF) and East African Business Council
(EABC). The organization is affiliated to the
International Organization of Employers (IOE) and it is
also a founder member of the Business Africa formerly
known as Pan African Employers Confederation (PEC).
ATE participates in ILO’s annual conference of which
Tanzania is a member and has one vote as an apex
employers’ association in Tanzania. Finally, ATE is
member of the East African Employers Organization
(EAEO).
ATE launched the Female Future Program in February
2016 that aims to attract more women into
management positons, decision making processes and
on Corporate Boards.
Zanzibar
Zanzibar's employers’ organization is the Employers
Association of Zanzibar (ZANEMA). Main activities are
to represent the private sector in policy advocacy and
to conduct training workshops for members. ZANEMA
maintains good working relations with ZATUC, but the
organization faces constraints in terms of manpower
resources. Recently ZANEMA expressed that despite
hefty work permit fees to protect domestic labour
forces from alien workers, it should also apply other
measures, such as upgrading skills of the workforce.4
ZANEMA is member of the East African Employers
Organization (EAEO).
CENTRAL TRIPARTITE STRUCTURES
Tanzania, mainland
Labour, Economic and Social Council (LESCO)
LESCO advises the Minister on e.g. national labour
market policy, any proposed labour law before it is
submitted to cabinet. It also collects and compiles
information and statistics relating to the administration
of the labour laws. LESCO consists of an independent
chairperson and sixteen members all appointed by the
Minister of Labour, which represent the interest of the
government, employers, workers; and four members
appointed because of their expertise.
Meeting in LESCO have not been often, but with
occasional consultations with trade unions.
Representatives’ on some issues prior to meetings have
been effectuated albeit coordination mechanisms are
not well established. What affects the dialogue has
frequently been related to its recommendations are not
acted on by the government because of political
position.
Labour Court
The Labour Court is a division of the high court, which
settles labour disputes referred to it. This Court is
presided by a judge and two assessors from the
employers’ organizations and trade unions.
It has also been registered that there is no
administrative sanctions or fines available to labour
inspectors. According to ILO, labour inspectors are
hindered in their ability to ensure labour law
compliance because sanctioning an employer through
the courts is cumbersome and appears to depend on the
seldom-used delegation of prosecutorial authority from
the Director of Public Prosecutions.5 In addition, the
Labour Court lacks resources and processing slightly less
than half of the cases it receives.6
Commission for Mediation and Arbitration (CMA)
Labour disputes are mainly regulated and resolved by
mediation through the CMA. It is an independent
department of the government and has been operating
since 2007. The functions of this Commission are to
mediate or arbitrate in any dispute referred to the
Commission in terms of any labour laws, including
antiunion discrimination, if the parties to the dispute
agree to arbitration or the Labour Court refers a
dispute. The CMA is well functioning and therefore an
important organ in the Tanzanian labour market.7
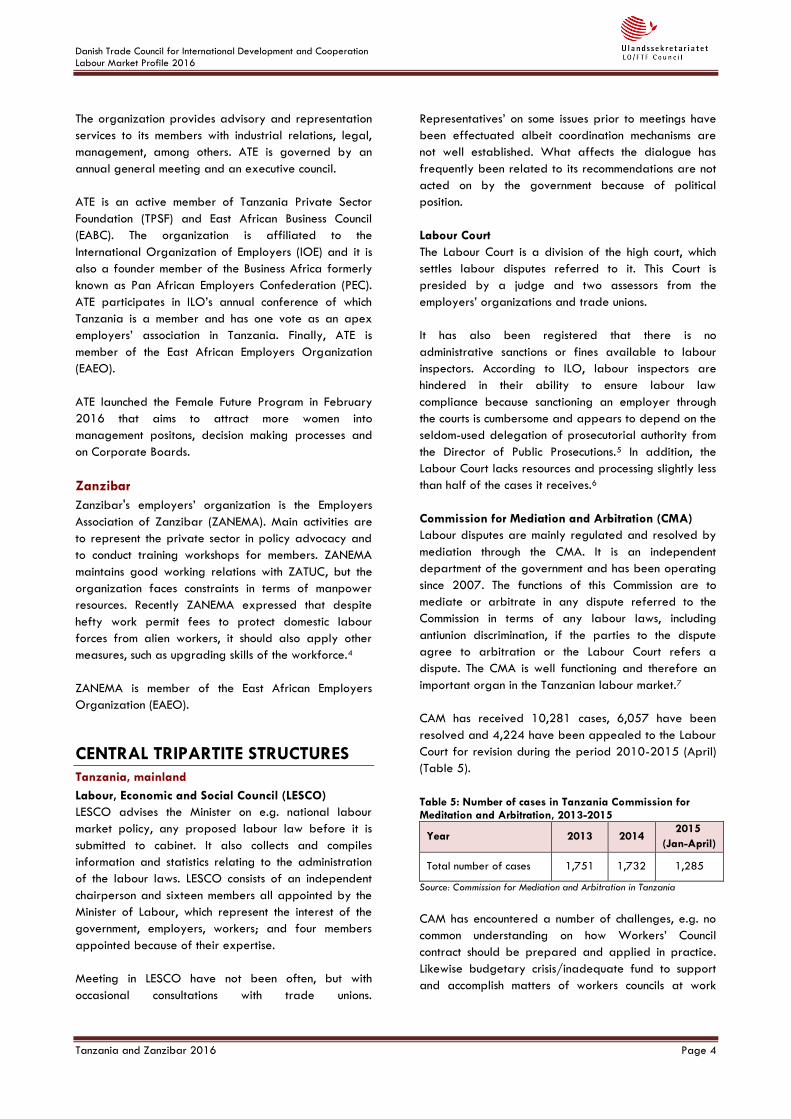
CAM has received 10,281 cases, 6,057 have been
resolved and 4,224 have been appealed to the Labour
Court for revision during the period 2010-2015 (April)
(Table 5).
Table 5: Number of cases in Tanzania Commission for Meditation and Arbitration, 2013-2015
Year 2013 2014 2015
(Jan-April)
Total number of cases 1,751 1,732 1,285
Source: Commission for Mediation and Arbitration in Tanzania
CAM has encountered a number of challenges, e.g. no
common understanding on how Workers’ Council
contract should be prepared and applied in practice.
Likewise budgetary crisis/inadequate fund to support
and accomplish matters of workers councils at work
Danish Trade Council for International Development and Cooperation
Labour Market Profile 2016
Tanzania and Zanzibar 2016 Page 5
places, e.g. the problems with documentation when
registering the workers council contract e.g. its
commencement and expiry time
Sectoral Wage Boards
The members of the Wage Boards are appointed by
the Minister of Labour and Employment in consultation
with LESCO. The functions of the Wage Boards are to: i)
conduct an investigation on a minimum remuneration
and other conditions of employment; ii) promote
collective bargaining between registered trade unions,
employers and registered employer’s associations, and
iii) make recommendations to the Minister on minimum
wages and conditions of employment. Wage boards
have been established in sectors such as domestic
service, private security, agriculture, mining, and
health.8
Essential Services Committee
The Essential Services Committee is composed of
employers, workers, and government representatives.
Workers in certain “essential” sectors, which may not
strike without a pre-existing agreement to maintain
“minimum services”, and workers in other sectors may
also be subject to strike limitation as determined by the
Essential Services Committee. This committee has the
authority to deem periodically which services are
essential.9
Collective Bargaining Agreements (CBAs) in Tanzania
Mainland
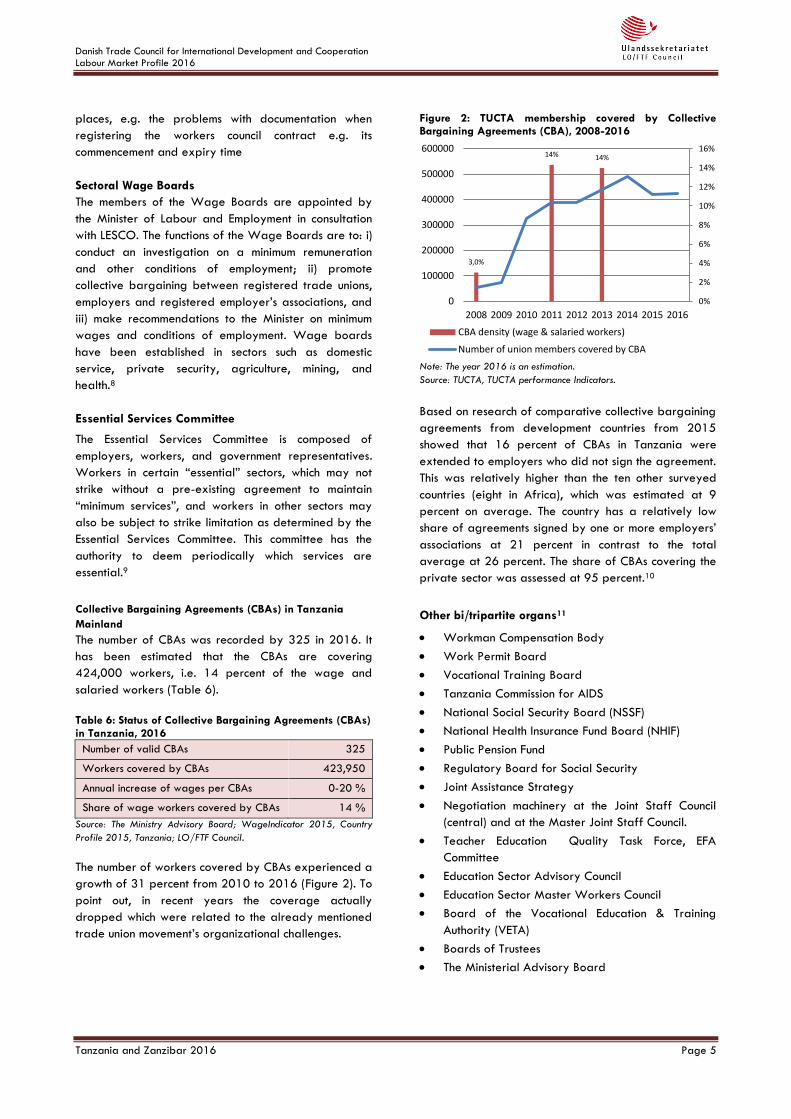
The number of CBAs was recorded by 325 in 2016. It
has been estimated that the CBAs are covering
424,000 workers, i.e. 14 percent of the wage and
salaried workers (Table 6).
Table 6: Status of Collective Bargaining Agreements (CBAs) in Tanzania, 2016
Number of valid CBAs 325
Workers covered by CBAs 423,950
Annual increase of wages per CBAs 0-20 %
Share of wage workers covered by CBAs 14 %
Source: The Ministry Advisory Board; WageIndicator 2015, Country
Profile 2015, Tanzania; LO/FTF Council.
The number of workers covered by CBAs experienced a
growth of 31 percent from 2010 to 2016 (Figure 2). To
point out, in recent years the coverage actually
dropped which were related to the already mentioned
trade union movement’s organizational challenges.
Figure 2: TUCTA membership covered by Collective Bargaining Agreements (CBA), 2008-2016
Note: The year 2016 is an estimation.
Source: TUCTA, TUCTA performance Indicators.
Based on research of comparative collective bargaining
agreements from development countries from 2015
showed that 16 percent of CBAs in Tanzania were
extended to employers who did not sign the agreement.
This was relatively higher than the ten other surveyed
countries (eight in Africa), which was estimated at 9
percent on average. The country has a relatively low
share of agreements signed by one or more employers’
associations at 21 percent in contrast to the total
average at 26 percent. The share of CBAs covering the
private sector was assessed at 95 percent.10
Other bi/tripartite organs11
Workman Compensation Body
Work Permit Board
Vocational Training Board
Tanzania Commission for AIDS
National Social Security Board (NSSF)
National Health Insurance Fund Board (NHIF)
Public Pension Fund
Regulatory Board for Social Security
Joint Assistance Strategy
Negotiation machinery at the Joint Staff Council
(central) and at the Master Joint Staff Council.
Teacher Education Quality Task Force, EFA
Committee
Education Sector Advisory Council
Education Sector Master Workers Council
Board of the Vocational Education & Training
Authority (VETA)
Boards of Trustees
The Ministerial Advisory Board
3,0%
14% 14%
0%
2%
4%
6%
8%
10%
12%
14%
16%
0
100000
200000
300000
400000
500000
600000
2008 2009 2010 2011 2012 2013 2014 2015 2016
CBA density (wage & salaried workers)
Number of union members covered by CBA
Danish Trade Council for International Development and Cooperation
Labour Market Profile 2016
Tanzania and Zanzibar 2016 Page 6
Zanzibar
Zanzibar Industrial Court
The Zanzibar Industrial Court is a division of the High
Court of Zanzibar, which settles formal labour disputes
conferred to it and like its mainland counterpart the
Zanzibar Industrial Court is presided by a judge and
two assessors from employers’ organisations and trade
unions.12 The courts are the only venue in which labour
disputes can be heard. According to an ILO labour
administration audit,13 the industrial court is functioning,
but is slow and irregular due to lack of resources.
During 2015 the government advised for the speeding
up of the establishment of industrial court. Among
others, the Ministry for Justice and Legal Affairs
initiated hearings with experts to improve the trust of
the courts as well as delimit the case delays.14
Other sources argue that Zanzibar judges and all
judicial officers, members of special departments, and
employees of the House of Representatives are
excluded from labour law protection.15
Labour Advisory Board
The Labour Advisory Board consists of nine member,
with three members each from the government,
employers and workers, all appointed by the Labour
Minister. The board provides advice on labour related
issues, such as proposed legislation, ILO conventions,
industrial relations, and working conditions. It is required
to meet four times a year.16 However, the board is
reported not to function effectively and bipartite
meetings between trade union and employers
association are very informal with general discussions.
Wages Advisory Board
The Wages Advisory Board consists of 13 members,
representing government, employers, workers, informal
economy, commerce and independent experts. It
provides recommendation for minimum wages and
working conditions. The board is required to meet twice
a year. This board takes consequential decisions
annually and one of the major recent decisions was the
new minimum wage fixing in the private sector (see
more in section: Labour Conditions). However, when the
political tensions are high the dialogue is somewhat
affected.
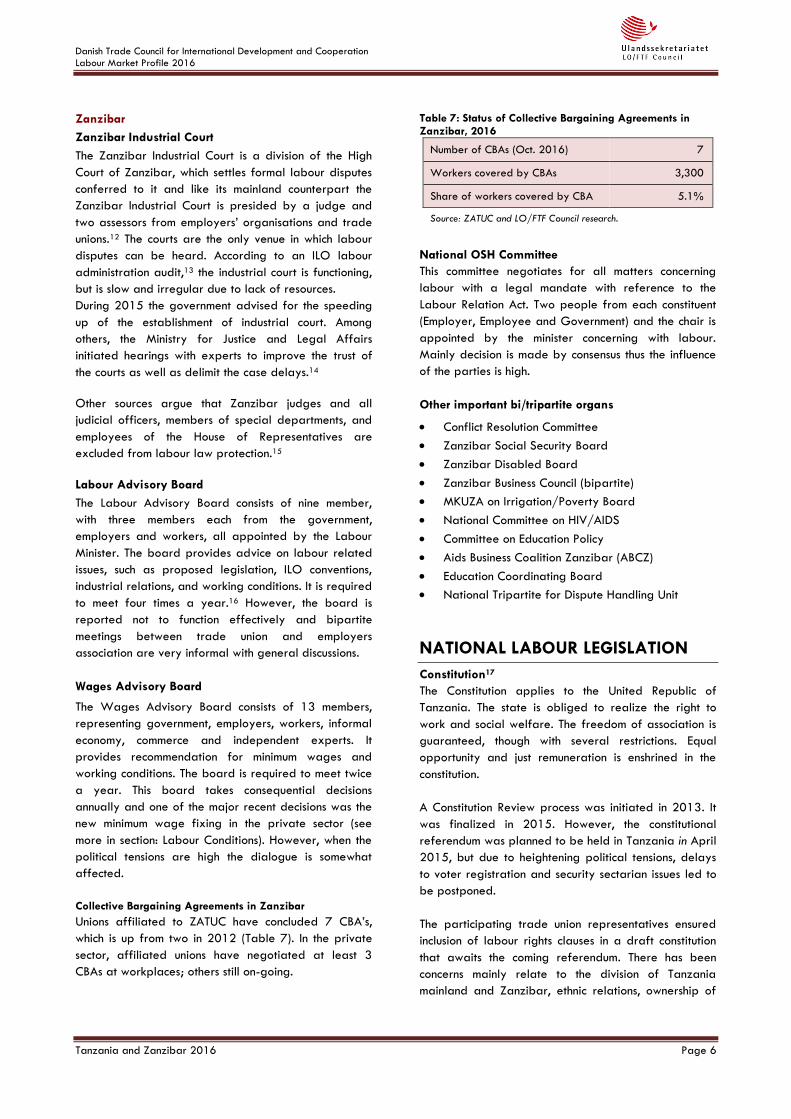
Collective Bargaining Agreements in Zanzibar
Unions affiliated to ZATUC have concluded 7 CBA’s,
which is up from two in 2012 (Table 7). In the private
sector, affiliated unions have negotiated at least 3
CBAs at workplaces; others still on-going.
Table 7: Status of Collective Bargaining Agreements in Zanzibar, 2016
Number of CBAs (Oct. 2016) 7
Workers covered by CBAs 3,300
Share of workers covered by CBA 5.1%
Source: ZATUC and LO/FTF Council research.
National OSH Committee
This committee negotiates for all matters concerning
labour with a legal mandate with reference to the
Labour Relation Act. Two people from each constituent
(Employer, Employee and Government) and the chair is
appointed by the minister concerning with labour.
Mainly decision is made by consensus thus the influence
of the parties is high.
Other important bi/tripartite organs
Conflict Resolution Committee
Zanzibar Social Security Board
Zanzibar Disabled Board
Zanzibar Business Council (bipartite)
MKUZA on Irrigation/Poverty Board
National Committee on HIV/AIDS
Committee on Education Policy
Aids Business Coalition Zanzibar (ABCZ)
Education Coordinating Board
National Tripartite for Dispute Handling Unit
NATIONAL LABOUR LEGISLATION
Constitution17
The Constitution applies to the United Republic of
Tanzania. The state is obliged to realize the right to
work and social welfare. The freedom of association is
guaranteed, though with several restrictions. Equal
opportunity and just remuneration is enshrined in the
constitution.
A Constitution Review process was initiated in 2013. It
was finalized in 2015. However, the constitutional
referendum was planned to be held in Tanzania in April
2015, but due to heightening political tensions, delays
to voter registration and security sectarian issues led to
be postponed.
The participating trade union representatives ensured
inclusion of labour rights clauses in a draft constitution
that awaits the coming referendum. There has been
concerns mainly relate to the division of Tanzania
mainland and Zanzibar, ethnic relations, ownership of
Danish Trade Council for International Development and Cooperation
Labour Market Profile 2016
Tanzania and Zanzibar 2016 Page 7
oil and gas reserves, among others. The same awaits
the proposed amendment of employment and labour
legislation that takes into account ILO core conventions.
***
The Tanzania mainland and Zanzibar have separate
labour laws:
Tanzania, mainland
Employment and Labour Relations Act18
The Employment and Labour Relations Act of 2004 sets
fundamental rights at work and regulates hours of
work, remuneration, leave, termination of employment,
trade unions and employers’ organizations,
organizational rights, collective bargaining, strikes and
lockouts and sets dispute resolution under the
Commission for Mediation and Arbitration. The labor
laws cover all workers, including foreign and migrant
workers.
The Labour Relations Act is contradicted by the Public
Service (Negotiation Machinery) of 200319 for civil
servants by having conflicting regulations concerning
strikes. Amendments of the Act are prepared and are
underway to parliament discussions.
Labour Institutions Act20
The Labour Institutions Act of 2004 applies to the
United Republic of Tanzania. It establishes the Labour,
Economic and Social Council, the Commission for
Mediation and Arbitration, the Essential Services
Committee, the Sectoral Wage boards, the Labour
Administration and Inspection, and the Labour Court.
According to an assessment from 2013 by the Legal
and Human Rights Centre in Tanzania, 67% of workers
are completely unaware of the labour laws.21
Zanzibar
Labour Relations Act22
Of the laws specifically to Zanzibar, the Labour
Relations Act from 2005 regulates fundamental
employees’ rights, establishes the framework for
registration of trade unions and organizations,
organizational rights, collective bargaining and
agreements, labour disputes / right to strike, dispute
prevention and resolution and establishes the Zanzibar
Industrial Court.
The Employment Act
The Employment Act from 2005 regulates fundamental
rights and protection, employment procedures and
foreign employment, contracts of service and
employment standards and rights (hours at work,
wages, leave, vacation, penalties, termination of
employment, etc.). The law also establishes the Labour
Advisory Board, wage fixing machinery and wages
protection as well as the Labour Commission and labour
inspection.
Other legislations
Several other legislations exist from Tanzania mainland
and Zanzibar which regulate and set standards and
restrictions for the labour market.23 ILO has registered
a total 283 national labour, social security and related
human rights legislations. Six were registered in 2015
(none in 2014 and 2016) (see also Table 8):
Employment and Labour Laws (Miscellaneous
Amendments) Act, 2015.
Zanzibar Public Leaders Code of Ethics Act, 2015
(Act No. 4 of 2015).
Youth Council of Tanzania Act, 2015 (registered
among ‘Elimination of child labour, protection of
children and young persons’ as well as
‘Employment policy, promotion of employment and
employment services’).
Non-Citizens (Employment Regulations) Act 2015.
Teacher's Service Commission Act, 2015 (No. 25 of
2015).
Table 8: Status of the national labour, social security and human rights related legislations in Tanzania
2014 2015 2016
Number of new legislations 0 6 0
Source: ILO, NATLEX, Tanzania
Observations on the labour legislation
Equally important the International Trade Union
Confederation (ITUC) has registered several
observations of the legislations. Among others, they
vary from:24
Power to refuse official registration on arbitrary,
unjustified or ambiguous grounds;
formalities or requirements which excessively delay
or substantially impair the free establishment of
organizations;
restrictions on trade unions’ right to establish
branches, federation and confederation or to
affiliate with national and international
organizations;
administrative authorities’ power to unilaterally
dissolve, suspend or de-register trade union
organizations;
Danish Trade Council for International Development and Cooperation
Labour Market Profile 2016
Tanzania and Zanzibar 2016 Page 8
Compulsory conciliation and/or binding arbitration
procedure in the event of disputes during collective
bargaining, other than in essential services;
Compulsory recourse to arbitration, or to long and
complex conciliation and mediation procedures
prior to strike actions; and
discretionary determination or excessively long list
of “essential services” in which the right to strike is
prohibited or severely restricted.
Ratified ILO Conventions
With reference to Tanzania’s ratification of
international labour standards, a total 35 ILO
Conventions are ratified (see also Appendix Table
29):25
Ratifications for the United Republic of Tanzania
Fundamental Conventions: 8 of 8.
Governance Conventions (Priority): 1 of 4
Technical Conventions: 26 of 177.
Out of 35 Conventions ratified by Tanzania, of
which 34 are in fovece, 1 Convention has been
denounced; none has been ratified in the past 12
months.
The latest ratified Conventions were the Discrimination
(Employment and Occupation) Convention (C111) and
the Equal Remuneration Convention (C100), both from
February 2002.
A tripartite plan of action of promoting the ratification
of the Domestic Workers Convention No. 189 was
launched in February 2014.
With reference to the Article 22 of the ILO Constitution,
i.e. annual reports on ratified Conventions, both the
International Organization of Employers (IOE) and ITUC
had observations to the Convention 87 on Freedom of
Association and Protection of the Right to Organise in
Tanzania in 2015; only the latter organization received
responses from the government, so far.26
TRADE UNION RIGHTS VIOLATIONS
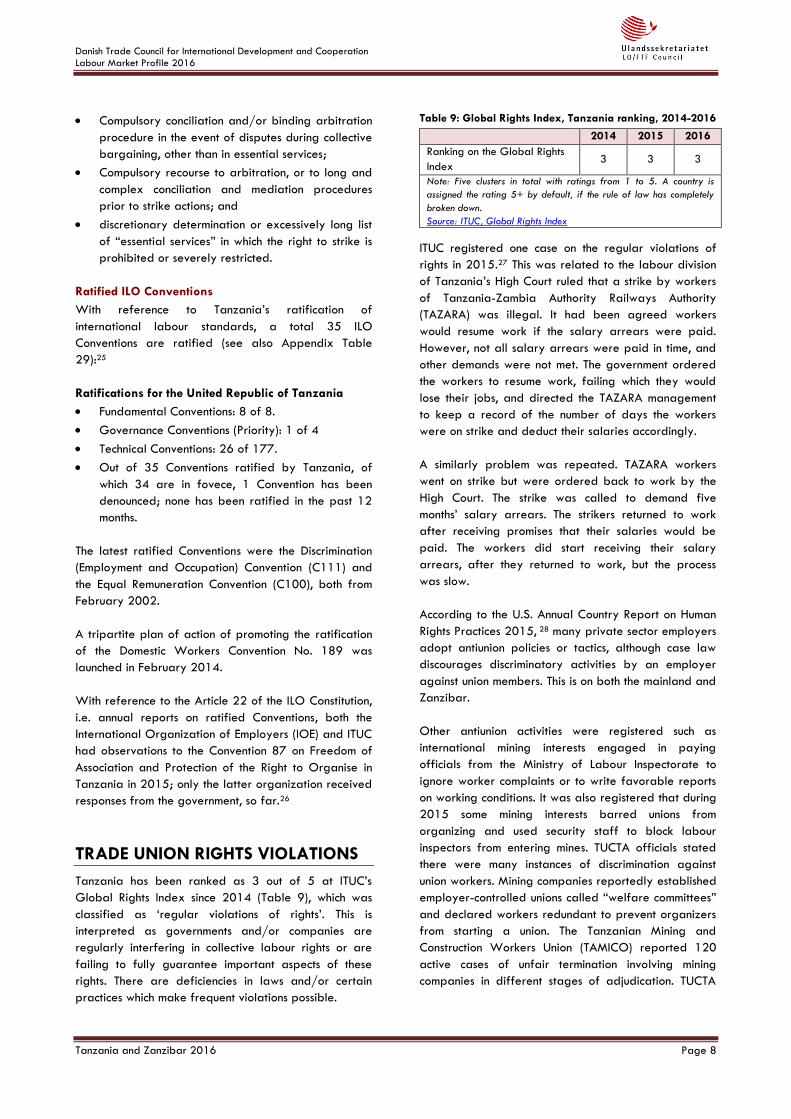
Tanzania has been ranked as 3 out of 5 at ITUC’s
Global Rights Index since 2014 (Table 9), which was
classified as ‘regular violations of rights’. This is
interpreted as governments and/or companies are
regularly interfering in collective labour rights or are
failing to fully guarantee important aspects of these
rights. There are deficiencies in laws and/or certain
practices which make frequent violations possible.
Table 9: Global Rights Index, Tanzania ranking, 2014-2016
2014 2015 2016
Ranking on the Global Rights
Index 3 3 3
Note: Five clusters in total with ratings from 1 to 5. A country is
assigned the rating 5+ by default, if the rule of law has completely
broken down.
Source: ITUC, Global Rights Index
ITUC registered one case on the regular violations of
rights in 2015.27 This was related to the labour division
of Tanzania’s High Court ruled that a strike by workers
of Tanzania-Zambia Authority Railways Authority
(TAZARA) was illegal. It had been agreed workers
would resume work if the salary arrears were paid.
However, not all salary arrears were paid in time, and
other demands were not met. The government ordered
the workers to resume work, failing which they would
lose their jobs, and directed the TAZARA management
to keep a record of the number of days the workers
were on strike and deduct their salaries accordingly.
A similarly problem was repeated. TAZARA workers
went on strike but were ordered back to work by the
High Court. The strike was called to demand five
months’ salary arrears. The strikers returned to work
after receiving promises that their salaries would be
paid. The workers did start receiving their salary
arrears, after they returned to work, but the process
was slow.
According to the U.S. Annual Country Report on Human
Rights Practices 2015, 28 many private sector employers
adopt antiunion policies or tactics, although case law
discourages discriminatory activities by an employer
against union members. This is on both the mainland and
Zanzibar.
Other antiunion activities were registered such as
international mining interests engaged in paying
officials from the Ministry of Labour Inspectorate to
ignore worker complaints or to write favorable reports
on working conditions. It was also registered that during
2015 some mining interests barred unions from
organizing and used security staff to block labour
inspectors from entering mines. TUCTA officials stated
there were many instances of discrimination against
union workers. Mining companies reportedly established
employer-controlled unions called “welfare committees”
and declared workers redundant to prevent organizers
from starting a union. The Tanzanian Mining and
Construction Workers Union (TAMICO) reported 120
active cases of unfair termination involving mining
companies in different stages of adjudication. TUCTA
Danish Trade Council for International Development and Cooperation
Labour Market Profile 2016
Tanzania and Zanzibar 2016 Page 9
also reported cases of hotels and construction firms
dismissing employees for attempting to unionize.
Both Tanzania mainland and Zanzibar have no cases
with the ILO's Committee of Freedom of Association.29
WORKING CONDITIONS
In Tanzania mainland minimum wages are fixed by the
Government after tripartite consultation in the LESCO
based on recommendations from 12 sub-sectoral wage
boards.
In July 2014 the minimum wages for public sector were
raised from 200,000 TZS (US$120) to 240,000 TZS
(US$144). TUCTA and the Ministry of Labour agreed to
increase minimum wages by 11 percent in 2015/16,
but in future, minimum wage negotiations will be dealt
by special wage regulatory committees and social
partners. Public civil servants have received increased
travel allowances (up to 50 percent) after years of
lobbying by trade unions to align salaries with the
rising cost of travelling fees and accommodations.
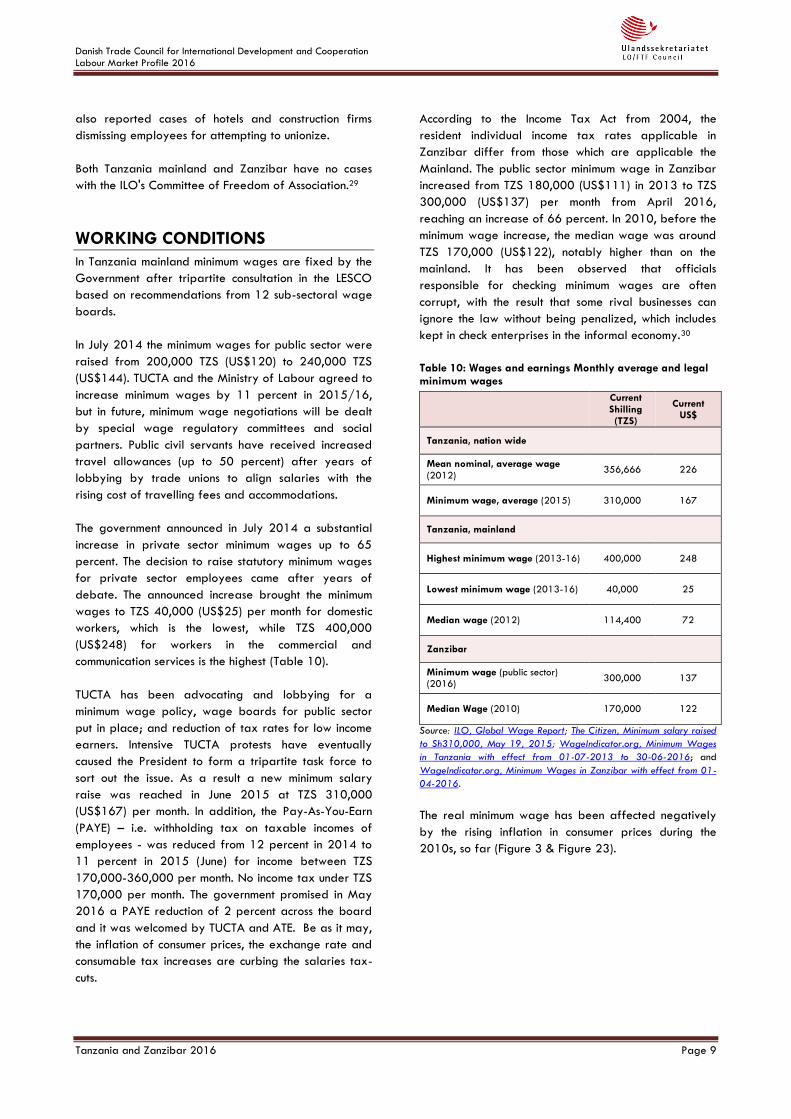
The government announced in July 2014 a substantial
increase in private sector minimum wages up to 65
percent. The decision to raise statutory minimum wages
for private sector employees came after years of
debate. The announced increase brought the minimum
wages to TZS 40,000 (US$25) per month for domestic
workers, which is the lowest, while TZS 400,000
(US$248) for workers in the commercial and
communication services is the highest (Table 10).
TUCTA has been advocating and lobbying for a
minimum wage policy, wage boards for public sector
put in place; and reduction of tax rates for low income
earners. Intensive TUCTA protests have eventually
caused the President to form a tripartite task force to
sort out the issue. As a result a new minimum salary
raise was reached in June 2015 at TZS 310,000
(US$167) per month. In addition, the Pay-As-You-Earn
(PAYE) – i.e. withholding tax on taxable incomes of
employees - was reduced from 12 percent in 2014 to
11 percent in 2015 (June) for income between TZS
170,000-360,000 per month. No income tax under TZS
170,000 per month. The government promised in May
2016 a PAYE reduction of 2 percent across the board
and it was welcomed by TUCTA and ATE. Be as it may,
the inflation of consumer prices, the exchange rate and
consumable tax increases are curbing the salaries tax-
cuts.
According to the Income Tax Act from 2004, the
resident individual income tax rates applicable in
Zanzibar differ from those which are applicable the
Mainland. The public sector minimum wage in Zanzibar
increased from TZS 180,000 (US$111) in 2013 to TZS
300,000 (US$137) per month from April 2016,
reaching an increase of 66 percent. In 2010, before the
minimum wage increase, the median wage was around
TZS 170,000 (US$122), notably higher than on the
mainland. It has been observed that officials
responsible for checking minimum wages are often
corrupt, with the result that some rival businesses can
ignore the law without being penalized, which includes
kept in check enterprises in the informal economy.30
Table 10: Wages and earnings Monthly average and legal minimum wages
Current Shilling (TZS)
Current US$
Tanzania, nation wide
Mean nominal, average wage (2012)
356,666 226
Minimum wage, average (2015) 310,000 167
Tanzania, mainland
Highest minimum wage (2013-16) 400,000 248
Lowest minimum wage (2013-16) 40,000 25
Median wage (2012) 114,400 72
Zanzibar
Minimum wage (public sector) (2016)
300,000 137
Median Wage (2010) 170,000 122
Source: ILO, Global Wage Report; The Citizen, Minimum salary raised
to Sh310,000, May 19, 2015; WageIndicator.org, Minimum Wages
in Tanzania with effect from 01-07-2013 to 30-06-2016; and
WageIndicator.org, Minimum Wages in Zanzibar with effect from 01-
04-2016.
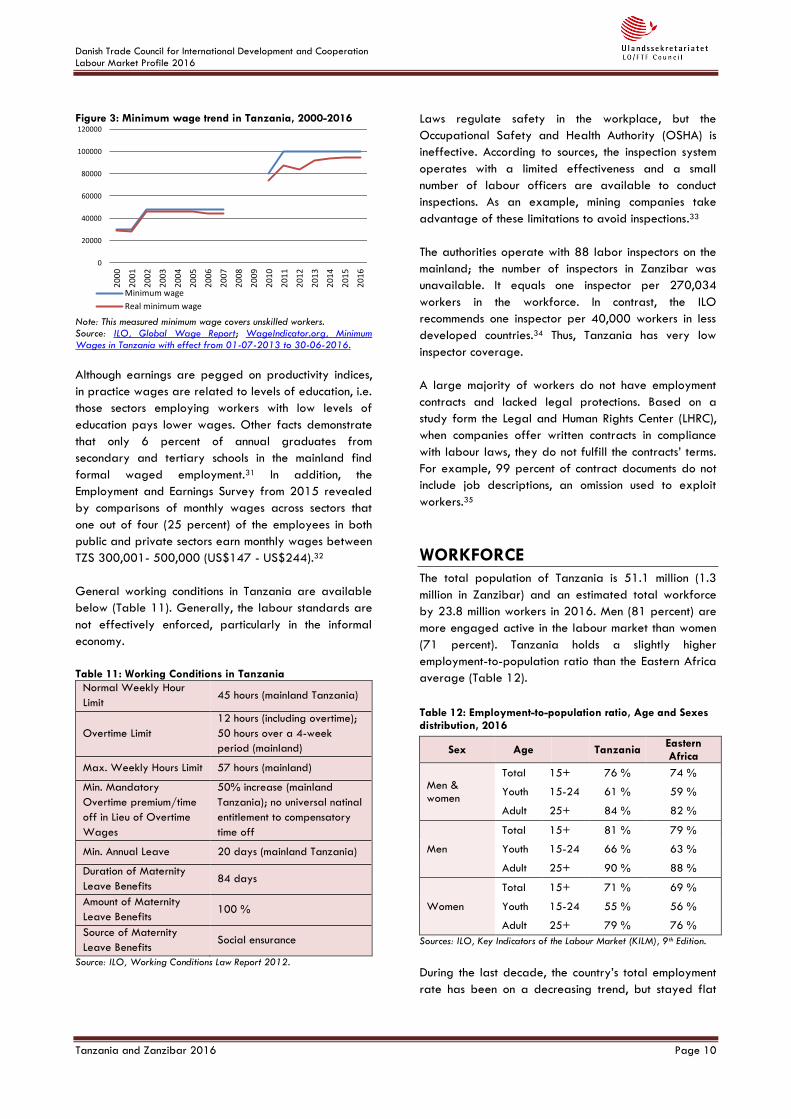
The real minimum wage has been affected negatively
by the rising inflation in consumer prices during the
2010s, so far (Figure 3 & Figure 23).
Danish Trade Council for International Development and Cooperation
Labour Market Profile 2016
Tanzania and Zanzibar 2016 Page 10
Figure 3: Minimum wage trend in Tanzania, 2000-2016
Note: This measured minimum wage covers unskilled workers. Source: ILO, Global Wage Report; WageIndicator.org, Minimum Wages in Tanzania with effect from 01-07-2013 to 30-06-2016.
Although earnings are pegged on productivity indices,
in practice wages are related to levels of education, i.e.
those sectors employing workers with low levels of
education pays lower wages. Other facts demonstrate
that only 6 percent of annual graduates from
secondary and tertiary schools in the mainland find
formal waged employment.31 In addition, the
Employment and Earnings Survey from 2015 revealed
by comparisons of monthly wages across sectors that
one out of four (25 percent) of the employees in both
public and private sectors earn monthly wages between
TZS 300,001- 500,000 (US$147 - US$244).32
General working conditions in Tanzania are available
below (Table 11). Generally, the labour standards are
not effectively enforced, particularly in the informal
economy.
Table 11: Working Conditions in Tanzania
Normal Weekly Hour
Limit 45 hours (mainland Tanzania)
Overtime Limit
12 hours (including overtime);
50 hours over a 4-week
period (mainland)
Max. Weekly Hours Limit 57 hours (mainland)
Min. Mandatory
Overtime premium/time
off in Lieu of Overtime
Wages
50% increase (mainland
Tanzania); no universal natinal
entitlement to compensatory
time off
Min. Annual Leave 20 days (mainland Tanzania)
Duration of Maternity
Leave Benefits 84 days
Amount of Maternity
Leave Benefits 100 %
Source of Maternity
Leave Benefits Social ensurance
Source: ILO, Working Conditions Law Report 2012.
Laws regulate safety in the workplace, but the
Occupational Safety and Health Authority (OSHA) is
ineffective. According to sources, the inspection system
operates with a limited effectiveness and a small
number of labour officers are available to conduct
inspections. As an example, mining companies take
advantage of these limitations to avoid inspections.33
The authorities operate with 88 labor inspectors on the
mainland; the number of inspectors in Zanzibar was
unavailable. It equals one inspector per 270,034
workers in the workforce. In contrast, the ILO
recommends one inspector per 40,000 workers in less
developed countries.34 Thus, Tanzania has very low
inspector coverage.
A large majority of workers do not have employment
contracts and lacked legal protections. Based on a
study form the Legal and Human Rights Center (LHRC),
when companies offer written contracts in compliance
with labour laws, they do not fulfill the contracts’ terms.
For example, 99 percent of contract documents do not
include job descriptions, an omission used to exploit
workers.35
WORKFORCE
The total population of Tanzania is 51.1 million (1.3
million in Zanzibar) and an estimated total workforce
by 23.8 million workers in 2016. Men (81 percent) are
more engaged active in the labour market than women
(71 percent). Tanzania holds a slightly higher
employment-to-population ratio than the Eastern Africa
average (Table 12).
Table 12: Employment-to-population ratio, Age and Sexes distribution, 2016
Sex Age Tanzania Eastern Africa
Men & women
Total 15+ 76 % 74 %
Youth 15-24 61 % 59 %
Adult 25+ 84 % 82 %
Men
Total 15+ 81 % 79 %
Youth 15-24 66 % 63 %
Adult 25+ 90 % 88 %
Women
Total 15+ 71 % 69 %
Youth 15-24 55 % 56 %
Adult 25+ 79 % 76 %
Sources: ILO, Key Indicators of the Labour Market (KILM), 9th Edition.
During the last decade, the country’s total employment
rate has been on a decreasing trend, but stayed flat
0
20000
40000
60000
80000
100000
120000
20
00
20
01
20
02
20
03
20
04
20
05
20
06
20
07
20
08
20
09
20
10
20
11
20
12
20
13
20
14
20
15
20
16
Minimum wage
Real minimum wage
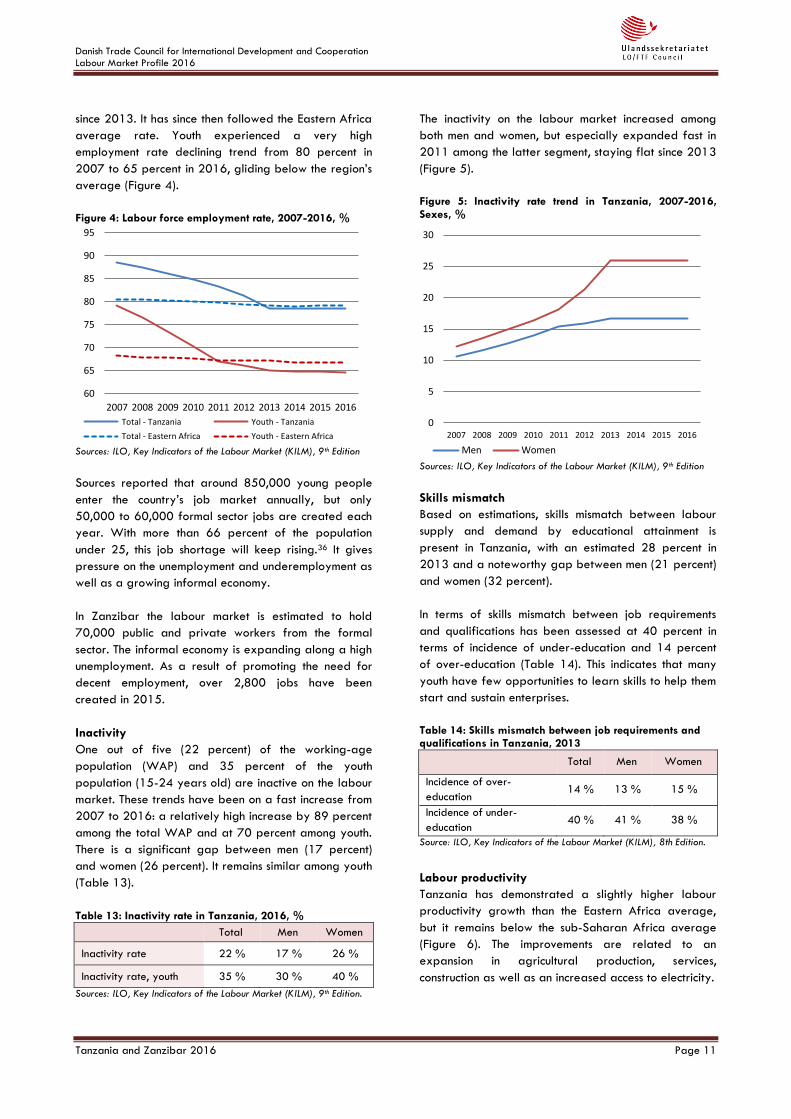
Danish Trade Council for International Development and Cooperation
Labour Market Profile 2016
Tanzania and Zanzibar 2016 Page 11
since 2013. It has since then followed the Eastern Africa
average rate. Youth experienced a very high
employment rate declining trend from 80 percent in
2007 to 65 percent in 2016, gliding below the region’s
average (Figure 4).
Figure 4: Labour force employment rate, 2007-2016, %
Sources: ILO, Key Indicators of the Labour Market (KILM), 9th Edition
Sources reported that around 850,000 young people
enter the country’s job market annually, but only
50,000 to 60,000 formal sector jobs are created each
year. With more than 66 percent of the population
under 25, this job shortage will keep rising.36 It gives
pressure on the unemployment and underemployment as
well as a growing informal economy.
In Zanzibar the labour market is estimated to hold
70,000 public and private workers from the formal
sector. The informal economy is expanding along a high
unemployment. As a result of promoting the need for
decent employment, over 2,800 jobs have been
created in 2015.
Inactivity
One out of five (22 percent) of the working-age
population (WAP) and 35 percent of the youth
population (15-24 years old) are inactive on the labour
market. These trends have been on a fast increase from
2007 to 2016: a relatively high increase by 89 percent
among the total WAP and at 70 percent among youth.
There is a significant gap between men (17 percent)
and women (26 percent). It remains similar among youth
(Table 13).
Table 13: Inactivity rate in Tanzania, 2016, %
Total Men Women
Inactivity rate 22 % 17 % 26 %
Inactivity rate, youth 35 % 30 % 40 %
Sources: ILO, Key Indicators of the Labour Market (KILM), 9th Edition.
The inactivity on the labour market increased among
both men and women, but especially expanded fast in
2011 among the latter segment, staying flat since 2013
(Figure 5).
Figure 5: Inactivity rate trend in Tanzania, 2007-2016, Sexes, %
Sources: ILO, Key Indicators of the Labour Market (KILM), 9th Edition
Skills mismatch
Based on estimations, skills mismatch between labour
supply and demand by educational attainment is
present in Tanzania, with an estimated 28 percent in
2013 and a noteworthy gap between men (21 percent)
and women (32 percent).
In terms of skills mismatch between job requirements
and qualifications has been assessed at 40 percent in
terms of incidence of under-education and 14 percent
of over-education (Table 14). This indicates that many
youth have few opportunities to learn skills to help them
start and sustain enterprises.
Table 14: Skills mismatch between job requirements and qualifications in Tanzania, 2013
Total Men Women
Incidence of over-
education 14 % 13 % 15 %
Incidence of under-
education 40 % 41 % 38 %
Source: ILO, Key Indicators of the Labour Market (KILM), 8th Edition.
Labour productivity
Tanzania has demonstrated a slightly higher labour
productivity growth than the Eastern Africa average,
but it remains below the sub-Saharan Africa average
(Figure 6). The improvements are related to an
expansion in agricultural production, services,
construction as well as an increased access to electricity.
60
65
70
75
80
85
90
95
2007 2008 2009 2010 2011 2012 2013 2014 2015 2016
Total - Tanzania Youth - Tanzania
Total - Eastern Africa Youth - Eastern Africa
0
5
10
15
20
25
30
2007 2008 2009 2010 2011 2012 2013 2014 2015 2016
Men Women
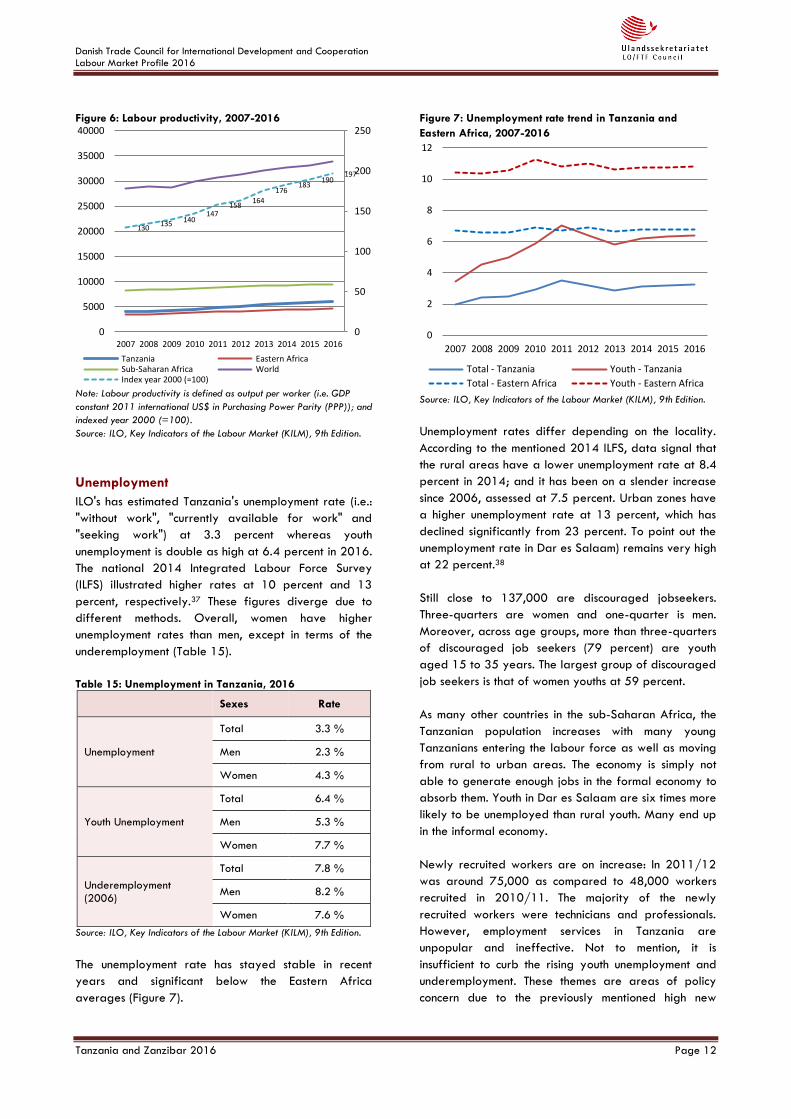
Danish Trade Council for International Development and Cooperation
Labour Market Profile 2016
Tanzania and Zanzibar 2016 Page 12
Figure 6: Labour productivity, 2007-2016
Note: Labour productivity is defined as output per worker (i.e. GDP
constant 2011 international US$ in Purchasing Power Parity (PPP)); and
indexed year 2000 (=100).
Source: ILO, Key Indicators of the Labour Market (KILM), 9th Edition.
Unemployment
ILO's has estimated Tanzania's unemployment rate (i.e.:
"without work", "currently available for work" and
"seeking work") at 3.3 percent whereas youth
unemployment is double as high at 6.4 percent in 2016.
The national 2014 Integrated Labour Force Survey
(ILFS) illustrated higher rates at 10 percent and 13
percent, respectively.37 These figures diverge due to
different methods. Overall, women have higher
unemployment rates than men, except in terms of the
underemployment (Table 15).
Table 15: Unemployment in Tanzania, 2016
Sexes Rate
Unemployment
Total 3.3 %
Men 2.3 %
Women 4.3 %
Youth Unemployment
Total 6.4 %
Men 5.3 %
Women 7.7 %
Underemployment (2006)
Total 7.8 %
Men 8.2 %
Women 7.6 %
Source: ILO, Key Indicators of the Labour Market (KILM), 9th Edition.
The unemployment rate has stayed stable in recent
years and significant below the Eastern Africa
averages (Figure 7).
Figure 7: Unemployment rate trend in Tanzania and
Eastern Africa, 2007-2016
Source: ILO, Key Indicators of the Labour Market (KILM), 9th Edition.
Unemployment rates differ depending on the locality.
According to the mentioned 2014 ILFS, data signal that
the rural areas have a lower unemployment rate at 8.4
percent in 2014; and it has been on a slender increase
since 2006, assessed at 7.5 percent. Urban zones have
a higher unemployment rate at 13 percent, which has
declined significantly from 23 percent. To point out the
unemployment rate in Dar es Salaam) remains very high
at 22 percent.38
Still close to 137,000 are discouraged jobseekers.
Three-quarters are women and one-quarter is men.
Moreover, across age groups, more than three-quarters
of discouraged job seekers (79 percent) are youth
aged 15 to 35 years. The largest group of discouraged
job seekers is that of women youths at 59 percent.
As many other countries in the sub-Saharan Africa, the
Tanzanian population increases with many young
Tanzanians entering the labour force as well as moving
from rural to urban areas. The economy is simply not
able to generate enough jobs in the formal economy to
absorb them. Youth in Dar es Salaam are six times more
likely to be unemployed than rural youth. Many end up
in the informal economy.
Newly recruited workers are on increase: In 2011/12
was around 75,000 as compared to 48,000 workers
recruited in 2010/11. The majority of the newly
recruited workers were technicians and professionals.
However, employment services in Tanzania are
unpopular and ineffective. Not to mention, it is
insufficient to curb the rising youth unemployment and
underemployment. These themes are areas of policy
concern due to the previously mentioned high new
130 135 140
147 158
164
176 183
190 197
0
50
100
150
200
250
0
5000
10000
15000
20000
25000
30000
35000
40000
2007 2008 2009 2010 2011 2012 2013 2014 2015 2016
Tanzania Eastern AfricaSub-Saharan Africa WorldIndex year 2000 (=100)
0
2
4
6
8
10
12
2007 2008 2009 2010 2011 2012 2013 2014 2015 2016
Total - Tanzania Youth - Tanzania
Total - Eastern Africa Youth - Eastern Africa
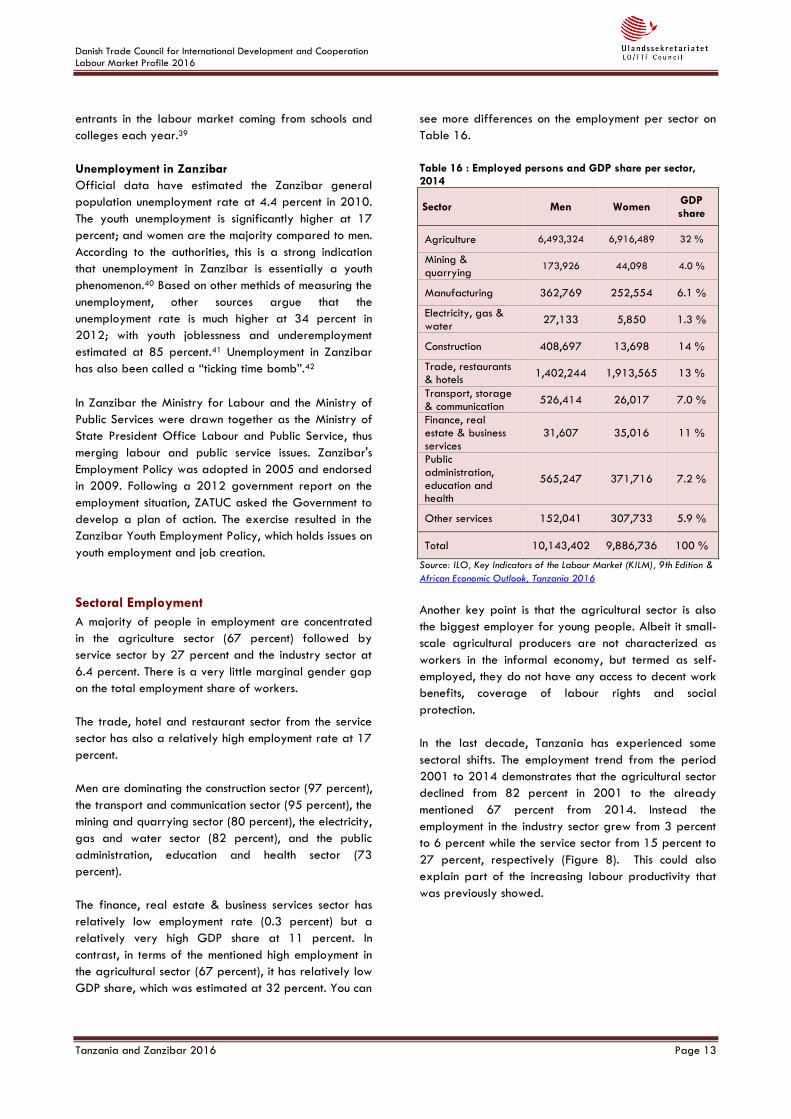
Danish Trade Council for International Development and Cooperation
Labour Market Profile 2016
Tanzania and Zanzibar 2016 Page 13
entrants in the labour market coming from schools and
colleges each year.39
Unemployment in Zanzibar
Official data have estimated the Zanzibar general
population unemployment rate at 4.4 percent in 2010.
The youth unemployment is significantly higher at 17
percent; and women are the majority compared to men.
According to the authorities, this is a strong indication
that unemployment in Zanzibar is essentially a youth
phenomenon.40 Based on other methids of measuring the
unemployment, other sources argue that the
unemployment rate is much higher at 34 percent in
2012; with youth joblessness and underemployment
estimated at 85 percent.41 Unemployment in Zanzibar
has also been called a “ticking time bomb”.42
In Zanzibar the Ministry for Labour and the Ministry of
Public Services were drawn together as the Ministry of
State President Office Labour and Public Service, thus
merging labour and public service issues. Zanzibar's
Employment Policy was adopted in 2005 and endorsed
in 2009. Following a 2012 government report on the
employment situation, ZATUC asked the Government to
develop a plan of action. The exercise resulted in the
Zanzibar Youth Employment Policy, which holds issues on
youth employment and job creation.
Sectoral Employment
A majority of people in employment are concentrated
in the agriculture sector (67 percent) followed by
service sector by 27 percent and the industry sector at
6.4 percent. There is a very little marginal gender gap
on the total employment share of workers.
The trade, hotel and restaurant sector from the service
sector has also a relatively high employment rate at 17
percent.
Men are dominating the construction sector (97 percent),
the transport and communication sector (95 percent), the
mining and quarrying sector (80 percent), the electricity,
gas and water sector (82 percent), and the public
administration, education and health sector (73
percent).
The finance, real estate & business services sector has
relatively low employment rate (0.3 percent) but a
relatively very high GDP share at 11 percent. In
contrast, in terms of the mentioned high employment in
the agricultural sector (67 percent), it has relatively low
GDP share, which was estimated at 32 percent. You can
see more differences on the employment per sector on
Table 16.
Table 16 : Employed persons and GDP share per sector, 2014
Sector Men Women GDP share
Agriculture 6,493,324 6,916,489 32 %
Mining & quarrying
173,926 44,098 4.0 %
Manufacturing 362,769 252,554 6.1 %
Electricity, gas & water
27,133 5,850 1.3 %
Construction 408,697 13,698 14 %
Trade, restaurants & hotels
1,402,244 1,913,565 13 %
Transport, storage & communication
526,414 26,017 7.0 %
Finance, real estate & business services
31,607 35,016 11 %
Public administration, education and health
565,247 371,716 7.2 %
Other services 152,041 307,733 5.9 %
Total 10,143,402 9,886,736 100 %
Source: ILO, Key Indicators of the Labour Market (KILM), 9th Edition &
African Economic Outlook, Tanzania 2016
Another key point is that the agricultural sector is also
the biggest employer for young people. Albeit it small-
scale agricultural producers are not characterized as
workers in the informal economy, but termed as self-
employed, they do not have any access to decent work
benefits, coverage of labour rights and social
protection.
In the last decade, Tanzania has experienced some
sectoral shifts. The employment trend from the period
2001 to 2014 demonstrates that the agricultural sector
declined from 82 percent in 2001 to the already
mentioned 67 percent from 2014. Instead the
employment in the industry sector grew from 3 percent
to 6 percent while the service sector from 15 percent to
27 percent, respectively (Figure 8). This could also
explain part of the increasing labour productivity that
was previously showed.
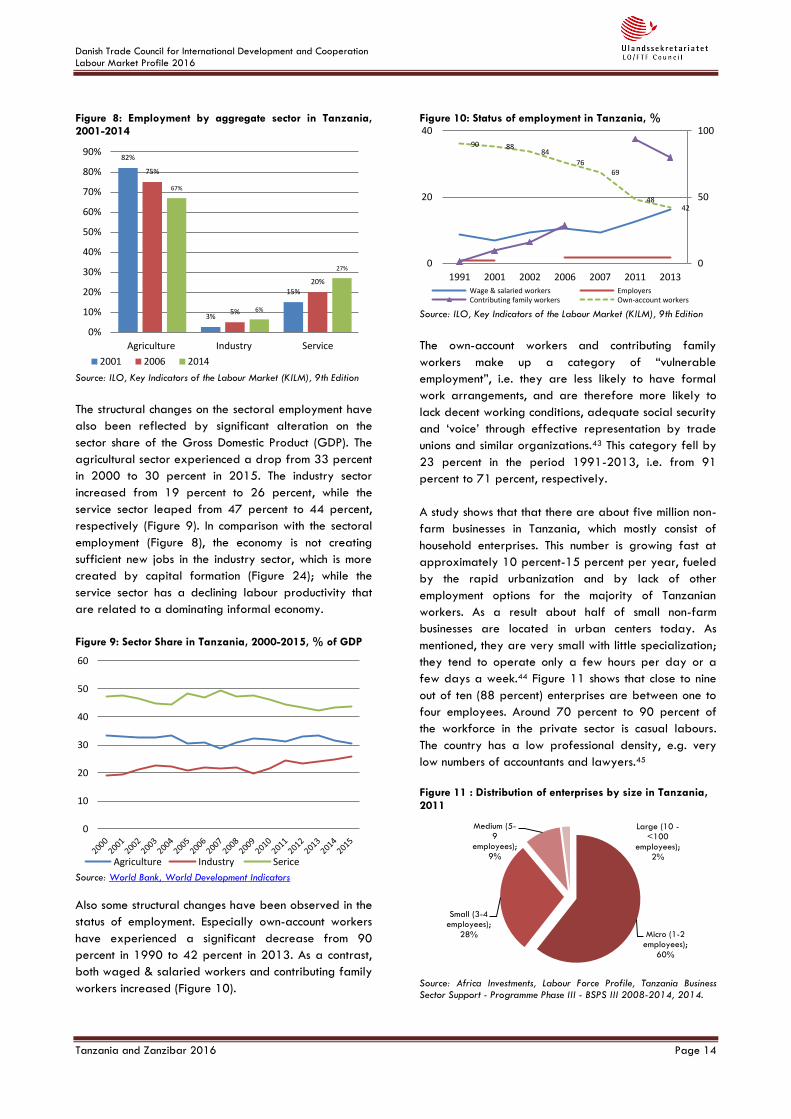
Danish Trade Council for International Development and Cooperation
Labour Market Profile 2016
Tanzania and Zanzibar 2016 Page 14
Figure 8: Employment by aggregate sector in Tanzania, 2001-2014
Source: ILO, Key Indicators of the Labour Market (KILM), 9th Edition
The structural changes on the sectoral employment have
also been reflected by significant alteration on the
sector share of the Gross Domestic Product (GDP). The
agricultural sector experienced a drop from 33 percent
in 2000 to 30 percent in 2015. The industry sector
increased from 19 percent to 26 percent, while the
service sector leaped from 47 percent to 44 percent,
respectively (Figure 9). In comparison with the sectoral
employment (Figure 8), the economy is not creating
sufficient new jobs in the industry sector, which is more
created by capital formation (Figure 24); while the
service sector has a declining labour productivity that
are related to a dominating informal economy.
Figure 9: Sector Share in Tanzania, 2000-2015, % of GDP
Source: World Bank, World Development Indicators
Also some structural changes have been observed in the
status of employment. Especially own-account workers
have experienced a significant decrease from 90
percent in 1990 to 42 percent in 2013. As a contrast,
both waged & salaried workers and contributing family
workers increased (Figure 10).
Figure 10: Status of employment in Tanzania, %
Source: ILO, Key Indicators of the Labour Market (KILM), 9th Edition
The own-account workers and contributing family
workers make up a category of “vulnerable
employment”, i.e. they are less likely to have formal
work arrangements, and are therefore more likely to
lack decent working conditions, adequate social security
and ‘voice’ through effective representation by trade
unions and similar organizations.43 This category fell by
23 percent in the period 1991-2013, i.e. from 91
percent to 71 percent, respectively.
A study shows that that there are about five million non-
farm businesses in Tanzania, which mostly consist of
household enterprises. This number is growing fast at
approximately 10 percent-15 percent per year, fueled
by the rapid urbanization and by lack of other
employment options for the majority of Tanzanian
workers. As a result about half of small non-farm
businesses are located in urban centers today. As
mentioned, they are very small with little specialization;
they tend to operate only a few hours per day or a
few days a week.44 Figure 11 shows that close to nine
out of ten (88 percent) enterprises are between one to
four employees. Around 70 percent to 90 percent of
the workforce in the private sector is casual labours.
The country has a low professional density, e.g. very
low numbers of accountants and lawyers.45
Figure 11 : Distribution of enterprises by size in Tanzania, 2011
Source: Africa Investments, Labour Force Profile, Tanzania Business Sector Support - Programme Phase III - BSPS III 2008-2014, 2014.
82%
3%
15%
75%
5%
20%
67%
6%
27%
0%
10%
20%
30%
40%
50%
60%
70%
80%
90%
Agriculture Industry Service
2001 2006 2014
0
10
20
30
40
50
60
Agriculture Industry Serice
90 88 84
76 69
48 42
0
50
100
0
20
40
1991 2001 2002 2006 2007 2011 2013Wage & salaried workers EmployersContributing family workers Own-account workers
Micro (1-2 employees);
60%
Small (3-4 employees);
28%
Medium (5-9
employees); 9%
Large (10 - <100
employees); 2%
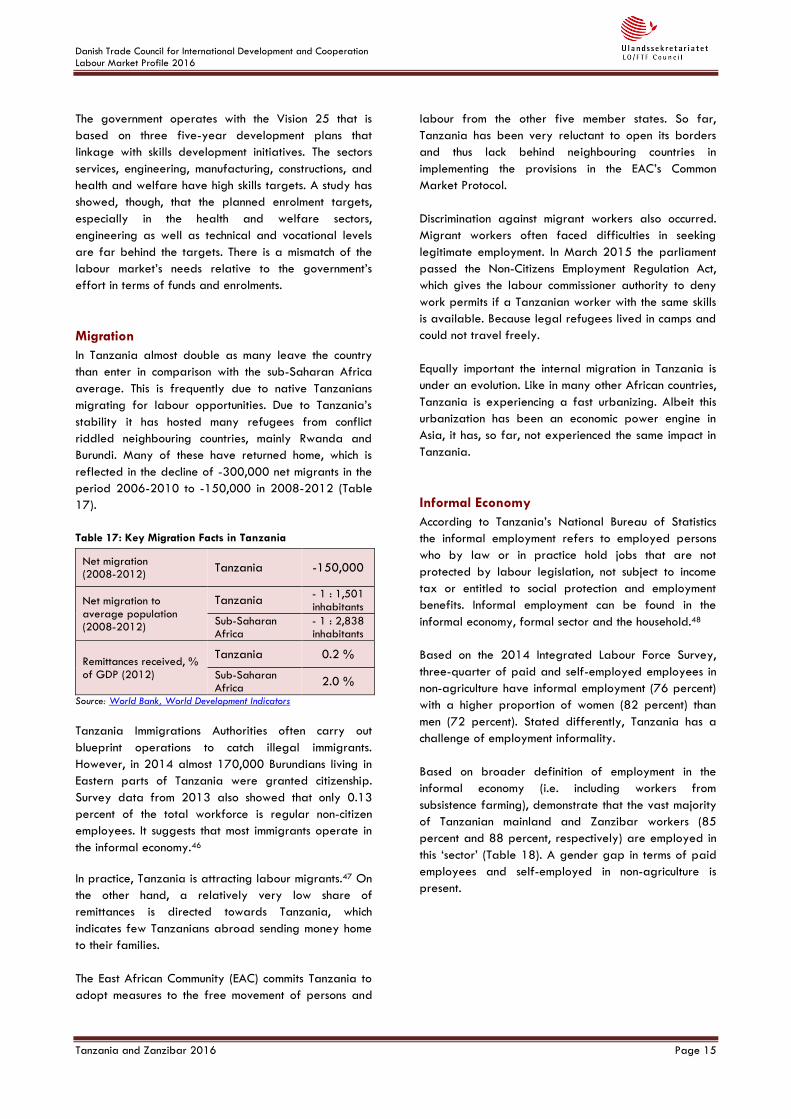
Danish Trade Council for International Development and Cooperation
Labour Market Profile 2016
Tanzania and Zanzibar 2016 Page 15
The government operates with the Vision 25 that is
based on three five-year development plans that
linkage with skills development initiatives. The sectors
services, engineering, manufacturing, constructions, and
health and welfare have high skills targets. A study has
showed, though, that the planned enrolment targets,
especially in the health and welfare sectors,
engineering as well as technical and vocational levels
are far behind the targets. There is a mismatch of the
labour market’s needs relative to the government’s
effort in terms of funds and enrolments.
Migration
In Tanzania almost double as many leave the country
than enter in comparison with the sub-Saharan Africa
average. This is frequently due to native Tanzanians
migrating for labour opportunities. Due to Tanzania’s
stability it has hosted many refugees from conflict
riddled neighbouring countries, mainly Rwanda and
Burundi. Many of these have returned home, which is
reflected in the decline of -300,000 net migrants in the
period 2006-2010 to -150,000 in 2008-2012 (Table
17).
Table 17: Key Migration Facts in Tanzania
Net migration (2008-2012)
Tanzania -150,000
Net migration to average population (2008-2012)
Tanzania - 1 : 1,501 inhabitants
Sub-Saharan Africa
- 1 : 2,838 inhabitants
Remittances received, % of GDP (2012)
Tanzania 0.2 %
Sub-Saharan Africa
2.0 %
Source: World Bank, World Development Indicators
Tanzania Immigrations Authorities often carry out
blueprint operations to catch illegal immigrants.
However, in 2014 almost 170,000 Burundians living in
Eastern parts of Tanzania were granted citizenship.
Survey data from 2013 also showed that only 0.13
percent of the total workforce is regular non-citizen
employees. It suggests that most immigrants operate in
the informal economy.46
In practice, Tanzania is attracting labour migrants.47 On
the other hand, a relatively very low share of
remittances is directed towards Tanzania, which
indicates few Tanzanians abroad sending money home
to their families.
The East African Community (EAC) commits Tanzania to
adopt measures to the free movement of persons and
labour from the other five member states. So far,
Tanzania has been very reluctant to open its borders
and thus lack behind neighbouring countries in
implementing the provisions in the EAC’s Common
Market Protocol.
Discrimination against migrant workers also occurred.
Migrant workers often faced difficulties in seeking
legitimate employment. In March 2015 the parliament
passed the Non-Citizens Employment Regulation Act,
which gives the labour commissioner authority to deny
work permits if a Tanzanian worker with the same skills
is available. Because legal refugees lived in camps and
could not travel freely.
Equally important the internal migration in Tanzania is
under an evolution. Like in many other African countries,
Tanzania is experiencing a fast urbanizing. Albeit this
urbanization has been an economic power engine in
Asia, it has, so far, not experienced the same impact in
Tanzania.
Informal Economy
According to Tanzania’s National Bureau of Statistics
the informal employment refers to employed persons
who by law or in practice hold jobs that are not
protected by labour legislation, not subject to income
tax or entitled to social protection and employment
benefits. Informal employment can be found in the
informal economy, formal sector and the household.48
Based on the 2014 Integrated Labour Force Survey,
three-quarter of paid and self-employed employees in
non-agriculture have informal employment (76 percent)
with a higher proportion of women (82 percent) than
men (72 percent). Stated differently, Tanzania has a
challenge of employment informality.
Based on broader definition of employment in the
informal economy (i.e. including workers from
subsistence farming), demonstrate that the vast majority
of Tanzanian mainland and Zanzibar workers (85
percent and 88 percent, respectively) are employed in
this ‘sector’ (Table 18). A gender gap in terms of paid
employees and self-employed in non-agriculture is
present.
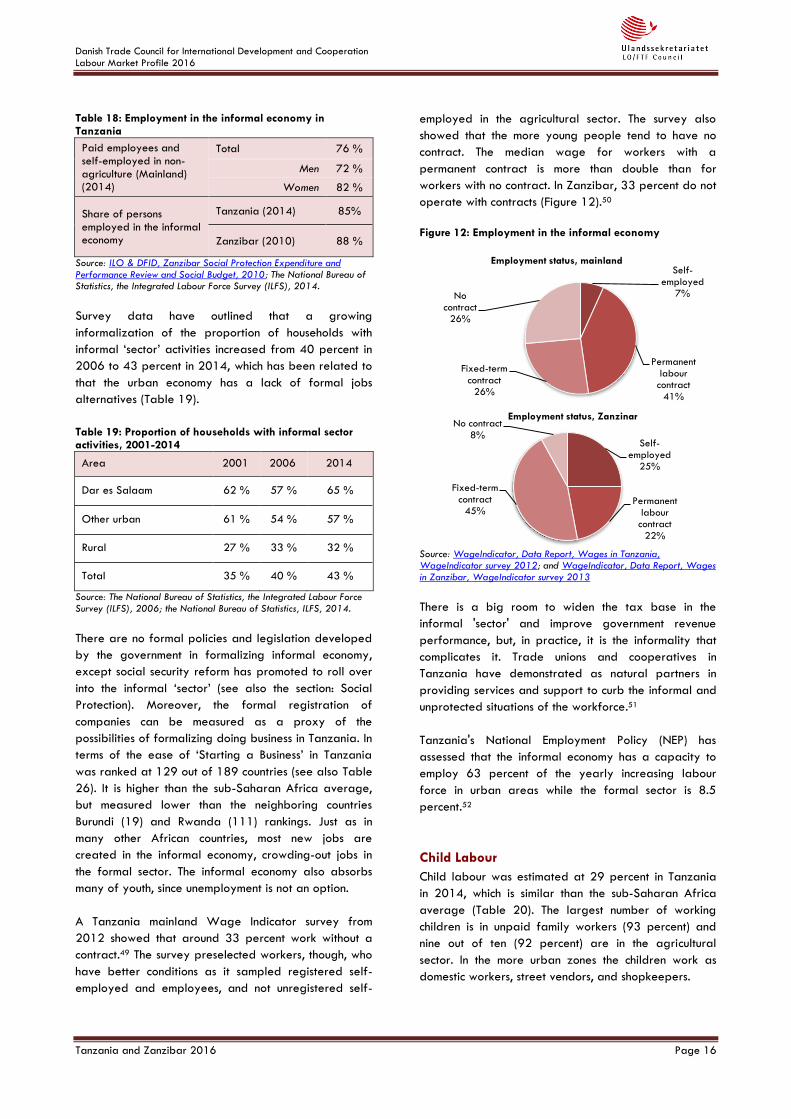
Danish Trade Council for International Development and Cooperation
Labour Market Profile 2016
Tanzania and Zanzibar 2016 Page 16
Table 18: Employment in the informal economy in Tanzania
Paid employees and self-employed in non-agriculture (Mainland) (2014)
Total 76 %
Men 72 %
Women 82 %
Share of persons employed in the informal economy
Tanzania (2014) 85%
Zanzibar (2010) 88 %
Source: ILO & DFID, Zanzibar Social Protection Expenditure and Performance Review and Social Budget, 2010; The National Bureau of Statistics, the Integrated Labour Force Survey (ILFS), 2014.
Survey data have outlined that a growing
informalization of the proportion of households with
informal ‘sector’ activities increased from 40 percent in
2006 to 43 percent in 2014, which has been related to
that the urban economy has a lack of formal jobs
alternatives (Table 19).
Table 19: Proportion of households with informal sector activities, 2001-2014
Area 2001 2006 2014
Dar es Salaam 62 % 57 % 65 %
Other urban 61 % 54 % 57 %
Rural 27 % 33 % 32 %
Total 35 % 40 % 43 %
Source: The National Bureau of Statistics, the Integrated Labour Force Survey (ILFS), 2006; the National Bureau of Statistics, ILFS, 2014.
There are no formal policies and legislation developed
by the government in formalizing informal economy,
except social security reform has promoted to roll over
into the informal ‘sector’ (see also the section: Social
Protection). Moreover, the formal registration of
companies can be measured as a proxy of the
possibilities of formalizing doing business in Tanzania. In
terms of the ease of ‘Starting a Business’ in Tanzania
was ranked at 129 out of 189 countries (see also Table
26). It is higher than the sub-Saharan Africa average,
but measured lower than the neighboring countries
Burundi (19) and Rwanda (111) rankings. Just as in
many other African countries, most new jobs are
created in the informal economy, crowding-out jobs in
the formal sector. The informal economy also absorbs
many of youth, since unemployment is not an option.
A Tanzania mainland Wage Indicator survey from
2012 showed that around 33 percent work without a
contract.49 The survey preselected workers, though, who
have better conditions as it sampled registered self-
employed and employees, and not unregistered self-
employed in the agricultural sector. The survey also
showed that the more young people tend to have no
contract. The median wage for workers with a
permanent contract is more than double than for
workers with no contract. In Zanzibar, 33 percent do not
operate with contracts (Figure 12).50
Figure 12: Employment in the informal economy
Source: WageIndicator, Data Report, Wages in Tanzania, WageIndicator survey 2012; and WageIndicator, Data Report, Wages in Zanzibar, WageIndicator survey 2013
There is a big room to widen the tax base in the
informal 'sector' and improve government revenue
performance, but, in practice, it is the informality that
complicates it. Trade unions and cooperatives in
Tanzania have demonstrated as natural partners in
providing services and support to curb the informal and
unprotected situations of the workforce.51
Tanzania's National Employment Policy (NEP) has
assessed that the informal economy has a capacity to
employ 63 percent of the yearly increasing labour
force in urban areas while the formal sector is 8.5
percent.52
Child Labour
Child labour was estimated at 29 percent in Tanzania
in 2014, which is similar than the sub-Saharan Africa
average (Table 20). The largest number of working
children is in unpaid family workers (93 percent) and
nine out of ten (92 percent) are in the agricultural
sector. In the more urban zones the children work as
domestic workers, street vendors, and shopkeepers.
Self-employed
7%
Permanent labour contract
41%
Fixed-term contract
26%
No contract
26%
Employment status, mainland
Self-employed
25%
Permanent labour contract
22%
Fixed-term contract
45%
No contract 8%
Employment status, Zanzinar
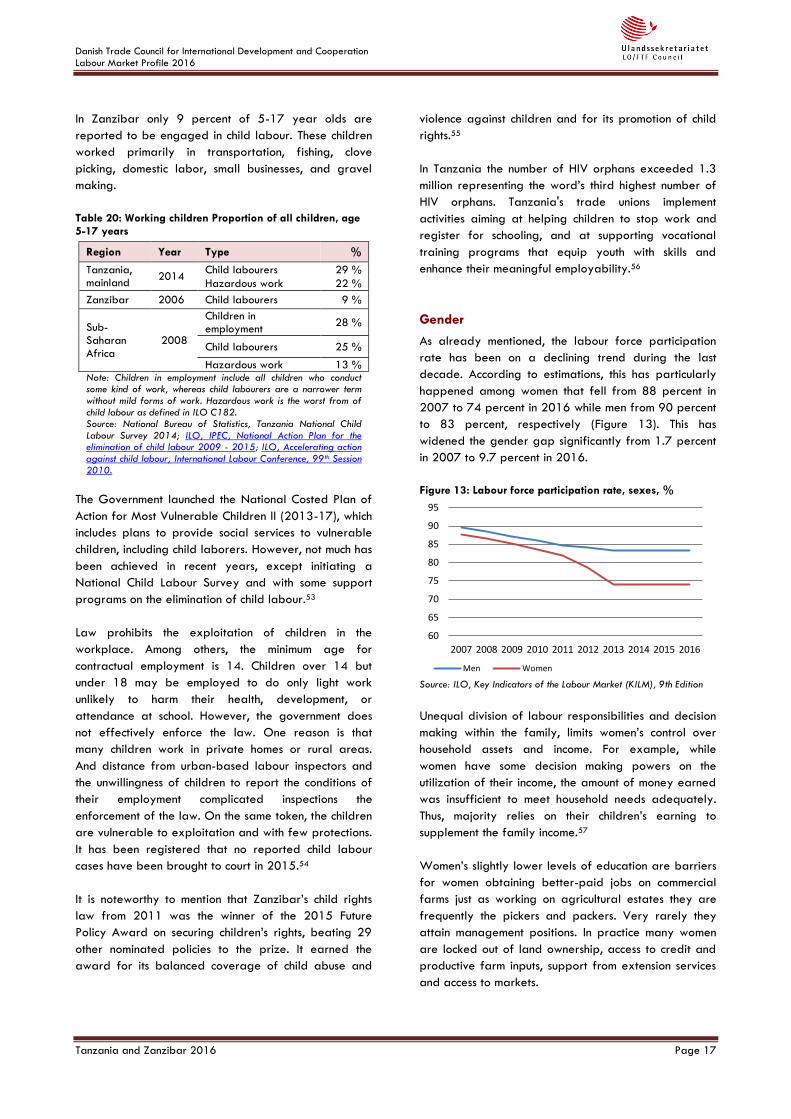
Danish Trade Council for International Development and Cooperation
Labour Market Profile 2016
Tanzania and Zanzibar 2016 Page 17
In Zanzibar only 9 percent of 5-17 year olds are
reported to be engaged in child labour. These children
worked primarily in transportation, fishing, clove
picking, domestic labor, small businesses, and gravel
making.
Table 20: Working children Proportion of all children, age 5-17 years
Region Year Type %
Tanzania, mainland
2014 Child labourers 29 %
Hazardous work 22 %
Zanzibar 2006 Child labourers 9 %
Sub-Saharan Africa
2008
Children in employment
28 %
Child labourers 25 %
Hazardous work 13 % Note: Children in employment include all children who conduct some kind of work, whereas child labourers are a narrower term without mild forms of work. Hazardous work is the worst from of child labour as defined in ILO C182. Source: National Bureau of Statistics, Tanzania National Child Labour Survey 2014; ILO, IPEC, National Action Plan for the elimination of child labour 2009 - 2015; ILO, Accelerating action against child labour, International Labour Conference, 99th Session 2010.
The Government launched the National Costed Plan of
Action for Most Vulnerable Children II (2013-17), which
includes plans to provide social services to vulnerable
children, including child laborers. However, not much has
been achieved in recent years, except initiating a
National Child Labour Survey and with some support
programs on the elimination of child labour.53
Law prohibits the exploitation of children in the
workplace. Among others, the minimum age for
contractual employment is 14. Children over 14 but
under 18 may be employed to do only light work
unlikely to harm their health, development, or
attendance at school. However, the government does
not effectively enforce the law. One reason is that
many children work in private homes or rural areas.
And distance from urban-based labour inspectors and
the unwillingness of children to report the conditions of
their employment complicated inspections the
enforcement of the law. On the same token, the children
are vulnerable to exploitation and with few protections.
It has been registered that no reported child labour
cases have been brought to court in 2015.54
It is noteworthy to mention that Zanzibar’s child rights
law from 2011 was the winner of the 2015 Future
Policy Award on securing children’s rights, beating 29
other nominated policies to the prize. It earned the
award for its balanced coverage of child abuse and
violence against children and for its promotion of child
rights.55
In Tanzania the number of HIV orphans exceeded 1.3
million representing the word’s third highest number of
HIV orphans. Tanzania's trade unions implement
activities aiming at helping children to stop work and
register for schooling, and at supporting vocational
training programs that equip youth with skills and
enhance their meaningful employability.56
Gender
As already mentioned, the labour force participation
rate has been on a declining trend during the last
decade. According to estimations, this has particularly
happened among women that fell from 88 percent in
2007 to 74 percent in 2016 while men from 90 percent
to 83 percent, respectively (Figure 13). This has
widened the gender gap significantly from 1.7 percent
in 2007 to 9.7 percent in 2016.
Figure 13: Labour force participation rate, sexes, %
Source: ILO, Key Indicators of the Labour Market (KILM), 9th Edition
Unequal division of labour responsibilities and decision
making within the family, limits women’s control over
household assets and income. For example, while
women have some decision making powers on the
utilization of their income, the amount of money earned
was insufficient to meet household needs adequately.
Thus, majority relies on their children’s earning to
supplement the family income.57
Women’s slightly lower levels of education are barriers
for women obtaining better-paid jobs on commercial
farms just as working on agricultural estates they are
frequently the pickers and packers. Very rarely they
attain management positions. In practice many women
are locked out of land ownership, access to credit and
productive farm inputs, support from extension services
and access to markets.
60
65
70
75
80
85
90
95
2007 2008 2009 2010 2011 2012 2013 2014 2015 2016
Men Women
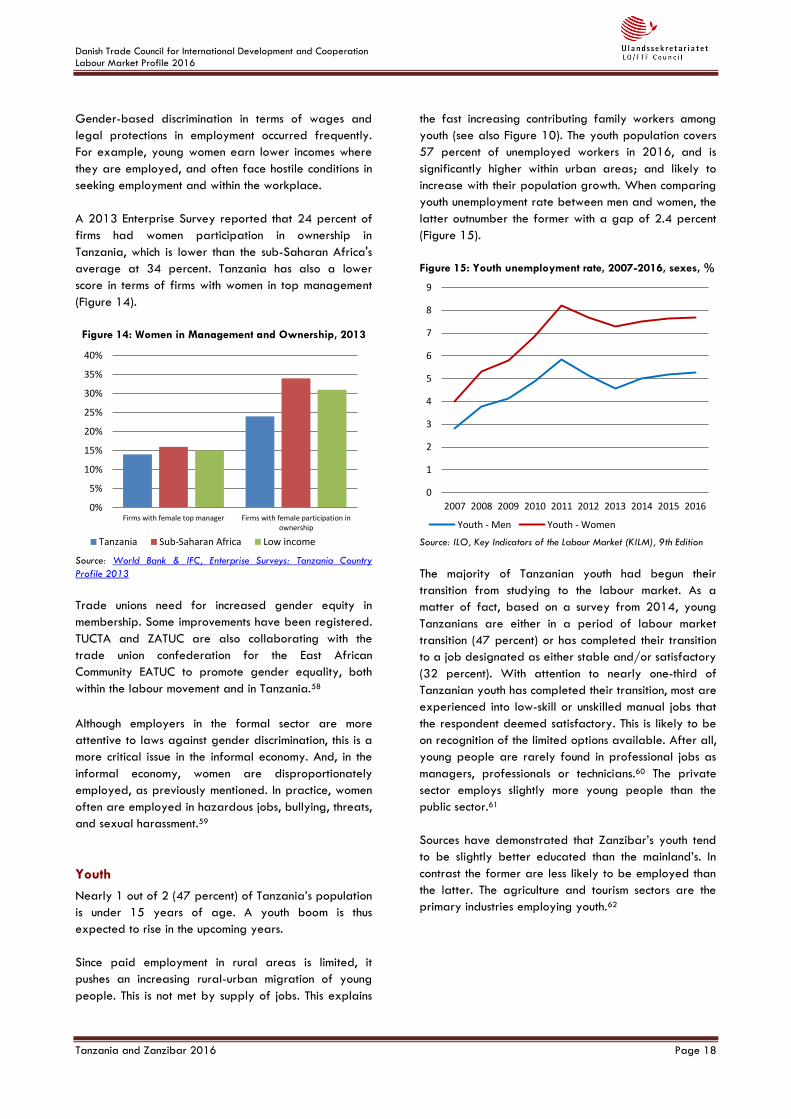
Danish Trade Council for International Development and Cooperation
Labour Market Profile 2016
Tanzania and Zanzibar 2016 Page 18
Gender-based discrimination in terms of wages and
legal protections in employment occurred frequently.
For example, young women earn lower incomes where
they are employed, and often face hostile conditions in
seeking employment and within the workplace.
A 2013 Enterprise Survey reported that 24 percent of
firms had women participation in ownership in
Tanzania, which is lower than the sub-Saharan Africa's
average at 34 percent. Tanzania has also a lower
score in terms of firms with women in top management
(Figure 14).
Figure 14: Women in Management and Ownership, 2013
Source: World Bank & IFC, Enterprise Surveys: Tanzania Country
Profile 2013
Trade unions need for increased gender equity in
membership. Some improvements have been registered.
TUCTA and ZATUC are also collaborating with the
trade union confederation for the East African
Community EATUC to promote gender equality, both
within the labour movement and in Tanzania.58
Although employers in the formal sector are more
attentive to laws against gender discrimination, this is a
more critical issue in the informal economy. And, in the
informal economy, women are disproportionately
employed, as previously mentioned. In practice, women
often are employed in hazardous jobs, bullying, threats,
and sexual harassment.59
Youth
Nearly 1 out of 2 (47 percent) of Tanzania’s population
is under 15 years of age. A youth boom is thus
expected to rise in the upcoming years.
Since paid employment in rural areas is limited, it
pushes an increasing rural-urban migration of young
people. This is not met by supply of jobs. This explains
the fast increasing contributing family workers among
youth (see also Figure 10). The youth population covers
57 percent of unemployed workers in 2016, and is
significantly higher within urban areas; and likely to
increase with their population growth. When comparing
youth unemployment rate between men and women, the
latter outnumber the former with a gap of 2.4 percent
(Figure 15).
Figure 15: Youth unemployment rate, 2007-2016, sexes, %
Source: ILO, Key Indicators of the Labour Market (KILM), 9th Edition
The majority of Tanzanian youth had begun their
transition from studying to the labour market. As a
matter of fact, based on a survey from 2014, young
Tanzanians are either in a period of labour market
transition (47 percent) or has completed their transition
to a job designated as either stable and/or satisfactory
(32 percent). With attention to nearly one-third of
Tanzanian youth has completed their transition, most are
experienced into low-skill or unskilled manual jobs that
the respondent deemed satisfactory. This is likely to be
on recognition of the limited options available. After all,
young people are rarely found in professional jobs as
managers, professionals or technicians.60 The private
sector employs slightly more young people than the
public sector.61
Sources have demonstrated that Zanzibar’s youth tend
to be slightly better educated than the mainland’s. In
contrast the former are less likely to be employed than
the latter. The agriculture and tourism sectors are the
primary industries employing youth.62
0%
5%
10%
15%
20%
25%
30%
35%
40%
Firms with female top manager Firms with female participation inownership
Tanzania Sub-Saharan Africa Low income
0
1
2
3
4
5
6
7
8
9
2007 2008 2009 2010 2011 2012 2013 2014 2015 2016
Youth - Men Youth - Women
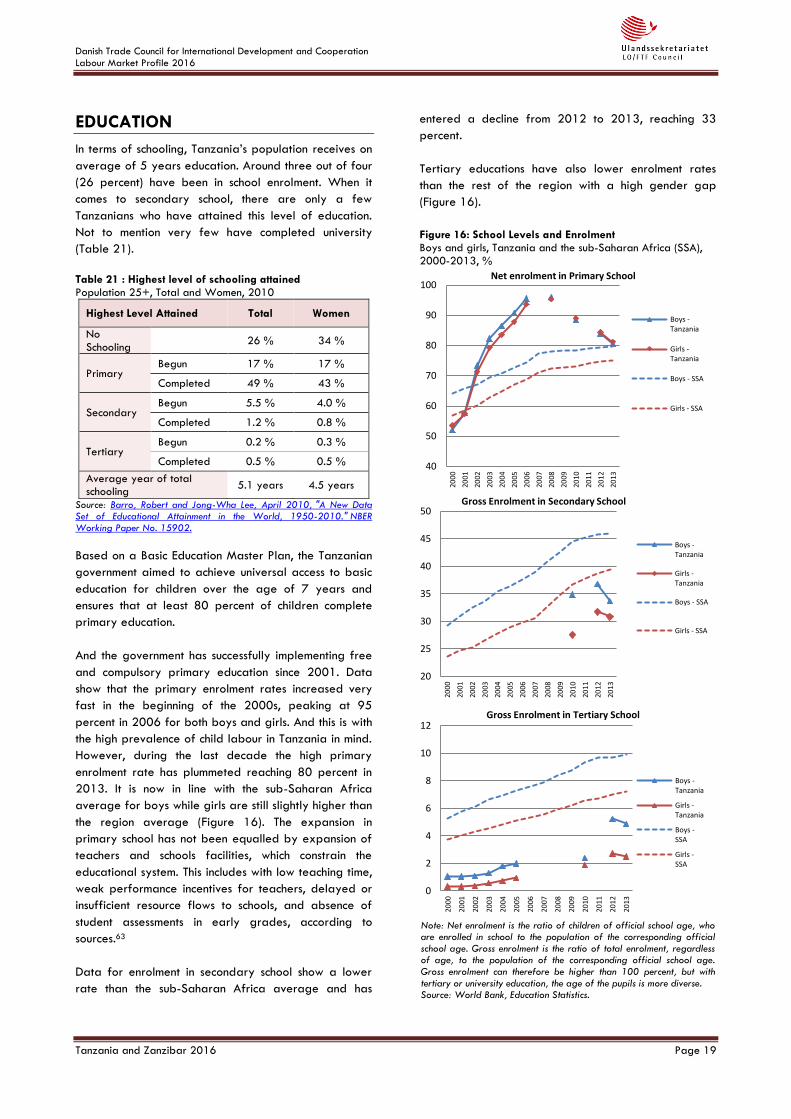
Danish Trade Council for International Development and Cooperation
Labour Market Profile 2016
Tanzania and Zanzibar 2016 Page 19
EDUCATION
In terms of schooling, Tanzania’s population receives on
average of 5 years education. Around three out of four
(26 percent) have been in school enrolment. When it
comes to secondary school, there are only a few
Tanzanians who have attained this level of education.
Not to mention very few have completed university
(Table 21).
Table 21 : Highest level of schooling attained Population 25+, Total and Women, 2010
Highest Level Attained Total Women
No Schooling
26 % 34 %
Primary Begun 17 % 17 %
Completed 49 % 43 %
Secondary Begun 5.5 % 4.0 %
Completed 1.2 % 0.8 %
Tertiary Begun 0.2 % 0.3 %
Completed 0.5 % 0.5 %
Average year of total schooling
5.1 years 4.5 years
Source: Barro, Robert and Jong-Wha Lee, April 2010, "A New Data Set of Educational Attainment in the World, 1950-2010." NBER Working Paper No. 15902.
Based on a Basic Education Master Plan, the Tanzanian
government aimed to achieve universal access to basic
education for children over the age of 7 years and
ensures that at least 80 percent of children complete
primary education.
And the government has successfully implementing free
and compulsory primary education since 2001. Data
show that the primary enrolment rates increased very
fast in the beginning of the 2000s, peaking at 95
percent in 2006 for both boys and girls. And this is with
the high prevalence of child labour in Tanzania in mind.
However, during the last decade the high primary
enrolment rate has plummeted reaching 80 percent in
2013. It is now in line with the sub-Saharan Africa
average for boys while girls are still slightly higher than
the region average (Figure 16). The expansion in
primary school has not been equalled by expansion of
teachers and schools facilities, which constrain the
educational system. This includes with low teaching time,
weak performance incentives for teachers, delayed or
insufficient resource flows to schools, and absence of
student assessments in early grades, according to
sources.63
Data for enrolment in secondary school show a lower
rate than the sub-Saharan Africa average and has
entered a decline from 2012 to 2013, reaching 33
percent.
Tertiary educations have also lower enrolment rates
than the rest of the region with a high gender gap
(Figure 16).
Figure 16: School Levels and Enrolment Boys and girls, Tanzania and the sub-Saharan Africa (SSA), 2000-2013, %
Note: Net enrolment is the ratio of children of official school age, who are enrolled in school to the population of the corresponding official school age. Gross enrolment is the ratio of total enrolment, regardless of age, to the population of the corresponding official school age. Gross enrolment can therefore be higher than 100 percent, but with tertiary or university education, the age of the pupils is more diverse. Source: World Bank, Education Statistics.
40
50
60
70
80
90
100
2000
2001
2002
2003
2004
2005
2006
2007
2008
2009
2010
2011
2012
2013
Net enrolment in Primary School
Boys -Tanzania
Girls -Tanzania
Boys - SSA
Girls - SSA
20
25
30
35
40
45
50
2000
2001
2002
2003
2004
2005
2006
2007
2008
2009
2010
2011
2012
2013
Gross Enrolment in Secondary School
Boys -Tanzania
Girls -Tanzania
Boys - SSA
Girls - SSA
0
2
4
6
8
10
12
2000
2001
2002
2003
2004
2005
2006
2007
2008
2009
2010
2011
2012
2013
Gross Enrolment in Tertiary School
Boys -Tanzania
Girls -Tanzania
Boys -SSA
Girls -SSA
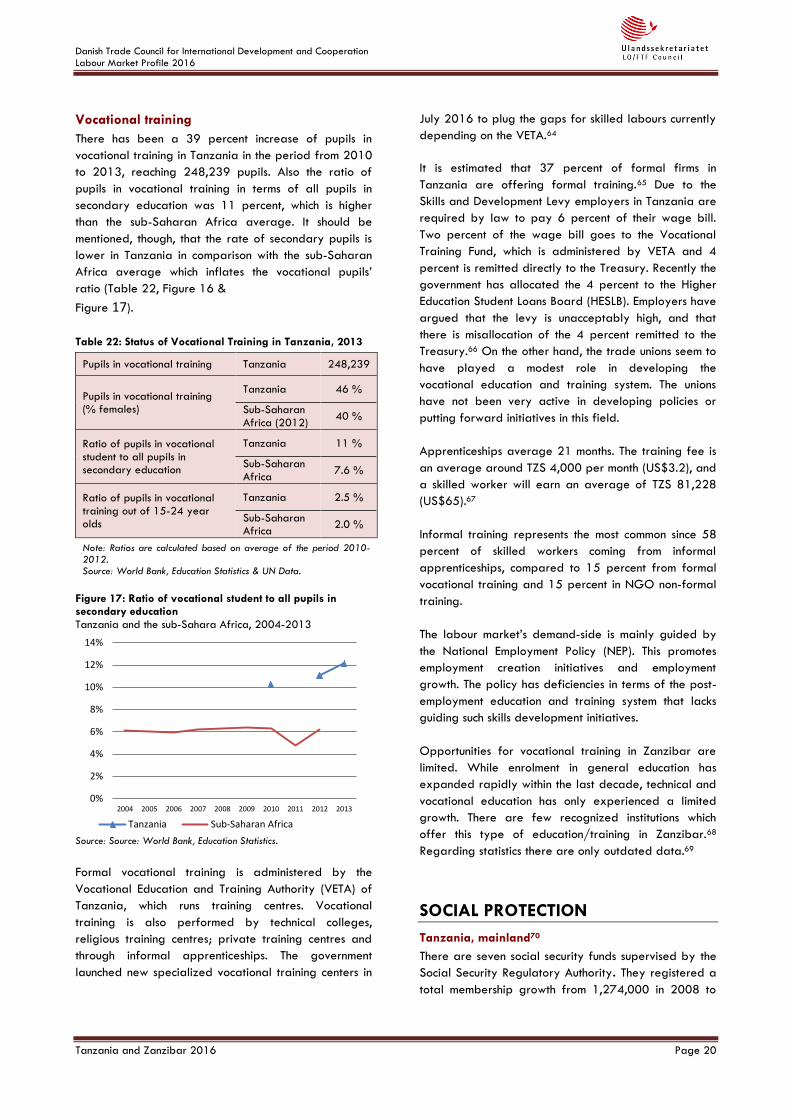
Danish Trade Council for International Development and Cooperation
Labour Market Profile 2016
Tanzania and Zanzibar 2016 Page 20
Vocational training
There has been a 39 percent increase of pupils in
vocational training in Tanzania in the period from 2010
to 2013, reaching 248,239 pupils. Also the ratio of
pupils in vocational training in terms of all pupils in
secondary education was 11 percent, which is higher
than the sub-Saharan Africa average. It should be
mentioned, though, that the rate of secondary pupils is
lower in Tanzania in comparison with the sub-Saharan
Africa average which inflates the vocational pupils’
ratio (Table 22, Figure 16 &
Figure 17).
Table 22: Status of Vocational Training in Tanzania, 2013
Pupils in vocational training Tanzania 248,239
Pupils in vocational training (% females)
Tanzania 46 %
Sub-Saharan Africa (2012)
40 %
Ratio of pupils in vocational student to all pupils in secondary education
Tanzania 11 %
Sub-Saharan Africa
7.6 %
Ratio of pupils in vocational training out of 15-24 year olds
Tanzania 2.5 %
Sub-Saharan Africa
2.0 %
Note: Ratios are calculated based on average of the period 2010-2012. Source: World Bank, Education Statistics & UN Data.
Figure 17: Ratio of vocational student to all pupils in secondary education Tanzania and the sub-Sahara Africa, 2004-2013
Source: Source: World Bank, Education Statistics.
Formal vocational training is administered by the
Vocational Education and Training Authority (VETA) of
Tanzania, which runs training centres. Vocational
training is also performed by technical colleges,
religious training centres; private training centres and
through informal apprenticeships. The government
launched new specialized vocational training centers in
July 2016 to plug the gaps for skilled labours currently
depending on the VETA.64
It is estimated that 37 percent of formal firms in
Tanzania are offering formal training.65 Due to the
Skills and Development Levy employers in Tanzania are
required by law to pay 6 percent of their wage bill.
Two percent of the wage bill goes to the Vocational
Training Fund, which is administered by VETA and 4
percent is remitted directly to the Treasury. Recently the
government has allocated the 4 percent to the Higher
Education Student Loans Board (HESLB). Employers have
argued that the levy is unacceptably high, and that
there is misallocation of the 4 percent remitted to the
Treasury.66 On the other hand, the trade unions seem to
have played a modest role in developing the
vocational education and training system. The unions
have not been very active in developing policies or
putting forward initiatives in this field.
Apprenticeships average 21 months. The training fee is
an average around TZS 4,000 per month (US$3.2), and
a skilled worker will earn an average of TZS 81,228
(US$65).67
Informal training represents the most common since 58
percent of skilled workers coming from informal
apprenticeships, compared to 15 percent from formal
vocational training and 15 percent in NGO non-formal
training.
The labour market’s demand-side is mainly guided by
the National Employment Policy (NEP). This promotes
employment creation initiatives and employment
growth. The policy has deficiencies in terms of the post-
employment education and training system that lacks
guiding such skills development initiatives.
Opportunities for vocational training in Zanzibar are
limited. While enrolment in general education has
expanded rapidly within the last decade, technical and
vocational education has only experienced a limited
growth. There are few recognized institutions which
offer this type of education/training in Zanzibar.68
Regarding statistics there are only outdated data.69
SOCIAL PROTECTION
Tanzania, mainland70
There are seven social security funds supervised by the
Social Security Regulatory Authority. They registered a
total membership growth from 1,274,000 in 2008 to
0%
2%
4%
6%
8%
10%
12%
14%
2004 2005 2006 2007 2008 2009 2010 2011 2012 2013
Tanzania Sub-Saharan Africa
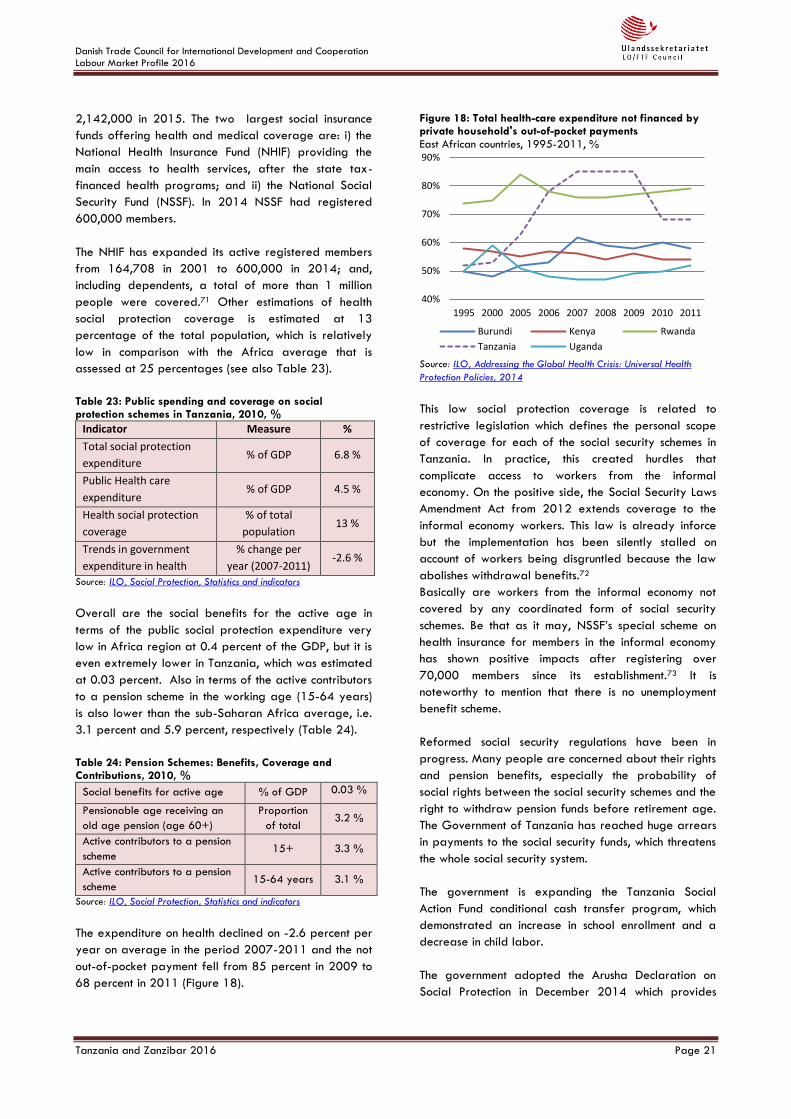
Danish Trade Council for International Development and Cooperation
Labour Market Profile 2016
Tanzania and Zanzibar 2016 Page 21
2,142,000 in 2015. The two largest social insurance
funds offering health and medical coverage are: i) the
National Health Insurance Fund (NHIF) providing the
main access to health services, after the state tax-
financed health programs; and ii) the National Social
Security Fund (NSSF). In 2014 NSSF had registered
600,000 members.
The NHIF has expanded its active registered members
from 164,708 in 2001 to 600,000 in 2014; and,
including dependents, a total of more than 1 million
people were covered.71 Other estimations of health
social protection coverage is estimated at 13
percentage of the total population, which is relatively
low in comparison with the Africa average that is
assessed at 25 percentages (see also Table 23).
Table 23: Public spending and coverage on social protection schemes in Tanzania, 2010, %
Indicator Measure %
Total social protection
expenditure % of GDP 6.8 %
Public Health care
expenditure % of GDP 4.5 %
Health social protection
coverage
% of total
population 13 %
Trends in government
expenditure in health
% change per
year (2007-2011) -2.6 %
Source: ILO, Social Protection, Statistics and indicators
Overall are the social benefits for the active age in
terms of the public social protection expenditure very
low in Africa region at 0.4 percent of the GDP, but it is
even extremely lower in Tanzania, which was estimated
at 0.03 percent. Also in terms of the active contributors
to a pension scheme in the working age (15-64 years)
is also lower than the sub-Saharan Africa average, i.e.
3.1 percent and 5.9 percent, respectively (Table 24).
Table 24: Pension Schemes: Benefits, Coverage and Contributions, 2010, %
Social benefits for active age % of GDP 0.03 %
Pensionable age receiving an
old age pension (age 60+)
Proportion
of total 3.2 %
Active contributors to a pension
scheme 15+ 3.3 %
Active contributors to a pension
scheme 15-64 years 3.1 %
Source: ILO, Social Protection, Statistics and indicators
The expenditure on health declined on -2.6 percent per
year on average in the period 2007-2011 and the not
out-of-pocket payment fell from 85 percent in 2009 to
68 percent in 2011 (Figure 18).
Figure 18: Total health-care expenditure not financed by private household's out-of-pocket payments East African countries, 1995-2011, %
Source: ILO, Addressing the Global Health Crisis: Universal Health
Protection Policies, 2014
This low social protection coverage is related to
restrictive legislation which defines the personal scope
of coverage for each of the social security schemes in
Tanzania. In practice, this created hurdles that
complicate access to workers from the informal
economy. On the positive side, the Social Security Laws
Amendment Act from 2012 extends coverage to the
informal economy workers. This law is already inforce
but the implementation has been silently stalled on
account of workers being disgruntled because the law
abolishes withdrawal benefits.72
Basically are workers from the informal economy not
covered by any coordinated form of social security
schemes. Be that as it may, NSSF’s special scheme on
health insurance for members in the informal economy
has shown positive impacts after registering over
70,000 members since its establishment.73 It is
noteworthy to mention that there is no unemployment
benefit scheme.
Reformed social security regulations have been in
progress. Many people are concerned about their rights
and pension benefits, especially the probability of
social rights between the social security schemes and the
right to withdraw pension funds before retirement age.
The Government of Tanzania has reached huge arrears
in payments to the social security funds, which threatens
the whole social security system.
The government is expanding the Tanzania Social
Action Fund conditional cash transfer program, which
demonstrated an increase in school enrollment and a
decrease in child labor.
The government adopted the Arusha Declaration on
Social Protection in December 2014 which provides
40%
50%
60%
70%
80%
90%
1995 2000 2005 2006 2007 2008 2009 2010 2011
Burundi Kenya Rwanda
Tanzania Uganda
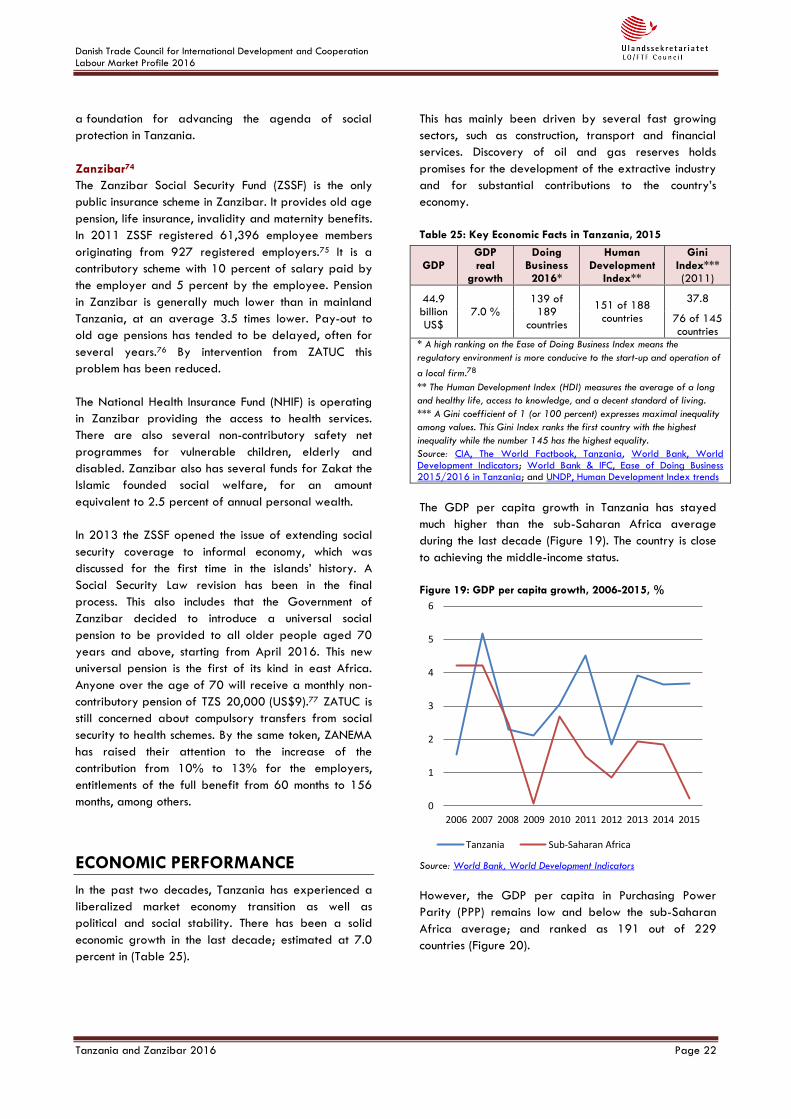
Danish Trade Council for International Development and Cooperation
Labour Market Profile 2016
Tanzania and Zanzibar 2016 Page 22
a foundation for advancing the agenda of social
protection in Tanzania.
Zanzibar74
The Zanzibar Social Security Fund (ZSSF) is the only
public insurance scheme in Zanzibar. It provides old age
pension, life insurance, invalidity and maternity benefits.
In 2011 ZSSF registered 61,396 employee members
originating from 927 registered employers.75 It is a
contributory scheme with 10 percent of salary paid by
the employer and 5 percent by the employee. Pension
in Zanzibar is generally much lower than in mainland
Tanzania, at an average 3.5 times lower. Pay-out to
old age pensions has tended to be delayed, often for
several years.76 By intervention from ZATUC this
problem has been reduced.
The National Health Insurance Fund (NHIF) is operating
in Zanzibar providing the access to health services.
There are also several non-contributory safety net
programmes for vulnerable children, elderly and
disabled. Zanzibar also has several funds for Zakat the
Islamic founded social welfare, for an amount
equivalent to 2.5 percent of annual personal wealth.
In 2013 the ZSSF opened the issue of extending social
security coverage to informal economy, which was
discussed for the first time in the islands’ history. A
Social Security Law revision has been in the final
process. This also includes that the Government of
Zanzibar decided to introduce a universal social
pension to be provided to all older people aged 70
years and above, starting from April 2016. This new
universal pension is the first of its kind in east Africa.
Anyone over the age of 70 will receive a monthly non-
contributory pension of TZS 20,000 (US$9).77 ZATUC is
still concerned about compulsory transfers from social
security to health schemes. By the same token, ZANEMA
has raised their attention to the increase of the
contribution from 10% to 13% for the employers,
entitlements of the full benefit from 60 months to 156
months, among others.
ECONOMIC PERFORMANCE
In the past two decades, Tanzania has experienced a
liberalized market economy transition as well as
political and social stability. There has been a solid
economic growth in the last decade; estimated at 7.0
percent in (Table 25).
This has mainly been driven by several fast growing
sectors, such as construction, transport and financial
services. Discovery of oil and gas reserves holds
promises for the development of the extractive industry
and for substantial contributions to the country’s
economy.
Table 25: Key Economic Facts in Tanzania, 2015
GDP GDP real
growth
Doing Business 2016*
Human Development
Index**
Gini Index*** (2011)
44.9 billion US$
7.0 % 139 of
189 countries
151 of 188 countries
37.8
76 of 145 countries
* A high ranking on the Ease of Doing Business Index means the
regulatory environment is more conducive to the start-up and operation of
a local firm.78
** The Human Development Index (HDI) measures the average of a long
and healthy life, access to knowledge, and a decent standard of living.
*** A Gini coefficient of 1 (or 100 percent) expresses maximal inequality
among values. This Gini Index ranks the first country with the highest
inequality while the number 145 has the highest equality.
Source: CIA, The World Factbook, Tanzania, World Bank, World Development Indicators; World Bank & IFC, Ease of Doing Business 2015/2016 in Tanzania; and UNDP, Human Development Index trends
The GDP per capita growth in Tanzania has stayed
much higher than the sub-Saharan Africa average
during the last decade (Figure 19). The country is close
to achieving the middle-income status.
Figure 19: GDP per capita growth, 2006-2015, %
Source: World Bank, World Development Indicators
However, the GDP per capita in Purchasing Power
Parity (PPP) remains low and below the sub-Saharan
Africa average; and ranked as 191 out of 229
countries (Figure 20).
0
1
2
3
4
5
6
2006 2007 2008 2009 2010 2011 2012 2013 2014 2015
Tanzania Sub-Saharan Africa
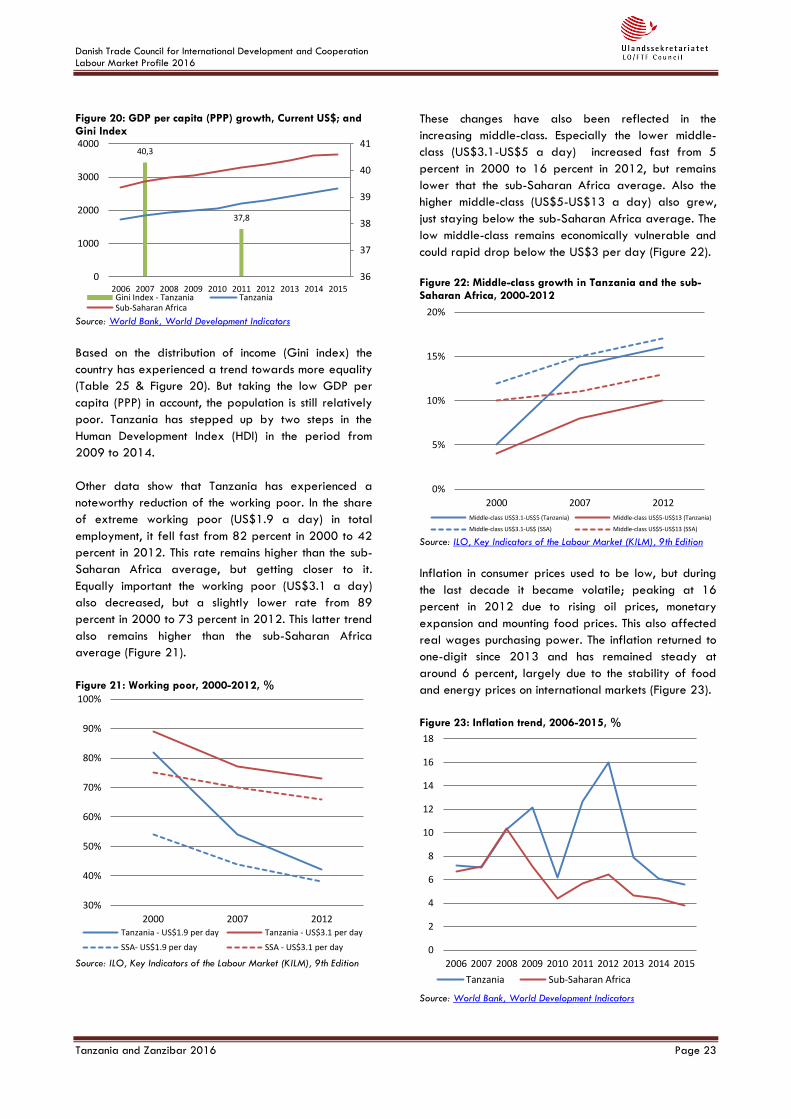
Danish Trade Council for International Development and Cooperation
Labour Market Profile 2016
Tanzania and Zanzibar 2016 Page 23
Figure 20: GDP per capita (PPP) growth, Current US$; and Gini Index
Source: World Bank, World Development Indicators
Based on the distribution of income (Gini index) the
country has experienced a trend towards more equality
(Table 25 & Figure 20). But taking the low GDP per
capita (PPP) in account, the population is still relatively
poor. Tanzania has stepped up by two steps in the
Human Development Index (HDI) in the period from
2009 to 2014.
Other data show that Tanzania has experienced a
noteworthy reduction of the working poor. In the share
of extreme working poor (US$1.9 a day) in total
employment, it fell fast from 82 percent in 2000 to 42
percent in 2012. This rate remains higher than the sub-
Saharan Africa average, but getting closer to it.
Equally important the working poor (US$3.1 a day)
also decreased, but a slightly lower rate from 89
percent in 2000 to 73 percent in 2012. This latter trend
also remains higher than the sub-Saharan Africa
average (Figure 21).
Figure 21: Working poor, 2000-2012, %
Source: ILO, Key Indicators of the Labour Market (KILM), 9th Edition
These changes have also been reflected in the
increasing middle-class. Especially the lower middle-
class (US$3.1-US$5 a day) increased fast from 5
percent in 2000 to 16 percent in 2012, but remains
lower that the sub-Saharan Africa average. Also the
higher middle-class (US$5-US$13 a day) also grew,
just staying below the sub-Saharan Africa average. The
low middle-class remains economically vulnerable and
could rapid drop below the US$3 per day (Figure 22).
Figure 22: Middle-class growth in Tanzania and the sub-Saharan Africa, 2000-2012
Source: ILO, Key Indicators of the Labour Market (KILM), 9th Edition
Inflation in consumer prices used to be low, but during
the last decade it became volatile; peaking at 16
percent in 2012 due to rising oil prices, monetary
expansion and mounting food prices. This also affected
real wages purchasing power. The inflation returned to
one-digit since 2013 and has remained steady at
around 6 percent, largely due to the stability of food
and energy prices on international markets (Figure 23).
Figure 23: Inflation trend, 2006-2015, %
Source: World Bank, World Development Indicators
40,3
37,8
36
37
38
39
40
41
0
1000
2000
3000
4000
2006 2007 2008 2009 2010 2011 2012 2013 2014 2015Gini Index - Tanzania TanzaniaSub-Saharan Africa
30%
40%
50%
60%
70%
80%
90%
100%
2000 2007 2012Tanzania - US$1.9 per day Tanzania - US$3.1 per day
SSA- US$1.9 per day SSA - US$3.1 per day
0%
5%
10%
15%
20%
2000 2007 2012
Middle-class US$3.1-US$5 (Tanzania) Middle-class US$5-US$13 (Tanzania)
Middle-class US$3.1-US$ (SSA) Middle-class US$5-US$13 (SSA)
0
2
4
6
8
10
12
14
16
18
2006 2007 2008 2009 2010 2011 2012 2013 2014 2015
Tanzania Sub-Saharan Africa
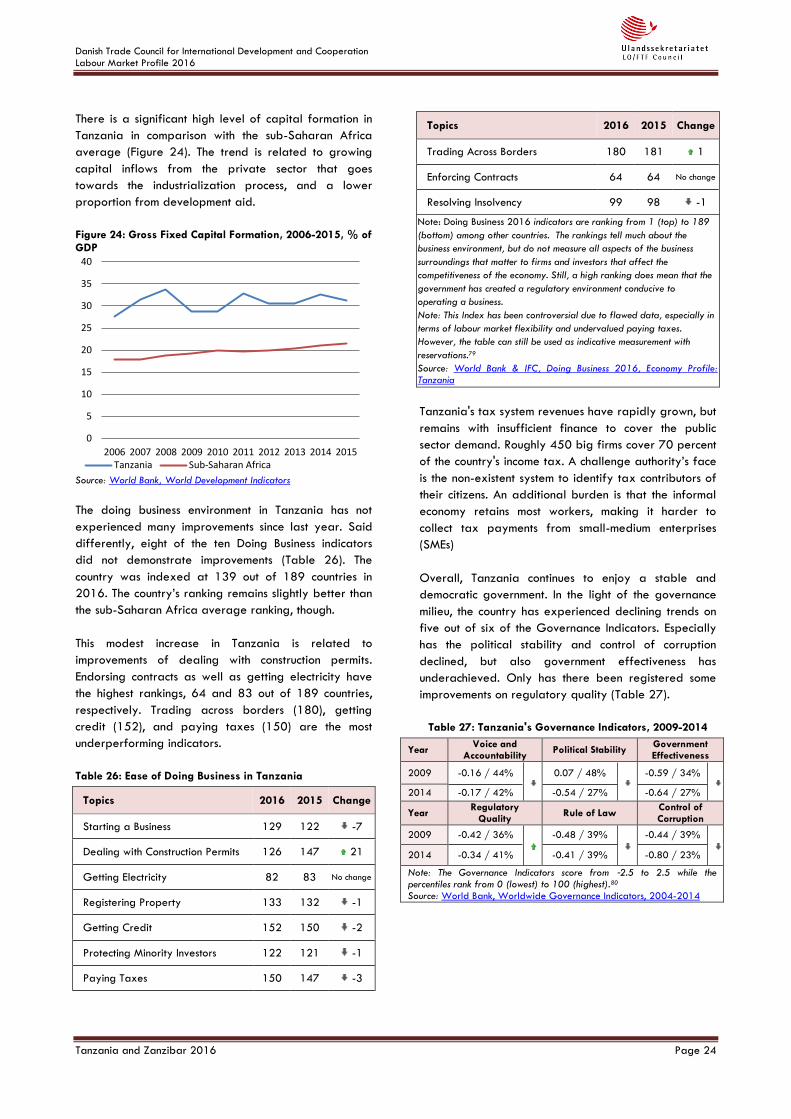
Danish Trade Council for International Development and Cooperation
Labour Market Profile 2016
Tanzania and Zanzibar 2016 Page 24
There is a significant high level of capital formation in
Tanzania in comparison with the sub-Saharan Africa
average (Figure 24). The trend is related to growing
capital inflows from the private sector that goes
towards the industrialization process, and a lower
proportion from development aid.
Figure 24: Gross Fixed Capital Formation, 2006-2015, % of GDP
Source: World Bank, World Development Indicators
The doing business environment in Tanzania has not
experienced many improvements since last year. Said
differently, eight of the ten Doing Business indicators
did not demonstrate improvements (Table 26). The
country was indexed at 139 out of 189 countries in
2016. The country’s ranking remains slightly better than
the sub-Saharan Africa average ranking, though.
This modest increase in Tanzania is related to
improvements of dealing with construction permits.
Endorsing contracts as well as getting electricity have
the highest rankings, 64 and 83 out of 189 countries,
respectively. Trading across borders (180), getting
credit (152), and paying taxes (150) are the most
underperforming indicators.
Table 26: Ease of Doing Business in Tanzania
Topics 2016 2015 Change
Starting a Business 129 122 -7
Dealing with Construction Permits 126 147 21
Getting Electricity 82 83 No change
Registering Property 133 132 -1
Getting Credit 152 150 -2
Protecting Minority Investors 122 121 -1
Paying Taxes 150 147 -3
Topics 2016 2015 Change
Trading Across Borders 180 181 1
Enforcing Contracts 64 64 No change
Resolving Insolvency 99 98 -1
Note: Doing Business 2016 indicators are ranking from 1 (top) to 189
(bottom) among other countries. The rankings tell much about the
business environment, but do not measure all aspects of the business
surroundings that matter to firms and investors that affect the
competitiveness of the economy. Still, a high ranking does mean that the
government has created a regulatory environment conducive to
operating a business.
Note: This Index has been controversial due to flawed data, especially in
terms of labour market flexibility and undervalued paying taxes.
However, the table can still be used as indicative measurement with
reservations.79
Source: World Bank & IFC, Doing Business 2016, Economy Profile: Tanzania
Tanzania's tax system revenues have rapidly grown, but
remains with insufficient finance to cover the public
sector demand. Roughly 450 big firms cover 70 percent
of the country's income tax. A challenge authority’s face
is the non-existent system to identify tax contributors of
their citizens. An additional burden is that the informal
economy retains most workers, making it harder to
collect tax payments from small-medium enterprises
(SMEs)
Overall, Tanzania continues to enjoy a stable and
democratic government. In the light of the governance
milieu, the country has experienced declining trends on
five out of six of the Governance Indicators. Especially
has the political stability and control of corruption
declined, but also government effectiveness has
underachieved. Only has there been registered some
improvements on regulatory quality (Table 27).
Table 27: Tanzania's Governance Indicators, 2009-2014
Year Voice and
Accountability Political Stability
Government Effectiveness
2009 -0.16 / 44%
0.07 / 48%
-0.59 / 34%
2014 -0.17 / 42% -0.54 / 27% -0.64 / 27%
Year Regulatory
Quality Rule of Law
Control of Corruption
2009 -0.42 / 36%
-0.48 / 39%
-0.44 / 39%
2014 -0.34 / 41% -0.41 / 39% -0.80 / 23%
Note: The Governance Indicators score from ‐2.5 to 2.5 while the percentiles rank from 0 (lowest) to 100 (highest).80 Source: World Bank, Worldwide Governance Indicators, 2004-2014
0
5
10
15
20
25
30
35
40
2006 2007 2008 2009 2010 2011 2012 2013 2014 2015Tanzania Sub-Saharan Africa
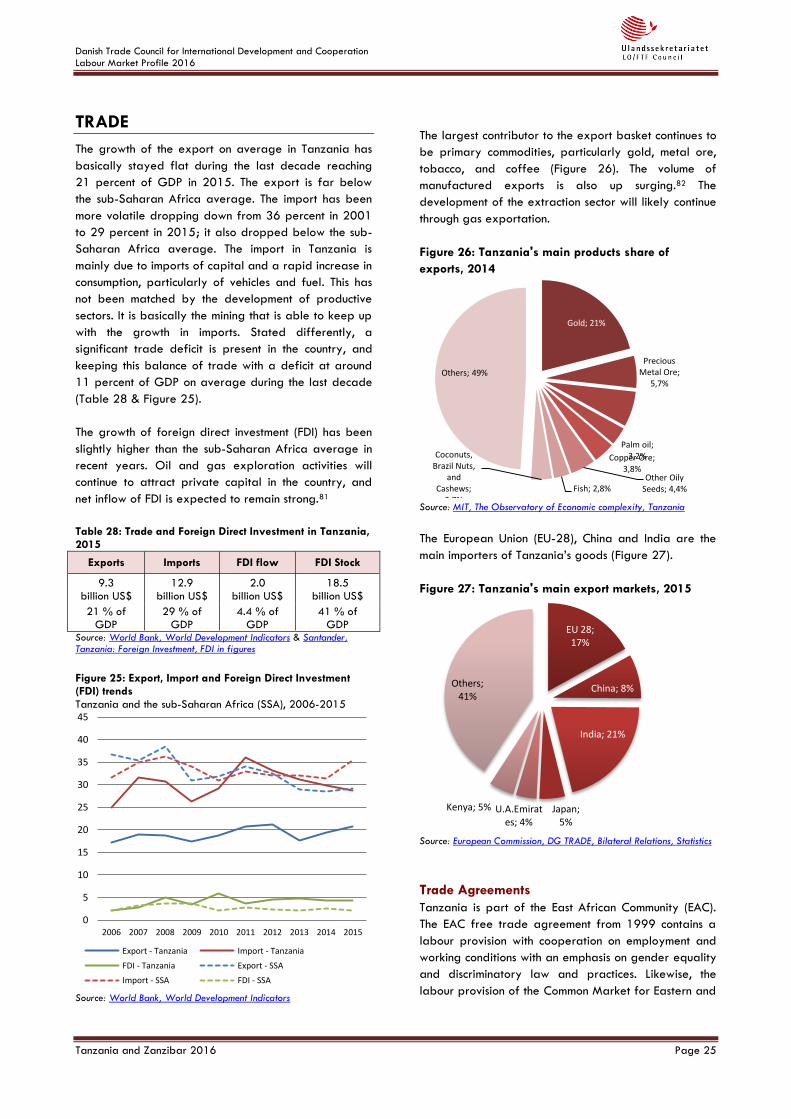
Danish Trade Council for International Development and Cooperation
Labour Market Profile 2016
Tanzania and Zanzibar 2016 Page 25
TRADE
The growth of the export on average in Tanzania has
basically stayed flat during the last decade reaching
21 percent of GDP in 2015. The export is far below
the sub-Saharan Africa average. The import has been
more volatile dropping down from 36 percent in 2001
to 29 percent in 2015; it also dropped below the sub-
Saharan Africa average. The import in Tanzania is
mainly due to imports of capital and a rapid increase in
consumption, particularly of vehicles and fuel. This has
not been matched by the development of productive
sectors. It is basically the mining that is able to keep up
with the growth in imports. Stated differently, a
significant trade deficit is present in the country, and
keeping this balance of trade with a deficit at around
11 percent of GDP on average during the last decade
(Table 28 & Figure 25).
The growth of foreign direct investment (FDI) has been
slightly higher than the sub-Saharan Africa average in
recent years. Oil and gas exploration activities will
continue to attract private capital in the country, and
net inflow of FDI is expected to remain strong.81
Table 28: Trade and Foreign Direct Investment in Tanzania, 2015
Exports Imports FDI flow FDI Stock
9.3 billion US$
12.9 billion US$
2.0 billion US$
18.5 billion US$
21 % of GDP
29 % of GDP
4.4 % of GDP
41 % of GDP
Source: World Bank, World Development Indicators & Santander, Tanzania: Foreign Investment, FDI in figures
Figure 25: Export, Import and Foreign Direct Investment (FDI) trends Tanzania and the sub-Saharan Africa (SSA), 2006-2015
Source: World Bank, World Development Indicators
The largest contributor to the export basket continues to
be primary commodities, particularly gold, metal ore,
tobacco, and coffee (Figure 26). The volume of
manufactured exports is also up surging.82 The
development of the extraction sector will likely continue
through gas exportation.
Figure 26: Tanzania's main products share of
exports, 2014
Source: MIT, The Observatory of Economic complexity, Tanzania
The European Union (EU-28), China and India are the
main importers of Tanzania’s goods (Figure 27).
Figure 27: Tanzania's main export markets, 2015
Source: European Commission, DG TRADE, Bilateral Relations, Statistics
Trade Agreements
Tanzania is part of the East African Community (EAC).
The EAC free trade agreement from 1999 contains a
labour provision with cooperation on employment and
working conditions with an emphasis on gender equality
and discriminatory law and practices. Likewise, the
labour provision of the Common Market for Eastern and
0
5
10
15
20
25
30
35
40
45
2006 2007 2008 2009 2010 2011 2012 2013 2014 2015
Export - Tanzania Import - Tanzania
FDI - Tanzania Export - SSA
Import - SSA FDI - SSA
Gold; 21%
Precious Metal Ore;
5,7%
Raw Tobacco;
6,3%
Palm oil; 3,2% Copper Ore;
3,8% Other Oily
Seeds; 4,4% Fish; 2,8%
Coconuts, Brazil Nuts,
and Cashews;
3,7%
Others; 49%
EU 28; 17%
China; 8%
India; 21%
Japan; 5%
U.A.Emirates; 4%
Kenya; 5%
Others; 41%
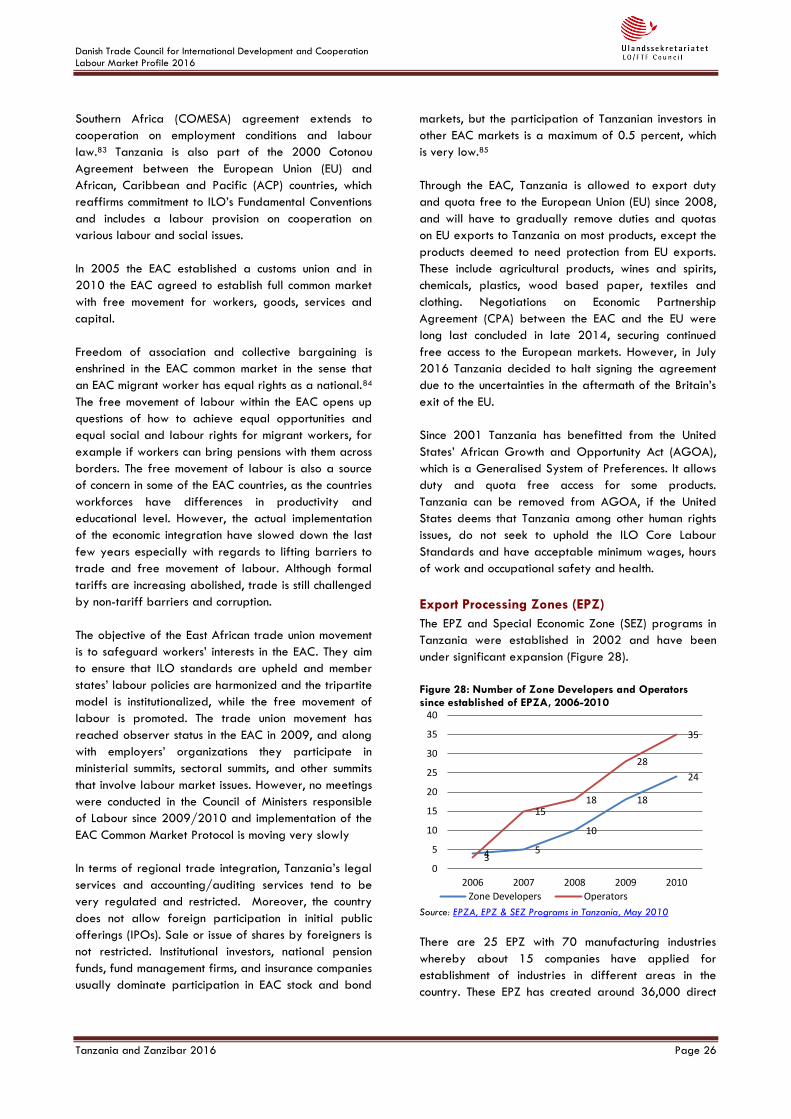
Danish Trade Council for International Development and Cooperation
Labour Market Profile 2016
Tanzania and Zanzibar 2016 Page 26
Southern Africa (COMESA) agreement extends to
cooperation on employment conditions and labour
law.83 Tanzania is also part of the 2000 Cotonou
Agreement between the European Union (EU) and
African, Caribbean and Pacific (ACP) countries, which
reaffirms commitment to ILO’s Fundamental Conventions
and includes a labour provision on cooperation on
various labour and social issues.
In 2005 the EAC established a customs union and in
2010 the EAC agreed to establish full common market
with free movement for workers, goods, services and
capital.
Freedom of association and collective bargaining is
enshrined in the EAC common market in the sense that
an EAC migrant worker has equal rights as a national.84
The free movement of labour within the EAC opens up
questions of how to achieve equal opportunities and
equal social and labour rights for migrant workers, for
example if workers can bring pensions with them across
borders. The free movement of labour is also a source
of concern in some of the EAC countries, as the countries
workforces have differences in productivity and
educational level. However, the actual implementation
of the economic integration have slowed down the last
few years especially with regards to lifting barriers to
trade and free movement of labour. Although formal
tariffs are increasing abolished, trade is still challenged
by non-tariff barriers and corruption.
The objective of the East African trade union movement
is to safeguard workers’ interests in the EAC. They aim
to ensure that ILO standards are upheld and member
states’ labour policies are harmonized and the tripartite
model is institutionalized, while the free movement of
labour is promoted. The trade union movement has
reached observer status in the EAC in 2009, and along
with employers’ organizations they participate in
ministerial summits, sectoral summits, and other summits
that involve labour market issues. However, no meetings
were conducted in the Council of Ministers responsible
of Labour since 2009/2010 and implementation of the
EAC Common Market Protocol is moving very slowly
In terms of regional trade integration, Tanzania’s legal
services and accounting/auditing services tend to be
very regulated and restricted. Moreover, the country
does not allow foreign participation in initial public
offerings (IPOs). Sale or issue of shares by foreigners is
not restricted. Institutional investors, national pension
funds, fund management firms, and insurance companies
usually dominate participation in EAC stock and bond
markets, but the participation of Tanzanian investors in
other EAC markets is a maximum of 0.5 percent, which
is very low.85
Through the EAC, Tanzania is allowed to export duty
and quota free to the European Union (EU) since 2008,
and will have to gradually remove duties and quotas
on EU exports to Tanzania on most products, except the
products deemed to need protection from EU exports.
These include agricultural products, wines and spirits,
chemicals, plastics, wood based paper, textiles and
clothing. Negotiations on Economic Partnership
Agreement (CPA) between the EAC and the EU were
long last concluded in late 2014, securing continued
free access to the European markets. However, in July
2016 Tanzania decided to halt signing the agreement
due to the uncertainties in the aftermath of the Britain’s
exit of the EU.
Since 2001 Tanzania has benefitted from the United
States’ African Growth and Opportunity Act (AGOA),
which is a Generalised System of Preferences. It allows
duty and quota free access for some products.
Tanzania can be removed from AGOA, if the United
States deems that Tanzania among other human rights
issues, do not seek to uphold the ILO Core Labour
Standards and have acceptable minimum wages, hours
of work and occupational safety and health.
Export Processing Zones (EPZ)
The EPZ and Special Economic Zone (SEZ) programs in
Tanzania were established in 2002 and have been
under significant expansion (Figure 28).
Figure 28: Number of Zone Developers and Operators since established of EPZA, 2006-2010
Source: EPZA, EPZ & SEZ Programs in Tanzania, May 2010
There are 25 EPZ with 70 manufacturing industries
whereby about 15 companies have applied for
establishment of industries in different areas in the
country. These EPZ has created around 36,000 direct
4 5
10
18
24
3
15 18
28
35
0
5
10
15
20
25
30
35
40
2006 2007 2008 2009 2010
Zone Developers Operators
Danish Trade Council for International Development and Cooperation
Labour Market Profile 2016
Tanzania and Zanzibar 2016 Page 27
employment, and at least 120,000 indirect ones;86 and
contributing with 5 percent of national exports. The
industries operate in machinery, processing of food and
of minerals.
A study concluded that Tanzania’s EPZ program is
lagging behind, mainly due to the rigid and expensive
infrastructural issues. While EPZ firms have been
enjoying fiscal incentives, the government has not been
reaping benefits from the scheme as well as borne
fiscal losses in terms of huge tax exemptions extending
over up to 10 years.87 The EPZ program also face a
number of other challenges: High cost of operations and
production due to unreliable supply of electricity and
water made the EPZ operating enterprises
uncompetitive in the international markets.88
There are two EPZs on Zanzibar, where there previously
have been unconfirmed reports of trade union rights
violations.
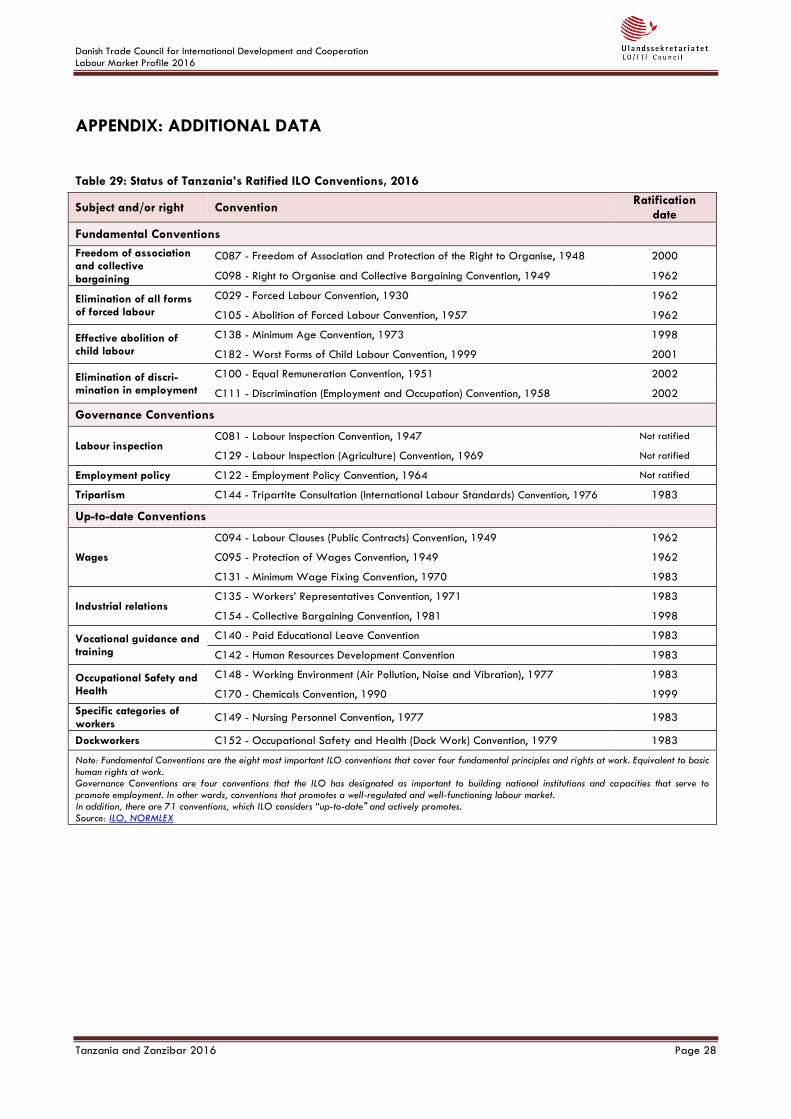
Danish Trade Council for International Development and Cooperation
Labour Market Profile 2016
Tanzania and Zanzibar 2016 Page 28
APPENDIX: ADDITIONAL DATA
Table 29: Status of Tanzania’s Ratified ILO Conventions, 2016
Subject and/or right Convention Ratification
date
Fundamental Conventions
Freedom of association and collective bargaining
C087 - Freedom of Association and Protection of the Right to Organise, 1948 2000
C098 - Right to Organise and Collective Bargaining Convention, 1949 1962
Elimination of all forms of forced labour
C029 - Forced Labour Convention, 1930 1962
C105 - Abolition of Forced Labour Convention, 1957 1962
Effective abolition of child labour
C138 - Minimum Age Convention, 1973 1998
C182 - Worst Forms of Child Labour Convention, 1999 2001
Elimination of discri-mination in employment
C100 - Equal Remuneration Convention, 1951 2002
C111 - Discrimination (Employment and Occupation) Convention, 1958 2002
Governance Conventions
Labour inspection C081 - Labour Inspection Convention, 1947 Not ratified
C129 - Labour Inspection (Agriculture) Convention, 1969 Not ratified
Employment policy C122 - Employment Policy Convention, 1964 Not ratified
Tripartism C144 - Tripartite Consultation (International Labour Standards) Convention, 1976 1983
Up-to-date Conventions
Wages
C094 - Labour Clauses (Public Contracts) Convention, 1949 1962
C095 - Protection of Wages Convention, 1949 1962
C131 - Minimum Wage Fixing Convention, 1970 1983
Industrial relations C135 - Workers’ Representatives Convention, 1971 1983
C154 - Collective Bargaining Convention, 1981 1998
Vocational guidance and training
C140 - Paid Educational Leave Convention 1983
C142 - Human Resources Development Convention 1983
Occupational Safety and Health
C148 - Working Environment (Air Pollution, Noise and Vibration), 1977 1983
C170 - Chemicals Convention, 1990 1999
Specific categories of workers
C149 - Nursing Personnel Convention, 1977 1983
Dockworkers C152 - Occupational Safety and Health (Dock Work) Convention, 1979 1983
Note: Fundamental Conventions are the eight most important ILO conventions that cover four fundamental principles and rights at work. Equivalent to basic human rights at work. Governance Conventions are four conventions that the ILO has designated as important to building national institutions and capacities that serve to promote employment. In other words, conventions that promotes a well-regulated and well-functioning labour market. In addition, there are 71 conventions, which ILO considers “up-to-date" and actively promotes. Source: ILO, NORMLEX
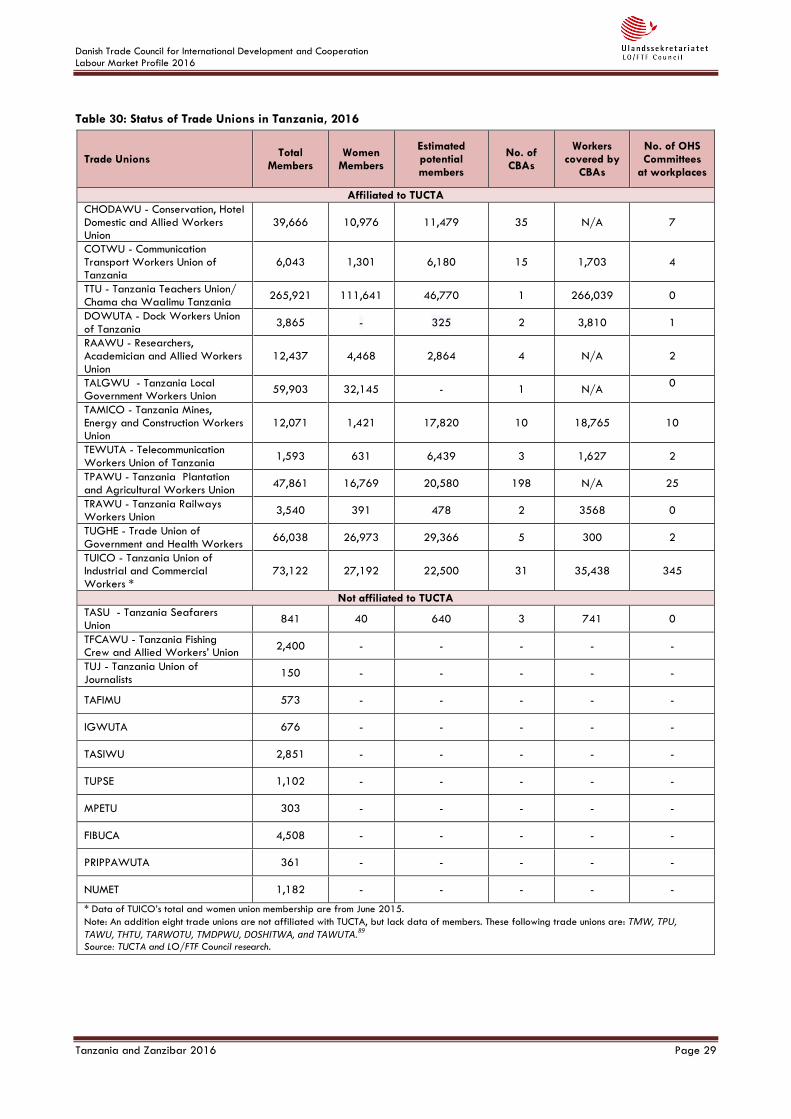
Danish Trade Council for International Development and Cooperation
Labour Market Profile 2016
Tanzania and Zanzibar 2016 Page 29
Table 30: Status of Trade Unions in Tanzania, 2016
Trade Unions Total
Members Women
Members
Estimated potential members
No. of CBAs
Workers covered by
CBAs
No. of OHS Committees
at workplaces
Affiliated to TUCTA
CHODAWU - Conservation, Hotel Domestic and Allied Workers Union
39,666 10,976 11,479 35 N/A 7
COTWU - Communication Transport Workers Union of Tanzania
6,043 1,301 6,180 15 1,703 4
TTU - Tanzania Teachers Union/ Chama cha Waalimu Tanzania
265,921 111,641 46,770 1 266,039 0
DOWUTA - Dock Workers Union of Tanzania
3,865 - 325 2 3,810 1
RAAWU - Researchers, Academician and Allied Workers Union
12,437 4,468 2,864 4 N/A 2
TALGWU - Tanzania Local Government Workers Union
59,903 32,145 - 1 N/A 0
TAMICO - Tanzania Mines, Energy and Construction Workers Union
12,071 1,421 17,820 10 18,765 10
TEWUTA - Telecommunication Workers Union of Tanzania
1,593 631 6,439 3 1,627 2
TPAWU - Tanzania Plantation and Agricultural Workers Union
47,861 16,769 20,580 198 N/A 25
TRAWU - Tanzania Railways Workers Union
3,540 391 478 2 3568 0
TUGHE - Trade Union of Government and Health Workers
66,038 26,973 29,366 5 300 2
TUICO - Tanzania Union of Industrial and Commercial Workers *
73,122 27,192 22,500 31 35,438 345
Not affiliated to TUCTA
TASU - Tanzania Seafarers Union
841 40 640 3 741 0
TFCAWU - Tanzania Fishing Crew and Allied Workers’ Union
2,400 - - - - -
TUJ - Tanzania Union of Journalists
150 - - - - -
TAFIMU 573 - - - - -
IGWUTA 676 - - - - -
TASIWU 2,851 - - - - -
TUPSE 1,102 - - - - -
MPETU 303 - - - - -
FIBUCA 4,508 - - - - -
PRIPPAWUTA 361 - - - - -
NUMET 1,182 - - - - -
* Data of TUICO’s total and women union membership are from June 2015.
Note: An addition eight trade unions are not affiliated with TUCTA, but lack data of members. These following trade unions are: TMW, TPU, TAWU, THTU, TARWOTU, TMDPWU, DOSHITWA, and TAWUTA.89 Source: TUCTA and LO/FTF Council research.
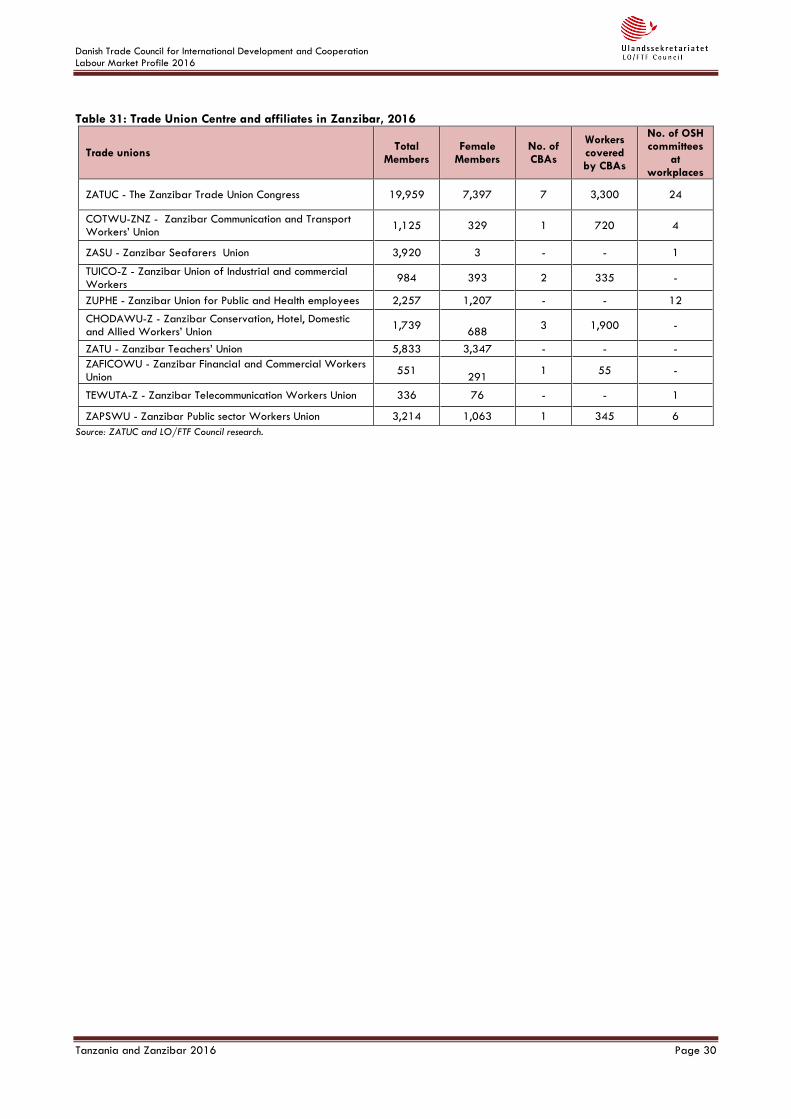
Danish Trade Council for International Development and Cooperation
Labour Market Profile 2016
Tanzania and Zanzibar 2016 Page 30
Table 31: Trade Union Centre and affiliates in Zanzibar, 2016
Trade unions Total
Members Female
Members No. of CBAs
Workers covered by CBAs
No. of OSH committees
at workplaces
ZATUC - The Zanzibar Trade Union Congress 19,959 7,397 7 3,300 24
COTWU-ZNZ - Zanzibar Communication and Transport Workers’ Union
1,125 329 1 720 4
ZASU - Zanzibar Seafarers Union 3,920 3 - - 1
TUICO-Z - Zanzibar Union of Industrial and commercial Workers
984 393 2 335 -
ZUPHE - Zanzibar Union for Public and Health employees 2,257 1,207 - - 12
CHODAWU-Z - Zanzibar Conservation, Hotel, Domestic and Allied Workers’ Union
1,739
688 3 1,900 -
ZATU - Zanzibar Teachers’ Union 5,833 3,347 - - -
ZAFICOWU - Zanzibar Financial and Commercial Workers Union
551
291 1 55 -
TEWUTA-Z - Zanzibar Telecommunication Workers Union 336 76 - - 1
ZAPSWU - Zanzibar Public sector Workers Union 3,214 1,063 1 345 6
Source: ZATUC and LO/FTF Council research.
Danish Trade Council for International Development and Cooperation
Labour Market Profile 2016
Tanzania and Zanzibar 2016 Page 31
REFERENCES
1 U.S. Department of State, Annual Country Report on Human Rights Practices, 2014 2 Zanzibar 2012 Census 3 http://www.ate.or.tz 4 East African Business Week, Regional trade unions want common work permit formula, May 5, 2014 5 ILO, Labour Administration and Labour Inspection, Information resources, Tanzania 6 ILO, LAB/ADMIN, Technical Memorandum: Tanzania, 2010 7 ILO, LAB/ADMIN, Technical Memorandum: Tanzania, 2010 8 ILO, LAB/ADMIN, Technical Memorandum: Tanzania, 2010 9 ILO, LAB/ADMIN, Technical Memorandum: Tanzania, 2010 & U.S. Department of State, Annual Country Report on Human Rights Practices, 2013 10 Janna Besamusca & Kea Tijdens, Comparing collective bargaining agreements for developing countries, 2015 11 LO/FTF Council 12 Labour Relations Act 2005 (Act No. 1 of 2005), Part X The Zanzibar Industrial Court 13 ILO, LAB/ADMIN, Technical Memorandum: Tanzania, 2010 14 ALLAFRICA, Tanzania: Shein Calls for Improved Justice for All in Isles, February 11, 2015 15 U.S. Department of State, Annual Country Report on Human Rights Practices, 2015 16 The Employment Act 2005 (Act No. 2 of 2005), Part IV Establishment of the Labour Advisory Board 17 ILO, NATLEX, The Constitution of the United Republic of Tanzania 18 ILO, NATLEX, Employment and Labour Relations Act, 2004 (No. 6 of 2004) 19 ILO, NATLEX, Public Service (Negotiating Machinery) Act 2003 (No. 19 of 2003) 20 ILO, NATLEX, Labour Institutions Act (No. 7 of 2004) 21 Legal and Human Rights Centre, Human Rights and Business Report in Tanzania 2013 22 ILO, NATLEX, Labour Act, 1997 (No. 3 of 1997) 23 ILO, NATLEX, Country Profile Tanzania, Basic Laws 24 ITUC, Survey of violations of trade union rights, Tanzania 25 ILO, NATLEX, Country Profile, Ratifications for Tanzania 26 ILO, NORMLEX, Observations made by employers' and workers' organizations of United Republic of Tanzania, Article 22, 2015 27 ITUC, Survey of violations of trade union rights, Tanzania 28 U.S. Department of State, Annual Country Report on Human Rights Practices, 2015 29 ILO, NORMLEX, Country Profile: Tanzania & Zanzibar 30 DW, MINIMUM WAGES IN AFRICA, NOT A CURE-ALL FOR POVERTY, 8 OCTOBER, 2013 31 ILO, Decent Work Country Programme (2006-2010) 32 Tanzania National Bureau of Statistics, Formal Sector EES 2014 Tanzania Mainland, 2015 33 U.S. Department of State, Annual Country Report on Human Rights Practices, 2014 34 ILO, Press Release, ILO calls for strengthening labour inspection worldwide, 16 November 2006 35 U.S. Department of State, Annual Country Report on Human Rights Practices, 2015 36 DEVEX, How data could help Tanzania's young informal workers, March 17, 2015 37 National Bureau of Statistics, 2014 Integrated Labour Force Survey (ILFS), 2015
38 National Bureau of Statistics, 2014 Integrated Labour Force Survey (ILFS), 2015 39 AEO, Tanzania 2014 40 Labour Market Information System, Employment situation in Zanzibar 41 The Economist, The Swahili coast: Contagion of discontent, Nov 3rd 2012 42 ALLAFRICA, TANZANIA: UNEMPLOYMENT IN ZANZIBAR A TICKING TIME BOMB, 23 SEPTEMBER, 2008 43 ILO, Vulnerable employment and poverty on the rise, Interview with ILO chief of Employment Trends Unit 44 World Bank, Tanzania - Productive jobs wanted (Vol. 1 of 2) : Executive summary, 2014 45 World Bank, De-fragmenting Africa: Deepening Regional Trade Integration in Goods and Services, 2012 46 Africa Investments, Labour Force Profile, Tanzania Business Sector Support - Programme Phase III - BSPS III 2008-2014, 2014 47 IOM, Activities, Facts and Figure, Tanzania 48 National Bureau of Statistics, 2014 Integrated Labour Force Survey (ILFS), 2015 49 WageIndicator, Data Report, Wages in Tanzania, WageIndicator survey 2012 50 WageIndicator, Data Report, Wages in Zanzibar, WageIndicator survey 2013 51 ILO, Transitioning from the informal to the formal economy, Report V (1), International Labour Conference 103rd Session 2014 52 Ministry of Labour, The National Employment Policy 53 U.S. Department of Labor, 2014 Findings on the Worst Forms of Child Labor, Tanzania 54 U.S. Department of State, Annual Country Report on Human Rights Practices, 2015 55 TANZANIA TODAY, Future Policy Award 2015: Gold goes to Zanzibar’s Children’s Act 56 ITUC, Trade unions take action on HIV orphans and child labour, September 29, 2012 57 ILO, National Report for Promoting the Linkages between Women’s Employment and the Reduction of Child Labour 58 EATUC, Gender Stategy , 2011 59 U.S. Department of State, Annual Country Report on Human Rights Practices, 2015 60 ILO, Labour market transitions of young women and men in the United Republic of Tanzania, Work4Youth Publication Series No. 26, December 2014 61 Africa Investments, Labour Force Profile, Tanzania Business Sector Support - Programme Phase III - BSPS III 2008-2014, 2014 62 International Youth Foundation, YouthMap: Tanzania,
Zanzibar Youth: Assets & opportunities, Assessment Report,
2014 63 World Bank, How Tanzania Plans To Achieve "Big Results Now" in Education, July 14, 2014 64 ALLAFRICA, Tanzania: Govt Set to Establish Specialised Vocational Centres, July 5, 2016 65 World Bank, World Development Indicators 66 Association of Tanzania Employers, Business Agenda 2011-2014 67 ILO, EMPLOYMENT, 2009, Understanding informal apprenticeship – Findings from empirical research in Tanzania, Employment Working Paper No. 32 68 Revolutional Government of Zanzibar, Ministry of Education and Vocational Training; Technical Education, Vocational Education & Training
Danish Trade Council for International Development and Cooperation
Labour Market Profile 2016
Tanzania and Zanzibar 2016 Page 32
69 ILO, Social Protection Expenditure and Performance Review and Social Budget: Zanzibar, 2010 & Ministry of Education and Vocational training 70 ILO, Tanzania Mainland, Social Protection Expenditure and Performance Review and Social Budget 71 NHIF, Fact Sheet Inside NHIF 2012-13 72 Tulia Ackson & Juliana Masabo, Social Protection for the Informal Sector in Tanzania 73 AllAfrica, Tanzania: Over 70,000 Register in NSSF Health Insurance, August 7, 2015 74 ILO, Zanzibar, Social Protection Expenditure and Performance Review and Social Budget 75 ZSSF, Annual Report 2010-2011 76 LO/FTF Council 77 Help Age, Zanzibar's new universal pension the first of its kind in east Africa, April 14, 2016 78 World Bank & IFC, Doing Business, Methodology 79 ITUC, WORLD BANK’S DOING BUSINESS MAKES UNSUBSTANTIATED ASSERTIONS, REWARDS COUNTRIES THAT HAVE NOT RATIFIED ILO CONVENTIONS, SEPTEMBER 10, 2008 & ILO, DEREGULATION LABOUR MARKETS: HOW ROBUST IS THE ANALYSIS OF RECENT IMF WORKING PAPERS?, CONDITIONS OF WORK AND EMPLOYMENT SERIES NO. 47, 2014 80 World Bank, The Worldwide Governance Indicators, Methodology and Analytical Issues, Policy Research Working Paper 5430, 2010 81 African Economic Outlook, Tanzania 2015 82 World Bank, Tanzania Overview 83 Ebert & Posthuma, ILO, IILS, 2010, Labour provisions in trade agreements: current trends and provisions 84 EAC, Annex on the Free Movement of Workers, November 2009 85 World Bank, De-fragmenting Africa: Deepening Regional Trade Integration in Goods and Services, 2012 86 EPZA, EPZA’s push toward industrial development a plus in Tanzania’s economic endeavors & Daily News, EPZA generates 2tri/- in forex, April 14, 2016 87 Charles Domician, An Evaluation of Tanzania’s EPZ Programme – Challenges and Prospects, August 2009 88 EPZA, Annual Report 2011-2012 89 Africa Investments, Labour Force Profile, Tanzania Business Sector Support - Programme Phase III - BSPS III 2008-2014, 2014
Recommended