1
“We Accelerate Growth” May 2014
Key Trends in the Turkish Energy
Market
Potential Opportunities and Pitfalls for
Investors
2
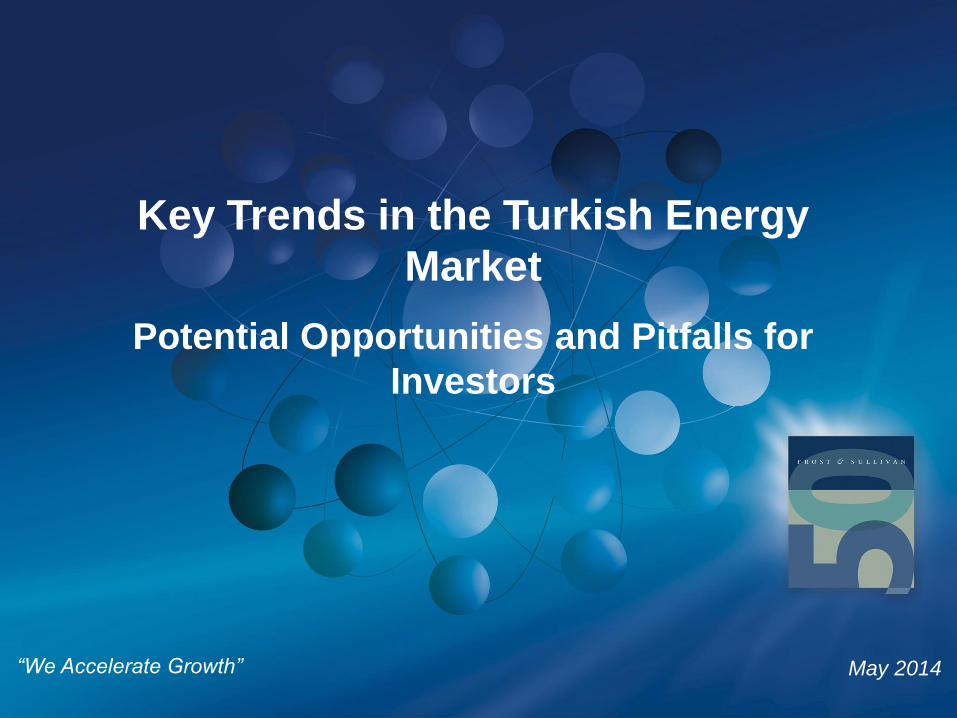
Key trends in the Turkish energy market
Source: Frost & Sullivan analysis.
Key Trends in the Turkish Market
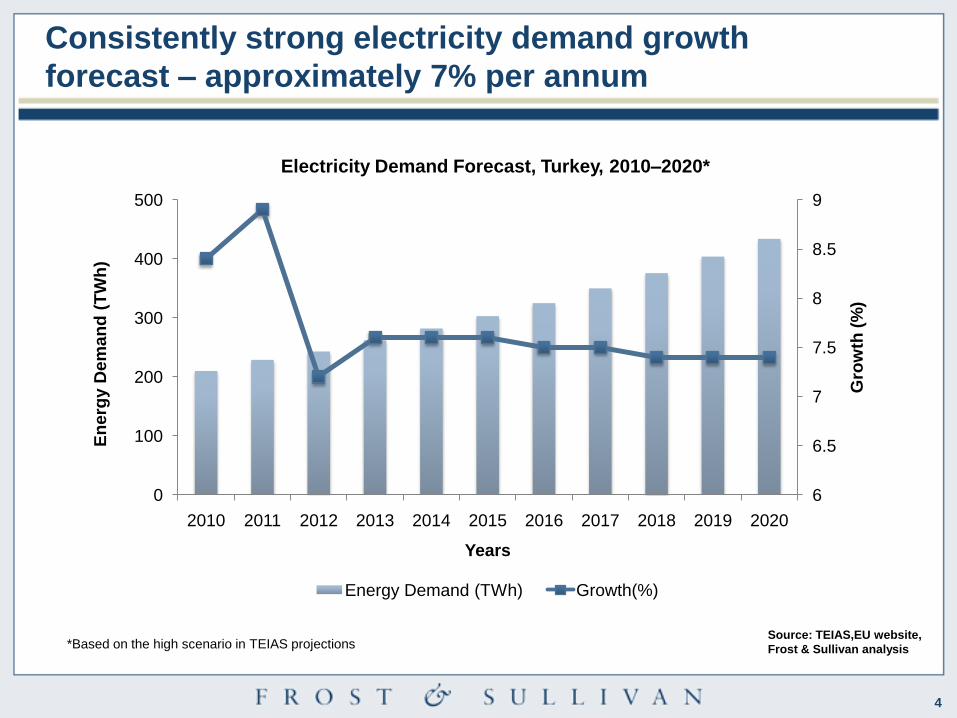
1Demand for power will continue to rise at approximately 7% per year, necessitating
new capacity additions
2The market reform process is progressing with private companies keen to expand their
presence in the market
3Turkey’s fuel mix will diversify, with greater investment in renewables. Coal and gas will
remain a key element of the fuel mix
4Once a functioning bureaucracy is in place, the solar power market is expected to
boom fuelled particularly by the 'below 500 kW regulation'. This regulation will unlock a
significant amount of investment
5Power generation is dominated by local, diversified industrial groups. While several
international utilities are partnering with Turkish companies, most projects are run solely
by local companies, involved in the construction industry
6New competitors are continuing to emerge though and international investors are also
keen to expand their presence
7With most equipment imported from abroad, Turkey is an attractive market for
equipment OEMs. The presence of Chinese players is increasing
8There remains a bottleneck around financing, but this can be overcome as global
lending conditions improve
3
Source: ETKB, Frost & Sullivan analysis.
2001 2005 2010 2015
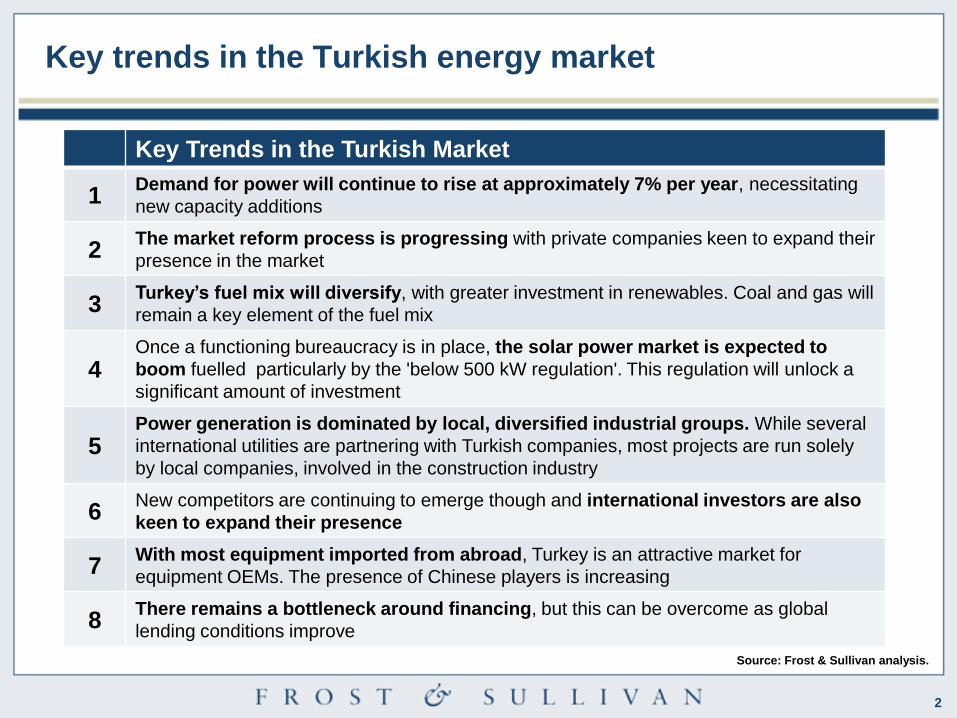
2001—Electricity
Market Law
2001—Establishment
of EPDK
2005—Renewable
Resources Law
2007—Energy
Efficiency Law
2010—Significant
Amendments in
Renewable Energy
Law
Major steps taken to realize market reform
Investment Opportunities in the Turkish Energy Market: Reforms Timeline, 2001–2015
2008—
Beginning of
Distribution
Privatisations
2012—Beginning of
the Privatisations of
16 GW Generation
Assets
2015—Fully
open market
(all consumers
will be eligible)
2013—Legal
unbundling of
distribution
and retail
2009—Electricity
Energy Market and
Supply Security
Strategy Paper
The market liberalisation process continues…..
4
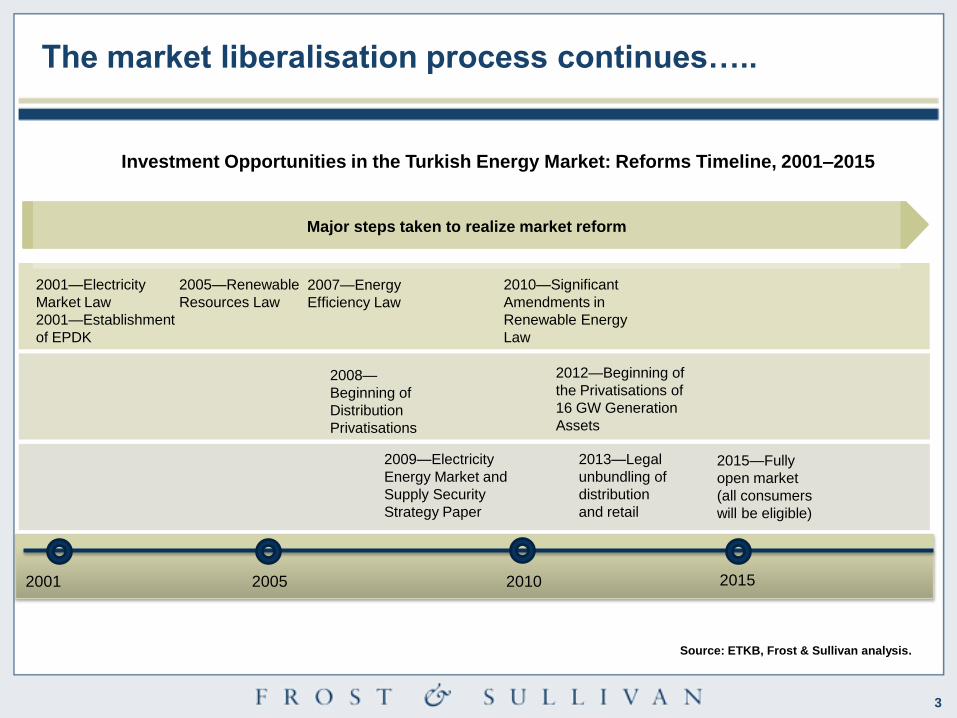
Electricity Demand Forecast, Turkey, 2010–2020*
Source: TEIAS,EU website,
Frost & Sullivan analysis*Based on the high scenario in TEIAS projections
6
6.5
7
7.5
8
8.5
9
0
100
200
300
400
500
2010 2011 2012 2013 2014 2015 2016 2017 2018 2019 2020
Gro
wth
(%
)
En
erg
y D
em
an
d (
TW
h)
Years
Energy Demand (TWh) Growth(%)
Consistently strong electricity demand growth
forecast – approximately 7% per annum

5
0
3 000
6 000
9 000
12 000
15 000
18 000
21 000
2011 2023
Ins
talle
d C
ap
ac
ity (
MW
)
Expansion of Coal, 2011 and 2023
Installed Capacity by Share of Coal, 2011
Source: ETKB,TKI, Frost & Sullivan analysis.
*
* 17.5 GW is the set target of the government which is stated
as 17-18 GW until 2023.
12.4
GW
12.4 GW
17.5 GW
Coal24%
Others76%
Of the 12.4GW of capacity, 8.5GW utilises
domestic coal reserves. Turkey has 11.8 billion
tonnes of reserves; 1.3 billion tonnes of hard-
coal and 10.8 billion tonnes of lignite.
Coal plants built between 1980 and 1990 are
currently being privatised. A further 7GW of
capacity is being lined up to be tendered to the
private sector.
Despite government pronouncements on using
domestic coal, a high amount of investment is
planned based on imported coal, determined
from the licences currently under assessment
and examination. Project developers are
preferring to utilise higher calorific valued-coal, in
order to ensure higher returns and a shorter ROI.
Recent study predicts 5GW of additional coal
capacity to be online by 2023
6
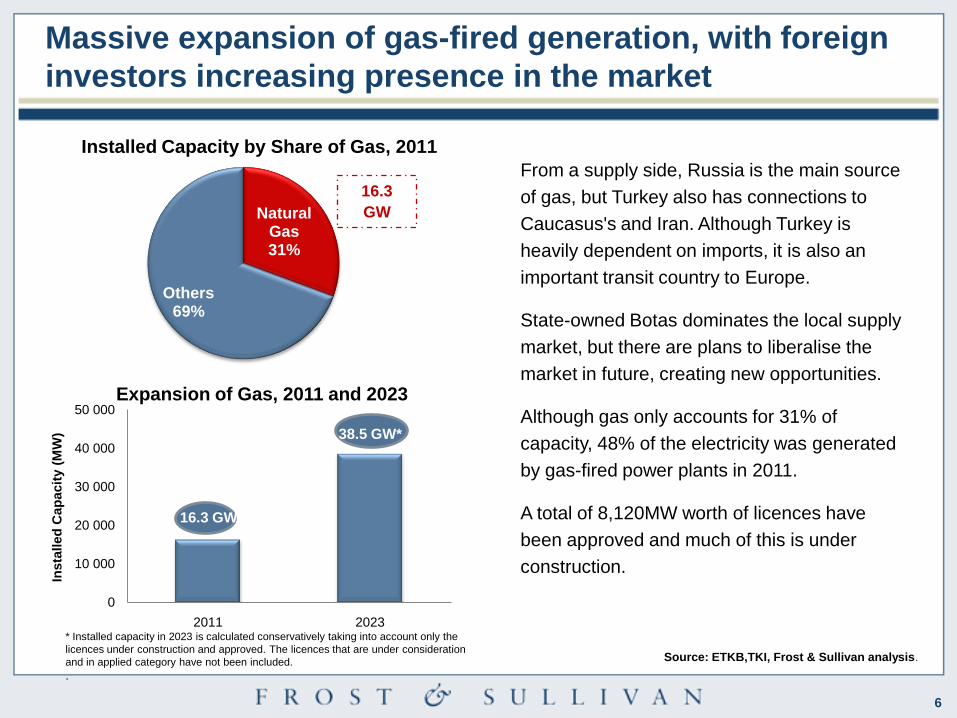
Natural Gas31%
Others69%
Expansion of Gas, 2011 and 2023
Installed Capacity by Share of Gas, 2011
Source: ETKB,TKI, Frost & Sullivan analysis.
From a supply side, Russia is the main source
of gas, but Turkey also has connections to
Caucasus's and Iran. Although Turkey is
heavily dependent on imports, it is also an
important transit country to Europe.
State-owned Botas dominates the local supply
market, but there are plans to liberalise the
market in future, creating new opportunities.
Although gas only accounts for 31% of
capacity, 48% of the electricity was generated
by gas-fired power plants in 2011.
A total of 8,120MW worth of licences have
been approved and much of this is under
construction.
Massive expansion of gas-fired generation, with foreign
investors increasing presence in the market
16.3 GW
38.5 GW*
* Installed capacity in 2023 is calculated conservatively taking into account only the
licences under construction and approved. The licences that are under consideration
and in applied category have not been included.
.
0
10 000
20 000
30 000
40 000
50 000
2011 2023
Insta
lled
Cap
acit
y (
MW
)
16.3
GW
7
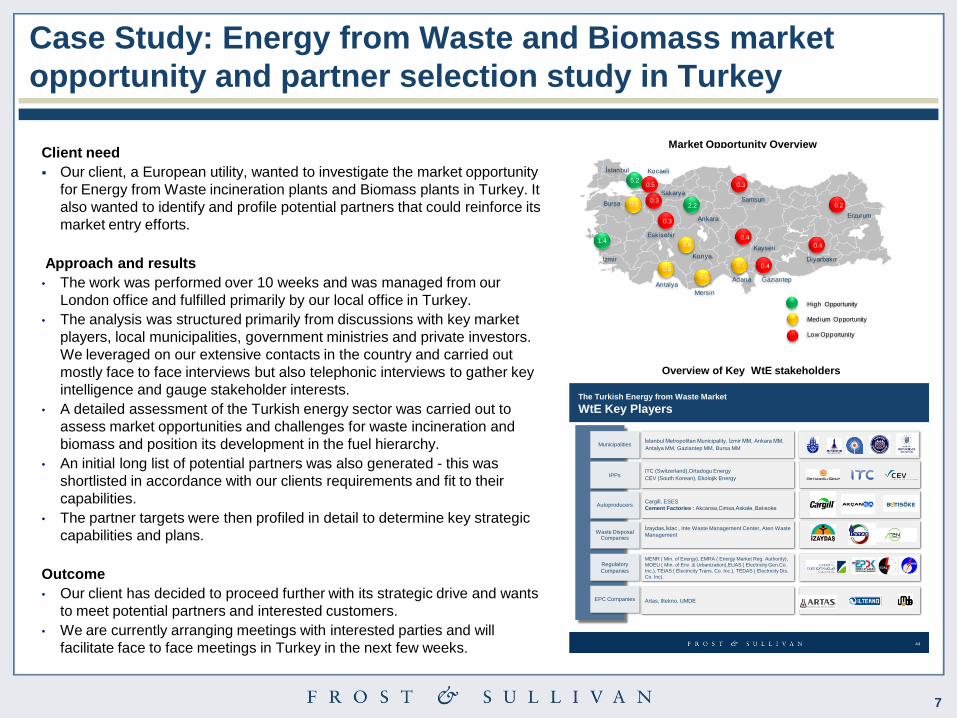
Client need
Our client, a European utility, wanted to investigate the market opportunity
for Energy from Waste incineration plants and Biomass plants in Turkey. It
also wanted to identify and profile potential partners that could reinforce its
market entry efforts.
Approach and results
• The work was performed over 10 weeks and was managed from our
London office and fulfilled primarily by our local office in Turkey.
• The analysis was structured primarily from discussions with key market
players, local municipalities, government ministries and private investors.
We leveraged on our extensive contacts in the country and carried out
mostly face to face interviews but also telephonic interviews to gather key
intelligence and gauge stakeholder interests.
• A detailed assessment of the Turkish energy sector was carried out to
assess market opportunities and challenges for waste incineration and
biomass and position its development in the fuel hierarchy.
• An initial long list of potential partners was also generated - this was
shortlisted in accordance with our clients requirements and fit to their
capabilities.
• The partner targets were then profiled in detail to determine key strategic
capabilities and plans.
Outcome
• Our client has decided to proceed further with its strategic drive and wants
to meet potential partners and interested customers.
• We are currently arranging meetings with interested parties and will
facilitate face to face meetings in Turkey in the next few weeks.
Case Study: Energy from Waste and Biomass market
opportunity and partner selection study in Turkey
Overview of Key WtE stakeholders
Market Opportunity Overview
İstanbul Kocaeli
Sakarya
Eskisehir
Ankara
Samsun
Erzurum
Izmir
Antalya
Konya.
Mersin
Adana
Kayseri
Gaziantep
Diyarbakır
Bursa
5.2
1.4
2.2 0.2
0.3
0.3
0.3
0.6
0.6
0.70.8
0.8
0.4
0.4
0.4
0.5
High Opportunity
Medium Opportunity
Low Opportunity
44
İstanbul Metropolitan Municipality, İzmir MM, Ankara MM,
Antalya MM, Gaziantep MM, Bursa MMMunicipalities
EPC Companies
Regulatory
Companies
IPPs
Autoproducers
Waste Disposal Companies
The Turkish Energy from Waste Market
WtE Key Players
ITC (Switzerland),Ortadogu Energy
CEV (South Korean), Ekolojik Energy
Cargill, ESES
Cement Factories : Akcansa,Cimsa,Askale, Batısoke
İzaydas,İstac , Inte Waste Management Center, Aten Waste
Management
MENR ( Min. of Energy), EMRA ( Energy Market Reg. Authority),
MOEU ( Min. of Env .& Urbanization),EUAS ( Electricity Gen.Co.
Inc.), TEIAS ( Electricity Trans. Co. Inc.), TEDAS ( Electricity Dis.
Co. Inc).
Artas, Iltekno, UMDE

8
Hydro32%
Others68%
Expansion of Hydropower, 2011 and 2023
Installed Capacity by Share of Hydropower, 2011 The current installed capacity as of 2011, was
17.1GW, with 15.2 GW of hydropower plants
under construction.
On the equipment supply side, Turkey has
increasingly become a battleground as
Chinese manufacturers have been increasing
their presence in the market, especially
supplying hydro turbines below 15MW. Over
15 MW, the investors tend to work with the
Western OEMs such as Voith
Hydro, Alstom, and Andritz Hydro.
Challenges facing the market include:
• Poor coordination between the responsible
corporations
• Public protest based on the environmental
impacts
• Lack of control mechanism of the
hydropower plants during
feasibility, construction, and after
commissioning period.
Significant expansion of hydropower + refurbishment
work makes Turkey a key European market
17.1
GW
0
10000
20000
30000
40000
50000
2011 2023
Insta
lled C
apacity
(MW
)
Years
17.1 GW
45 GW*
*45 GB represents the government’s set target in the 2009 strategy paper. The projects in the pipeline indicate that things are on track as planned and the target
is reachable if conflicts stemming from environmental problems can be solved with necessary precautions.
9
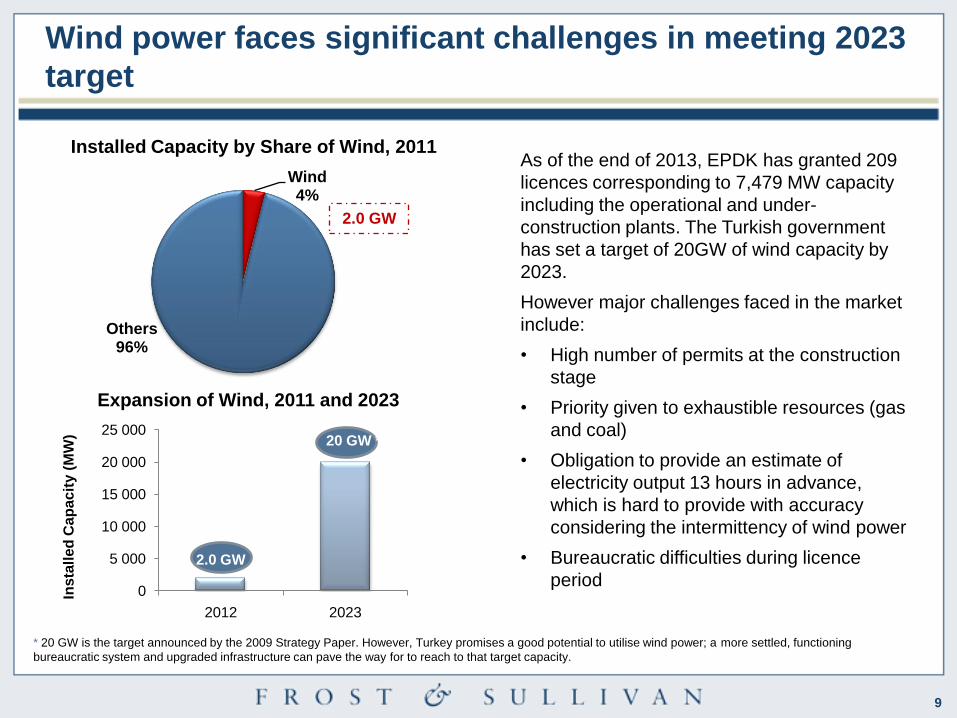
Wind4%
Others96%
Expansion of Wind, 2011 and 2023
Installed Capacity by Share of Wind, 2011As of the end of 2013, EPDK has granted 209
licences corresponding to 7,479 MW capacity
including the operational and under-
construction plants. The Turkish government
has set a target of 20GW of wind capacity by
2023.
However major challenges faced in the market
include:
• High number of permits at the construction
stage
• Priority given to exhaustible resources (gas
and coal)
• Obligation to provide an estimate of
electricity output 13 hours in advance,
which is hard to provide with accuracy
considering the intermittency of wind power
• Bureaucratic difficulties during licence
period
Wind power faces significant challenges in meeting 2023
target
2.0 GW
0
5 000
10 000
15 000
20 000
25 000
2012 2023
Ins
tall
ed
Ca
pa
cit
y (
MW
)
2.0 GW
20 GW *
* 20 GW is the target announced by the 2009 Strategy Paper. However, Turkey promises a good potential to utilise wind power; a more settled, functioning
bureaucratic system and upgraded infrastructure can pave the way for to reach to that target capacity.

10
The Client: A Global Tier 1 Supply of Wind Turbines
The Challenge Project Objectives
A leading global supplier of wind turbines has
recently entered the market in Turkey. Given
its late entrance to the market, the company
wanted to gain detailed insights into the
market trends and dynamics to ascertain the
realistic market opportunity. In addition, our
client wanted to understand the operational
activities of competitors in order to ramp up its
business in an optimal manner through best
practices and lessons learned in the market.
• To assess the market opportunity of the wind power
plant services market in revenues;
• To forecast the market size to 2017 (with 2012 as the
base year)
• To identify key trends, revenues drivers/enablers and
restraints and how this will impact the market;
• To identify key competitors and provide detailed profiles
on their operational architecture; and
• To provide key conclusions and actionable
recommendations for our client to maximise their
success in this market.
Our Approach and Work
Frost and Sullivan initially utilised data from out internal studies, key public sources and databases. These
were used as a platform on which the remaining market intelligence was built. Our analysts used detailed
expert interviews with key market participants to uncover the details and provide insightful results. Overall, 30
interviews were conducted.
Outcome and Business Impact
The client will use the data to plan its next operational investments in Turkey to build its wind power services
networks most effectively incurring the least investments that will have the maximum coverage for its
customers. The intelligence will feed into the structured roll out of team build up and the ramp up of its
capabilities.
Case Study: Strategic Analysis of the Wind Power
Services Market in Turkey
11
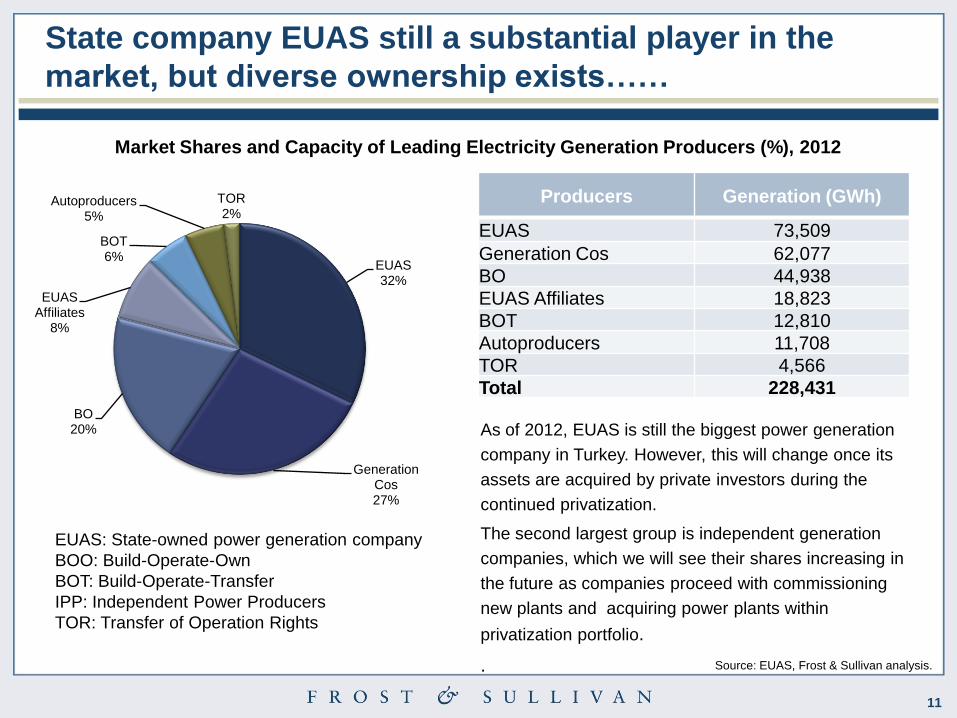
State company EUAS still a substantial player in the
market, but diverse ownership exists……
Market Shares and Capacity of Leading Electricity Generation Producers (%), 2012
EUAS: State-owned power generation company
BOO: Build-Operate-Own
BOT: Build-Operate-Transfer
IPP: Independent Power Producers
TOR: Transfer of Operation Rights
As of 2012, EUAS is still the biggest power generation
company in Turkey. However, this will change once its
assets are acquired by private investors during the
continued privatization.
The second largest group is independent generation
companies, which we will see their shares increasing in
the future as companies proceed with commissioning
new plants and acquiring power plants within
privatization portfolio.
. Source: EUAS, Frost & Sullivan analysis.
EUAS32%
Generation Cos27%
BO 20%
EUAS Affiliates
8%
BOT6%
Autoproducers5%
TOR2%
Producers Generation (GWh)
EUAS 73,509
Generation Cos 62,077
BO 44,938
EUAS Affiliates 18,823
BOT 12,810
Autoproducers 11,708
TOR 4,566
Total 228,431
12
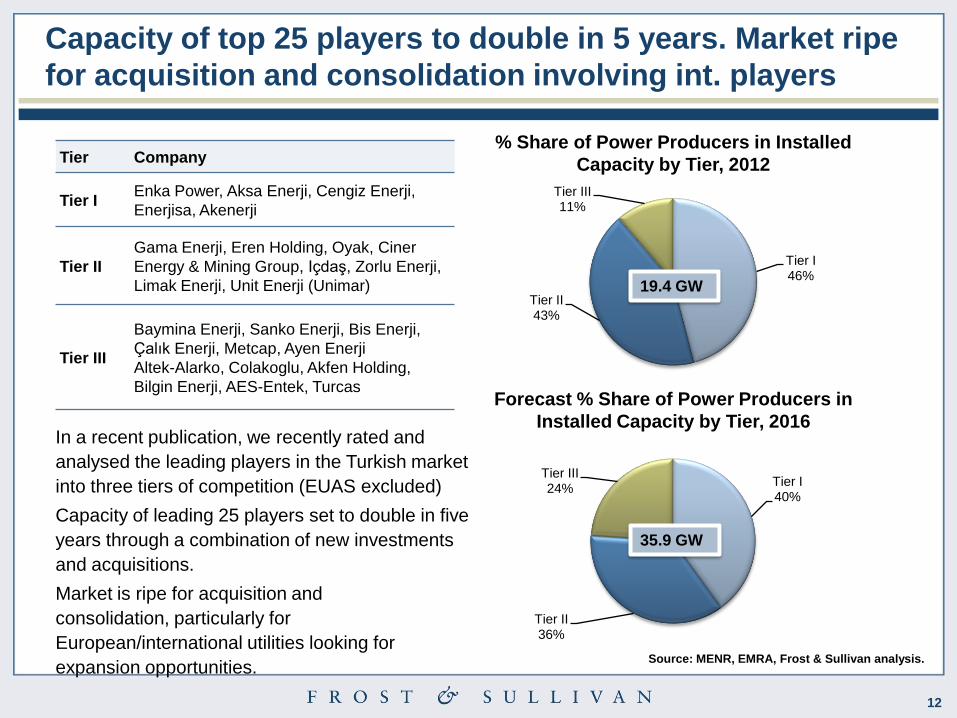
Capacity of top 25 players to double in 5 years. Market ripe
for acquisition and consolidation involving int. players
Tier Company
Tier IEnka Power, Aksa Enerji, Cengiz Enerji,
Enerjisa, Akenerji
Tier II
Gama Enerji, Eren Holding, Oyak, Ciner
Energy & Mining Group, Içdaş, Zorlu Enerji,
Limak Enerji, Unit Enerji (Unimar)
Tier III
Baymina Enerji, Sanko Enerji, Bis Enerji,
Çalık Enerji, Metcap, Ayen Enerji
Altek-Alarko, Colakoglu, Akfen Holding,
Bilgin Enerji, AES-Entek, Turcas
Source: MENR, EMRA, Frost & Sullivan analysis.
Tier I40%
Tier II 36%
Tier III24%
Tier I46%
Tier II43%
Tier III11%
% Share of Power Producers in Installed
Capacity by Tier, 2012
Forecast % Share of Power Producers in
Installed Capacity by Tier, 2016
19.4 GW
35.9 GW
In a recent publication, we recently rated and
analysed the leading players in the Turkish market
into three tiers of competition (EUAS excluded)
Capacity of leading 25 players set to double in five
years through a combination of new investments
and acquisitions.
Market is ripe for acquisition and
consolidation, particularly for
European/international utilities looking for
expansion opportunities.
13
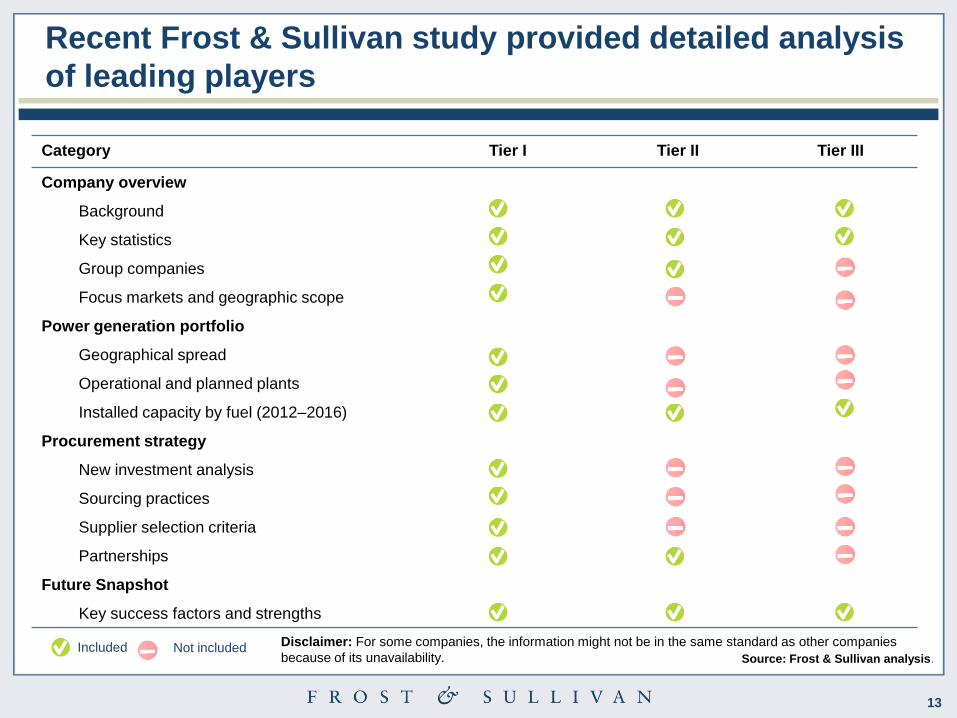
Recent Frost & Sullivan study provided detailed analysis
of leading players
Category Tier I Tier II Tier III
Company overview
Background
Key statistics
Group companies
Focus markets and geographic scope
Power generation portfolio
Geographical spread
Operational and planned plants
Installed capacity by fuel (2012–2016)
Procurement strategy
New investment analysis
Sourcing practices
Supplier selection criteria
Partnerships
Future Snapshot
Key success factors and strengths
Not includedIncluded Disclaimer: For some companies, the information might not be in the same standard as other companies
because of its unavailability. Source: Frost & Sullivan analysis.
14
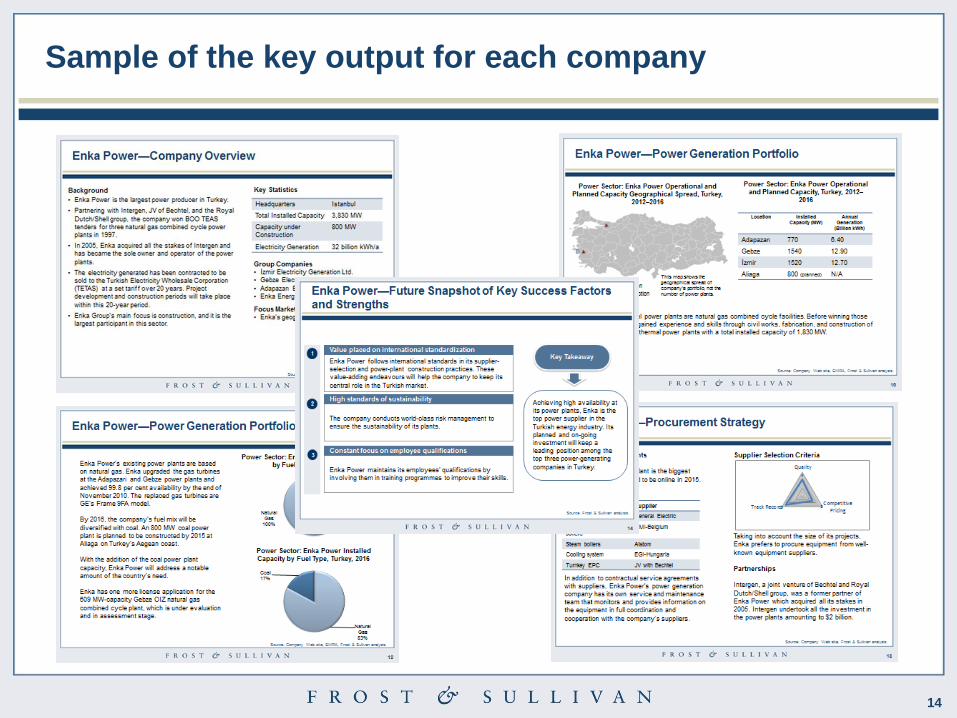
Sample of the key output for each company

15
0
20
40
60
80
100
120
140
160
180
200
2011 2012 2013 2014 2015 2016 2017
Industry 3.6 3.9 4.2 4.5 4.9 5.4 5.9
OIZ 6.4 7.2 7.8 8.5 9.5 10.6 11.5
Gas & Water Distribution 8.3 9.2 11.1 12.1 13.0 13.8 14.6
Power Distribution 62.0 71.3 75.1 80.7 86.5 93.0 100.5
Power Tranmission 9.7 7.6 8.1 10.2 9.9 10.6 10.9
Power Generation - - 4.3 6.9 10.3 15.3 22.1
To
tal M
ark
et
Reve
nu
es
(€
Mil
lio
n)
Total Market Revenues by Sectors, 2011 - 2017
CAGR: 10.8 %
Massive investment forecast for T&D, as Turkey seeks to
boost grid performance

16
The Challenge Project Objectives
A world leader for smart grid and automation
equipment wanted to assess the market
opportunity and develop a strategic road map
for Smart Grids Services and Solutions in
Turkey. The client wanted to assess 5 key
customer segments namely; power
generation, power transmission, power
distribution, organised industrial zones and
infrastructure and transportation.
• Provide a top level macro analysis of the Turkish
electricity market
• Assess the regulatory landscape and determine key
legislative impacts on future smart grid deployment
• Analyse the potential market opportunity for Smart Grid
Services and Solutions to 2020 (2011 base year)
•Identify key competitors and profile market leaders; and
• Provide key conclusions and recommendations for our
client to develop an effective market development strategy.
Our Approach and Work
Frost & Sullivan developed the analysis from both a ‘bottom –up’ approach, where customer bases were
concentrated and through a ‘top-down’ approach where industry databases were available and the
customers base was highly fragmented. Interviews were conducted with 100 key market participants
(competitors and customers) to ascertain current requirements and spending plans. In addition, extensive
desk research was used to cross check and supplement the analysis.
Outcome and Business Impact
• The project lasted for 12 weeks and this involved close interaction (weekly onsite work) with the client.
• Frost & Sullivan presented the data to the key strategy development stakeholders
•These inputs will be used in our clients yearly business strategy development plans.
Case Study: Strategic Analysis of the Smart Grid
Services and Solutions Market in Turkey
17
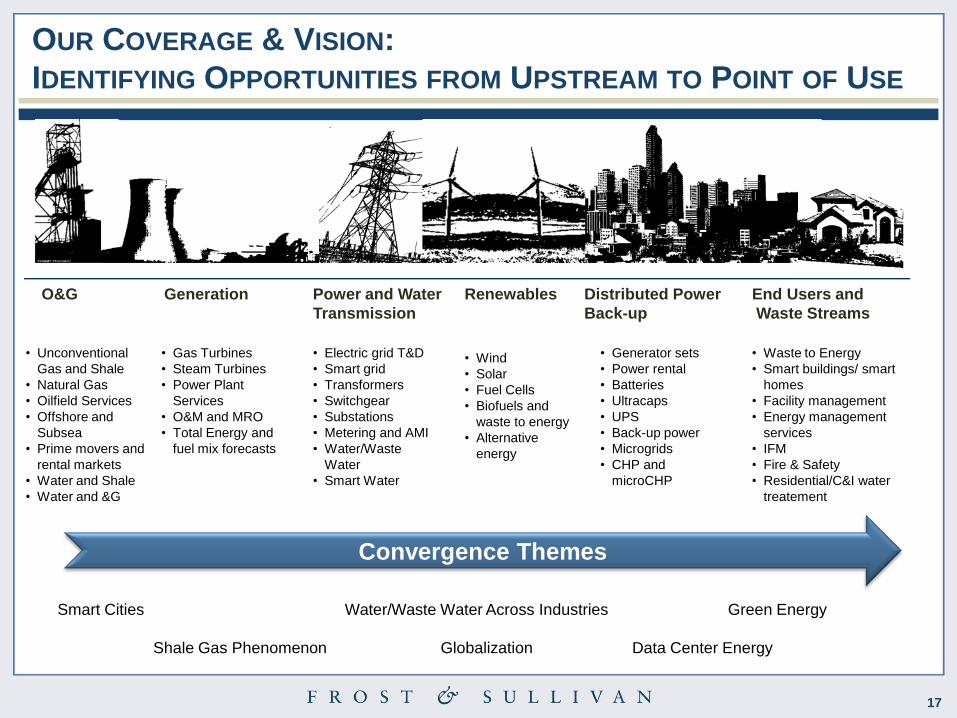
O&G Generation Power and Water
Transmission
Renewables Distributed Power End Users and
Back-up Waste Streams
OUR COVERAGE & VISION:
IDENTIFYING OPPORTUNITIES FROM UPSTREAM TO POINT OF USE
• Unconventional
Gas and Shale
• Natural Gas
• Oilfield Services
• Offshore and
Subsea
• Prime movers and
rental markets
• Water and Shale
• Water and &G
• Gas Turbines
• Steam Turbines
• Power Plant
Services
• O&M and MRO
• Total Energy and
fuel mix forecasts
• Electric grid T&D
• Smart grid
• Transformers
• Switchgear
• Substations
• Metering and AMI
• Water/Waste
Water
• Smart Water
• Wind
• Solar
• Fuel Cells
• Biofuels and
waste to energy
• Alternative
energy
Convergence Themes
• Generator sets
• Power rental
• Batteries
• Ultracaps
• UPS
• Back-up power
• Microgrids
• CHP and
microCHP
• Waste to Energy
• Smart buildings/ smart
homes
• Facility management
• Energy management
services
• IFM
• Fire & Safety
• Residential/C&I water
treatement
Smart Cities Water/Waste Water Across Industries Green Energy
Shale Gas Phenomenon Globalization Data Center Energy
18
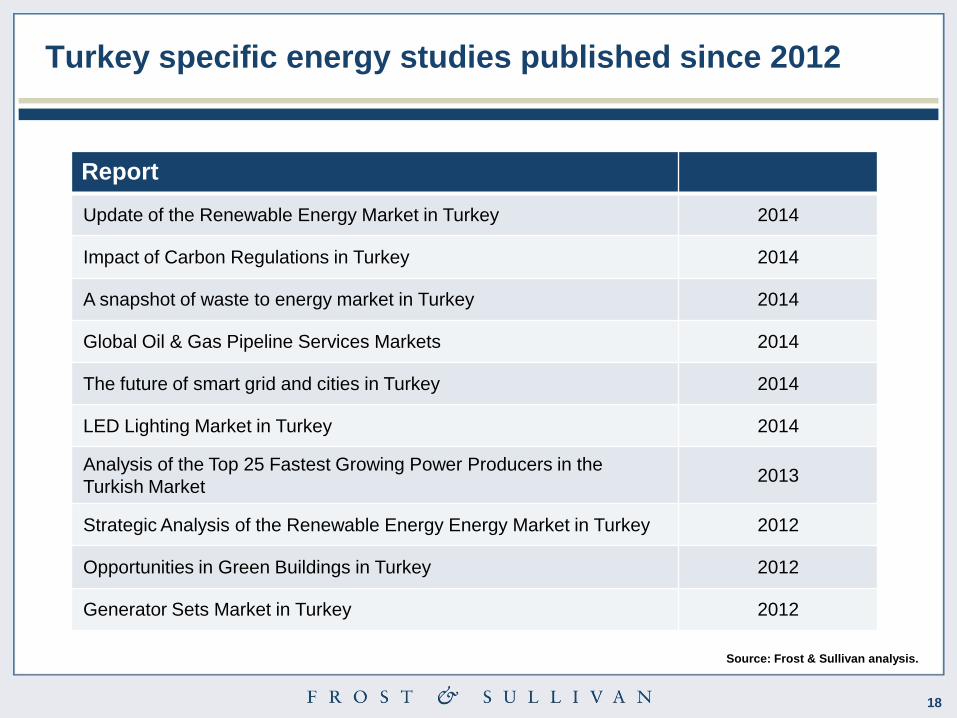
Turkey specific energy studies published since 2012
Source: Frost & Sullivan analysis.
Report
Update of the Renewable Energy Market in Turkey 2014
Impact of Carbon Regulations in Turkey 2014
A snapshot of waste to energy market in Turkey 2014
Global Oil & Gas Pipeline Services Markets 2014
The future of smart grid and cities in Turkey 2014
LED Lighting Market in Turkey 2014
Analysis of the Top 25 Fastest Growing Power Producers in the
Turkish Market2013
Strategic Analysis of the Renewable Energy Energy Market in Turkey 2012
Opportunities in Green Buildings in Turkey 2012
Generator Sets Market in Turkey 2012

19
Melih Nalcıoğlu
• Melih Nalcioglu is a research manager in Frost & Sullivan's Turkey office with 12 years consulting experience
on Turkey market cross industries. Before joining Frost & Sullivan, Melih was involved in boutique consulting
projects mainly for European companies that would like to enter Turkish market. Melih has managed
approximately 25 consulting projects for Frost & Sullivan.
Ozge Ozeke
• Ozge has been working as a Senior Research Analyst in Frost & Sullivan’s Energy & Environment team in
Turkey for 3 years. She has participated in several consulting studies in smart grid, wind, waste to
energy, building technologies, power back-up systems and authored research reports on
renewables, investment opportunities in energy and green buildings in Turkey.
Hikmet Cakmak
• Hikmet is an Industry Analyst and has been working in cross industry studies and projects, mostly in Energy
& Environment and Automotive & Transportation. He has participated in projects on smart grid, wind and
back up power, electric vehicles and urban mobility. He has authored reports on gas and diesel gensets and
lighting.
The team in Turkey is supported where required from our European offices. Local European project
management is also available.
Key members of the Turkish Energy team
20
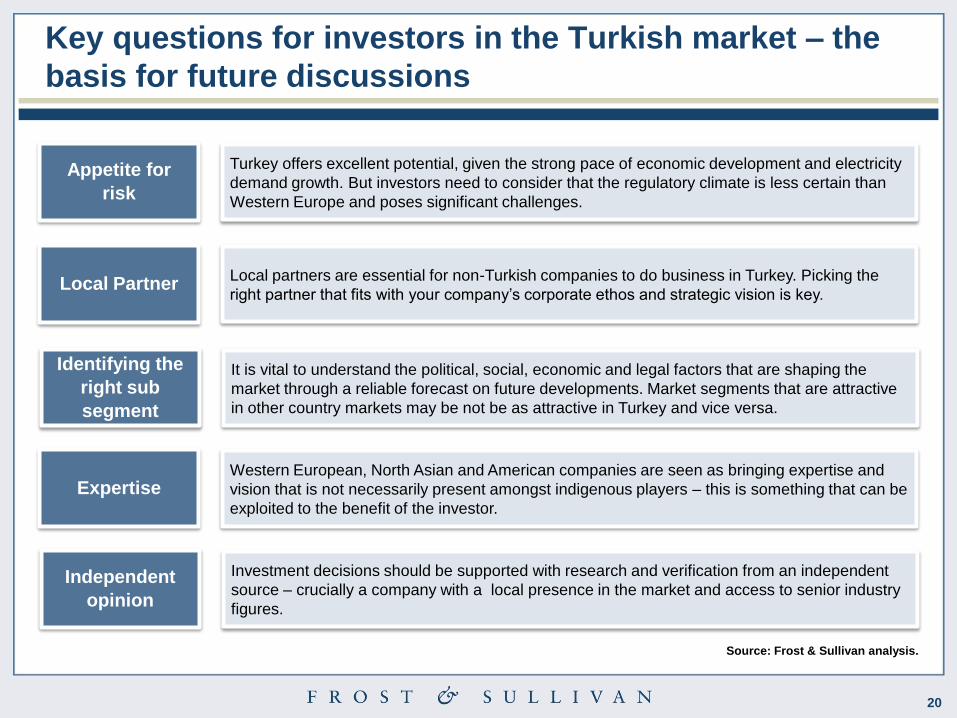
Key questions for investors in the Turkish market – the
basis for future discussions
Source: Frost & Sullivan analysis.
Independent
opinion
Investment decisions should be supported with research and verification from an independent
source – crucially a company with a local presence in the market and access to senior industry
figures.
Appetite for
risk
Turkey offers excellent potential, given the strong pace of economic development and electricity
demand growth. But investors need to consider that the regulatory climate is less certain than
Western Europe and poses significant challenges.
Identifying the
right sub
segment
It is vital to understand the political, social, economic and legal factors that are shaping the
market through a reliable forecast on future developments. Market segments that are attractive
in other country markets may be not be as attractive in Turkey and vice versa.
Local PartnerLocal partners are essential for non-Turkish companies to do business in Turkey. Picking the
right partner that fits with your company’s corporate ethos and strategic vision is key.
ExpertiseWestern European, North Asian and American companies are seen as bringing expertise and
vision that is not necessarily present amongst indigenous players – this is something that can be
exploited to the benefit of the investor.
21
About Frost & Sullivan
22
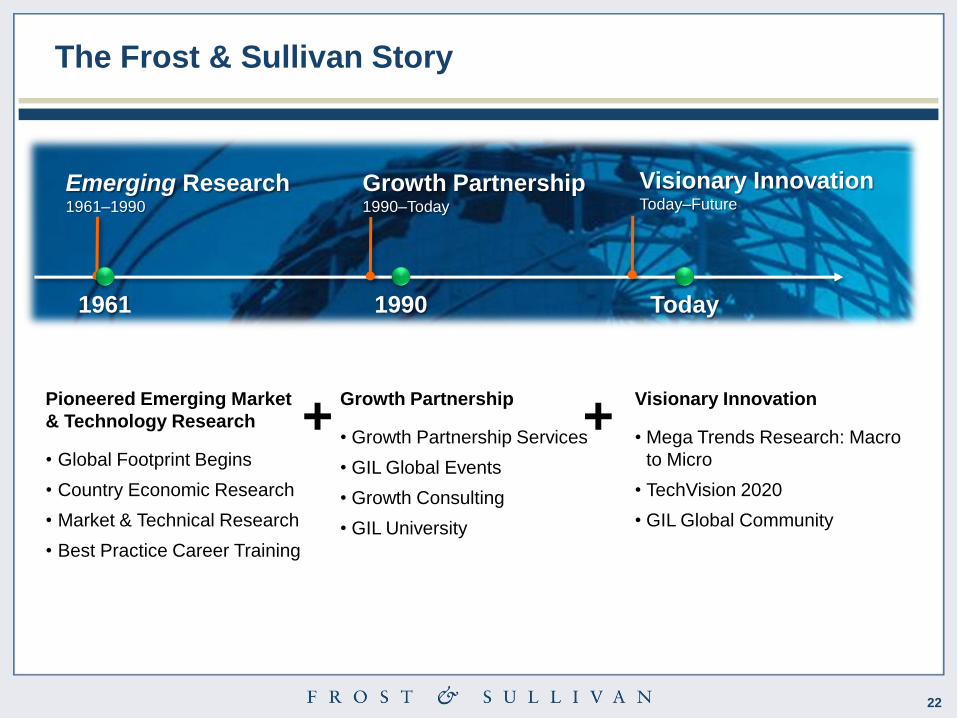
The Frost & Sullivan Story
1961 1990 Today
Emerging Research1961–1990
Pioneered Emerging Market
& Technology Research
• Global Footprint Begins
• Country Economic Research
• Market & Technical Research
• Best Practice Career Training
Growth Partnership
• Growth Partnership Services
• GIL Global Events
• Growth Consulting
• GIL University
Growth Partnership1990–Today
Visionary InnovationToday–Future
Visionary Innovation
• Mega Trends Research: Macro
to Micro
• TechVision 2020
• GIL Global Community
+ +
23
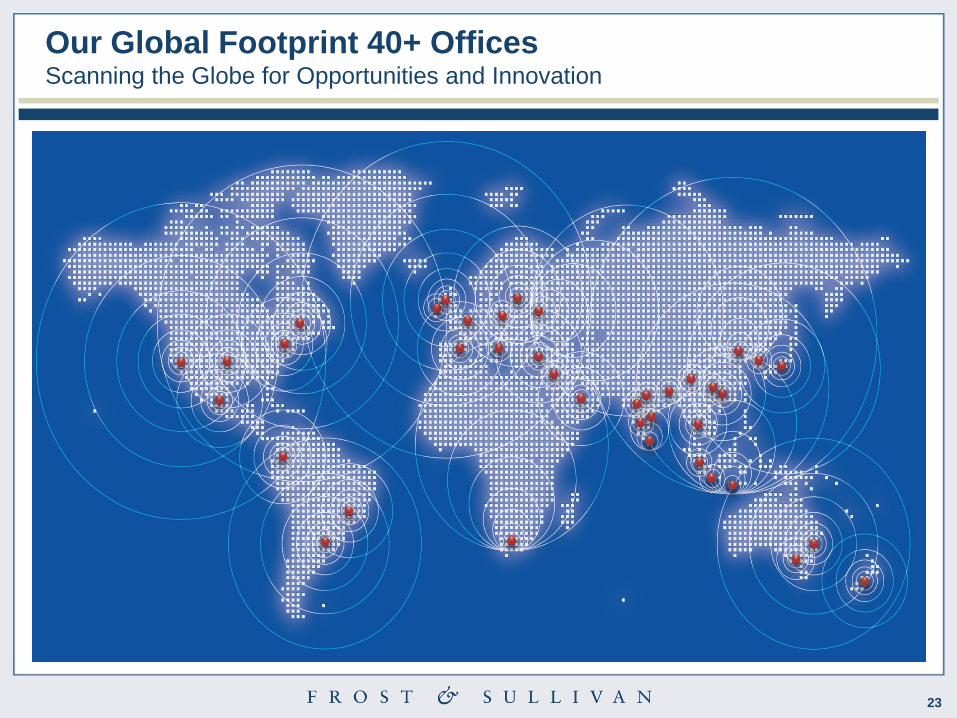
Our Global Footprint 40+ OfficesScanning the Globe for Opportunities and Innovation
24
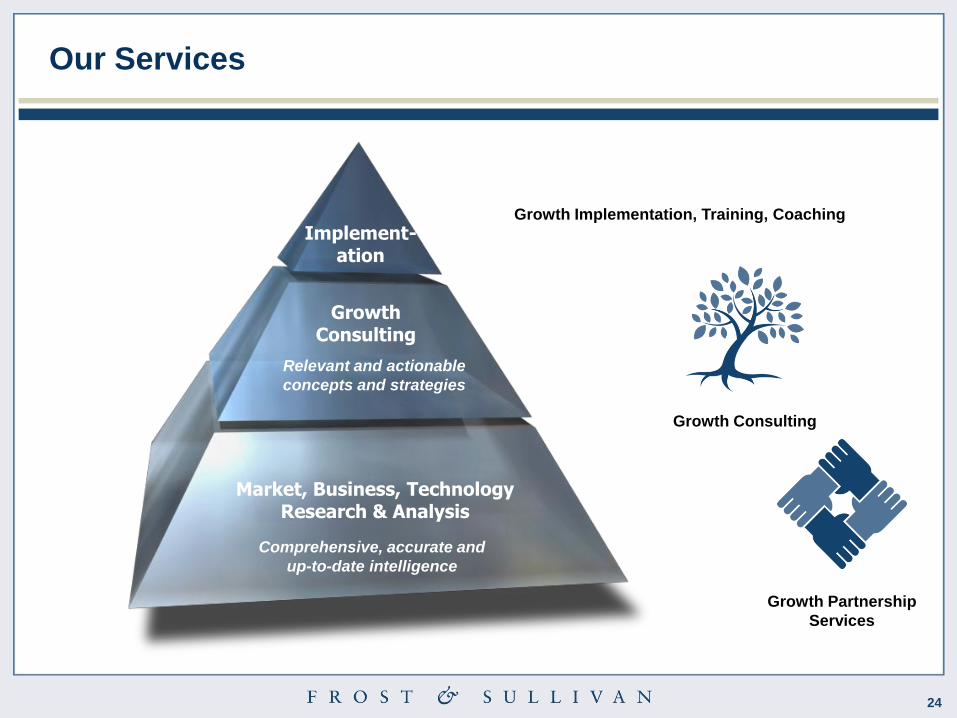
Our Services
Market, Business, Technology Research & Analysis
GrowthConsulting
Implement-ation
Relevant and actionable
concepts and strategies
Comprehensive, accurate and
up-to-date intelligence
Growth Implementation, Training, Coaching
Growth Consulting
Growth Partnership
Services

25
Our Industry Coverage
Automotive&
Transportation
Aerospace & Defense Measurement &
Instrumentation
Information &
Communication
Technologies
Healthcare
Environment & Building
Technologies
Energy & Power
Systems
Chemicals, Materials
& Food
Electronics &
Security
Industrial Automation
& Process ControlAutomotive
Transportation & Logistics
Consumer
Technologies
Minerals & Mining

26
Contacts
Jonathan Robinson
Senior Consultant
Energy, Environment & Building
Technologies
+(44)207.915.7883
Chiara Carella
Head of Corporate Communications
Europe, Israel and Africa
+44 (0) 207 343 8314
Recommended