Jurisdictional Review of Dynamic Pricing of
Electricity
Prepared for:
Ontario Energy Board
October 29, 2014
poweradvisoryllc.com
978-369-2465

Power Advisory RPP Jurisdictional Review of Dynamic Pricing Report Page i
Table of Contents
1 Introduction ............................................................................................................................... 1 1.1 Background ........................................................................................................................ 1 1.2 The Legislative Context for the RPP ................................................................................. 1 1.3 Report Contents ................................................................................................................. 2
2 Definition and High Level Review of Dynamic Pricing Alternatives ...................................... 3 2.1 Reasons for and Objectives of Dynamic Pricing ............................................................... 3 2.2 Barriers to Acceptance of Dynamic Pricing ...................................................................... 3 2.3 Definition of Dynamic Pricing .......................................................................................... 4
2.3.1 RTP ............................................................................................................................. 4 2.3.2 CPP ............................................................................................................................. 4 2.3.3 CPR ............................................................................................................................ 5 2.3.4 TOU ............................................................................................................................ 5
3 Ontario’s Experience with Dynamic Pricing ............................................................................ 7 3.1 The RPP and TOU ............................................................................................................. 7 3.2 Reviews of Ontario’s RPP ................................................................................................. 8
3.2.1 Brattle Group Review: 2010 ....................................................................................... 8 3.2.2 Brattle Group Review: 2013 ....................................................................................... 9 3.2.3 Navigant Review: 2013 .............................................................................................. 9
4 Jurisdictional Review .............................................................................................................. 10 4.1 California ......................................................................................................................... 10
4.1.1 Statewide Pricing Pilot (2003-2004) ........................................................................ 10 4.2 Florida .............................................................................................................................. 13
4.2.1 Energy Select Program (2000-present)..................................................................... 13 4.3 Georgia ............................................................................................................................ 16
4.3.1 PoweRewards Program (2008-2009) ....................................................................... 16 4.3.2 Other Programs in Georgia ....................................................................................... 18
4.4 Illinois .............................................................................................................................. 19 4.4.1 Energy-Smart Pricing Plan (2003-2006) .................................................................. 19 4.4.2 Residential Real Time Pricing (2007-present) ......................................................... 20 4.4.3 Power Smart Pricing (2007-present) ........................................................................ 20
4.5 Missouri ........................................................................................................................... 21 4.5.1 Residential Time-Of-Use Study (2004-2005) .......................................................... 21
4.6 New South Wales, Australia ............................................................................................ 24 4.6.1 Smart Grid, Smart City Project: EnergyAustralia Trial (2012-2014) ....................... 24
4.7 Ontario ............................................................................................................................. 27 4.7.1 Ontario Smart Price Pilot (2006-2007) ..................................................................... 27
4.8 Washington D. C. ............................................................................................................ 31 4.8.1 PowerCentsDC Program (2008-2009) ..................................................................... 31
5 Assessment of Dynamic Pricing Alternatives ......................................................................... 36 5.1 Objectives of Dynamic Pricing Alternatives ................................................................... 36 5.2 Common Implementation Issues ..................................................................................... 39
5.2.1 Voluntary vs. Mandatory Programs ......................................................................... 39 5.2.2 Enabling Technologies ............................................................................................. 40 5.2.3 Two-Way Communication ....................................................................................... 41 5.2.4 Education .................................................................................................................. 42
Power Advisory RPP Jurisdictional Review of Dynamic Pricing Report Page ii
5.2.5 Tie-ins with Other Conservation and Demand Management Programs ................... 43 5.2.6 Billing System Changes ........................................................................................... 44
5.3 Dynamic Pricing Alternatives .......................................................................................... 45 5.3.1 Real Time Pricing ..................................................................................................... 45 5.3.2 Critical Peak Pricing ................................................................................................. 49 5.3.3 Critical Peak Rebates ................................................................................................ 55 5.3.4 Time-of-Use Rates ................................................................................................... 56
5.4 Investing in Dynamic Pricing in Ontario ......................................................................... 60 6 Summary and Conclusions ...................................................................................................... 63
6.1 Ontario’s Experience To Date ......................................................................................... 63 6.2 Experience with Dynamic Pricing in Other Jurisdictions ................................................ 63 6.3 Dynamic Pricing Options for Further Consideration by Ontario Stakeholders ............... 66
Appendix A: Literature Review .................................................................................................... 69

Power Advisory RPP Jurisdictional Review of Dynamic Pricing Report Page iii
List of Tables
Table 1: Navigant 2013 Review Results ......................................................................................... 9 Table 2: Statewide Pricing Pilot Program Details ......................................................................... 11 Table 3: Statewide Pricing Pilot Key Findings ............................................................................. 12 Table 4: Energy Select Program Details ....................................................................................... 14 Table 5: Residential Time-of-Use Study Program Details ............................................................ 22 Table 6: Smart Grid, Smart City Program Details ......................................................................... 25 Table 7: Smart Grid, Smart City Consumer Retention .................................................................. 26 Table 8: Ontario Smart Price Pilot Program Details ..................................................................... 29 Table 9: Distribution of OSPP Participant Bill Savings ................................................................ 30 Table 10: PowerCentsDC Program Details ................................................................................... 33 Table 11: Summary of Appropriateness of Dynamic Pricing Alternatives to RPP Consumers .... 65 Table 12: List of Key Articles ....................................................................................................... 69
List of Figures
Figure 1: The OSPP Refrigerator Magnet ..................................................................................... 31 Figure 2: Ontario Peak Day Load Profiles .................................................................................... 52

Power Advisory RPP Jurisdictional Review of Dynamic Pricing Report Page iv
Abbreviations
A/C Air conditioning
Act Ontario Energy Board Act, 1998
ComEd Commonwealth Edison, a utility in Illinois
CPP Critical peak pricing
CPP-F Critical peak pricing with fixed event hours
CPP-V Critical peak pricing with variable event hours
CPR Critical peak rebate
DR Demand response
ESPP Energy Smart Pricing Program (ComEd, in Illinois)
GA Global Adjustment
LDC Local distribution company in Ontario
NEU Normal electric usage
OEB Ontario Energy Board
OSPP Ontario Smart Price Pilot
PCT Programmable controllable thermostat
PG&E Pacific Gas & Electric Company, a utility in California
PSP Power Smart Pricing (Ameren Illinois)
RPP Regulated Price Plan
RRTP Residential Real-Time Pricing (ComEd, in Illinois)
RTP Real-time pricing
SDG&E San Diego Gas & Electric Company, a utility in California
SGSC Smart Grid, Smart City (New South Wales, Australia)
SME Smart Metering Entity (Ontario)
SPP Statewide Pricing Pilot (California)
TOU Time-of-use
TOU-CPP Time-of-use plus critical peak pricing

Power Advisory RPP Jurisdictional Review of Dynamic Pricing Report Page 1
1 Introduction
1.1 Background
Approximately 4.8 million Ontario electricity residential and small commercial consumers have smart
meters and approximately 4.6 million of these consumers, about 96%, are billed based on time-of-use
(TOU) prices under the Ontario Energy Board’s (OEB or Board) Regulated Price Plan (RPP).1 The
Board identified a comprehensive review of the RPP as a key Business Plan initiative for Fiscal Year
2014-15 and undertook a review of the way in which consumers are responding to TOU pricing in
2013. The results of this study will be used to assess options for modifying the TOU pricing structure.
The OEB staff engaged Power Advisory LLC (Power Advisory) to produce a report that (1)
undertakes a comprehensive jurisdictional review of dynamic electricity pricing2 and (2) presents
options for the design, development, and implementation of dynamic pricing structures in Ontario.
Specifically, Board staff requested Power Advisory to provide a comprehensive review of dynamic
pricing options, including time-of-use pricing, to assist Board staff in assessing if, and how, the RPP
should evolve to meet policy objectives. Under the review, dynamic electricity pricing mechanisms
used in other jurisdictions and their potential applicability to Ontario are examined.
Power Advisory was retained to undertake this jurisdictional review of dynamic electricity pricing as
part of a broader stakeholder consultation process and outreach exercise. The purpose of this report is
not to provide definitive conclusions, but to frame discussions with stakeholders by providing analysis
and background information.
The challenge associated with implementing widespread dynamic pricing for residential and low
volume consumers is “designing a tariff that delivers tangible benefits to electricity consumers
without subjecting them to unacceptable levels of price risk.”3 This report reviews dynamic pricing
programs and outlines possible alternatives for addressing this challenge.
1.2 The Legislative Context for the RPP
Under amendments to the Ontario Energy Board Act, 1998 (Act) contained in the Electricity
Restructuring Act, 2004, the Board is mandated to develop the RPP. Section 79.16 of the Act assigns
the Board responsibility for determining electricity commodity prices for eligible RPP consumers.
Consumer eligibility for the RPP is determined by the RPP Regulation which also requires the Board
to forecast the cost of electricity used by these consumers and to ensure that the prices reflect that
cost.4 The Act also requires the Board to adjust RPP prices to clear any balances in the Ontario
1 Ontario Energy Board, “Backgrounder – May 1 electricity price change”, April 16, 2014
(http://www.ontarioenergyboard.ca/oeb/_Documents/Press%20Releases/bg_RPP_TOU_20140416.pdf), p. 1. 2 The OEB request for proposals for this project specified that time-use-pricing was to be considered in the
review of dynamic electricity pricing alternatives. 3 Frank A. Wolak, “An Experimental Comparison of Critical Peak and Hourly Pricing: The PowerCentsDC
Program”, March 13, 2010 (http://web.stanford.edu/group/peec/cgi-
bin/docs/policy/research/An%20Experimental%20Comparison%20of%20Critical%20Peak%20and%20Hourly
%20Pricing.pdf), p. 6. 4 O. Reg. 95/05 (Classes of Consumers and Determination of Rates).

Power Advisory RPP Jurisdictional Review of Dynamic Pricing Report Page 2
Power Authority variance account, which is used to account for differences between the RPP forecast
and actual costs, over a 12-month period.
As currently implemented, the RPP employs TOU pricing with three time periods and a peak/off-peak
price ratio of 1.8 for the vast majority of eligible consumers. Chapter 3 reviews the current TOU
pricing framework in greater detail.
1.3 Report Contents
The first Chapter is this introduction. Chapter 2 reviews the various dynamic pricing options that
could be employed in Ontario. Chapter 3 reviews Ontario’s RPP focusing on the TOU pricing
component and summarizes findings from recent reviews of the RPP. Chapter 4 summarizes the
results of the jurisdictional review and reviews different dynamic pricing programs that have been
employed in North America and Australia. Chapter 5 provides a general assessment of the various
dynamic pricing alternatives. The final chapter focuses on implications for Ontario, focusing first on
Ontario’s electricity system and then assessing the degree to which various program designs are likely
to promote or frustrate the achievement of the various identified objectives. Appendix A provides a
review of some of the literature regarding dynamic pricing and is intended to assist stakeholders in
identifying additional resources that they can draw upon to enhance their understanding of dynamic
pricing.
Power Advisory RPP Jurisdictional Review of Dynamic Pricing Report Page 3
2 Definition and High Level Review of Dynamic Pricing Alternatives
2.1 Reasons for and Objectives of Dynamic Pricing
A critical element of efficient electricity markets is demand-side participation where consumers
respond to prices. Because it is very costly to store electricity, wholesale electricity prices can vary
greatly – in some cases by more than an order of magnitude – over a single day. Without dynamic
pricing, retail consumers have little or no incentive to reduce consumption when power is expensive.
Dynamic pricing, where prices reflect the time-varying marginal costs of generating electricity, is
inherently more efficient than “static pricing”. By providing a price signal that reflects real-time
market conditions and costs, dynamic pricing enhances the efficiency of consumer consumption
decisions, promoting allocative efficiency. Consumers consume electricity only if they value it at
least equal to its cost. Dynamic pricing also promotes more efficient system operations. Higher
prices during peak periods when higher-cost resources are operating cause consumers to reduce
consumption and their reliance on these resources. Dynamic pricing can also be a strong deterrent to
the exercise of market power, as consumers respond to high prices by reducing demand, which
reduces the sales of the supplier that is exercising market power by withholding output, thus offsetting
the benefit from these higher prices. Conversely, lower prices during low demand periods or when
there is additional output available from variable output renewable energy resources will result in
higher demand, which in turn can facilitate the integration of these resources.5 In the long term,
productive efficiency is promoted whereby the development of electricity infrastructure is efficient.
For example, dynamic pricing can reduce requirements for peaking generation resources and
transmission and distribution investment through higher prices during peak periods or when the
electricity supply infrastructure is stressed.
2.2 Barriers to Acceptance of Dynamic Pricing
While the implementation of dynamic pricing can offer significant benefits, there are significant
barriers to the adoption of such programs. One of the most significant barriers can be the costs of
necessary infrastructure including purchasing and installing smart meters – a cost which Ontario has
incurred and hence is no longer an issue – and in some instances the infrastructure and systems
required for two-way communication and changes in billing systems.
Consumer acceptance of dynamic pricing is also critical issue. Even if adopted on an opt-in basis to
mitigate this concern, some may argue that consumers will not fully understand the risks that they are
accepting, i.e., the risk of high bills if they fail to reduce consumption during peak periods when
dynamic prices are high. These concerns are often amplified for more vulnerable low-income
consumers who may be perceived as having less ability to respond to these price signals. As further
discussed in subsequent chapters of this report, Power Advisory believes that these barriers and
concerns can be overcome through proper design of a dynamic pricing program.
5 With the growth in rooftop solar, Hawaii is experiencing dramatic increases in its requirement for ramping and
is evaluating dynamic load control to manage these requirements. While the dynamic pricing programs
evaluated in this report aren’t designed to provide this capability, this experience clearly indicates the value that
increased demand response facilitated by dynamic pricing can play in addressing this need.

Power Advisory RPP Jurisdictional Review of Dynamic Pricing Report Page 4
2.3 Definition of Dynamic Pricing
In the broadest terms, dynamic pricing is typically defined as prices which are not known with
certainty ahead of time.6 Generally, dynamic prices for end-use electricity consumers reflect the time-
varying marginal costs of generating electricity. There are a range of dynamic pricing alternatives
including: (1) Real Time Pricing (RTP) where prices vary by hour or time interval based on actual
system costs; (2) Critical Peak Pricing (CPP) where prices vary based on system costs or operating
conditions, with the electric utility, local distribution company, or system operator able to designate
CPP intervals when these prices are applied; (3) Critical Peak Rebate (CPR) which is a mirror image
of CPP, but instead of paying higher rates during the critical event hours, participants receive a cash
rebate for each kWh of load that they reduce below their baseline usage during the event hours; and
(4) TOU pricing where different price levels are established ex ante for different periods, based on the
estimated underlying cost during that period. With prices established before the fact, TOU in strict
terms isn’t a dynamic pricing alternative. Each of these alternatives is described further below.
2.3.1 RTP
Under RTP, consumers pay electricity prices that are linked to the wholesale cost of electricity on an
hourly (or sub-hourly) basis. In jurisdictions with administered competitive wholesale markets, these
prices can reflect hourly energy prices in the day-ahead or real-time markets.7 Traditionally, RTP
programs were offered just to utilities’ largest consumers, but with declines in the cost of advanced
metering infrastructure, RTP programs can be employed for residential consumers. Although RTP
may be ideal from a price signal perspective, resulting in efficient prices and eliminating any cross-
subsidies, for smaller mass market consumers (e.g., residential and small commercial) it may not be
the best option given many of these consumers are not in position to shape their demand in response
to these prices. For the majority of mass market consumers, approximations of RTP may make more
sense.8 In particular, unless these consumers have direct load control devices or smart appliances
which allow their demand to respond automatically to such prices, there may be a cost to respond such
that prices have to reach a certain level or be sustained at that level for an extended period to justify
the cost or effort of responding. Therefore, without assurances regarding future price levels beyond
the current price interval, consumers may be unwilling to commit to making the desired demand
reductions.
2.3.2 CPP
In contrast to RTP where prices can vary from hour-to-hour at all times, under CPP the period of time
(such as from 2 p.m. to 7 p.m.) and the number of days per year (e.g., 12 days in the summer months)
6 TOU pricing is typically not a form of dynamic pricing because the rate schedule is static and pre-determined.
However, for the purposes of this report TOU is treated as a dynamic pricing alternative. 7 Day-ahead prices are energy market prices which are established the day prior, with the objective of providing
price certainty to assist generators make efficient decisions as to when to commitment and dispatch their
generating unit. Such markets also have real-time market that clears in real-time based on offers by suppliers
and bids by load. 8 Institute for Electric Efficiency, “Moving Toward Utility Scale Deployment of Dynamic Pricing in Mass
Markets”, June 2009 (http://www.edisonfoundation.net/iei/Documents/IEE_Utility-
ScaleDynamicPricing_0609.pdf), p. 3.
Power Advisory RPP Jurisdictional Review of Dynamic Pricing Report Page 5
when the special rate would be in effect are often determined in advance. However, there is
uncertainty surrounding the exact days when these critical prices go into effect since this depends on
actual wholesale market prices or conditions. CPP is a dynamic rate in that it is dispatchable by the
utility based on wholesale market conditions. Frank Wolak states “The critical peak pricing (CPP)
tariff addresses the cost of taking action by pre-committing to a CPP event that can last up to 4 to 6
hours, during which retail prices are set at very high level.”9
CPP attempts to convey the true cost of power generation to electricity consumers by providing a
price signal that more accurately reflects energy costs during the small percentage of all hours which
are the most critical. This rate form is particularly effective when high wholesale prices are limited to
about 75-100 hours of the year that occur during reasonably predictable seasons and times of the
day.10
2.3.3 CPR
CPR is effectively a mirror image of the CPP.11 The CPR pays a rebate that depends on the amount a
consumer’s hourly consumption is below a reference level during a CP event. However, different
from CPP pricing, if the consumer’s hourly consumption is not below the reference level, the
consumer pays for his consumption during a CPP event at the standard retail price. In contrast, a
consumer on the CPP tariff pays for all of his consumption at the high CPP period price during a CPP
event. Therefore, the CPR tariff provides a consumer with the option to forgo taking action to reduce
demand during a CPP period, with no consequence since the consumer pays for this consumption at
the standard price. This “option to quit” limits CPR’s effectiveness since the consumer can elect to not
participate when the CPR interval is called, with no penalty. Clearly, this is a significant benefit to
consumers and reduces the risks of participating in a dynamic pricing program. From this perspective,
CPR offers automatic bill protection in that consumers will not pay more than what they pay under the
standard rates. Such a concept may provide a politically feasible way to transition from the current
TOU rates and for an eventual transition to other flexible rate options such as CPP or RTP.
Implementation of CPR also poses problems. In particular, the method for establishing the baseline
can result in a disincentive for energy efficiency investments that would reduce the baseline. Other
problems that need to be addressed include estimation of free-ridership, finding a source for payment
of the rebates, and dealing with the problems of transitioning from a rebate mechanism to a price-
based mechanism.
2.3.4 TOU
Under TOU pricing, distinct prices based on projected cost differences for the future are set for
different periods, which include a peak, off-peak and in some cases, a shoulder period. Typically,
these prices are set for months or even a year at a time.
Since TOU rates are set before the fact, they will not follow actual system costs, which tend to vary
with shorter run variations in the supply/demand balance. As a result, TOU pricing generally provide
9 Wolak (2010), p. 3. 10 Institute for Electric Efficiency (2009), p. 3. 11 CPR is sometimes referred to as “peak-time rebate.”

Power Advisory RPP Jurisdictional Review of Dynamic Pricing Report Page 6
price signals that promote less efficient consumption decision than the other dynamic pricing
alternatives.

Power Advisory RPP Jurisdictional Review of Dynamic Pricing Report Page 7
3 Ontario’s Experience with Dynamic Pricing
3.1 The RPP and TOU
Dynamic pricing for Ontario’s RPP consumers is currently limited to TOU pricing.12 Ontario is the
only jurisdiction, other than Italy, to require smart meters for all residential consumers and to mandate
TOU rates for generation costs for all consumers on the RPP.
The RPP has three time periods. The three TOU pricing periods are:
Off-peak period: winter and summer weekdays: 7 p.m. to 7 a.m.; winter and summer weekends
and holidays: 24 hours (all day);
Mid-peak period: winter weekdays (November 1 to April 30): 11 a.m. to 5 p.m.; summer
weekdays (May 1 to October 31): 7 a.m. to 11 a.m. and 5 p.m. to 7 p.m.
On-peak period: winter weekdays: 7 a.m. to 11 a.m. and 5 p.m. to 7p.m.; summer weekdays:
11 a.m. to 5 p.m.
Prices are set for six month periods beginning in May and November. Currently, TOU prices for
eligible consumers are 7.7¢ per kWh for off-peak, 11.4¢ per kWh for mid-peak and 14.0¢ per kWh for
on-peak, reflecting a 1.8 ratio relative to the off-peak price. These are RPP supply costs and do not
reflect the various other delivery, regulatory and debt retirement charges.
Time-of-use prices are set to make the forecast average price charged to consumers equal the forecast
average RPP supply cost. Wholesale market costs are assigned to the three TOU periods based on
forecasts of the average price in each period. To offset the convergence in TOU prices since
November 1, 2009 the Board has allocated Global Adjustment (GA) costs non-uniformly according to
when these costs are generated, i.e., during peak, mid-peak or off-peak hours. 13 For example,
nuclear-related GA costs are allocated equally to all kWh of load, while costs related to demand
response programs and the Lennox peaking plant are assigned to the peak period only.14
The RPP Manual, which outlines how RPP prices are to be established, states that
“An analysis of the forecast data for the first year of the RPP suggested that these prices
would occur in the ratio of roughly 1:2:3...In subsequent years, TOU price forecasts tended to
converge, primarily the result of GA costs becoming a greater percentage of total supply costs
and being allocated uniformly. In response to this trend…the Board has allocated GA costs
non-uniformly according to when these costs are generated, i.e., during peak, mid-peak or off-
peak hours. Subsequent price settings show that this type of GA cost allocation has offset
12 A number of LDCs have implemented pilot programs that evaluated other dynamic pricing alternatives such
as CPP. For example, Hydro Ottawa implemented a TOU pricing pilot in cooperation with the Board and
evaluated CPP and CPP rebates. This program is reviewed in Chapter 4. 13 The Board determined that “GA costs will be allocated to the TOU period when they are generated (in other
words, GA costs associated with peak supply costs are recovered through peak TOU prices and similarly for off-
peak and mid-peak supply costs and prices).” (RPP Manual, p. 29-30.) 14 Ontario Energy Board, “Regulated Price Plan: Price Report (November 2014 – October 2015)”, October 16,
2014 (http://www.ontarioenergyboard.ca/oeb/_Documents/EB-2004-
0205/RPP_Price_Report_Nov2014_20141016.pdf), p. 21.

Power Advisory RPP Jurisdictional Review of Dynamic Pricing Report Page 8
some of the convergence trend and partially restored the 1:2:3 ratio that was assumed by the
Board to be an adequate incentive for consumers to shift load.”15
3.2 Reviews of Ontario’s RPP
The OEB has undertaken a number of reviews of the RPP. The findings from these reviews are
summarized below to provide context for this jurisdictional review of dynamic pricing.
3.2.1 Brattle Group Review: 2010
In 2010 the Board engaged the Brattle Group (Brattle) to review the RPP, focusing in particular on the
TOU pricing framework employed.16 Brattle’s review employed a four step process: (1) reviewed
existing TOU rate; (2) identified areas for improvement; (3) established alternatives; and (4) evaluated
the alternatives.
In its review of the report the OEB staff noted “Brattle’s analysis shows that much of Ontario’s
current TOU price structure and price setting methodology is consistent with best practice elsewhere.
For example, three-period pricing structures are quite common in other jurisdictions. Moreover,
Ontario’s peak period is sufficiently short to allow consumers to shift consumption to lower-priced
periods.”17
The Staff Report continued “Brattle also found that Ontario’s price structure closely conforms to
Ontario’s system load curves and market price trends. In addition, different seasonal price structures
are justified because of Ontario’s winter double demand peak. The prima facie conclusion is that
Ontario’s TOU pricing structure and price setting methodology are well suited to the goals of fair
energy pricing and reduced overall power system costs.”18
However, Brattle found that “the area in which TOU design most significantly deviates from best
practices is in its peak-to-off-peak ratio.” Brattle noted that the then-current peak-to-off-peak price
ratio for the RPP of 1.9 to 1 was well below the average ratio of 4 to 1, with a higher ratio often
employed for TOU rates that are most effective in promoting permanent load shifting. Brattle
identified a number of rate design options for increasing the peak-to-off-peak price ratio including
reallocating wind and solar costs reflected in the Global Adjustment to the peak period,19 reducing the
peak period to four hours, setting peak and mid-peak prices based on costs and then solving for the
15 RPP Manual, p.31. 16 Ahmad Faruqui, Phil Hanser, Ryan Hledik and Jenny Palmer (The Brattle Group), “Assessing Ontario’s
Regulated Price Plan: A White Paper”, December 8, 2010
(http://www.ontarioenergyboard.ca/oeb/_Documents/EB-2010-0364/Report-
Assessing%20Ontarios%20Regulated%20Price%20Plan.pdf). 17 Ontario Energy Board, Staff Report to the Board, “Review of the Structure and Price Setting Methodology for
Time-of-Use Prices”, EB-2010-0364, March 25, 2011 (http://www.ontarioenergyboard.ca/oeb/_Documents/EB-
2010-0364/TOU_Consultation_Staff_Report_20110331.pdf), p. 2. 18 Ontario Energy Board (2011), p. 2. 19 Initially, the Board allocated global adjustment or “GA” costs uniformly on a per kilowatt-hour basis across
all TOU supply. To address the price convergence from this practice, in the fall of 2009, the Board determined
that GA costs will be allocated to the TOU period when they are generated. Specifically, GA costs associated
with peak supply costs are recovered through peak TOU prices and similarly for off-peak and mid-peak supply
costs and prices.

Power Advisory RPP Jurisdictional Review of Dynamic Pricing Report Page 9
off-peak price, and applying TOU only during the summer and having off-peak rate during the winter
period. Brattle didn’t offer definitive support for increasing the on-peak price ratio. The reallocation
of solar and wind costs in the GA to peak period did not generally receive support from stakeholders
in a subsequent OEB staff stakeholder consultation. Brattle concluded that the best path forward will
depend on the priorities of the OEB.
3.2.2 Brattle Group Review: 2013
The Brattle Group, along with Mountain Economic Consulting and Associates, Inc. and eMeter
(Siemens), were engaged by the Ontario Power Authority for a three-year study to analyze the impact
of Ontario’s TOU program. Their 2013 report20 looks at the first year in which consumers were on
TOU rates. Consumption data for approximately 140,000 consumers from five local distribution
companies (LDCs) was analyzed.
For residential consumers, the study found small but statistically significant impacts:
Demand reductions of 1.3% to 5.6%, depending on the LDC, at the time of system peaks
Load reductions of 2.6% to 5.7.% during the summer TOU peak period, somewhat less (1.6%
to 3.2%) during the winter peak period
Impacts were much smaller, and not statistically significant, for general service consumers. The study
will continue for two more years.
3.2.3 Navigant Review: 2013
Navigant was engaged by the OEB to undertake a study of TOU rates to estimate the historical impact
of TOU rates on the consumption of a sample of consumers drawn from participating LDCs.21 This
study estimated a 3.3% summer on-peak reduction from TOU rates. The table summarizes the results
of the conventional analysis that was used to evaluate the TOU impacts.
Table 1: Navigant 2013 Review Results
20 Ahmad Faruqui, Sanem Sergici, Neil Lessem (The Brattle Group), Dean Mountain, Frank Denton, Byron
Spencer (Mountain Economic Consulting and Associates, Inc.) and Chris King (eMeter), “Impact Evaluation of
Ontario’s Time-of-Use Rates: First Year Analysis”, November 26, 2013
(http://www.brattle.com/system/publications/pdfs/000/004/967/original/Impact_Evaluation_of_Ontario's_Time-
of-Use_Rates-First_Year_Analysis_Faruqui_et_al_Nov_26_2013.pdf?1386626350). 21 Navigant Consulting Ltd., “Time-of-Use Rates in Ontario Part 1: Impact Analysis”, December 20, 2013
(http://www.ontarioenergyboard.ca/oeb/_Documents/EB-2004-
0205/Navigant_report_TOU_Rates_in_Ontario_Part_1_201312.pdf).

Power Advisory RPP Jurisdictional Review of Dynamic Pricing Report Page 10
4 Jurisdictional Review
Experimental evidence dating back to the 1970s suggests that consumers exposed to time-varying
pricing are predictably responsive.22 A vast amount of literature exists on the hundreds of dynamic
pricing pilot programs that have been executed and analyzed over the past 40 years. The literature
remains valuable because each experiment provides insight into consumer behavior, and each program
or pilot provides insights into program design alternatives that can be employed to achieve program
objectives.
A comprehensive literature review of dynamic electricity pricing mechanisms used in other
jurisdictions was completed in order to gain insight into alternative pricing mechanisms that are
appropriate for Ontario. Pricing alternatives examined as part of the review include RTP, CPP, CPR,
and TOU. The following section provides information on these programs, including program
objectives, rate design description(s), participation structure, and key findings. The selected programs
represent a range of relevant alternative approaches to dynamic pricing and offer a range of outcomes.
In addition to having detailed information that supported a comprehensive review, they were selected
because the program design insights and consumer behavior findings provided key lessons for
Ontario.
4.1 California
4.1.1 Statewide Pricing Pilot (2003-2004)
The first comprehensive dynamic pricing pilot was carried out in California. Known as the Statewide
Pricing Pilot (SPP), it tested CPP and TOU pricing with and without enabling technologies. The SPP
was run between July 2003 to December 2004 by the three investor-owned utilities in the state –
Pacific Gas & Electric Company (PG&E), Southern California Edison Company and San Diego Gas
& Electric Company (SDG&E) – and was designed to achieve increased demand response in the state.
It had approximately 2,500 participants including residential and small to medium commercial and
industrial consumers.
Specific goals of the program included:
Estimating demand curves for electricity consumption by time-of-use period for dynamic tariffs
and deriving the associated price elasticities of demand;
Gathering information on consumer acceptance of dynamic tariffs, control technologies and
information treatments;
Forecasting the impact of a full-scale roll out of dynamic pricing; and
Providing input into a cost-benefit analysis of universal deployment of advanced metering
infrastructure.
The SPP program included three rate treatments: a traditional TOU treatment, critical peak pricing
with fixed period (CPP-F) hours, and critical peak pricing with variable period (CPP-V) hours. The
22 Dennis Aigner, “The Residential Time-of-Use Pricing Experiments: What Have We Learned?” 1985
(http://www.nber.org/chapters/c8372.pdf).

Power Advisory RPP Jurisdictional Review of Dynamic Pricing Report Page 11
CPP-F treatment featured a fixed peak period on both critical and non-critical days and day-ahead
consumer notification for critical day events. The CPP-V treatment featured a variable-length peak
period on critical days, which could be called on the day of a critical event.
In addition to the three rate treatments, the SPP tested an “Information Only” treatment for residential
consumers. This involved notifying consumers on critical days and asking them to avoid energy use
during the peak period. However, prices were the same on critical days as they were on all other days
and consumers did not face time-varying prices on any day. The Information Only treatment was
included to determine whether simply appealing for a reduction in energy use on critical days might
produce significant impacts even in the absence of any price incentive.
Details pertaining to each of the programs are outlined in the table below.
Table 2: Statewide Pricing Pilot Program Details
Treatment Details
TOU Seasonal (with summer running from May through October for residential consumers),
different rates for fixed on-peak and off-peak time periods
Consumers paid a higher price during the five-hour peak period from 2 p.m. to 7 p.m. on
weekdays and a lower price during the off-peak period, which applied during all other
hours
CPP-F TOU rate with an additional ‘critical peak’ price that can be dispatched during the peak-
period for up to 15 times each year, with day-ahead notice
As with TOU, the peak period for residential consumers was between 2 p.m. and 7 p.m.
weekdays
CPP with fixed event times and day-ahead notification; no enabling technology
Normal peak price twice off-peak price; event price 5 times off-peak price
CPP-V CPP with variable event times and day-of notification; almost all participating consumers
had enabling technology
Event price 6.5 times normal price (i.e., 10/65¢/kWh)
Residential CPP-V rate was tested among two different populations within the SDG&E
service territory:
o Track A: consumers were drawn from a population of consumers with average
summer energy use exceeding 600 kWh per month
o Track C: all consumers had smart thermostats and central air conditioning
Information
Only
Implemented in two climate zones in the PG&E service territory
Consumers were given educational materials regarding how to reduce loads during peak
periods
Consumers were notified in the same manner as were CPP-F consumers when critical
days were called
Consumers were not placed on time varying rates
Each TOU and CPP rate involved two sets of peak/off-peak prices, to allow for precise estimation of
the elasticities of demand. On average, consumers on TOU rates were given a discount of 23% during
Power Advisory RPP Jurisdictional Review of Dynamic Pricing Report Page 12
the off-peak hours and were charged a price of around 10¢ per kWh. They were charged around 22¢
per kWh during the peak hours, which was 69% higher than their standard rate of 13¢ per kWh.
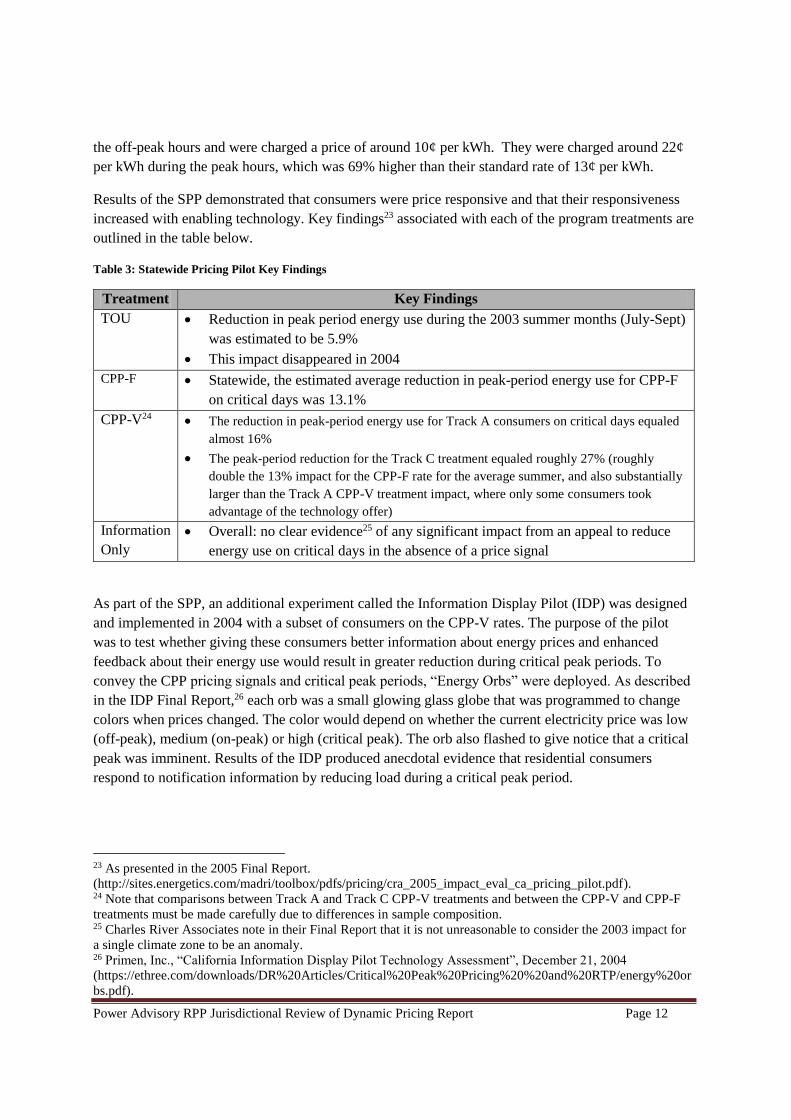
Results of the SPP demonstrated that consumers were price responsive and that their responsiveness
increased with enabling technology. Key findings23 associated with each of the program treatments are
outlined in the table below.
Table 3: Statewide Pricing Pilot Key Findings
Treatment Key Findings
TOU Reduction in peak period energy use during the 2003 summer months (July-Sept)
was estimated to be 5.9%
This impact disappeared in 2004
CPP-F Statewide, the estimated average reduction in peak-period energy use for CPP-F
on critical days was 13.1%
CPP-V24 The reduction in peak-period energy use for Track A consumers on critical days equaled
almost 16%
The peak-period reduction for the Track C treatment equaled roughly 27% (roughly
double the 13% impact for the CPP-F rate for the average summer, and also substantially
larger than the Track A CPP-V treatment impact, where only some consumers took
advantage of the technology offer)
Information
Only
Overall: no clear evidence25 of any significant impact from an appeal to reduce
energy use on critical days in the absence of a price signal
As part of the SPP, an additional experiment called the Information Display Pilot (IDP) was designed
and implemented in 2004 with a subset of consumers on the CPP-V rates. The purpose of the pilot
was to test whether giving these consumers better information about energy prices and enhanced
feedback about their energy use would result in greater reduction during critical peak periods. To
convey the CPP pricing signals and critical peak periods, “Energy Orbs” were deployed. As described
in the IDP Final Report,26 each orb was a small glowing glass globe that was programmed to change
colors when prices changed. The color would depend on whether the current electricity price was low
(off-peak), medium (on-peak) or high (critical peak). The orb also flashed to give notice that a critical
peak was imminent. Results of the IDP produced anecdotal evidence that residential consumers
respond to notification information by reducing load during a critical peak period.
23 As presented in the 2005 Final Report.
(http://sites.energetics.com/madri/toolbox/pdfs/pricing/cra_2005_impact_eval_ca_pricing_pilot.pdf). 24 Note that comparisons between Track A and Track C CPP-V treatments and between the CPP-V and CPP-F
treatments must be made carefully due to differences in sample composition. 25 Charles River Associates note in their Final Report that it is not unreasonable to consider the 2003 impact for
a single climate zone to be an anomaly. 26 Primen, Inc., “California Information Display Pilot Technology Assessment”, December 21, 2004
(https://ethree.com/downloads/DR%20Articles/Critical%20Peak%20Pricing%20%20and%20RTP/energy%20or
bs.pdf).

Power Advisory RPP Jurisdictional Review of Dynamic Pricing Report Page 13
Lessons for Ontario:
The SPP demonstrated that enabling technology can significantly enhance program
effectiveness, particularly for CPP programs where the consumer must respond to the CPP
event or pay significantly higher costs.
During periods of extremely high demand for electricity when reserve power supplies are low,
Ontario does not currently provide a price signal to residential and commercial consumers
(other than the TOU rates which are consistently applied whether or not in a period of extremely
high demand and/or low operating reserve). In these extreme cases, public appeals or “power
warnings” may be issued by the IESO, asking consumers to reduce their use of electricity in
order to alleviate the increased strain on Ontario's electricity system. The SPP’s Information
Only treatment demonstrated that demand response in the absence of a price signal is not
sustainable. As a general lesson for Ontario, addition of a price signal could be beneficial for
IESO to manage critical events.
4.2 Florida
4.2.1 Energy Select Program (2000-present)
Gulf Power’s Energy Select program has the distinction of having been the first fully-automated time
of use critical peak pricing27 (TOU-CPP) program in the United States. It is also among the longest-
running programs, and has been operational since the year 2000.28
Under the Energy Select program, participants were charged a Residential Service Variable Pricing
(RSVP) rate featuring four different prices based upon the time of day, day of week and season. Two
of the prices (low and medium) were lower than the standard residential rate. The other two prices
(high and critical) were higher than the standard residential rate to reflect the increased cost of
providing electricity during peak times.29 Energy Select’s seasonal pricing details are presented in the
following table.
27 Wherein a critical-peak component is added to a time-of-use rate. 28 Comverge, “Gulf Power Raises the Bar for Automated Residential Dynamic Pricing Programs”, 2013
(http://www.comverge.com/Comverge/media/pdf/Gulf-Power-Case-Study.pdf). 29 The high price is in effect only 12% of the time and the critical price period will never exceed 1% of total
hours in any calendar year.
Power Advisory RPP Jurisdictional Review of Dynamic Pricing Report Page 14
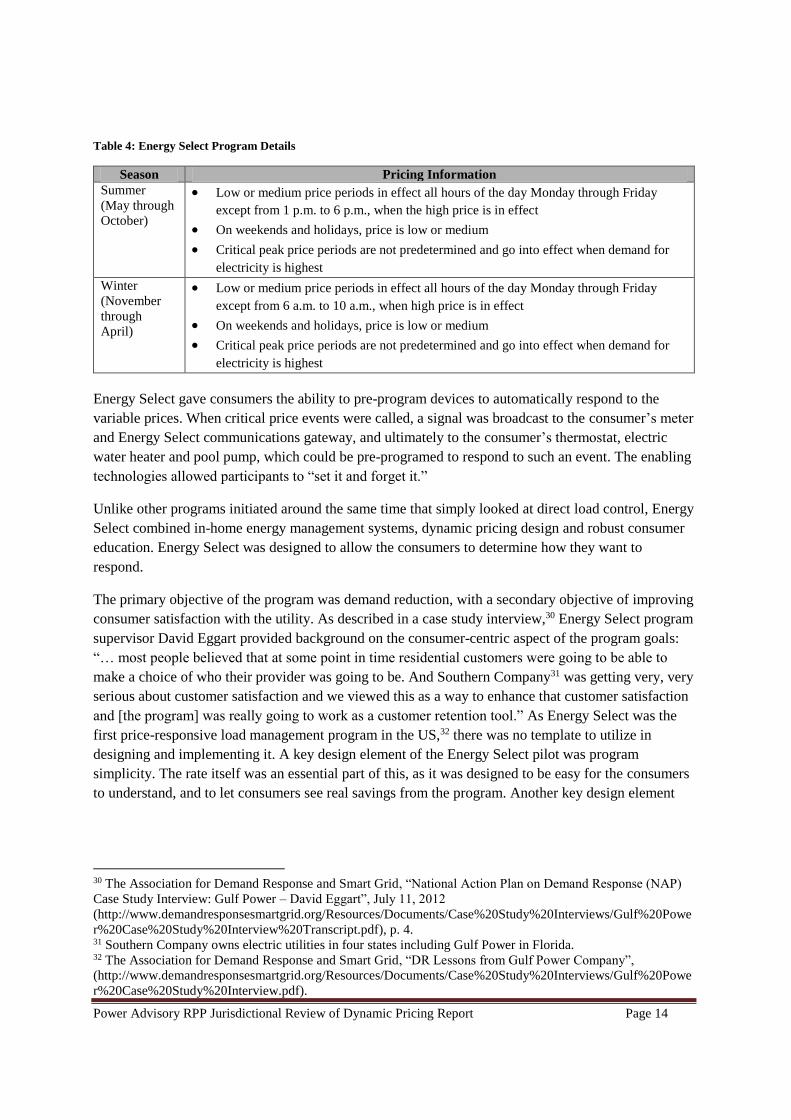
Table 4: Energy Select Program Details
Season Pricing Information Summer (May through
October)
Low or medium price periods in effect all hours of the day Monday through Friday
except from 1 p.m. to 6 p.m., when the high price is in effect
On weekends and holidays, price is low or medium
Critical peak price periods are not predetermined and go into effect when demand for
electricity is highest
Winter
(November
through
April)
Low or medium price periods in effect all hours of the day Monday through Friday
except from 6 a.m. to 10 a.m., when high price is in effect
On weekends and holidays, price is low or medium
Critical peak price periods are not predetermined and go into effect when demand for
electricity is highest
Energy Select gave consumers the ability to pre-program devices to automatically respond to the
variable prices. When critical price events were called, a signal was broadcast to the consumer’s meter
and Energy Select communications gateway, and ultimately to the consumer’s thermostat, electric
water heater and pool pump, which could be pre-programed to respond to such an event. The enabling
technologies allowed participants to “set it and forget it.”
Unlike other programs initiated around the same time that simply looked at direct load control, Energy
Select combined in-home energy management systems, dynamic pricing design and robust consumer
education. Energy Select was designed to allow the consumers to determine how they want to
respond.
The primary objective of the program was demand reduction, with a secondary objective of improving
consumer satisfaction with the utility. As described in a case study interview,30 Energy Select program
supervisor David Eggart provided background on the consumer-centric aspect of the program goals:
“… most people believed that at some point in time residential customers were going to be able to
make a choice of who their provider was going to be. And Southern Company31 was getting very, very
serious about customer satisfaction and we viewed this as a way to enhance that customer satisfaction
and [the program] was really going to work as a customer retention tool.” As Energy Select was the
first price-responsive load management program in the US,32 there was no template to utilize in
designing and implementing it. A key design element of the Energy Select pilot was program
simplicity. The rate itself was an essential part of this, as it was designed to be easy for the consumers
to understand, and to let consumers see real savings from the program. Another key design element
30 The Association for Demand Response and Smart Grid, “National Action Plan on Demand Response (NAP)
Case Study Interview: Gulf Power – David Eggart”, July 11, 2012
(http://www.demandresponsesmartgrid.org/Resources/Documents/Case%20Study%20Interviews/Gulf%20Powe
r%20Case%20Study%20Interview%20Transcript.pdf), p. 4. 31 Southern Company owns electric utilities in four states including Gulf Power in Florida. 32 The Association for Demand Response and Smart Grid, “DR Lessons from Gulf Power Company”,
(http://www.demandresponsesmartgrid.org/Resources/Documents/Case%20Study%20Interviews/Gulf%20Powe
r%20Case%20Study%20Interview.pdf).

Power Advisory RPP Jurisdictional Review of Dynamic Pricing Report Page 15
was developing the equipment, which took three to four years, a longer process than originally
anticipated.33
The objective of enhancing consumer satisfaction heavily influenced the program design. Consumers
were able to program their thermostats and other appliances that were subject to load control using the
internet. The program supervisor noted that “the big difference between what we do and what a lot of
load control programs that most utilities are still doing, is that the consumers determined how they
want to respond. So, they obviously feel more in control of their purchases and understand this is an
opportunity to save for them. So, that pricing signal in essence works as an off switch for them. And if
you have a critical price event that’s on a long duration, those units will start to come back on.”34
The Energy Select program has been found to deliver increased value to consumers while providing
peak reduction benefits to the utility and the system. Consumer satisfaction with the program has been
high (typically rated in the 90s on a 100 scale35), and includes satisfaction with the level of control
consumers have over energy purchases, satisfaction with the comfort level of their homes, satisfaction
with their bill savings, and finally satisfaction with the utility. Gulf Power consumers who participate
in the program or simply review the program materials give the utility higher satisfaction ratings than
consumers who know nothing about the program.
The program’s documented savings are summarized in a 2013 Smart Grid Consumer Collaborative
Case Study:36
Gulf Power sees an average of 1.7–1.8 kW peak load demand reduction per household on
summer peak and 2.5–3 kW peak load demand reduction per household on winter peak. Overall,
Gulf Power has seen a 20 MW summer peak reduction from the program.
In addition to the peak savings, consumers on the Energy Select program typically reduce their
household energy use by 700–1000 kWh/year and see a 12–15% annual reduction in their
electricity bill.
Based on the success of the pilot, the Energy Select program continues to run. The program has seen
significant participation growth over the years, with 3,200 initial participants in 2000, approximately
11,000 in 2013 and an expected enrolment of approximately 16,000 participants by 2015.37
As the program has been operational since 2000, Gulf Power has had the benefit of learning how best
to strike a balance between maintaining a high level of consumer satisfaction with the program and
achieving the desired demand response results. Learnings from the program stress the importance of
being consumer-oriented and making rates easy to understand. Some key lessons include:
33 The Association for Demand Response and Smart Grid, (2012), p. 7. 34 The Association for Demand Response and Smart Grid, (2012), p. 4. 35 Kathleen Wolf Davis, “Gulf Power’s Energy Select: ‘Simple is good’”, Intelligent Utility, July 15, 2013
(http://www.intelligentutility.com/article/13/07/gulf-power-s-energyselect-simple-good). 36 Smart Grid Consumer Collaborative, “Smart Grid Customer Engagement Success Stories: Case Studies –
Gulf Power”, 2013 (http://smartgridcc.org/wp-content/uploads/2013/07/CS_Gulf-Power.pdf), p. 3. 37 comverge (2013), p. 4.

Power Advisory RPP Jurisdictional Review of Dynamic Pricing Report Page 16
The program was initially marketed through direct mail, mass market advertising (television,
outdoor advertising, newspaper and radio), and the internet. Direct mail, internet, television and
outdoor advertising worked well, but newspaper and radio advertising was found to be much
less effective in terms of driving consumer participation. Therefore, one of the main lessons
related to marketing and promotion was the importance of tracking sales sources and limiting
advertising resources to what works.
Consumers benefit from the program in ways other than cost savings. Consumer reps are better
able to assist consumers who call about a high bill because a detailed review of how the
consumer has pre-programmed their equipment (water heater, pool pump, thermostat, etc.) is
available.
In order to get the desired demand response results, critical price events should not exceed two
hours38 because as the event continues, consumers will begin to bring their units (water heaters,
pool pumps, etc.) back online. Critical price events were therefore found to be most effective if
called only when needed and only for a short duration.39
Lessons for Ontario:
In order to make the most efficient use of program advertising budgets and to maximize
consumer participation in an opt-in dynamic pricing program, Ontario could track sales sources
for the duration of the program’s pilot period so that utilities can ultimately limit advertising
resources to what works best. As with the Energy Select program, this is particularly useful for
programs with a lengthy or (expected to be lengthy) lifespan.
“Set it and forget it technology” has also been key to the Energy Select program’s ongoing
success. While such technologies offer benefits no matter what dynamic pricing programs are
implemented, they are particularly important with CPP. Residential consumers in Ontario could
benefit from this technology.
Consumer response to CPP events is greatest within the first hour of critical price event.
Afterwards, consumers bring their units back online. Power Advisory believes that this finding
is significantly influenced by the program objective of enhancing consumer satisfaction, which
influenced the program design and gave consumers greater control over appliance settings
during CPP events.
4.3 Georgia
4.3.1 PoweRewards Program (2008-2009)
Georgia Power Company launched the PoweRewards Program in 2008 in order to incent residential
consumers to reduce electricity consumption during summer peak hours. The CPR program was
38 David Eggart explains that the greatest systems benefit of a critical event occurs in the first hour of any event:
The Association for Demand Response and Smart Grid, (2012), p. 4. 39 Power Advisory believes that this finding and the program design is heavily influenced by the objective of
improving consumer satisfaction. With such an objective, program design is likely to make it easier for
consumers to override the device controls to avoid any adverse impacts on comfort. Note that consumers
continued to have high satisfaction with the comfort of their homes.

Power Advisory RPP Jurisdictional Review of Dynamic Pricing Report Page 17
designed to give consumers credit when they reduced their electric usages during critical peak events
called by the company. The program included voluntary participation by approximately 1,000
residential consumers40 who opted into the program following solicitation by email or direct mail.41 In
order to determine applicability of the payment, baselines of each consumer’s hourly electric usage
were constructed and rewards were calculated based on the differences between consumers’ actual
usage and the projected usage during critical peak events.
Under the program, consumers were notified by telephone or e-mail at least one day before a critical
peak pricing event was called. In order to receive payment, the consumer had to reduce their
electricity use to below the consumer’s predefined Normal Electric Usage (NEU). The energy usage
reduction payment was set at 35c/kWh.42 If the consumer was not able to reduce load to below the
NEU, the consumer would then only pay what would have been paid under the company’s residential
tariff.
An essential element of the PoweRewards program design was the methodology by which a
consumer’s baseline (NEU or projected energy use during a critical event) was determined. In a 2009
paper,43 Xiao et al discuss the methodology and challenges associated with calculating the baseline:
Four estimation methodologies for constructing the baselines were studied, including simple
average, combined ratio, linear regression and time series. A twostep estimation methodology
was selected for the final production model.
Although there were procedures to validate the consumer’s hourly usage data before the
consumer was informed of an event, there were still several cases where special handling was
required. The most common one was an inadequate regression model. In this case, the average
of the 3 hottest days was used as the final baseline. A few times, consumer’s actual load on
event day was missing. In this instance, a fixed rebate amount was issued.
Occasionally, there were missing hot day load shapes. Instead of borrowing load shapes from
another consumer, a manual review was performed and each situation assessed.
Despite the strong influence weather has on electricity use, there were many abnormal
consumer electricity usages observed which were attributed either to a consumer’s unusual
behavior and/or data collection error.
Over the course of the PoweRewards pilot, a total of 6 critical peak events were called with each
lasting 2 to 4 hours. The average total payout was approximately $6 per consumer. Overall, the
objectives of the program were met. Program results demonstrated benefits to both the consumers and
the utility, including energy reductions, peak demand reductions, and consumer savings. However, as
noted above and outlined in the EIA 2011 document summarizing U.S. Smart Grid Case Studies,44
40 Pilot participants included residential consumers who already had AMI: SAIC, “U.S. Smart Grid Case
Studies”, September 28, 2011 (http://www.eia.gov/analysis/studies/electricity/pdf/sg_case_studies.pdf), p. 27. 41 Georgia Power, “Georgia Power’s Critical Peak Pricing pilot program PoweRewards”, March 2009
(http://www.metering.com/wp-content/uploads/Bob%20Hughes_0.pdf), p. 4. 42 Energy reduction payment was paid up to a maximum of 50 hours/year. 43 Yuqing Xiao, Bob Bolen, Diane Cunningham, Jiaying Xu, “Constructing Baseline of Consumer’s Hourly
Electric Usage in SAS”, 2009 (http://analytics.ncsu.edu/sesug/2009/PO015.Xiao.pdf), p. 3. 44 SAIC (2011), p. 27. Analysis demonstrates that consumers substantially reduced their load during the EW
events. The load shifting impact for both years was statistically significant for the EW participants.

Power Advisory RPP Jurisdictional Review of Dynamic Pricing Report Page 18
Georgia Power Company faced several challenges in implementing the pilot, particularly with respect
to determination of the baseline algorithm, as outlined above.
Another challenge faced by the utility was that the program was more administratively burdensome
than initially anticipated. The program also ended up with higher than expected costs. In a DSM
policy brief,45 Annoni et al. notes that “Encouraging residential participation through rebates or other
rewards can encourage participation but offering significant rebates to large numbers of consumers
can affect a utility’s bottom line. Such concerns must be carefully balanced.”
Lessons for Ontario:
Ontario can learn from the challenges associated with designing and implementing the
PoweRewards program. In considering any program, the design needs to consider
administrative costs. Ontario should seek to avoid administratively burdensome programs that
have high implementation costs.
As with any CPR program, a critical element of the program design is how to determine a
consumer’s baseline energy use.
Implementing a program similar to PoweRewards could also be challenging in Ontario from a
consumer acceptance perspective. Residential Ontario consumers have expressed confusion
related to current bill structure. Implementing a CPR program could add to the confusion as
explaining the baseline energy use and conditions pertaining to reward payment could be
difficult.
4.3.2 Other Programs in Georgia
Following the PoweRewards pilot, Georgia Power’s parent company, Southern Company, reviewed
several CPP programs that were piloted by its retail operating company. As noted in the 2011 EIA
U.S. Smart Grid Case Studies, findings and overall experience resulting from Southern Company’s
program review include the following:
Reliable, measurable residential demand-side resources require enabling technology, such as
advanced energy management systems and consumer gateways;
Enabling technology can also further improve consumer acceptance and satisfaction with CPP
programs and increase the reliability of consumer reductions; and
CPP/TOU programs need thorough consumer education and energy management advice to be
successful.
Lessons for Ontario:
Similar to other project findings, results from Georgia’s CPP programs highlight the importance
of enabling technology.
Consumer education is essential to program success.
45 Jen Annoni, Devesh Chandra, Thomas Gage, Kanwar Sameer Lather and Jenny Monson-Miller, “DSM Policy
Brief”, December 2, 2013 (http://rcp.umn.edu/wp-content/uploads/2014/01/3-Demand-side-management-Policy-
Brief.pdf), p. 1.
Power Advisory RPP Jurisdictional Review of Dynamic Pricing Report Page 19
4.4 Illinois
4.4.1 Energy-Smart Pricing Plan (2003-2006)
Over the past decade, several dynamic pricing programs have been implemented in the state of
Illinois. In 2003, Commonwealth Edison (ComEd) launched the Energy-Smart Pricing Plan (ESPP)
program, which ran through 2006. ESPP was the first program in the nation to allow residential
consumers to pay hourly, market-based electricity prices. The main goals of this RTP program were to
determine the price elasticity of demand and the overall impact on energy conservation. ESPP sought
to evaluate the benefits of having retail prices of electricity reflect the cost of power in wholesale
markets, without expensive technology.
The ESPP was designed to provide day-ahead announcement of the hourly electricity prices to
participants. In other words, consumers were charged hourly prices that had been posted one day in
advance. The program also included high-price day notifications by phone or email when the price of
electricity climbed above a pre-determined threshold.46 Finally, there was a price cap47 associated with
the program to protect against extreme price spikes.
In order to execute the program, interval meters rather than smart meters were used. The meters stored
hourly energy use, and were read by meter readers on a monthly basis using hand-held computers.
Accordingly, participation was limited by funding available for the interval meters. Initially there
were 750 participants who opted into the program, and this number eventually grew to 1,500.
Once enrolled in the program, participants were given educational materials and information to help
manage their electricity costs with hourly pricing. This information included high price alerts via
phone or email (as previously mentioned), and also general energy efficiency tips.
Results of the ESPP pilot demonstrated the potential for net benefits from real-time pricing programs.
Key findings from the program evaluations include high participant satisfaction, high participant
retention, and average consumer savings of 10% over the four years of the pilot.48 In 2006, the Illinois
General Assembly passed legislation requiring the major electric utilities in the state to offer their
residential consumers an hourly pricing option.49 In 2007, ComEd’s ESPP program was replaced with
the Residential Real-Time Pricing (RRTP) program. At the same time, Power Smart Pricing (PSP)
was launched by Ameren Illinois. Both the RRTP and the PSP programs have a similar design to the
ESPP pilot, in that they give consumers access to hourly electricity prices set in the wholesale market.
A discussion of both of these programs is presented in the following two sections.
46 Initially the notification threshold was set to above $0.10 per kWh. In 2006, the notification threshold was set
to above $0.13 per kWh. 47 A price cap of $0.50 per kWh for participants meaning that the maximum hourly price is set at $0.50 per kWh
during their participation in the program. The maximum actual price ever seen was $0.3655/kWh. 48 Summit Blue Consulting, “Evaluation of the 2006 Energy-Smart Pricing Plan, Final Report”, November 2007
(http://www.smartgridnews.com/artman/uploads/1/2006-espp-evaluation.pdf), p. 10. 49 Illinois General Assembly, Public Act 094-0977
(http://www.ilga.gov/legislation/publicacts/fulltext.asp?Name=094-0977).

Power Advisory RPP Jurisdictional Review of Dynamic Pricing Report Page 20
4.4.2 Residential Real Time Pricing (2007-present)
Initiated in 2007, the RRTP program is still operational. Under the program, day-ahead prices are
provided to participants each evening. These prices serve as advisory prices, and consumers are billed
on the actual real time prices that settle the next day.
An initial challenge for this program was in recruiting consumers. In order to increase participation,
additional outreach and communication efforts were undertaken after the program’s first year.
Another challenge faced by ComEd related to program costs. A significant investment was needed to
develop the processes and IT systems required to commence the program.50
The results of the program have been evaluated annually, and demonstrate that consumers are
responsive to RTP. Bill savings have been realized as consumers reduced overall energy use and
energy consumption during peak hours. An evaluation of the first four years of the program showed
that the reductions in consumer demand persisted.
As with the ESPP program, RRTP participants are given education materials and information to help
manage their electricity costs. This includes information and general tips for reducing electricity costs,
access to electricity price updates online and by phone, real-time and predicted day-ahead price alerts,
and online analysis tools for managing electricity usage.
Participation in the RRTP program is voluntary. Consumers can sign up either online or over the
phone. RRTP participants must remain in the program for at least 12 consecutive monthly billing
periods. Participants are charged a small monthly fee, but there is no cost to participants for upgrading
to an hourly recording meter, and no additional monthly fee for use of the meter itself.51
4.4.3 Power Smart Pricing (2007-present)
Around the same time that ComEd introduced the RRTP program, the Power Smart Pricing (PSP)
program was launched for Ameren Illinois consumers. The initial PSP design mimicked the RRTP
program. Upon program sign up, day-ahead advisory prices were sent to participants in the evening,
but participants were charged actual hourly prices.
As with the RRTP program, a challenge for PSP in the early years was recruitment of new consumers.
In Ameren’s service territory of central and southern Illinois, real time pricing was an entirely new
concept to residential consumers in 2007. Despite the differences between real time and day-ahead
prices typically being minimal, consumers feared the uncertainty and volatility that was possible with
the real time prices.52 In order to simplify the program for participants, the PSP program pricing was
changed from real time to day ahead pricing, which provided greater certainty for participants.
50 Phil Carson, “Dynamic pricing set to expand in Illinois”, Intelligent Utility, September/October 2012
(http://www.intelligentutility.com/magazine/article/285131/dynamic-pricing-set-expand-illinois). 51 As outlined on the program website, RRTP participants will be charged an additional fee of $0.39 per month
to participate in the program. 52 Anthony Star, Ann Evans, Marjorie Isaacson and Larry Kotewa, “Making Waves in the Heartland: How
Illinois’ Experience with Residential Real-Time Pricing Can Be a National Model”, 2008
(http://www.eceee.org/library/conference_proceedings/ACEEE_buildings/2008/Panel_2/2_437/paper), p. 2-288.

Power Advisory RPP Jurisdictional Review of Dynamic Pricing Report Page 21
Borrowing an idea from the ESPP pilot, participants in the PSP program were able to test the use of
the “PriceLight” communication technology. As described in Star et al.,53 the PriceLight is an
adaptation of the Ambient Orb, a glowing glass ball that receives a pager signal each hour and
changes color using a blue-green-yellow-red schema to reflect the current real-time price of
electricity. The PriceLight is similar to the glowing orb which was used in California’s SPP to provide
notification information to remind residential and commercial program participants reduce load during
a critical peak period. This visual reference point for participants was found in the evaluation of ESPP
to increase the price elasticity of participants who had one in their home.54 The final report on
“Demonstrating PriceLight Technology to Improve Household Energy Efficiency in Central and
Southern Illinois” indicates that the reduction of demand for electricity at peak (higher priced) hours is
greater in households with PriceLights than those without this tool. By simplifying hourly prices to a
“glance-able” color spectrum, consumers received information and learned to understand the
relatively consistent hourly price patterns easily.
Lessons for Ontario:
A hedged price cap can protect RTP participants against potential extreme price spikes.
Simplifying the design of a RTP program is important. PSP consumers were confused by and
ultimately concerned about receiving day-ahead advisory prices and then being charged real-
time prices. To overcome this issue, PSP eventually simplified the program design by
employing day-ahead pricing only. This structure was simpler for PSP consumers to
understand. However, if a similar program structure were to be implemented in Ontario, a
significant amount of work would be required to determine how the day-ahead prices would be
set.
Consumer education and market exposure will be invaluable for Ontario consumers if an RTP
structure is adopted. The majority of Ontario’s residential consumers have very little knowledge
of and exposure to Ontario’s wholesale electricity prices and the volatility surrounding those
prices.
As discussed above in the California Statewide Pricing Pilot section, “Price Lights”, “Ambient
Orbs”, or an equivalent technology could be employed in Ontario. In the case of the SPP, this
technology was shown to be useful under a CPP treatment. In ESPP and PSP programs, the
same technology was used successfully under RTP regimes. This confirms that no matter what
pricing regime is ultimately adopted by Ontario, visual pricing tools can help Ontario
consumers adapt and respond to prices.
4.5 Missouri
4.5.1 Residential Time-Of-Use Study (2004-2005)
In the summer of 2004, AmerenUE implemented the Residential Time-of-Use Pilot in Missouri,
employing a three-part TOU rate with high differentials. It ran for two consecutive summers (2004
53 Star et al. (2008), p. 2-287. 54 Summit Blue Consulting (2007), p. 11.

Power Advisory RPP Jurisdictional Review of Dynamic Pricing Report Page 22
and 2005). The main purpose was to determine if and how residential time-of-use rates would be
beneficial in Missouri.
In order to recruit consumers to the opt-in program, residential consumers with high summer use were
targeted, and provided with the following main selling propositions:55
Potential savings could be realized by reducing electricity usage in response to higher prices
during peak hours. Additionally, shifting electric usage to periods when electric costs would be
at lower rates would result in savings;
Most consumers would recognize savings with more efficient use of electricity;
There were no forms or other steps to convert to the program. Consumers simply had to confirm
they would like to participate in the Pilot and the billing change was completed automatically;
Should they wish to opt out of the program at any time, a consumer could change back to their
former rate; and
A signing bonus of $25 was offered and an additional $75 was provided to those that
participated in the Pilot for at least six months.
Under the Residential Time-Of-Use Study, impacts associated with three rate offerings were
evaluated:
TOU with peak, mid-peak, and off-peak rates;
TOU with a CPP component; and
TOU with a CPP component and an enabling technology.56
The TOU rates associated with each offering are detailed in the table below.
Table 5: Residential Time-of-Use Study Program Details
Rate Offering Pricing Information
Three-Tier TOU Only Off Peak (Weekday 10 p.m.–10 a.m., Weekends, Holidays) 4.80¢/kWh
Mid Peak (Weekdays 10 a.m.–3 p.m. and 7 p.m.–10 p.m.) 7.50¢/kWh
Peak (Weekday 3 p.m.–7 p.m.) 18.31¢/kWh
Three-Tier TOU with
CPP Off Peak (Weekday 10 p.m.–10 a.m., Weekends, Holidays) 4.80¢/kWh
Mid Peak (Weekdays 10 a.m.–3 p.m. and 7 p.m.–10 p.m.) 7.50¢/kWh
Peak (Weekday 3 p.m.–7 p.m.) 16.75¢/kWh
CPP (Weekday 3 p.m.–7 p.m., 10 times per summer) 30.00¢/kWh
24 hours prior to when a CPP period was to be called, AmerenUE contacted program participants via
automated telephone calls (with a pre-recorded notification message) and, where requested, via an
email. In addition, the programmable thermostats belonging to participants in the TOU-CPP with
55 Winter use is defined as the billing months December through February and summer is defined as the billing
months June through September. Consumers with more than 1500 kWh in the summer are classified as high
summer use consumers. 56 The enabling technology was a programmable thermostat that could be modified during CPP events.

Power Advisory RPP Jurisdictional Review of Dynamic Pricing Report Page 23
enabling technology group were sent a control message to raise the temperature to a predetermined
level.57
A key design aspect of the program is how the TOU rates were chosen. The Residential TOU Final
Report58 provides insight into the design details: “The Residential TOU rate was developed by the
AmerenUE Rate Engineering Department. It is important to note that the TOU rates were not based of
[sic] the true costs of serving loads during the indicated pricing period, but instead designed to gauge
consumer reaction to ‘high’ prices. In other words, while the average cents/kWh realization resulting
from these rates recover the Company's costs of providing service, such costs do not vary as widely by
rating period as the TOU prices suggest.”
Another important element of the pilot design was determining when to call a CPP event. In 2004,
AmerenUE staff utilized an algorithm that would call a CPP event whenever the temperature was
forecast to be 90 degrees F or above. However, a challenge associated with this initial design
presented itself in 2005, as the summer was extremely hot.59 As a result, more administrative time was
required to determine when to call a CPP event.
As highlighted in the pilot study’s final report, the TOU-Only rate was dropped from the study in
2005, primarily because 2004 results demonstrated that this group failed to make a significant shift in
load from the on-peak to the mid-peak or the off-peak periods even though there was a 4.8 peak to
off-peak price ratio. In other words, the pilot demonstrated that there was very little to be gained in
Missouri by implementing the residential TOU rate by itself. Conclusions from post-2004 summer
focus groups gave some possible insight into why there was no meaningful impact from the TOU-
Only participants. From a consumer awareness and understanding perspective, there was confusion
surrounding the rates themselves and very little interest in the participant website.
Both the 2004 analysis60 and the 2005 analysis indicated that the CPP event was effective in moving
load away from the event period. The results also suggested that significant changes occurred with the
introduction of the enabling technology. The final report states that participants with enabling
technology displayed much stronger load response (more than double) during CPP events when
compared to the CPP only group.
Lessons for Ontario:
57 Consumers were able to opt out of a CPP control period by contacting AmerenUE’s Call Center or online.
Consumers were not able to override the CPP control period directly from the smart thermostat. 58 RLW Analytics, “AmerenUE Residential TOU Pilot Study: Load Research Analysis 2005 Program Results”,
June 2006
(https://www.smartgrid.gov/sites/default/files/doc/files/AmerenUE_Residential_TOU_Pilot_Study_Load_Resea
rch_Analysis_200605.pdf), p. 9. 59 The program’s final report (p. 10) indicates that in 2005, the temperature in Missouri was expected to
exceed 90 degrees F on 46 days for a total of 326 hours (including weekends and holidays). 60 The 2004 pilot study results are documented in: RLW Analytics, “AmerenUE Residential TOU Pilot Study:
Load Research Analysis First Look Results”, 2005 (http://www.ontarioenergyboard.ca/documents/cases/RP-
2004-0203/2005-07-submissions/cdm_trccomments_toronto_supplementary2.pdf; this is a draft version with an
incorrect date).

Power Advisory RPP Jurisdictional Review of Dynamic Pricing Report Page 24
Enabling technology was found to be a key component of the offering in AmerenUE’s
Residential Time-of-Use study. The groups receiving the smart thermostat were found to
display much stronger load response (more than double) during CPP events when compared to
the CPP-only group. This supports other program findings, and therefore a lesson for Ontario
is that if a CPP program is being considered, there is merit in exploring complementary
technologies to enable Ontario consumers to respond to critical events.
If implementing a CPP program with enabling technology, Ontario should consider both the
length of CPP events and whether and how consumers are able to override their unit settings.
EmerenUE’s Residential Time-of-Use study did not allow consumers to override the CPP
control period directly from the smart thermostat; consumers were required to call or use an
online portal to make changes. In Florida, Gulf Power consumers are able to make changes
both at the device and online. If emphasis of an Ontario program is on consumer acceptance (as
is the case with the Energy Select program), it would be appropriate to give the consumers
quick and easy access to changing technology settings in response to CPP events. However,
this would undercut the ability of the system operator to rely on the demand reductions provided
by this program.
4.6 New South Wales, Australia
4.6.1 Smart Grid, Smart City Project: EnergyAustralia Trial (2012-2014)
The Smart Grid, Smart City (SGSC) project was an Australian Government initiative to test new
energy technologies and find intelligent new ways of managing electricity use. As part of this
initiative, the New South Wales utility, EnergyAustralia, launched a residential trial in September
2012 involving a menu of new pricing structures and household energy management tools. The trial
measured the effectiveness of alternative electricity tariffs either as standalone products or bundled
with smart feedback devices. Initial invitations for the voluntary trial were sent to 55,000 of
EnergyAustralia’s residential consumers. More than 3,400 participants ultimately enrolled.61 The trial
concluded in February 2014.
One of the main goals of EnergyAustralia’s SGSC trial was to learn and understand what consumers
want and need to reduce their bills and take control of their energy use. The trial was also aimed at
reducing peak demand on the grid. As outlined in the July 28, 2014 results report, the trial was
particularly concerned with whether the smart-meter related products were:
Attractive to consumers;
Effective in engaging consumers;
Effective in helping consumers manage and reduce electricity usage; and
Effective in reducing retailers’ exposure to extreme wholesale costs during peak demand
periods.
Findings from the trial were intended to deliver learnings for the whole of Australia.
61 A total of 3,469 residential consumers participated.

Power Advisory RPP Jurisdictional Review of Dynamic Pricing Report Page 25
In order to achieve the program goals, a total of twelve products were offered to consumers with each
product including a tariff (CPP, but referred to as dynamic peak pricing; seasonal time-of-use; and
top-up (pre-payment) plan) or a rebate (interruptible load, such as air conditioning) and optionally one
or more feedback technologies (an online portal, an in home display or appliance control and sub-
metering devices). Details pertaining to each product and pricing structure are outlined in the table
below.
Table 6: Smart Grid, Smart City Program Details
Tariff Type Tariff Description Sta
nd
alo
ne
Ta
riff
Po
wer
Sm
art
Mo
nit
or
Po
wer
Sm
art
On
lin
e
Po
wer
Sm
art
On
lin
e &
Ho
me
Co
ntr
ol
PriceSmart
Dynamic
Peak Pricing
Low rates during the year
Higher rates apply during peak events
Consumer to be notified by SMS before peak
events
Consumer encouraged to curtail usage during
events
Peak events last from one to four hours
Trial simulated 14 peak events per year
X X X X
SeasonSmart
Seasonal
Time of Use
Seasonal time of use
Lower peak rates in Spring/ Autumn
Higher peak rates in Summer/Winter
X X X
BudgetSmart
Top Up
Reward62
Advance pay (top-up) product
Consumers receive a 12.5% discount off bill
Account must remain in credit
Consumers are notified via SMS when it is
estimated they will run out of credit in seven days
X X X X
FlowSmart
Interruptible
A/C control
Direct air conditioning (A/C) load control
A/C interrupted during events unless consumer
opts-out
Consumers earn between $15 and $44 per event,
with up to 6 events per year63
A/C’s compressor to be switched off for 30 minute
intervals in peak times, up to six occasions from
January to March
A/C’s fan will continue to operate
X
62 While not a CPP, BudgetSmart was part of the trial. Consumers on this rate plan were given the option to
choose a technology bundle. 63 FlowSmart rewards varied depending on the size of a consumer's air-conditioner's compressor. Figures
include GST.

Power Advisory RPP Jurisdictional Review of Dynamic Pricing Report Page 26
The program trialed three types of feedback devices:
A home energy monitor (also known as an ‘in-home display’), showing basic live energy
consumption and cost data;
An online portal, which showed more detailed information but required computer access; and
An online portal paired with a Home Area Network (HAN). The HAN included smart plugs
that enabled tracking and remote control of individual appliances.
A component of the EnergyAustralia SGSC trial was a structured consumer communications and
retention program. Key engagement and retention activities included:
A quarterly newsletter tailored to the consumer’s specific tariff;
Consumer case studies to motivate participants;
Early issue intervention to resolve potential issues; and
Tailored processes to manage consumers who move or opt-out of the trial.
Over two-thirds of original participants remained in the trial, with PriceSmart showing the highest
retention of all the tariff types. Trial opt-out reasons included consumers no longer wanting to
participate, moving to new homes, and changing energy retailers. Moving homes accounted for
around 25% of total trial opt-outs. The table below details consumer retention under each type.
Table 7: Smart Grid, Smart City Consumer Retention
Tariff Type
Total Initial
Customers
Total Consumer
Opt-Outs
Total Consumers
in Trial at End
PriceSmart
Dynamic Peak Pricing 1,823
458
(25%)
1,365
(75%)
SeasonSmart
Seasonal Time of Use 567
176
(31%)
391
(69%)
BudgetSmart
Top Up Reward 1,078
428
(40%)
650
(60%)
FlowSmart
Interruptible A/C control 1
1
(100%)
0
(0%)
Total 3,469 1,063
(31%)
2,406
(69%)
The trial proved favourable for participants. Consumers reported that their ability to reduce bills
improved since taking part in the trial, and most participants believed their participation in the trials
resulted in them reducing their energy use. Key findings include:
Both PriceSmart and BudgetSmart consumers showed high satisfaction levels and likelihood to
recommend the tariff;
Tariff and technology bundles proved the most empowering for consumers and drove high
levels of consumer satisfaction; and

Power Advisory RPP Jurisdictional Review of Dynamic Pricing Report Page 27
PriceSmart consumers showed the greatest peak reductions.64
Analysis undertaken as part of the EnergyAustralia SGSC trial has shown that it is possible to more
effectively manage peak demand through consumer behavioral change and with the assistance of
feedback technologies and dynamic tariffs. This analysis showed that with the appropriate pricing
signals and behavioral changes consumers were able to reduce their electricity bills.
Lessons for Ontario:
Consumer education is key to program success. The importance of consumer education is
elevated in programs that offer consumers a variety of choices. In the EnergyAustralia SGSC
trial, the original target for participation was 8,000 households, however ultimately only 3,400
consumers enrolled (with 2,400 remaining in the trial until program close). The low engagement
was partially attributed to consumers having a limited understanding of the categories they
could choose.
Analysis showed large variations in the experiences of different trial participants with the same
product. This suggests that there will not be one product that suits all consumers. Diversity in
product offerings could be advantageous as it allows consumers to choose the products they
think best suit their needs.
Under the seasonal TOU tariff, there was some evidence of consumers opting out of the
program ahead of the seasonal price rises. Attention must be given in designing the program to
prevent “gaming” by opting in or out of the program strategically.
4.7 Ontario
4.7.1 Ontario Smart Price Pilot (2006-2007)
The Ontario Smart Price Pilot (OSPP) was launched in August 2006 to investigate the feasibility of
implementing various dynamic pricing alternatives for Ontario residential consumers. The main
objective of the pilot was to determine the extent to which participants would respond to time-varying
prices and to assess how demand responsiveness varies with participant characteristics, weather and
other determining factors. The results of the pilot were intended to inform the Board with respect to
future decisions associated with CPP and CPR as well as whether refinements were needed to the
existing TOU pricing construct and associated consumer communications.
As outlined in the pilot design document,65 the OSPP was intended to assess:
The demand response of consumers to various pricing structures (e.g., RPP TOU with/without
CPP or CPR;
64 Average consumption reductions of 39% were achieved, although some decay was observed over time. 65 IBM Global Business Services and eMeter Strategic Consulting, “Ontario Smart Price Pilot: Pilot Design”,
August 30, 2006 (http://www.ontarioenergyboard.ca/documents/cases/EB-2004-0205/smartpricepilot/ospp-
programdesign-report-excludeappend_20070108.pdf), p. 2.

Power Advisory RPP Jurisdictional Review of Dynamic Pricing Report Page 28
The extent to which each price structure causes a change in consumer behaviour with respect
to shifting of electricity consumption to off-peak periods as measured by the reduction in peak
demand;66
The understandability for residential consumers of each pricing structure and the
communications associated with each; and
Consumer acceptance of each price structure.
Hydro Ottawa was the sole participating LDC for the pilot. Recruitment for the opt-in program was
undertaken via direct mail. Each recruitment package consisted of a cover letter, fact sheet, and
confirmation form. In carrying out the pilot, three different commodity price structures were tested on
Hydro Ottawa residential consumers relative to the tiered price structure in place:
The RPP TOU prices (tested on 124 consumers)
The existing RPP TOU prices with a critical peak price (tested on 124 consumers)
The existing RPP TOU prices with a critical peak rebate (tested on 125 consumers)
All participants were to receive a $75 payment for participating in the program. Details pertaining to
each pricing structure are outlined in the table below.
Under the OSPP, 3 to 4 hours of the peak period were defined as critical on a CPP day. For
participants on the CPP plan, day-ahead notification was given by 5 p.m. on the day before a critical
event was to be called by phone, email or text, based on the participant’s selection.67 The triggers for
calling a critical event included forecasted temperatures of -14°C or below (winter) and 28°C
(summer) or above, or a Humidex exceeding 30°C during peak periods. The maximum number of
critical peak days planned for the pilot was nine. During the pilot, seven68 critical peak events were
declared. Participants on this price plan paid a reduced off-peak price of 3.1¢/kWh versus 3.5¢/kWh
that TOU participants were subject to.
Participants in the CPR plan were exposed to the same days, times, and participant notification as
those on the CPP plan. However, these participants did not receive a reduction in the off-peak price.
During critical events, consumers received a rebate of 30¢/kWh when they reduced their electricity
usage to below their baseline.
As with other CPR programs, an essential element of the Smart Price Pilot program design was
the methodology by which a consumer’s baseline was determined. The baseline methodology was
developed by reviewing other baseline methodologies used for residential CPR programs, as well as
baselines used for curtailment programs for large commercial consumers. The CPR baseline
66 Changes in total monthly consumption were also assessed. 67 Focus group participants indicated that they were generally satisfied with the mode of notification they
requested. 68 Critical peak events were declared due to moderate weather: two in August, two in September and three in
January.
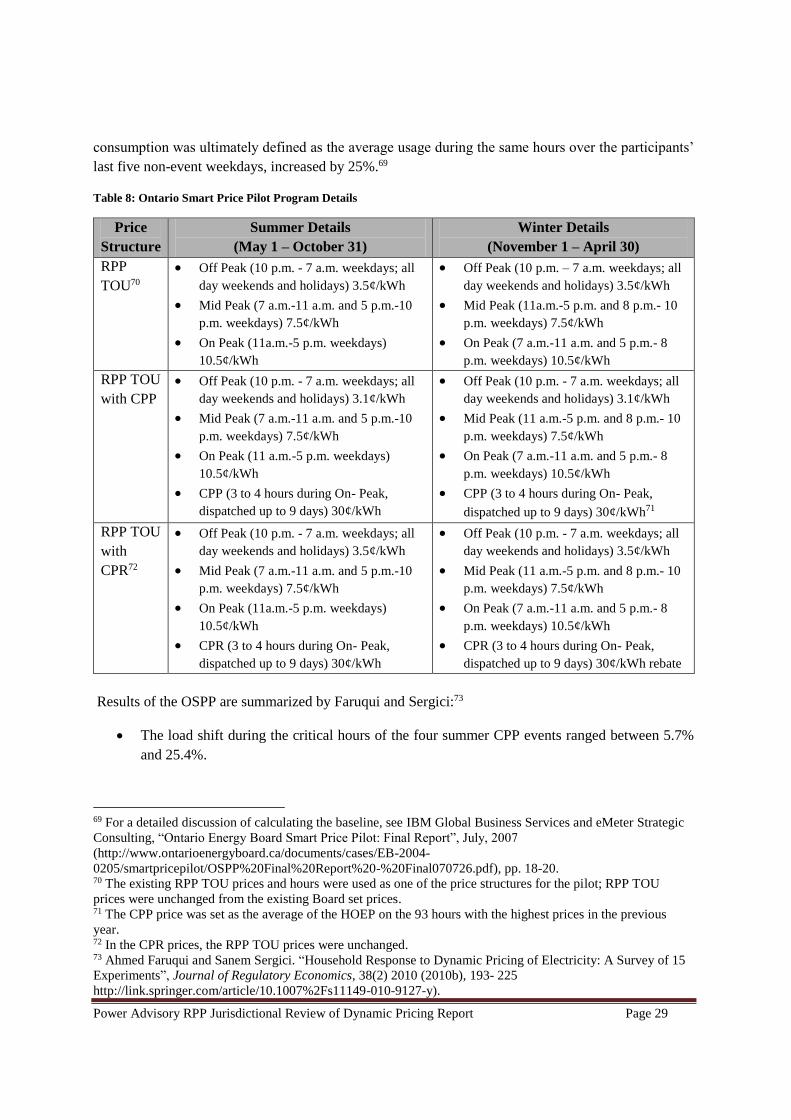
Power Advisory RPP Jurisdictional Review of Dynamic Pricing Report Page 29
consumption was ultimately defined as the average usage during the same hours over the participants’
last five non-event weekdays, increased by 25%.69
Table 8: Ontario Smart Price Pilot Program Details
Price
Structure
Summer Details
(May 1 – October 31)
Winter Details
(November 1 – April 30)
RPP
TOU70
Off Peak (10 p.m. - 7 a.m. weekdays; all
day weekends and holidays) 3.5¢/kWh
Mid Peak (7 a.m.-11 a.m. and 5 p.m.-10
p.m. weekdays) 7.5¢/kWh
On Peak (11a.m.-5 p.m. weekdays)
10.5¢/kWh
Off Peak (10 p.m. – 7 a.m. weekdays; all
day weekends and holidays) 3.5¢/kWh
Mid Peak (11a.m.-5 p.m. and 8 p.m.- 10
p.m. weekdays) 7.5¢/kWh
On Peak (7 a.m.-11 a.m. and 5 p.m.- 8
p.m. weekdays) 10.5¢/kWh
RPP TOU
with CPP
Off Peak (10 p.m. - 7 a.m. weekdays; all
day weekends and holidays) 3.1¢/kWh
Mid Peak (7 a.m.-11 a.m. and 5 p.m.-10
p.m. weekdays) 7.5¢/kWh
On Peak (11 a.m.-5 p.m. weekdays)
10.5¢/kWh
CPP (3 to 4 hours during On- Peak,
dispatched up to 9 days) 30¢/kWh
Off Peak (10 p.m. - 7 a.m. weekdays; all
day weekends and holidays) 3.1¢/kWh
Mid Peak (11 a.m.-5 p.m. and 8 p.m.- 10
p.m. weekdays) 7.5¢/kWh
On Peak (7 a.m.-11 a.m. and 5 p.m.- 8
p.m. weekdays) 10.5¢/kWh
CPP (3 to 4 hours during On- Peak,
dispatched up to 9 days) 30¢/kWh71
RPP TOU
with
CPR72
Off Peak (10 p.m. - 7 a.m. weekdays; all
day weekends and holidays) 3.5¢/kWh
Mid Peak (7 a.m.-11 a.m. and 5 p.m.-10
p.m. weekdays) 7.5¢/kWh
On Peak (11a.m.-5 p.m. weekdays)
10.5¢/kWh
CPR (3 to 4 hours during On- Peak,
dispatched up to 9 days) 30¢/kWh
Off Peak (10 p.m. - 7 a.m. weekdays; all
day weekends and holidays) 3.5¢/kWh
Mid Peak (11 a.m.-5 p.m. and 8 p.m.- 10
p.m. weekdays) 7.5¢/kWh
On Peak (7 a.m.-11 a.m. and 5 p.m.- 8
p.m. weekdays) 10.5¢/kWh
CPR (3 to 4 hours during On- Peak,
dispatched up to 9 days) 30¢/kWh rebate
Results of the OSPP are summarized by Faruqui and Sergici:73
The load shift during the critical hours of the four summer CPP events ranged between 5.7%
and 25.4%.
69 For a detailed discussion of calculating the baseline, see IBM Global Business Services and eMeter Strategic
Consulting, “Ontario Energy Board Smart Price Pilot: Final Report”, July, 2007
(http://www.ontarioenergyboard.ca/documents/cases/EB-2004-
0205/smartpricepilot/OSPP%20Final%20Report%20-%20Final070726.pdf), pp. 18-20. 70 The existing RPP TOU prices and hours were used as one of the price structures for the pilot; RPP TOU
prices were unchanged from the existing Board set prices. 71 The CPP price was set as the average of the HOEP on the 93 hours with the highest prices in the previous
year. 72 In the CPR prices, the RPP TOU prices were unchanged. 73 Ahmed Faruqui and Sanem Sergici. “Household Response to Dynamic Pricing of Electricity: A Survey of 15
Experiments”, Journal of Regulatory Economics, 38(2) 2010 (2010b), 193- 225
http://link.springer.com/article/10.1007%2Fs11149-010-9127-y).

Power Advisory RPP Jurisdictional Review of Dynamic Pricing Report Page 30
The load shift during the entire peak period of the four summer CPR events ranged between
2.4 % and 11.9%.
The percentage reductions for the TOU-only consumers were not found to be statistically
significant.
The table below summarizes the bill savings realized by participants over the seven-month pilot.
These savings are relative to the tiered pricing which was then employed in Ontario. A significant
portion of the savings was from the conservation effect produced by reduced consumption (turning off
lighting) and increased awareness which also reduces consumption. The focus groups indicated that
many participants found the savings that they realized less than they anticipated, but nonetheless were
satisfied by the program.
Table 9: Distribution of OSPP Participant Bill Savings
Source: OSPP Report
Surveys and focus groups with participants were conducted. Almost 75% of participants completed the
survey. The majority (78%) of survey respondents would recommend the time-of-use pricing plan to
their friends, while only 6% would definitely not. The top three reasons given by respondents for this
satisfaction were more awareness of how to reduce their bill, greater control over their electricity costs,
and environmental benefits. Those who were not sure or definitely would not recommend the program
indicated that the savings were too insignificant or required too much effort. Regardless of the pricing
plan in which they were enrolled, the majority of participants (74%) preferred TOU-only pricing out of
the four options, regardless of which option in which they were enrolled.
The refrigerator magnet was critical in making TOU prices and periods clear and concise and causing
the program pricing to be understandable. The magnet was frequently used to explain the program
pricing to family and friends.
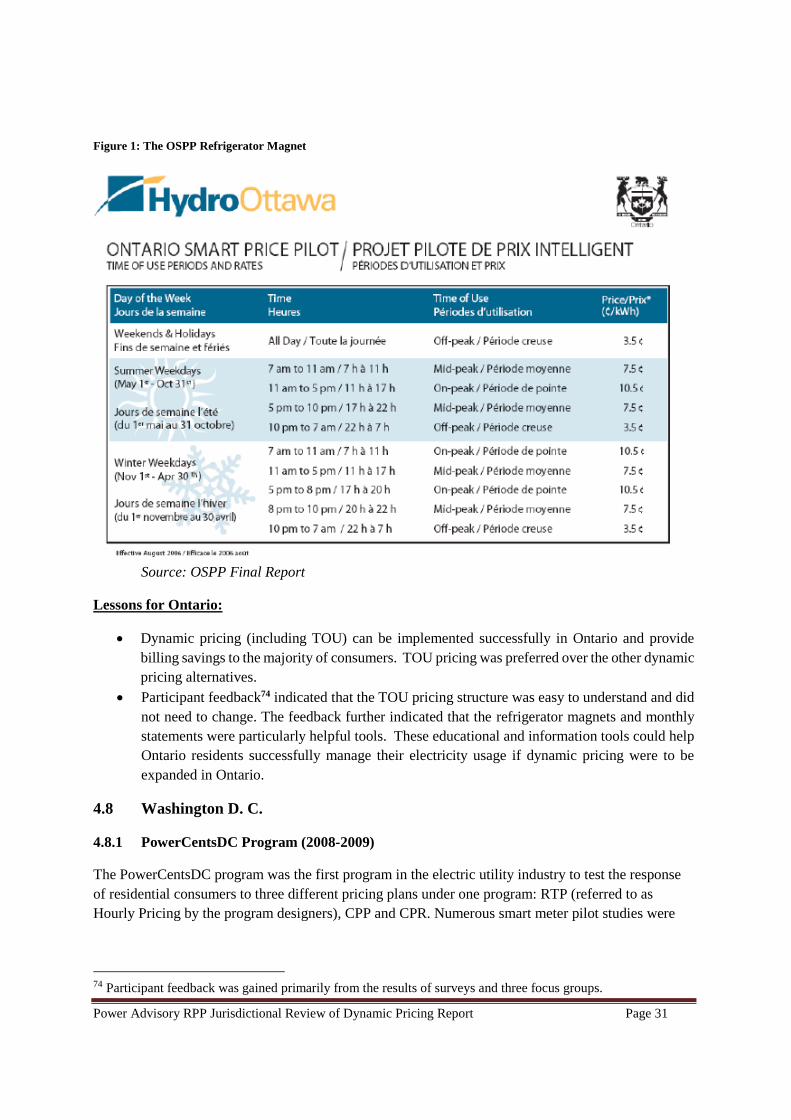
Power Advisory RPP Jurisdictional Review of Dynamic Pricing Report Page 31
Figure 1: The OSPP Refrigerator Magnet
Source: OSPP Final Report
Lessons for Ontario:
Dynamic pricing (including TOU) can be implemented successfully in Ontario and provide
billing savings to the majority of consumers. TOU pricing was preferred over the other dynamic
pricing alternatives.
Participant feedback74 indicated that the TOU pricing structure was easy to understand and did
not need to change. The feedback further indicated that the refrigerator magnets and monthly
statements were particularly helpful tools. These educational and information tools could help
Ontario residents successfully manage their electricity usage if dynamic pricing were to be
expanded in Ontario.
4.8 Washington D. C.
4.8.1 PowerCentsDC Program (2008-2009)
The PowerCentsDC program was the first program in the electric utility industry to test the response
of residential consumers to three different pricing plans under one program: RTP (referred to as
Hourly Pricing by the program designers), CPP and CPR. Numerous smart meter pilot studies were
74 Participant feedback was gained primarily from the results of surveys and three focus groups.

Power Advisory RPP Jurisdictional Review of Dynamic Pricing Report Page 32
being conducted around the time when PowerCentsDC was implemented.75 However, none of these
pilots included a comparison of RTP, CPP, and CPR in a single residential population; the effect of
smart thermostats on these three plans; or the reaction of low income consumers to these specific
options.
The program, which ran between July 2008 and October 2009, was initiated in response to the District
of Columbia’s 2007 Smart Meter Pilot Program, Inc. The program, which strongly emphasized
innovation, sought to determine the amount electricity consumers could save by utilizing key Smart
Grid technologies. PowerCentsDC had a consumer focus because it was conceived by the DC
consumer advocate, the Office of the People’s Counsel.76 The program relied heavily on consumer
education and the simplicity of the program design to engage consumers and produce results.
PowerCentsDC tested the reactions and impacts of three different price structures on consumer
behavior. Details pertaining to each pricing regime are outlined in the table below.
Participation in the PowerCentsDC program was voluntary; participants were randomly selected and
given an offer to participate. The program’s education plan included emails, regular mailings,
community meetings, a web portal and refrigerator magnets about the basic parameters of the
program. Program participants received monthly energy reports and in-home displays with real time
pricing and online access to a home energy management portal, which showed detailed energy
consumption data and tips for conservation. Price signals were provided with 24-hour notice via
telephone, text alert or email.
PowerCentsDC successfully demonstrated consumer use and adoption of smart meters, smart
thermostats, dynamic pricing, and enhanced energy information. Consumers participating in the
program reduced summer peak demand by up to 50% (among the largest reductions ever recorded),
with the greatest reductions occurring when dynamic prices were combined with automated air
conditioner control via smart thermostats. The results of the experiment demonstrated that all three
dynamic pricing programs provide stable, predictable, and sizable demand reductions in response to
CPP events and RTP warnings for residential consumers.77 Consumers reduced peak summer
electricity demand consistently when given a price signal. In his 2010 review78 of the PowerCentsDC
program, Frank Wolak outlines key program findings:
Consumers on all of the dynamic pricing programs substantially reduced their electricity
consumption during high-priced periods;
75 Ahmed Faruqui and Sanem Sergici, “Household Response to Dynamic Pricing of Electricity – A Survey of
the Experimental Evidence”, January 10, 2009
(http://www.hks.harvard.edu/hepg/Papers/2009/The%20Power%20of%20Experimentation%20_01-11-09_.pdf),
p. 12. 76 Brenda K. Pennington and Laurence C. Daniels, “PowerCentsDC’s Pilot Points the Way to a Successful
Smart Meter Rollout”, Electricity Policy.com, April 13, 2011 (http://www.electricitypolicy.com/4-13-11-
Pennington-final%20(Recovered).pdf), p. 1. 77 Frank Wolak, “Do Residential Customers Respond to Hourly Prices? Evidence from a Dynamic Pricing
Experiment” American Economic Review: Papers & Proceedings, 2011
(http://web.stanford.edu/group/fwolak/cgi-bin/sites/default/files/files/hourly_pricing_aer_paper.pdf), p. 87. 78 Wolak (2010), p. 1.
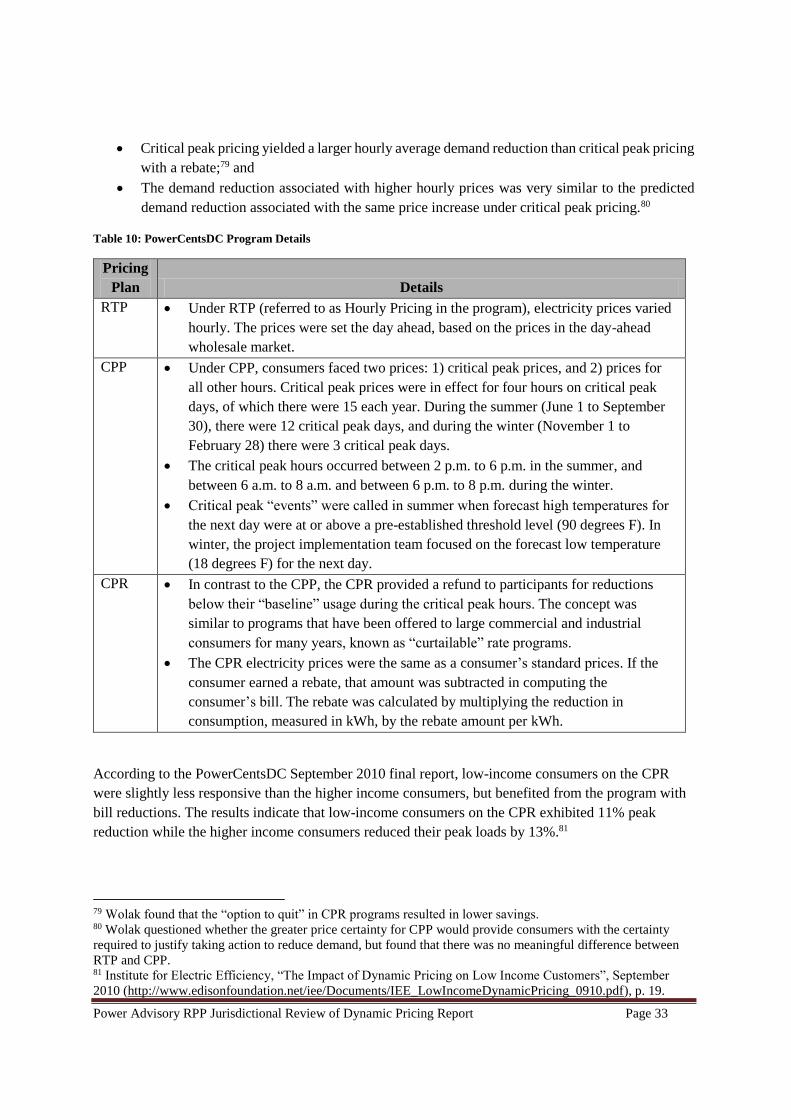
Power Advisory RPP Jurisdictional Review of Dynamic Pricing Report Page 33
Critical peak pricing yielded a larger hourly average demand reduction than critical peak pricing
with a rebate;79 and
The demand reduction associated with higher hourly prices was very similar to the predicted
demand reduction associated with the same price increase under critical peak pricing.80
Table 10: PowerCentsDC Program Details
Pricing
Plan Details
RTP Under RTP (referred to as Hourly Pricing in the program), electricity prices varied
hourly. The prices were set the day ahead, based on the prices in the day-ahead
wholesale market.
CPP Under CPP, consumers faced two prices: 1) critical peak prices, and 2) prices for
all other hours. Critical peak prices were in effect for four hours on critical peak
days, of which there were 15 each year. During the summer (June 1 to September
30), there were 12 critical peak days, and during the winter (November 1 to
February 28) there were 3 critical peak days.
The critical peak hours occurred between 2 p.m. to 6 p.m. in the summer, and
between 6 a.m. to 8 a.m. and between 6 p.m. to 8 p.m. during the winter.
Critical peak “events” were called in summer when forecast high temperatures for
the next day were at or above a pre-established threshold level (90 degrees F). In
winter, the project implementation team focused on the forecast low temperature
(18 degrees F) for the next day.
CPR In contrast to the CPP, the CPR provided a refund to participants for reductions
below their “baseline” usage during the critical peak hours. The concept was
similar to programs that have been offered to large commercial and industrial
consumers for many years, known as “curtailable” rate programs.
The CPR electricity prices were the same as a consumer’s standard prices. If the
consumer earned a rebate, that amount was subtracted in computing the
consumer’s bill. The rebate was calculated by multiplying the reduction in
consumption, measured in kWh, by the rebate amount per kWh.
According to the PowerCentsDC September 2010 final report, low-income consumers on the CPR
were slightly less responsive than the higher income consumers, but benefited from the program with
bill reductions. The results indicate that low-income consumers on the CPR exhibited 11% peak
reduction while the higher income consumers reduced their peak loads by 13%.81
79 Wolak found that the “option to quit” in CPR programs resulted in lower savings. 80 Wolak questioned whether the greater price certainty for CPP would provide consumers with the certainty
required to justify taking action to reduce demand, but found that there was no meaningful difference between
RTP and CPP. 81 Institute for Electric Efficiency, “The Impact of Dynamic Pricing on Low Income Customers”, September
2010 (http://www.edisonfoundation.net/iee/Documents/IEE_LowIncomeDynamicPricing_0910.pdf), p. 19.

Power Advisory RPP Jurisdictional Review of Dynamic Pricing Report Page 34
Average participant savings were found to be approximately $44/year.82 While not a significant
amount, the program still motivated consumers to change behavior as demonstrated in the program
findings (outlined above). This demonstrates that the option to respond to price signals was appealing
to the consumers despite the relatively low cost savings. The simple, consumer-centric nature of the
program yielded other interesting results:
Independent of which of pricing plan (RTP, CPP, CPR) the participants were on, 93% of the
participants indicated they liked the program better than their old rate.
The technology was not necessarily the driver behind consumers’ sense of empowerment.
When asked about how they preferred to receive information about their electricity, about half
of the nearly 1,000 participants said they want it on their hard copy, mailed bill rather than
online.
One-quarter of the respondents said they were not interested in receiving information about
their energy usage from a website.83
In addition to providing statistically significant information about how consumers respond to different
pricing plans, the PowerCentsDC pilot yielded valuable lessons with respect to deploying programs at
the residential consumer level. As Pennington and Daniels note,84 “the focus must be on the consumer
– early and comprehensively – through education, empowerment, and simplicity.” Pennington and
Daniels list the key lessons learned from the PowerCentsDC program:
Consumer education needs to begin early and continue well after deployment.
Listen to a broad group of stakeholders.
Rate simplicity is a must. In order for the new rates to provide adequate incentive for consumers
to change their behavior, consumers need to understand how the new rate scheme will work.
The easier the rates are to understand – and how consumers may benefit from using them – the
more likely it is that consumers will make use of them.
Any empowering technology used, must be user friendly. Try and get to the level of simplicity
that allows consumers to “set it and forget it.” Partner with the makers of easy-to-use
technology.
Continue meeting with and listening to consumers and adapting to their needs, even after the
program is underway and consumers begin adopting the technology. Over the next ten years, a
majority of utilities’ consumer base will be a generation of people who have become used to
downloading applications to digital devices and incorporating them into their daily lives. They
will expect that same easy ability to receive and apply solutions from their utility companies.
82 Katherine Tweed, “PowerCentsDC Could Provide Best Practices for Other Utilities”, September 10, 2010
(http://www.greentechmedia.com/articles/read/powercentsdc-could-provide-best-practices-for-other-utilities). 83 Power Advisory expects that consumer preferences in this regard may have changed in the intervening six
years. 84 Pennington and Daniels (2011), p. 9.

Power Advisory RPP Jurisdictional Review of Dynamic Pricing Report Page 35
Lessons for Ontario:
The PowerCentsDC program focused on consumer education, consumer empowerment, and
simplicity (both surrounding the rate and the empowering technology). Even at a general level,
these are relevant themes that Ontario can use in the design of dynamic pricing programs.
Much of the success of the PowerCentsDC program has been attributed to the significant efforts
that went into the program’s broad stakeholder engagement.
Similar to other program findings discussed above, the “set it and forget it” technology
associated with the PowerCentsDC program was found to be helpful. Similar technology could
work well for Ontario’s residential consumers who may not be at home to respond to changing
prices.
Participants in the PowerCentsDC program included a large percentage of consumers with
limited income. Program results demonstrated that these consumers reduced peak by virtually
the same amount as other consumers. Low income consumers were also found to enroll in the
program at higher rates than other consumers. A relevant lesson for Ontario is that low-income
consumers can benefit from implementation of a dynamic pricing program.

Power Advisory RPP Jurisdictional Review of Dynamic Pricing Report Page 36
5 Assessment of Dynamic Pricing Alternatives
5.1 Objectives of Dynamic Pricing Alternatives
The ultimate objective of all types of dynamic pricing is to reduce electricity costs by giving
consumers incentives to shift their consumption from times that are expensive to serve to times that
are less expensive. There are two aspects to reducing electricity costs: reducing peak demand (and
thus reducing or deferring corresponding capacity requirements and transmission and distribution
investments) and reducing energy costs.
All of the four types of dynamic pricing programs discussed in this report – RTP, CPP, CPR and TOU
– are intended to reduce the electricity system’s peak demand, which is one of the main determinants
of how much supply capacity it needs.85 Reducing peak demand can mean postponing or avoiding
development of new generating capacity and transmission and distribution investments. The resulting
cost savings can be substantial, but can take years to be realized. Two of the program types – RTP and
TOU – are also intended to shift consumption from high-cost to low-cost periods. Which program is
most appropriate depends on a number of factors, including the characteristics of the electricity
system. For example, a system with an immediate shortage of peaking capacity but fairly constant
energy prices might find CPP or CPR more appropriate, whereas a system with adequate peaking
capacity but widely-varying energy costs might be best served by RTP or TOU.
This chapter reviews the strengths and weaknesses of each type of dynamic pricing and factors
affecting their applicability to Ontario RPP consumers. One element of this is how they fit with the
appropriate objectives of the RPP program. Since the objectives for TOU pricing were developed
and outlined in the RPP Manual there have been fundamental changes to Ontario’s wholesale
electricity market prices and the determinants of these prices.86 Therefore, Power Advisory believes
that it’s appropriate at this time to reevaluate these four objectives:
1. Set prices to recover the full cost of RPP supply; that is, the prices and price structure must,
on a forecast basis, recover all of the RPP supply costs from the RPP consumers.87 This is
essential for RPP prices to be sustainable and a requirement of the RPP Regulation;
2. Set the price structure to reflect RPP supply costs; that is, the prices should reflect the
differences in cost of supply at different times of the day and year. This will promote
dynamic and allocative efficiency – the efficient development of Ontario’s electricity
infrastructure and the efficient use of resources;
3. Set both prices and the price structure to provide consumers with reasonable opportunities to
reduce their electricity bills by shifting their time of electricity use. In this way, the dynamic
pricing alternative should facilitate conservation and demand management (CDM) by
85 However, these programs typically also have a conservation impact since the demand reduction doesn’t just
involve shifting demand it can involve conservation (e.g., turning off lighting) and the increased awareness of
electricity consumption levels during this period can also reduce consumption. 86 RPP Manual, p. 24. Power Advisory slightly modified the wording of these objectives. 87 Price structure refers to the periods for which prices apply and the relative price levels between periods.

Power Advisory RPP Jurisdictional Review of Dynamic Pricing Report Page 37
recognizing how consumers are likely to respond to price differences and avoiding undue
barriers to CDM; and
4. Create a price structure that is easily understood by consumers and as a result facilitates their
response to such prices and increases consumer acceptance of these prices.
The first two objectives can be achieved by all types of dynamic pricing programs, and so are not
considered further in this chapter. The fourth objective is an important consideration, with significant
differences between different dynamic pricing alternatives. However, the third objective is
problematic, as the cost savings from shifting consumption may be significant in aggregate but
insignificant for an individual consumer. For example, under Ontario’s current TOU rates, a typical
residential consumer, consuming an average of 1,000 kWh per month, who shifted 10% of both peak
and mid-peak consumption to off-peak times (which would require considerable effort, and is toward
the high end of what TOU programs in other jurisdictions have achieved, as discussed below) would
reduce their total electricity bill, including transmission, distribution and other charges, by
$1.80/month or approximately 1%. According to Navigant’s evaluation of the TOU program, the
actual bill reduction for residential consumers has been even less than this, only $12/year, or
$1/month.88 Much of this reduction has been due to an overall decrease in consumption, with 2.6-
2.8% decreases in peak and mid-peak consumption and almost no increase in off-peak consumption.
Ontario’s electricity system has evolved significantly since the RPP came into effect in 2005. In the
first RPP price-setting (for the April 1, 2005 to April 30, 2006 period), RPP supply costs were
dominated by market prices as reflected in the HOEP (forecast to be 6.0¢/kWh), with the other supply
cost components (which were reflected in the Global Adjustment and a revenue cap on OPG Non-
prescribed Generation) reducing costs by 0.7¢/kWh, for a net supply cost of 5.3¢/kWh. Since then,
market prices have fallen considerably (to 2.3¢/kWh in the most recent RPP price-setting, for
November 2014 to October 2015) and RPP supply costs are dominated by the Global Adjustment
(forecast to be 7.5¢/kWh in the most recent price-setting). These changes are due to two main factors:
The drop in gas prices, which have greatly reduced market prices. Because many Ontario
generators are on fixed-price contracts, a drop in the average market price is largely offset by
an increase in the Global Adjustment.
Additional fixed-price contracts, for gas plants, renewable generation, nuclear generation and
conservation and demand management programs. This has further increased the Global
Adjustment.
Lower market prices mean that the difference between high-price and low-price hours – and therefore
the savings from shifting consumption from peak to off-peak periods – has fallen. In 2005, the
average price during peak periods was 3.9¢/kWh higher than the average price during off-peak
periods. In 2013, that gap had fallen to 1.0¢/kWh.89
88 Navigant (2013), Figure 24, p. 39. 89 Current definitions of time-of-use periods are used for both 2005 and 2013, with the off-peak period
beginning at 7 p.m.

Power Advisory RPP Jurisdictional Review of Dynamic Pricing Report Page 38
This does not mean that dynamic pricing is not important in Ontario. In 2013, the Ministry of Energy
issued a Long-Term Energy Plan (LTEP), which called for demand response to meet 10% of peak
demand by 2025, representing approximately 2,400 MW. Dynamic pricing can make a significant
contribution toward meeting that goal.
Taken together, these two factors – the smaller difference between peak and off-peak market prices,
and the LTEP requirement for 2,400 MW of demand response – point to a greater emphasis on
reducing system costs through peak reduction, and a lesser emphasis on shifting load from high-priced
to low-priced hours (outside of the hours that affect system peak capacity requirements). They also
call into question the weight that should be placed on the third RPP objective – to provide consumers
with reasonable opportunities to reduce their electricity bills – and suggest that additional objectives
be considered.
For guidance in this, the objectives of the dynamic pricing programs described in Chapter 4 were
reviewed. Most of these programs were pilots or experiments, whose main objectives – to gain
information about consumer behavior and program implementation – are not applicable to Ontario’s
dynamic pricing objectives. Two of the programs are on-going (not pilots or experiments) and have
explicitly-stated objectives: Gulf Power’s Energy Select program in Florida, and Ameren’s
Residential Real-Time Pricing program in Illinois. Objectives of these programs include:
Reducing peak demand (Gulf Power)
Improving consumer satisfaction with the utility (Gulf Power)
Help consumers save money (Gulf Power and Ameren)
Help consumers reduce energy usage (Gulf Power)
Improve local, feeder-based reliability (Ameren)
Of these, the third (help consumers save money) is covered by the third RPP objective. The fourth
(help consumers reduce energy usage) is less applicable to dynamic pricing programs, which are
focused largely on shifting load rather than reducing it. The second (improving consumer satisfaction)
and fifth (improving feeder-based reliability) are not obviously inapplicable. Gulf Power was
focused on improving consumer satisfaction given the risk of competition and concerns with customer
attrition. While improving feeder-based reliability is a possible objective it is a secondary or tertiary
objective. The only one that is clearly applicable to Ontario, and missing from the RPP objectives, is
the first: reducing peak demand.
For the purposes of our evaluation of the dynamic pricing alternatives, the four RPP objectives need to
be modified and supplemented in at least two ways:
Reducing system costs needs to be added as an explicit objective. This can be achieved either
by reducing system peak demand, or by shifting load from more expensive to less expensive
hours outside of system peak hours.
Rather than committing to providing consumers with “reasonable opportunities to reduce their
electricity bills”, bill reductions should be commensurate with both reductions in system costs
and with the level of effort required to achieve them.
Power Advisory RPP Jurisdictional Review of Dynamic Pricing Report Page 39
A further consideration is the extent to which small businesses can participate in dynamic pricing
programs. The Brattle Group’s evaluation of Ontario’s TOU program found that general service
consumers had far smaller responses to TOU rates than residential consumers did,90 and Navigant’s
evaluation found no significant impact on general service on-peak consumption.91 Many small
businesses operate primarily during the peak and mid-peak periods, so have little opportunity to
participate in Ontario’s current TOU program by shifting consumption to the off-peak period.
With any change in electricity rates, there will be winners and losers. Consumers who use a higher
proportion of their electricity during peak times (CPP/CPR events, peak TOU periods, or times when
real-time prices are high) will be adversely affected by such a program if they don’t reduce their
electricity demand in such periods. This may impede consumer acceptance to such changes. Clearly,
obtaining such changes in behavior is critical to the program’s effectiveness. Strategies to facilitate
these changes and consumer acceptance are discussed further below. Many of these are discussed in
the context of implementation issues.
5.2 Common Implementation Issues
Any new dynamic pricing program, or change to the existing TOU period, would face a similar range
of implementation issues.
5.2.1 Voluntary vs. Mandatory Programs
Opposition to the implementation of dynamic pricing programs would be reduced if the new rates
were voluntary rather than mandatory. Voluntary programs can be implemented in two ways: as “opt-
in” programs, which consumers have to make a choice to participate in, and as “opt-out” programs,
which consumers have to make a choice to not participate in. Ontario’s TOU program is technically
an “opt-out” program, because consumers have the option to sign up with an electricity retailer and
receive a flat price.
Research shows that “opt-out” programs tend to have much higher participation rates, and much
higher impacts on electricity consumption, than “opt-in” programs.92 The average impact per
participant tends to be higher in “opt-in” programs, because only those consumers who pay attention
to their electricity bills tend to participate. However, the overall impact is much greater with more
participants. “Opt-in” programs are more reliant on program marketing to secure consumer
participation (to pull in consumers) and this can increase program costs. Conversely, this creates an
opportunity for targeted marketing where consumers that are most likely to benefit from the program
are identified and marketed to. “Opt-out” programs have most of the participation benefits of
mandatory programs, and can avoid much of the opposition associated with mandatory programs,
particularly if they offer other consumer protections (e.g., bill protection and bill comparisons which
are discussed below).
90 Faruqui et al. (2013). 91 Navigant (2013), p. 40. 92 Ahmad Faruqui, “Price-Enabled Demand Response”, July 16, 2014
(http://brattle.com/system/publications/pdfs/000/005/048/original/Price-
Enabled_Demand_Response.pdf?1406065753), pp. 18-19.

Power Advisory RPP Jurisdictional Review of Dynamic Pricing Report Page 40
Programs can start out as opt-in; transition to opt-out; and ultimately become mandatory. This can
ease implementation, both practically (LDCs gain experience with a few consumers before the full
roll-out) and strategically (only those interested participate at first; by the time that other consumers
are involved, discussion on impacts can be based on data from the early adopters).
One reason that opt-out programs result in higher participation than opt-in programs is that consumers
are unlikely to make a decision (to opt out or to opt in) unless they are confident that they will see a
tangible benefit from their decision. One technique that has been used successfully in a number of
pilot projects to encourage opting in is shadow billing: both participating and non-participating
consumers receive bills showing their cost of electricity, and what it would have cost had they been on
the alternative pricing program, so that they can see if the new rate structure would save them
money.93
One limitation on mandatory and opt-out programs is that they put the onus on the utility to provide
all participating consumers with the means to receive the information (e.g., prices or notice of a CPP
event) required to participate in the program, whereas with voluntary opt-in programs, the onus can be
put on the consumers who choose to participate. This is discussed below with respect to each type of
program.
5.2.2 Enabling Technologies
Dynamic pricing alternatives can be more effective if manual adjustments to end-uses are
supplemented or avoided by enabling technology. For TOU programs, examples include timers of
various sorts (to raise or lower heating and air conditioning according to a fixed schedule, start clothes
dryers and other appliances, turn pool pumps on and off, etc.). For CPP, CPR and RTP programs,
more sophisticated – and expensive – equipment is needed that receives information about prices or
CPP/CPR events, and controls heating, appliances, lighting, etc. accordingly.
Communication with enabling equipment can be achieved through some types of smart meters or
through an internet connection. Almost all of Ontario’s RPP consumers have smart meters installed
that are capable of two-way communication. However, these capabilities have, for the most part, not
been implemented or tested. Power Advisory discussions with Ontario LDCs indicate that the cost of
installing enabling equipment such as a Programmable Controllable Thermostats (PCT) capable of
communicating with the smart meter, and implementing systems at the LDC end to communicate real-
time prices or CPP/CPR events, is likely to be several hundred dollars per consumer. An alternative is
to use the internet: LDC applications, the consumers’ own internet connections, and WiFi-capable
enabling equipment. Gulf Power’s Energy Select TOU-CPP program, discussed in Section 4.2.1
above, takes this approach.
Experience with CPP programs in other jurisdictions has shown that participants who have enabling
technologies, such as PCTs for residential consumers, reduce their peak demand during CPP events by
a substantially larger percentage than do participants without enabling technologies. In Xcel’s CPP
pilot project in Colorado, for example, participants with enabling technologies – either PCTs or A/C
93 Severin Borenstein, “Effective and Equitable Adoption of Opt-In Residential Dynamic Electricity Pricing”,
April 2012 (https://ei.haas.berkeley.edu/pdf/working_papers/WP229.pdf), p. 10.

Power Advisory RPP Jurisdictional Review of Dynamic Pricing Report Page 41
cycling switches – reduced their demand by 49%, compared to a 29% reduction by CPP participants
without enabling technologies.94 CPP programs in Georgia, discussed in Section 4.3 above, found that
enabling technologies also increased consumer satisfaction with the programs. Increasing the load
reduction enhances the savings realized by consumers, increasing their satisfaction and reducing the
risks of consumer opposition to such programs.
Dynamic pricing programs can therefore be more effective if they include support for enabling
technologies. This support can range from providing consumers with information about what types of
equipment are available, where they can be purchased, and what performance to expect, to discounts
on specific equipment (similar to the coupons that the Ontario Power Authority has been distributing
for energy-saving equipment such as low-energy light bulbs), to directly supplying equipment.
Ontario already has a program in place that provides residential and small commercial consumers with
enabling technology. Ontario’s peaksaver PLUS program reduces consumers’ loads during summer
peak times.95 Participating consumers allow a one-way paging network to control either a PCT or a
load control switch to curtail demand for central air conditioners, electric water heaters or pool pumps
at no cost to the consumer. Thermostats can be accessed remotely to allow consumers to manage
energy use when they are away from their home. The peaksaver PLUS program also offers an in-
home energy display that allows consumers to see, in near real-time, how much electricity they are
using, and allows consumers to take steps to reduce consumption. peaksaver PLUS participants would
be well positioned to participate in dynamic pricing programs, though it could be argued that they are
free riders in that they would be rewarded for doing what they are already doing.
5.2.3 Two-Way Communication
All types of dynamic pricing require some form of two-way communication between the utility and
consumers. Utilities need to know when consumers use electricity, for billing purposes, and
consumers need to know what rates are and when they change. The frequency and complexity of
providing information to consumers varies with the type of program:
RTP has the most complex communication requirements, as consumers need to know hourly
prices.
CPP and CPR require utilities to inform consumers that a CPP/CPR event is about to occur, at
least several hours before it begins. Consumers also need to be made aware of prices during
events, but these generally remain the same for an extended period (months or years).
TOU programs have the simplest communication requirements, as consumers only need to be
kept informed of changes in TOU schedules and rates. In Ontario, RPP rates are reset every six
months, and the time of the peak and mid-peak periods flip between summer and winter.
94 Faruqui, and Sergici (2009), p. 19. 95 The peaksaver Plus program provides demand reductions during peak demand periods from May 1 to
September 30th between the hours of noon and 7 p.m., but never for more than four hours, from consumer’s air
conditioners, electric water heaters and pool pumps which are cycled off. Participants are able to override the
air conditioner control by calling a toll-free number. As of December 2012, approximately 180,000 control
devices were installed on central air conditioners in Ontario.

Power Advisory RPP Jurisdictional Review of Dynamic Pricing Report Page 42
Information that changes only occasionally (such as TOU schedules and TOU and CPP rates) can be
communicated through newspapers and other media; no special provisions are required. CPP/CPR
events can be announced through media, phone or text messages, email, internet applications, or
through some types of smart meters (as discussed above, most smart meters installed in Ontario have
this capability, but it would need to be enabled at considerable expense). Real-time prices are best
communicated electronically, through internet applications or smart meters.
These different communication requirements have implications for the use of enabling technologies,
the costs and equity of making programs mandatory, and the types of consumers each program is
suitable for. These implications are discussed below with respect to each type of program.
5.2.4 Education
One message that was consistent throughout the programs reviewed in Chapter 4 is the importance of
educating consumers about the programs and about steps that can be taken to successfully participate.
It is not simply the technologies or tools that drive results in a dynamic pricing program, but rather the
consumers. Done well, consumer education can significantly increase program’s impacts and benefits
by increasing enrollments and facilitating program enhancements to retain participants. Often, the key
to a dynamic pricing program's success lies in a utility’s approach to engage with and educate its
consumers. To increase consumer participation, consumers must understand why rates are changing
and how the dynamic pricing alternative can lower their bills and reduce overall energy costs for
society.
Dynamic pricing is like any new consumer product, which requires market research and messaging.
For a program to be successful, the designer must understand consumer preferences, perform
consumer segmentation, send segment-specific messages, do outreach and education, listen and
answer questions.96
Generally speaking, a key part of consumer engagement efforts should include customized tools that
educate consumers about the details, pros, and cons of different rate plan offerings. More specifically,
when creating consumer education materials related to a rate plan, it is important to identify which
customer base the utility is trying to reach (residential, small businesses, etc.) and tailor education
materials to that particular customer base. The PowerCentsDC program in Washington D.C. is a good
example of a pilot program that was infused with a robust education plan tailored specifically to the
residential consumers that were targeted (including low income consumers). The education materials
included emails, regular mailing, community meetings, a web portal and refrigerator magnets about
the basic parameters of the program.
Another consideration in developing education materials is timing. Consumer education materials are
typically developed during program design stages. Early stakeholder collaboration can help identify
the best approaches to reaching and communicating with consumers. Consumer representation on
stakeholder working groups is one way to do so. The PowerCentsDC program demonstrated that
96Phil Carson, “Dynamic pricing: the facts are in, Part III”, Intelligent Utility, August 7, 2012
(http://www.intelligentutility.com/article/12/08/dynamic-pricing-facts-are-part-iii).

Power Advisory RPP Jurisdictional Review of Dynamic Pricing Report Page 43
engaging consumers during program design rather than at the program launch can significantly
contribute to program success. As demonstrated by Gulf Power’s Energy Select program, in addition
to increasing program impacts, robust consumer education can also increase a consumer’s satisfaction
with the utility.
Based on experience with the PowerCentsDC program, the following elements can contribute
significantly to program success:
Beginning consumer education early and continuing it well after deployment.
Listening to a broad group of stakeholders.
Rate simplicity.
User-friendly enabling technology that allows consumers to “set it and forget it.”97
The experience of other dynamic pricing programs can be drawn on in designing an education
program. For example, PG&E’s SmartRate program found that a combination of a letter plus an email
was more effective in encouraging participation than either two letters or two emails.98
5.2.5 Tie-ins with Other Conservation and Demand Management Programs
Ontario has experience with a number of conservation and demand management programs. Currently
the most active demand management programs are:
peaksaver PLUS, a program aimed at residential consumers in single-family dwellings and
small businesses. The program provides controllers which the LDC can signal at peak times to
cycle off air conditioners, electric water heaters and pool pumps. There is no change in the
consumer’s rates.
DR-3, which contracts with larger (more than 50 kW demand) commercial, industrial and
institutional consumers to reduce their load when called on, with payments for reducing load
and penalties for failing to do so.
There are also a number of energy conservation programs. Residential programs provide incentives to
replace inefficient appliances with new, more efficiency ones, and provide coupons to encourage the
purchase of energy-efficient products such as lightbulbs, motion-detector switches and programmable
thermostats. The commercial programs include support for energy audits, engineering studies and
equipment retrofits and replacement.
A dynamic pricing program could benefit from Ontario’s other conservation and demand management
programs in two ways: by learning from their experience, and by active cooperation. Examples of the
types of experience which could benefit a dynamic pricing program include the following:
Selecting, providing, administering and controlling enabling equipment. peaksaver PLUS
offers experience in providing and installing residential consumers with control equipment
97 Pennington and Daniels (2011), p. 9. 98 Maril Pitcock, “SmartRate Best Practices and Lessons Learned”, CPUC Workshop: Marketing, Education and
Outreach, Day 2 - Session 1, July 31, 2014 (http://www.cpuc.ca.gov/NR/rdonlyres/E1AB361C-A80C-4FE0-
B995-2BE2D2DCD6BE/0/PGETOU_Day2_Session1.pptx), p. 5.

Power Advisory RPP Jurisdictional Review of Dynamic Pricing Report Page 44
that responds to a utility’s signals. Such equipment can greatly increase the impact of CPP
and CPR programs.
Soliciting participants in opt-in programs. peaksaver PLUS and the conservation programs are
optional, and have given the Ontario Power Authority and participating LDCs extensive
experience in selecting and designing outreach programs (advertisements, mailings, emails,
etc.) to maximize participation.
Estimating load reductions in CPR programs. While the DR-3 program is aimed at large
commercial and industrial consumers, it provides experience in the complexities of estimating
what consumers’ loads would have been in the absence of the program – an essential
component of a CPR program.
Experience in promoting conservation and educating consumers about TOU pricing could be
drawn on to most effectively educate consumers about any new dynamic pricing program.
As well, dynamic pricing programs and conservation and demand management programs can be
mutually supportive. For example, education materials (flyers, advertising etc.) could address both
types of programs to avoid duplication and stretch budgets.
Packaging a dynamic pricing program, such as CPP, with a conservation program could make both
more acceptable to consumers. Consumers can benefit immediately from conservation programs,
while the consumer-level benefits of TOU and CPP programs (i.e., reduced investment requirements),
though substantial can take years to manifest. By combining the two, the resulting package can be
shown to have both immediate and long-term benefits.
Ontario’s dynamic pricing program or programs should not been considered in isolation, but should be
seen as part of a menu of energy management programs available to Ontario consumers. Some
programs may be mandatory, such as the current TOU program, but others are optional. Consumers
who are more interested in energy management could opt in to a voluntary dynamic pricing program,
get enabling equipment installed through the peaksaver PLUS program, use coupons to install energy-
conserving equipment, get a home energy audit, etc.
5.2.6 Billing System Changes
In Ontario, the Smart Metering Entity (SME) is responsible for collecting and managing consumer’s
load data. It sums each consumer’s hourly loads into the three TOU categories and sends that
information to the LDCs. The LDCs calculate charges and bill the consumers.
Any dynamic pricing alternative, including changes to Ontario’s current TOU program, will require
both the LDCs and the SME to make changes to their systems, but the complexity and expense of
these changes will depend on the details of program design. Modifying the current TOU program is
likely to be simple, requiring the SME to change the TOU schedule, and the LDCs to change the rate
schedule. RTP would be more complicated, but the SME’s systems, and data transfer protocols
between the SME and the LDCs, have been designed to accommodate RTP. CPP would be still more
complicated, and CPR would be the most difficult as it would involve calculation of baseline
consumption for every participating consumer.
Power Advisory RPP Jurisdictional Review of Dynamic Pricing Report Page 45
One issue to be addressed is which entities should be responsible for the more complex calculations.
For example, with CPR, it might be simpler for the SME to calculate baseline consumption levels for
all consumers, rather than requiring each of the 73 LDCs to implement this complex calculation. With
RTP, data volumes could be greatly reduced if the SME were to provide the LDC with total monthly
consumption and total monthly cost, rather than hourly volume data for every consumer, but this
would require the SME to calculate prices and charges, which it does not currently do.
These complexities should only be a minor consideration in making strategic decisions about which
dynamic pricing alternative to implement. Once the general choice is made, however, consultation
with the SME and the LDCs is strongly recommended to ensure program implementation at a
reasonable cost.
5.3 Dynamic Pricing Alternatives
5.3.1 Real Time Pricing
RTP rates are typically based on market prices, which reflect the short-term marginal cost of
electricity. Large consumers in Ontario have been paying real-time rates since the market opened in
2003. Illinois has been a leader in RTP for residential consumers, with a legislative requirement that
all electricity consumers “should have access to and be able to voluntarily use real-time pricing”.99
Illinois’s RTP programs are discussed in Section 4.4 above.
5.3.1.1 Strengths of RTP
RTP gives consumers detailed information about system costs, and incentives to reduce consumption
when, and only when, system costs are high, unlike Time-of-Use and CPP rates which are
predetermined and may not reflect current costs. Consumers are given incentives to avoid periods with
outages (to the extent that outages result in high prices) as well as periods when demand is high. They
are free to choose whether and how to monitor changing prices, and whether and how to respond, so
they can make trade-offs between paying for electricity and modifying their consumption; for
example, a consumer could choose to reduce consumption most of the time when prices are high, but
might choose to pay high electricity prices rather than accepting a reduction in service at specific
times when the services provided by electricity are valued especially highly.
As noted above, it would be relatively easy for the SME and LDCs to implement RTP. Most LDCs
already have large consumers which pay spot prices, but adjustments would be needed to account for
the details of an RPP-focused RTP program, and to accommodate the much larger number of
participating consumers.
5.3.1.2 Weaknesses of RTP
In order to take advantage of RTP, consumers need to somehow monitor real-time prices, and respond
accordingly. To be most effective, this requires automation, both of the monitoring and of the
response. This can be quite expensive, as it requires equipment, programming, and management time.
99 Illinois General Assembly, Public Act 094-0977
(http://www.ilga.gov/legislation/publicacts/fulltext.asp?Name=094-0977).

Power Advisory RPP Jurisdictional Review of Dynamic Pricing Report Page 46
RTP takes into account short-term marginal energy costs, but may not reflect long-term marginal
energy costs. For example, a long-term shift from on-peak to off-peak periods could affect a system’s
expansion plan and the resulting costs. The difference is not likely to be significant, since most RTP
consumers will focus on avoiding price spikes, rather than optimizing their operations with respect to
small variations in electricity prices.
More importantly, while RTP provides a means and an incentive to avoid all price spikes, it may not
provide an adequate incentive to avoid the highest price spikes and/or periods when demand is
highest. These are the periods that determine the system’s need for new peaking capacity. In Ontario,
as in several other jurisdictions, new capacity is procured separately from energy (in Ontario,
primarily through direct procurement; in PJM, ISO-NE, NYISO and a few other markets, through an
auction for capacity). In these types of markets, energy prices do not necessarily reflect the full capital
cost of peaking capacity, and to provide an economically efficient price in such markets, RTP would
need to be supplemented to reflect such costs. In Ontario, the largest consumers (specifically, those
with peak demands greater than either 3 or 5 MW, depending on the industry – none of them RPP
consumers) have an incentive, in addition to RTP, to minimize consumption during periods of high
system demand as their Global Adjustment charges are determined based on their consumption during
those times.
5.3.1.3 Range of Outcomes of RTP Programs
There have been relatively few RTP programs or pilot projects aimed at smaller consumers. Faruqui
and Palmer’s survey of 126 experiments with dynamic pricing and time-of-use pricing100 included
only four RTP programs, with peak reductions ranging from almost nothing to 16%
In Ameren’s Power Smart Program in Illinois, consumers “have saved an average of more than 15%
on the electricity supply portion of their bills compared with what they would have paid on the
standard rate”.101 These are residential consumers who are notified of power prices by email, phone or
text so that they can manually adjust their consumption. Savings would presumably be larger with
enabling equipment that adjusts air conditioning, lighting, etc. automatically. However, savings in
Ontario could be smaller, for two reasons:
According to Ameren Illinois’s FAQ, “Most of the time, the hourly price is lower than the
standard-fixed rate price” so it is not clear to what extent consumers’ savings are due to shifting
consumption vs. a lower average rate; and
PSP real-time rates are actually day-ahead rates, so consumers know with certainty what rates
they will be charged the next day, and can act accordingly. The HOEP – which is the most
obvious RTP signal for Ontario – is not known ahead.
100 Ahmad Faruqui and Jenny Palmer, “The Discovery of Price Responsiveness – A Survey of Experiments
Involving Dynamic Pricing of Electricity”, March 12, 2012 (http://ssrn.com/abstract=2020587). 101 Ameren Illinois, “Power Smart Program Frequently Asked Questions”
(http://www.powersmartpricing.org/faqs/).

Power Advisory RPP Jurisdictional Review of Dynamic Pricing Report Page 47
5.3.1.4 Appropriateness of RTP for Ontario RPP Consumers
RTP programs are most appropriate in jurisdictions with numerous price spikes of relatively short
duration, occurring in multiple seasons and at different times of the day. Where price spikes tend to
occur in the same season and at the same time of day, a simpler program, such as CPP, CPR or TOU,
may be more appropriate. RTP programs can assist with facilitating the integration of renewables
where integration issues are based on long duration demand/supply imbalances which are captured in
wholesale prices (e.g., negative prices in Ontario during Surplus Baseload Generation events.)
While RTP conveys efficient price signals, it may not be the best option for RPP consumers. To take
full advantage of RTP, consumers would need to make significant investments in automation of both
monitoring and electricity usage – investments that would be most cost-effective for large consumers.
RPP consumers are, by definition, the smaller (residential and smaller commercial) consumers.102 As
well, hourly prices in Ontario have relatively low volatility compared to many other jurisdictions,
which limits the potential savings from RTP.
RTP does not fit well with the fourth objectives of the RPP program, as it is the most difficult type of
dynamic pricing program for consumers to understand, and ultimately to respond to. However, it has
been shown to be effective in reducing system peak demand and system energy costs.
5.3.1.5 RTP Implementation Considerations
Any RTP program would need to consider how to communicate real-time prices to consumers. RTP
has the most stringent communication requirements of all types of dynamic pricing, as consumers
need to be informed of hourly prices. For some consumers, emails or internet applications may be
adequate, especially if they have options to set up alerts when especially high prices are expected,
rather than receiving all hourly prices. Ameren Illinois’s Power Smart Pricing program offers
consumers a “PriceLight” – a glowing glass ball that receives hourly prices by pager and changes
colour from blue to green to yellow to red to warn of high prices. To be most effective, however,
enabling technologies need to receive information directly so that they can respond in pre-
programmed ways. This requires either special types of smart meters capable of two-way
communication, or internet access and an appropriate application.
These communication requirements may limit the types of consumers for whom RTP is suitable,
depending on what form of communication is chosen. As discussed above, Ontario’s smart meters
generally have two-way communication capabilities, but implementing these capabilities for RTP
would require significant investments. Internet communication may turn out to be less expensive, but
participation would be limited to consumers who already have an internet connection. Virtually all
commercial RPP consumers have an internet connection, as do most residential consumers, but some
do not. It would therefore be unfair to make an internet-based RTP program mandatory, or even opt-
out, for all consumers. It could be made mandatory or opt-out for commercial consumers of a certain
102 Volatility is often measured in coefficient of variation which is the standard deviation as a percentage of the
mean. In Ontario low prices result in a low mean such that relatively small absolute movements in price can
result in appreciable volatility. The low volatility of the Ontario wholesale electricity market in this context
refers to the relatively small absolute variations in price levels.
Power Advisory RPP Jurisdictional Review of Dynamic Pricing Report Page 48
size (who can reasonably be assumed to have an internet connection), and opt-in for residential
consumers.
Another consideration in designing an RTP program is how to protect consumers from unexpectedly
high bills, which could impede consumer acceptance of the program. Ontario’s hourly market prices
have occasionally exceeded $1.00/kWh ($1,000/MWh), a level which would expose participants to
significant risk if they fail to monitor and respond to prices. One approach, discussed above, is to
calculate each consumer’s bill based both on the RTP program and on what it would have been on
standard rates, and then put a cap on the difference. (Showing both amounts could also encourage
switching to RTP, and increase satisfaction with RTP, by showing how much consumers could save.)
Another approach, which could be used either instead of or in addition to a cap on the total bill, would
be to cap hourly prices for program participants. Illinois’s Energy-Smart Pricing Plan, discussed in
Section 4.4.1 above, caps prices at $0.50/kWh.
In addition to considerations applicable to any RTP program, some implementation considerations are
specific to Ontario’s electricity market. One of these is that in Ontario, marginal costs (as represented
by wholesale market prices) fall far short of the total cost of electricity supply, with the difference
made up by the Global Adjustment. Any RTP program would need to consider how to allocate GA
costs, as well as wholesale market costs. Currently, GA costs are allocated to RPP consumers in a
two-stage process: first, GA costs are allocated to RPP consumers collectively based only on total
RPP consumption in each month, without regard for when that consumption occurred; then these
collective costs are allocated to individual RPP consumers based on time-of-use periods. The Board
has, over the last few years, considered various ways in which to allocate GA costs to time-of-use
periods, but is limited by the requirement that RPP prices be based on differences in the cost of supply
at different times of the day and year. As a result, the difference between on-peak and off-peak RPP
rates is fairly small. If GA costs under an RTP program are allocated in the same way, based on the
same TOU periods, the percentage difference between real-time prices during high-cost and low-cost
periods will be quite small except during a few hours, meaning that consumers would have little
incentive to adjust their electricity consumption outside of price spikes.
Another consideration specific to Ontario’s market is that there is no day-ahead market. While the
IESO currently produces forecasts of market prices up to a day ahead, charges to consumers who pay
the spot price are based on HOEP, which is determined after the fact. RPP consumers may oppose
being billed based on prices which they have no way of knowing beforehand. An RTP program in
Ontario will therefore need to consider whether to determine charges after the fact, or base them on a
forecast. The PowerCentsDC RTP program in Washington, D.C. used day-ahead prices, which were
available from PJM’s wholesale power market. In Illinois’s Energy-Smart Pricing Plan (operated by
ComEd), participating consumers receive an advisory estimate each evening for prices the following
day, but billing is based on actual real-time prices. Real-time prices in Illinois tend to be fairly close to
day-ahead prices. Nonetheless, the Power Smart Pricing program (operated by Ameren Illinois)
switched from using real-time to day-ahead prices for billing to alleviate consumers’ concerns.
Since hourly prices in Ontario reflect only short-term supply costs, and not the capital costs of peaking
capacity, a third consideration is whether to combine RTP with another dynamic pricing program,

Power Advisory RPP Jurisdictional Review of Dynamic Pricing Report Page 49
such as CPP or CPR, that focuses on system peak periods and reflects the full cost of peaking
capacity.
5.3.2 Critical Peak Pricing
As discussed in Section 2.3.2 above, in CPP programs, the electricity provider announces “events”,
typically with a cap of 10 to 15 events per year. Participating consumers pay much higher rates for
any consumption during those periods, and lower rates the rest of the year. Events are tied to high
system costs, due to either high system demand or significant outages. Participating consumers know
the rates ahead of time, but not the days on which the events will occur. In many CPP programs, the
time of day in which the CPP events occur is pre-determined; in other CPP programs, this too is
variable.
5.3.2.1 Strengths of CPP
CPP programs focus specifically on reducing demand during system peaks or other high-price periods
when they occur, and therefore contribute directly to minimizing the cost of providing peaking
capacity. They reduce consumption only in a relatively few hours each year, and require no action
outside of those hours.
To realize the full benefits of CPP, consumers need to monitor and respond to announcements of
events. This can be done manually (for example, announcements can be received through phone or
email, and activities can be adjusted accordingly) or can be automated. While this would require some
investment, the cost is likely to be significantly less than that required for RTP, because of the limited
number of CPP events that can occur each year.
As well, the impact on consumers’ lives, or businesses’ operations, is limited to a relatively few hours
a year. Residential and smaller commercial consumers can benefit to some extent with minimal
investment, for example in “smart” thermostats that can automatically adjust air-conditioning settings
during CPP events.
5.3.2.2 Weaknesses of CPP
Some of the limitations of CPP are related to the impacts it can have on system demand:
CPP event times may not perfectly reflect contributions to the need for peaking capacity. Even
with significant analysis, CPP events may miss critical periods, such as unexpected outages or
unpredictable weather resulting in higher-than-expected demand during periods that are outside
the CPP event window. The need for peaking capacity is not determined only by a system’s
peak demand, but also by outages and, where there are transmission constraints, by local peaks.
Limits on the number of CPP events can mean that the program misses some times of high
system demand, because the allowable number of events can be used up during especially hot
summers or cold winters.103
103 One possibility would be to allow the utility to carryover a limited number of CPP events to the subsequent
year if market conditions were particularly moderate in a year.

Power Advisory RPP Jurisdictional Review of Dynamic Pricing Report Page 50
As well, CPP event prices are fixed, and therefore are unable to reflect differences in the severity
of the expected peak or the value of energy during that interval. In some implementations, this
limitation is addressed to some extent by allowing utilities to call two levels of CPP events: a
normal event with high prices, and an extreme event with even higher prices.104
If not all CPP events are called, the service provider may not realize its revenue requirements.
This can lead to a utility calling CPP events during periods when the need isn’t apparent, simply
to raise revenue, which may undercut the program’s perceived legitimacy.
While CPP reduces system peak demand, it does nothing to shift consumption outside of these
critical peak periods from high-cost to low-cost times.
Other weaknesses are related to the investment required by both consumers and the utility to
implement and respond to CPP:
Monitoring for and responding to CPP events can require significant investment by consumers,
either in time (checking emails, manually adjusting thermostat settings etc.) or in enabling
automation equipment (e.g., smart thermostats). This may not be cost-effective for many
smaller consumers. However, researchers have found that low-income consumers have seen
significant reductions in their bills through CPP programs, even without enabling equipment,
as shown, for example, in the PowerCentsDC program in Washington, D.C.105 Whether, and to
what extent, smaller consumers benefit from a CPP program is likely to depend on the details
of the program and the electricity system;
If consumers fail to monitor CPP events, they can end up with substantially higher electricity
bills than they would if they were not participating in a CPP program. Some such consumers
may question the fairness of the program if they are required to pay higher rates during critical
peak periods without being able to respond effectively (though this last objection could be
avoided by making the CPP program optional). Some observers have suggested that this is a
significant issue for low income consumers, but research by Wolak and others suggests that low
income consumers’ responses are significant and result in bill reductions, mitigating such
concerns;106 and
The need to notify consumers of CPP events requires investment by the energy provider, both
in determining when events occur, and in setting up the system to notify consumers by internet
application, email, phone, radio or television announcements, or other means.
Ontario LDCs and the SME would need to adjust their billing practices to track and account for
CPP events. Power Advisory discussions with selected LDCs and the SME indicate that, while
some investment in software changes would be required, they can be accommodated within the
current billing systems.
5.3.2.3 Range of Outcomes of CPP Programs
As discussed in Chapter 4, CPP programs in other jurisdictions found that participants reduced their
consumption during CPP events by 13 to 50%, with the PowerCentsDC program in Washington, D.C.
104 Borenstein (2012), p. 28. 105 Institute for Electric Efficiency (2010), p. 19. 106 Wolak (2010), p. 28.

Power Advisory RPP Jurisdictional Review of Dynamic Pricing Report Page 51
achieving the latter result with enabling equipment. Factors associated with greater reductions in
consumption included:
The availability of enabling equipment, with PCTs being most effective for residential
consumers. CPP programs have been found to reduce peak demand by 13-20% without enabling
technology, and 27-44% with enabling technology.107 This difference has been confirmed in
numerous programs. AmerenEU, for example, ran pilot projects of TOU-CPP programs with
and without enabling technologies, and found that enabling technologies more than doubled
consumers’ load response;
Whether the consumers had central air conditioning – a single end-use associated with high
consumption during peak periods, and therefore greater opportunities for peak reduction;
Higher rates during CPP events;
Fixed hours for CPP events (event days were not pre-determined, but when an event day was
announced, higher CPP rates were always charged during the same hours, corresponding to
when peaks typically occurred in that jurisdiction); and
Pairing the CPP program with a TOU program; in Xcel Energy’s TOU pilot program in
Colorado, the peak reduction from the TOU-plus-CPP program was found to be greater than
the reduction from either TOU or CPP separately.108
5.3.2.4 Appropriateness of CPP for Ontario RPP Consumers
CPP is most appropriate in systems in which peaking capacity costs are a significant consideration,
and in which the need for peaking capacity is determined largely by a relatively small number of high-
demand periods. Both are true of Ontario’s electricity system. CPP is easier for consumers to adapt to
if the timing of CPP events is more predictable. This is also true of Ontario. Over the last five years
(September 2009 through August 2014), there have been 250 hours (0.6% of all hours) in which
Ontario demand has exceeded 23,000 MW. Of these 250 hours:
All have occurred during the months of June, July, August or September;
All have been on a weekday; and
86% have been between noon and 9 p.m. EDT, and all have been between 10 a.m. and 10 p.m.
EDT.
CPP programs are also most suitable for systems with relatively short peaks, because the longer the
duration of the CPP event the greater the loss of comfort or service quality. Short duration CPP events
require relatively limited sacrifices by consumers. CPP is not ideal for Ontario in this respect, as
Ontario’s system peaks often last for many hours as shown the figure which follows.
107 Faruqui and Sergici (2009). p. 2. This article was written before the PowerCentsDC program results had
been published. 108 Faurqui and Sergici (2009), p. 19.

Power Advisory RPP Jurisdictional Review of Dynamic Pricing Report Page 52
Figure 2: Ontario Peak Day Load Profiles
CPP programs may be particularly suitable for commercial RPP consumers, for two reasons:
A number of programs in other jurisdictions, including California’s Statewide Price Pilot
discussed in Section 4.1.1 above, found that CPP programs work best if they are supported by
enabling equipment. An example of such equipment is a PCT that receives information about
CPP events and adjusts air conditioning accordingly. PCTs typically cost a few hundred
dollars.109 Such expenses are more easily justified by a larger commercial consumer than by a
typical residential consumer.
CPP is an especially good match for those consumers with fixed schedules (including many
commercial consumers and some residential consumers), because they would need to adjust
their electricity consumption during only a few hours each year.110
CPP programs fit well with the fourth objectives of the RPP program, as rates for both CPP events and
other hours are known in advance, making the program easy to understand. Consumer education
would be required to explain CPP events: what they are, how consumers can know when they occur,
and what consumers can do to minimize their consumption during those times. As well, CPP has been
shown to be effective in reducing system peak demand.
5.3.2.5 CPP Implementation Considerations
If the Board chose to implement a CPP program from RPP consumers, a number of design issues
would need to be addressed:
109 For example, a PCT advertised as compatible with California smart meters is available on Amazon.com for
US$280. Utilities could presumably get better prices by buying in bulk. This does not include installation, or
changes to the utility’s infrastructure or hardware. 110 However, some commercial consumers have difficulty in modifying their consumption profiles because their
electricity demand is driven by their consumer’s requirements.
Power Advisory RPP Jurisdictional Review of Dynamic Pricing Report Page 53
What level to set prices during CPP events. Prices in the programs reviewed in Chapter 4 above
ranged from 29¢/kWh (Florida’s Energy Select program) to 79¢/kWh (Washington, D.C.’s
PowerCentsDC program). CPP rates in Ontario must address the requirement to set RPP prices
to reflect supply costs. The CPP rate used in the OSPP was 30¢/kWh which was based on the
average of the HOEP on the 93 hours with the highest prices in the previous year.
What to base CPP events on: peak demand, or expected market prices, or some combination.
In Washington, D.C. and Missouri, CPP events were based on the forecast temperature.
However, in Missouri, an especially hot summer meant that temperature did not work as the
only criterion, and additional administrative time was needed to determine when to schedule
CPP events. For the OSPP, the CPP events were triggered based on weather conditions, i.e.,
temperature and Humidex, not system operating conditions or forecast HOEP. The IESO’s
Voluntary Emergency Load Reduction Program was also considered as a trigger, but because
this is only called infrequently it was felt not to be an appropriate trigger for a pilot that sought
to gain experience over a relatively short period. The weather triggers were selected to provide
an appropriate number of CPP events in four of the five most recent years.
How many CPP events to allow each year, and whether they can be carried over, in whole or in
part, from one year to another. A cap of 10 to 15 events per year is typical in other jurisdictions.
The OSPP employed a cap of 9; however, this program began in August and ended at the end
of February and therefore didn’t include the entire summer or winter seasons.
How to limit CPP events to periods which could potentially affect system costs such as peaking
costs or high energy costs. CPP programs can give utilities an incentive to call the maximum
allowable number of CPP events every year, even in years of moderate weather and moderate
demand, in order to realize the higher rates and additional revenue. This could undercut the
program’s perceived legitimacy and result in consumer backlash.111
Whether to limit CPP events to certain periods. It may be appropriate to limit CPP events to
summer, since, as discussed above, almost all system peaks occur between May and September
and the peaksaver PLUS program runs from May through September. However, the OSPP
called CPP events in August (2), September (2) and January (3). For a similar reason, it may
be appropriate to limit events to weekdays. In many jurisdictions, the time of day of CPP events
is pre-determined. In Ontario, system peaks generally occur between noon and 9 pm. A 9-hour
CPP event would capture almost all system peak hours, but is likely to be unattractive to
consumers given the difficulty of sustaining a demand reduction for such a sustained period.
The peaksaverPLUS program has a noon to 7 p.m. window. Therefore, CPP programs in other
jurisdictions typically use much shorter events; in the programs reviewed in Chapter 4 above,
CPP events lasted between 2 and 5 hours.112 PeaksaverPLUS program has a four hour limit.
Consumers’ responses to CPP programs have been shown to be highest during the first hour
and decline after that, as found in Florida’s Energy Select Program discussed in Section 4.2.1
above, so starting an event too early might result in less-than-optimal response at the time of
the actual system peak.113 One solution would be to limit CPP events to a pre-determined length
111 Borenstein (2012), p. 30. 112 The OSPP used 3 or 4 hour events. 113 However, the Gulf Power program was focused on enhancing consumer satisfaction and therefore gave
consumers significant control over appliance settings during a CPP event.

Power Advisory RPP Jurisdictional Review of Dynamic Pricing Report Page 54
of a few hours within a longer, but also pre-determined, window, with flexibility about when
within that longer window the CPP event occurs on each day.
How to accommodate Ontario’s relatively long critical periods, and the tendency of consumers
to respond most strongly at the beginning of a CPP event and less strong in subsequent hours.
For example, rather than calling a single event for all participating consumers, consumers could
be divided into groups, with one group called on to reduce their demand (or pay the higher CPP
rate) between noon. and 4 p.m., a second group between 2 p.m. and 6 p.m., etc., in order to even
out the response over the entire critical period.
When to decide on and announce CPP events. Some jurisdictions base CPP events on day-ahead
prices. Ontario does not have a day-ahead market, so prices can’t be locked in ahead of time,
but the IESO does produce forecasts of load and prices 24 hours ahead. Announcing events
earlier makes it easier for consumers to respond, but increases the risk of a mismatch between
the announced CPP event and actual system prices and loads.
How to communicate CPP events to consumers. For consumers who respond by manually
adjusting electricity consumption, notification through media announcements, phone or text
messages, or emails may be adequate. But to be most effective, enabling equipment should be
able to receive CPP event notifications directly, so that they can respond automatically. This
would require either special types of smart meters capable of two-way communication, or an
internet connection and an appropriate internet application. Since most smart meters currently
installed in Ontario are not capable of two-way communication, and not all RPP consumers
have an internet connection, this affects who can fully participate in a CPP program, and
whether such a program should be mandatory, or voluntary, as discussed below.
Whether to cap the impact of CPP rates on participating consumers’ bills, at least initially.
Consumers who are not aware of CPP events can incur significant charges if their load happens
to be higher than usual at those times. In order to avoid consumer backlash, especially in the
early years and if the program is either mandatory or opt-out, it may be advisable to cap bill
impacts. Variations on this include a guarantee that for a set period of time, CPP-based bills
will not exceed what the consumer would pay under non-CPP rates and shadow bills, in which
CPP and non-CPP consumers are shown what they would have paid had they been on the other
rate.
Who should participate. As discussed above, a CPP program would work well for some
consumers (generally those with larger demands who can both benefit most and afford enabling
equipment, including an internet connection or a smart meter with two-way communication),
less well for others. The program could be open to some types of consumers but not others, and
for eligible consumers could be mandatory, or the default with the choice of opting out, or
entirely voluntary. A mandatory or opt-out program without a rate cap could be considered
unfair to some consumers.
Whether and how to support consumers in acquiring enabling equipment. CPP programs have
been found to be more effective when supported by enabling equipment.
Whether to combine a CPP program with a TOU program. In pilot projects, combining CPP
and TOU programs was found to reduce consumers’ peak demands significantly more than
either program by itself.

Power Advisory RPP Jurisdictional Review of Dynamic Pricing Report Page 55
5.3.3 Critical Peak Rebates
CPR programs are similar to CPP programs, except that instead of paying higher rates during CPP
events and lower rates other times, CPR consumers pay the same rates as other consumers, but receive
a rebate if their consumption during events is lower than an established baseline.
5.3.3.1 Strengths of CPR
One criticism of CPP is that consumers’ bills can increase if they use electricity during CPP events.
This is especially a concern if CPP rates are mandatory or require a decision to opt out. The main
advantage of CPR over CPP is that consumers’ bills are never higher, and sometimes lower, than they
would otherwise be. Consumers are paid a rebate if their consumption during CPR events is lower
than expected; if it’s higher than expected, their bill isn’t affected. Therefore, CPR is likely to have
greater consumer acceptance than CPP and if implemented as an opt-in program likely to have greater
consumer participation rates.
Another advantage of CPR over CPP is there is no need to limit the number of events allowed in a
year. Consumers do not lose if more events are called; instead, each additional event is an opportunity
to earn additional rebates.
Other than that, CPR has the same strengths as CPP. In fact, CPR can be a way to transition to CPP, or
even RTP, by starting with a program that will have greater consumer acceptance.
5.3.3.2 Weaknesses of CPR
In addition to the weaknesses of CPP (investment required by the energy provider to notify consumers
of events, and by consumers to monitor and respond to events; mismatch between announced events
and system needs; focus on peak rather than energy savings, etc.), experience with CPR suggests that
it is less effective than CPP in reducing peak demand given the ability of CPR participants to elect to
opt out of a CPR event as shown, for example, in the PowerCentsDC program in Washington, D.C.,
which included both CPP and CPR programs.114
As well, CPR requires additional analysis for each participating consumer to estimate what that
consumer’s baseline consumption would have been during each event. In some cases, consumers will
receive rebates without having done anything – for example, if a CPR event occurs while they are on
vacation. Such freerider issues are an implementation issue for CPR, but not CPP. Section 4.3.1
above discusses the complexity of estimating consumers’ baseline usage in Georgia’s PoweRewards
program.
Finally, because CPR results only in rebates, never in higher prices, it requires an increase in non-
event prices to recover the full cost of electricity.
114 Wolak (2010), p. 27.

Power Advisory RPP Jurisdictional Review of Dynamic Pricing Report Page 56
5.3.3.3 Range of Outcomes of CPR Programs
Faruqui and Palmer’s study of 126 dynamic pricing programs included results for 27 CPR programs,
with demand reductions during CPR events ranging from 7% to 35%.115 As discussed above, CPR
programs tend to have less of an impact than CPP programs.
5.3.3.4 Appropriateness of CPR for Ontario RPP Consumers
Like CPP programs, CPR programs have a number of characteristics that make them appropriate for
Ontario RPP consumers, including:
Their focus on peaking capacity, which over the long term is a meaningful determinant of
electricity costs in Ontario.
The fact that system peaks in Ontario tend to occur at predictable times: on summer weekdays.
Their suitability to larger RPP consumers, including commercial consumers who have had
limited opportunities to respond to the price signals in Ontario’s TOU program because of their
fixed operating schedules.
Their simplicity, making them relatively easy to understand and respond to, at least compared
to RTP programs.
As well, given the negative response of some consumers to Ontario’s TOU program, the
fundamentally optional nature of CPR (consumers can choose not to participate in CPR events, losing
the opportunity to receive a rebate but otherwise not being penalized) and the fact that participation in
the program can only lead to lower bills than non-participation, may make it more acceptable to
Ontario consumers.
5.3.3.5 CPR Implementation Considerations
Implementation considerations for CPR programs are similar to those for CPP considerations,
including the basis for calling CPR events, how to communicate CPR events to consumers, and
whether and how to support consumers’ acquisition of enabling technologies. Less consideration is
needed of whether to make the program mandatory or voluntary (either opt-out or opt-in) as
participation is always optional. As well, it is not necessary to protect consumers from unexpectedly
high bills; participation in CPR can only lead to equal or lower bills than non-participation. For the
same reason, there is no need to limit the number of CPR events in a year.
5.3.4 Time-of-Use Rates
Ontario has several years’ experience with TOU. Most RPP consumers are now on TOU rates, and the
ratio between peak and off-peak rates is currently 1.8 considering only wholesale electricity costs, and
approximately 1.5 when all energy charges (including transmission, distribution and debt retirement
charges) are considered.
115 Faruqui and Palmer (2012), p. 5. CPR programs are also called “Peak Time Rebate” (PTR) programs.

Power Advisory RPP Jurisdictional Review of Dynamic Pricing Report Page 57
5.3.4.1 Strengths of TOU
TOU rates are easy to understand, and in Ontario all of the required infrastructure is in place.
Consumers know what rates will be, and when rates will change. This facilitates and promotes
demand response. Ontario consumers in particular now have several years’ experience with these
rates. As well, LDCs have well-established systems for tracking consumption and billing using TOU
rates. Modifications to rates and TOU periods can be made with minimal effort.
5.3.4.2 Weaknesses of TOU
TOU rates give consumers incentives to shift consumption from peak or mid-peak periods to off-peak
times, but these incentives may not match up with actual system costs. While on balance there is a
shift toward lower-cost hours, there are many hours in a year, and sometimes within the same day,
when system costs (as measured by HOEP) are higher during some off-peak hours than during some
peak or mid-peak hours, giving consumers a perverse incentive to shift consumption to what are high-
priced hours. In particular, there is a tendency for consumers on TOU programs to shift load from
peak and mid-peak times to the first few hours of the off-peak period (for example, delaying running a
clothes dryer until rate goes down). Power Advisory analysis of hourly HOEP prices shows that
market prices during the first three hours of the off-peak period (7 p.m. to 10 p.m. on weekdays) are
higher than either average mid-peak or peak prices in most months. Therefore, Ontario’s current TOU
program may well be shifting load from lower-priced to higher-priced hours.
TOU rates give a general incentive to reduce consumption during peak hours, which in Ontario
amount to approximately 18% of consumption. However, they do not give special consideration to the
hours of highest system demand which contribute to the need for peaking capacity.
TOU rates are more effective in shifting consumption from peak to off-peak periods when the ratio of
peak to off-peak prices is higher. In Ontario, the ratio is 1.5, when transmission, distribution, and debt
recovery charges are included, putting Ontario at the bottom end of most TOU programs.116 Changing
this ratio significantly, without changing the TOU periods themselves, may not be possible given the
second objective of the RPP program, to set prices to reflect differences in supply costs. It could also
require significant changes to how transmission, distribution and other charges are set, which is
beyond the scope of the RPP.
TOU rates in Ontario have been criticized because some consumers have limited abilities to shift
consumption out of the designated peak and mid-peak periods. This includes many commercial RPP
consumers which operate primarily during peak and mid-peak hours, and residential consumers with
fixed schedules.
5.3.4.3 Range of Outcomes of TOU Programs
Faruqui and Palmer’s study of 126 dynamic pricing programs included results for 51 TOU programs,
ranging from zero to almost 50%, with most programs showing peak demand reductions of 10% or
116 Faruqui and Palmer (2012), p. 8 shows a graph of at least 20 TOU programs, with peak:off-peak price ratios
ranging from approximately 1.5 to 5. The half-dozen programs with ratios similar to Ontario’s, 1.5, show peak
reductions ranging from zero to 10%, while the two programs with ratios above 5 show peak reductions between
20 and 25%.

Power Advisory RPP Jurisdictional Review of Dynamic Pricing Report Page 58
less.117 An earlier study by Faruqui and Sergici stated that “Across the range of experiments studied,
time-of-use rates induce a drop in peak demand that ranges between three to six percent”.118
For comparison, The Brattle Group’s review of Ontario’s TOU program found that residential
consumers reduced their summer peak period demand by 2.8 to 5.7% depending on the LDC, with a
simple average across the four LDCs studied of 3.9%. Navigant’s review of the RPP, based on
analysis of the hourly consumption data of approximately 14,000 consumers, found a similar
residential summer peak period reduction of 3.3%.119 These results put Ontario at the lower end of
results in other jurisdictions, which is consistent with the lower TOU price differentials.
A high ratio of peak to off-peak prices does not guarantee results, however; as discussed in Section
4.5.1 above, AmerenUE’s TOU-Only program in Missouri found no significant shift of consumption
from peak to mid- or off-peak periods even though there was a 4.8 ratio of peak to off-peak prices.
Neither the Brattle review nor the Navigant review of Ontario’s TOU program found statistically
significant reductions in peak-period consumption by commercial (or “general service”) RPP
consumers. This may reflect the difficulty of many commercial consumers, such as retail stores and
offices, in shifting demand out of regular working hours.
5.3.4.4 Appropriateness of TOU for Ontario RPP Consumers
In general, TOU programs are most appropriate in electricity systems with the following
characteristics:
Predictable and consistent times of high and low system costs
Large and sustained differences between high and low system costs
System costs are largely driven by variable energy costs rather than fixed costs
Ontario is not ideal for TOU in these respects, as there is relatively little variation in prices in most
hours; system costs in peak periods, as currently defined, are often lower than system costs in what are
called off-peak periods; and energy costs, as represented by HOEP, now make up a smaller portion of
total wholesale electricity costs than do Global Adjustment charges, which cover fixed costs such as
contract payments to generation and the costs of conservation and demand management programs.
On the other hand, one of the advantages of a TOU program over other types of dynamic pricing is
that all of the required infrastructure and processes are in place. TOU, unlike RTP, CPP and CPR,
does not require two-way communication (except for periodic announcements of rates and the
changes in the TOU schedule, achievable through newspapers and other media). Any changes in the
program (to rates or schedules) can be easily implemented by the LDCs and the SME.
Ontario’s TOU program could be made more effective by increasing the ratio of peak to off-peak
prices. However, one of the stated policy objectives of the RPP program is to set the price structure to
reflect RPP supply costs; that is, the prices should reflect the differences in cost of supply at different
117 Faruqui and Palmer (2012), p. 5. 118 Faruqui and Sergici (2009). p. 46. 119 Navigant (2013), p. 36.

Power Advisory RPP Jurisdictional Review of Dynamic Pricing Report Page 59
times of the day and year. Any increase in the ratio between peak and off-peak prices would need to
be based on differences in costs between the two periods. A Board staff report regarding stakeholder
consultation on time-of-use prices concluded that:
“The principles of supply cost recovery and cost causality received very strong support from
stakeholders. This was particularly the case for representatives of consumers, but also for
other participants. Although many of these comments acknowledged the importance of
adequate price differentials to encourage load shifting behaviour, it was argued that this
should not be at the expense of compromising the principles of cost recovery or cost causality.
By contrast, support for price ratios that are developed on a basis other than supply curve
characteristics was almost non-existent.”120
Introducing a super-peak period, restricted to weekday afternoons in June, July and August, would be
consistent with the Board’s policy objectives, and would increase the impact of TOU prices on system
peak demand. Some costs, such as Demand Management programs and the Lennox contract, are
currently allocated to the peak TOU period. If the period to which these costs are allocated was
reduced, the peak:off-peak price ratio could be increased significantly.
Introducing a super-peak period would make it easier for consumers on fixed schedules, including
many commercial consumers, to participate in and benefit from the TOU program. It would be easier
for these types of consumers to shift consumption temporarily, during only a few months of the year,
out of the peak period and into the mid-peak period. While this might not have the same energy
benefits as the current system, it could have significantly higher capacity deferral benefits.
In terms of meeting the objectives of the RPP program:
TOU gives all consumers the opportunity to reduce their electricity bills by shifting their time
of electricity use, but this opportunity is limited for all consumers by the relatively small
difference between peak and off-peak rates. It is especially limited for consumers on fixed
schedule, such as commercial consumers who do not operate during off-peak periods, because
of the very small difference between peak and mid-peak rates. Introducing a super-peak
program with significantly higher rates during a small number of hours would increase
opportunities for all consumers.
The current TOU system satisfies the fourth RPP objective, as it is a fairly simple price structure
that most Ontario consumers understand, though the twice-yearly switch between peak and
mid-peak periods in Ontario’s current TOU system can be confusing. The focus group
participants for the Ontario Smart Price Pilot (OSPP) noted that the TOU pricing structure was
easy to understand.121 Most TOU programs in other jurisdictions have either two or three
periods. Interestingly, in the OSPP none of the consumers participating in the survey indicated
that they would prefer a two-period TOU structure to the current three-period structure.
Introducing a super-peak period in addition to the three existing periods (rather than instead of
the existing peak period) would mean four TOU periods, which could be confusing.
120 Ontario Energy Board (2011), p. 5. 121 IBM Global Business Services and eMeter Strategic Consulting (2007), p. 9.

Power Advisory RPP Jurisdictional Review of Dynamic Pricing Report Page 60
However, the current TOU system is not effective in reducing system costs, either in reducing
peak demand or in minimizing system costs. Introducing a super-peak period could make the
system more effective in both respects.
5.3.4.5 TOU Implementation Considerations
In designing, or redesigning, a TOU program, a number of factors need to be considered, including
the following:
The number of different rates and periods. Ontario has three periods, with different summer and
winter schedules. Most programs in other jurisdictions use three periods, though some use only
two and a few use four (including a super-peak period). Seasonal changes in the schedule are
not uncommon. If a super-peak period was to be introduced, consideration would need to be
given to how to keep the resulting schedule as simple and easy to understand as possible.
How to match TOU periods to prices. Under Ontario’s current TOU schedule, there are many
peak hours with lower market prices than many off-peak hours, but this is a problem common
to TOU programs in many jurisdictions. System peaks in Ontario tend to occur in July and
August (sometimes in June and September and occasionally in January, though winter peaks
do not generally determine the need for peaking capacity), on weekdays, between the hours of
9 a.m. and 11 p.m. However, there are also many hours during these times when market prices
are low. Periods with very high market prices (say, greater than $80/MWh) occur in every
month (though more often in June-August), somewhat more often on weekdays than weekends,
and most often in the early evening (between 5 and 8 pm), and rarely last more than six hours
(excluding February and March 2014, when gas prices were extremely high).
How to set rates for the various periods. TOU programs are most effective when the ratio
between peak and off-peak prices is at least 4:1.122 However, one of the objectives of the RPP
program is that prices should reflect the differences in cost of supply at different times of the
day and year. The Board has tried various ways of allocating costs between TOU periods over
the past several years, but the ratio between peak and off-peak prices has remained low.
Introducing a super-peak period, to which costs relating to peaking capacity would be assigned,
could help to increase the difference between peak prices and both mid-peak and off-peak
prices.
Once the above factors have been determined, implementing changes to the TOU program would be
fairly simple, requiring an education program to make consumers aware of the changes and their
implications, changes to the Board’s regulations and procedures for setting RPP prices, and
adjustments to the settings in the LDCs’ and SME’s billing software.
5.4 Investing in Dynamic Pricing in Ontario
The discussion above demonstrates that there are advantages and disadvantages associated with
Ontario’s adoption of any of the dynamic pricing regimes. As discussed, TOU as it is currently
implemented in the Province has shown favourable, albeit moderate, results.123 It is fairly well
122 Faruqui et al. (2010), p. 3. 123 See discussion of Ontario SPP in section 4.6.1.

Power Advisory RPP Jurisdictional Review of Dynamic Pricing Report Page 61
understood by consumers and obviously poses no implementation challenges for LDCs. A natural
question then becomes: is the TOU as the status quo a reasonable alternative for Ontario, or does
making a greater investment in dynamic pricing make sense?
How this question is answered will be an important determinant of the appropriate path for Ontario in
pursuing dynamic pricing. The answer to this question should consider the long-term electricity
supply and demand outlook for Ontario and associated system requirements. A discussion of
Ontario’s future capacity requirements and system needs follows.
As outlined in the 2013 Long-Term Energy Plan124 (LTEP), beginning later this decade Ontario will
need additional capacity or greater reductions in demand than forecast to ensure reliable supply. More
specifically, there will be a capacity shortfall starting in 2019 in which additional capacity or demand
reductions beyond the existing and committed resources will be needed to meet peak demand. The
LTEP has aggressive demand response goals; demand response is targeted to meet 10% of forecast net
peak demand by 2025, contributing 2,445 MW of peak demand reduction.125 Included in these
demand response resources are existing programs including peaksaver PLUS, new dispatchable
demand response resources to be developed, and the TOU rate.
With a need for additional capacity or demand response by 2019, dynamic pricing could play a
meaningful role in meeting peak demand. Assuming a two year program development and roll out
period, a modest dynamic pricing program appears appropriate to address future resource
requirements.
Ontario’s generation supply mix will change substantially in the next 10 years. In addition to the
capacity requirements presented above, the LTEP highlights the system’s flexibility needs. Resources
must reliably and efficiently be available to balance supply and demand. While Ontario’s
hydroelectric generation plays an important role in this regard, there are increasing requirements for
flexible resources.
Following the phase-out of coal resources, natural gas-fired generation has become the swing fuel to
meet the supply-demand balance. Ontario’s gas-fired generation provides energy, capacity and
increasingly important flexibility. However, the gas fleet does have limitations, particularly related to
ramping.
In addition to the benefits to consumers, there are system benefits associated with the adoption of
dynamic pricing regimes. Building new generation and transmission to meet a few periods of peak
demand per year can be avoided or reduced by enabling consumers to shift electricity use from
periods of peak demand to periods of lower demand, or reduce use during peak periods. The outlook
for Ontario’s supply mix, capacity requirements, and system needs is such that making a greater
investment in dynamic pricing makes sense. The benefits of having consumers respond to price
signals and ultimately improve system conditions (by lowering system peak, for example) through a
124 Ontario Ministry of Energy, Achieving Balance: Ontario’s Long Term Energy Plan, November 2013
(http://www.energy.gov.on.ca/en/ltep/). 125 The LTEP assumes 1,444 MW of demand response in 2017 through 2019 and an incremental 100 MW of
demand response in 2020.

Power Advisory RPP Jurisdictional Review of Dynamic Pricing Report Page 62
dynamic pricing program will be even greater if there are delays in the return of refurbished nuclear
units, or if the net peak demand is higher than forecast.

Power Advisory RPP Jurisdictional Review of Dynamic Pricing Report Page 63
6 Summary and Conclusions
6.1 Ontario’s Experience To Date
Ontario’s RPP consumers have now had a few years’ experience with time-of-use pricing, but
according to two evaluations of the TOU program, it has resulted in only a 3-4% reduction in load
during peak demand periods for residential consumers, and statistically insignificant reductions for
general-service consumers. Dynamic pricing programs in other jurisdictions have shown much greater
results; 10% is not unusual for a TOU program, and some CPP programs have shown up to a 50%
reduction in load during CPP events when enabling technology is employed. The limited results of
Ontario’s TOU program can be attributed in large measure to the relatively small ratio between peak
and off-peak prices: a ratio of approximately 1.8 when only TOU prices are considered, and
approximately 1.5 when transmission, distribution and other per-kWh charges are included. These low
ratios themselves are a function of several factors:
The relatively low volatility of Ontario’s wholesale market prices, resulting in relatively small
differences when these prices are averaged over the peak, mid-peak and off-peak periods (as
currently set).
The importance of contract and other costs not included in wholesale market prices, but
included instead in the Global Adjustment. Only a few of these costs (specifically, cost related
to Lennox and to demand management programs) have been attributed exclusively to peak
periods.
The allocation of transmission, distribution and other costs equally to all energy consumption
regardless of time of use, which reduces the effective ratio (though not the absolute
difference) between the peak and off-peak prices paid by consumers.
6.2 Experience with Dynamic Pricing in Other Jurisdictions
To provide insight into what other dynamic pricing programs may be suitable for Ontario, this report
includes a review of the literature on dynamic pricing, and provides details on a selection of programs
in other jurisdictions that may be of particular interest to Ontario.
California’s Statewide Pricing Pilot was the first comprehensive dynamic pricing pilot
project, testing TOU and CPP prices with and without enabling technologies.
Florida’s Energy Select was the first fully-automated TOU-CPP pricing program.
Georgia’s PoweRewards program is an example of CPR.
Illinois has two of the few programs that offer real-time pricing to residential consumers; in
fact, Illinois consumers must by law be offered real-time pricing.
Missouri’s Time-of-Use study combined a TOU program similar in many ways to Ontario’s,
with a CPP program.
The Smart Grid, Smart City project in New South Wales, Australia, is an example of offering
consumers a menu of rate choices, with various enabling technologies.
Washington, D.C.’s PowerCentsDC pilot project was an especially-well designed experiment
that compared TOU, CPP and CPR prices, with and without enabling technology.

Power Advisory RPP Jurisdictional Review of Dynamic Pricing Report Page 64
These sample programs and pilot projects provide insight not only into how effective dynamic pricing
can be, but in how to implement these programs to achieve maximum effect and high consumer
satisfaction. Two of the key findings of these programs were:
The importance of consumer education, starting well before, and continuing well after,
program implementation.
The effectiveness of enabling equipment such as programmable communicating thermostats
in increasing both program effectiveness and consumer satisfaction by enabling the load
shifting necessary to produce bills savings with relatively limited consumer involvement.
These programs also provided more specific and detailed insights, such as that consumer response to
CPP events tends to be highest in the first hour and then falls; that a CPP program is likely to have
more impact than a similar CPR program.
Based on both the literature review and in-depth analysis of selected programs, the strengths and
weaknesses of the four types of dynamic pricing, and their appropriateness for Ontario RPP
consumers, were assessed. Several criteria were used:
How well each type of pricing fits with Ontario’s electricity system, including price volatility,
how predictable or unpredictable system peaks are, and Ontario’s need to integrate increasing
amounts of renewable energy.
How easy each type of pricing is both for LDCs and the SME to set up and administer, and
for consumers to respond to.
How effective each type of pricing is promoting consumer behaviour that is likely to
minimize system costs.
Whether each type of pricing provides consumers with opportunities for cost-effective
participation, with bill reductions commensurate with the consumers’ efforts.
How easy each type of pricing is for consumers to understand.
The results of this assessment are summarized in the following table. Two versions of TOU pricing
are shown in the table: the current system, perhaps with minor adjustments; and the similar system
with a super-peak period.

Power Advisory RPP Jurisdictional Review of Dynamic Pricing Report Page 65
Table 11: Summary of Appropriateness of Dynamic Pricing Alternatives to RPP Consumers
Criteria Real Time
Pricing
Critical
Peak
Pricing
Critical Peak
Rebates
Current
Time-of-
Use
Superpeak
TOU
Fit with Ontario’s
Electricity System
Poor: low
price
volatility
reduces need,
but would
enhance
ability to
integrate
renewables
Good:
System
peaks occur
within
predictable
windows and
are an
important
determinant
of system
costs, but the
highest peaks
last for many
hours
Good: System
peaks occur
within predictable
windows and are
an important
determinant of
system costs, but
the highest peaks
last for many
hours
Poor:
narrow cost
differences
between
peak and
off-peak
Good:
System
peaks occur
within
predictable
windows
and are an
important
determinant
of system
costs
Ease of
implementation:
LDCs
Moderate:
need to
communicate
and bill on
real-time
prices but
LDCs have
experience
with larger
consumers
Moderate:
need to
determine,
communicate
and bill 10 to
15 events
each year
Poor to Moderate:
need to
determine,
communicate and
bill 10 to 15
events each year;
need to determine
baseline
consumption for
each consumer
Excellent:
systems are
in place
Excellent:
systems are
in place; a
few
parameters
would need
to be
changed
Ease of
implementation:
consumers
Poor:
requires
constant
monitoring
and
response;
best with
expensive
enabling
equipment
Moderate:
requires
monitoring
during
certain
windows and
response a
number of
times a year;
best with
simple
enabling
equipment
(e.g., PCTs)
Good: no penalty
for non-
participation, so
monitoring and
response is
encouraged but
not required; best
with simple
enabling
equipment (e.g.,
PCTs)
Good for
some, poor
for others:
requires
permanent
shift of
activities
out of
extended
peak
period,
which is
easy for
many
consumers,
difficult or
impossible
for others
Good:
requires
permanent
shift out of a
narrow peak
period,
which
would be
fairly easy
for many,
though not
all,
consumers

Power Advisory RPP Jurisdictional Review of Dynamic Pricing Report Page 66
Criteria Real Time
Pricing
Critical
Peak
Pricing
Critical Peak
Rebates
Current
Time-of-
Use
Superpeak
TOU
Effectiveness in
minimizing
system costs
0-16% peak
load
reduction;
also shifts
from high-
price to low-
price hours
13-50% load
reduction
during CPP
events
7-35% load
reduction during
CPR events
3-4% shift
out of
entire peak
period
Unknown
but higher
impact on
system peak
than current
TOU
program
Opportunities for
cost-effective
time-shifting
Moderate:
opportunities
in all
seasons, but
generally
limited price
differences
Good:
significant
impact
during a
limited
number of
critical
hours a year
Good: significant
impact during a
limited number of
critical hours a
year
Poor: Low
price
differential
s means
large time-
shifts have
low bill
impacts
Moderate:
Larger price
differentials
could mean
greater bill
impacts with
less onerous
shifts
Ease of
Understanding
Poor:
Requires
constant
(automated
or manual)
price
monitoring
and complex
decision-
making
Good: easy
to understand
and respond
to, but CPP
event days
are not
known in
advance
Moderate to good:
easy to
understand and
respond to, but
CPR event days
are not known in
advance, and
baseline
consumption
calculations can
be confusing to
consumers
Moderate:
consumers
are used to
the current
system, but
it has three
TOU
periods and
changes
twice a
year
Depends on
whether new
schedule is
more or less
complicated
than current
schedule
As well as conclusions about specific types of pricing, some findings apply to most or all types of
pricing. Among these are the importance of education and enabling technology, as discussed above.
As well, program design would need to address issues relating to providing two-way communication
between utilities and consumers (required by RTP, CPP and CPR, but not TOU), and whether a
pricing program should be made mandatory, voluntary but as a default (giving consumers the choice
to opt out), or entirely voluntary (requiring consumers to choose to opt in).
6.3 Dynamic Pricing Options for Further Consideration by Ontario Stakeholders
In choosing between pricing options, three main factors should be kept in mind:
Reducing peak demand. The LTEP forecasts a need for additional capacity or demand
resources in 2019. Reducing peak demand and the corresponding need for new peaking
capacity could save Ontario consumers many millions of dollars. There may also be benefits

Power Advisory RPP Jurisdictional Review of Dynamic Pricing Report Page 67
from shifting demand from high-value to low-value times outside of the system peaks that
drive the need for new peaking capacity, but these benefits are likely modest, given the fairly
low volatility of electricity costs in Ontario.
Cost-effectiveness, or the amount of consumer effort required to achieve a significant impact.
The current TOU program requires a sustained effort to produce a small reduction in peak
demand and peak-period consumption, and resulting small bill reduction. A CPP program
may be able to achieve a relatively large reduction in peak demand with much less effort over
only a few hours out of the year.
Simplicity. Consumers are more likely to participate in a program they understand.
While there are many factors for stakeholders to consider, and much additional analysis that would
need to be done on any specific proposal, the outlines of two main options emerge from the previous
chapters, depending on how aggressively the Board and Ontario policymakers seek to encourage RPP
consumers to shift their time of electricity use. A more aggressive approach would include CPP as a
default program (along with TOU) for all RPP consumers, with the choice of opting out. Participation,
program effectiveness and consumer satisfaction could be promoted with phantom billing (in which
consumers are shown what their bill would be both with and without participation in the CPP
program), and bill protection (a guarantee that they will never pay more under CPP). Phantom billing
could be started several months before implementation, and both phantom billing and bill protection
could continue for at least twelve months. Another important element of this more aggressive
approach would be supporting consumers in tangible ways in acquiring enabling technology. This
approach would require a significant consumer education program to ensure consumer acceptance and
program success, with particular attention given to those consumers best positioned to shift load
during CPP events. This could include existing peaksaver PLUS participants who already have PCTs,
in home displays and in some instance direct load control on their electric hot water heater or pool
pump and expanding the promotion of peaksaver PLUS to those customers that don’t opt out of the
CPP.
A less aggressive approach to achieving Ontario’s demand response potential would include CPP on
an entirely voluntary, opt-in basis. A significant consumer education program would be an essential
element of such a program, as above, but with a focus on program benefits to encourage participation.
CPP promises to be more effective than CPR, especially since Ontario’s existing peaksaver PLUS
program provides interested consumers with the means to reduce demand during critical peak periods.
This opt-in approach is also appropriate for General Service consumers and could be adapted to their
particular requirements, recognizing that: (1) they tend to be larger than residential consumers on
average, so a smaller investment (in marketing, enabling equipment and administration) would give
larger results (in MW of system peak reduction), and (2) they have been less able than residential
consumers to participate in the current TOU program, and may find it easier to adjust their
consumption during a few hours each year rather than throughout the entire peak and mid-peak
periods. The General Service category contains a wide range of RPP consumers, including retail
stores, multi-unit apartment buildings without individual meters, schools and farms, but little
information is available on how many of each type there are. In designing a dynamic pricing program
that is more suitable to General Service consumers than the current TOU program has been, it would
be useful to have better information on who they are.

Power Advisory RPP Jurisdictional Review of Dynamic Pricing Report Page 68
Either approach would include a continuation of the existing TOU program, possibly with a “super-
peak” period, focused on weekdays in a few summer months. Offering both TOU and CPP rates
would significantly increase the complexity of the RPP rate schedule, making it more difficult for
consumers to understand and potentially undermining the effectiveness of both programs.
Consideration should therefore be given to simplifying the rate schedule in other ways. For example,
the existing Tier rates, now paid by only 3% of consumers, could be replaced by a single price equal
to the Supply Cost. If a super-peak period was introduced, it could either be added to the existing
schedule (creating four periods and a very complex schedule), or could replace the existing peak
period (making the schedule somewhat simpler than it is now). Given the importance of ensuring that
consumers can understand the pricing framework, the second alternative is likely to be preferable.
Whichever path is chosen, it will need to be integrated with Ontario’s other conservation and demand
management programs. Consumers have a number of options for managing their energy use,
including:
Responding to dynamic pricing signals
Participating in programs such as peaksaver PLUS that limit demand during peak times
Using low-energy light bulbs, programmable communicating thermostats, and other enabling
equipment that helps to conserve energy or reduce peak demand.
To the extent that the various programs available to RPP consumers work together, they can be more
effective in reducing Ontario’s electricity costs.
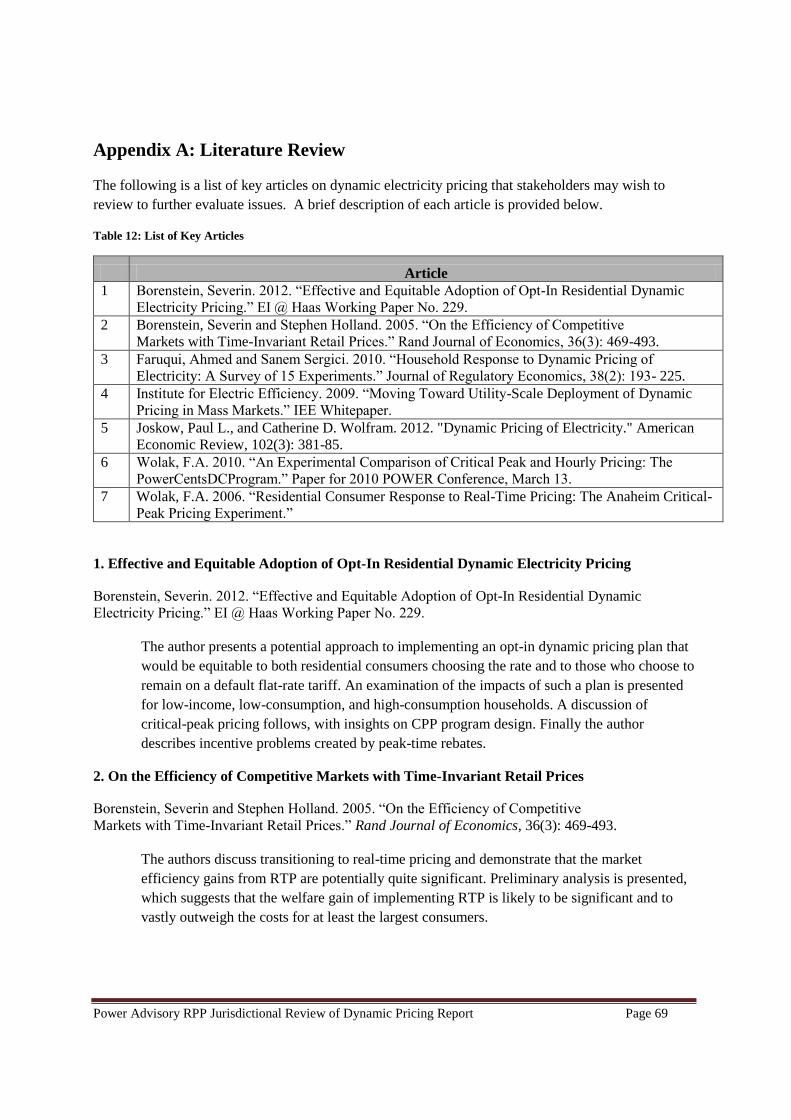
Power Advisory RPP Jurisdictional Review of Dynamic Pricing Report Page 69
Appendix A: Literature Review
The following is a list of key articles on dynamic electricity pricing that stakeholders may wish to
review to further evaluate issues. A brief description of each article is provided below.
Table 12: List of Key Articles
Article
1 Borenstein, Severin. 2012. “Effective and Equitable Adoption of Opt-In Residential Dynamic
Electricity Pricing.” EI @ Haas Working Paper No. 229.
2 Borenstein, Severin and Stephen Holland. 2005. “On the Efficiency of Competitive
Markets with Time-Invariant Retail Prices.” Rand Journal of Economics, 36(3): 469-493.
3 Faruqui, Ahmed and Sanem Sergici. 2010. “Household Response to Dynamic Pricing of
Electricity: A Survey of 15 Experiments.” Journal of Regulatory Economics, 38(2): 193- 225.
4 Institute for Electric Efficiency. 2009. “Moving Toward Utility-Scale Deployment of Dynamic
Pricing in Mass Markets.” IEE Whitepaper.
5 Joskow, Paul L., and Catherine D. Wolfram. 2012. "Dynamic Pricing of Electricity." American
Economic Review, 102(3): 381-85.
6 Wolak, F.A. 2010. “An Experimental Comparison of Critical Peak and Hourly Pricing: The
PowerCentsDCProgram.” Paper for 2010 POWER Conference, March 13.
7 Wolak, F.A. 2006. “Residential Consumer Response to Real-Time Pricing: The Anaheim Critical-
Peak Pricing Experiment.”
1. Effective and Equitable Adoption of Opt-In Residential Dynamic Electricity Pricing
Borenstein, Severin. 2012. “Effective and Equitable Adoption of Opt-In Residential Dynamic
Electricity Pricing.” EI @ Haas Working Paper No. 229.
The author presents a potential approach to implementing an opt-in dynamic pricing plan that
would be equitable to both residential consumers choosing the rate and to those who choose to
remain on a default flat-rate tariff. An examination of the impacts of such a plan is presented
for low-income, low-consumption, and high-consumption households. A discussion of
critical-peak pricing follows, with insights on CPP program design. Finally the author
describes incentive problems created by peak-time rebates.
2. On the Efficiency of Competitive Markets with Time-Invariant Retail Prices
Borenstein, Severin and Stephen Holland. 2005. “On the Efficiency of Competitive
Markets with Time-Invariant Retail Prices.” Rand Journal of Economics, 36(3): 469-493.
The authors discuss transitioning to real-time pricing and demonstrate that the market
efficiency gains from RTP are potentially quite significant. Preliminary analysis is presented,
which suggests that the welfare gain of implementing RTP is likely to be significant and to
vastly outweigh the costs for at least the largest consumers.

Power Advisory RPP Jurisdictional Review of Dynamic Pricing Report Page 70
3. Household Response to Dynamic Pricing of Electricity
Faruqui, Ahmed and Sanem Sergici. 2010. “Household Response to Dynamic Pricing of Electricity: A
Survey of 15 Experiments.” Journal of Regulatory Economics, 38(2): 193- 225.
To help inform the assessment of whether consumers will respond to higher electricity prices
by lowering demand, the authors survey 15 dynamic pricing experiments. Conclusive
evidence is outlined, confirming that residential consumers respond to higher prices by
lowering usage. The authors discuss factors affecting the magnitude of price response,
including the magnitude of price increases and the availability of enabling technologies.
4. Moving Toward Utility-Scale Deployment of Dynamic Pricing in Mass Markets
Institute for Electric Efficiency. 2009. “Moving Toward Utility-Scale Deployment of Dynamic
Pricing in Mass Markets.” IEE Whitepaper.
This white paper discusses ways to make the transition to dynamic pricing for mass market
consumers. It summarizes information that may assist regulators and utilities who are
assessing the business case for advanced metering infrastructure. As part of the discussion,
five dynamic pricing programs that have been implemented in the U.S. are highlighted.
Dynamic pricing is defined, and consumer response to dynamic pricing is examined.
5. Dynamic Pricing of Electricity
Joskow, Paul L., and Catherine D. Wolfram. 2012. "Dynamic Pricing of Electricity." American
Economic Review, 102(3): 381-85.
The authors provide an update on the progress of peak load pricing of electricity in the United
States. As part of this update, developments over the last decade that have elevated interest in
dynamic pricing are detailed, including a discussion of recent technological developments
related to improved functionality for smart meters and automated demand response
technologies. Consideration is given as to why dynamic pricing has not been more widely
adopted, and remaining barriers are outlined as well.
6. An Experimental Comparison of Critical Peak and Hourly Pricing
Wolak, F.A. 2010. “An Experimental Comparison of Critical Peak and Hourly Pricing: The
PowerCentsDC Program.” Paper for 2010 POWER Conference, March 13.
The author reports on the results of Washington’s PowerCentsDC Program, which is a
dynamic pricing experiment comparing the performance of hourly pricing, critical peak
pricing, and critical peak pricing with a rebate. The author finds that consumers on all of the
dynamic pricing programs reduce their electricity consumption during high-priced periods. As
part of the findings, a comparison of the demand responses between low-income and higher-
income households is included.

Power Advisory RPP Jurisdictional Review of Dynamic Pricing Report Page 71
7. Residential Consumer Response to Real-Time Pricing
Wolak, F.A. 2006. “Residential Consumer Response to Real-Time Pricing: The Anaheim Critical-
Peak Pricing Experiment.”
The author analyzes the results of a critical-peak pricing experiment involving residential
consumers. Included is a discussion of the challenges associated with implementing a CPP
rate with a rebate mechanism as the default rate for residential consumers.
Recommended