- ---
XFWS-A 583 1-l4 (l969) US Fish Wildl Servo ~ Spec SCi Rep_ Fish
~~ ==~-~~
-~~ _ -~~~ -_ -~
~ft~ ---shy-shy~ --
-~~
~-
~
--~-
~
~
--- shy- _ - --~ -~ ---shy- ---~--
-----shy
-~
--~--
---~- ~~
~~----
-shy----~
Electrica l Installation for Control of
the Northern Squawfish
bull
A~
~
~ SPECIAL SCIENTIFIC REPORT-FISHERIES No 58 3
~~
1 ~~A ~~ -~ shy_ ----shy
--shy ~
30~
~
~ ~
~
r ~
~~~~~~~~~~~~~~~~~~~F~SH~A~ND~W~~LD~L~F~ESERVCE~~ BUREAU OF COMMERCIAL F~ ~~
shy
shy
SPECI AL SCI ENT I FIC REPORT--FISH E RI ES
Robert L Hacker Editor
Jane S Hallett Associate Editor
Mary Fukuyama Assistant Editor
Betty M Hoffman Assistant Editor
P UBLICATION BOARD
John A Guinan James H Johnson
Robert L Hacker John M Patton Jr
J ohn I Hodges Frank T Piskur
Ha rvey Hutchings Edward A Schaefers
Leslie W Scattergood Chairman
Special Scientific Report--Fisheries are preliminary or progress reports and reports on scientific investigations of restricted scope Established as Special Scientific Reports in 1940 nos 1 to 67 were issued from that date to 1949 when the new series Special Scientific Report-shyFisheries with new serial numbering was started
Special Scientific Report--Fisheries are distributed free to libraries research institutions State agencies and scientists
bull
UNITED STATES DEPARTMENT OF THE INTERIOR
US FISH AND WILDLIFE SERVICE
BUREAU OF COMMERCIAL FISHERIES
Electrical Installation for Control of the Northern Squawfish
By
GALEN H MAXFIELD GERALD E MONAN
and
HOLBROOK L GARRETT
United states Fish and Wildlife Service Special Scientific Report--Fisheries No 583
Washington DC February 1969
CONTENTS
Page
Introduction bull bull bull bull bull bull bull bull bull bull bull bull bull bull bull bull bull bull bull bull bull bull bull bull bull bull bull 1
Experimental site and installation bull bull bull bull bull bull bull bull bull bull bull bull 2
Electrode array and traps bull bull bull bull bull bull bull bull bull bull bull bull bull bull 2
Power source bull bull bull bull 4
Electronic equipment bull bull bull bull bull bull bull bull bull bull bull bull bull bull 5
Method of energizing array bull bull bull bull bull bull bull bull bull bull bull bull bull bull 5
Electrical conditions 6
Physical quality of water 8
Resistivity bull bull bull bull 8
Temperature 8
Method of testing effectiveness of installation 8
Testing the installation bullbullbullbullbullbullbullbull 9
Conclusions and recommendations 14
Acknowledgments 14
Literature cited bullbull 14
iii
Electrical Installation for Control of the
Northern Squawfish
By
GALEN H MAXFIELD GERALD E MONAN Fishery Biologists
and HOLBROOK L GARRETTshyElectrical Engineer
Bureau of Commercial Fisheries Biological Laboratory Seattle Washington 98102
ABSTRACT
Electricity was used experimentally to divert and trap squawfish during their spawning migration in 1958 at Cascade Reservoir Idaho Electrical fields created by sequentially energizing a V-shaped array of vertically suspended round electrodes with square-wave dc pulses were evaluated as a means of diverting squawfish into traps
Three test conditions of varied pulse frequency pulse duration and voltage were tested Two sets had a pulse frequency of 10 pulses per second (2 per field per secshyond when five fields were pulsed in sequence) a pulse duration of 50 msec and volt shyages of 140 and 180 v one sethad a pulse frequency of 15 pulses per second (3 per field) a pulse duration of 25 msec anda voltage of 180 v One set (pulse frequency 10 pulses per second pulse duration 50 msec and voltage 180 v) was repeated
The electrical fields of the electrode array were effective in diverting squawshyfish into traps The test condition with pulse frequency of 15 pulses per second pulse duration of 25 msec and voltage of 180 v was less effective than the other test conditions
INTRODUCTION
The northern squawfish Ptychocheilus oreshygonensis (Richardson) a predator on young salmon and trout in the major river systems of the Pacific Northwest (Lindsey 1956) is also a serious competitor of the desirable food and game fishes in many of the lakes and tributary streams of these systems For example in northern Idaho squawfish-shytogether with other native cyprinids the peashymouth Mylocheilus caurinus (Richardson) and longnose dace Rhinichthys cataractae (Valenshyciennes)--and suckers (Catostomidae) have become the dominant fishes in waters that formerly produced trout The principal cause of this increase in rough-fish populations has been the changes in stream environment-shywarmer water reduced bank cover siltation and intermittent flow (Jeppson 1957)
In 1957 fishery biologists of the State of Idaho Department of Fish and Game began to investigate the life histories of the rough
~Now employed as Engineer US Post Office Dep 415 First Ave N Seattle Wash 98109
1
fishes and to experiment with partial control measures that could be used when fish are concentrated and thus vulnerable to destrucshytion in large numbers Jeppson (l957) used gill nets to reduce the number of northern squawfish in 3Z-hectare Hayden Lake He also learned that squawfish congregated along a 16-km stretch of rocky shoal as spawning time approached dynamite was effective in dispersing or destroying these schools Fish Tox2 and rotenone killed fry small young-ofshythe-year and yearling squawfish and slight reduction of the lake level during the incubashytion period killed the eggs that had been laid in shallow areas and subsequently exposed to air when the water level dropped
Following Jeppson1s work Richards3 began to study the spawning habits of squawfish at
2 Trade names referred to in this publication do not imply endorsement of commercial products by the Bureau of Commercial Fisheries
3 Richards Monte 1958bullExperimental rough-fish conshytrol Idaho Dep Fish Game [Boise] Annu ProgrRep Fed Aid Fish Restoration Proj F 22-R-3 17 PP [Procshyessed]
Cascade Reservoir Idaho to determine how to control the extremely large population there He found that
middotSquawfish migrated from the reservoir into two of the larger tributaries to spawn (North Fork of the Payette River and Lake Fork Creek)
eNo evidence of spawning existed in Casshycade Reservoir proper
eSquawfish spawned in the two tributaries in late June and early July after spawnshying the fish returned to the reservoir immediately
middotSquawfish fry drifted gradually from the spawning stream to the backwaters of the reservoir throughout the summer and fall
middotControl of squawfish in Cascade Reservoir appeared possible by trapping or treating them with rotenone while they were conshycentrated during the spawning run
Hasselman and Garrison4 found that the squawfish of Lookout Point Reservoir on the Middle Fork of the Willamette River Oreg migrated to the upper end of the reservoir to spawn The authors reported that four small tributaries which empty into the reservoir are probably too small to provide areas with reshyquirements for large concentrations of spawnshying squawfish
In 1953-57 the Bureau of Commercial Fishshyeries Biological Laboratory Seattle Wash studied in the laboratory the use of electricity to control northern squawfish This research was directed toward (1) preventing adult squawfish from moving into the areas where hatchery-reared salmon fingerlings werereshyleased so that the young salmon could safely disperse and (2) catching adult squawfish by using sequentially pulsed dc fields to lead them into enclosures or traps (Maxfield Liscom and Lander 1959)
In the spring of 1958 the Bureau and the Idaho Department of Fish and Game agreed to install an experimental electrical structure (electrode array and appurtenances ) at Cascade Reservoir and to estimate the structures efshyfectiveness in diverting northern squawfish into traps
EXPERIMENTAL SITE AND INSTALLATION
Cascade Reservoir (fig 1) is 1473 m above sea level in Valley County Idaho When full it is about 42 km long and covers 14528 ha
4Hasselman Ronald and Robert Garrison 1957 Studshyies on the squawfish Ptychocheilus oregonense in Lookshyout Point and Dexter reservoirs 1957 Joint research study US Fish Wildl Serv Portland middotand Dep Fish Game Manage Oreg State Coll Corvallis 41 PP [Processed]
Maxfield Galen H and C D Yolz An electrical barrier for controlling squawfish (Ptychocheilus oregoshynesis) predation Bur Comm Fish BioI Lab Seattle Wash [Unpublished manuscript 41 PP]
The experimental site for the electrical inshystallation was at the North Fork bridge that crosses the reservoir (at what was formerly Tamarack Falls) on the North Fork of the Payette River Here the reservoir is conshystricted to a 31-m-wide channel by the two concrete abutments of the bridge depth at peak level ranges from about 3 m at the abutments to 5 m at midstream The reservoir at peak level widens considerably on the upshystream side of the bridge and to a lesser degree on the immediate downstream side
The experimental installation consisted of (1) a V-shaped electrode array in the center of the stream and (2) two nonelectrified traps at the waters edge--one at each end of the electrode array The installation and its opershyation are described in five sections (1) elecshytrode array and traps (2) power source (3) electronic equipment (4) method of enershygizing array and (5) electrical conditions
Electrode Array and Traps
The V-shaped electrode array with apex downstream consisted of three parallel rows of vertical electrodes (26-cm thin-wall elecshytrical conduit) spaced 06 m apart in each row (figure 2) The downstream and middle rows of electrodes were 15 m apart and the middle and upstream rows were 06 m apart
We assembled the electrodes in sections which consisted of either two or four elecshytrodes inserted at 06-m intervals in an upper and a lower 51- by 102-cm spacer board which maintained the correct spacing of the electrodes during and after installation The lower spacer (fig 3) was about 12 m from the lower ends of the electrodes The upper spacer boards were mounted on a floating support structure that was not secured to the elecshytrodes therefore the support structure moved freely up and down the electrodes when the water level changed The lower ends of the vertical electrodes the lengths of which were from 37 to 61 m depending upon the water depth were embedded in the stream bottom
The support structure for the electrode array was built by joining balsa wood liferafts with planks or stringers in two sections that were floated into position and joined in a V-shape (fig 2) The structure was held in position by a vertical 102- by 306-cm plank secured to the bridge at each wing ofthe V in such a manshyner that it was free to rise and fall with change in water level The apex of the support strucshyture was 213 m downstream from the bridge the length of each arm of the V-shaped elecshytrode array was 207 m
A 46- by 61-m rectangular screen of galshyvanized hardware cloth (4 meshes per 25 em) mounted on a frame of 25-cm galvanized pipe was positioned in the water from each upstream end of the electrode array to the closest trap lead The two screens (fig 2)
2
Upper Payette Lake
North Fork Payette River N
Payette
Payette Lake
Creek
Creek
See
012 6 J3 Reservoir
Scale of kilometers
Dam
Figure l--Map of Cascade Reservoir and tributaries
3
B
PLAN DETAIL A
Figure 2--Plan view and construction details of support structure for electrode array including traps
prevented the fish from escaping through the unenergized space between the end of the array and the lead of the traps Two wooden traps (figs 2 and 3) caught the fish at either end of the array Each trap had a wooden V-shaped opening which extended from bottom to surshyface
The two trap leads were of 12-thread cotton netting of 38-cm mesh (stretched measure center of knot to center of knot) A throat exshytending from the bottom to the surface reduced the width of the opening to 457 cm The bottom to the trap leads which were of the same netting material extended as an apron downstream on the streambed for an additional 3 m to prevent the fish from escaping under the trap (figs 2 and 3)
The two traps were each emptied with a net brail of 38-cm mesh 15-thread cotton netting fastened to a metal frame designed to fit the inside of the trap To remove the fish from the trap the entrance was blocked and the brail which rested on the bottom was lifted with a pulley
Power Source
The direct current for the electrode array was provided by a 50-kw 250-v diesel-driven generator A lO-kw llO220-v gasolineshydriven generator supplied the 60-cycle altershynating current for the electrical and electronic equipment and utilities
4
~i111 27 X 15 m r-15ALSA LIFERAfT
WOODEN middot1WATERLINE TRAP
15
FEN 61
-R
JfhJ middotbullTI
lOTTO LINE
L2 II
~ TRAP
SECTION A-A
46
1110APRON
TRAP PLAN
APRON
TRAP DETAIL (SECTION B-B)
Figure 3--Plan and detail of trap including detail on electrode assembly
Electronic Equipment
The electronic equipment included an ignishytion pulse generator and a thyratron switching unit a cQntrol unit and sequential switch and a master control panel (fig 4) This equipment was similar in principle to that described in detail by Volz (1962)
The master control panel had voltage meters and ammeters for both ac and dc and a rheostat to regulate the voltage input ofthe dc generator A calibrated oscilloscope provided monitoring of pulse shape voltage frequency duration and sequence
The output of this equipment was pulsating direct current with substantially a squareshywave form (2-30 pulses per second) The
pulse duration had a range of2 to 200 millishyseconds depending upon the frequency used The equipment had a capacity of 80 amperes average current at 250 v or 20 kw
Method of Energizing Array
The array was divided into five sections which were energized in a repeating sequence To accomplish this system of energizing the electrodes those electrodes in the upstream row were connected to form a single cathode energized by every pulse Each electrode in the middle row was connected to the correshysponding electrode in the downstream row to form a series of five separate groups of anodes (fig 5) Thus the groups of anodes
5
TO ARRAY
IGNITRON PULSEDC SWITCH DCDIESEL-DRIVEN MASTER GENERATORDC FUSES a DCDIRECT CURRENT aOVERLOAD CONTROL
ACGENERATOR PROTECTION PANEL THYRATRON - SWITCHING
UNIT l DC EXCITATION
AC DC
bullAC
ACGASOLINEshy CONTROL UNIT MONITORINGDISTRIBUTIONDRIVEN AC a SEQUENTIAL ---1 CENTER - OSCILLOSCOPE
GENERATOR SWITCH a FUSES
AC LIGHTS
shy
Figure 4--Block diagram of electrical and electronic equipment
together with the cathode were energized in a repeating sequence which produced a conshytinuously moving electrical field throughout the array The peak current was about oneshyfifth of that which would have been required to energize all of the electrodes at one time however the average power consumption was about the same for the sequential pulsing as it would have been for simultaneously energizing the electrodes
Figure 6 shows the equipotential lines preshypared from analog plotting created about the electrodes as they were momentarily energized by pulse No4 The numbers in the figure represent the percentages of applied voltage from positive to negative electrodes The patshy
tern of equipotential lines from each of the five pulses is similar to that illustrated for pulse No4 The principal differences are near the apex of the array where the convergence of the rows of electrodes causes some disshytortion
Electrical Conditions
The electrical conditions of the experiment were (1) pulse frequencies of10and15pulses per second (2 and 3 pulses per field per second respectively when five fields were pulsed in sequence) (2) pulse durations of 25 and 50 msec and (3) applied voltages of 140 and 180 v at the electrodes
6
Pulse I +
Pulse 2 +
Pulse 3 +
Pulse 4 +
Figure 5--Wiring diagram of electrode connections of array
These conditions were selected on the basis of laboratory research to deterznine the optiznuzn conditions of a sequentially pulsed dc elecshytrical field to lead squawfish into enclosures or traps (Maxfield Liscozn and Lander 1959) The fish were released in the electdcal field Frequencies of 2 5 and 8 pulses per second were tested 2 pulses per second gave the best results To ensure that fish znoving upstreazn would encounter a frequency of 2 pulses per second in the array at Cascade Reservoir each of its five electrode sections or groups
were energized at this rate or 10 pulses per second for the total array Because the results in the laboratory with 5 pulses per second were considerably inferior to those with 2 we decided also to test 3 pulses per second per array section or 15 pulses per second for the total array As pulse duration and aznplitude znight cause significant differences under these conditions two durations 25 and 50 znsec and two aznplitudes 140 and 180 v were tested
7
_---===~ ELECTRODES
60
75
~o
~ 45
40
~o
70 75
4~
45
40
Figure 6--Plot of equipotential lines for a portion of electrical field No4
PHYSICAL QUALITY OF WATER
MeasureJnel1ts o[Wa~er resistivity and temshyperature- were made every-4 hours with few exceptions from July 4 to Aug 1 (table 1) Stream velocities were estimated to be near 015 m per second
Resistivity
Water resistivity was measured every 4 hours with a conductivity bridge the sample for each measurement was taken at midchanshynel upstream from the test site (fig 2) Resistivity 6 readings ranged from 20000 to 46000 ohm cm (table 1)
6Conductivity of the water varied from 21 to 45 microshymhos at 180 C
Temperature
Water temperatures were taken directly from the channel in the same location where the samples for the resistivity measurements were obtained A standard laboratory thershymometer was used Each measurement was recorded concurrently with resistivity Water temperatures ranged from 156 to 2560 C (table 1)
METHOD OF TESTING EFFECTIVENESS OF INSTALLATION
We adopted the hypothesis that a field inshystallation of this type is not effective in dishyverting adult squawfish into traps To test
8
----- --~--~---------------------------
Table 1--Water temperatures and water resistivities at Tamarack Falls Cascade Reservoir Idaho July 4 to Aug 1 1958
Water temperature Water resistivity
am pm am pm
Date I 400 I 800 I 1200 400 I 800 I 1200 400 I 800 I 1200 400 I 800 I 1200
0 ~ bullbullbullbullbullbullbull Thousands of ohm cmbull July 4 -shy 160 156 166 166 -shy -shy 430 405 370 420 -shy5 -shy 166 178 189 189 -shy -shy 440 405 400 417 -shy6 -shy 184 189 189 189 189 450 440 412 370 405 410 7 189 184 200 200 166 194 430 435 422 410 430 400 8 189 189 194 200 194 194 460 420 410 390 430 390 9 194 194 200 200 200 200 440 430 420 380 430 390
10 200 200 211 211 200 206 440 420 330 380 460 430 11 12
200 211
211 211
211 222
216 228
211 222
211 216
450 440
400 415
360 335
290 340
360 410
400 420
13 14 15 16 17 18 19 20 21 22 23 24 25 26 27 28 29 30 31
211 200 206 206 200 189 194 194 200 206 211 216 216 216 211 206 200 211 211
211 206 200 200 200 200 194 194 200 206 211 216 216 222 211 211 211 200 211
211 200 211 211 211 200 194 211 211 211 228 211 222 228 211 211 211 206 211
211 222 211 234 200 211 211 211 211 234 256 222 222 228 211 211 216 222 222
211 211 211 211 211 206 211 221 211 211 222 216 211 222 211 211 211 216 222
211 211 206 206 200 200 194 211 206 211 234 216 222 216 211 211 211 211 211
435 435 425 410 400 410 390 410 360 338 290 310 385 280 325 300 300 310 300
395 395 380 382 390 375 390 365 335 320 272 300 275 255 312 300 300 320 295
370 280 352 370 355 342 375 320 290 265 240 240 232 222 272 270 270 290 235
350 290 340 330 355 340 330 262 250 200 200 220 200 245 265 230 245 260 222
410 380 370 375 400 362 350 290 312 250 232 240 212 260 272 220 262 260 222
420 360 395 385 410 380 350 350 330 255 268 270 240 290 280 255 295 295 262
Aug 1 216 211 -shy -shy -shy -shy 275 275 -shy -shy -shy -shy
this hypothesis we required intervals when the power was on and when it was off We then expected if the hypothesis were true to obtain equal catches in the traps under each power condition A valid test would require however that equal numbers of fish be available to the installation when the power was on and when it was off To satisfy this requirement we designed an experiment in which the power condition (on or off) was alternated for successive 24-hour intervals between July 2 and August 1
continued through 1000 am Aug 1 Duringthis testing electrical conditionsmiddot maintained continuously over a 24-hour period were folshylowed by a 24-hour period of power off Thus 15 days with power on were alternated with 15 days with power off Three sets of electrical conditions of varied pulse frequencypulse duration and voltage were usedas shown in table 2 and one set (pulse frequency 10 pulses per second pulse duration 50 msecand voltage 180 v) was repeated Thus fourseries of tests were made Several species of fishes besidessquawfish were caught in the
TESTING THE INSTALLATION traps but only records of squawfish werekept (table 2)
The experimental installation at Cascade Figure 7 prepared from table 2 shows the
catches for each 48-hour test of 24 hours Reservoir as used to test the hypothesis was built in June and tested from July 2 to Aug 1 The testing began at 1000 am July 2 and
power on and 24 hours power off exshypressed as percentages of the total 48-hour catch In figure 7 each test period started at
9
Table 2--Numbers of squawfish in traps 1 and 2 for each 24-hour test with power on and for each 24-hour test with power off July 2 to Aug 1 1958
Test series
Date Power condition
Squawfish
Fish in Fish in trap No1 trap No2
Total fish
Electrical conditions
Voltage Frequency Duration
1 Do
July 1 2
3 On Off
Number
0 2
Number
3 4
Number
3 6
Volts
180
PulaeLaec
10
Msec
50
Do Do
4 5
On Off
4 15
23 8
27 23
180 10 50
Do Do
6 7
On Off
13 6
33 7middot
46 13
180 10 50
Do Do
S 9
On Ofr
15 4
44 6
59 10
180 10 50
Do Do
10 11
On orr
13 1
32 1
45 2
180 10 50
Do Do
12 13
On orr
12 2
17 a
29 2
180 10 50
Do Do
14 15
On middotOfr
13 6
16 2
29 8
180 10 50
2 Do
16 17
On Ofr
1 3
12 4
13 7
180 15 25
Do Do
18 19
On orr
2 3
3 3
5 6
180 15 25
Do Do
20 21
On orr
2 3
9 4
11 7
180 15 25
3 Do
22 23
On orr
5 2
9 2
14 4
140 10 50
Do Do
24 25
On Ofr
8 6
23 2
31 8
140 10 50
Do Do
26 27
On Off
6 4
11 2
17 6
140 10 50
4 Do
2S 29
On Off
2 2
13 2
15 4
180 10 50
Do Do
30 31
On orf
5 0
5 4
10 4
180 10 50
Total On Off
Grand Total
101 59
160
253 51
304
354 110 464
1 The date shown is the date the 24-hour period began July 2 is actually 1000 am July 2 to 1000 am July 3 July 3 is 1000 am July) to 1000 am July 4
10
TEST SERIES 2 4 4~OOO~------~~~~~~------~---~----~r---~------------
WATER RESISTIVITY (ohlll CIII)
WATER TEMPERATURE ( middotCol
ELECTRICAL CONDITIONS
100
10 pulbullbullbull I bullbullc 50 mbullbullc 50 mbullbullc
90 ~ z u 80 II
IL 70
Q 60
2 4 6 8 10 12 14 16 18 20 22 24 26 28 30 JULY
mpOWER ON _POWER OFF
IL IL It ~O II ~
40 til ibull 30It 0
20til
10
0
Figure 7--Percentage of squawflsn trapped witn power on and witn power off for eacn 48-nour test July 2 to Aug 1 1958 Data on trapping of squawfisn are plotted against average daily water temperature and water resistivity
1000 am on the date shown and ended 48 hours later Also shown in figure 7 are average daily water resistivity and water temperature readings
Table 3 was prepared to show the numbers and percentages of squawfish taken in each trap for the different conditions One possible explanation of the consistently greater numbers of fish in trap No2 during power on lies in the response of the squawfish to the direction of the positive charge of the sequentially pulsed electrical fields The electrical fields in the electrode array were sWitched in the direction of the apex away from trap No 1 (west side of bridge right bank) and this switching continued in the direction of trap No2 (east side of bridge left bank) It has been demonstrated in the laboratory that adult squawfish move toward the positive charge (Maxfield Liscom and Lander 1959) The larger catches of squawfish in trap No2 in comparison with catches in trap No1 may have reflected this response
Table 4 groups the data of table 3 under the different electrical conditions We assumed that equal numbers of fish were available when the power was on and off within each test series The results suggest that the test conshydition with voltage 180 v bullbull pulse frequency 15 per second and pulse duration 25 msec was less effective than the other electrical condishytions in diverting the northern squawfish into traps This result is also shown in figure 8
Under the hypothesis that the electrical fields did not divert the fish into the traps we expected half of the total count in all traps to be taken during each power condition The total catches were as follows (table 4)
Total catch of squawfish
Number
354 110 232
Power condition
Power on Power off Expected (in each trap)
11
Table 3--Numbers and percentages of squawfish in traps 1 and 2 in four series of 48-hour tests 24 hours power on and 24 hours power off July 2 to Aug 1 1958
Squawfish caught Percentage of total Electrical conditions
Test 48-hour Power on Power off Power on Power offDate
series tests Voltage Frequency DurationTrap Trap TrapTrap Trap T~apIT~ap ITotal ~ap ITotal1 1 2 1 2
bullbullbullbullbullbullbullbullbullbullbullbull Number bullbullbullbullbullbullbullbullbullbullbullbullbullbull bullbullbullbullbullbullbullbullbull Percent bullbullbullbullbullbullbullbull PUlsessec bull Maec bull ~ ~
1 7 July 2-15 70 168 238 36 28 64 294 706 562 438 180 10 50
2 3 July 16-21 5 24 29 9 11 20 172 828 450 550 180 15 25
3 3 July 22-27 19 43 62 12 6 18 306 694 667 333 140 10 50
280 720 250 750 180 4 2 July 28-Aug 1 7 18 25 2 6 8 10 50
Total 101 253 354 59 51 110 285 715 536 464
Table 4--Numbers and percentages of squawfish trapped in four series of 48-hour tests 24 hours power on and 24 hours power off July 2 to Aug 1 1958
Squawfish caught Percentage of total Electrical conditions Test 48-hour Date
series tests Power on I Power off I Total Power on I Power off Voltage I Frequency IDuration
bullbullbullbullbullbullbullbullbullbullbullbullbull Number bullbullbullbullbullbullbullbullbullbullbullbullbull bullbullbullbullbullbull Percent bullbullbullbullbullbullbull Volts Pulsessec bull ~~
302 788 212 180 10 50 1 7 July 2-15 238 64
20 49 592 408 180 15 25 2 3 July 16-21 29
18 80 775 225 140 10 50 3 3 July 22-27 62
33 758 242 180 10 50 4 2 July 28 to Aug 1 25 8
Total 354 110 464 763 237
tv
--
ELECTRICAL CONDITIONSTEST DATE SERI ES VoltaCJe Frequency Duration
Volts Pulsesec Msec
July 2 - US 180 10 50
2 July16-21 180 5 25
503 July 22-27 140 0
July 28-31 t80 10 50-100 41- Z IIJ u 90 a IIJ Q 80-o 7 0 E~ IIJ Q Q 60laquo --- a I shy
5 0 1====1c
~40rmmm ~ 30
g2 0 ~m~~tmk~iI 10
O~~-
July 2-15 July 16 - 21 July 22-27
POWER ON OFF ON OFF ON OFF July 28-3
ON OFF
Figure 8--Percentage of squawfish trapped in four series of 48-hour tests 24 hours power on and 24 hours power off July 2 to Aug I 1958
Chi-square was significant (pltOOl) thereshyfore we concluded that the squawfish were diverted by the electric fields
For each of the four test series we subshytracted the power off catches from the corresponding power on catches (table 4) these figures estimate the numbers trapped under the influence of electricity To examine the relative effect of electricity during the four series we then divided these estimates by the power on catches and tested the fractions for uniformity The fraction trapped
under the influence of electricity was signifishycantly smaller (p lt001) for the test series July 16-21 Thus the data suggest that the effectivenes s of the electrical fields in trapping squawfish is decreased when the pulse freshyquency exceeds some value between 10 and 15 pulses per second (2 and 3 pulses per field per second respectively when five fields were pulsed in sequence) or when the pulse duration is shortened below some value beshytween 30 and 50 msec
13
CONCLUSIONS AND RECOMMENDATIONS
The operation of the electrical installation at the Tamarack Falls site permits the followshying conclusions and recommendations (1) the electrical fields of the electrode array were effective in diverting adult squawfish into traps (2) the work reported here was an attempt to determine the problems of operation of our equipment and evaluate its effectiveness under field conditions
For future application of this technique attention should be given to the following
1 The velocities and volumes of water to be expected at the site of operation of the installation
2 Replacement of parts or sections of the electrode array and traps
3 Power equipment to enable rapid removal of large numbers of fish
4 Upstream barrier to collect large pleces of debris
5 Disposal of squawfish and other undeshysirable fish removed from traps
ACKNOWLEDGMENTS
Funds for this study were provided jointly by the Idaho Department of Fish a~d Game and the Columbia River Program Offlce Bureau
of Commercial Fisheries Robert H Lander helped plan and analyze the field tests Kenneth L Liscom Charles C Gillaspie and field personnel of the Idaho Department of Fish and Game assisted in the field work at Casshycade Reservoir Idaho We also thank James E Mason for his suggestions on the installation
LITERATURE CITED
JEPPSON PAUL 1957 The control of squawfish by use of
dynamite spot treatment and reducshytion of lake levels Progr Fish-Cult 19 168-171
LINDSEY C c 1956 Distribution and taxonomy of fishes
in the Mackenzie drainage in British Columbia J Fish Res Board Can 13 759-789
MAXFIELD GALEN Hbullbull KENNETH L LISshyCOM and ROBER T H LANDER
1959 Leading adult squawfish (Ptychoch~shyilus oregonensis) within an electnc field US Fish Wildl Serv Spec Sci Rep Fish 298 iv + 15 pp
VOLZ CHARLES D 1962 Ignitron-pulsed electnc fence gUldes
migrating salmon Electronics 35 (16) 50-52
MS 1809
GPO 8$5981 14
As the Nations principal conservation agency the Departshyment of the Interior has basic responsibilities for water fish wildlife mineral land park and recreational reshysources Indian and Territorial affairs are other major concerns of Americas Department of Natural Resources
The Department works to assure the wisest choice in managing all our resources so each will make its full contribution to a better United States -- now and in the future
UNITIW ~TATES POSTAGE AND FEES PAID DEPARTMENT OF THE INTERIOR US DEPARTMENT OF THE INTERIOR
FISH AND WILDLIFE SERVICE THIRD CLASS BU REAU OF COMMERCIAL FISHERIES
WASHINGTON DC 20240
OFFICIAL BUSINESS
Return this sheet to above address if you do NO T wish to receive this mmerial 0 crlf
change of address is needed 0 (indicate change including ZIP Code)
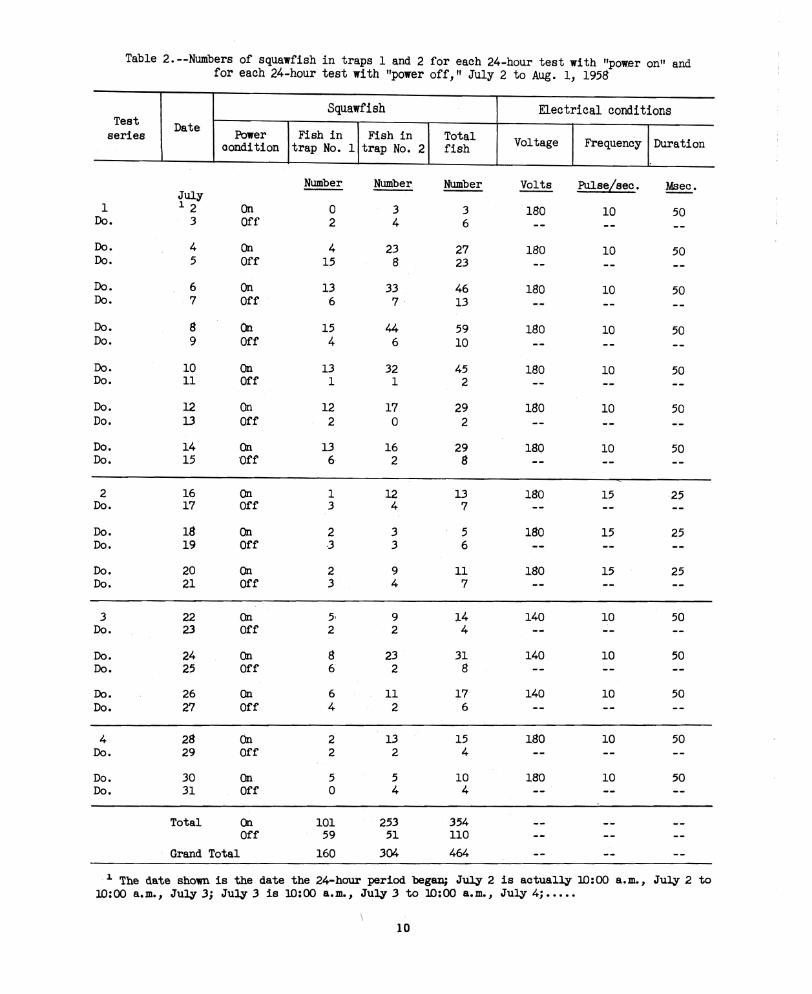
Recommended