SOLID GROWTH. STRONG RETURNS. BEST-IN-CLASS OPERATOR.
ITW Conference Call First Quarter 2013
April 23, 2013
SOLID GROWTH. STRONG RETURNS. BEST-IN-CLASS OPERATOR.
Forward-Looking Statements
2
Safe Harbor Statement This conference call contains forward-looking statements within the meaning of the Private Securities Litigation Reform Act of 1995 including, without limitation, statements regarding strategic initiatives and related benefits, operating performance, growth in free operating cash flow, revenue and margin growth, diluted income per share from continuing operations, restructuring expenses and related benefits, tax rates, exchange rates, share repurchases, end market conditions, and the Company’s related 2013 forecasts. These statements are subject to certain risks, uncertainties, and other factors which could cause actual results to differ materially from those anticipated. Important risks that could cause actual results to differ materially from the Company’s expectations include those that are detailed in ITW’s Form 10-K for 2012. Non-GAAP Measures The Company uses certain non-GAAP measures in discussing the Company’s performance. The reconciliation of those measures to the most comparable GAAP measures is contained throughout this presentation and is also available at our website www.ITW.com under “Investor Relations”.
SOLID GROWTH. STRONG RETURNS. BEST-IN-CLASS OPERATOR.
Conference Call Playback
●Replay number: 800-839-1334; No pass code necessary
●Telephone replay available through midnight of May 7, 2013
●Webcast / PowerPoint replay available at www.itw.com
●Supplemental financial and investor information will be available on the ITW website under the “Investor Relations” tab
3
SOLID GROWTH. STRONG RETURNS. BEST-IN-CLASS OPERATOR.
Enterprise Strategy Update
4
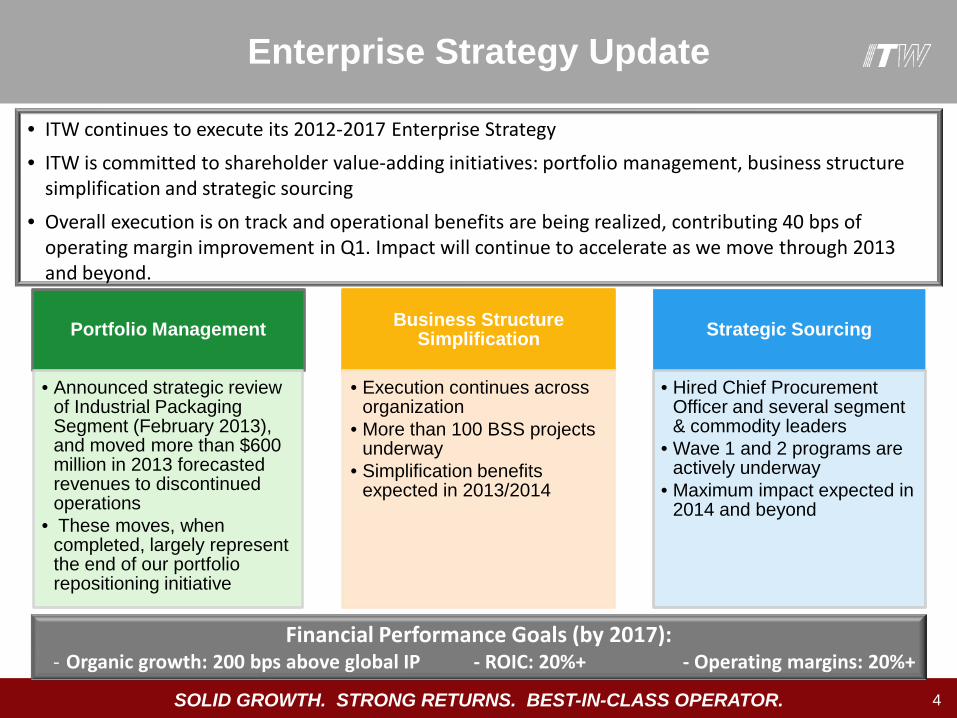
Portfolio Management
• Announced strategic review of Industrial Packaging Segment (February 2013), and moved more than $600 million in 2013 forecasted revenues to discontinued operations
• These moves, when completed, largely represent the end of our portfolio repositioning initiative
Business Structure Simplification
• Execution continues across organization
• More than 100 BSS projects underway
• Simplification benefits expected in 2013/2014
Strategic Sourcing
• Hired Chief Procurement Officer and several segment & commodity leaders
• Wave 1 and 2 programs are actively underway
• Maximum impact expected in 2014 and beyond
• ITW continues to execute its 2012-2017 Enterprise Strategy
• ITW is committed to shareholder value-adding initiatives: portfolio management, business structure simplification and strategic sourcing
• Overall execution is on track and operational benefits are being realized, contributing 40 bps of operating margin improvement in Q1. Impact will continue to accelerate as we move through 2013 and beyond.
Financial Performance Goals (by 2017): - Organic growth: 200 bps above global IP - ROIC: 20%+ - Operating margins: 20%+
SOLID GROWTH. STRONG RETURNS. BEST-IN-CLASS OPERATOR.
Reporting Changes
5
2012 Non-GAAP
Results
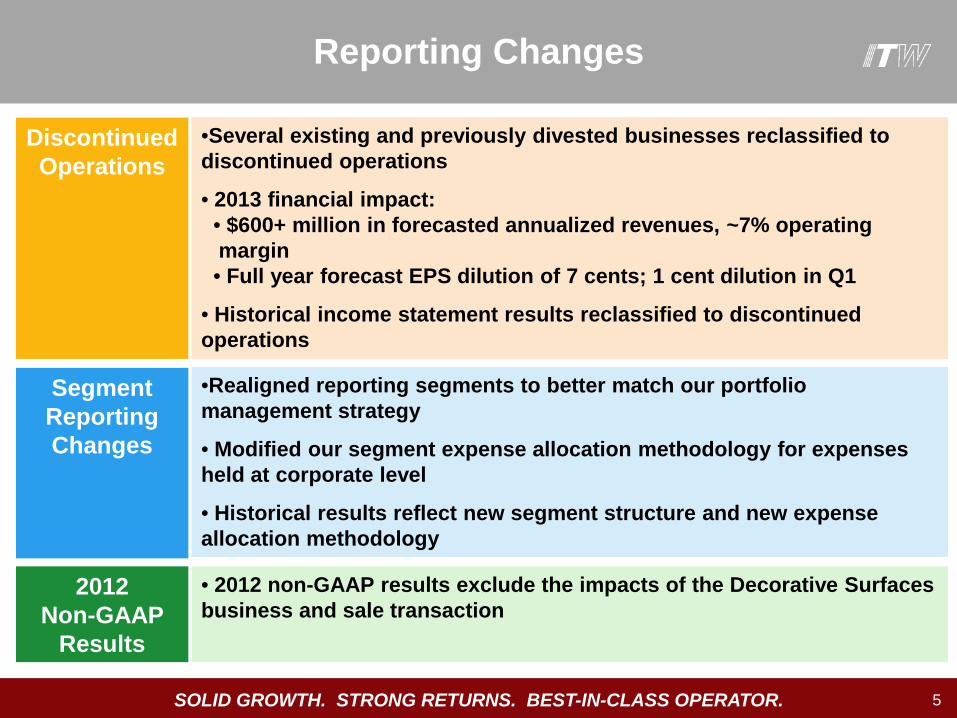
• 2012 non-GAAP results exclude the impacts of the Decorative Surfaces business and sale transaction
•Several existing and previously divested businesses reclassified to discontinued operations
• 2013 financial impact: • $600+ million in forecasted annualized revenues, ~7% operating margin • Full year forecast EPS dilution of 7 cents; 1 cent dilution in Q1
• Historical income statement results reclassified to discontinued operations
•Realigned reporting segments to better match our portfolio management strategy
• Modified our segment expense allocation methodology for expenses held at corporate level
• Historical results reflect new segment structure and new expense allocation methodology
Discontinued Operations
Segment Reporting Changes
SOLID GROWTH. STRONG RETURNS. BEST-IN-CLASS OPERATOR. 6
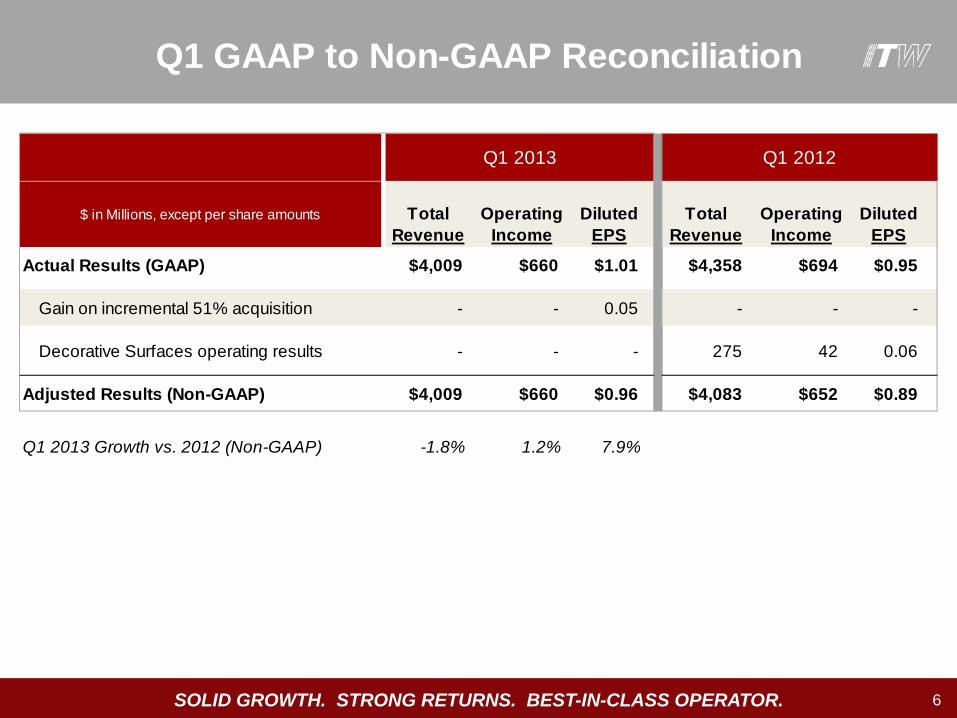
$ in Millions, except per share amounts Total Revenue
Operating Income
Diluted EPS
Total Revenue
Operating Income
Diluted EPS
Actual Results (GAAP) $4,009 $660 $1.01 $4,358 $694 $0.95
Gain on incremental 51% acquisition - - 0.05 - - -
Decorative Surfaces operating results - - - 275 42 0.06
Adjusted Results (Non-GAAP) $4,009 $660 $0.96 $4,083 $652 $0.89
Q1 2013 Growth vs. 2012 (Non-GAAP) -1.8% 1.2% 7.9%
Q1 2013 Q1 2012
Q1 GAAP to Non-GAAP Reconciliation
SOLID GROWTH. STRONG RETURNS. BEST-IN-CLASS OPERATOR. 7
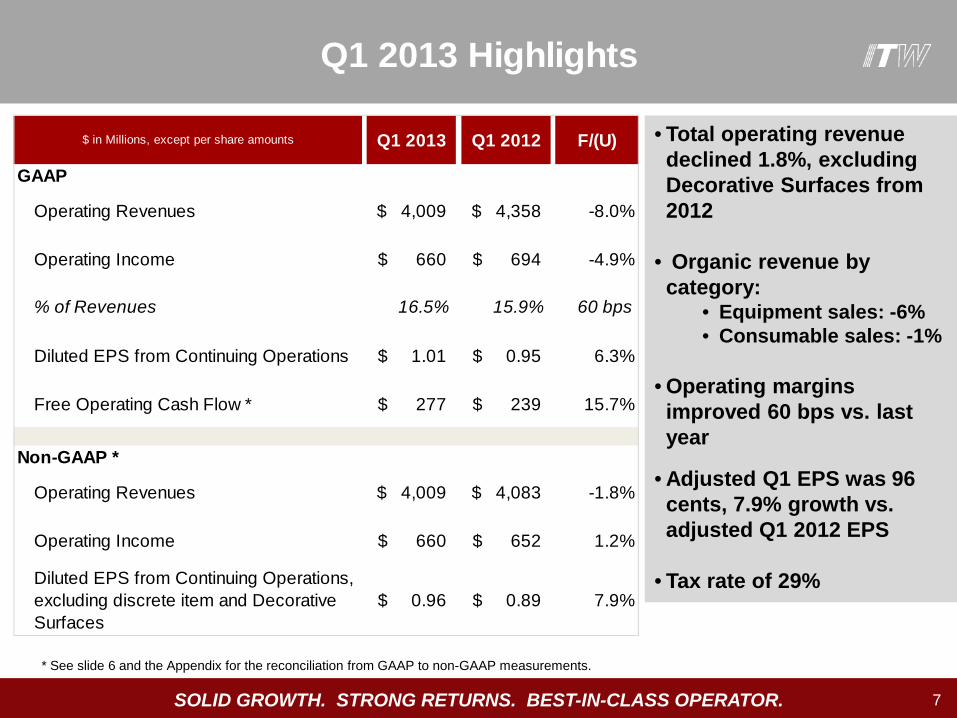
• Total operating revenue declined 1.8%, excluding Decorative Surfaces from 2012
• Organic revenue by category:
• Equipment sales: -6% • Consumable sales: -1%
• Operating margins improved 60 bps vs. last year
• Adjusted Q1 EPS was 96 cents, 7.9% growth vs. adjusted Q1 2012 EPS
• Tax rate of 29%
Q1 2013 Highlights
$ in Millions, except per share amounts Q1 2013 Q1 2012 F/(U)
GAAP
Operating Revenues 4,009$ 4,358$ -8.0%
Operating Income 660$ 694$ -4.9%
% of Revenues 16.5% 15.9% 60 bps
Diluted EPS from Continuing Operations 1.01$ 0.95$ 6.3%
Free Operating Cash Flow * 277$ 239$ 15.7%
Non-GAAP *
Operating Revenues 4,009$ 4,083$ -1.8%
Operating Income 660$ 652$ 1.2%
Diluted EPS from Continuing Operations, excluding discrete item and Decorative Surfaces
0.96$ 0.89$ 7.9%
* See slide 6 and the Appendix for the reconciliation from GAAP to non-GAAP measurements.
SOLID GROWTH. STRONG RETURNS. BEST-IN-CLASS OPERATOR. 8
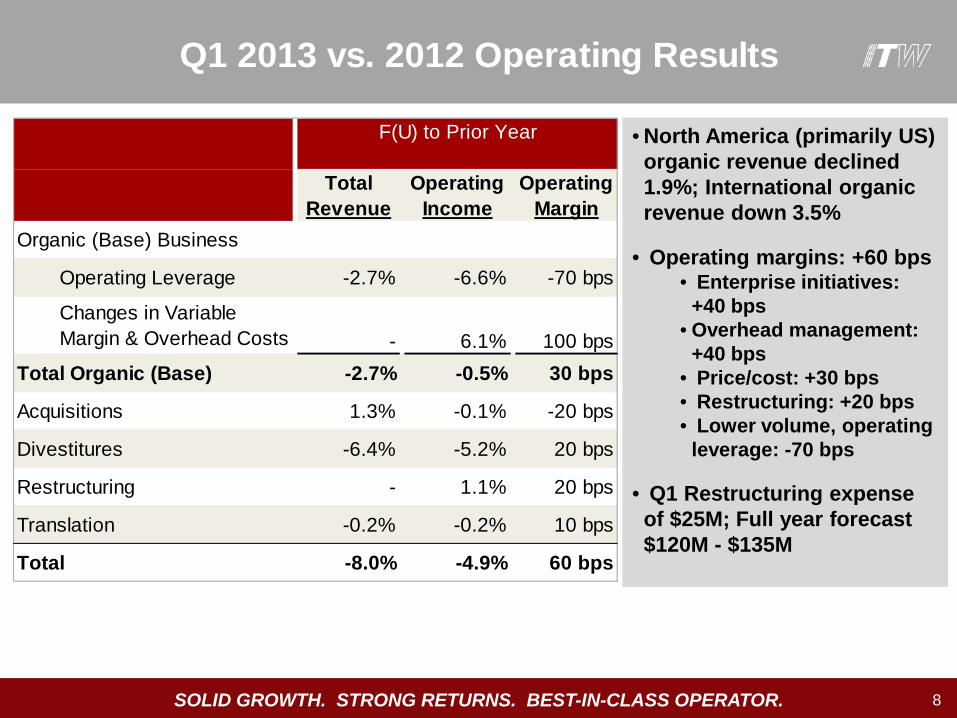
• North America (primarily US) organic revenue declined 1.9%; International organic revenue down 3.5%
• Operating margins: +60 bps
• Enterprise initiatives: +40 bps
• Overhead management: +40 bps
• Price/cost: +30 bps • Restructuring: +20 bps • Lower volume, operating
leverage: -70 bps
• Q1 Restructuring expense of $25M; Full year forecast $120M - $135M
Q1 2013 vs. 2012 Operating Results
Total Revenue
Operating Income
Operating Margin
Organic (Base) Business
Operating Leverage -2.7% -6.6% -70 bps
Changes in Variable Margin & Overhead Costs - 6.1% 100 bps
Total Organic (Base) -2.7% -0.5% 30 bps
Acquisitions 1.3% -0.1% -20 bps
Divestitures -6.4% -5.2% 20 bps
Restructuring - 1.1% 20 bps
Translation -0.2% -0.2% 10 bps
Total -8.0% -4.9% 60 bps
F(U) to Prior Year
SOLID GROWTH. STRONG RETURNS. BEST-IN-CLASS OPERATOR. 9
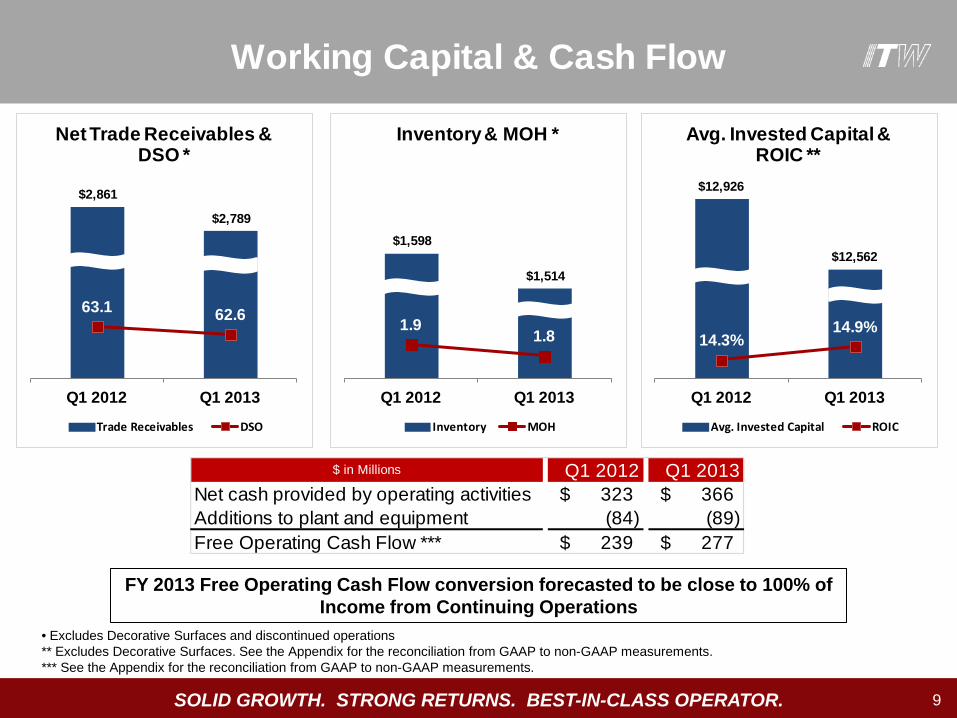
• Excludes Decorative Surfaces and discontinued operations ** Excludes Decorative Surfaces. See the Appendix for the reconciliation from GAAP to non-GAAP measurements. *** See the Appendix for the reconciliation from GAAP to non-GAAP measurements.
$ in Millions Q1 2012 Q1 2013Net cash provided by operating activities 323$ 366$ Additions to plant and equipment (84) (89) Free Operating Cash Flow *** 239$ 277$
$2,861
$2,789
63.1 62.6
Q1 2012 Q1 2013
Net Trade Receivables & DSO *
Trade Receivables DSO
$1,598
$1,514
1.91.8
Q1 2012 Q1 2013
Inventory & MOH *
Inventory MOH
$12,926
$12,562
14.3%14.9%
Q1 2012 Q1 2013
Avg. Invested Capital & ROIC **
Avg. Invested Capital ROIC
Working Capital & Cash Flow
FY 2013 Free Operating Cash Flow conversion forecasted to be close to 100% of Income from Continuing Operations
SOLID GROWTH. STRONG RETURNS. BEST-IN-CLASS OPERATOR. 10
* See the Appendix for the reconciliation from GAAP to non-GAAP measurements.
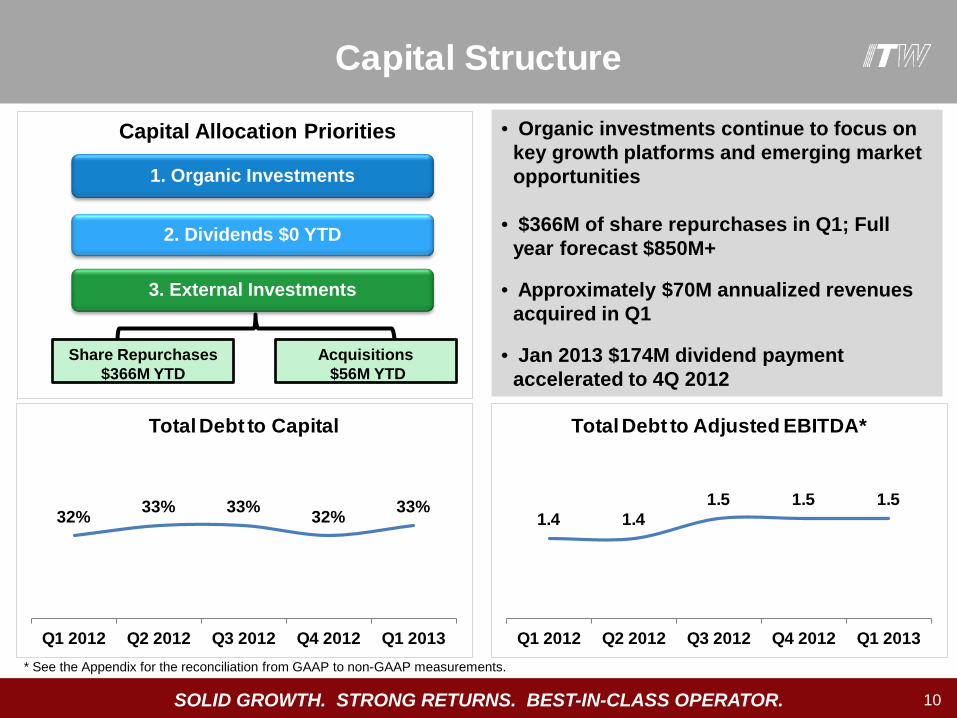
• Organic investments continue to focus on key growth platforms and emerging market opportunities
• $366M of share repurchases in Q1; Full
year forecast $850M+
• Approximately $70M annualized revenues acquired in Q1
• Jan 2013 $174M dividend payment accelerated to 4Q 2012
1. Organic Investments
2. Dividends $0 YTD
3. External Investments
Share Repurchases $366M YTD
Acquisitions $56M YTD
Capital Allocation Priorities
32% 33% 33% 32% 33%
Q1 2012 Q2 2012 Q3 2012 Q4 2012 Q1 2013
Total Debt to Capital
1.4 1.4 1.5 1.5 1.5
Q1 2012 Q2 2012 Q3 2012 Q4 2012 Q1 2013
Total Debt to Adjusted EBITDA*
Capital Structure
SOLID GROWTH. STRONG RETURNS. BEST-IN-CLASS OPERATOR. 11
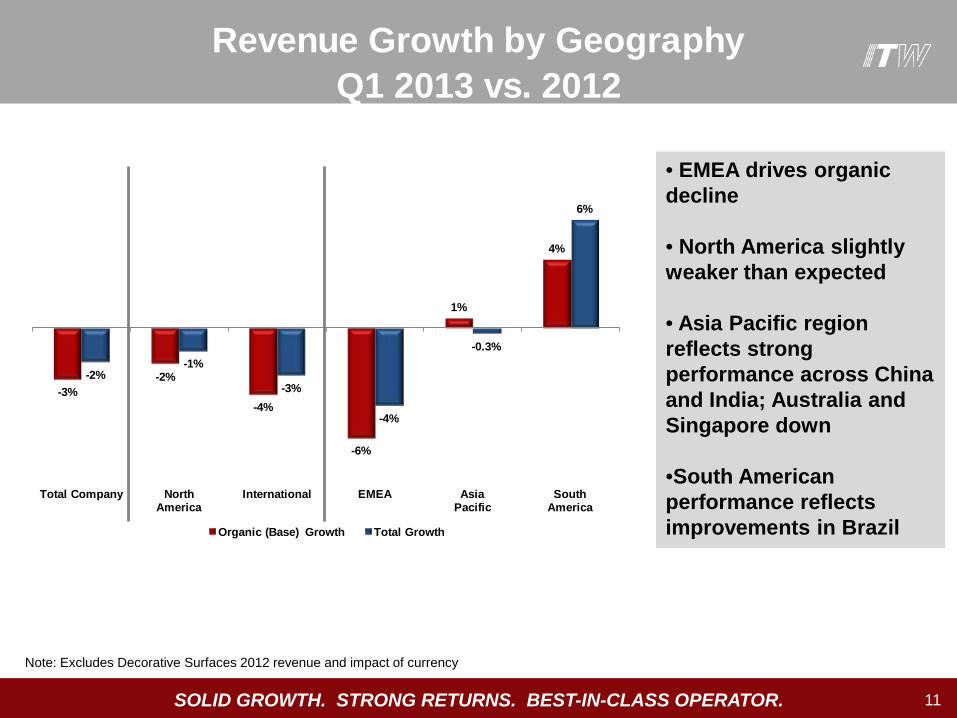
Note: Excludes Decorative Surfaces 2012 revenue and impact of currency
• EMEA drives organic decline
• North America slightly weaker than expected
• Asia Pacific region reflects strong performance across China and India; Australia and Singapore down •South American performance reflects improvements in Brazil
Revenue Growth by GeographyQ1 2013 vs. 2012
-3%-2%
-4%
-6%
1%
4%
-2%-1%
-3%
-4%
-0.3%
6%
Total Company North America
International EMEA AsiaPacific
South America
Organic (Base) Growth Total Growth
SOLID GROWTH. STRONG RETURNS. BEST-IN-CLASS OPERATOR. 12
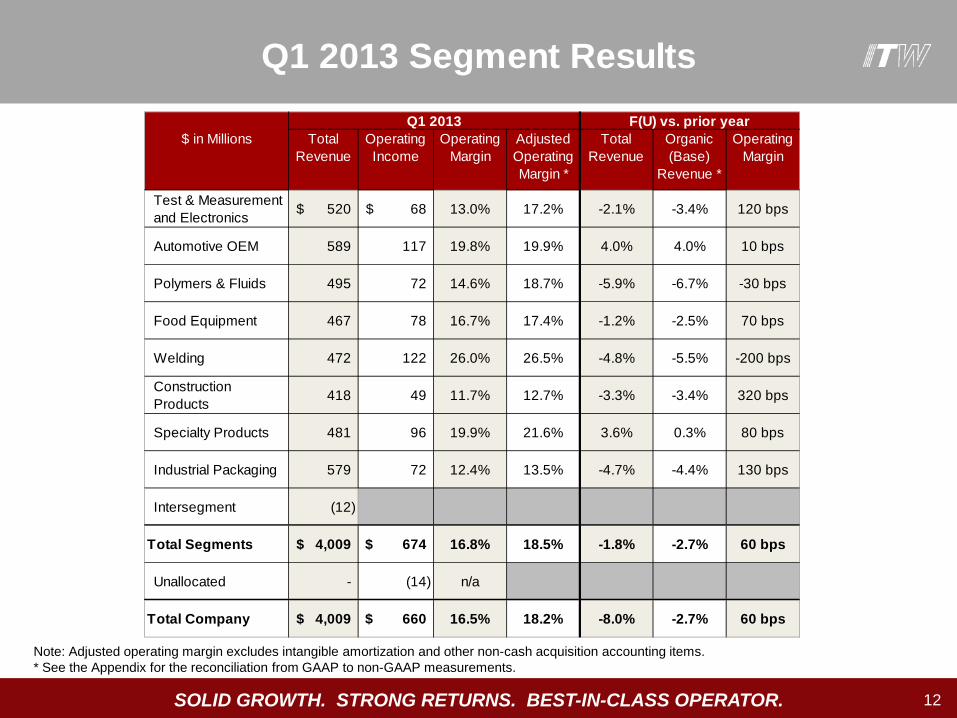
Note: Adjusted operating margin excludes intangible amortization and other non-cash acquisition accounting items. * See the Appendix for the reconciliation from GAAP to non-GAAP measurements.
Q1 2013 Segment Results
$ in Millions Total Revenue
OperatingIncome
OperatingMargin
Adjusted Operating Margin *
Total Revenue
Organic (Base)
Revenue *
OperatingMargin
Test & Measurement and Electronics 520$ 68$ 13.0% 17.2% -2.1% -3.4% 120 bps
Automotive OEM 589 117 19.8% 19.9% 4.0% 4.0% 10 bps
Polymers & Fluids 495 72 14.6% 18.7% -5.9% -6.7% -30 bps
Food Equipment 467 78 16.7% 17.4% -1.2% -2.5% 70 bps
Welding 472 122 26.0% 26.5% -4.8% -5.5% -200 bps
Construction Products 418 49 11.7% 12.7% -3.3% -3.4% 320 bps
Specialty Products 481 96 19.9% 21.6% 3.6% 0.3% 80 bps
Industrial Packaging 579 72 12.4% 13.5% -4.7% -4.4% 130 bps
Intersegment (12)
Total Segments 4,009$ 674$ 16.8% 18.5% -1.8% -2.7% 60 bps
Unallocated - (14) n/a
Total Company 4,009$ 660$ 16.5% 18.2% -8.0% -2.7% 60 bps
F(U) vs. prior yearQ1 2013
SOLID GROWTH. STRONG RETURNS. BEST-IN-CLASS OPERATOR. 13
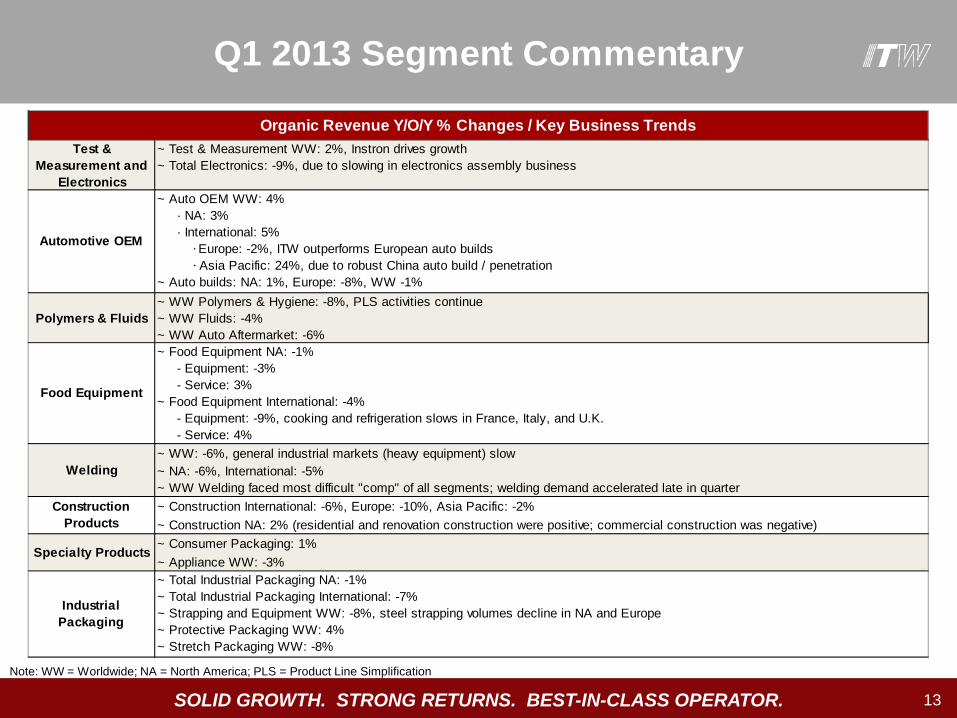
Note: WW = Worldwide; NA = North America; PLS = Product Line Simplification
Q1 2013 Segment Commentary
Organic Revenue Y/O/Y % Changes / Key Business TrendsTest &
Measurement and Electronics
~ Test & Measurement WW: 2%, Instron drives growth ~ Total Electronics: -9%, due to slowing in electronics assembly business
Polymers & Fluids~ WW Polymers & Hygiene: -8%, PLS activities continue~ WW Fluids: -4%~ WW Auto Aftermarket: -6%
~ WW: -6%, general industrial markets (heavy equipment) slow~ NA: -6%, International: -5%~ WW Welding faced most difficult "comp" of all segments; welding demand accelerated late in quarter~ Construction International: -6%, Europe: -10%, Asia Pacific: -2%~ Construction NA: 2% (residential and renovation construction were positive; commercial construction was negative)~ Consumer Packaging: 1%~ Appliance WW: -3%~ Total Industrial Packaging NA: -1%~ Total Industrial Packaging International: -7%~ Strapping and Equipment WW: -8%, steel strapping volumes decline in NA and Europe~ Protective Packaging WW: 4%~ Stretch Packaging WW: -8%
Construction Products
Specialty Products
Industrial Packaging
Automotive OEM
Food Equipment
Welding
~ Auto OEM WW: 4% · NA: 3% · International: 5% · Europe: -2%, ITW outperforms European auto builds · Asia Pacific: 24%, due to robust China auto build / penetration ~ Auto builds: NA: 1%, Europe: -8%, WW -1%
~ Food Equipment NA: -1% - Equipment: -3% - Service: 3%~ Food Equipment International: -4% - Equipment: -9%, cooking and refrigeration slows in France, Italy, and U.K. - Service: 4%
SOLID GROWTH. STRONG RETURNS. BEST-IN-CLASS OPERATOR. 14
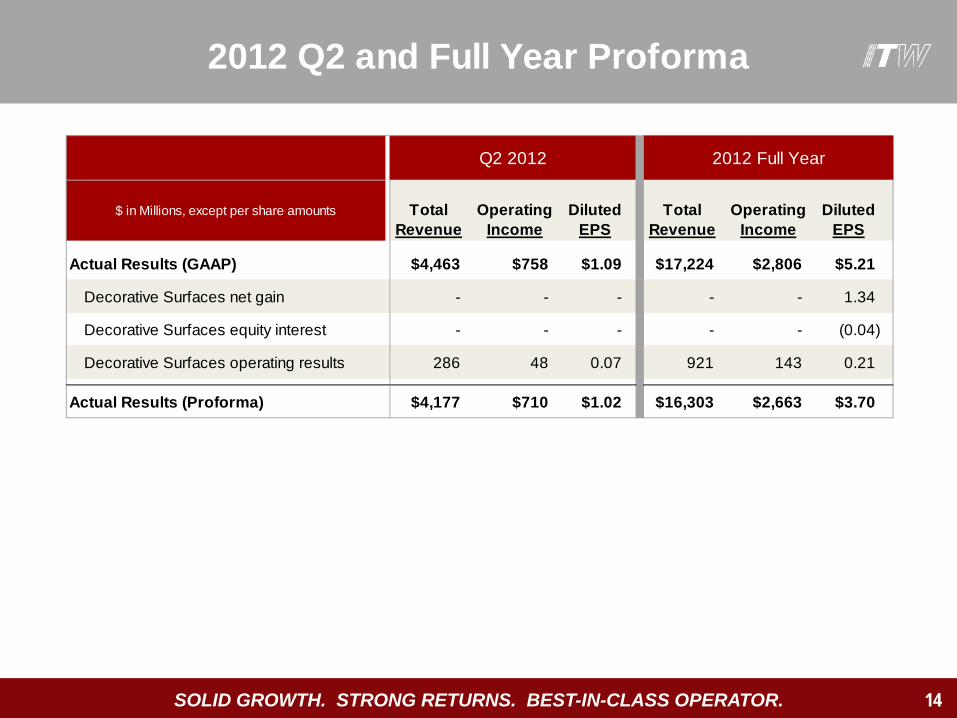
$ in Millions, except per share amounts Total Revenue
Operating Income
Diluted EPS
Total Revenue
Operating Income
Diluted EPS
Actual Results (GAAP) $4,463 $758 $1.09 $17,224 $2,806 $5.21
Decorative Surfaces net gain - - - - - 1.34
Decorative Surfaces equity interest - - - - - (0.04)
Decorative Surfaces operating results 286 48 0.07 921 143 0.21
Actual Results (Proforma) $4,177 $710 $1.02 $16,303 $2,663 $3.70
Q2 2012 2012 Full Year
2012 Q2 and Full Year Proforma
SOLID GROWTH. STRONG RETURNS. BEST-IN-CLASS OPERATOR. 15
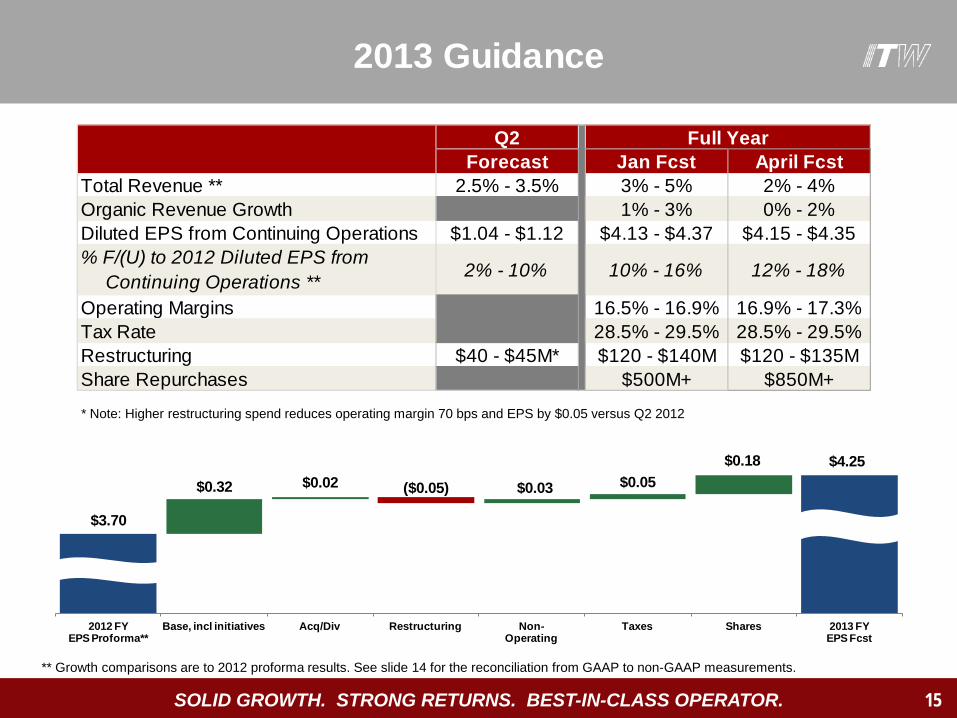
** Growth comparisons are to 2012 proforma results. See slide 14 for the reconciliation from GAAP to non-GAAP measurements.
Q2Forecast Jan Fcst April Fcst
Total Revenue ** 2.5% - 3.5% 3% - 5% 2% - 4%Organic Revenue Growth 1% - 3% 0% - 2%Diluted EPS from Continuing Operations $1.04 - $1.12 $4.13 - $4.37 $4.15 - $4.35% F/(U) to 2012 Diluted EPS from Continuing Operations ** 2% - 10% 10% - 16% 12% - 18%
Operating Margins 16.5% - 16.9% 16.9% - 17.3%Tax Rate 28.5% - 29.5% 28.5% - 29.5%Restructuring $40 - $45M* $120 - $140M $120 - $135MShare Repurchases $500M+ $850M+
Full Year
2013 Guidance
$3.70
$4.25$0.32 $0.02 ($0.05) $0.03 $0.05
$0.18
2012 FYEPS Proforma**
Base, incl initiatives Acq/Div Restructuring Non-Operating
Taxes Shares 2013 FYEPS Fcst
* Note: Higher restructuring spend reduces operating margin 70 bps and EPS by $0.05 versus Q2 2012
SOLID GROWTH. STRONG RETURNS. BEST-IN-CLASS OPERATOR. 16
Q&A
SOLID GROWTH. STRONG RETURNS. BEST-IN-CLASS OPERATOR. 17
Appendix:
GAAP to Non-GAAP Reconciliations & Segment Tables

SOLID GROWTH. STRONG RETURNS. BEST-IN-CLASS OPERATOR.
The Company uses return on average invested capital (“ROIC”) to measure the effectiveness of its operations' use of invested capital to generate profits. Invested capital represents the net assets of the Company, excluding cash and equivalents and outstanding debt, which are excluded as they do not represent capital investment in the Company's operations. Average invested capital is calculated using balances at the start of the period and at the end of each quarter.
For further information on ROIC, see the Company’s annual report on Form 10-K for 2012.
18
AppendixReturn on Average Invested Capital
Note: Operating income and average invested capital have been adjusted to eliminate the impact of Decorative Surfaces * See slide 6 for the reconciliation from GAAP to non-GAAP measurements
$ in Millions Q1 2012 Q1 2013Operating income 652$ * 660$
Taxes: (29% for 2012 & 29% for 2013) (189) (191) Operating income after taxes 463$ 469$
Invested capital at end of period:Trade receivables 3,134$ 2,789$ Inventories 1,824 1,514 Net plant and equipment 2,100 1,960 Goodwill and intangible assets 7,889 7,574 Accounts payable and accrued expenses (2,219) (1,984) Net assets held for sale 299 232 Other, net 569 544
Invested capital 13,596 12,629
Adjustment for Decorative Surfaces (301) (170)
Total adjusted invested capital 13,295$ 12,459$ Average invested capital 12,926$ 12,562$
Return on average invested capital 14.3% 14.9%
SOLID GROWTH. STRONG RETURNS. BEST-IN-CLASS OPERATOR.
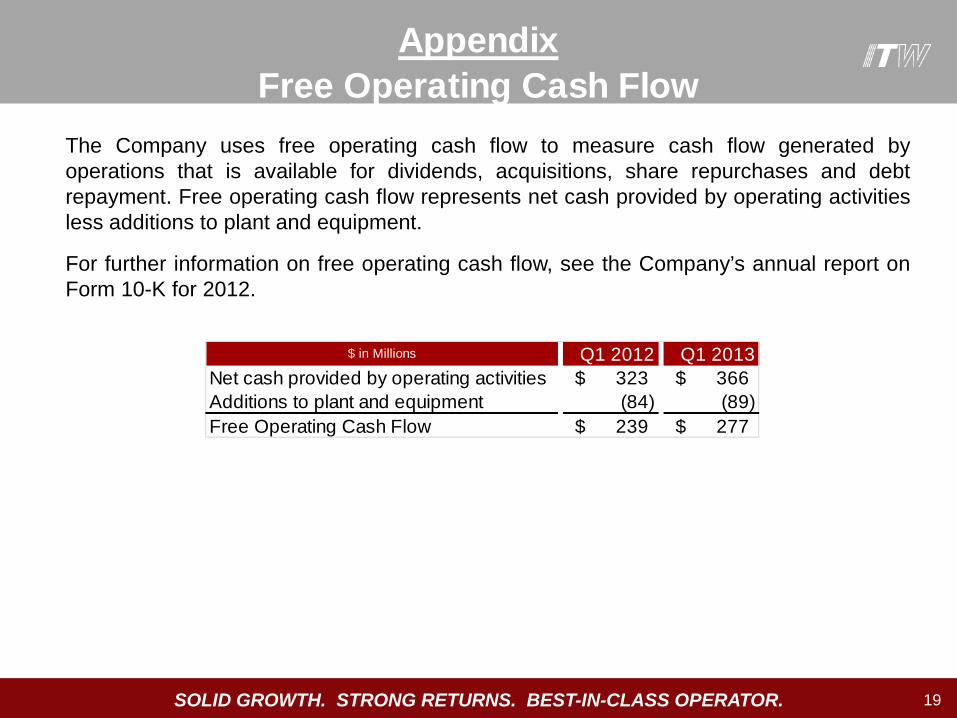
The Company uses free operating cash flow to measure cash flow generated by operations that is available for dividends, acquisitions, share repurchases and debt repayment. Free operating cash flow represents net cash provided by operating activities less additions to plant and equipment.
For further information on free operating cash flow, see the Company’s annual report on Form 10-K for 2012.
19
$ in Millions Q1 2012 Q1 2013Net cash provided by operating activities 323$ 366$ Additions to plant and equipment (84) (89) Free Operating Cash Flow 239$ 277$
AppendixFree Operating Cash Flow
SOLID GROWTH. STRONG RETURNS. BEST-IN-CLASS OPERATOR.
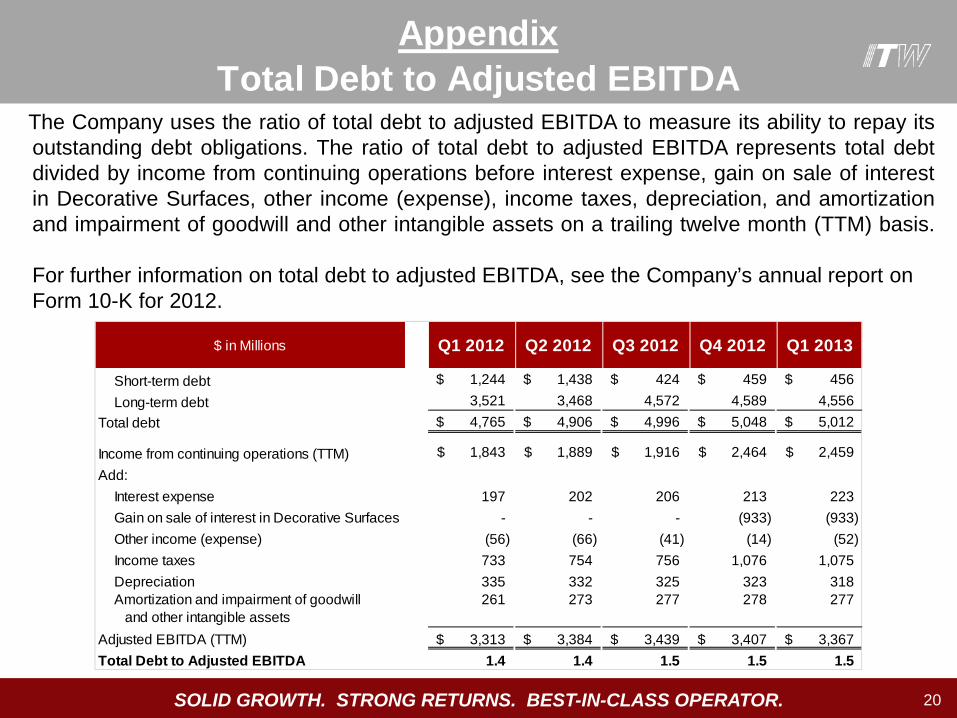
The Company uses the ratio of total debt to adjusted EBITDA to measure its ability to repay its outstanding debt obligations. The ratio of total debt to adjusted EBITDA represents total debt divided by income from continuing operations before interest expense, gain on sale of interest in Decorative Surfaces, other income (expense), income taxes, depreciation, and amortization and impairment of goodwill and other intangible assets on a trailing twelve month (TTM) basis.
For further information on total debt to adjusted EBITDA, see the Company’s annual report on Form 10-K for 2012.
20
$ in Millions Q1 2012 Q2 2012 Q3 2012 Q4 2012 Q1 2013
Short-term debt 1,244$ 1,438$ 424$ 459$ 456$ Long-term debt 3,521 3,468 4,572 4,589 4,556
Total debt 4,765$ 4,906$ 4,996$ 5,048$ 5,012$
Income from continuing operations (TTM) 1,843$ 1,889$ 1,916$ 2,464$ 2,459$ Add:
Interest expense 197 202 206 213 223 Gain on sale of interest in Decorative Surfaces - - - (933) (933) Other income (expense) (56) (66) (41) (14) (52) Income taxes 733 754 756 1,076 1,075 Depreciation 335 332 325 323 318 Amortization and impairment of goodwill and other intangible assets
261 273 277 278 277
Adjusted EBITDA (TTM) 3,313$ 3,384$ 3,439$ 3,407$ 3,367$ Total Debt to Adjusted EBITDA 1.4 1.4 1.5 1.5 1.5
Total Debt to Adjusted EBITDAAppendix

SOLID GROWTH. STRONG RETURNS. BEST-IN-CLASS OPERATOR. 21
Appendix2012 GAAP to Proforma
$ in Millions, except per share amounts Total Revenue
Operating Income
Diluted EPS
Total Revenue
Operating Income
Diluted EPS
Actual Results (GAAP) $4,358 $694 $0.95 $4,463 $758 $1.09
Decorative Surfaces operating results 275 42 0.06 286 48 0.07
Actual Results (Proforma) $4,083 $652 $0.89 $4,177 $710 $1.02
$ in Millions, except per share amounts Total Revenue
Operating Income
Diluted EPS
Total Revenue
Operating Income
Diluted EPS
Total Revenue
Operating Income
Diluted EPS
Actual Results (GAAP) $4,337 $752 $1.08 $4,066 $602 $2.11 $17,224 $2,806 $5.21
Decorative Surfaces net gain - - - - - 1.37 - - 1.34
Decorative Surfaces equity interest - - - - - (0.04) - - (0.04)
Decorative Surfaces operating results 267 41 0.06 93 12 0.01 921 143 0.21
Actual Results (Proforma) $4,070 $711 $1.02 $3,973 $590 $0.77 $16,303 $2,663 $3.70
2012 Full Year
Q1 2012 Q2 2012
Q3 2012 Q4 2012
SOLID GROWTH. STRONG RETURNS. BEST-IN-CLASS OPERATOR.
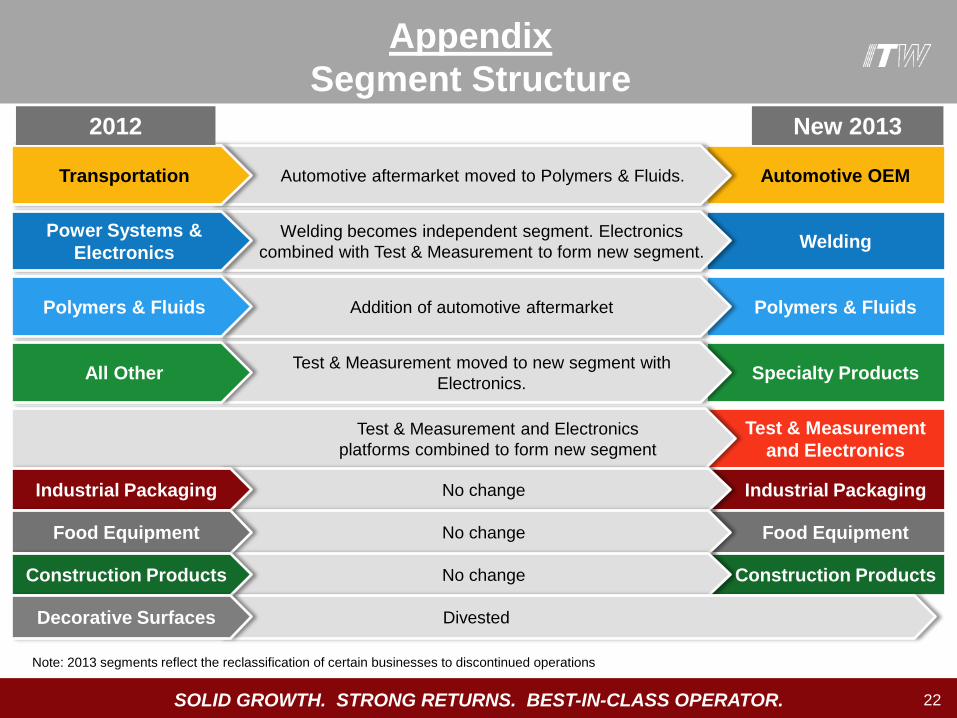
Appendix Segment Structure
22
Test & Measurement and Electronics
Automotive OEM
Welding
Polymers & Fluids
Specialty Products
Industrial Packaging
Food Equipment
Construction Products
Test & Measurement and Electronics platforms combined to form new segment
Automotive aftermarket moved to Polymers & Fluids.
Welding becomes independent segment. Electronics combined with Test & Measurement to form new segment.
Addition of automotive aftermarket
Test & Measurement moved to new segment with Electronics.
No change
No change
No change
Divested
Transportation
Power Systems & Electronics
Polymers & Fluids
All Other
Industrial Packaging
Food Equipment
Construction Products
Decorative Surfaces
2012 New 2013
Note: 2013 segments reflect the reclassification of certain businesses to discontinued operations
SOLID GROWTH. STRONG RETURNS. BEST-IN-CLASS OPERATOR. 23
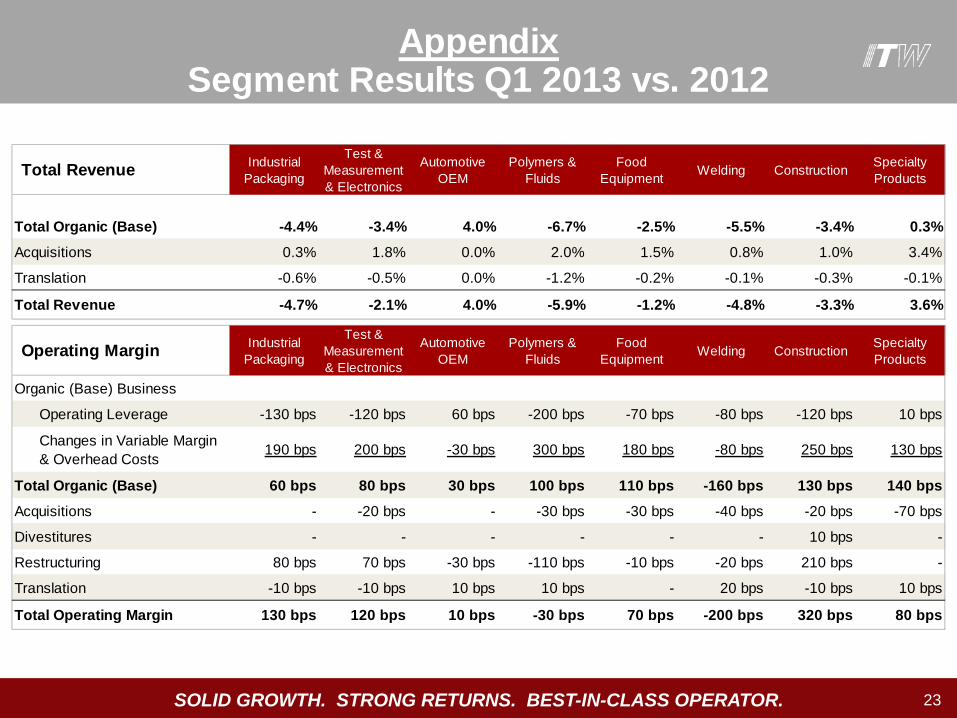
Segment Results Q1 2013 vs. 2012Appendix
Total Revenue Industrial Packaging
Test & Measurement & Electronics
Automotive OEM
Polymers & Fluids
Food Equipment Welding Construction Specialty
Products
Total Organic (Base) -4.4% -3.4% 4.0% -6.7% -2.5% -5.5% -3.4% 0.3%
Acquisitions 0.3% 1.8% 0.0% 2.0% 1.5% 0.8% 1.0% 3.4%
Translation -0.6% -0.5% 0.0% -1.2% -0.2% -0.1% -0.3% -0.1%
Total Revenue -4.7% -2.1% 4.0% -5.9% -1.2% -4.8% -3.3% 3.6%
Operating Margin Industrial Packaging
Test & Measurement & Electronics
Automotive OEM
Polymers & Fluids
Food Equipment Welding Construction Specialty
Products
Organic (Base) Business
Operating Leverage -130 bps -120 bps 60 bps -200 bps -70 bps -80 bps -120 bps 10 bps
Changes in Variable Margin & Overhead Costs
190 bps 200 bps -30 bps 300 bps 180 bps -80 bps 250 bps 130 bps
Total Organic (Base) 60 bps 80 bps 30 bps 100 bps 110 bps -160 bps 130 bps 140 bps
Acquisitions - -20 bps - -30 bps -30 bps -40 bps -20 bps -70 bps
Divestitures - - - - - - 10 bps -
Restructuring 80 bps 70 bps -30 bps -110 bps -10 bps -20 bps 210 bps -
Translation -10 bps -10 bps 10 bps 10 bps - 20 bps -10 bps 10 bps
Total Operating Margin 130 bps 120 bps 10 bps -30 bps 70 bps -200 bps 320 bps 80 bps
SOLID GROWTH. STRONG RETURNS. BEST-IN-CLASS OPERATOR. 24
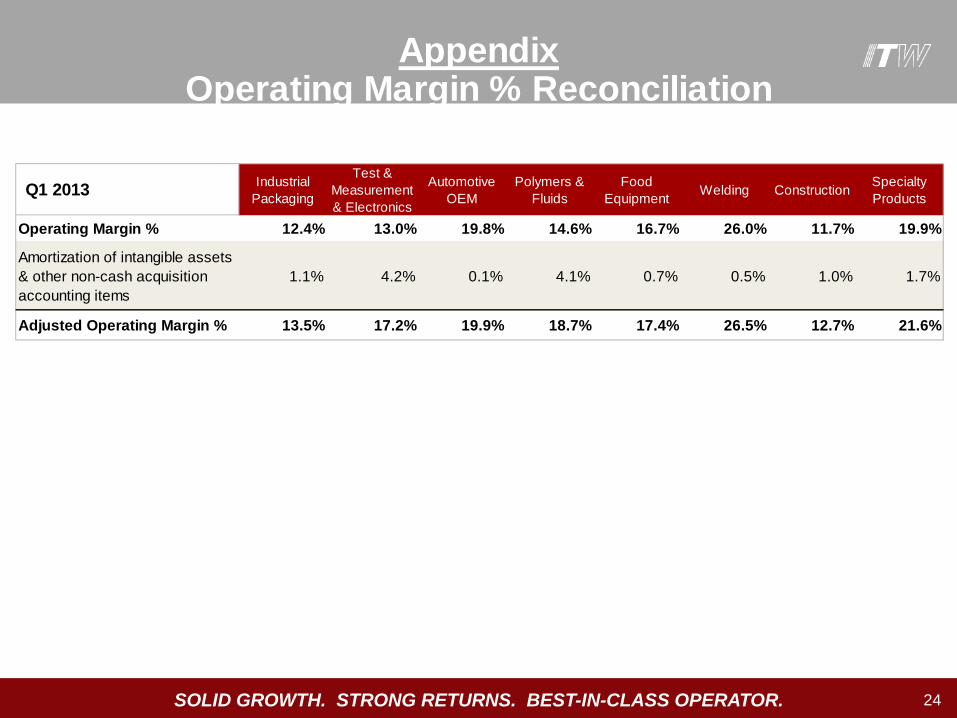
Operating Margin % ReconciliationAppendix
Q1 2013 Industrial Packaging
Test & Measurement & Electronics
Automotive OEM
Polymers & Fluids
Food Equipment Welding Construction Specialty
Products
Operating Margin % 12.4% 13.0% 19.8% 14.6% 16.7% 26.0% 11.7% 19.9%
Amortization of intangible assets & other non-cash acquisition accounting items
1.1% 4.2% 0.1% 4.1% 0.7% 0.5% 1.0% 1.7%
Adjusted Operating Margin % 13.5% 17.2% 19.9% 18.7% 17.4% 26.5% 12.7% 21.6%
SOLID GROWTH. STRONG RETURNS. BEST-IN-CLASS OPERATOR. 25
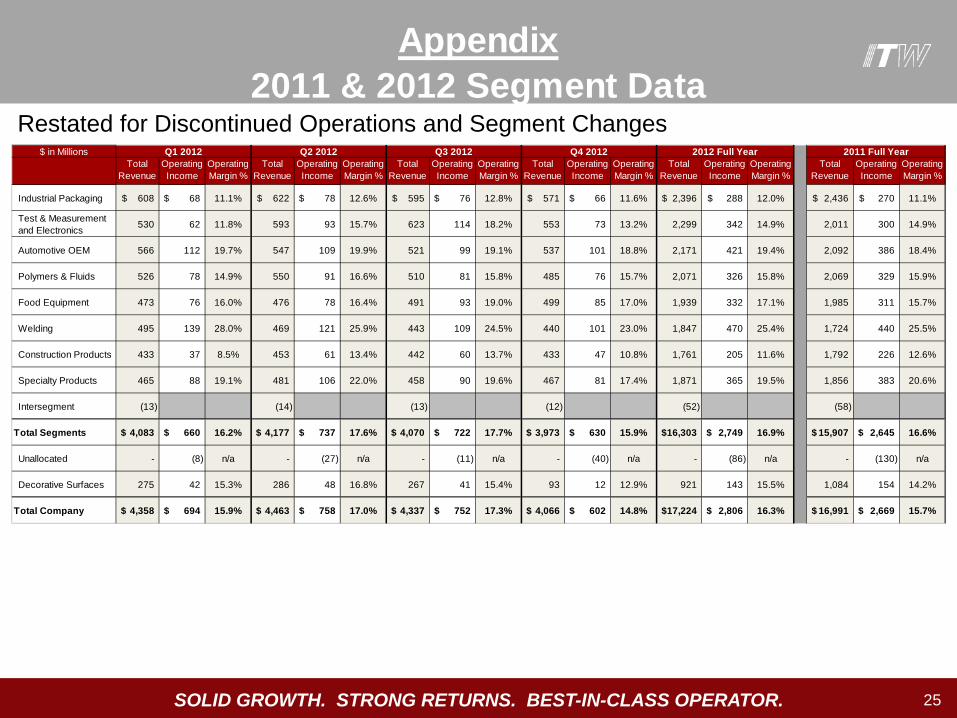
Appendix2011 & 2012 Segment Data
$ in MillionsTotal
RevenueOperatingIncome
Operating Margin %
Total Revenue
OperatingIncome
Operating Margin %
Total Revenue
OperatingIncome
Operating Margin %
Total Revenue
OperatingIncome
Operating Margin %
Total Revenue
OperatingIncome
Operating Margin %
Total Revenue
OperatingIncome
Operating Margin %
Industrial Packaging 608$ 68$ 11.1% 622$ 78$ 12.6% 595$ 76$ 12.8% 571$ 66$ 11.6% 2,396$ 288$ 12.0% 2,436$ 270$ 11.1%
Test & Measurement and Electronics 530 62 11.8% 593 93 15.7% 623 114 18.2% 553 73 13.2% 2,299 342 14.9% 2,011 300 14.9%
Automotive OEM 566 112 19.7% 547 109 19.9% 521 99 19.1% 537 101 18.8% 2,171 421 19.4% 2,092 386 18.4%
Polymers & Fluids 526 78 14.9% 550 91 16.6% 510 81 15.8% 485 76 15.7% 2,071 326 15.8% 2,069 329 15.9%
Food Equipment 473 76 16.0% 476 78 16.4% 491 93 19.0% 499 85 17.0% 1,939 332 17.1% 1,985 311 15.7%
Welding 495 139 28.0% 469 121 25.9% 443 109 24.5% 440 101 23.0% 1,847 470 25.4% 1,724 440 25.5%
Construction Products 433 37 8.5% 453 61 13.4% 442 60 13.7% 433 47 10.8% 1,761 205 11.6% 1,792 226 12.6%
Specialty Products 465 88 19.1% 481 106 22.0% 458 90 19.6% 467 81 17.4% 1,871 365 19.5% 1,856 383 20.6%
Intersegment (13) (14) (13) (12) (52) (58)
Total Segments 4,083$ 660$ 16.2% 4,177$ 737$ 17.6% 4,070$ 722$ 17.7% 3,973$ 630$ 15.9% 16,303$ 2,749$ 16.9% 15,907$ 2,645$ 16.6%
Unallocated - (8) n/a - (27) n/a - (11) n/a - (40) n/a - (86) n/a - (130) n/a
Decorative Surfaces 275 42 15.3% 286 48 16.8% 267 41 15.4% 93 12 12.9% 921 143 15.5% 1,084 154 14.2%
Total Company 4,358$ 694$ 15.9% 4,463$ 758$ 17.0% 4,337$ 752$ 17.3% 4,066$ 602$ 14.8% 17,224$ 2,806$ 16.3% 16,991$ 2,669$ 15.7%
Q4 2012 2012 Full Year 2011 Full YearQ1 2012 Q2 2012 Q3 2012
Restated for Discontinued Operations and Segment Changes
Recommended