Embed Size (px)
Citation preview

The Places We Go
ILLINOIS TOOL WORKS INC.
ITW Annual Report 2005
*
Short lead-time plastic
and metal components and
fasteners, and specialty
products such as adhesives,
fluid products and
resealable packaging
Buildex, CIP, Deltar, Devcon,
Drawform, Fastex, Fibre
Glass-Evercoat, ITW Brands,
Minigrip/Zip-Pak, Paslode,
Permatex, Ramset/Red
Head, Shakeproof,TACC,
Texwipe, Truswal, Valeron,
Wilsonart and Wynn’s
Construction, automotive
and general industrial
Short lead-time plastic
and metal components and
fasteners, and specialty
products such as fluid
products and electronic
component packaging
Bailly Comte, Buildex, Deltar,
Fastex, Ispra, James Briggs,
Krafft, Meritex, Novadan,
Paslode, Pryda, Ramset,
Resopal, Rocol, Shakeproof,
SPIT, Wilsonart and Wynn’s
Construction, automotive
and general industrial
Longer lead-time machinery
and related consumables,
and specialty equipment for
applications such as food
service, industrial finishing
and materials testing
Acme Packaging,
Angleboard, DeVilbiss,
Hi-Cone, Hobart, Instron,
ITW Foils, Miller,
Ransburg, Signode,
Unipac and Vulcan
Food institutional and
retail, general industrial,
construction, and food
and beverage
Longer lead-time machinery
and related consumables,
and specialty equipment for
applications such as food
service and materials testing
DeVilbiss, Elga, Foster,
Gema, Hi-Cone, Hobart,
Instron, ITW Foils, Mima,
Orgapack,Ransburg,
Signode, Simco, Strapex
and Tien Tai
General industrial, food
institutional and retail,
and food and beverage
PRODUCTCATEGORIES
MAJORBUSINESSES
PRIMARYEND MARKETS
ENGINEERED PRODUCTSNORTH AMERICA
ENGINEERED PRODUCTSINTERNATIONAL
SPECIALTY SYSTEMS NORTH AMERICA
SPECIALTY SYSTEMS INTERNATIONAL
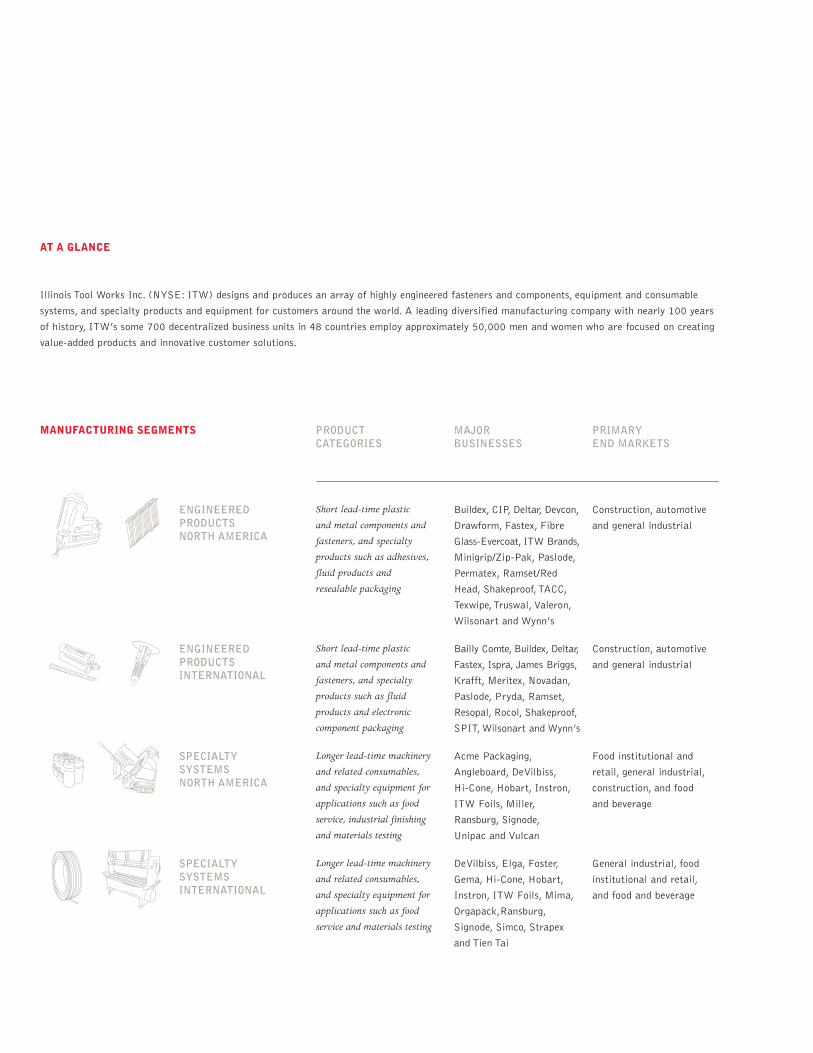
AT A GLANCE
Illinois Tool Works Inc. (NYSE: ITW) designs and produces an array of highly engineered fasteners and components, equipment and consumable
systems, and specialty products and equipment for customers around the world. A leading diversified manufacturing company with nearly 100 years
of history, ITW’s some 700 decentralized business units in 48 countries employ approximately 50,000 men and women who are focused on creating
value-added products and innovative customer solutions.
MANUFACTURING SEGMENTS
ILLINOIS TOOL WORKS INC. 1
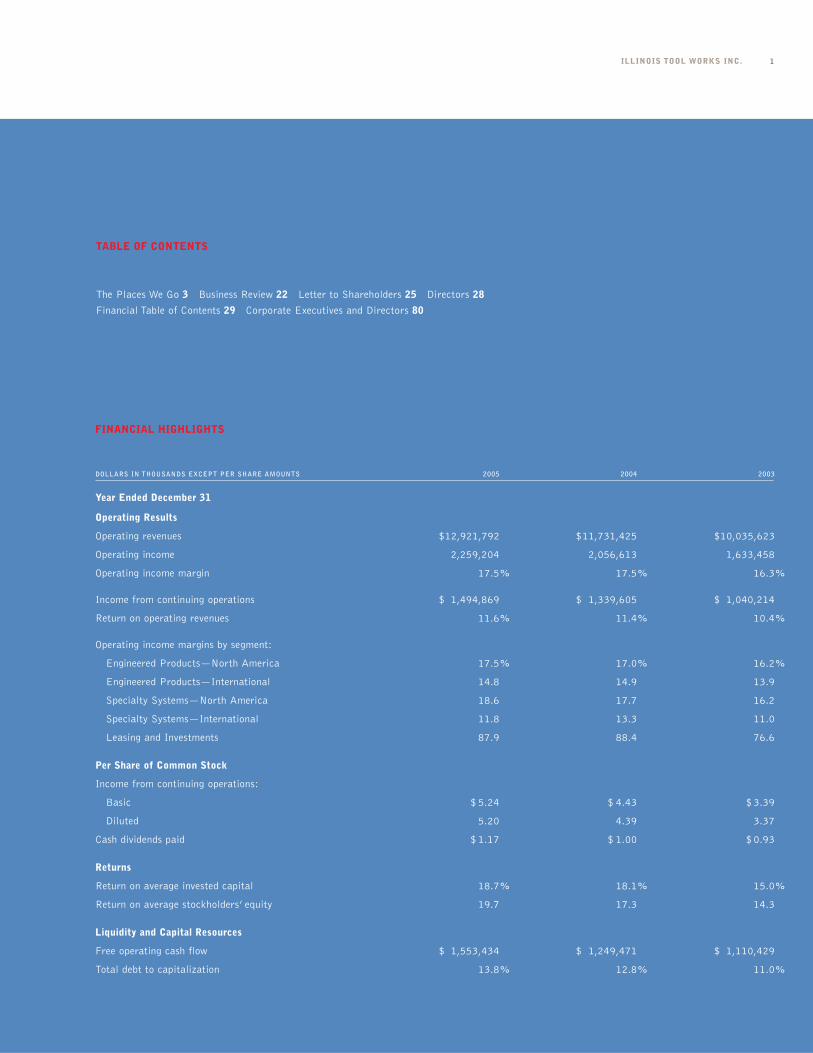
DOLLARS IN THOUSANDS EXCEPT PER SHARE AMOUNTS 2005 2004 2003
Year Ended December 31
Operating Results
Operating revenues $12,921,792 $11,731,425 $10,035,623
Operating income 2,259,204 2,056,613 1,633,458
Operating income margin 17.5% 17.5% 16.3%
Income from continuing operations $ 1,494,869 $ 1,339,605 $ 1,040,214
Return on operating revenues 11.6% 11.4% 10.4%
Operating income margins by segment:
Engineered Products—North America 17.5% 17.0% 16.2%
Engineered Products—International 14.8 14.9 13.9
Specialty Systems—North America 18.6 17.7 16.2
Specialty Systems—International 11.8 13.3 11.0
Leasing and Investments 87.9 88.4 76.6
Per Share of Common Stock
Income from continuing operations:
Basic $ 5.24 $ 4.43 $ 3.39
Diluted 5.20 4.39 3.37
Cash dividends paid $ 1.17 $ 1.00 $ 0.93
Returns
Return on average invested capital 18.7% 18.1% 15.0%
Return on average stockholders’ equity 19.7 17.3 14.3
Liquidity and Capital Resources
Free operating cash flow $ 1,553,434 $ 1,249,471 $ 1,110,429
Total debt to capitalization 13.8% 12.8% 11.0%
FINANCIAL HIGHLIGHTS
TABLE OF CONTENTS
The Places We Go 3 Business Review 22 Letter to Shareholders 25 Directors 28
Financial Table of Contents 29 Corporate Executives and Directors 80

2005 ANNUAL REPORT2
RR
ILLINOIS TOOL WORKS INC. 3
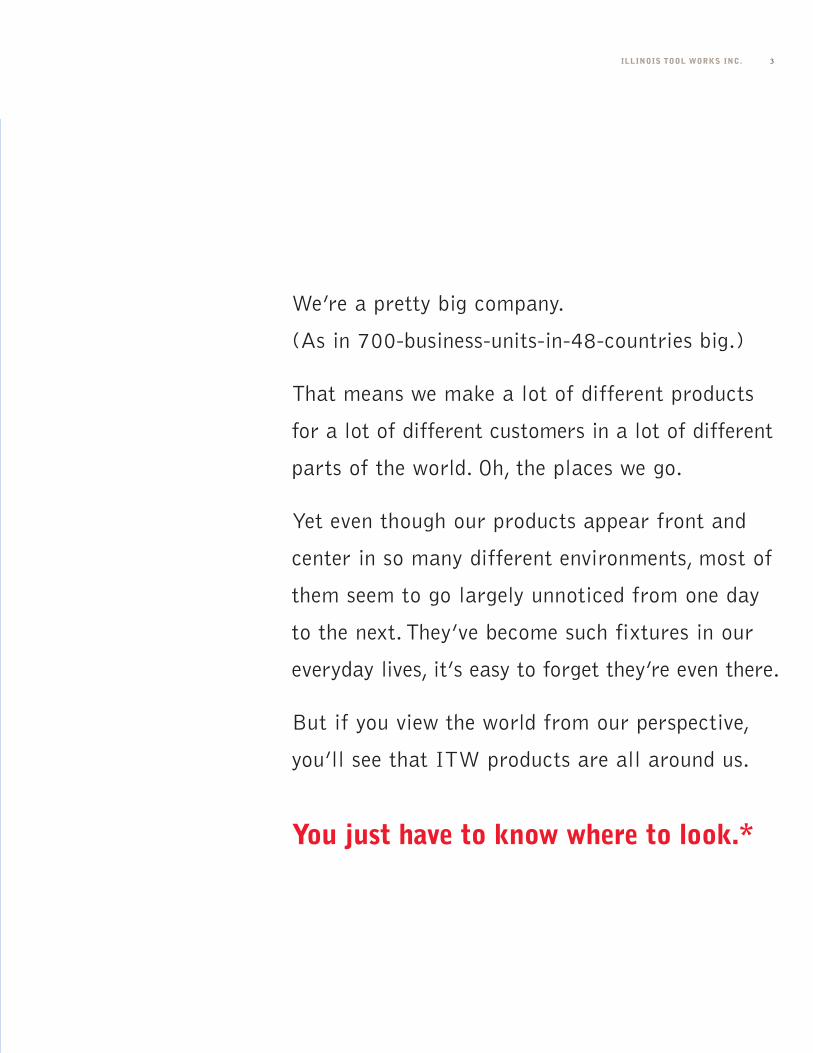
We’re a pretty big company.
(As in 700-business-units-in-48-countries big.)
That means we make a lot of different products
for a lot of different customers in a lot of different
parts of the world. Oh, the places we go.
Yet even though our products appear front and
center in so many different environments, most of
them seem to go largely unnoticed from one day
to the next. They’ve become such fixtures in our
everyday lives, it’s easy to forget they’re even there.
But if you view the world from our perspective,
you’ll see that ITW products are all around us.
You just have to know where to look.*
2005 ANNUAL REPORT4
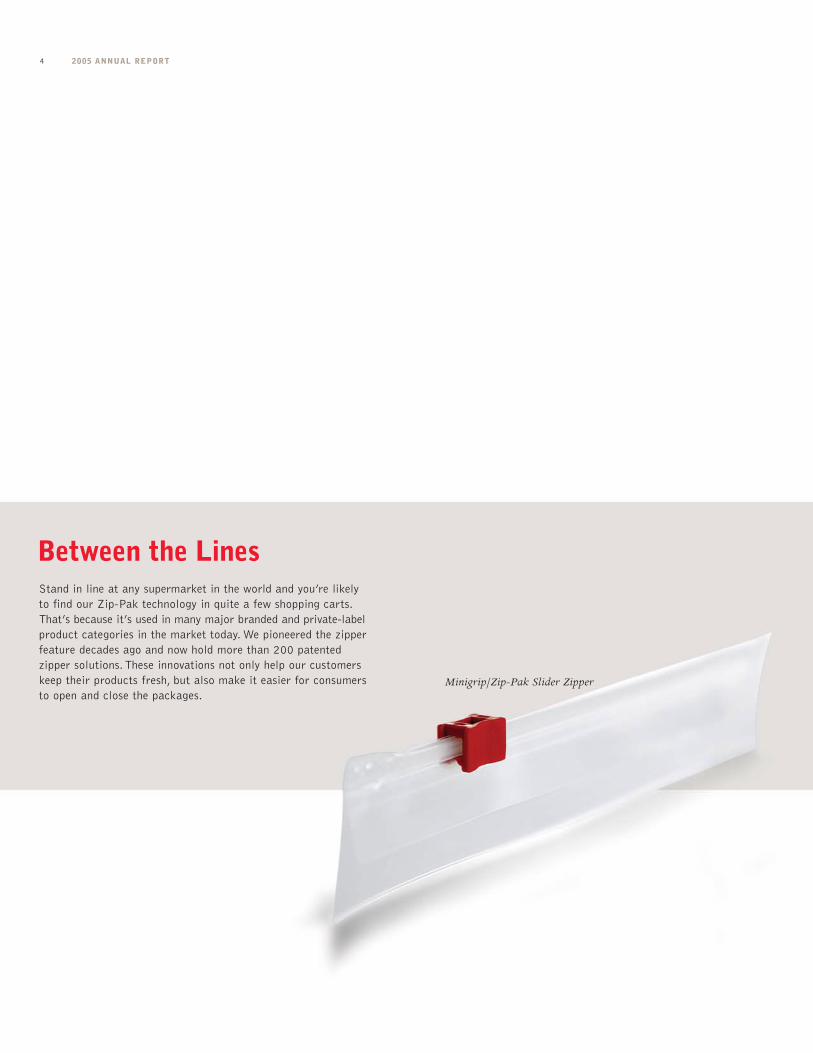
Stand in line at any supermarket in the world and you’re likelyto find our Zip-Pak technology in quite a few shopping carts.That’s because it’s used in many major branded and private-labelproduct categories in the market today. We pioneered the zipperfeature decades ago and now hold more than 200 patentedzipper solutions. These innovations not only help our customerskeep their products fresh, but also make it easier for consumersto open and close the packages.
Between the Lines
Minigrip/Zip-Pak Slider Zipper

ILLINOIS TOOL WORKS INC. 5
*
2005 ANNUAL REPORT6
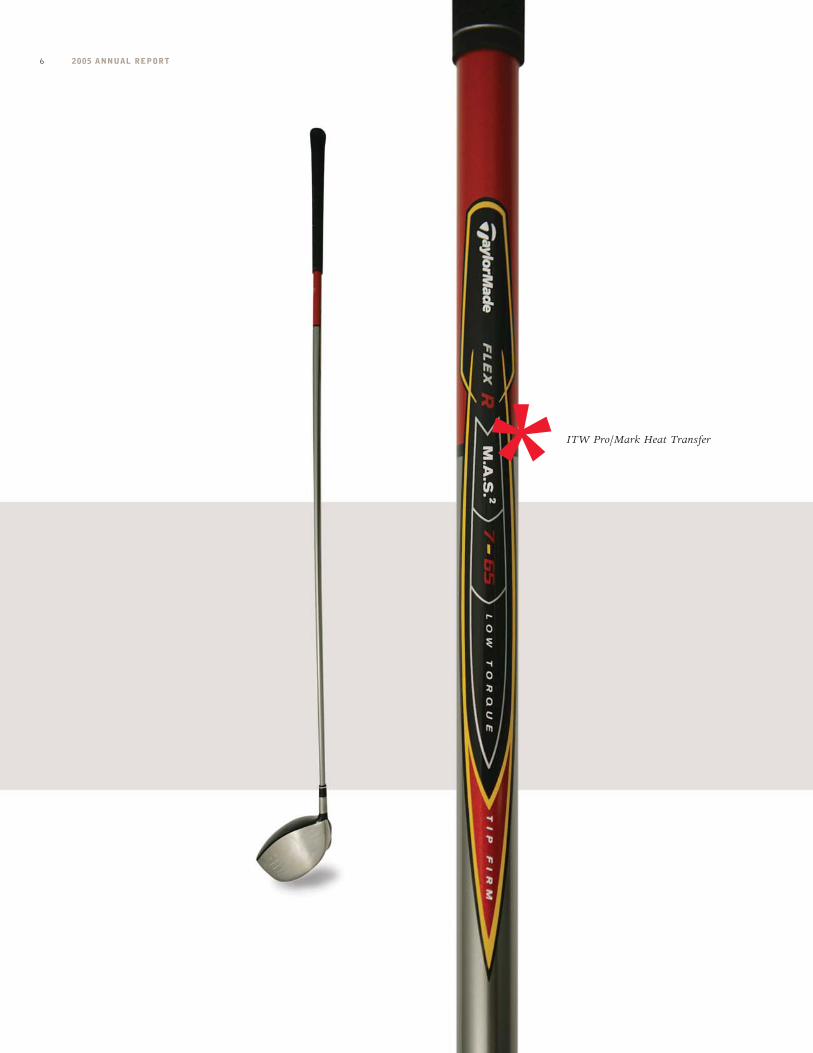
ITW Pro/Mark Heat Transfer*
ILLINOIS TOOL WORKS INC. 7
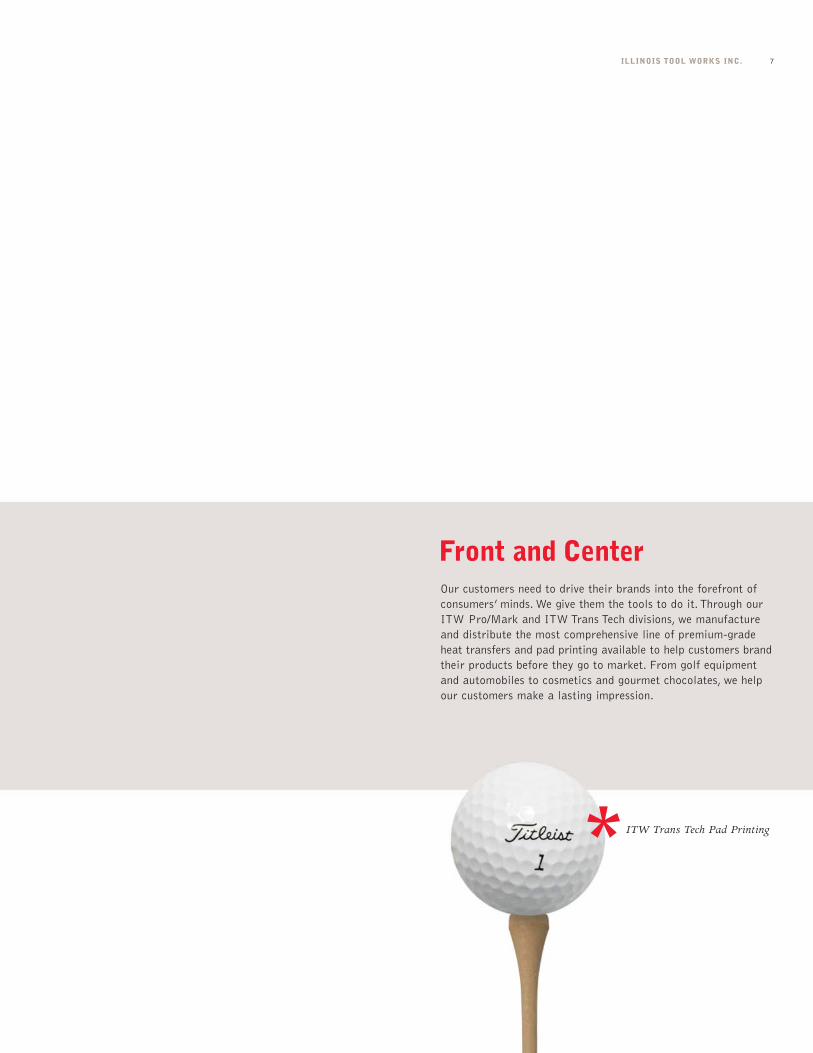
ITW Trans Tech Pad Printing*
Our customers need to drive their brands into the forefront ofconsumers’ minds. We give them the tools to do it. Through ourITW Pro/Mark and ITW Trans Tech divisions, we manufactureand distribute the most comprehensive line of premium-gradeheat transfers and pad printing available to help customers brandtheir products before they go to market. From golf equipmentand automobiles to cosmetics and gourmet chocolates, we helpour customers make a lasting impression.
Front and Center
2005 ANNUAL REPORT8
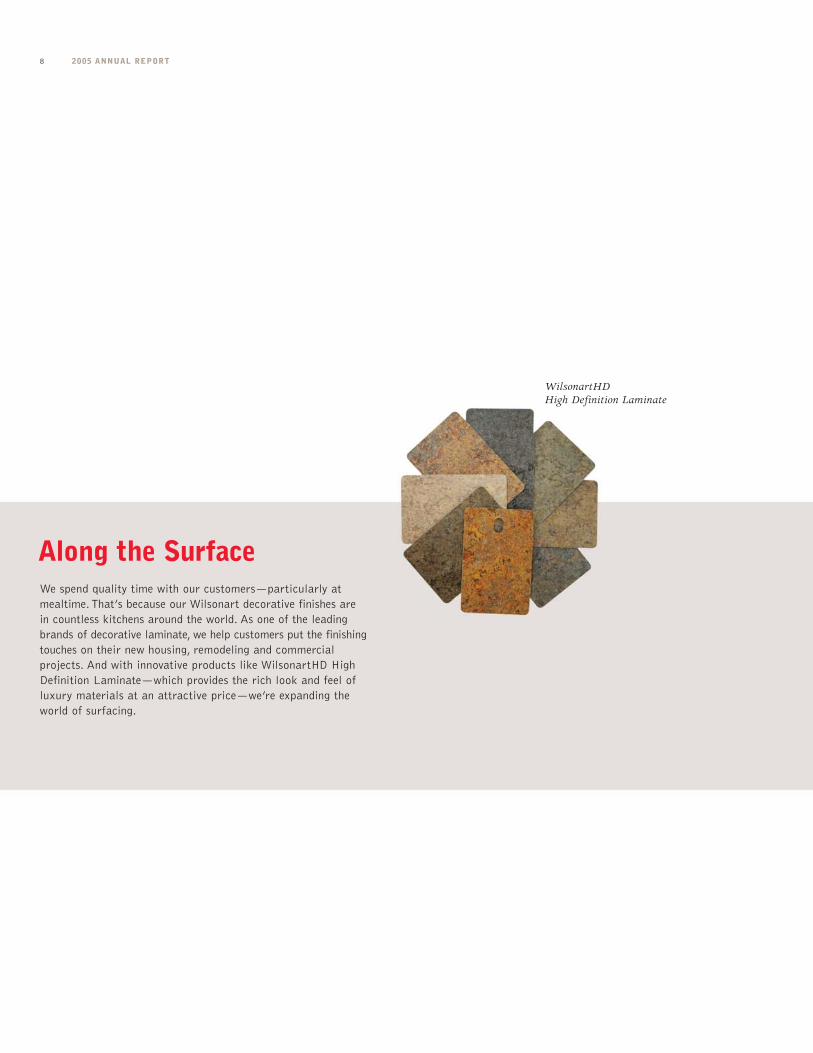
WilsonartHD High Definition Laminate
We spend quality time with our customers—particularly atmealtime. That’s because our Wilsonart decorative finishes are in countless kitchens around the world. As one of the leadingbrands of decorative laminate, we help customers put the finishingtouches on their new housing, remodeling and commercialprojects. And with innovative products like WilsonartHD HighDefinition Laminate—which provides the rich look and feel ofluxury materials at an attractive price—we’re expanding theworld of surfacing.
Along the Surface

ILLINOIS TOOL WORKS INC. 9
*

2005 ANNUAL REPORT10
*

ILLINOIS TOOL WORKS INC. 11
Wynn’s Fuel Treatment
We go on quite a few road trips with our customers, thanks toour trusted Wynn’s business. As a global leader in maintenanceand appearance products for the specialty automotiveaftermarket, Wynn’s provides a full range of products to helppower and maintain all kinds of vehicles. From brake fluids andradiator sealants to transmission flush machines and enginecleaning systems, we keep our customers rolling right along.
On the Open Road

2005 ANNUAL REPORT12
*
ILLINOIS TOOL WORKS INC. 13
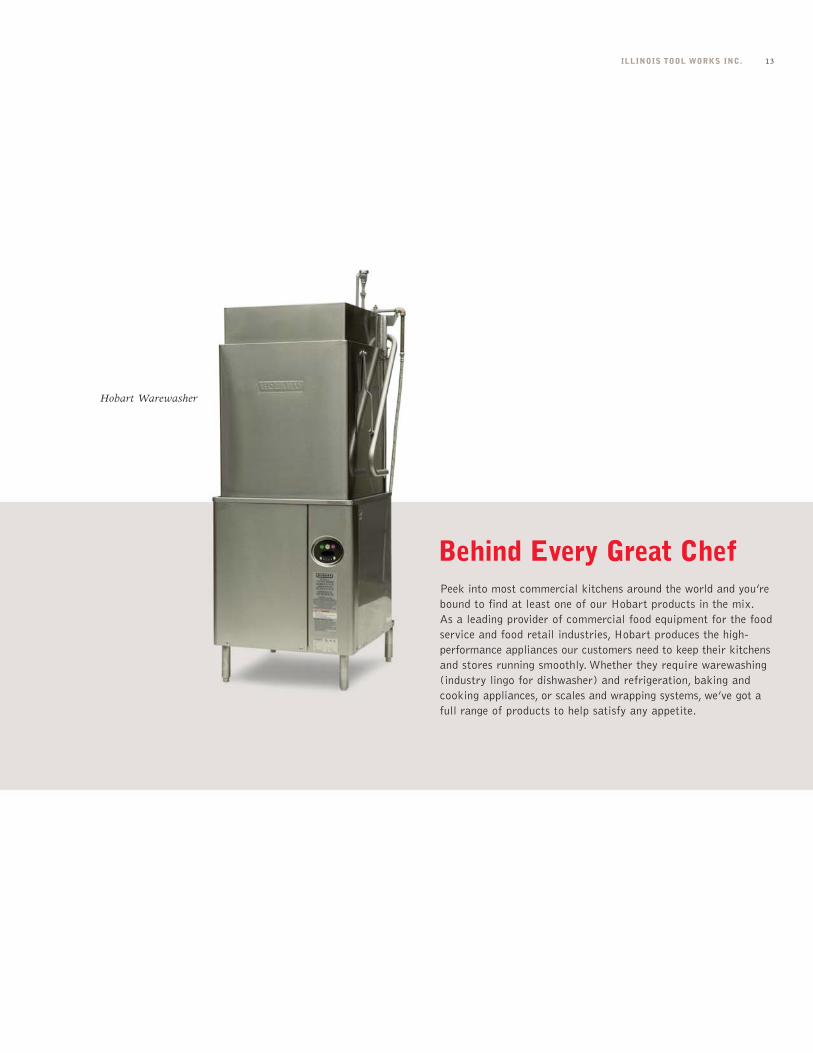
Hobart Warewasher
Peek into most commercial kitchens around the world and you’rebound to find at least one of our Hobart products in the mix.As a leading provider of commercial food equipment for the foodservice and food retail industries, Hobart produces the high-performance appliances our customers need to keep their kitchensand stores running smoothly. Whether they require warewashing(industry lingo for dishwasher) and refrigeration, baking andcooking appliances, or scales and wrapping systems, we’ve got afull range of products to help satisfy any appetite.
Behind Every Great Chef
2005 ANNUAL REPORT14
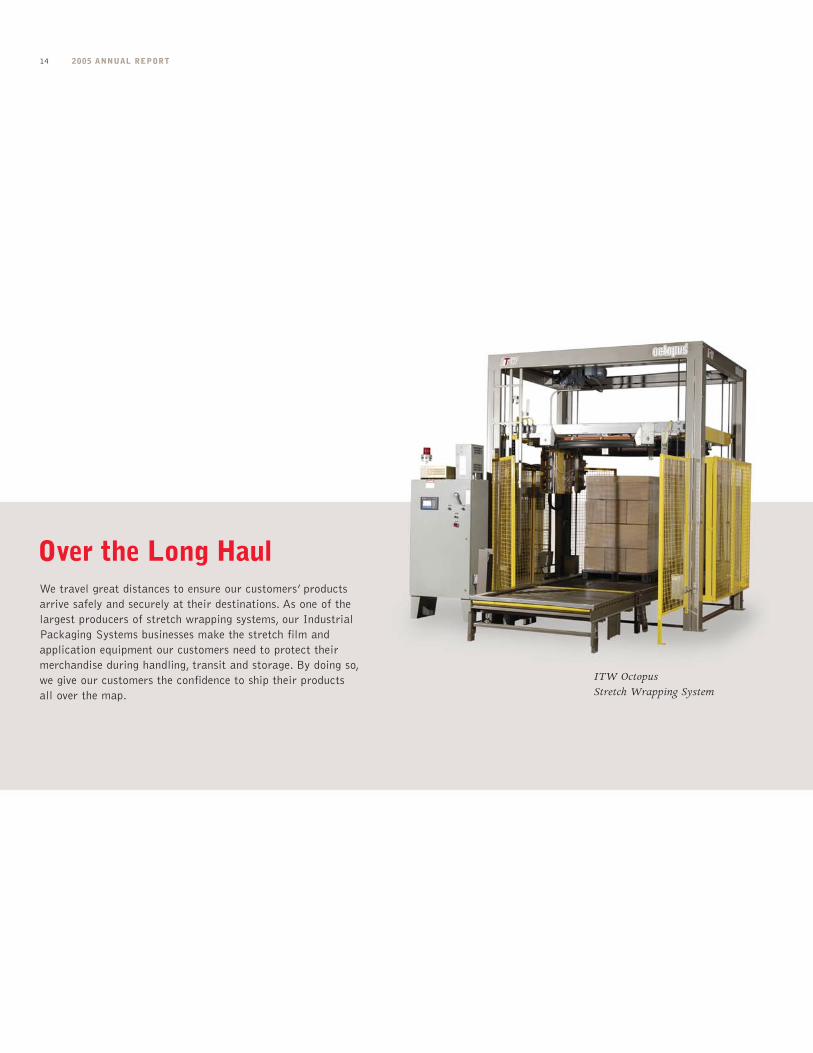
ITW OctopusStretch Wrapping System
We travel great distances to ensure our customers’ productsarrive safely and securely at their destinations. As one of thelargest producers of stretch wrapping systems, our IndustrialPackaging Systems businesses make the stretch film andapplication equipment our customers need to protect theirmerchandise during handling, transit and storage. By doing so,we give our customers the confidence to ship their products all over the map.
Over the Long Haul

ILLINOIS TOOL WORKS INC. 15
*
2005 ANNUAL REPORT16
*
ILLINOIS TOOL WORKS INC. 17
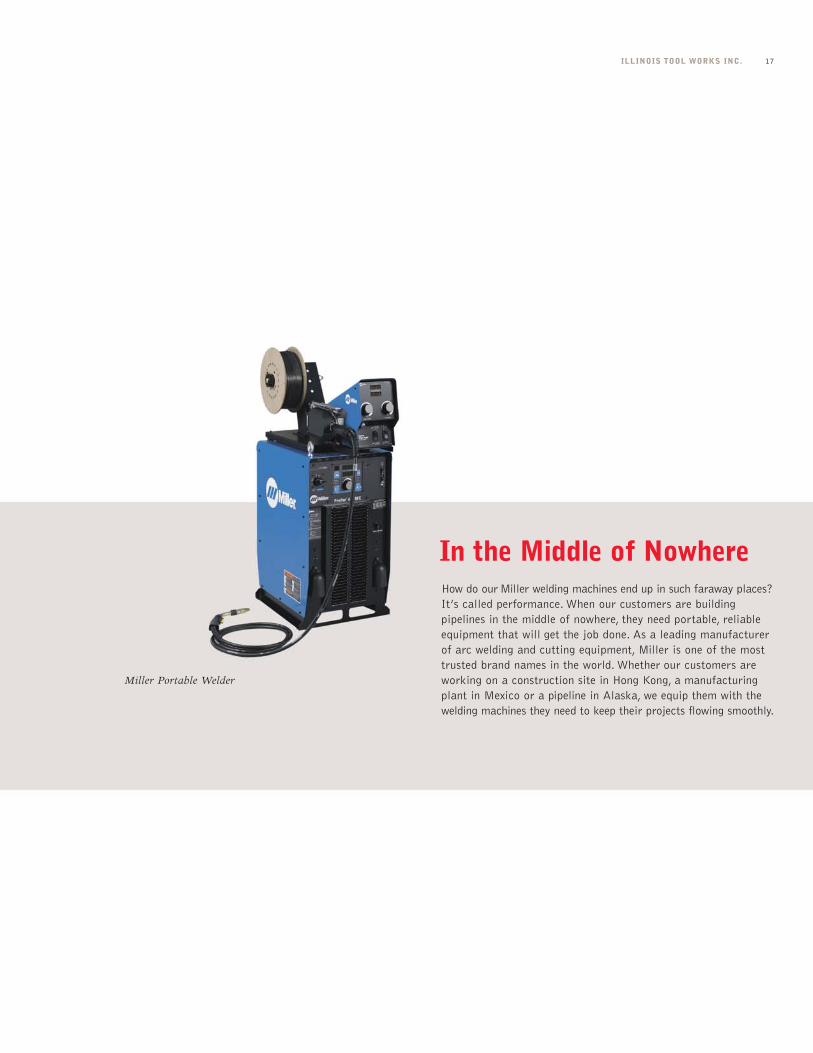
Miller Portable Welder
How do our Miller welding machines end up in such faraway places?It’s called performance. When our customers are buildingpipelines in the middle of nowhere, they need portable, reliableequipment that will get the job done. As a leading manufacturerof arc welding and cutting equipment, Miller is one of the mosttrusted brand names in the world. Whether our customers areworking on a construction site in Hong Kong, a manufacturingplant in Mexico or a pipeline in Alaska, we equip them with thewelding machines they need to keep their projects flowing smoothly.
In the Middle of Nowhere
2005 ANNUAL REPORT18
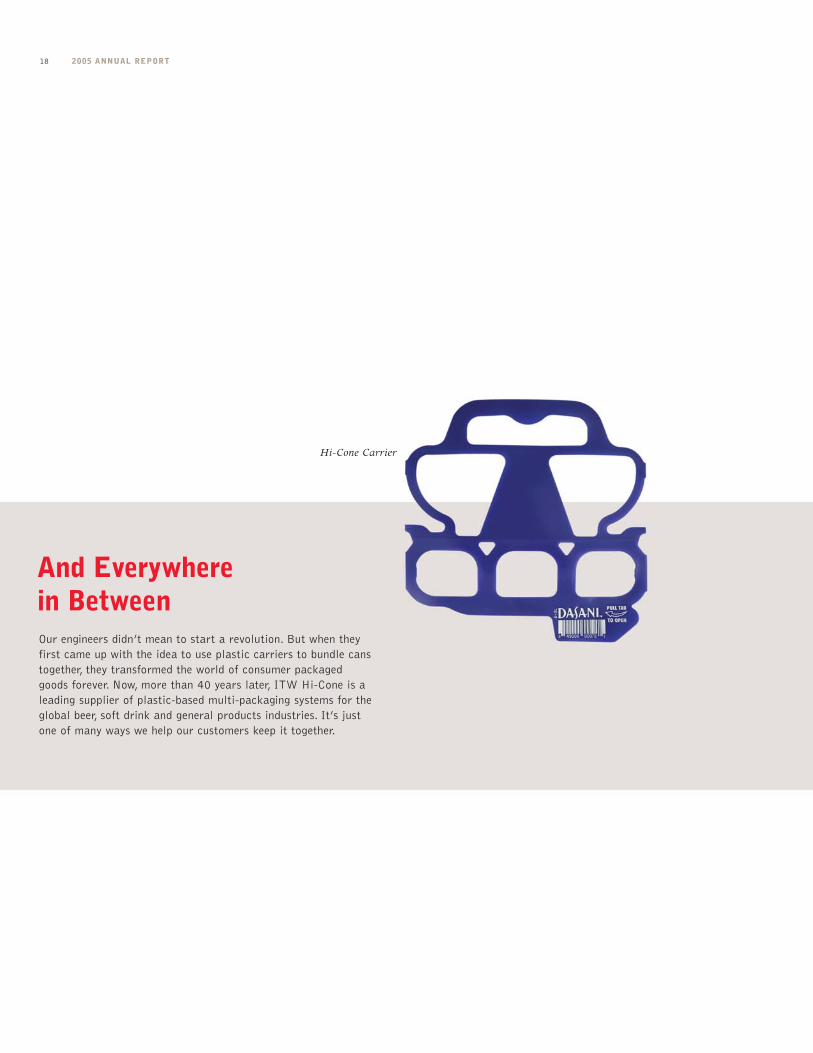
Hi-Cone Carrier
Our engineers didn’t mean to start a revolution. But when theyfirst came up with the idea to use plastic carriers to bundle canstogether, they transformed the world of consumer packagedgoods forever. Now, more than 40 years later, ITW Hi-Cone is aleading supplier of plastic-based multi-packaging systems for theglobal beer, soft drink and general products industries. It’s justone of many ways we help our customers keep it together.
And Everywhere in Between

ILLINOIS TOOL WORKS INC. 19
*

2005 ANNUAL REPORT20
While our products can be found in countless places, it’s our people
who take them there—every day and in every part of the world.
Our people understand the importance of their work. Not only do
ITW products play an integral role in our customers’ lives, they help
them achieve their visions.

ILLINOIS TOOL WORKS INC. 21
They invent. Research. Design.Test. Produce. Market. Distribute.
And then, without even batting an eyelash, they start all over again.
2005 ANNUAL REPORT22
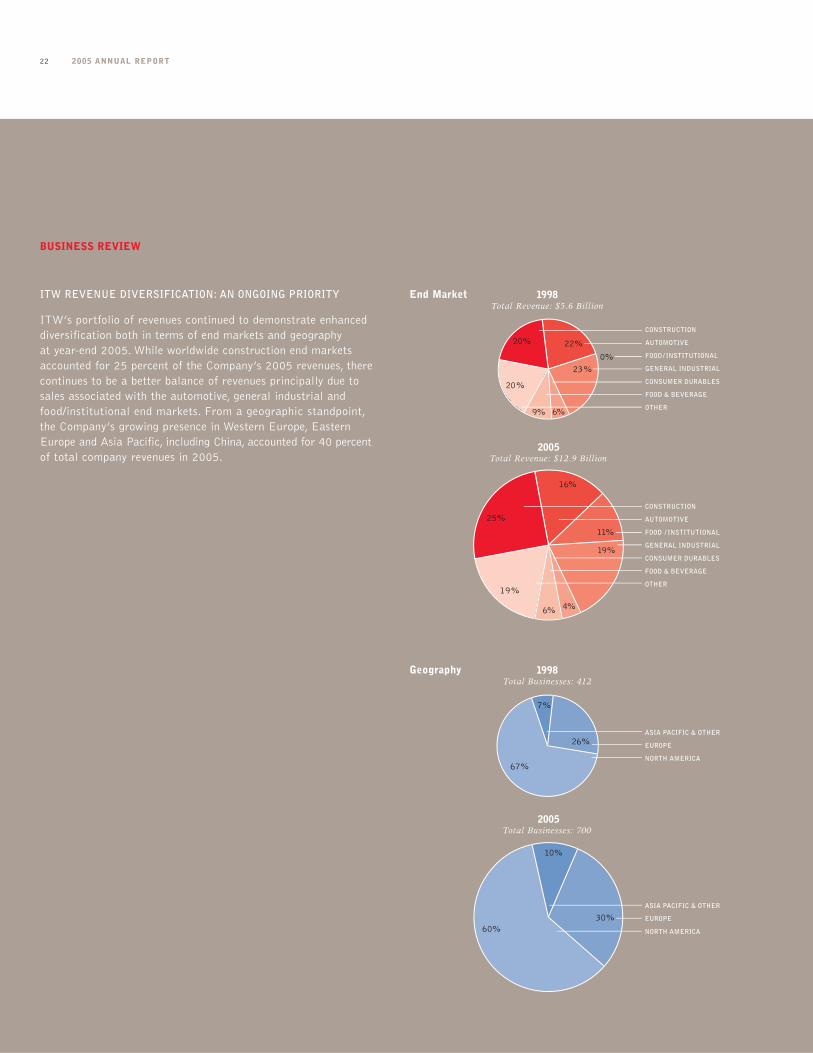
ITW REVENUE DIVERSIFICATION: AN ONGOING PRIORITY
ITW’s portfolio of revenues continued to demonstrate enhanceddiversification both in terms of end markets and geography at year-end 2005. While worldwide construction end marketsaccounted for 25 percent of the Company’s 2005 revenues, therecontinues to be a better balance of revenues principally due tosales associated with the automotive, general industrial andfood/institutional end markets. From a geographic standpoint,the Company’s growing presence in Western Europe, EasternEurope and Asia Pacific, including China, accounted for 40 percentof total company revenues in 2005.
2005Total Businesses: 700
ASIA PACIFIC & OTHER
EUROPE
NORTH AMERICA
30%
10%
60%
1998Total Businesses: 412
7%
26%
67%
ASIA PACIFIC & OTHER
EUROPE
NORTH AMERICA
End Market
Geography
25%
16%
6%
19%
CONSTRUCTION
AUTOMOTIVE
FOOD / INSTITUTIONAL
GENERAL INDUSTRIAL
CONSUMER DURABLES
FOOD & BEVERAGE
OTHER
4%
2005Total Revenue: $12.9 Billion
19%
11%
CONSTRUCTION
AUTOMOTIVE
FOOD / INSTITUTIONAL
GENERAL INDUSTRIAL
CONSUMER DURABLES
FOOD & BEVERAGE
OTHER
1998Total Revenue: $5.6 Billion
23%
9%
20%
6%
22%
20%
0%
BUSINESS REVIEW
ILLINOIS TOOL WORKS INC. 23
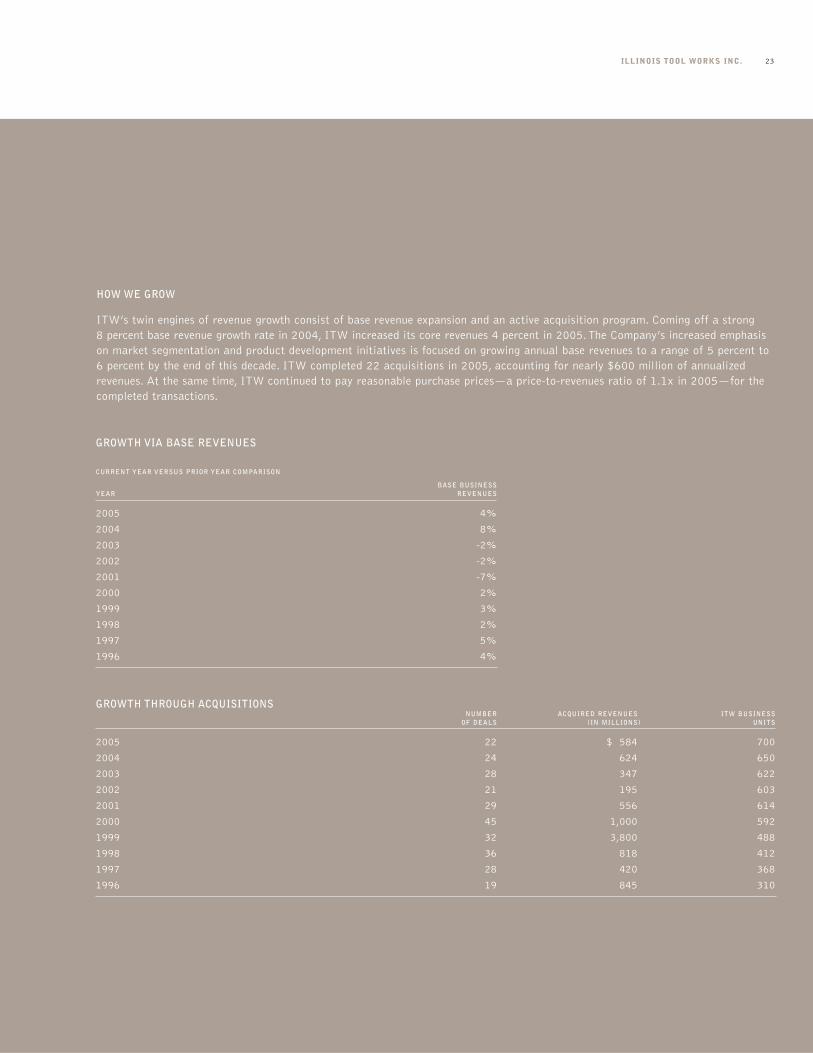
GROWTH VIA BASE REVENUES
CURRENT YEAR VERSUS PRIOR YEAR COMPARISON
BASE BUSINESS YEAR REVENUES
2005 4%
2004 8%
2003 -2%
2002 -2%
2001 -7%
2000 2%
1999 3%
1998 2%
1997 5%
1996 4%
HOW WE GROW
ITW’s twin engines of revenue growth consist of base revenue expansion and an active acquisition program. Coming off a strong 8 percent base revenue growth rate in 2004, ITW increased its core revenues 4 percent in 2005. The Company’s increased emphasison market segmentation and product development initiatives is focused on growing annual base revenues to a range of 5 percent to6 percent by the end of this decade. ITW completed 22 acquisitions in 2005, accounting for nearly $600 million of annualizedrevenues. At the same time, ITW continued to pay reasonable purchase prices—a price-to-revenues ratio of 1.1x in 2005—for thecompleted transactions.
GROWTH THROUGH ACQUISITIONSNUMBER ACQUIRED REVENUES ITW BUSINESS
OF DEALS (IN MILLIONS) UNITS
2005 22 $ 584 700
2004 24 624 650
2003 28 347 622
2002 21 195 603
2001 29 556 614
2000 45 1,000 592
1999 32 3,800 488
1998 36 818 412
1997 28 420 368
1996 19 845 310
2005 ANNUAL REPORT24
RE
VE
NU
E (
IN M
ILL
ION
S)
OP
ER
AT
ING
IN
CO
ME
(IN
TH
OU
SA
ND
S)
REVENUE
OPERATING INCOME
2005
2004
2003
2002
2001
2000
1999
1998
1997
1996
1995
1994
1993
1992
1991
1990
1989
1988
1987
1986
1985
1984
1983
1982
1981
$ 15,000
$ 12,000
$ 9,000
$ 6,000
$ 3,000
$0
$3,000
$2,500
$2,000
$ 1,500
$ 1,000
$500
$0
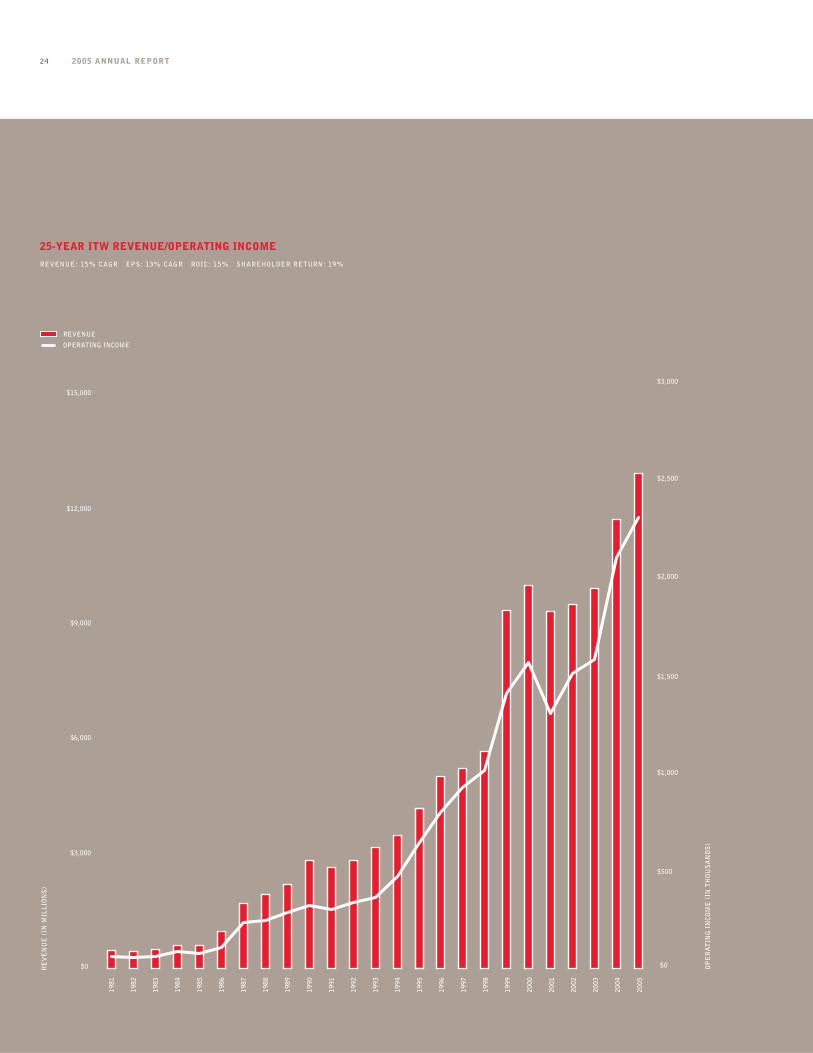
25-YEAR ITW REVENUE/OPERATING INCOME
REVENUE: 15% CAGR EPS: 13% CAGR ROIC: 15% SHAREHOLDER RETURN: 19%
ILLINOIS TOOL WORKS INC. 25
Back in the early days of corporate advertising, ITW recruitedcomedian Steve Allen to promote the little-known companybehind so many familiar products. Launched in 1962, the radio-based ad campaign centered around a simple and fitting slogan:“You are never more than a few feet away from a product ofITW.” Today, this tagline rings more true than ever. Our productscross just about every industry, geography and market segmentin the world. And while we’ve touched on a number of them inthis report, there simply isn’t an annual report big enough toshowcase all of ITW’s products. We truly are everywhere.
But it takes a lot more than sheer scale to continually earn thetrust and support of customers around the globe. It takes passion,a heavy dose of innovation and a firm commitment to excellence.Our people work hard to ensure our products add value to thelives of our customers. We take great pride in knowing that everyday and in every part of the world, ITW products help bring theirvisions to life.
It’s qualities like these that have made your company a success—and a sound investment.
2005 FINANCIAL RESULTS
We closed 2005 with record results for the year. Revenues forfull-year 2005 totaled $12.9 billion, a 10 percent increase overthe prior year. The two main contributors to top-line growth in2005 were base revenues increasing 4.4 percent and acquisitionscontributing 5 percent. Most importantly, diluted net income pershare of $5.20 for the full year was 18 percent higher than 2004.
As the year progressed, we were able to recover price from thedramatically higher cost of a number of basic raw materials,such as steel, which began in 2004. This price recovery helped usoffset weaker first-half margin performance, culminating withfull-year operating margins of 17.5 percent—basically even withour very strong margin performance in 2004. Free operating cashflow increased to a record $1.6 billion, up from $1.2 billion in2004, while our return on average invested capital improved to18.7 percent from 18.1 percent in the prior year.
MANAGEMENT CHANGES
In August 2005, I was honored to assume the leadership of yourcompany from former CEO Jim Farrell, who will remain chairmanof the board until his previously announced retirement this May.I am grateful to Jim and the entire board of directors for givingme the opportunity to lead this extraordinary company and lookforward to building on the legacy they’ve helped create.
To Our ShareholdersTRIBUTE TO JIM FARRELL
In 1965, a 23-year-old college graduate startedhis career at a small company known asIllinois Tool Works. Back then, the young manwas a business novice and the company thathired him earned less than $100 million in revenues. The good news was the companyprospered and Jim Farrell never left. As fatewould have it, the winning nature of this combination would reveal itself over time.
Jim has spent his entire 40-year career at your company, and his impact on the businesscan’t be overstated. Since taking the helm ofthe company as CEO in 1995 and adding the chairman’s title in 1996, his vision and leadership have guided ITW through nearly300 acquisitions, significant expansion andrefinement of the company’s 80/20 businessprocess, financial results that stack up smartlywith other industrial companies around theworld, and a market capitalization that hasmore than tripled in dollar value.
But Jim’s legacy reaches far beyond profit margins, balance sheets and market caps. The strength of his character, positive attitude and unflappable leadership style will long serve as a model here. His personal attention to leadership development and commitment to the highest ethical business standards haveestablished your company as an industry-leadingmodel for others to emulate. He has been, andwill remain, a towering figure in the company’shistory. As such, he joins a short list of ITW’spast CEO’s—Harold Smith, Si Cathcart andJohn Nichols—as architects of how to build astrong enterprise for both today and tomorrow.We wish Jim the very best in all his futureendeavors. We know he will continue to prosperin whatever he chooses to do, and will bring hischaracteristic warmth, humor and abidingaffection for people along with him.
2005 ANNUAL REPORT26
In addition to Jim Farrell’s contributions chronicled on the previous page, we want to extendour thanks and best wishes to another key member of the management team who retired in2005. Former General Counsel Stewart Hudnut retired in August after 14 years with ITW.We thank Stewart for the sound leadership he provided over the years and especially for hismentoring skills. Stewart has been succeeded by James Wooten, Jr., who was elected vicepresident, general counsel and corporate secretary. James brings significant experience andexpertise to the position, having served as ITW’s associate general counsel for the past 17 years.
Also in August, we were pleased to welcome Jim Skinner as our newest board member. Asvice chairman and chief executive officer of McDonald’s, Jim brings tremendous operatinginsights and leadership experience to the board of directors. We look forward to hiscontributions in the coming years.
LEADERSHIP THAT LASTS
The strength and depth of your leadership team are among our most valuable assets andare a clear competitive advantage. With a heritage of long-tenured, homegrown leaders and a commitment to cultivating talent throughout the business, your company remainswell-positioned for growth and profitability over the long term.
Many of the executives on your senior management team started their careers at ITW.With an average tenure of 27 years with the company, their extensive knowledge of thebusiness helps drive the company’s success year after year. The team includes eightexecutive vice presidents, who with the support of their staffs, are each responsible foroverseeing the performance of their respective business units around the world. Likewise,the business units are led by very talented general managers and operating staff whorun our autonomous operations with a high level of commitment to our customers, ourshareholders and our people. This combined management expertise and experience ensurescontinuity from one year to the next and provides the necessary bench strength to helplead your company far into the future.
FUTURE FOCUSED
As we look for new and different ways to create shareholder value in the coming years, ourstrategy will focus on the following priorities:
1. Pursue even greater customer focus and innovation. Through many of ITW’s long-standingoperating practices, we will sharpen our focus on our customers and their changing needswith an eye towards developing new and better products to help their businesses thrive.Our decentralized business model and our ongoing 80/20 business simplification processesare core disciplines, allowing us to keep our focus squarely on customer needs. And ourcommitment to constant innovation will continue to lead us to new businesses and untappedmarket opportunities around the world.
2. Become increasingly diversified. We continue to penetrate growth markets around theworld, which impacts the diversification of our revenue base. One area that holds tremendousgrowth opportunities for us is Asia Pacific. Ten years ago, the region accounted for less than5 percent of our business. Today, it represents 10 percent and if we continue to grow as weexpect, Asia Pacific would represent approximately one quarter of our revenues by 2009.
ILLINOIS TOOL WORKS INC. 27
DAVID B. SPEER
President and
Chief Executive Officer
FEBRUARY 28, 2006
W. JAMES FARRELL
Chairman
3. Continue growth through our proven combination of growth in our baserevenues and a sound acquisition program. We plan to enhance base revenuegrowth over the next five years by increasing our market penetration throughtargeting higher growth potential end markets supported by an expandedinvestment in marketing and new product development. At the same time, we’llcontinue to execute a robust, but valuation-appropriate, acquisition programlargely driven by our business units around the world. This initiative will bringgrowth opportunities in the years ahead.
4. Continue ITW’s tradition of strong financial performance. Over the past 25 years, ITW has averaged a strong 15 percent CAGR in revenue and ashareholder return of 19 percent. We will continue to aggressively pursuethese benchmarks in order to maintain your company’s long-standing trackrecord of success.
2006 AND BEYOND
We have established an ambitious agenda for 2006—one that should providea satisfying return to our shareholders over the long term. We are excitedabout the future of ITW and look forward to another successful year in thecompany’s storied 94-year history.
As we look to the future, we’d like to thank our people for their constantcommitment to ITW’s legacy of excellence. We are also grateful to ourcustomers and shareholders for their continued support.
THANK YOU FROM JIM FARRELL
As already noted, I will be retiring from ITWand the Board of Directors this May after 41very memorable years. Put simply, mine hasbeen a rewarding and thorougly enjoyable career.When I became CEO in 1995, my major concernwas whether or not I could maintain and improvethe culture that I was so fortunate to inherit. I now believe that the trust—not only grantedto me so willingly by the wonderful peoplethroughout ITW, but also returned in kind—has made that concern a distant memory.
The current management team and the board of directors who are now leading the companyare themselves a product of that very same successful culture. I know they will continuethe building process for the benefit of ourshareholders, customers and our people. It hasbeen my privilege and honor to be part of—andto lead—this incredible company. Thank you.
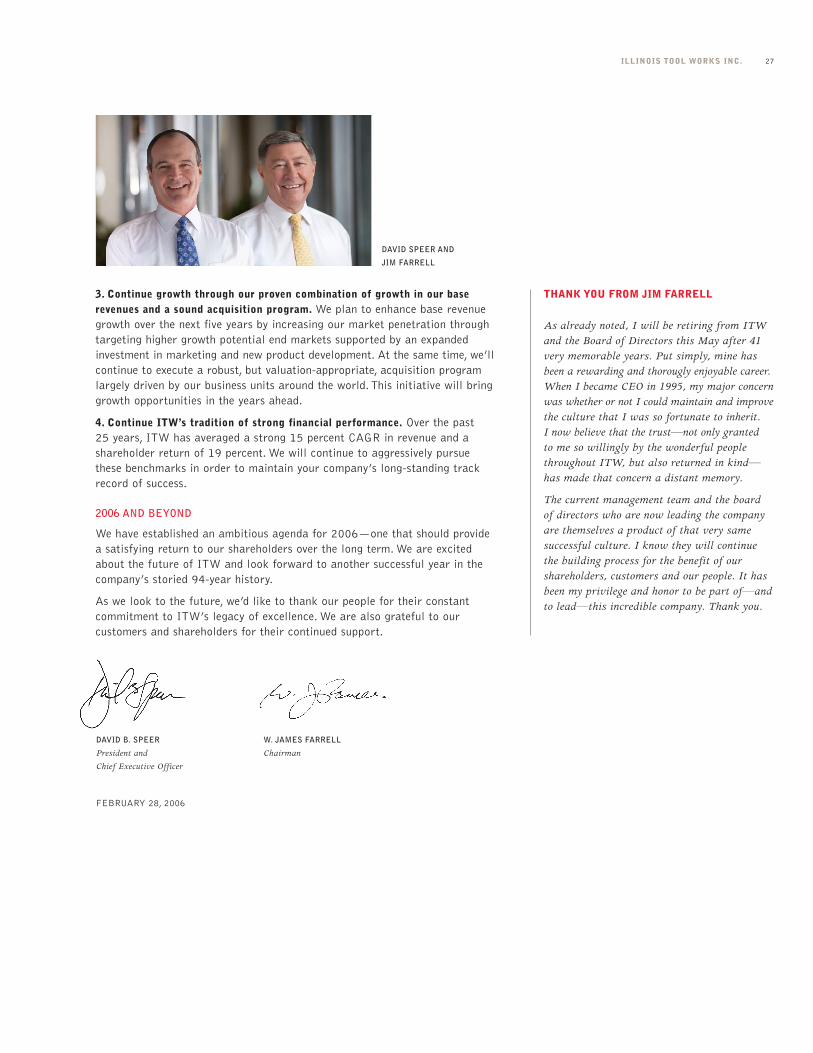
DAVID SPEER AND
JIM FARRELL
2005 ANNUAL REPORT28
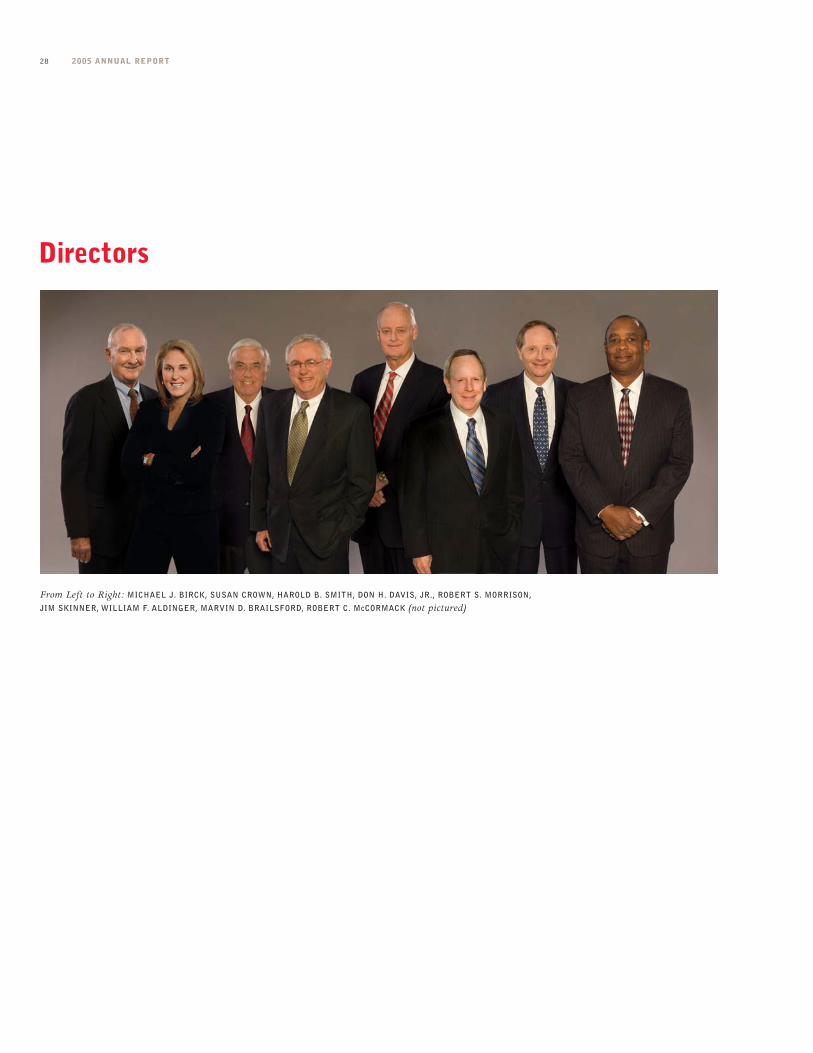
From Left to Right: MICHAEL J. BIRCK, SUSAN CROWN, HAROLD B. SMITH, DON H. DAVIS, JR., ROBERT S. MORRISON,
JIM SKINNER, WILLIAM F. ALDINGER, MARVIN D. BRAILSFORD, ROBERT C. McCORMACK (not pictured)
Directors
ILLINOIS TOOL WORKS INC. 29
Financial Table of Contents
MANAGEMENT’S DISCUSSION AND ANALYSIS 30
FORWARD-LOOKING STATEMENTS 48
MANAGEMENT REPORT ON INTERNAL CONTROL OVER FINANCIAL REPORTING 49
REPORT OF INDEPENDENT REGISTERED PUBLIC ACCOUNTING FIRM 50
STATEMENT OF INCOME 51
STATEMENT OF INCOME REINVESTED IN THE BUSINESS 51
STATEMENT OF COMPREHENSIVE INCOME 51
STATEMENT OF FINANCIAL POSITION 52
STATEMENT OF CASH FLOWS 53
NOTES TO FINANCIAL STATEMENTS 54
QUARTERLY AND COMMON STOCK DATA 77
ELEVEN-YEAR FINANCIAL SUMMARY 78
2005 ANNUAL REPORT30
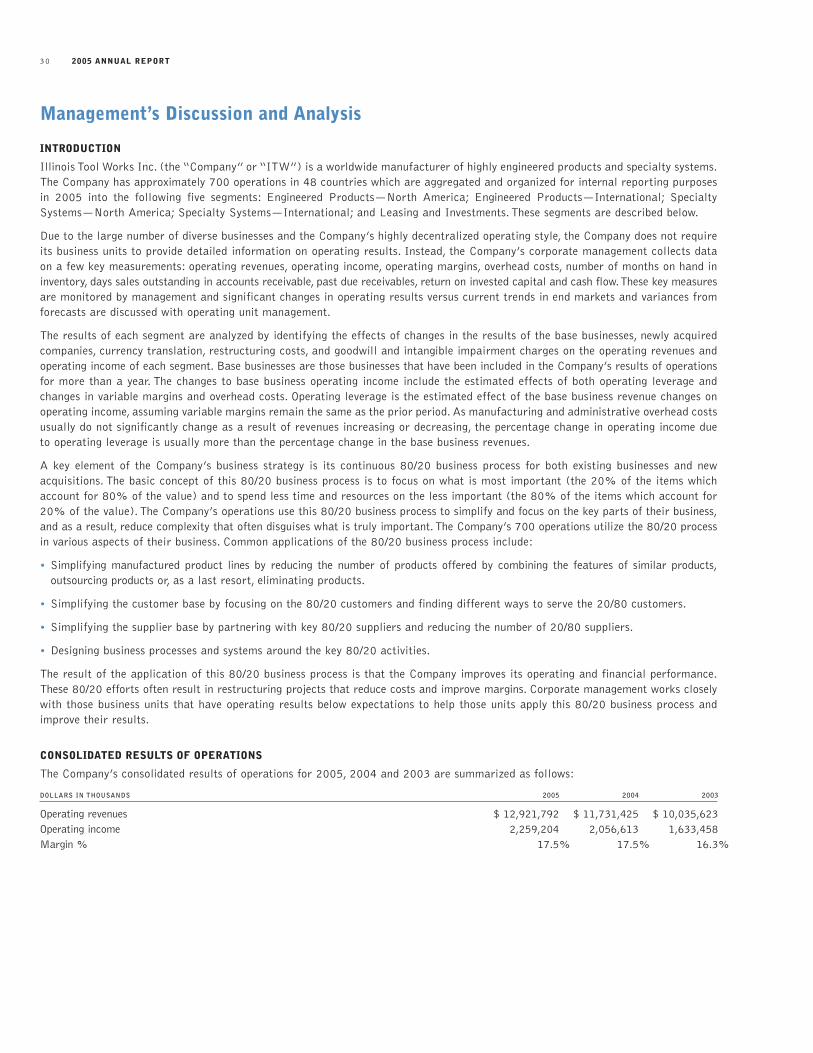
Management’s Discussion and Analysis
INTRODUCTION
Illinois Tool Works Inc. (the “Company” or “ITW”) is a worldwide manufacturer of highly engineered products and specialty systems.The Company has approximately 700 operations in 48 countries which are aggregated and organized for internal reporting purposesin 2005 into the following five segments: Engineered Products—North America; Engineered Products—International; SpecialtySystems—North America; Specialty Systems—International; and Leasing and Investments. These segments are described below.
Due to the large number of diverse businesses and the Company’s highly decentralized operating style, the Company does not requireits business units to provide detailed information on operating results. Instead, the Company’s corporate management collects dataon a few key measurements: operating revenues, operating income, operating margins, overhead costs, number of months on hand ininventory, days sales outstanding in accounts receivable, past due receivables, return on invested capital and cash flow.These key measuresare monitored by management and significant changes in operating results versus current trends in end markets and variances fromforecasts are discussed with operating unit management.
The results of each segment are analyzed by identifying the effects of changes in the results of the base businesses, newly acquiredcompanies, currency translation, restructuring costs, and goodwill and intangible impairment charges on the operating revenues andoperating income of each segment. Base businesses are those businesses that have been included in the Company’s results of operationsfor more than a year. The changes to base business operating income include the estimated effects of both operating leverage andchanges in variable margins and overhead costs. Operating leverage is the estimated effect of the base business revenue changes onoperating income, assuming variable margins remain the same as the prior period. As manufacturing and administrative overhead costsusually do not significantly change as a result of revenues increasing or decreasing, the percentage change in operating income dueto operating leverage is usually more than the percentage change in the base business revenues.
A key element of the Company’s business strategy is its continuous 80/20 business process for both existing businesses and new acquisitions. The basic concept of this 80/20 business process is to focus on what is most important (the 20% of the items whichaccount for 80% of the value) and to spend less time and resources on the less important (the 80% of the items which account for20% of the value). The Company’s operations use this 80/20 business process to simplify and focus on the key parts of their business,and as a result, reduce complexity that often disguises what is truly important.The Company’s 700 operations utilize the 80/20 processin various aspects of their business. Common applications of the 80/20 business process include:
• Simplifying manufactured product lines by reducing the number of products offered by combining the features of similar products,outsourcing products or, as a last resort, eliminating products.
• Simplifying the customer base by focusing on the 80/20 customers and finding different ways to serve the 20/80 customers.
• Simplifying the supplier base by partnering with key 80/20 suppliers and reducing the number of 20/80 suppliers.
• Designing business processes and systems around the key 80/20 activities.
The result of the application of this 80/20 business process is that the Company improves its operating and financial performance.These 80/20 efforts often result in restructuring projects that reduce costs and improve margins. Corporate management works closelywith those business units that have operating results below expectations to help those units apply this 80/20 business process andimprove their results.
CONSOLIDATED RESULTS OF OPERATIONS
The Company’s consolidated results of operations for 2005, 2004 and 2003 are summarized as follows:
DOLLARS IN THOUSANDS 2005 2004 2003
Operating revenues $ 12,921,792 $ 11,731,425 $ 10,035,623Operating income 2,259,204 2,056,613 1,633,458Margin % 17.5% 17.5% 16.3%
ILLINOIS TOOL WORKS INC. 31
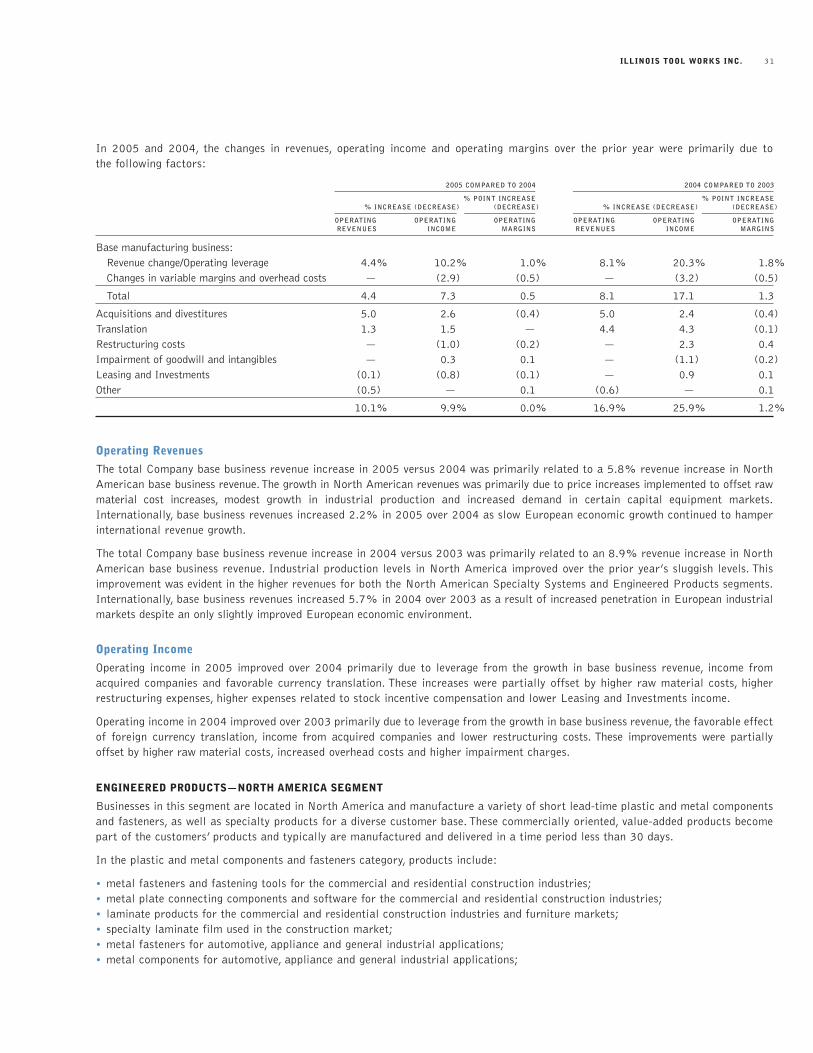
In 2005 and 2004, the changes in revenues, operating income and operating margins over the prior year were primarily due to the following factors:
2005 COMPARED TO 2004 2004 COMPARED TO 2003
% POINT INCREASE % POINT INCREASE% INCREASE (DECREASE) (DECREASE) % INCREASE (DECREASE) (DECREASE)
OPERATING OPERATING OPERATING OPERATING OPERATING OPERATINGREVENUES INCOME MARGINS REVENUES INCOME MARGINS
Base manufacturing business:Revenue change/Operating leverage 4.4% 10.2% 1.0% 8.1% 20.3% 1.8%Changes in variable margins and overhead costs — (2.9) (0.5) — (3.2) (0.5)
Total 4.4 7.3 0.5 8.1 17.1 1.3
Acquisitions and divestitures 5.0 2.6 (0.4) 5.0 2.4 (0.4)Translation 1.3 1.5 — 4.4 4.3 (0.1)Restructuring costs — (1.0) (0.2) — 2.3 0.4Impairment of goodwill and intangibles — 0.3 0.1 — (1.1) (0.2)Leasing and Investments (0.1) (0.8) (0.1) — 0.9 0.1Other (0.5) — 0.1 (0.6) — 0.1
10.1% 9.9% 0.0% 16.9% 25.9% 1.2%
Operating Revenues
The total Company base business revenue increase in 2005 versus 2004 was primarily related to a 5.8% revenue increase in NorthAmerican base business revenue.The growth in North American revenues was primarily due to price increases implemented to offset rawmaterial cost increases, modest growth in industrial production and increased demand in certain capital equipment markets.Internationally, base business revenues increased 2.2% in 2005 over 2004 as slow European economic growth continued to hamperinternational revenue growth.
The total Company base business revenue increase in 2004 versus 2003 was primarily related to an 8.9% revenue increase in NorthAmerican base business revenue. Industrial production levels in North America improved over the prior year’s sluggish levels. Thisimprovement was evident in the higher revenues for both the North American Specialty Systems and Engineered Products segments.Internationally, base business revenues increased 5.7% in 2004 over 2003 as a result of increased penetration in European industrialmarkets despite an only slightly improved European economic environment.
Operating Income
Operating income in 2005 improved over 2004 primarily due to leverage from the growth in base business revenue, income fromacquired companies and favorable currency translation. These increases were partially offset by higher raw material costs, higherrestructuring expenses, higher expenses related to stock incentive compensation and lower Leasing and Investments income.
Operating income in 2004 improved over 2003 primarily due to leverage from the growth in base business revenue, the favorable effectof foreign currency translation, income from acquired companies and lower restructuring costs. These improvements were partially offset by higher raw material costs, increased overhead costs and higher impairment charges.
ENGINEERED PRODUCTS—NORTH AMERICA SEGMENT
Businesses in this segment are located in North America and manufacture a variety of short lead-time plastic and metal componentsand fasteners, as well as specialty products for a diverse customer base. These commercially oriented, value-added products becomepart of the customers’ products and typically are manufactured and delivered in a time period less than 30 days.
In the plastic and metal components and fasteners category, products include:
• metal fasteners and fastening tools for the commercial and residential construction industries;• metal plate connecting components and software for the commercial and residential construction industries;• laminate products for the commercial and residential construction industries and furniture markets;• specialty laminate film used in the construction market;• metal fasteners for automotive, appliance and general industrial applications;• metal components for automotive, appliance and general industrial applications;
2005 ANNUAL REPORT32
• plastic components for automotive, appliance, furniture and electronics applications; and• plastic fasteners for automotive, appliance and electronics applications.
In the specialty products category, products include:
• reclosable packaging for consumer food applications;• swabs, wipes and mats for clean room usage in the electronics and pharmaceutical industries;• hand wipes and cleaners for use in industrial manufacturing locations;• chemical fluids which clean or add lubrication to machines and automobiles;• adhesives for industrial, construction and consumer purposes;• epoxy and resin-based coating products for industrial applications;• components for industrial machines;• manual and power operated chucking equipment for industrial applications; and• automotive aftermarket maintenance and appearance products.
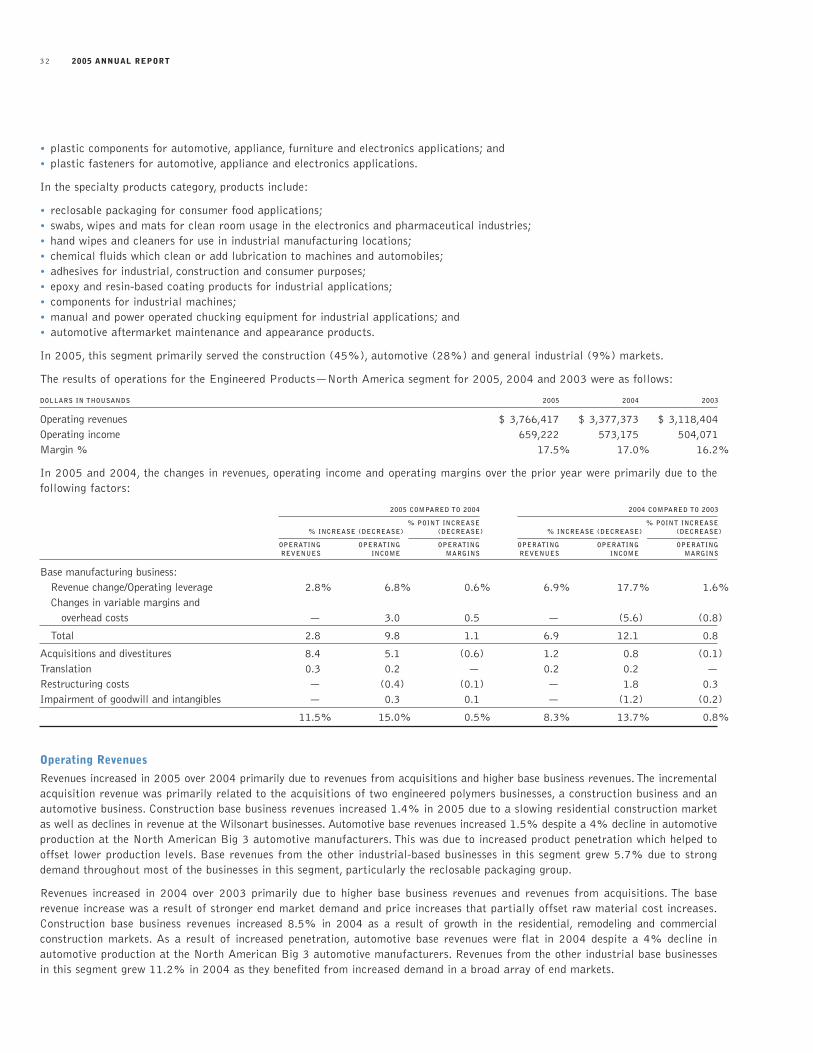
In 2005, this segment primarily served the construction (45%), automotive (28%) and general industrial (9%) markets.
The results of operations for the Engineered Products—North America segment for 2005, 2004 and 2003 were as follows:
DOLLARS IN THOUSANDS 2005 2004 2003
Operating revenues $ 3,766,417 $ 3,377,373 $ 3,118,404Operating income 659,222 573,175 504,071Margin % 17.5% 17.0% 16.2%
In 2005 and 2004, the changes in revenues, operating income and operating margins over the prior year were primarily due to thefollowing factors:
2005 COMPARED TO 2004 2004 COMPARED TO 2003
% POINT INCREASE % POINT INCREASE% INCREASE (DECREASE) (DECREASE) % INCREASE (DECREASE) (DECREASE)
OPERATING OPERATING OPERATING OPERATING OPERATING OPERATINGREVENUES INCOME MARGINS REVENUES INCOME MARGINS
Base manufacturing business:Revenue change/Operating leverage 2.8% 6.8% 0.6% 6.9% 17.7% 1.6%Changes in variable margins and
overhead costs — 3.0 0.5 — (5.6) (0.8)
Total 2.8 9.8 1.1 6.9 12.1 0.8
Acquisitions and divestitures 8.4 5.1 (0.6) 1.2 0.8 (0.1)Translation 0.3 0.2 — 0.2 0.2 —Restructuring costs — (0.4) (0.1) — 1.8 0.3Impairment of goodwill and intangibles — 0.3 0.1 — (1.2) (0.2)
11.5% 15.0% 0.5% 8.3% 13.7% 0.8%
Operating Revenues
Revenues increased in 2005 over 2004 primarily due to revenues from acquisitions and higher base business revenues. The incrementalacquisition revenue was primarily related to the acquisitions of two engineered polymers businesses, a construction business and anautomotive business. Construction base business revenues increased 1.4% in 2005 due to a slowing residential construction marketas well as declines in revenue at the Wilsonart businesses. Automotive base revenues increased 1.5% despite a 4% decline in automotiveproduction at the North American Big 3 automotive manufacturers. This was due to increased product penetration which helped tooffset lower production levels. Base revenues from the other industrial-based businesses in this segment grew 5.7% due to strongdemand throughout most of the businesses in this segment, particularly the reclosable packaging group.
Revenues increased in 2004 over 2003 primarily due to higher base business revenues and revenues from acquisitions. The base revenue increase was a result of stronger end market demand and price increases that partially offset raw material cost increases.Construction base business revenues increased 8.5% in 2004 as a result of growth in the residential, remodeling and commercial construction markets. As a result of increased penetration, automotive base revenues were flat in 2004 despite a 4% decline in automotive production at the North American Big 3 automotive manufacturers. Revenues from the other industrial base businessesin this segment grew 11.2% in 2004 as they benefited from increased demand in a broad array of end markets.
ILLINOIS TOOL WORKS INC. 33
Operating Income
Operating income increased in 2005 over 2004 primarily due to leverage from the growth in base business revenues, lower overheadexpenses and income from acquisitions. These increases were partially offset by base business variable margin declines of 60 basispoints due to sales declines in high margin businesses. In addition, income was higher due to lower goodwill and intangible assetimpairment charges over the prior year. In the first quarter of 2005, an intangible asset impairment charge of $5.0 million was recordedrelated to the intangibles of a U.S. manufacturer of clean room mats. Additionally, income increased in 2005 due to a $9.0 millioncharge in 2004 associated with a warranty issue related to a discontinued product at the Wilsonart laminate business.
Operating income increased in 2004 over 2003 primarily due to leverage from the growth in base business revenues described above,lower restructuring costs and income from acquisitions.These increases were partially offset by base business variable margin declinesof 20 basis points, primarily due to steel cost increases. In addition, income in 2004 was negatively impacted by a $9.0 million chargeassociated with a warranty issue related to a discontinued product at the Wilsonart laminate business. Also partially offsetting thebase business increases were first quarter 2004 goodwill and impairment charges of $7.0 million, primarily related to the goodwillof a U.S. electrical components business and the trademarks and brands of a U.S. manufacturer of clean room mats.
ENGINEERED PRODUCTS—INTERNATIONAL SEGMENT
Businesses in this segment are located outside North America and manufacture a variety of short lead-time plastic and metal components and fasteners, as well as specialty products for a diverse customer base. These commercially oriented, value-added products become part of the customers’ products and typically are manufactured and delivered in a time period less than 30 days.
In the plastic and metal components and fastener category, products include:
• metal fasteners and fastening tools for the commercial and residential construction industries;• laminate products for the commercial and residential construction industries and furniture markets;• specialty laminate film used in the construction market;• metal plate connecting components and software for the commercial and residential construction markets;• metal fasteners for automotive, appliance and general industrial applications;• metal components for automotive, appliance and general industrial applications;• plastic components for automotive, appliance and electronics applications; and• plastic fasteners for automotive, appliance and electronics applications.
In the specialty products category, products include:
• electronic component packaging trays used for the storage, shipment and manufacturing insertion of electronic components and microchips;
• swabs, wipes and mats for clean room usage in the electronics and pharmaceutical industries;• adhesives for industrial, construction and consumer purposes;• chemical fluids which clean or add lubrication to machines and automobiles;• epoxy and resin-based coating products for industrial applications; and• manual and power operated chucking equipment for industrial applications.
In 2005, this segment primarily served the construction (39%), automotive (28%) and general industrial (13%) markets.
The results of operations for the Engineered Products—International segment for 2005, 2004 and 2003 were as follows:
DOLLARS IN THOUSANDS 2005 2004 2003
Operating revenues $ 2,727,922 $ 2,491,908 $ 1,897,951Operating income 403,507 372,368 263,464Margin % 14.8% 14.9% 13.9%
2005 ANNUAL REPORT34
In 2005 and 2004, the changes in revenues, operating income and operating margins over the prior year were primarily due to thefollowing factors:
2005 COMPARED TO 2004 2004 COMPARED TO 2003
% POINT INCREASE % POINT INCREASE% INCREASE (DECREASE) (DECREASE) %INCREASE (DECREASE) (DECREASE)
OPERATING OPERATING OPERATING OPERATING OPERATING OPERATINGREVENUES INCOME MARGINS REVENUES INCOME MARGINS
Base manufacturing business:Revenue change/Operating leverage 0.1% 0.3% —% 7.3% 21.1% 1.8%Changes in variable margins and
overhead costs — (1.9) (0.3) — (0.6) (0.1)
Total 0.1 (1.6) (0.3) 7.3 20.5 1.7
Acquisitions and divestitures 6.6 4.5 (0.3) 12.4 8.8 (0.6)Translation 2.8 3.9 0.2 11.6 13.8 0.1Restructuring costs — (0.7) — — 1.4 0.2Impairment of goodwill and intangibles — 2.3 0.3 — (3.2) (0.4)
9.5% 8.4% (0.1)% 31.3% 41.3% 1.0%
Operating Revenues
Revenues increased in 2005 over 2004 primarily due to contributions from acquisitions and the favorable effect of currency translation.The incremental acquisition revenue was primarily related to the acquisitions of two European polymers businesses, two European fluidproduct businesses and a European construction business. Base business construction revenues increased 2.2% as increased demand atthe Wilsonart laminate businesses was partially offset by weak European and Australian construction markets. Automotive base revenuesdeclined 2.9% primarily due to declines in automotive production at certain European automotive manufacturers. Base business revenues for the other businesses in this segment that serve a broad array of industrial and commercial end markets were flat in 2005.
Revenues increased in 2004 over 2003 due to contributions from acquisitions, increased base business revenues and the favorableeffect of currency translation, primarily as a result of the euro strengthening versus the U.S. dollar. The acquisition revenue is primarilyrelated to the acquisitions of an Australian construction business and a European polymer business in the first quarter of 2004 andtwo European fluid product businesses in the second quarter of 2004. Base business construction revenues increased 7.8% in 2004due to a rise in commercial construction activity in Europe, as well as increased commercial and residential demand in the Australasiaregion. Automotive base revenues grew 6.8% primarily due to increased product penetration at the European automotive manufacturers.Base business revenue for the other businesses in this segment increased 5.8% in 2004 due to strong demand through the end marketsthat this segment serves.
Operating Income
Operating income increased in 2005 over 2004 primarily due to acquisitions, the favorable effect of currency translation, and lowerimpairment charges offset by higher restructuring expenses. In addition, variable margins decreased 30 basis points primarily due toincreases in raw material costs.
Operating income increased in 2004 over 2003 primarily due to leverage from the increase in base business revenues described above,the favorable effect of currency translation, income from acquisitions and lower restructuring expenses. Partially offsetting the aboveincome increases was a goodwill impairment charge of $8.5 million incurred in the first quarter of 2004, primarily related to thediminished cash flow expectations of a European automotive components business.
SPECIALTY SYSTEMS—NORTH AMERICA SEGMENT
Businesses in this segment are located in North America and design and manufacture longer lead-time machinery and related consumables, as well as specialty equipment for a diverse customer base. These commercially oriented, value-added products becomepart of the customers’ processes and typically are manufactured and delivered in a time period of more than 30 days.
In the machinery and related consumables category, products include:
• industrial packaging equipment and plastic and steel strapping for the bundling and shipment of a variety of products for customersin numerous end markets;
• welding equipment and metal consumables for a variety of end market users;
ILLINOIS TOOL WORKS INC. 35
• equipment and plastic consumables that multi-pack cans and bottles for the food and beverage industry;• plastic stretch film and related packaging equipment for various industrial purposes;• paper and plastic products used to protect shipments of goods in transit;• marking tools and inks for various end users; and• foil and film and related equipment used to decorate a variety of consumer products.
In the specialty equipment category, products include:
• commercial food equipment such as dishwashers, refrigerators, mixers, ovens, food slicers and specialty scales for use by restaurants,institutions and supermarkets;
• paint spray equipment for a variety of general industrial applications;• materials and structural testing machinery and software;• static control equipment for electronics and industrial applications;• wheel balancing and tire uniformity equipment used in the automotive industry; and• airport ground power generators for commercial and military applications.
In 2005, this segment primarily served the food institutional and retail (25%), general industrial (25%), construction (11%) andfood and beverage (8%) markets.
The results of operations for the Specialty Systems—North America segment for 2005, 2004 and 2003 were as follows:
DOLLARS IN THOUSANDS 2005 2004 2003
Operating revenues $ 4,168,305 $ 3,776,100 $ 3,300,776Operating income 776,094 668,114 534,384Margin % 18.6% 17.7% 16.2%
In 2005 and 2004, the changes in revenues, operating income and operating margins over the prior year were primarily due to thefollowing factors:
2005 COMPARED TO 2004 2004 COMPARED TO 2003
% POINT INCREASE % POINT INCREASE% INCREASE (DECREASE) (DECREASE) % INCREASE (DECREASE) (DECREASE)
OPERATING OPERATING OPERATING OPERATING OPERATING OPERATINGREVENUES INCOME MARGINS REVENUES INCOME MARGINS
Base manufacturing business:Revenue change/Operating leverage 8.4% 19.5% 1.8% 10.9% 28.2% 2.5%Changes in variable margins and
and overhead costs — (4.5) (0.7) — (4.8) (0.7)
Total 8.4 15.0 1.1 10.9 23.4 1.8
Acquisitions and divestitures 1.5 1.1 (0.1) 3.1 1.4 (0.3)Translation 0.5 0.6 — 0.4 0.4 —Restructuring costs — — — — 0.2 0.1Impairment of goodwill and intangibles — (0.5) (0.1) — (0.4) (0.1)
10.4% 16.2% 0.9% 14.4% 25.0% 1.5%
Operating Revenues
Revenues increased in 2005 over 2004 primarily due to higher base business revenues as a result of increased demand for machinery andconsumables in most of the end markets this segment serves. Welding base revenues increased 18.7% mainly due to increases in volumein the oil, pipeline and construction markets. Food equipment and industrial packaging base revenues increased 5.0% and 3.3%,respectively, in 2005. Base revenues in the other businesses in this segment, including the marking, decorating and finishing businesses,increased 9.5%. The acquisition revenue is primarily related to the acquisitions of a materials and structural testing business and aspecialty packaging business.
Revenues increased in 2004 over 2003 due to increased base business revenues and revenues from acquisitions.The acquisition revenue increaseis primarily due to a third quarter 2003 acquisition of a North American steel strapping business. The base revenue increase was aresult of stronger end market demand and price increases that partially offset raw material cost increases. Base business revenue growthin 2004 is primarily due to an increase in demand in most of the end markets that this segment serves. Welding base revenues
2005 ANNUAL REPORT36
increased 26.6% due to an increase in equipment orders due to the economic recovery in industrial markets. Industrial packagingbase revenues grew 10.8%, food equipment base revenues increased 2.1% and base revenues in the other businesses in this segmentincreased 8.5%.
Operating Income
Operating income increased in 2005 over 2004 primarily due to leverage from the base business revenue increases and income fromacquisitions. These increases were partially offset by a 70 basis point decrease in operating margins. Margins decreased due to rawmaterial cost increases and revenue gains in lower margin businesses. In addition, overhead costs increased partially due to higherexpenses related to stock incentive compensation. In addition, income was adversely affected by 2005 goodwill impairment chargesof $9.6 million mainly related to the reduced cash flow expectations at a welding business and a specialty packaging business.
Operating income increased in 2004 over 2003 primarily due to leverage from the base business revenue increases described above.Additionally, income from acquisitions increased income in 2004. However, variable margins declined 50 basis points in 2004 primarilydue to steel raw material cost increases. Additionally, income was adversely impacted in 2004 due to goodwill and intangible assetimpairment charges of $5.9 million incurred in the first quarter of 2004, primarily related to the diminished cash flow expectationsat two welding businesses and an industrial packaging unit.
SPECIALTY SYSTEMS—INTERNATIONAL SEGMENT
Businesses in this segment are located outside North America and design and manufacture longer lead-time machinery and relatedconsumables, as well as specialty equipment for a diverse customer base. These commercially oriented, value-added products becomepart of the customers’ processes and typically are manufactured and delivered in a time period of more than 30 days.
In the machinery and related consumables category, products include:
• industrial packaging equipment and plastic and steel strapping for the bundling and shipment of a variety of products for customersin numerous end markets;
• welding equipment and metal consumables for a variety of end market users;• equipment and plastic consumables that multi-pack cans and bottles for the food and beverage industry;• plastic bottle sleeves and related equipment for the food and beverage industry;• plastic stretch film and related packaging equipment for various industrial purposes;• paper and plastic products used to protect shipments of goods in transit; and• foil and film and related equipment used to decorate a variety of consumer products.
In the specialty equipment category, products include:
• commercial food equipment such as dishwashers, refrigerators, mixers, ovens, food slicers and specialty scales for use by restaurants,institutions and supermarkets;
• materials and structural testing machinery and software;• paint spray equipment for a variety of general industrial applications;• static control equipment for electronics and industrial applications; and• airport ground power generators for commercial applications.
In 2005, this segment primarily served the general industrial (29%), food institutional and retail (19%) and food and beverage(14%) markets.
The results of operations for the Specialty Systems—International segment for 2005, 2004 and 2003 were as follows:
DOLLARS IN THOUSANDS 2005 2004 2003
Operating revenues $ 2,582,346 $ 2,349,238 $ 1,943,447Operating income 304,288 311,354 214,602Margin % 11.8% 13.3% 11.0%
ILLINOIS TOOL WORKS INC. 37
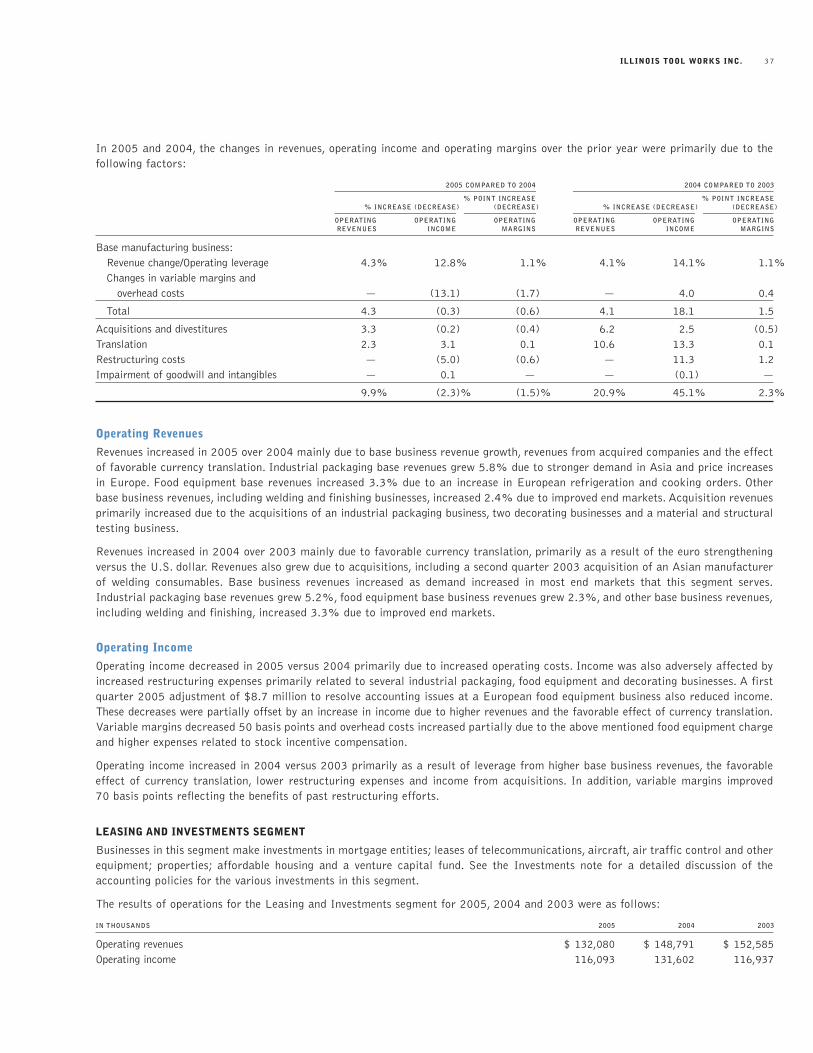
In 2005 and 2004, the changes in revenues, operating income and operating margins over the prior year were primarily due to the following factors:
2005 COMPARED TO 2004 2004 COMPARED TO 2003
% POINT INCREASE % POINT INCREASE% INCREASE (DECREASE) (DECREASE) % INCREASE (DECREASE) (DECREASE)
OPERATING OPERATING OPERATING OPERATING OPERATING OPERATINGREVENUES INCOME MARGINS REVENUES INCOME MARGINS
Base manufacturing business:Revenue change/Operating leverage 4.3% 12.8% 1.1% 4.1% 14.1% 1.1%Changes in variable margins and
overhead costs — (13.1) (1.7) — 4.0 0.4
Total 4.3 (0.3) (0.6) 4.1 18.1 1.5
Acquisitions and divestitures 3.3 (0.2) (0.4) 6.2 2.5 (0.5)Translation 2.3 3.1 0.1 10.6 13.3 0.1Restructuring costs — (5.0) (0.6) — 11.3 1.2Impairment of goodwill and intangibles — 0.1 — — (0.1) —
9.9% (2.3)% (1.5)% 20.9% 45.1% 2.3%
Operating Revenues
Revenues increased in 2005 over 2004 mainly due to base business revenue growth, revenues from acquired companies and the effectof favorable currency translation. Industrial packaging base revenues grew 5.8% due to stronger demand in Asia and price increasesin Europe. Food equipment base revenues increased 3.3% due to an increase in European refrigeration and cooking orders. Otherbase business revenues, including welding and finishing businesses, increased 2.4% due to improved end markets. Acquisition revenuesprimarily increased due to the acquisitions of an industrial packaging business, two decorating businesses and a material and structuraltesting business.
Revenues increased in 2004 over 2003 mainly due to favorable currency translation, primarily as a result of the euro strengtheningversus the U.S. dollar. Revenues also grew due to acquisitions, including a second quarter 2003 acquisition of an Asian manufacturerof welding consumables. Base business revenues increased as demand increased in most end markets that this segment serves.Industrial packaging base revenues grew 5.2%, food equipment base business revenues grew 2.3%, and other base business revenues,including welding and finishing, increased 3.3% due to improved end markets.
Operating Income
Operating income decreased in 2005 versus 2004 primarily due to increased operating costs. Income was also adversely affected byincreased restructuring expenses primarily related to several industrial packaging, food equipment and decorating businesses. A firstquarter 2005 adjustment of $8.7 million to resolve accounting issues at a European food equipment business also reduced income.These decreases were partially offset by an increase in income due to higher revenues and the favorable effect of currency translation.Variable margins decreased 50 basis points and overhead costs increased partially due to the above mentioned food equipment chargeand higher expenses related to stock incentive compensation.
Operating income increased in 2004 versus 2003 primarily as a result of leverage from higher base business revenues, the favorableeffect of currency translation, lower restructuring expenses and income from acquisitions. In addition, variable margins improved 70 basis points reflecting the benefits of past restructuring efforts.
LEASING AND INVESTMENTS SEGMENT
Businesses in this segment make investments in mortgage entities; leases of telecommunications, aircraft, air traffic control and otherequipment; properties; affordable housing and a venture capital fund. See the Investments note for a detailed discussion of theaccounting policies for the various investments in this segment.
The results of operations for the Leasing and Investments segment for 2005, 2004 and 2003 were as follows:
IN THOUSANDS 2005 2004 2003
Operating revenues $ 132,080 $ 148,791 $ 152,585 Operating income 116,093 131,602 116,937
2005 ANNUAL REPORT38
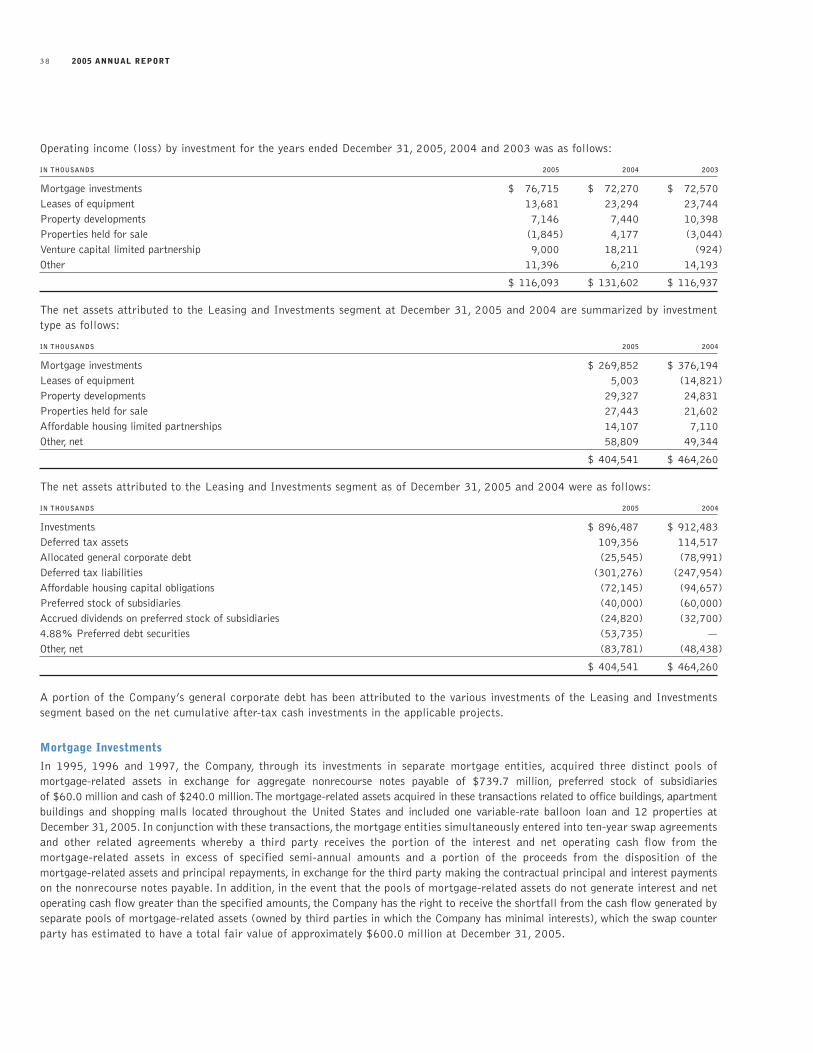
Operating income (loss) by investment for the years ended December 31, 2005, 2004 and 2003 was as follows:
IN THOUSANDS 2005 2004 2003
Mortgage investments $ 76,715 $ 72,270 $ 72,570Leases of equipment 13,681 23,294 23,744Property developments 7,146 7,440 10,398Properties held for sale (1,845) 4,177 (3,044)Venture capital limited partnership 9,000 18,211 (924)Other 11,396 6,210 14,193
$ 116,093 $ 131,602 $ 116,937
The net assets attributed to the Leasing and Investments segment at December 31, 2005 and 2004 are summarized by investmenttype as follows:
IN THOUSANDS 2005 2004
Mortgage investments $ 269,852 $ 376,194Leases of equipment 5,003 (14,821)Property developments 29,327 24,831Properties held for sale 27,443 21,602Affordable housing limited partnerships 14,107 7,110Other, net 58,809 49,344
$ 404,541 $ 464,260
The net assets attributed to the Leasing and Investments segment as of December 31, 2005 and 2004 were as follows:
IN THOUSANDS 2005 2004
Investments $ 896,487 $ 912,483Deferred tax assets 109,356 114,517Allocated general corporate debt (25,545) (78,991)Deferred tax liabilities (301,276) (247,954)Affordable housing capital obligations (72,145) (94,657)Preferred stock of subsidiaries (40,000) (60,000)Accrued dividends on preferred stock of subsidiaries (24,820) (32,700)4.88% Preferred debt securities (53,735) —Other, net (83,781) (48,438)
$ 404,541 $ 464,260
A portion of the Company’s general corporate debt has been attributed to the various investments of the Leasing and Investments segment based on the net cumulative after-tax cash investments in the applicable projects.
Mortgage Investments
In 1995, 1996 and 1997, the Company, through its investments in separate mortgage entities, acquired three distinct pools of mortgage-related assets in exchange for aggregate nonrecourse notes payable of $739.7 million, preferred stock of subsidiaries of $60.0 million and cash of $240.0 million.The mortgage-related assets acquired in these transactions related to office buildings, apartmentbuildings and shopping malls located throughout the United States and included one variable-rate balloon loan and 12 properties atDecember 31, 2005. In conjunction with these transactions, the mortgage entities simultaneously entered into ten-year swap agreementsand other related agreements whereby a third party receives the portion of the interest and net operating cash flow from the mortgage-related assets in excess of specified semi-annual amounts and a portion of the proceeds from the disposition of the mortgage-related assets and principal repayments, in exchange for the third party making the contractual principal and interest paymentson the nonrecourse notes payable. In addition, in the event that the pools of mortgage-related assets do not generate interest and netoperating cash flow greater than the specified amounts, the Company has the right to receive the shortfall from the cash flow generated byseparate pools of mortgage-related assets (owned by third parties in which the Company has minimal interests), which the swap counterparty has estimated to have a total fair value of approximately $600.0 million at December 31, 2005.
ILLINOIS TOOL WORKS INC. 39
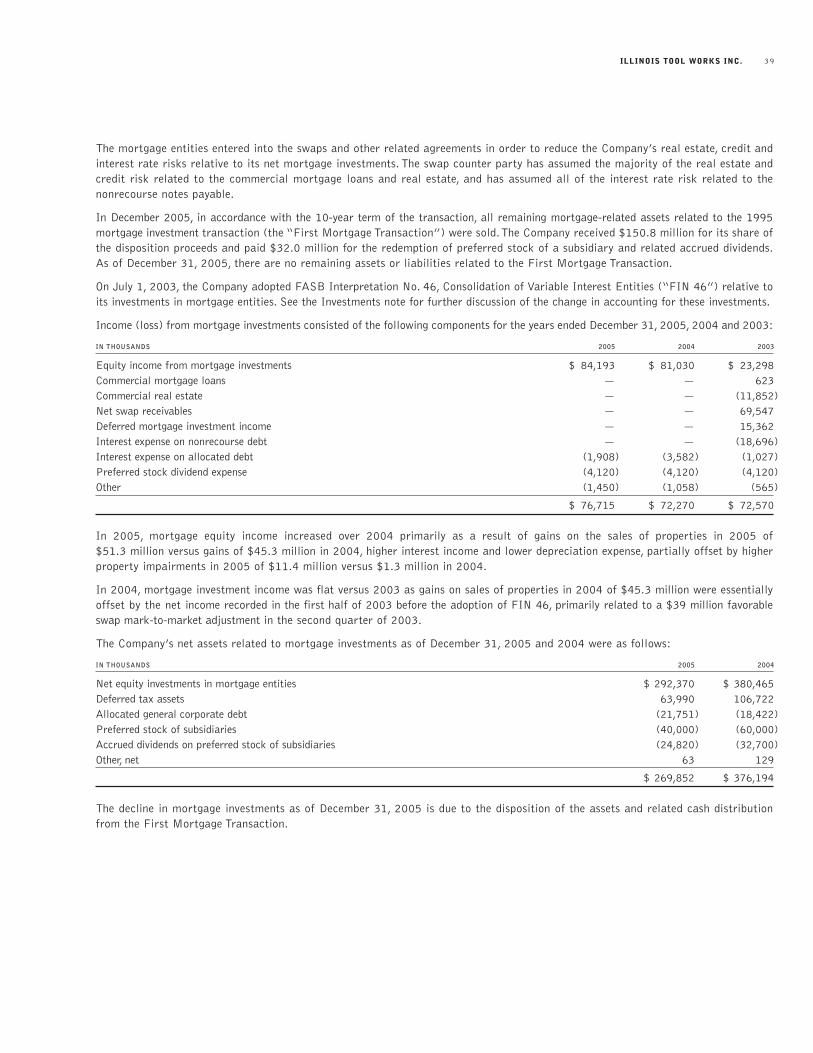
The mortgage entities entered into the swaps and other related agreements in order to reduce the Company’s real estate, credit andinterest rate risks relative to its net mortgage investments. The swap counter party has assumed the majority of the real estate andcredit risk related to the commercial mortgage loans and real estate, and has assumed all of the interest rate risk related to the nonrecourse notes payable.
In December 2005, in accordance with the 10-year term of the transaction, all remaining mortgage-related assets related to the 1995mortgage investment transaction (the “First Mortgage Transaction”) were sold.The Company received $150.8 million for its share ofthe disposition proceeds and paid $32.0 million for the redemption of preferred stock of a subsidiary and related accrued dividends.As of December 31, 2005, there are no remaining assets or liabilities related to the First Mortgage Transaction.
On July 1, 2003, the Company adopted FASB Interpretation No. 46, Consolidation of Variable Interest Entities (“FIN 46”) relative toits investments in mortgage entities. See the Investments note for further discussion of the change in accounting for these investments.
Income (loss) from mortgage investments consisted of the following components for the years ended December 31, 2005, 2004 and 2003:
IN THOUSANDS 2005 2004 2003
Equity income from mortgage investments $ 84,193 $ 81,030 $ 23,298Commercial mortgage loans — — 623Commercial real estate — — (11,852)Net swap receivables — — 69,547Deferred mortgage investment income — — 15,362Interest expense on nonrecourse debt — — (18,696)Interest expense on allocated debt (1,908) (3,582) (1,027)Preferred stock dividend expense (4,120) (4,120) (4,120)Other (1,450) (1,058) (565)
$ 76,715 $ 72,270 $ 72,570
In 2005, mortgage equity income increased over 2004 primarily as a result of gains on the sales of properties in 2005 of $51.3 million versus gains of $45.3 million in 2004, higher interest income and lower depreciation expense, partially offset by higherproperty impairments in 2005 of $11.4 million versus $1.3 million in 2004.
In 2004, mortgage investment income was flat versus 2003 as gains on sales of properties in 2004 of $45.3 million were essentiallyoffset by the net income recorded in the first half of 2003 before the adoption of FIN 46, primarily related to a $39 million favorableswap mark-to-market adjustment in the second quarter of 2003.
The Company’s net assets related to mortgage investments as of December 31, 2005 and 2004 were as follows:
IN THOUSANDS 2005 2004
Net equity investments in mortgage entities $ 292,370 $ 380,465Deferred tax assets 63,990 106,722 Allocated general corporate debt (21,751) (18,422)Preferred stock of subsidiaries (40,000) (60,000)Accrued dividends on preferred stock of subsidiaries (24,820) (32,700)Other, net 63 129
$ 269,852 $ 376,194
The decline in mortgage investments as of December 31, 2005 is due to the disposition of the assets and related cash distributionfrom the First Mortgage Transaction.
2005 ANNUAL REPORT40
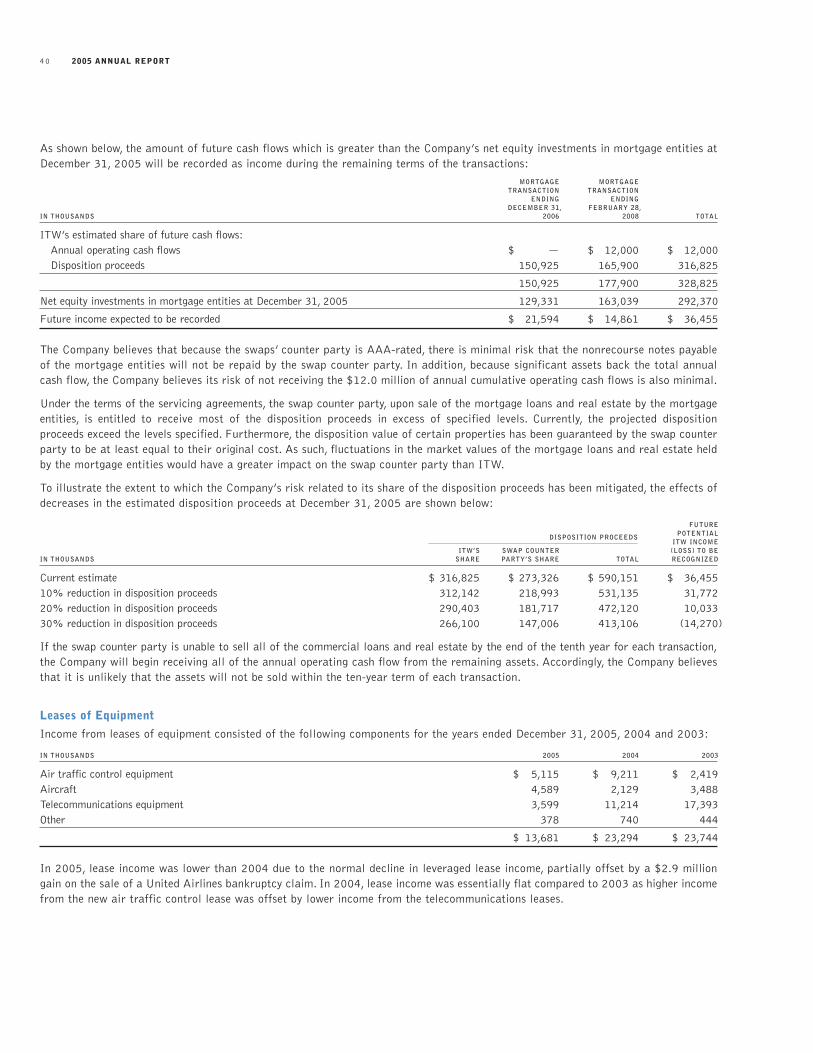
As shown below, the amount of future cash flows which is greater than the Company’s net equity investments in mortgage entities atDecember 31, 2005 will be recorded as income during the remaining terms of the transactions:
MORTGAGE MORTGAGETRANSACTION TRANSACTION
ENDING ENDINGDECEMBER 31, FEBRUARY 28,
IN THOUSANDS 2006 2008 TOTAL
ITW’s estimated share of future cash flows:Annual operating cash flows $ — $ 12,000 $ 12,000Disposition proceeds 150,925 165,900 316,825
150,925 177,900 328,825
Net equity investments in mortgage entities at December 31, 2005 129,331 163,039 292,370
Future income expected to be recorded $ 21,594 $ 14,861 $ 36,455
The Company believes that because the swaps’ counter party is AAA-rated, there is minimal risk that the nonrecourse notes payableof the mortgage entities will not be repaid by the swap counter party. In addition, because significant assets back the total annualcash flow, the Company believes its risk of not receiving the $12.0 million of annual cumulative operating cash flows is also minimal.
Under the terms of the servicing agreements, the swap counter party, upon sale of the mortgage loans and real estate by the mortgageentities, is entitled to receive most of the disposition proceeds in excess of specified levels. Currently, the projected disposition proceeds exceed the levels specified. Furthermore, the disposition value of certain properties has been guaranteed by the swap counterparty to be at least equal to their original cost. As such, fluctuations in the market values of the mortgage loans and real estate heldby the mortgage entities would have a greater impact on the swap counter party than ITW.
To illustrate the extent to which the Company’s risk related to its share of the disposition proceeds has been mitigated, the effects ofdecreases in the estimated disposition proceeds at December 31, 2005 are shown below:
FUTUREPOTENTIAL
ITW INCOMEITW’S SWAP COUNTER (LOSS) TO BE
IN THOUSANDS SHARE PARTY’S SHARE TOTAL RECOGNIZED
Current estimate $ 316,825 $ 273,326 $ 590,151 $ 36,45510% reduction in disposition proceeds 312,142 218,993 531,135 31,77220% reduction in disposition proceeds 290,403 181,717 472,120 10,03330% reduction in disposition proceeds 266,100 147,006 413,106 (14,270)
If the swap counter party is unable to sell all of the commercial loans and real estate by the end of the tenth year for each transaction,the Company will begin receiving all of the annual operating cash flow from the remaining assets. Accordingly, the Company believesthat it is unlikely that the assets will not be sold within the ten-year term of each transaction.
Leases of Equipment
Income from leases of equipment consisted of the following components for the years ended December 31, 2005, 2004 and 2003:
IN THOUSANDS 2005 2004 2003
Air traffic control equipment $ 5,115 $ 9,211 $ 2,419Aircraft 4,589 2,129 3,488Telecommunications equipment 3,599 11,214 17,393Other 378 740 444
$ 13,681 $ 23,294 $ 23,744
In 2005, lease income was lower than 2004 due to the normal decline in leveraged lease income, partially offset by a $2.9 milliongain on the sale of a United Airlines bankruptcy claim. In 2004, lease income was essentially flat compared to 2003 as higher incomefrom the new air traffic control lease was offset by lower income from the telecommunications leases.
DISPOSITION PROCEEDS
ILLINOIS TOOL WORKS INC. 41
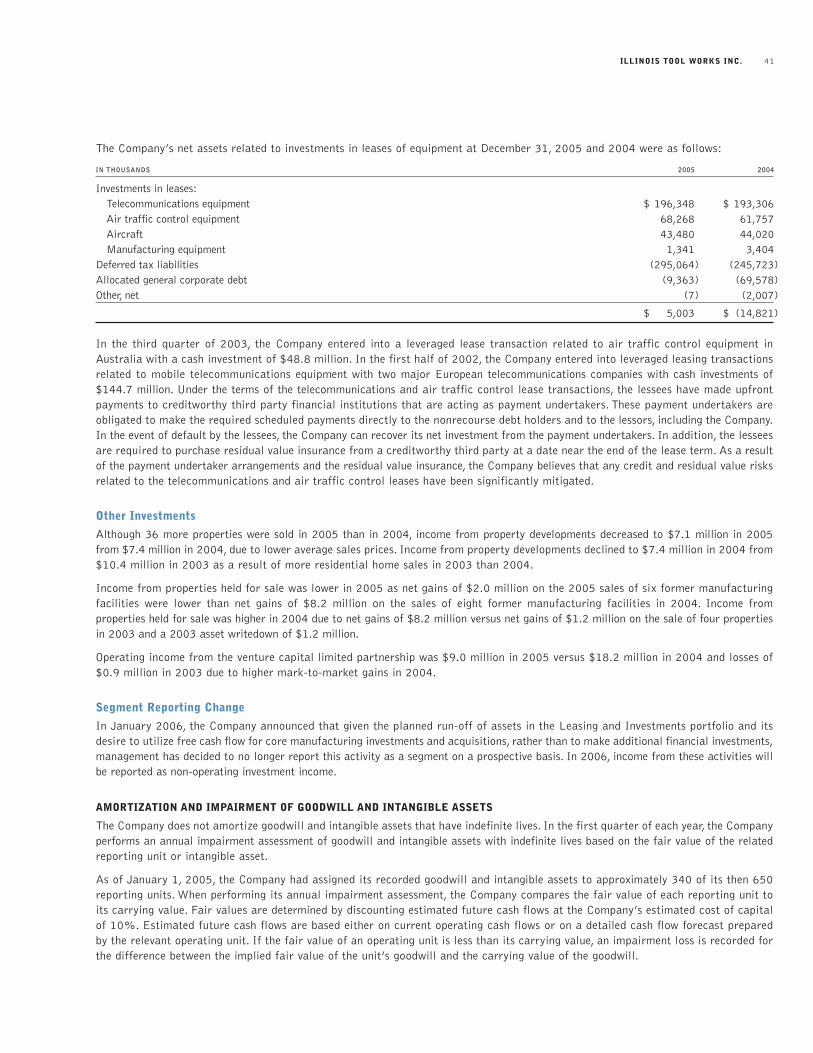
The Company’s net assets related to investments in leases of equipment at December 31, 2005 and 2004 were as follows:
IN THOUSANDS 2005 2004
Investments in leases:Telecommunications equipment $ 196,348 $ 193,306Air traffic control equipment 68,268 61,757Aircraft 43,480 44,020Manufacturing equipment 1,341 3,404
Deferred tax liabilities (295,064) (245,723)Allocated general corporate debt (9,363) (69,578)Other, net (7) (2,007)
$ 5,003 $ (14,821)
In the third quarter of 2003, the Company entered into a leveraged lease transaction related to air traffic control equipment inAustralia with a cash investment of $48.8 million. In the first half of 2002, the Company entered into leveraged leasing transactionsrelated to mobile telecommunications equipment with two major European telecommunications companies with cash investments of$144.7 million. Under the terms of the telecommunications and air traffic control lease transactions, the lessees have made upfrontpayments to creditworthy third party financial institutions that are acting as payment undertakers. These payment undertakers areobligated to make the required scheduled payments directly to the nonrecourse debt holders and to the lessors, including the Company.In the event of default by the lessees, the Company can recover its net investment from the payment undertakers. In addition, the lesseesare required to purchase residual value insurance from a creditworthy third party at a date near the end of the lease term. As a resultof the payment undertaker arrangements and the residual value insurance, the Company believes that any credit and residual value risksrelated to the telecommunications and air traffic control leases have been significantly mitigated.
Other Investments
Although 36 more properties were sold in 2005 than in 2004, income from property developments decreased to $7.1 million in 2005 from $7.4 million in 2004, due to lower average sales prices. Income from property developments declined to $7.4 million in 2004 from$10.4 million in 2003 as a result of more residential home sales in 2003 than 2004.
Income from properties held for sale was lower in 2005 as net gains of $2.0 million on the 2005 sales of six former manufacturingfacilities were lower than net gains of $8.2 million on the sales of eight former manufacturing facilities in 2004. Income from properties held for sale was higher in 2004 due to net gains of $8.2 million versus net gains of $1.2 million on the sale of four propertiesin 2003 and a 2003 asset writedown of $1.2 million.
Operating income from the venture capital limited partnership was $9.0 million in 2005 versus $18.2 million in 2004 and losses of$0.9 million in 2003 due to higher mark-to-market gains in 2004.
Segment Reporting Change
In January 2006, the Company announced that given the planned run-off of assets in the Leasing and Investments portfolio and itsdesire to utilize free cash flow for core manufacturing investments and acquisitions, rather than to make additional financial investments,management has decided to no longer report this activity as a segment on a prospective basis. In 2006, income from these activities willbe reported as non-operating investment income.
AMORTIZATION AND IMPAIRMENT OF GOODWILL AND INTANGIBLE ASSETS
The Company does not amortize goodwill and intangible assets that have indefinite lives. In the first quarter of each year, the Companyperforms an annual impairment assessment of goodwill and intangible assets with indefinite lives based on the fair value of the relatedreporting unit or intangible asset.
As of January 1, 2005, the Company had assigned its recorded goodwill and intangible assets to approximately 340 of its then 650reporting units. When performing its annual impairment assessment, the Company compares the fair value of each reporting unit toits carrying value. Fair values are determined by discounting estimated future cash flows at the Company’s estimated cost of capitalof 10%. Estimated future cash flows are based either on current operating cash flows or on a detailed cash flow forecast preparedby the relevant operating unit. If the fair value of an operating unit is less than its carrying value, an impairment loss is recorded forthe difference between the implied fair value of the unit’s goodwill and the carrying value of the goodwill.
2005 ANNUAL REPORT42
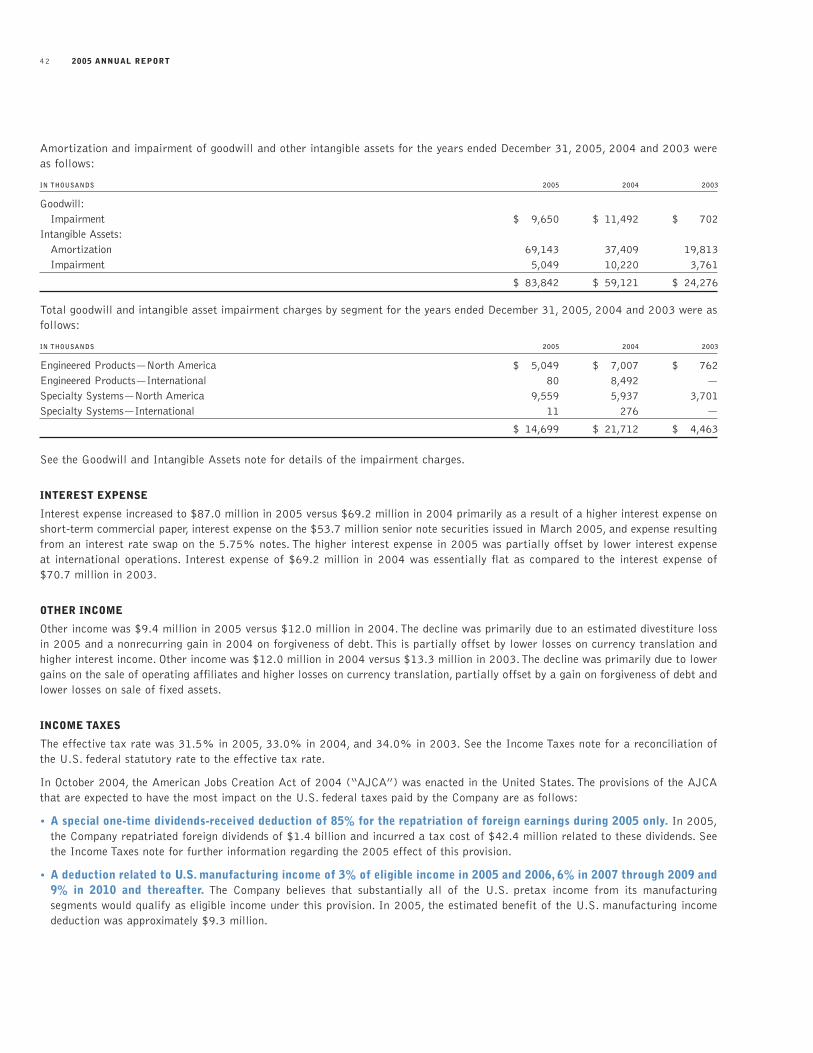
Amortization and impairment of goodwill and other intangible assets for the years ended December 31, 2005, 2004 and 2003 wereas follows:
IN THOUSANDS 2005 2004 2003
Goodwill:Impairment $ 9,650 $ 11,492 $ 702
Intangible Assets:Amortization 69,143 37,409 19,813Impairment 5,049 10,220 3,761
$ 83,842 $ 59,121 $ 24,276
Total goodwill and intangible asset impairment charges by segment for the years ended December 31, 2005, 2004 and 2003 were asfollows:
IN THOUSANDS 2005 2004 2003
Engineered Products—North America $ 5,049 $ 7,007 $ 762Engineered Products—International 80 8,492 —Specialty Systems—North America 9,559 5,937 3,701Specialty Systems—International 11 276 —
$ 14,699 $ 21,712 $ 4,463
See the Goodwill and Intangible Assets note for details of the impairment charges.
INTEREST EXPENSE
Interest expense increased to $87.0 million in 2005 versus $69.2 million in 2004 primarily as a result of a higher interest expense onshort-term commercial paper, interest expense on the $53.7 million senior note securities issued in March 2005, and expense resultingfrom an interest rate swap on the 5.75% notes. The higher interest expense in 2005 was partially offset by lower interest expense at international operations. Interest expense of $69.2 million in 2004 was essentially flat as compared to the interest expense of$70.7 million in 2003.
OTHER INCOME
Other income was $9.4 million in 2005 versus $12.0 million in 2004. The decline was primarily due to an estimated divestiture lossin 2005 and a nonrecurring gain in 2004 on forgiveness of debt. This is partially offset by lower losses on currency translation andhigher interest income. Other income was $12.0 million in 2004 versus $13.3 million in 2003.The decline was primarily due to lowergains on the sale of operating affiliates and higher losses on currency translation, partially offset by a gain on forgiveness of debt andlower losses on sale of fixed assets.
INCOME TAXES
The effective tax rate was 31.5% in 2005, 33.0% in 2004, and 34.0% in 2003. See the Income Taxes note for a reconciliation ofthe U.S. federal statutory rate to the effective tax rate.
In October 2004, the American Jobs Creation Act of 2004 (“AJCA”) was enacted in the United States. The provisions of the AJCAthat are expected to have the most impact on the U.S. federal taxes paid by the Company are as follows:
• A special one-time dividends-received deduction of 85% for the repatriation of foreign earnings during 2005 only. In 2005,the Company repatriated foreign dividends of $1.4 billion and incurred a tax cost of $42.4 million related to these dividends. Seethe Income Taxes note for further information regarding the 2005 effect of this provision.
• A deduction related to U.S. manufacturing income of 3% of eligible income in 2005 and 2006, 6% in 2007 through 2009 and9% in 2010 and thereafter. The Company believes that substantially all of the U.S. pretax income from its manufacturing segments would qualify as eligible income under this provision. In 2005, the estimated benefit of the U.S. manufacturing income deduction was approximately $9.3 million.
ILLINOIS TOOL WORKS INC. 43
• A gradual repeal of the exclusion of certain extraterritorial income (“ETI”) related to export sales from the U.S. This provisionprovides that the ETI benefit is reduced to 80% in 2005, 60% in 2006 and 0% in 2007 and thereafter. Because the Company generally manufactures locally in the major foreign countries in which it sells products, the repeal of the ETI benefit will not havea significant impact on the Company’s future U.S. tax payments. The benefit of the ETI exclusion was approximately $5.7 millionin 2005 and $7.4 million in 2004.
INCOME FROM CONTINUING OPERATIONS
Income from continuing operations in 2005 of $1,494.9 million ($5.20 per diluted share) was 11.6% higher than 2004 income of$1,339.6 million ($4.39 per diluted share). Income from continuing operations in 2004 was 28.8% higher than 2003 income of$1,040.2 million ($3.37 per diluted share).
FOREIGN CURRENCY
The weakening of the U.S. dollar against foreign currencies increased operating revenues by approximately $150 million in 2005,$430 million in 2004, and $520 million in 2003, and increased income from continuing operations by approximately 6 cents per dilutedshare in 2005, 15 cents per diluted share in 2004 and 16 cents per diluted share in 2003.
NEW ACCOUNTING PRONOUNCEMENT
Effective January 1, 2005, the Company adopted Statement of Financial Accounting Standards No. 123 (revised 2004), Share-BasedPayment (“SFAS 123R”), which requires the Company to measure the cost of employee services received in exchange for equity awardsbased on the grant date fair value. Starting in 2005, the Company recorded compensation cost related to the amortization of theunamortized grant date fair value of stock awards unvested as of December 31, 2004 over the remaining service periods of thoseawards. See the Stock-Based Compensation footnote for further details of the effect of the adoption of this pronouncement.
2006 FORECAST
The Company believes that while its end markets will remain relatively stable in 2006, the contribution from Leasing and Investmentswill diminish substantially in the upcoming year. As a result, the Company is forecasting full-year 2006 income from continuing operationsto be in a range of $5.60 to $5.78 per diluted share. The following key assumptions were used for this forecast:
• base business revenue growth in a range of 3.2% to 5.2%;• foreign exchange rates holding at year-end 2005 levels;• annualized revenues from acquired companies in a range of $800 million to $1.0 billion;• restructuring costs of $30 million to $50 million;• nonoperating investment income of $45 to $55 million, which is lower than 2005 by $75 to $85 million;• estimated impairment of goodwill/intangibles of $15 to $25 million;• operating income (excluding Leasing and Investments) to increase between 9.4% and 13.0% for full-year 2006;• an effective tax rate of 31.5%.
The Company updates its forecast and assumptions throughout the year via monthly press releases.
DISCONTINUED OPERATIONS
Discontinued Operations represents the Company’s former Consumer Products segment which was comprised of the following businesses: Precor specialty exercise equipment, West Bend small appliances and premium cookware, and Florida Tile ceramic tile.The Company’s net loss on disposal of the segment was $0.9 million in 2004 and $16.5 million in 2003.
LIQUIDITY AND CAPITAL RESOURCES
Cash Flow
The Company’s primary source of liquidity is free operating cash flow. Management continues to believe that such internally generatedcash flow will be adequate to service existing debt and to continue to pay dividends that meet its dividend payout objective of 25% to30% of the last three years’ average net income. In addition, free operating cash flow is expected to be adequate to finance internal growthand small- to medium-sized acquisitions.
The Company uses free operating cash flow to measure normal cash flow generated by its operations that is available for dividends,acquisitions and debt repayment. Free operating cash flow is a measurement that is not the same as net cash flow from operatingactivities per the statement of cash flows and may not be consistent with similarly titled measures used by other companies.
2005 ANNUAL REPORT44
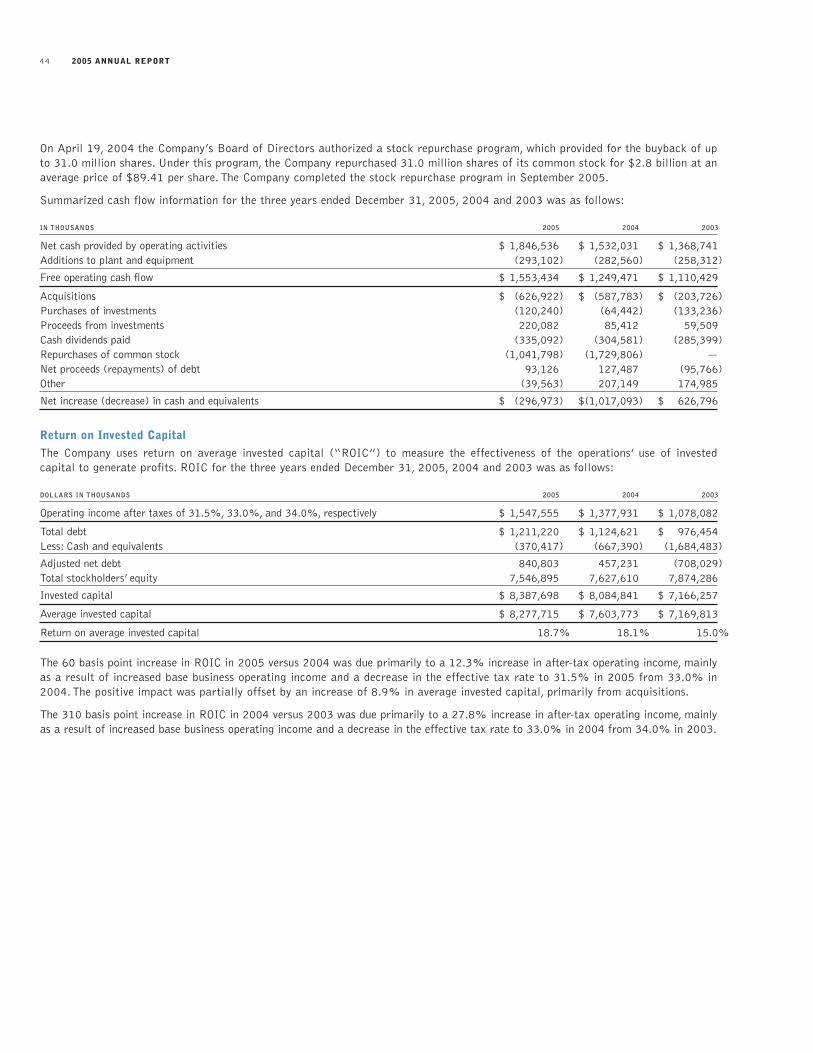
On April 19, 2004 the Company’s Board of Directors authorized a stock repurchase program, which provided for the buyback of upto 31.0 million shares. Under this program, the Company repurchased 31.0 million shares of its common stock for $2.8 billion at anaverage price of $89.41 per share. The Company completed the stock repurchase program in September 2005.
Summarized cash flow information for the three years ended December 31, 2005, 2004 and 2003 was as follows:
IN THOUSANDS 2005 2004 2003
Net cash provided by operating activities $ 1,846,536 $ 1,532,031 $ 1,368,741Additions to plant and equipment (293,102) (282,560) (258,312)
Free operating cash flow $ 1,553,434 $ 1,249,471 $ 1,110,429
Acquisitions $ (626,922) $ (587,783) $ (203,726)Purchases of investments (120,240) (64,442) (133,236)Proceeds from investments 220,082 85,412 59,509 Cash dividends paid (335,092) (304,581) (285,399)Repurchases of common stock (1,041,798) (1,729,806) —Net proceeds (repayments) of debt 93,126 127,487 (95,766)Other (39,563) 207,149 174,985
Net increase (decrease) in cash and equivalents $ (296,973) $(1,017,093) $ 626,796
Return on Invested Capital
The Company uses return on average invested capital (“ROIC”) to measure the effectiveness of the operations’ use of invested capital to generate profits. ROIC for the three years ended December 31, 2005, 2004 and 2003 was as follows:
DOLLARS IN THOUSANDS 2005 2004 2003
Operating income after taxes of 31.5%, 33.0%, and 34.0%, respectively $ 1,547,555 $ 1,377,931 $ 1,078,082
Total debt $ 1,211,220 $ 1,124,621 $ 976,454Less: Cash and equivalents (370,417) (667,390) (1,684,483)
Adjusted net debt 840,803 457,231 (708,029)Total stockholders’ equity 7,546,895 7,627,610 7,874,286
Invested capital $ 8,387,698 $ 8,084,841 $ 7,166,257
Average invested capital $ 8,277,715 $ 7,603,773 $ 7,169,813
Return on average invested capital 18.7% 18.1% 15.0%
The 60 basis point increase in ROIC in 2005 versus 2004 was due primarily to a 12.3% increase in after-tax operating income, mainlyas a result of increased base business operating income and a decrease in the effective tax rate to 31.5% in 2005 from 33.0% in2004. The positive impact was partially offset by an increase of 8.9% in average invested capital, primarily from acquisitions.
The 310 basis point increase in ROIC in 2004 versus 2003 was due primarily to a 27.8% increase in after-tax operating income, mainlyas a result of increased base business operating income and a decrease in the effective tax rate to 33.0% in 2004 from 34.0% in 2003.
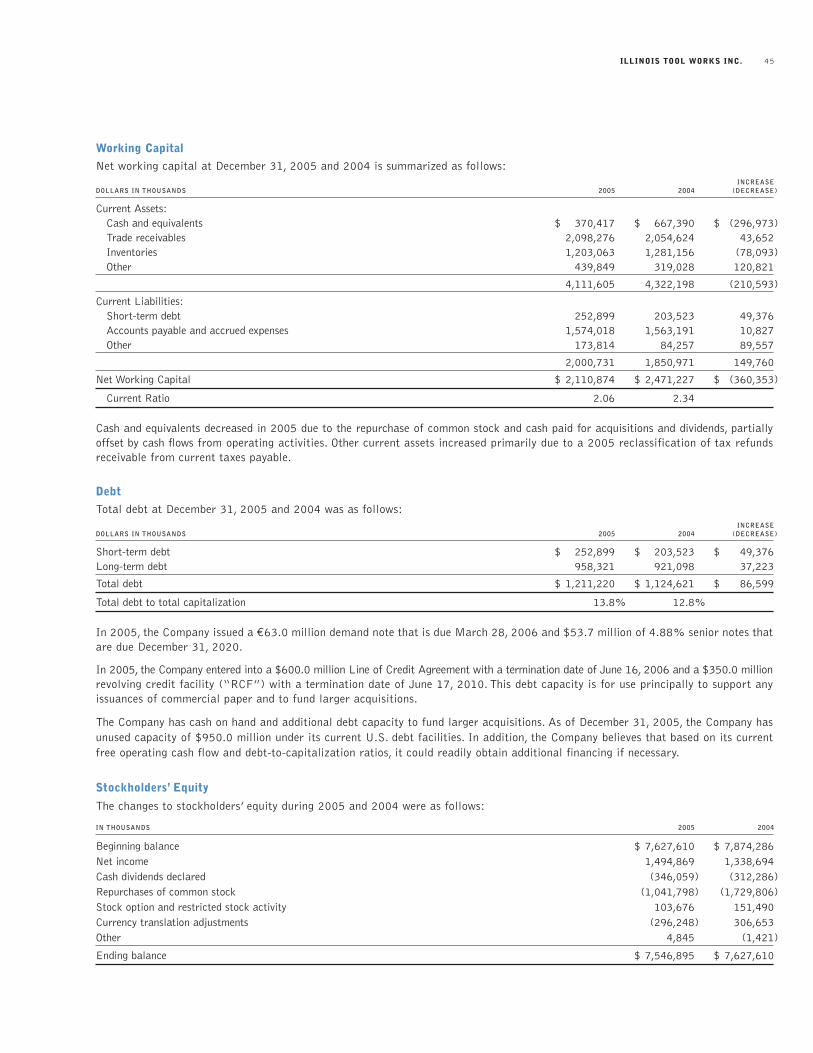
ILLINOIS TOOL WORKS INC. 45
Working Capital
Net working capital at December 31, 2005 and 2004 is summarized as follows:INCREASE
DOLLARS IN THOUSANDS 2005 2004 (DECREASE)
Current Assets:Cash and equivalents $ 370,417 $ 667,390 $ (296,973) Trade receivables 2,098,276 2,054,624 43,652 Inventories 1,203,063 1,281,156 (78,093)Other 439,849 319,028 120,821
4,111,605 4,322,198 (210,593)
Current Liabilities:Short-term debt 252,899 203,523 49,376Accounts payable and accrued expenses 1,574,018 1,563,191 10,827Other 173,814 84,257 89,557
2,000,731 1,850,971 149,760
Net Working Capital $ 2,110,874 $ 2,471,227 $ (360,353)
Current Ratio 2.06 2.34
Cash and equivalents decreased in 2005 due to the repurchase of common stock and cash paid for acquisitions and dividends, partially offset by cash flows from operating activities. Other current assets increased primarily due to a 2005 reclassification of tax refundsreceivable from current taxes payable.
Debt
Total debt at December 31, 2005 and 2004 was as follows:INCREASE
DOLLARS IN THOUSANDS 2005 2004 (DECREASE)
Short-term debt $ 252,899 $ 203,523 $ 49,376Long-term debt 958,321 921,098 37,223
Total debt $ 1,211,220 $ 1,124,621 $ 86,599
Total debt to total capitalization 13.8% 12.8%
In 2005, the Company issued a €63.0 million demand note that is due March 28, 2006 and $53.7 million of 4.88% senior notes thatare due December 31, 2020.
In 2005, the Company entered into a $600.0 million Line of Credit Agreement with a termination date of June 16, 2006 and a $350.0 millionrevolving credit facility (“RCF”) with a termination date of June 17, 2010. This debt capacity is for use principally to support anyissuances of commercial paper and to fund larger acquisitions.
The Company has cash on hand and additional debt capacity to fund larger acquisitions. As of December 31, 2005, the Company hasunused capacity of $950.0 million under its current U.S. debt facilities. In addition, the Company believes that based on its currentfree operating cash flow and debt-to-capitalization ratios, it could readily obtain additional financing if necessary.
Stockholders’ Equity
The changes to stockholders’ equity during 2005 and 2004 were as follows:
IN THOUSANDS 2005 2004
Beginning balance $ 7,627,610 $ 7,874,286Net income 1,494,869 1,338,694Cash dividends declared (346,059) (312,286)Repurchases of common stock (1,041,798) (1,729,806)Stock option and restricted stock activity 103,676 151,490Currency translation adjustments (296,248) 306,653Other 4,845 (1,421)
Ending balance $ 7,546,895 $ 7,627,610
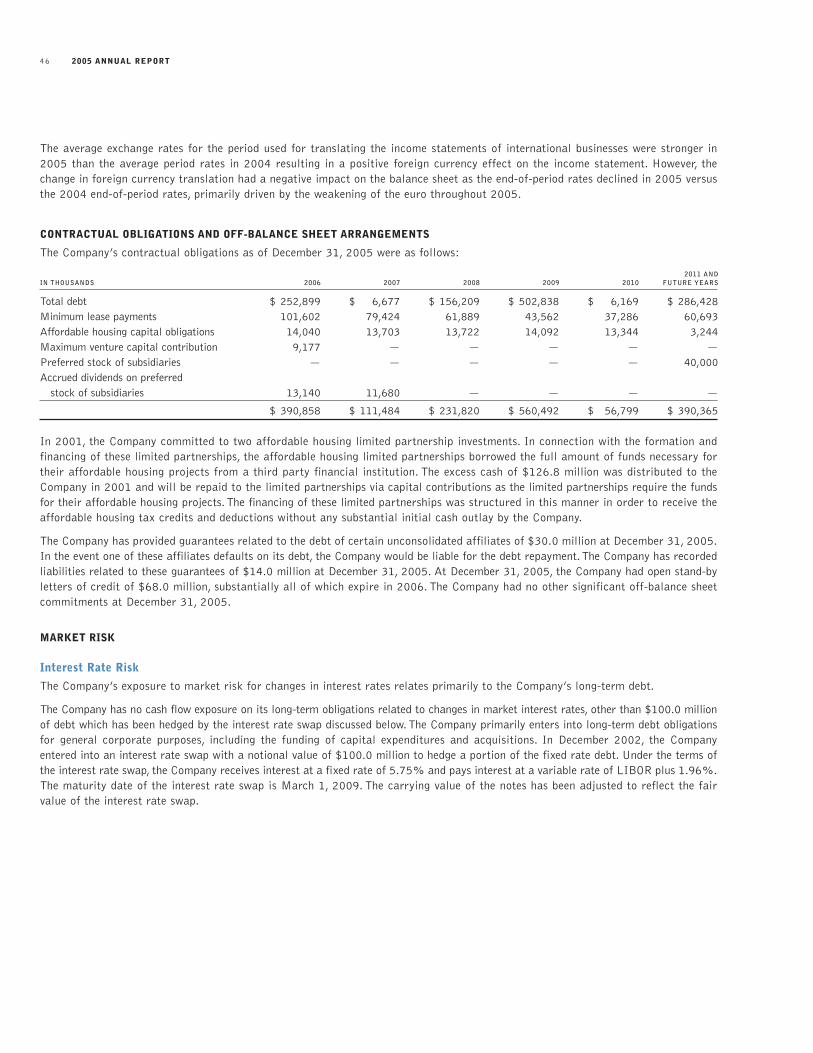
2005 ANNUAL REPORT46
The average exchange rates for the period used for translating the income statements of international businesses were stronger in2005 than the average period rates in 2004 resulting in a positive foreign currency effect on the income statement. However, thechange in foreign currency translation had a negative impact on the balance sheet as the end-of-period rates declined in 2005 versusthe 2004 end-of-period rates, primarily driven by the weakening of the euro throughout 2005.
CONTRACTUAL OBLIGATIONS AND OFF-BALANCE SHEET ARRANGEMENTS
The Company’s contractual obligations as of December 31, 2005 were as follows:
2011 ANDIN THOUSANDS 2006 2007 2008 2009 2010 FUTURE YEARS
Total debt $ 252,899 $ 6,677 $ 156,209 $ 502,838 $ 6,169 $ 286,428Minimum lease payments 101,602 79,424 61,889 43,562 37,286 60,693Affordable housing capital obligations 14,040 13,703 13,722 14,092 13,344 3,244Maximum venture capital contribution 9,177 — — — — —Preferred stock of subsidiaries — — — — — 40,000Accrued dividends on preferred
stock of subsidiaries 13,140 11,680 — — — —
$ 390,858 $ 111,484 $ 231,820 $ 560,492 $ 56,799 $ 390,365
In 2001, the Company committed to two affordable housing limited partnership investments. In connection with the formation andfinancing of these limited partnerships, the affordable housing limited partnerships borrowed the full amount of funds necessary fortheir affordable housing projects from a third party financial institution. The excess cash of $126.8 million was distributed to theCompany in 2001 and will be repaid to the limited partnerships via capital contributions as the limited partnerships require the fundsfor their affordable housing projects. The financing of these limited partnerships was structured in this manner in order to receive theaffordable housing tax credits and deductions without any substantial initial cash outlay by the Company.
The Company has provided guarantees related to the debt of certain unconsolidated affiliates of $30.0 million at December 31, 2005.In the event one of these affiliates defaults on its debt, the Company would be liable for the debt repayment.The Company has recordedliabilities related to these guarantees of $14.0 million at December 31, 2005. At December 31, 2005, the Company had open stand-byletters of credit of $68.0 million, substantially all of which expire in 2006. The Company had no other significant off-balance sheetcommitments at December 31, 2005.
MARKET RISK
Interest Rate Risk
The Company’s exposure to market risk for changes in interest rates relates primarily to the Company’s long-term debt.
The Company has no cash flow exposure on its long-term obligations related to changes in market interest rates, other than $100.0 millionof debt which has been hedged by the interest rate swap discussed below. The Company primarily enters into long-term debt obligationsfor general corporate purposes, including the funding of capital expenditures and acquisitions. In December 2002, the Companyentered into an interest rate swap with a notional value of $100.0 million to hedge a portion of the fixed rate debt. Under the terms ofthe interest rate swap, the Company receives interest at a fixed rate of 5.75% and pays interest at a variable rate of LIBOR plus 1.96%.The maturity date of the interest rate swap is March 1, 2009. The carrying value of the notes has been adjusted to reflect the fairvalue of the interest rate swap.
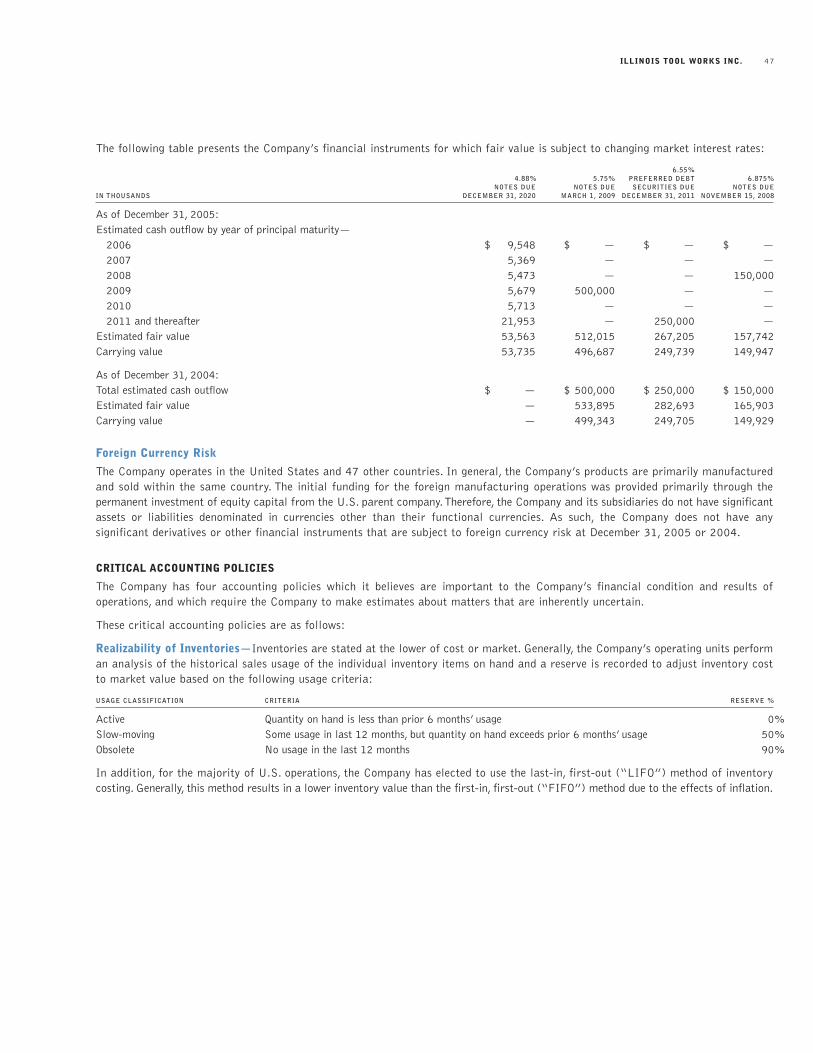
ILLINOIS TOOL WORKS INC. 47
The following table presents the Company’s financial instruments for which fair value is subject to changing market interest rates:
6.55%4.88% 5.75% PREFERRED DEBT 6.875%
NOTES DUE NOTES DUE SECURITIES DUE NOTES DUEIN THOUSANDS DECEMBER 31, 2020 MARCH 1, 2009 DECEMBER 31, 2011 NOVEMBER 15, 2008
As of December 31, 2005:Estimated cash outflow by year of principal maturity—
2006 $ 9,548 $ — $ — $ —2007 5,369 — — —2008 5,473 — — 150,0002009 5,679 500,000 — —2010 5,713 — — —2011 and thereafter 21,953 — 250,000 —
Estimated fair value 53,563 512,015 267,205 157,742Carrying value 53,735 496,687 249,739 149,947
As of December 31, 2004:Total estimated cash outflow $ — $ 500,000 $ 250,000 $ 150,000Estimated fair value — 533,895 282,693 165,903Carrying value — 499,343 249,705 149,929
Foreign Currency Risk
The Company operates in the United States and 47 other countries. In general, the Company’s products are primarily manufacturedand sold within the same country. The initial funding for the foreign manufacturing operations was provided primarily through the permanent investment of equity capital from the U.S. parent company.Therefore, the Company and its subsidiaries do not have significantassets or liabilities denominated in currencies other than their functional currencies. As such, the Company does not have any significant derivatives or other financial instruments that are subject to foreign currency risk at December 31, 2005 or 2004.
CRITICAL ACCOUNTING POLICIES
The Company has four accounting policies which it believes are important to the Company’s financial condition and results of operations, and which require the Company to make estimates about matters that are inherently uncertain.
These critical accounting policies are as follows:
Realizability of Inventories—Inventories are stated at the lower of cost or market. Generally, the Company’s operating units performan analysis of the historical sales usage of the individual inventory items on hand and a reserve is recorded to adjust inventory costto market value based on the following usage criteria:
USAGE CLASSIFICATION CRITERIA RESERVE %
Active Quantity on hand is less than prior 6 months’ usage 0%Slow-moving Some usage in last 12 months, but quantity on hand exceeds prior 6 months’ usage 50%Obsolete No usage in the last 12 months 90%
In addition, for the majority of U.S. operations, the Company has elected to use the last-in, first-out (“LIFO”) method of inventorycosting. Generally, this method results in a lower inventory value than the first-in, first-out (“FIFO”) method due to the effects of inflation.
2005 ANNUAL REPORT48
Collectibility of Accounts Receivable—The Company estimates the allowance for uncollectible accounts based on the greater of aspecific reserve for past due accounts or a reserve calculated based on the historical write-off percentage over the last two years. Inaddition, the allowance for uncollectible accounts includes reserves for customer credits and cash discounts, which are also estimatedbased on past experience.
Depreciation of Plant and Equipment—The Company’s U.S. businesses compute depreciation on an accelerated basis, as follows:
Buildings and improvements 150% declining balanceMachinery and equipment 200% declining balance
The majority of the international businesses compute depreciation on a straight-line basis to conform to their local statutory accountingand tax regulations.
Income Taxes—The Company provides deferred income tax assets and liabilities based on the estimated future tax effects of differencesbetween the financial and tax bases of assets and liabilities based on currently enacted tax laws. The Company’s tax balances arebased on management’s interpretation of the tax regulations and rulings in numerous taxing jurisdictions. Income tax expense recognizedby the Company also reflects its best estimates and assumptions regarding, among other things, the level of future taxable income andeffect of the Company’s various tax planning strategies. Future tax authority rulings and changes in tax laws, changes in projected levelsof taxable income and future tax planning strategies could affect the actual effective tax rate and tax balances recorded by the Company.
The Company believes that the above critical policies have resulted in past actual results approximating the estimated amounts inthose areas.
Forward-Looking StatementsThis annual report contains forward-looking statements within the meaning of the Private Securities Litigation Reform Act of 1995including, without limitation, statements regarding the Company’s 2006 forecasts and assumptions, the adequacy of internally generatedfunds, the recoverability of the Company’s investments in mortgage entities, future cash flows and income from the Company’s mortgageinvestments, equipment leases, the meeting of dividend payout objectives, the impact of the repeal of the ETI benefit on the Company’sfuture U.S. tax payments, the impact of the AJCA including the amount of U.S. pre-tax manufacturing income that would qualify aseligible income, payments under guarantees, the Company’s portion of future benefit payments related to pension and postretirementbenefits, the availability of additional financing and the outcome of outstanding legal proceedings.These statements are subject to certainrisks, uncertainties, and other factors, which could cause actual results to differ materially from those anticipated. Important risks thatmay influence future results include (1) a downturn in the construction, automotive, general industrial, food institutional and retail,or real estate markets, (2) deterioration in global and domestic business and economic conditions, particularly in North America, theEuropean Community, Asia or Australia, (3) the unfavorable impact of foreign currency fluctuations and costs of raw materials, (4) aninterruption in, or reduction in, introducing new products into the Company’s product lines, (5) an unfavorable environment for makingacquisitions, domestic and international, including adverse accounting or regulatory requirements and market values of candidates, and(6) unfavorable tax law changes and tax authority rulings.The risks covered here are not all inclusive and given these and other possiblerisks and uncertainties, investors should not place undue reliance on forward-looking statements as a prediction of actual results.
ITW practices fair disclosure for all interested parties. Investors should be aware that while ITW regularly communicates with securitiesanalysts and other investment professionals, it is against ITW’s policy to disclose to them any material non-public information orother confidential commercial information. Shareholders should not assume that ITW agrees with any statement or report issued byany analyst irrespective of the content of the statement or report.
ILLINOIS TOOL WORKS INC. 49
Management Report on Internal Control over Financial ReportingThe management of Illinois Tool Works Inc. (“ITW”) is responsible for establishing and maintaining adequate internal control overfinancial reporting, as such term is defined in Exchange Act Rule 13a-15(f). ITW’s internal control system was designed to providereasonable assurance to the Company’s management and board of directors regarding the preparation and fair presentation of publishedfinancial statements.
All internal control systems, no matter how well designed, have inherent limitations. Therefore, even those systems determined to beeffective can provide only reasonable assurance with respect to financial statement preparation and presentation.
ITW management assessed the effectiveness of the Company’s internal control over financial reporting as of December 31, 2005. Inmaking this assessment, it used the criteria set forth by the Committee of Sponsoring Organizations of the Treadway Commission(COSO) in Internal Control—Integrated Framework. Based on our assessment we believe that, as of December 31, 2005, theCompany’s internal control over financial reporting is effective based on those criteria.
Our Management’s assessment of the effectiveness of our internal control over financial reporting as of December 31, 2005 has beenaudited by Deloitte & Touche LLP, an independent registered public accounting firm, as stated in their attestation report which isincluded herein.
DAVID B. SPEER RONALD D. KROPPPresident and Chief Executive Officer Vice President and Controller, Financial ReportingFebruary 24, 2006 February 24, 2006
2005 ANNUAL REPORT50
Report of Independent Registered Public Accounting Firm To the Board of Directors and Stockholders of Illinois Tool Works Inc.:
We have audited the accompanying statements of financial position of Illinois Tool Works Inc. and Subsidiaries (the “Company”) asof December 31, 2005 and 2004, and the related statements of income, income reinvested in the business, comprehensive income andcash flows for each of the three years in the period ended December 31, 2005. We also have audited management’s assessment, includedin the accompanying Management Report on Internal Control over Financial Reporting, dated February 24, 2006, that the Companymaintained effective internal control over financial reporting as of December 31, 2005, based on criteria established in InternalControl—Integrated Framework issued by the Committee of Sponsoring Organizations of the Treadway Commission. The Company’smanagement is responsible for these financial statements, for maintaining effective internal control over financial reporting, and forits assessment of the effectiveness of internal control over financial reporting. Our responsibility is to express an opinion on thesefinancial statements, an opinion on management’s assessment, and an opinion on the effectiveness of the Company’s internal controlover financial reporting based on our audits.
We conducted our audits in accordance with the standards of the Public Company Accounting Oversight Board (United States).Thosestandards require that we plan and perform the audit to obtain reasonable assurance about whether the financial statements are freeof material misstatement and whether effective internal control over financial reporting was maintained in all material respects. Ouraudit of financial statements included examining, on a test basis, evidence supporting the amounts and disclosures in the financialstatements, assessing the accounting principles used and significant estimates made by management, and evaluating the overall financialstatement presentation. Our audit of internal control over financial reporting included obtaining an understanding of internal controlover financial reporting, evaluating management’s assessment, testing and evaluating the design and operating effectiveness of internalcontrol, and performing such other procedures as we considered necessary in the circumstances. We believe that our audits provide areasonable basis for our opinions.
A company’s internal control over financial reporting is a process designed by, or under the supervision of, a company’s principal executiveand principal financial officers, or persons performing similar functions, and effected by a company’s board of directors, management,and other personnel to provide reasonable assurance regarding the reliability of financial reporting and the preparation of financialstatements for external purposes in accordance with generally accepted accounting principles. A company’s internal control over financialreporting includes those policies and procedures that (1) pertain to the maintenance of records that, in reasonable detail, accuratelyand fairly reflect the transactions and dispositions of the assets of the company; (2) provide reasonable assurance that transactions arerecorded as necessary to permit preparation of financial statements in accordance with generally accepted accounting principles, andthat receipts and expenditures of a company are being made only in accordance with authorizations of management and directors of acompany; and (3) provide reasonable assurance regarding prevention or timely detection of unauthorized acquisition, use, or dispositionof a company’s assets that could have a material effect on the financial statements.
Because of the inherent limitations of internal control over financial reporting, including the possibility of collusion or improper management override of controls, material misstatements due to error or fraud may not be prevented or detected on a timely basis.Also, projections of any evaluation of the effectiveness of the internal control over financial reporting to future periods are subject tothe risk that the controls may become inadequate because of changes in conditions, or that the degree of compliance with the policiesor procedures may deteriorate.
In our opinion, the consolidated financial statements referred to above present fairly, in all material respects, the financial positionof the Company as of December 31, 2005 and 2004, and the results of its operations and its cash flows for each of the three yearsin the period ended December 31, 2005, in conformity with accounting principles generally accepted in the United States of America.Also in our opinion, management’s assessment that the Company maintained effective internal control over financial reporting as ofDecember 31, 2005, is fairly stated, in all material respects, based on the criteria established in Internal Control—IntegratedFramework issued by the Committee of Sponsoring Organizations of the Treadway Commission. Furthermore, in our opinion, theCompany maintained, in all material respects, effective internal control over financial reporting as of December 31, 2005, based onthe criteria established in Internal Control—Integrated Framework issued by the Committee of Sponsoring Organizations of theTreadway Commission.
DELOITTE & TOUCHE LLPChicago, IllinoisFebruary 24, 2006
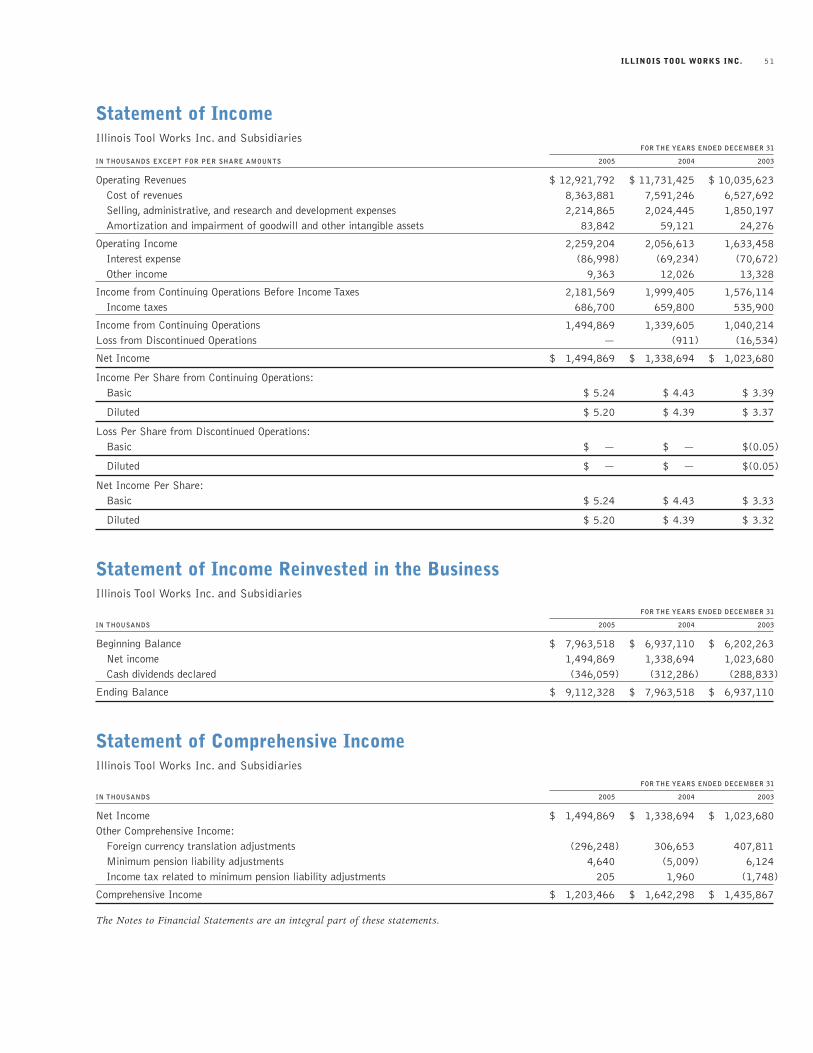
ILLINOIS TOOL WORKS INC. 51
Statement of IncomeIllinois Tool Works Inc. and Subsidiaries
FOR THE YEARS ENDED DECEMBER 31
IN THOUSANDS EXCEPT FOR PER SHARE AMOUNTS 2005 2004 2003
Operating Revenues $ 12,921,792 $ 11,731,425 $ 10,035,623Cost of revenues 8,363,881 7,591,246 6,527,692Selling, administrative, and research and development expenses 2,214,865 2,024,445 1,850,197Amortization and impairment of goodwill and other intangible assets 83,842 59,121 24,276
Operating Income 2,259,204 2,056,613 1,633,458Interest expense (86,998) (69,234) (70,672)Other income 9,363 12,026 13,328
Income from Continuing Operations Before Income Taxes 2,181,569 1,999,405 1,576,114Income taxes 686,700 659,800 535,900
Income from Continuing Operations 1,494,869 1,339,605 1,040,214Loss from Discontinued Operations — (911) (16,534)
Net Income $ 1,494,869 $ 1,338,694 $ 1,023,680
Income Per Share from Continuing Operations:Basic $ 5.24 $ 4.43 $ 3.39
Diluted $ 5.20 $ 4.39 $ 3.37
Loss Per Share from Discontinued Operations:Basic $ — $ — $(0.05)
Diluted $ — $ — $(0.05)
Net Income Per Share:Basic $ 5.24 $ 4.43 $ 3.33
Diluted $ 5.20 $ 4.39 $ 3.32
Statement of Income Reinvested in the BusinessIllinois Tool Works Inc. and Subsidiaries
FOR THE YEARS ENDED DECEMBER 31
IN THOUSANDS 2005 2004 2003
Beginning Balance $ 7,963,518 $ 6,937,110 $ 6,202,263Net income 1,494,869 1,338,694 1,023,680Cash dividends declared (346,059) (312,286) (288,833)
Ending Balance $ 9,112,328 $ 7,963,518 $ 6,937,110
Statement of Comprehensive IncomeIllinois Tool Works Inc. and Subsidiaries
FOR THE YEARS ENDED DECEMBER 31
IN THOUSANDS 2005 2004 2003
Net Income $ 1,494,869 $ 1,338,694 $ 1,023,680Other Comprehensive Income:
Foreign currency translation adjustments (296,248) 306,653 407,811Minimum pension liability adjustments 4,640 (5,009) 6,124Income tax related to minimum pension liability adjustments 205 1,960 (1,748)
Comprehensive Income $ 1,203,466 $ 1,642,298 $ 1,435,867
The Notes to Financial Statements are an integral part of these statements.
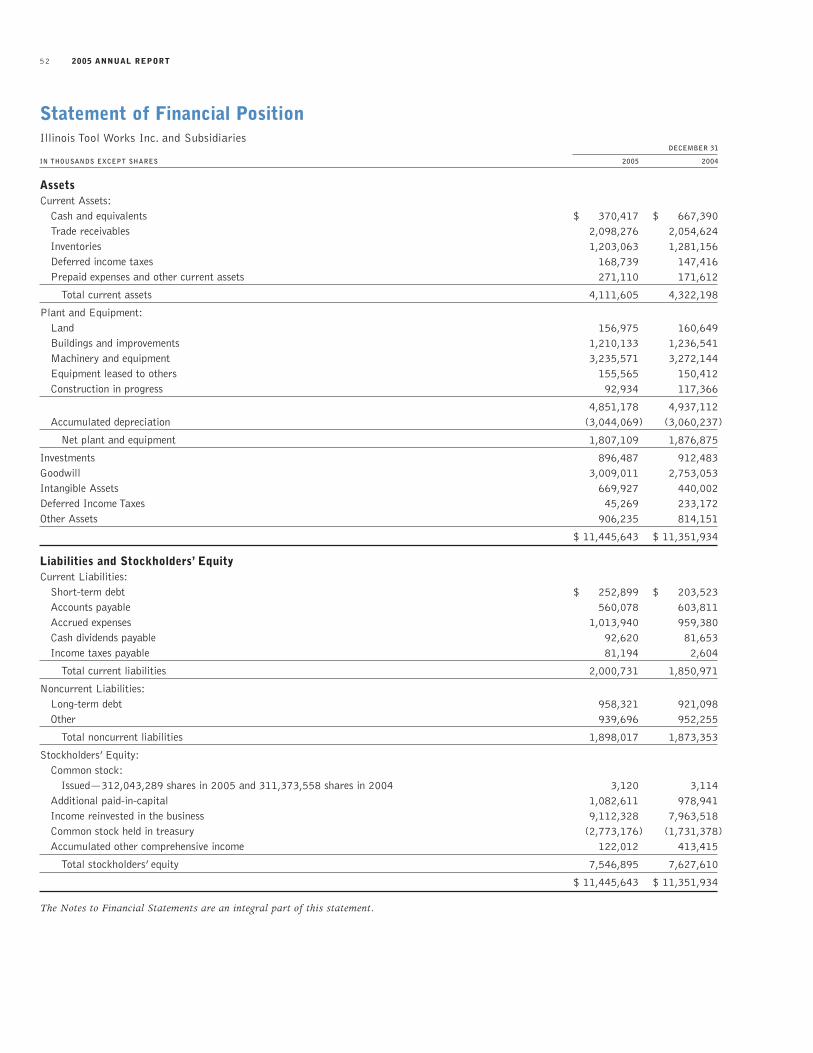
2005 ANNUAL REPORT52
Statement of Financial PositionIllinois Tool Works Inc. and Subsidiaries
DECEMBER 31
IN THOUSANDS EXCEPT SHARES 2005 2004
AssetsCurrent Assets:
Cash and equivalents $ 370,417 $ 667,390Trade receivables 2,098,276 2,054,624Inventories 1,203,063 1,281,156Deferred income taxes 168,739 147,416Prepaid expenses and other current assets 271,110 171,612
Total current assets 4,111,605 4,322,198
Plant and Equipment:Land 156,975 160,649Buildings and improvements 1,210,133 1,236,541Machinery and equipment 3,235,571 3,272,144Equipment leased to others 155,565 150,412Construction in progress 92,934 117,366
4,851,178 4,937,112Accumulated depreciation (3,044,069) (3,060,237)
Net plant and equipment 1,807,109 1,876,875
Investments 896,487 912,483Goodwill 3,009,011 2,753,053Intangible Assets 669,927 440,002Deferred Income Taxes 45,269 233,172Other Assets 906,235 814,151
$ 11,445,643 $ 11,351,934
Liabilities and Stockholders’ EquityCurrent Liabilities:
Short-term debt $ 252,899 $ 203,523Accounts payable 560,078 603,811Accrued expenses 1,013,940 959,380Cash dividends payable 92,620 81,653Income taxes payable 81,194 2,604
Total current liabilities 2,000,731 1,850,971
Noncurrent Liabilities:Long-term debt 958,321 921,098Other 939,696 952,255
Total noncurrent liabilities 1,898,017 1,873,353
Stockholders’ Equity:Common stock:
Issued—312,043,289 shares in 2005 and 311,373,558 shares in 2004 3,120 3,114Additional paid-in-capital 1,082,611 978,941Income reinvested in the business 9,112,328 7,963,518Common stock held in treasury (2,773,176) (1,731,378)Accumulated other comprehensive income 122,012 413,415
Total stockholders’ equity 7,546,895 7,627,610
$ 11,445,643 $ 11,351,934
The Notes to Financial Statements are an integral part of this statement.
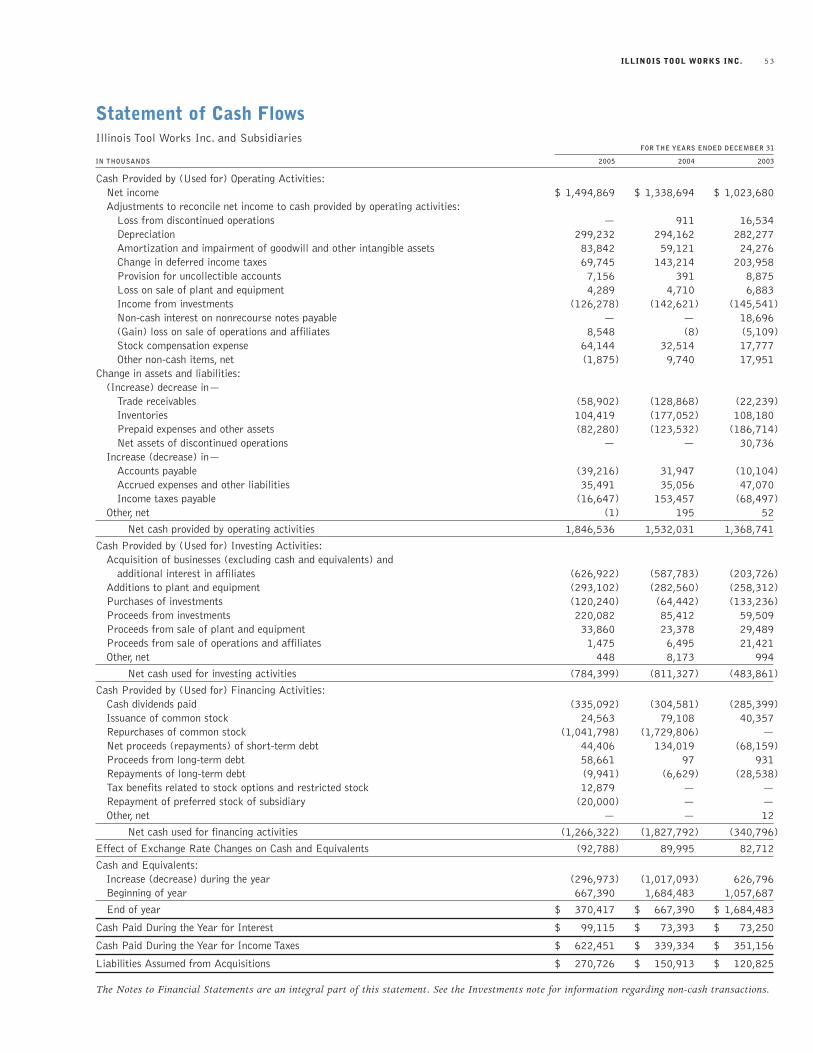
ILLINOIS TOOL WORKS INC. 53
Statement of Cash FlowsIllinois Tool Works Inc. and Subsidiaries
FOR THE YEARS ENDED DECEMBER 31
IN THOUSANDS 2005 2004 2003
Cash Provided by (Used for) Operating Activities:Net income $ 1,494,869 $ 1,338,694 $ 1,023,680Adjustments to reconcile net income to cash provided by operating activities:
Loss from discontinued operations — 911 16,534Depreciation 299,232 294,162 282,277Amortization and impairment of goodwill and other intangible assets 83,842 59,121 24,276Change in deferred income taxes 69,745 143,214 203,958Provision for uncollectible accounts 7,156 391 8,875Loss on sale of plant and equipment 4,289 4,710 6,883Income from investments (126,278) (142,621) (145,541)Non-cash interest on nonrecourse notes payable — — 18,696(Gain) loss on sale of operations and affiliates 8,548 (8) (5,109)Stock compensation expense 64,144 32,514 17,777Other non-cash items, net (1,875) 9,740 17,951
Change in assets and liabilities:(Increase) decrease in—
Trade receivables (58,902) (128,868) (22,239)Inventories 104,419 (177,052) 108,180Prepaid expenses and other assets (82,280) (123,532) (186,714)Net assets of discontinued operations — — 30,736
Increase (decrease) in—Accounts payable (39,216) 31,947 (10,104)Accrued expenses and other liabilities 35,491 35,056 47,070Income taxes payable (16,647) 153,457 (68,497)
Other, net (1) 195 52
Net cash provided by operating activities 1,846,536 1,532,031 1,368,741
Cash Provided by (Used for) Investing Activities:Acquisition of businesses (excluding cash and equivalents) and
additional interest in affiliates (626,922) (587,783) (203,726)Additions to plant and equipment (293,102) (282,560) (258,312)Purchases of investments (120,240) (64,442) (133,236)Proceeds from investments 220,082 85,412 59,509Proceeds from sale of plant and equipment 33,860 23,378 29,489Proceeds from sale of operations and affiliates 1,475 6,495 21,421Other, net 448 8,173 994
Net cash used for investing activities (784,399) (811,327) (483,861)
Cash Provided by (Used for) Financing Activities:Cash dividends paid (335,092) (304,581) (285,399)Issuance of common stock 24,563 79,108 40,357Repurchases of common stock (1,041,798) (1,729,806) —Net proceeds (repayments) of short-term debt 44,406 134,019 (68,159)Proceeds from long-term debt 58,661 97 931Repayments of long-term debt (9,941) (6,629) (28,538)Tax benefits related to stock options and restricted stock 12,879 — —Repayment of preferred stock of subsidiary (20,000) — —Other, net — — 12
Net cash used for financing activities (1,266,322) (1,827,792) (340,796)
Effect of Exchange Rate Changes on Cash and Equivalents (92,788) 89,995 82,712
Cash and Equivalents:Increase (decrease) during the year (296,973) (1,017,093) 626,796Beginning of year 667,390 1,684,483 1,057,687
End of year $ 370,417 $ 667,390 $ 1,684,483
Cash Paid During the Year for Interest $ 99,115 $ 73,393 $ 73,250
Cash Paid During the Year for Income Taxes $ 622,451 $ 339,334 $ 351,156
Liabilities Assumed from Acquisitions $ 270,726 $ 150,913 $ 120,825
The Notes to Financial Statements are an integral part of this statement. See the Investments note for information regarding non-cash transactions.

2005 ANNUAL REPORT54
Notes to Financial Statements
The Notes to Financial Statements furnish additional information on items in the financial statements.The notes have been arrangedin the same order as the related items appear in the statements.
Illinois Tool Works Inc. (the “Company” or “ITW”) is a worldwide manufacturer of highly engineered products and specialty systems.The Company primarily serves the construction, automotive, food institutional and retail, and general industrial markets.
Significant accounting principles and policies of the Company are in italics. Certain reclassifications of prior years’ data have beenmade to conform to current year reporting.
The preparation of the Company’s financial statements in conformity with generally accepted accounting principles requires managementto make estimates and assumptions that affect the amounts reported in the financial statements and the notes to financial statements.Actual results could differ from those estimates. The significant estimates included in the preparation of the financial statements arerelated to inventories, trade receivables, plant and equipment, income taxes, goodwill and intangible assets, product liability matters,litigation, product warranties, pensions, other postretirement benefits, environmental matters and stock options.
Consolidation and Translation—The financial statements include the Company and substantially all of its majority-owned subsidiaries.All significant intercompany transactions are eliminated from the financial statements. Substantially all of the Company’s foreignsubsidiaries outside North America have November 30 fiscal year-ends to facilitate inclusion of their financial statements in theDecember 31 consolidated financial statements.
Foreign subsidiaries’ assets and liabilities are translated to U.S. dollars at end-of-period exchange rates. Revenues and expenses aretranslated at average rates for the period. Translation adjustments are reported as a component of accumulated other comprehensiveincome in stockholders’ equity.
Acquisitions—Summarized information related to acquisitions during 2005, 2004 and 2003 is as follows:
IN THOUSANDS EXCEPT NUMBER OF ACQUISITIONS 2005 2004 2003
Number of acquisitions 22 24 28Net cash paid during the year $ 626,922 $ 587,783 $ 203,726Premium recorded as:
Goodwill $ 299,825 $ 219,750 $ 100,611Intangible assets 283,867 219,576 55,400
The acquisitions in these years, individually and in the aggregate, did not materially affect the Company’s results of operations orfinancial position.The Company anticipates subsequent purchase accounting adjustments will change the initial amounts recorded forgoodwill and intangible assets.
Operating Revenues are recognized when the risks and rewards of ownership are transferred to the customer, which is generally at thetime of product shipment. Operating revenues for the Leasing and Investments segment include income from mortgage investments,leases of equipment and other investments that is recognized based on the applicable accounting method for each type of investment.See the Investments note for the detailed accounting policies related to the Company’s significant investments.
No single customer accounted for more than 5% of consolidated revenues in 2005, 2004 or 2003.
Research and Development Expenses are recorded as expense in the year incurred. These costs were $127,871,000 in 2005,$123,486,000 in 2004 and $106,777,000 in 2003.
Rental Expense was $119,054,000 in 2005, $108,450,000 in 2004 and $102,447,000 in 2003. Future minimum lease payments forthe years ending December 31 are as follows:
IN THOUSANDS
2006 $ 101,6022007 79,4242008 61,8892009 43,5622010 37,2862011 and future years 60,693
$ 384,456
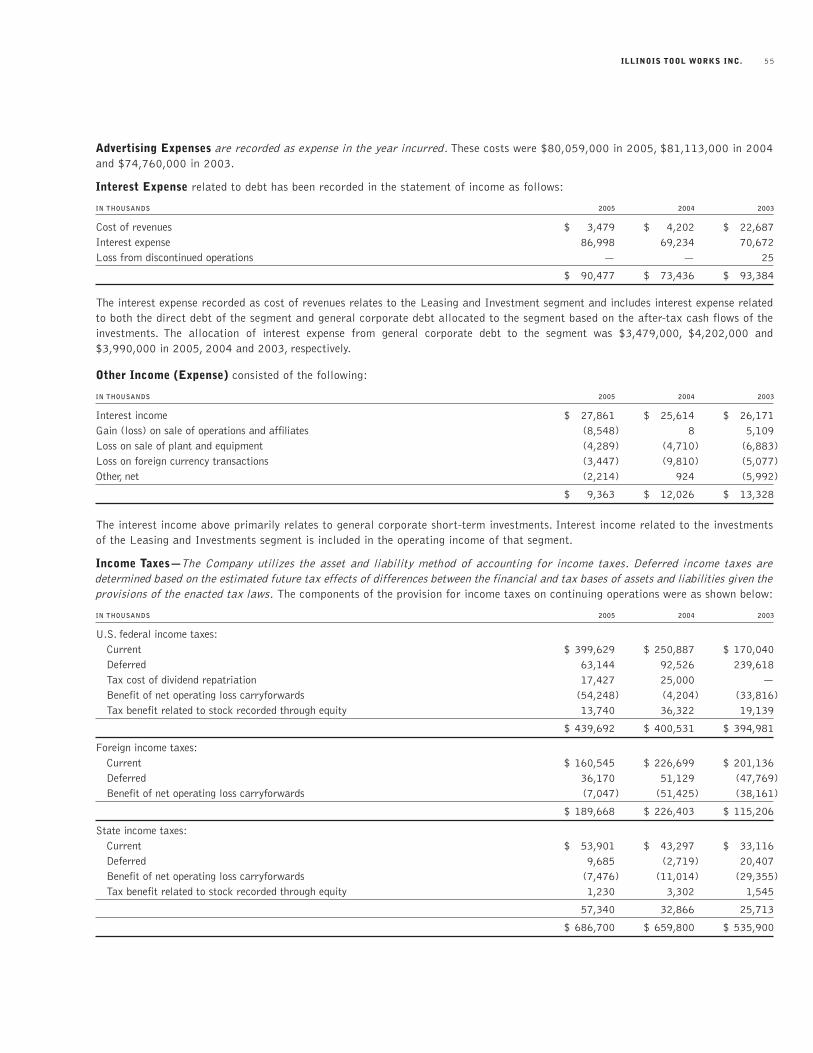
ILLINOIS TOOL WORKS INC. 55
Advertising Expenses are recorded as expense in the year incurred. These costs were $80,059,000 in 2005, $81,113,000 in 2004and $74,760,000 in 2003.
Interest Expense related to debt has been recorded in the statement of income as follows:
IN THOUSANDS 2005 2004 2003
Cost of revenues $ 3,479 $ 4,202 $ 22,687Interest expense 86,998 69,234 70,672Loss from discontinued operations — — 25
$ 90,477 $ 73,436 $ 93,384
The interest expense recorded as cost of revenues relates to the Leasing and Investment segment and includes interest expense relatedto both the direct debt of the segment and general corporate debt allocated to the segment based on the after-tax cash flows of theinvestments. The allocation of interest expense from general corporate debt to the segment was $3,479,000, $4,202,000 and$3,990,000 in 2005, 2004 and 2003, respectively.
Other Income (Expense) consisted of the following:
IN THOUSANDS 2005 2004 2003
Interest income $ 27,861 $ 25,614 $ 26,171Gain (loss) on sale of operations and affiliates (8,548) 8 5,109Loss on sale of plant and equipment (4,289) (4,710) (6,883)Loss on foreign currency transactions (3,447) (9,810) (5,077)Other, net (2,214) 924 (5,992)
$ 9,363 $ 12,026 $ 13,328
The interest income above primarily relates to general corporate short-term investments. Interest income related to the investmentsof the Leasing and Investments segment is included in the operating income of that segment.
Income Taxes—The Company utilizes the asset and liability method of accounting for income taxes. Deferred income taxes are determined based on the estimated future tax effects of differences between the financial and tax bases of assets and liabilities given theprovisions of the enacted tax laws. The components of the provision for income taxes on continuing operations were as shown below:
IN THOUSANDS 2005 2004 2003
U.S. federal income taxes:Current $ 399,629 $ 250,887 $ 170,040Deferred 63,144 92,526 239,618Tax cost of dividend repatriation 17,427 25,000 —Benefit of net operating loss carryforwards (54,248) (4,204) (33,816)Tax benefit related to stock recorded through equity 13,740 36,322 19,139
$ 439,692 $ 400,531 $ 394,981
Foreign income taxes:Current $ 160,545 $ 226,699 $ 201,136Deferred 36,170 51,129 (47,769)Benefit of net operating loss carryforwards (7,047) (51,425) (38,161)
$ 189,668 $ 226,403 $ 115,206
State income taxes:Current $ 53,901 $ 43,297 $ 33,116Deferred 9,685 (2,719) 20,407Benefit of net operating loss carryforwards (7,476) (11,014) (29,355)Tax benefit related to stock recorded through equity 1,230 3,302 1,545
57,340 32,866 25,713
$ 686,700 $ 659,800 $ 535,900
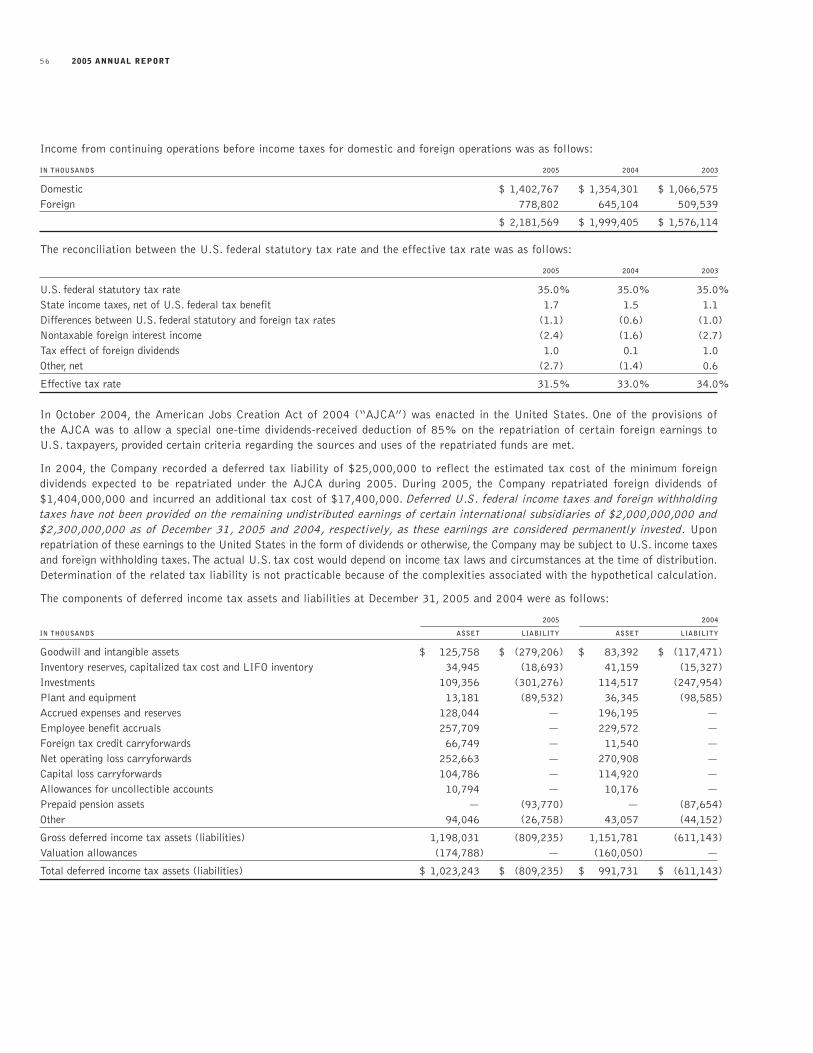
2005 ANNUAL REPORT56
Income from continuing operations before income taxes for domestic and foreign operations was as follows:
IN THOUSANDS 2005 2004 2003
Domestic $ 1,402,767 $ 1,354,301 $ 1,066,575Foreign 778,802 645,104 509,539
$ 2,181,569 $ 1,999,405 $ 1,576,114
The reconciliation between the U.S. federal statutory tax rate and the effective tax rate was as follows:
2005 2004 2003
U.S. federal statutory tax rate 35.0% 35.0% 35.0%State income taxes, net of U.S. federal tax benefit 1.7 1.5 1.1Differences between U.S. federal statutory and foreign tax rates (1.1) (0.6) (1.0)Nontaxable foreign interest income (2.4) (1.6) (2.7)Tax effect of foreign dividends 1.0 0.1 1.0Other, net (2.7) (1.4) 0.6
Effective tax rate 31.5% 33.0% 34.0%
In October 2004, the American Jobs Creation Act of 2004 (“AJCA”) was enacted in the United States. One of the provisions of the AJCA was to allow a special one-time dividends-received deduction of 85% on the repatriation of certain foreign earnings to U.S. taxpayers, provided certain criteria regarding the sources and uses of the repatriated funds are met.
In 2004, the Company recorded a deferred tax liability of $25,000,000 to reflect the estimated tax cost of the minimum foreign dividends expected to be repatriated under the AJCA during 2005. During 2005, the Company repatriated foreign dividends of$1,404,000,000 and incurred an additional tax cost of $17,400,000. Deferred U.S. federal income taxes and foreign withholdingtaxes have not been provided on the remaining undistributed earnings of certain international subsidiaries of $2,000,000,000 and$2,300,000,000 as of December 31, 2005 and 2004, respectively, as these earnings are considered permanently invested. Uponrepatriation of these earnings to the United States in the form of dividends or otherwise, the Company may be subject to U.S. income taxesand foreign withholding taxes.The actual U.S. tax cost would depend on income tax laws and circumstances at the time of distribution.Determination of the related tax liability is not practicable because of the complexities associated with the hypothetical calculation.
The components of deferred income tax assets and liabilities at December 31, 2005 and 2004 were as follows:
2005 2004
IN THOUSANDS ASSET LIABILITY ASSET LIABILITY
Goodwill and intangible assets $ 125,758 $ (279,206) $ 83,392 $ (117,471)Inventory reserves, capitalized tax cost and LIFO inventory 34,945 (18,693) 41,159 (15,327)Investments 109,356 (301,276) 114,517 (247,954)Plant and equipment 13,181 (89,532) 36,345 (98,585)Accrued expenses and reserves 128,044 — 196,195 —Employee benefit accruals 257,709 — 229,572 —Foreign tax credit carryforwards 66,749 — 11,540 —Net operating loss carryforwards 252,663 — 270,908 —Capital loss carryforwards 104,786 — 114,920 —Allowances for uncollectible accounts 10,794 — 10,176 —Prepaid pension assets — (93,770) — (87,654)Other 94,046 (26,758) 43,057 (44,152)
Gross deferred income tax assets (liabilities) 1,198,031 (809,235) 1,151,781 (611,143)Valuation allowances (174,788) — (160,050) —
Total deferred income tax assets (liabilities) $ 1,023,243 $ (809,235) $ 991,731 $ (611,143)
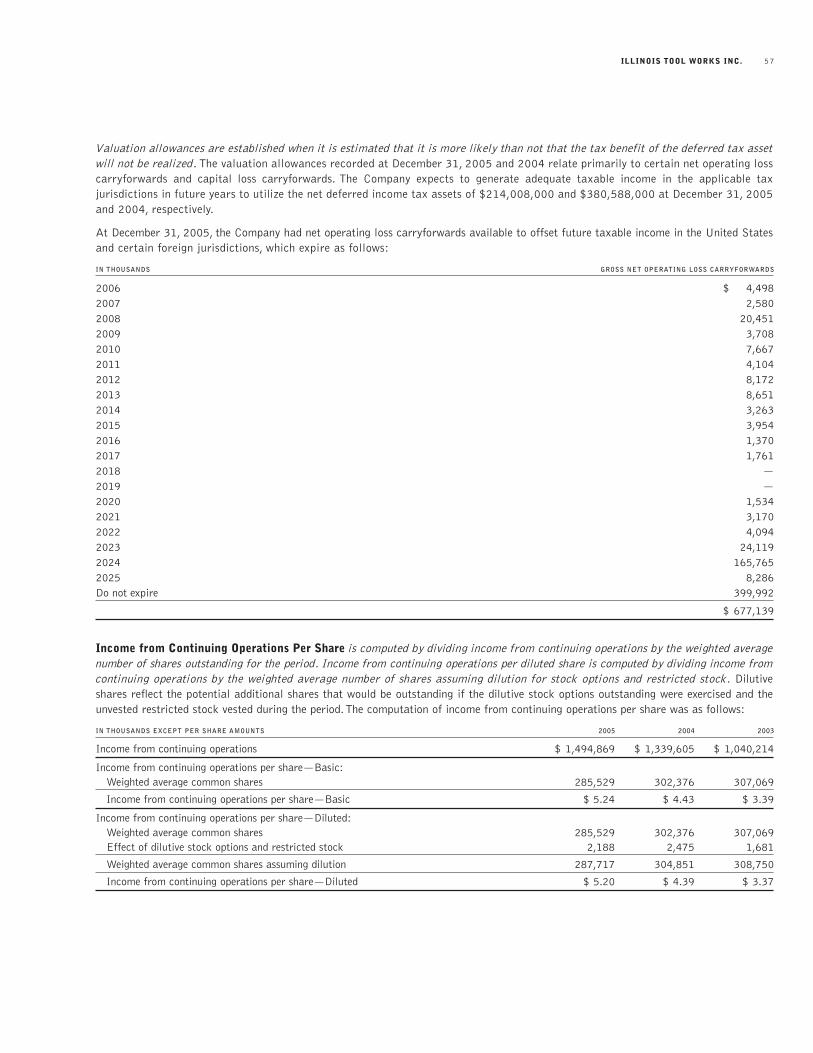
ILLINOIS TOOL WORKS INC. 57
Valuation allowances are established when it is estimated that it is more likely than not that the tax benefit of the deferred tax assetwill not be realized. The valuation allowances recorded at December 31, 2005 and 2004 relate primarily to certain net operating losscarryforwards and capital loss carryforwards. The Company expects to generate adequate taxable income in the applicable tax jurisdictions in future years to utilize the net deferred income tax assets of $214,008,000 and $380,588,000 at December 31, 2005and 2004, respectively.
At December 31, 2005, the Company had net operating loss carryforwards available to offset future taxable income in the United Statesand certain foreign jurisdictions, which expire as follows:
IN THOUSANDS GROSS NET OPERATING LOSS CARRYFORWARDS
2006 $ 4,4982007 2,5802008 20,4512009 3,7082010 7,6672011 4,1042012 8,1722013 8,6512014 3,2632015 3,9542016 1,3702017 1,7612018 —2019 —2020 1,5342021 3,1702022 4,0942023 24,1192024 165,7652025 8,286Do not expire 399,992
$ 677,139
Income from Continuing Operations Per Share is computed by dividing income from continuing operations by the weighted averagenumber of shares outstanding for the period. Income from continuing operations per diluted share is computed by dividing income fromcontinuing operations by the weighted average number of shares assuming dilution for stock options and restricted stock. Dilutiveshares reflect the potential additional shares that would be outstanding if the dilutive stock options outstanding were exercised and theunvested restricted stock vested during the period.The computation of income from continuing operations per share was as follows:
IN THOUSANDS EXCEPT PER SHARE AMOUNTS 2005 2004 2003
Income from continuing operations $ 1,494,869 $ 1,339,605 $ 1,040,214
Income from continuing operations per share—Basic:Weighted average common shares 285,529 302,376 307,069
Income from continuing operations per share—Basic $ 5.24 $ 4.43 $ 3.39
Income from continuing operations per share—Diluted:Weighted average common shares 285,529 302,376 307,069Effect of dilutive stock options and restricted stock 2,188 2,475 1,681
Weighted average common shares assuming dilution 287,717 304,851 308,750
Income from continuing operations per share—Diluted $ 5.20 $ 4.39 $ 3.37
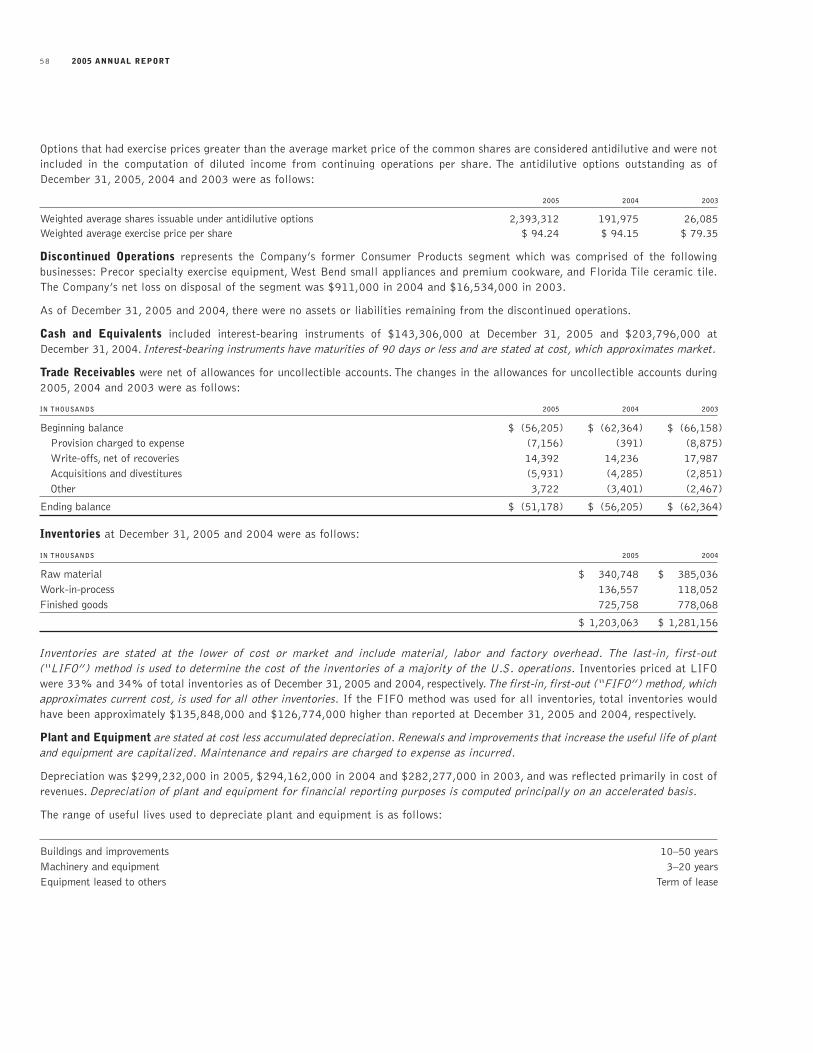
2005 ANNUAL REPORT58
Options that had exercise prices greater than the average market price of the common shares are considered antidilutive and were notincluded in the computation of diluted income from continuing operations per share. The antidilutive options outstanding as ofDecember 31, 2005, 2004 and 2003 were as follows:
2005 2004 2003
Weighted average shares issuable under antidilutive options 2,393,312 191,975 26,085Weighted average exercise price per share $ 94.24 $ 94.15 $ 79.35
Discontinued Operations represents the Company’s former Consumer Products segment which was comprised of the following businesses: Precor specialty exercise equipment, West Bend small appliances and premium cookware, and Florida Tile ceramic tile.The Company’s net loss on disposal of the segment was $911,000 in 2004 and $16,534,000 in 2003.
As of December 31, 2005 and 2004, there were no assets or liabilities remaining from the discontinued operations.
Cash and Equivalents included interest-bearing instruments of $143,306,000 at December 31, 2005 and $203,796,000 atDecember 31, 2004. Interest-bearing instruments have maturities of 90 days or less and are stated at cost, which approximates market.
Trade Receivables were net of allowances for uncollectible accounts. The changes in the allowances for uncollectible accounts during2005, 2004 and 2003 were as follows:
IN THOUSANDS 2005 2004 2003
Beginning balance $ (56,205) $ (62,364) $ (66,158)Provision charged to expense (7,156) (391) (8,875)Write-offs, net of recoveries 14,392 14,236 17,987Acquisitions and divestitures (5,931) (4,285) (2,851)Other 3,722 (3,401) (2,467)
Ending balance $ (51,178) $ (56,205) $ (62,364)
Inventories at December 31, 2005 and 2004 were as follows:
IN THOUSANDS 2005 2004
Raw material $ 340,748 $ 385,036Work-in-process 136,557 118,052Finished goods 725,758 778,068
$ 1,203,063 $ 1,281,156
Inventories are stated at the lower of cost or market and include material, labor and factory overhead. The last-in, first-out(“LIFO”) method is used to determine the cost of the inventories of a majority of the U.S. operations. Inventories priced at LIFOwere 33% and 34% of total inventories as of December 31, 2005 and 2004, respectively. The first-in, first-out (“FIFO”) method, whichapproximates current cost, is used for all other inventories. If the FIFO method was used for all inventories, total inventories wouldhave been approximately $135,848,000 and $126,774,000 higher than reported at December 31, 2005 and 2004, respectively.
Plant and Equipment are stated at cost less accumulated depreciation. Renewals and improvements that increase the useful life of plantand equipment are capitalized. Maintenance and repairs are charged to expense as incurred.
Depreciation was $299,232,000 in 2005, $294,162,000 in 2004 and $282,277,000 in 2003, and was reflected primarily in cost ofrevenues. Depreciation of plant and equipment for financial reporting purposes is computed principally on an accelerated basis.
The range of useful lives used to depreciate plant and equipment is as follows:
Buildings and improvements 10–50 yearsMachinery and equipment 3–20 yearsEquipment leased to others Term of lease
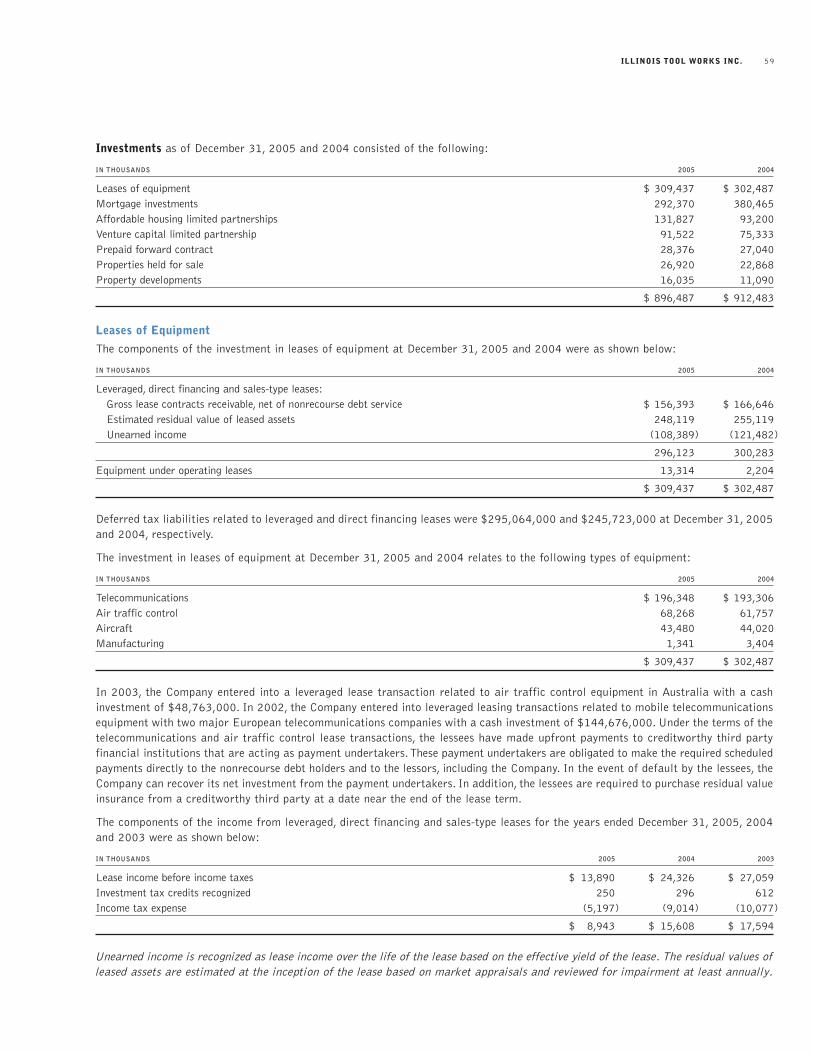
ILLINOIS TOOL WORKS INC. 59
Investments as of December 31, 2005 and 2004 consisted of the following:
IN THOUSANDS 2005 2004
Leases of equipment $ 309,437 $ 302,487Mortgage investments 292,370 380,465Affordable housing limited partnerships 131,827 93,200Venture capital limited partnership 91,522 75,333Prepaid forward contract 28,376 27,040Properties held for sale 26,920 22,868Property developments 16,035 11,090
$ 896,487 $ 912,483
Leases of Equipment
The components of the investment in leases of equipment at December 31, 2005 and 2004 were as shown below:
IN THOUSANDS 2005 2004
Leveraged, direct financing and sales-type leases:Gross lease contracts receivable, net of nonrecourse debt service $ 156,393 $ 166,646Estimated residual value of leased assets 248,119 255,119Unearned income (108,389) (121,482)
296,123 300,283
Equipment under operating leases 13,314 2,204
$ 309,437 $ 302,487
Deferred tax liabilities related to leveraged and direct financing leases were $295,064,000 and $245,723,000 at December 31, 2005and 2004, respectively.
The investment in leases of equipment at December 31, 2005 and 2004 relates to the following types of equipment:
IN THOUSANDS 2005 2004
Telecommunications $ 196,348 $ 193,306Air traffic control 68,268 61,757Aircraft 43,480 44,020Manufacturing 1,341 3,404
$ 309,437 $ 302,487
In 2003, the Company entered into a leveraged lease transaction related to air traffic control equipment in Australia with a cashinvestment of $48,763,000. In 2002, the Company entered into leveraged leasing transactions related to mobile telecommunicationsequipment with two major European telecommunications companies with a cash investment of $144,676,000. Under the terms of thetelecommunications and air traffic control lease transactions, the lessees have made upfront payments to creditworthy third partyfinancial institutions that are acting as payment undertakers.These payment undertakers are obligated to make the required scheduledpayments directly to the nonrecourse debt holders and to the lessors, including the Company. In the event of default by the lessees, theCompany can recover its net investment from the payment undertakers. In addition, the lessees are required to purchase residual valueinsurance from a creditworthy third party at a date near the end of the lease term.
The components of the income from leveraged, direct financing and sales-type leases for the years ended December 31, 2005, 2004and 2003 were as shown below:
IN THOUSANDS 2005 2004 2003
Lease income before income taxes $ 13,890 $ 24,326 $ 27,059Investment tax credits recognized 250 296 612Income tax expense (5,197) (9,014) (10,077)
$ 8,943 $ 15,608 $ 17,594
Unearned income is recognized as lease income over the life of the lease based on the effective yield of the lease. The residual values ofleased assets are estimated at the inception of the lease based on market appraisals and reviewed for impairment at least annually.
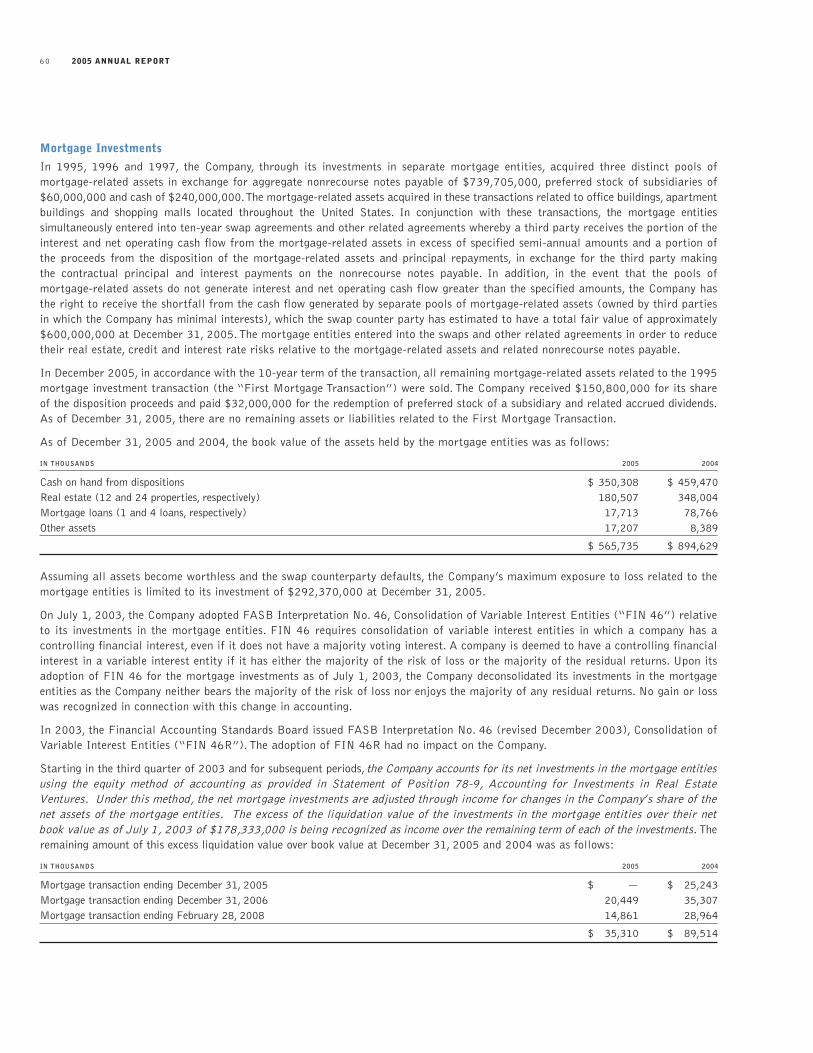
2005 ANNUAL REPORT60
Mortgage Investments
In 1995, 1996 and 1997, the Company, through its investments in separate mortgage entities, acquired three distinct pools of mortgage-related assets in exchange for aggregate nonrecourse notes payable of $739,705,000, preferred stock of subsidiaries of$60,000,000 and cash of $240,000,000.The mortgage-related assets acquired in these transactions related to office buildings, apartmentbuildings and shopping malls located throughout the United States. In conjunction with these transactions, the mortgage entities simultaneously entered into ten-year swap agreements and other related agreements whereby a third party receives the portion of theinterest and net operating cash flow from the mortgage-related assets in excess of specified semi-annual amounts and a portion ofthe proceeds from the disposition of the mortgage-related assets and principal repayments, in exchange for the third party making the contractual principal and interest payments on the nonrecourse notes payable. In addition, in the event that the pools of mortgage-related assets do not generate interest and net operating cash flow greater than the specified amounts, the Company hasthe right to receive the shortfall from the cash flow generated by separate pools of mortgage-related assets (owned by third partiesin which the Company has minimal interests), which the swap counter party has estimated to have a total fair value of approximately$600,000,000 at December 31, 2005. The mortgage entities entered into the swaps and other related agreements in order to reducetheir real estate, credit and interest rate risks relative to the mortgage-related assets and related nonrecourse notes payable.
In December 2005, in accordance with the 10-year term of the transaction, all remaining mortgage-related assets related to the 1995mortgage investment transaction (the “First Mortgage Transaction”) were sold. The Company received $150,800,000 for its shareof the disposition proceeds and paid $32,000,000 for the redemption of preferred stock of a subsidiary and related accrued dividends.As of December 31, 2005, there are no remaining assets or liabilities related to the First Mortgage Transaction.
As of December 31, 2005 and 2004, the book value of the assets held by the mortgage entities was as follows:
IN THOUSANDS 2005 2004
Cash on hand from dispositions $ 350,308 $ 459,470Real estate (12 and 24 properties, respectively) 180,507 348,004Mortgage loans (1 and 4 loans, respectively) 17,713 78,766Other assets 17,207 8,389
$ 565,735 $ 894,629
Assuming all assets become worthless and the swap counterparty defaults, the Company’s maximum exposure to loss related to themortgage entities is limited to its investment of $292,370,000 at December 31, 2005.
On July 1, 2003, the Company adopted FASB Interpretation No. 46, Consolidation of Variable Interest Entities (“FIN 46”) relativeto its investments in the mortgage entities. FIN 46 requires consolidation of variable interest entities in which a company has a controlling financial interest, even if it does not have a majority voting interest. A company is deemed to have a controlling financialinterest in a variable interest entity if it has either the majority of the risk of loss or the majority of the residual returns. Upon itsadoption of FIN 46 for the mortgage investments as of July 1, 2003, the Company deconsolidated its investments in the mortgageentities as the Company neither bears the majority of the risk of loss nor enjoys the majority of any residual returns. No gain or losswas recognized in connection with this change in accounting.
In 2003, the Financial Accounting Standards Board issued FASB Interpretation No. 46 (revised December 2003), Consolidation ofVariable Interest Entities (“FIN 46R”). The adoption of FIN 46R had no impact on the Company.
Starting in the third quarter of 2003 and for subsequent periods, the Company accounts for its net investments in the mortgage entitiesusing the equity method of accounting as provided in Statement of Position 78-9, Accounting for Investments in Real EstateVentures. Under this method, the net mortgage investments are adjusted through income for changes in the Company’s share of thenet assets of the mortgage entities. The excess of the liquidation value of the investments in the mortgage entities over their netbook value as of July 1, 2003 of $178,333,000 is being recognized as income over the remaining term of each of the investments. Theremaining amount of this excess liquidation value over book value at December 31, 2005 and 2004 was as follows:
IN THOUSANDS 2005 2004
Mortgage transaction ending December 31, 2005 $ — $ 25,243Mortgage transaction ending December 31, 2006 20,449 35,307Mortgage transaction ending February 28, 2008 14,861 28,964
$ 35,310 $ 89,514
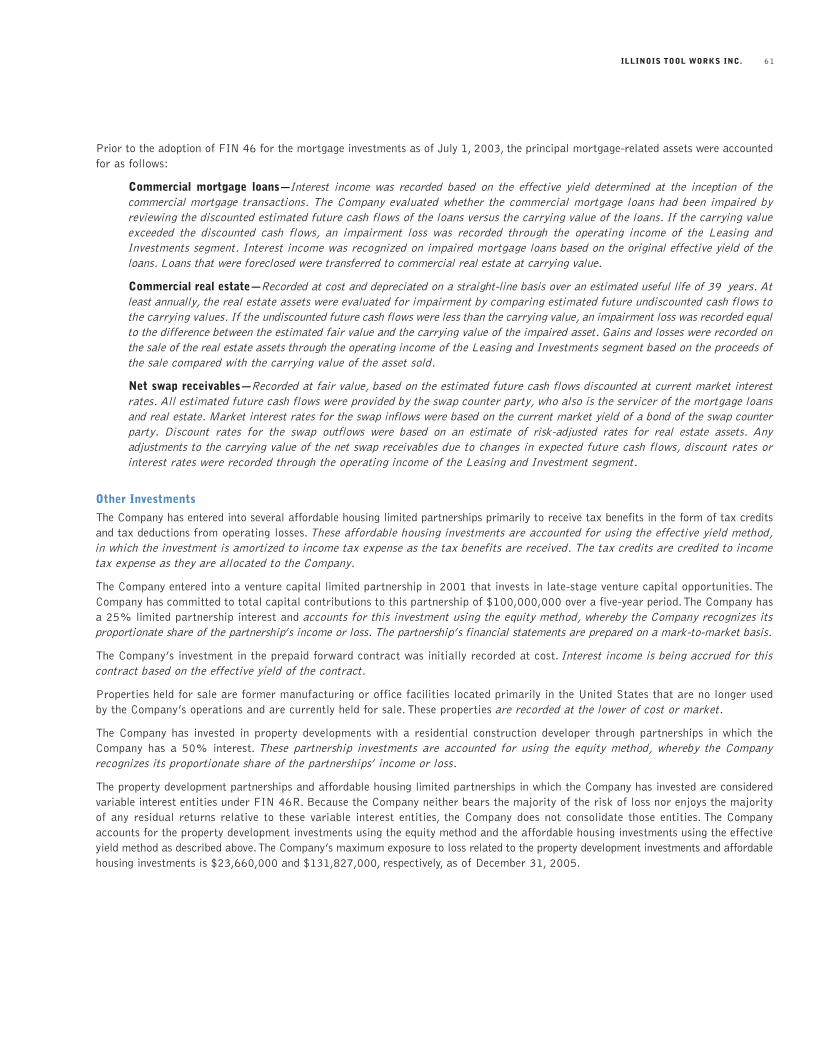
ILLINOIS TOOL WORKS INC. 61
Prior to the adoption of FIN 46 for the mortgage investments as of July 1, 2003, the principal mortgage-related assets were accountedfor as follows:
Commercial mortgage loans—Interest income was recorded based on the effective yield determined at the inception of the commercial mortgage transactions. The Company evaluated whether the commercial mortgage loans had been impaired byreviewing the discounted estimated future cash flows of the loans versus the carrying value of the loans. If the carrying valueexceeded the discounted cash flows, an impairment loss was recorded through the operating income of the Leasing andInvestments segment. Interest income was recognized on impaired mortgage loans based on the original effective yield of theloans. Loans that were foreclosed were transferred to commercial real estate at carrying value.
Commercial real estate—Recorded at cost and depreciated on a straight-line basis over an estimated useful life of 39 years. Atleast annually, the real estate assets were evaluated for impairment by comparing estimated future undiscounted cash flows tothe carrying values. If the undiscounted future cash flows were less than the carrying value, an impairment loss was recorded equalto the difference between the estimated fair value and the carrying value of the impaired asset. Gains and losses were recorded onthe sale of the real estate assets through the operating income of the Leasing and Investments segment based on the proceeds ofthe sale compared with the carrying value of the asset sold.
Net swap receivables—Recorded at fair value, based on the estimated future cash flows discounted at current market interestrates. All estimated future cash flows were provided by the swap counter party, who also is the servicer of the mortgage loansand real estate. Market interest rates for the swap inflows were based on the current market yield of a bond of the swap counterparty. Discount rates for the swap outflows were based on an estimate of risk-adjusted rates for real estate assets. Any adjustments to the carrying value of the net swap receivables due to changes in expected future cash flows, discount rates orinterest rates were recorded through the operating income of the Leasing and Investment segment.
Other Investments
The Company has entered into several affordable housing limited partnerships primarily to receive tax benefits in the form of tax creditsand tax deductions from operating losses. These affordable housing investments are accounted for using the effective yield method,in which the investment is amortized to income tax expense as the tax benefits are received. The tax credits are credited to incometax expense as they are allocated to the Company.
The Company entered into a venture capital limited partnership in 2001 that invests in late-stage venture capital opportunities. TheCompany has committed to total capital contributions to this partnership of $100,000,000 over a five-year period.The Company hasa 25% limited partnership interest and accounts for this investment using the equity method, whereby the Company recognizes itsproportionate share of the partnership’s income or loss. The partnership’s financial statements are prepared on a mark-to-market basis.
The Company’s investment in the prepaid forward contract was initially recorded at cost. Interest income is being accrued for thiscontract based on the effective yield of the contract.
Properties held for sale are former manufacturing or office facilities located primarily in the United States that are no longer usedby the Company’s operations and are currently held for sale. These properties are recorded at the lower of cost or market.
The Company has invested in property developments with a residential construction developer through partnerships in which theCompany has a 50% interest. These partnership investments are accounted for using the equity method, whereby the Company recognizes its proportionate share of the partnerships’ income or loss.
The property development partnerships and affordable housing limited partnerships in which the Company has invested are consideredvariable interest entities under FIN 46R. Because the Company neither bears the majority of the risk of loss nor enjoys the majorityof any residual returns relative to these variable interest entities, the Company does not consolidate those entities. The Companyaccounts for the property development investments using the equity method and the affordable housing investments using the effectiveyield method as described above.The Company’s maximum exposure to loss related to the property development investments and affordablehousing investments is $23,660,000 and $131,827,000, respectively, as of December 31, 2005.
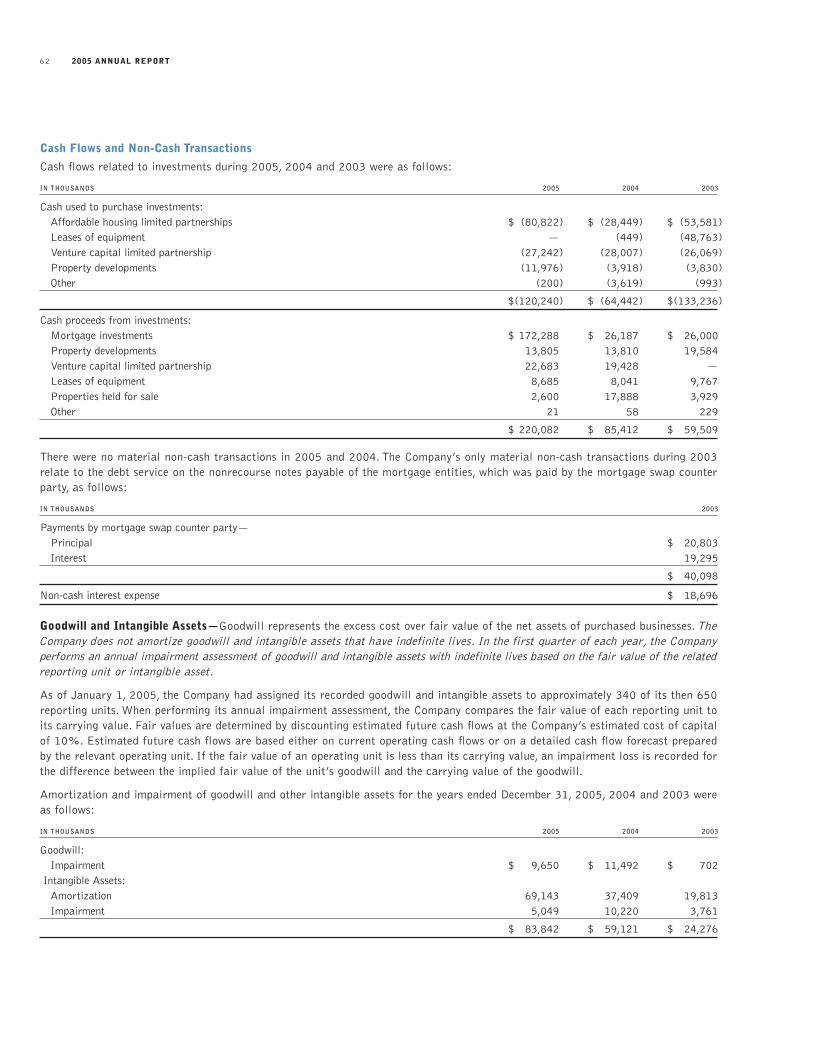
2005 ANNUAL REPORT62
Cash Flows and Non-Cash Transactions
Cash flows related to investments during 2005, 2004 and 2003 were as follows:
IN THOUSANDS 2005 2004 2003
Cash used to purchase investments:Affordable housing limited partnerships $ (80,822) $ (28,449) $ (53,581)Leases of equipment — (449) (48,763)Venture capital limited partnership (27,242) (28,007) (26,069)Property developments (11,976) (3,918) (3,830)Other (200) (3,619) (993)
$(120,240) $ (64,442) $(133,236)
Cash proceeds from investments:Mortgage investments $ 172,288 $ 26,187 $ 26,000Property developments 13,805 13,810 19,584Venture capital limited partnership 22,683 19,428 —Leases of equipment 8,685 8,041 9,767Properties held for sale 2,600 17,888 3,929Other 21 58 229
$ 220,082 $ 85,412 $ 59,509
There were no material non-cash transactions in 2005 and 2004. The Company’s only material non-cash transactions during 2003relate to the debt service on the nonrecourse notes payable of the mortgage entities, which was paid by the mortgage swap counterparty, as follows:
IN THOUSANDS 2003
Payments by mortgage swap counter party—Principal $ 20,803Interest 19,295
$ 40,098
Non-cash interest expense $ 18,696
Goodwill and Intangible Assets—Goodwill represents the excess cost over fair value of the net assets of purchased businesses. TheCompany does not amortize goodwill and intangible assets that have indefinite lives. In the first quarter of each year, the Companyperforms an annual impairment assessment of goodwill and intangible assets with indefinite lives based on the fair value of the relatedreporting unit or intangible asset.
As of January 1, 2005, the Company had assigned its recorded goodwill and intangible assets to approximately 340 of its then 650reporting units. When performing its annual impairment assessment, the Company compares the fair value of each reporting unit toits carrying value. Fair values are determined by discounting estimated future cash flows at the Company’s estimated cost of capitalof 10%. Estimated future cash flows are based either on current operating cash flows or on a detailed cash flow forecast preparedby the relevant operating unit. If the fair value of an operating unit is less than its carrying value, an impairment loss is recorded forthe difference between the implied fair value of the unit’s goodwill and the carrying value of the goodwill.
Amortization and impairment of goodwill and other intangible assets for the years ended December 31, 2005, 2004 and 2003 wereas follows:
IN THOUSANDS 2005 2004 2003
Goodwill:Impairment $ 9,650 $ 11,492 $ 702
Intangible Assets:Amortization 69,143 37,409 19,813Impairment 5,049 10,220 3,761
$ 83,842 $ 59,121 $ 24,276
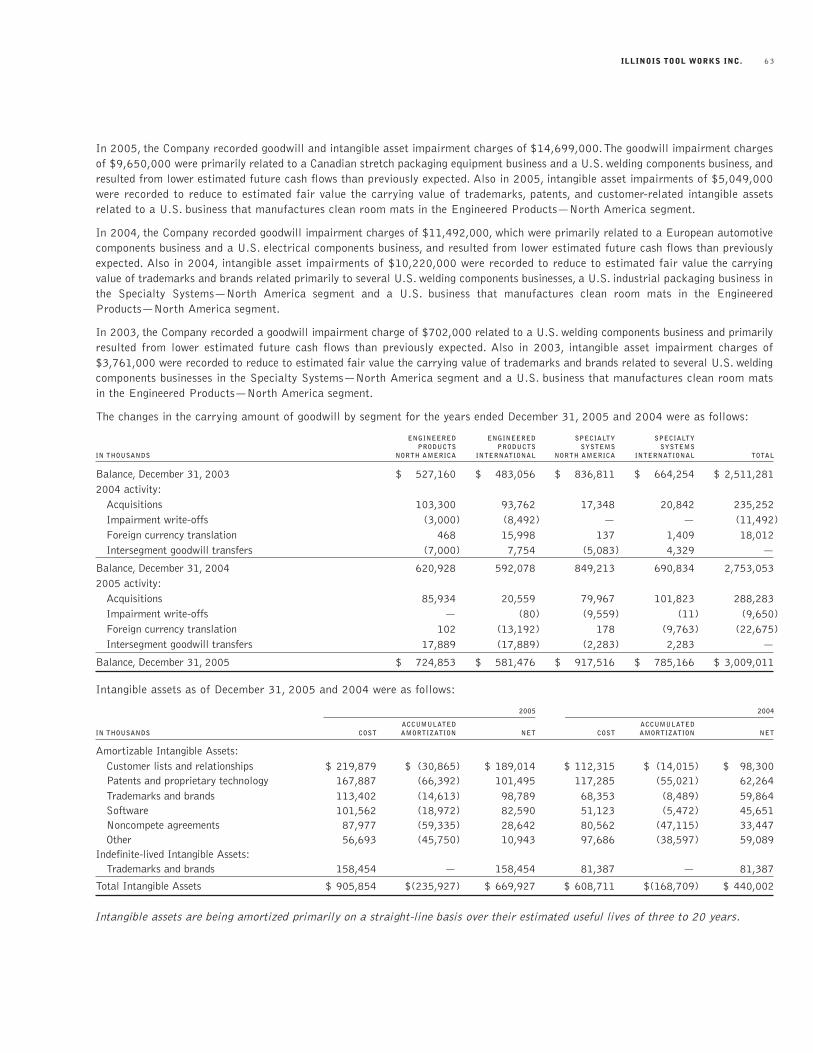
ILLINOIS TOOL WORKS INC. 63
In 2005, the Company recorded goodwill and intangible asset impairment charges of $14,699,000.The goodwill impairment chargesof $9,650,000 were primarily related to a Canadian stretch packaging equipment business and a U.S. welding components business, andresulted from lower estimated future cash flows than previously expected. Also in 2005, intangible asset impairments of $5,049,000were recorded to reduce to estimated fair value the carrying value of trademarks, patents, and customer-related intangible assetsrelated to a U.S. business that manufactures clean room mats in the Engineered Products—North America segment.
In 2004, the Company recorded goodwill impairment charges of $11,492,000, which were primarily related to a European automotivecomponents business and a U.S. electrical components business, and resulted from lower estimated future cash flows than previouslyexpected. Also in 2004, intangible asset impairments of $10,220,000 were recorded to reduce to estimated fair value the carryingvalue of trademarks and brands related primarily to several U.S. welding components businesses, a U.S. industrial packaging business inthe Specialty Systems—North America segment and a U.S. business that manufactures clean room mats in the EngineeredProducts—North America segment.
In 2003, the Company recorded a goodwill impairment charge of $702,000 related to a U.S. welding components business and primarilyresulted from lower estimated future cash flows than previously expected. Also in 2003, intangible asset impairment charges of$3,761,000 were recorded to reduce to estimated fair value the carrying value of trademarks and brands related to several U.S. weldingcomponents businesses in the Specialty Systems—North America segment and a U.S. business that manufactures clean room matsin the Engineered Products—North America segment.
The changes in the carrying amount of goodwill by segment for the years ended December 31, 2005 and 2004 were as follows:
ENGINEERED ENGINEERED SPECIALTY SPECIALTYPRODUCTS PRODUCTS SYSTEMS SYSTEMS
IN THOUSANDS NORTH AMERICA INTERNATIONAL NORTH AMERICA INTERNATIONAL TOTAL
Balance, December 31, 2003 $ 527,160 $ 483,056 $ 836,811 $ 664,254 $ 2,511,2812004 activity:
Acquisitions 103,300 93,762 17,348 20,842 235,252Impairment write-offs (3,000) (8,492) — — (11,492)Foreign currency translation 468 15,998 137 1,409 18,012Intersegment goodwill transfers (7,000) 7,754 (5,083) 4,329 —
Balance, December 31, 2004 620,928 592,078 849,213 690,834 2,753,0532005 activity:
Acquisitions 85,934 20,559 79,967 101,823 288,283Impairment write-offs — (80) (9,559) (11) (9,650)Foreign currency translation 102 (13,192) 178 (9,763) (22,675)Intersegment goodwill transfers 17,889 (17,889) (2,283) 2,283 —
Balance, December 31, 2005 $ 724,853 $ 581,476 $ 917,516 $ 785,166 $ 3,009,011
Intangible assets as of December 31, 2005 and 2004 were as follows:
2005 2004
ACCUMULATED ACCUMULATEDIN THOUSANDS COST AMORTIZATION NET COST AMORTIZATION NET
Amortizable Intangible Assets:Customer lists and relationships $ 219,879 $ (30,865) $ 189,014 $ 112,315 $ (14,015) $ 98,300Patents and proprietary technology 167,887 (66,392) 101,495 117,285 (55,021) 62,264Trademarks and brands 113,402 (14,613) 98,789 68,353 (8,489) 59,864Software 101,562 (18,972) 82,590 51,123 (5,472) 45,651Noncompete agreements 87,977 (59,335) 28,642 80,562 (47,115) 33,447Other 56,693 (45,750) 10,943 97,686 (38,597) 59,089
Indefinite-lived Intangible Assets:Trademarks and brands 158,454 — 158,454 81,387 — 81,387
Total Intangible Assets $ 905,854 $(235,927) $ 669,927 $ 608,711 $(168,709) $ 440,002
Intangible assets are being amortized primarily on a straight-line basis over their estimated useful lives of three to 20 years.
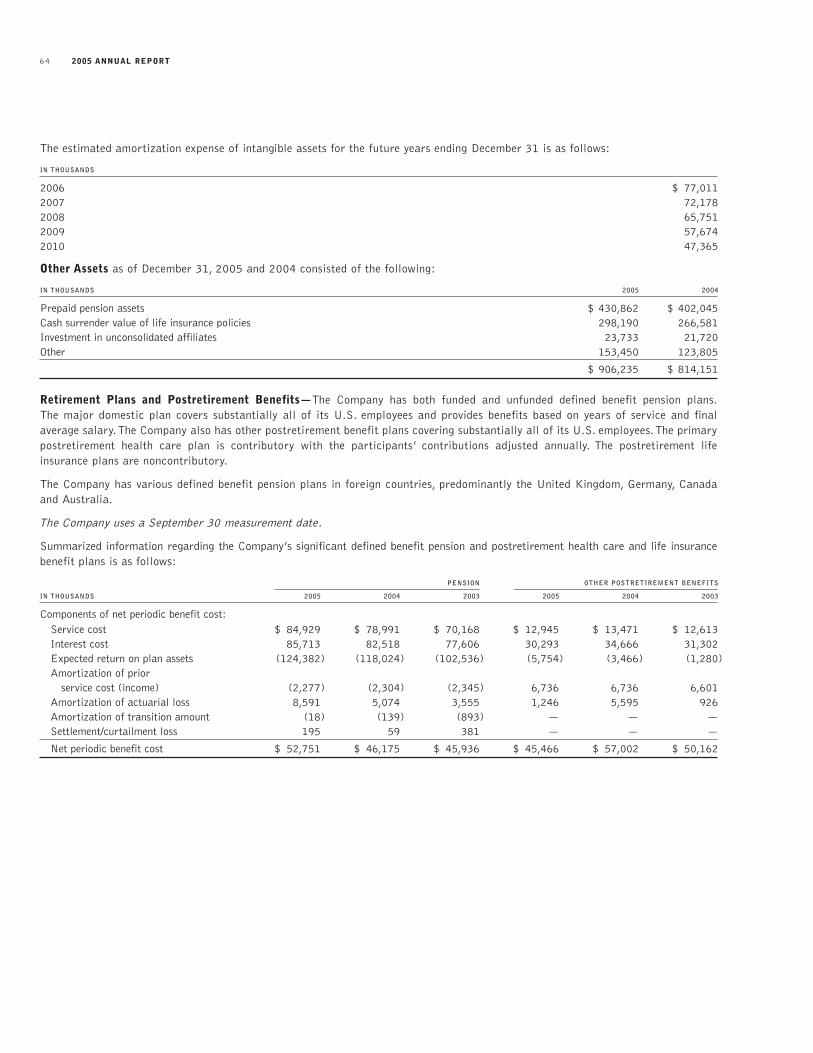
2005 ANNUAL REPORT64
The estimated amortization expense of intangible assets for the future years ending December 31 is as follows:
IN THOUSANDS
2006 $ 77,0112007 72,1782008 65,7512009 57,6742010 47,365
Other Assets as of December 31, 2005 and 2004 consisted of the following:
IN THOUSANDS 2005 2004
Prepaid pension assets $ 430,862 $ 402,045Cash surrender value of life insurance policies 298,190 266,581Investment in unconsolidated affiliates 23,733 21,720Other 153,450 123,805
$ 906,235 $ 814,151
Retirement Plans and Postretirement Benefits—The Company has both funded and unfunded defined benefit pension plans.The major domestic plan covers substantially all of its U.S. employees and provides benefits based on years of service and final average salary.The Company also has other postretirement benefit plans covering substantially all of its U.S. employees.The primary postretirement health care plan is contributory with the participants’ contributions adjusted annually. The postretirement life insurance plans are noncontributory.
The Company has various defined benefit pension plans in foreign countries, predominantly the United Kingdom, Germany, Canada and Australia.
The Company uses a September 30 measurement date.
Summarized information regarding the Company’s significant defined benefit pension and postretirement health care and life insurancebenefit plans is as follows:
PENSION OTHER POSTRETIREMENT BENEFITS
IN THOUSANDS 2005 2004 2003 2005 2004 2003
Components of net periodic benefit cost:Service cost $ 84,929 $ 78,991 $ 70,168 $ 12,945 $ 13,471 $ 12,613Interest cost 85,713 82,518 77,606 30,293 34,666 31,302Expected return on plan assets (124,382) (118,024) (102,536) (5,754) (3,466) (1,280)Amortization of prior
service cost (income) (2,277) (2,304) (2,345) 6,736 6,736 6,601Amortization of actuarial loss 8,591 5,074 3,555 1,246 5,595 926Amortization of transition amount (18) (139) (893) — — —Settlement/curtailment loss 195 59 381 — — —
Net periodic benefit cost $ 52,751 $ 46,175 $ 45,936 $ 45,466 $ 57,002 $ 50,162
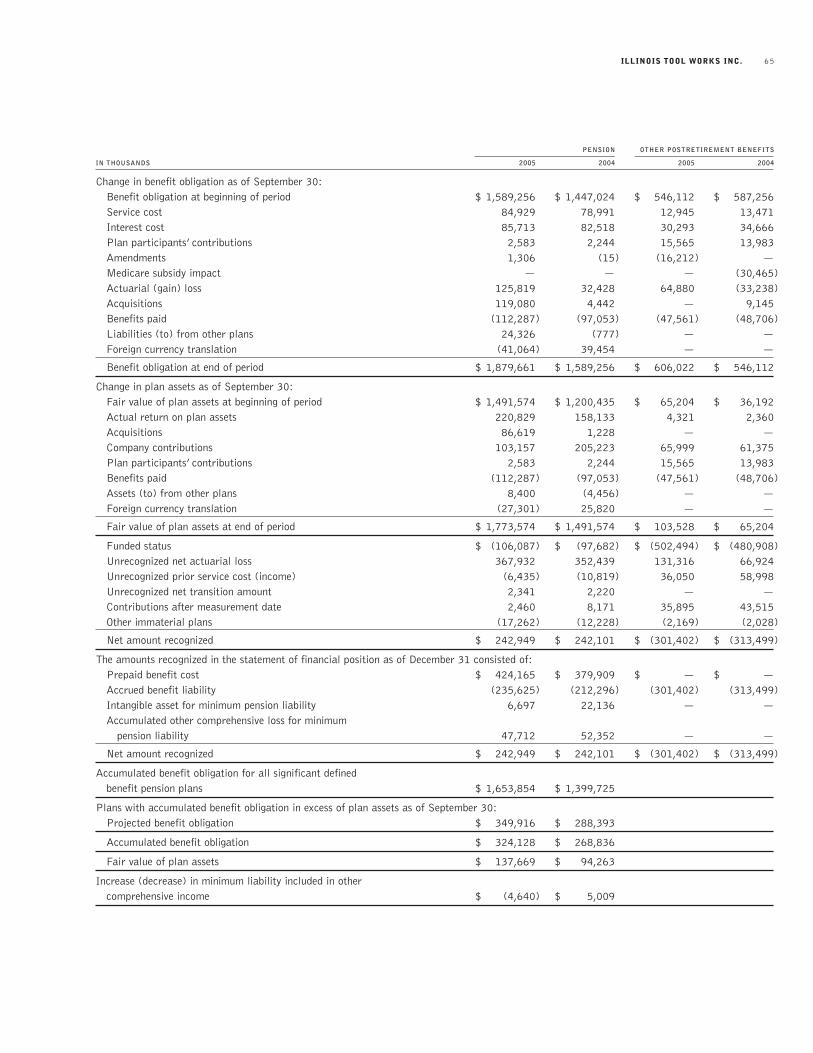
ILLINOIS TOOL WORKS INC. 65
PENSION OTHER POSTRETIREMENT BENEFITS
IN THOUSANDS 2005 2004 2005 2004
Change in benefit obligation as of September 30:Benefit obligation at beginning of period $ 1,589,256 $ 1,447,024 $ 546,112 $ 587,256Service cost 84,929 78,991 12,945 13,471Interest cost 85,713 82,518 30,293 34,666Plan participants’ contributions 2,583 2,244 15,565 13,983Amendments 1,306 (15) (16,212) —Medicare subsidy impact — — — (30,465)Actuarial (gain) loss 125,819 32,428 64,880 (33,238)Acquisitions 119,080 4,442 — 9,145Benefits paid (112,287) (97,053) (47,561) (48,706)Liabilities (to) from other plans 24,326 (777) — —Foreign currency translation (41,064) 39,454 — —
Benefit obligation at end of period $ 1,879,661 $ 1,589,256 $ 606,022 $ 546,112
Change in plan assets as of September 30:Fair value of plan assets at beginning of period $ 1,491,574 $ 1,200,435 $ 65,204 $ 36,192Actual return on plan assets 220,829 158,133 4,321 2,360Acquisitions 86,619 1,228 — —Company contributions 103,157 205,223 65,999 61,375Plan participants’ contributions 2,583 2,244 15,565 13,983Benefits paid (112,287) (97,053) (47,561) (48,706)Assets (to) from other plans 8,400 (4,456) — —Foreign currency translation (27,301) 25,820 — —
Fair value of plan assets at end of period $ 1,773,574 $ 1,491,574 $ 103,528 $ 65,204
Funded status $ (106,087) $ (97,682) $ (502,494) $ (480,908)Unrecognized net actuarial loss 367,932 352,439 131,316 66,924Unrecognized prior service cost (income) (6,435) (10,819) 36,050 58,998Unrecognized net transition amount 2,341 2,220 — —Contributions after measurement date 2,460 8,171 35,895 43,515Other immaterial plans (17,262) (12,228) (2,169) (2,028)
Net amount recognized $ 242,949 $ 242,101 $ (301,402) $ (313,499)
The amounts recognized in the statement of financial position as of December 31 consisted of:Prepaid benefit cost $ 424,165 $ 379,909 $ — $ —Accrued benefit liability (235,625) (212,296) (301,402) (313,499)Intangible asset for minimum pension liability 6,697 22,136 — —Accumulated other comprehensive loss for minimum
pension liability 47,712 52,352 — —
Net amount recognized $ 242,949 $ 242,101 $ (301,402) $ (313,499)
Accumulated benefit obligation for all significant definedbenefit pension plans $ 1,653,854 $ 1,399,725
Plans with accumulated benefit obligation in excess of plan assets as of September 30:Projected benefit obligation $ 349,916 $ 288,393
Accumulated benefit obligation $ 324,128 $ 268,836
Fair value of plan assets $ 137,669 $ 94,263
Increase (decrease) in minimum liability included in other comprehensive income $ (4,640) $ 5,009
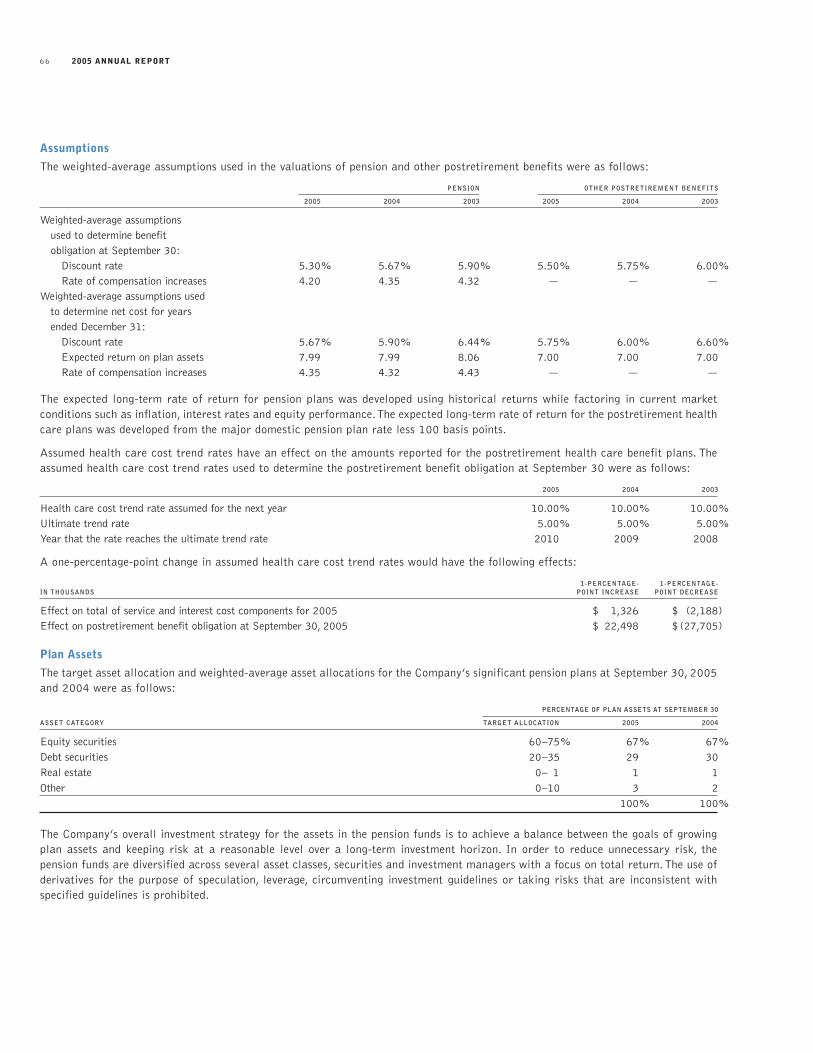
2005 ANNUAL REPORT66
Assumptions
The weighted-average assumptions used in the valuations of pension and other postretirement benefits were as follows:
PENSION OTHER POSTRETIREMENT BENEFITS
2005 2004 2003 2005 2004 2003
Weighted-average assumptions used to determine benefit obligation at September 30:
Discount rate 5.30% 5.67% 5.90% 5.50% 5.75% 6.00%Rate of compensation increases 4.20 4.35 4.32 — — —
Weighted-average assumptions used to determine net cost for years ended December 31:
Discount rate 5.67% 5.90% 6.44% 5.75% 6.00% 6.60%Expected return on plan assets 7.99 7.99 8.06 7.00 7.00 7.00Rate of compensation increases 4.35 4.32 4.43 — — —
The expected long-term rate of return for pension plans was developed using historical returns while factoring in current market conditions such as inflation, interest rates and equity performance.The expected long-term rate of return for the postretirement healthcare plans was developed from the major domestic pension plan rate less 100 basis points.
Assumed health care cost trend rates have an effect on the amounts reported for the postretirement health care benefit plans. Theassumed health care cost trend rates used to determine the postretirement benefit obligation at September 30 were as follows:
2005 2004 2003
Health care cost trend rate assumed for the next year 10.00% 10.00% 10.00%Ultimate trend rate 5.00% 5.00% 5.00%Year that the rate reaches the ultimate trend rate 2010 2009 2008
A one-percentage-point change in assumed health care cost trend rates would have the following effects:
1-PERCENTAGE- 1-PERCENTAGE-IN THOUSANDS POINT INCREASE POINT DECREASE
Effect on total of service and interest cost components for 2005 $ 1,326 $ (2,188)Effect on postretirement benefit obligation at September 30, 2005 $ 22,498 $(27,705)
Plan Assets
The target asset allocation and weighted-average asset allocations for the Company’s significant pension plans at September 30, 2005and 2004 were as follows:
PERCENTAGE OF PLAN ASSETS AT SEPTEMBER 30
ASSET CATEGORY TARGET ALLOCATION 2005 2004
Equity securities 60–75% 67% 67%Debt securities 20–35 29 30Real estate 0– 1 1 1Other 0–10 3 2
100% 100%
The Company’s overall investment strategy for the assets in the pension funds is to achieve a balance between the goals of growingplan assets and keeping risk at a reasonable level over a long-term investment horizon. In order to reduce unnecessary risk, the pension funds are diversified across several asset classes, securities and investment managers with a focus on total return. The use ofderivatives for the purpose of speculation, leverage, circumventing investment guidelines or taking risks that are inconsistent withspecified guidelines is prohibited.
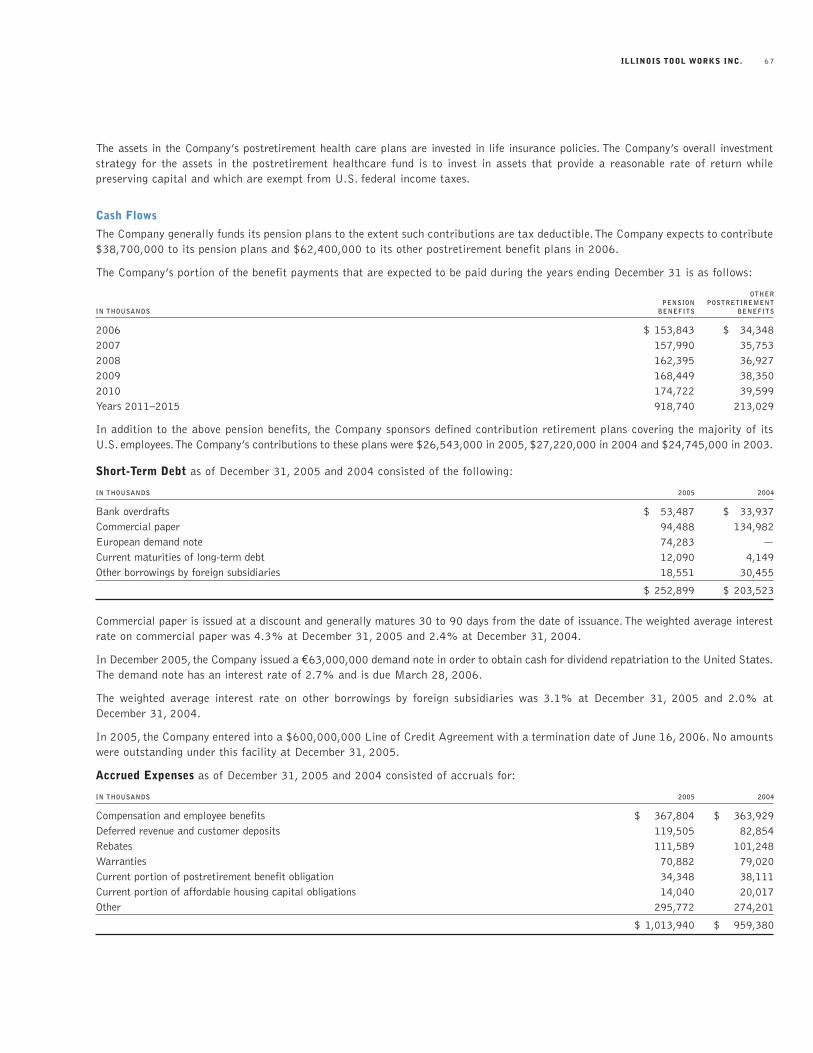
ILLINOIS TOOL WORKS INC. 67
The assets in the Company’s postretirement health care plans are invested in life insurance policies. The Company’s overall investmentstrategy for the assets in the postretirement healthcare fund is to invest in assets that provide a reasonable rate of return while preserving capital and which are exempt from U.S. federal income taxes.
Cash Flows
The Company generally funds its pension plans to the extent such contributions are tax deductible.The Company expects to contribute$38,700,000 to its pension plans and $62,400,000 to its other postretirement benefit plans in 2006.
The Company’s portion of the benefit payments that are expected to be paid during the years ending December 31 is as follows:
OTHER PENSION POSTRETIREMENT
IN THOUSANDS BENEFITS BENEFITS
2006 $ 153,843 $ 34,3482007 157,990 35,7532008 162,395 36,9272009 168,449 38,3502010 174,722 39,599Years 2011–2015 918,740 213,029
In addition to the above pension benefits, the Company sponsors defined contribution retirement plans covering the majority of itsU.S. employees.The Company’s contributions to these plans were $26,543,000 in 2005, $27,220,000 in 2004 and $24,745,000 in 2003.
Short-Term Debt as of December 31, 2005 and 2004 consisted of the following:
IN THOUSANDS 2005 2004
Bank overdrafts $ 53,487 $ 33,937Commercial paper 94,488 134,982European demand note 74,283 —Current maturities of long-term debt 12,090 4,149Other borrowings by foreign subsidiaries 18,551 30,455
$ 252,899 $ 203,523
Commercial paper is issued at a discount and generally matures 30 to 90 days from the date of issuance.The weighted average interestrate on commercial paper was 4.3% at December 31, 2005 and 2.4% at December 31, 2004.
In December 2005, the Company issued a €63,000,000 demand note in order to obtain cash for dividend repatriation to the United States.The demand note has an interest rate of 2.7% and is due March 28, 2006.
The weighted average interest rate on other borrowings by foreign subsidiaries was 3.1% at December 31, 2005 and 2.0% atDecember 31, 2004.
In 2005, the Company entered into a $600,000,000 Line of Credit Agreement with a termination date of June 16, 2006. No amountswere outstanding under this facility at December 31, 2005.
Accrued Expenses as of December 31, 2005 and 2004 consisted of accruals for:
IN THOUSANDS 2005 2004
Compensation and employee benefits $ 367,804 $ 363,929Deferred revenue and customer deposits 119,505 82,854Rebates 111,589 101,248Warranties 70,882 79,020Current portion of postretirement benefit obligation 34,348 38,111Current portion of affordable housing capital obligations 14,040 20,017Other 295,772 274,201
$ 1,013,940 $ 959,380
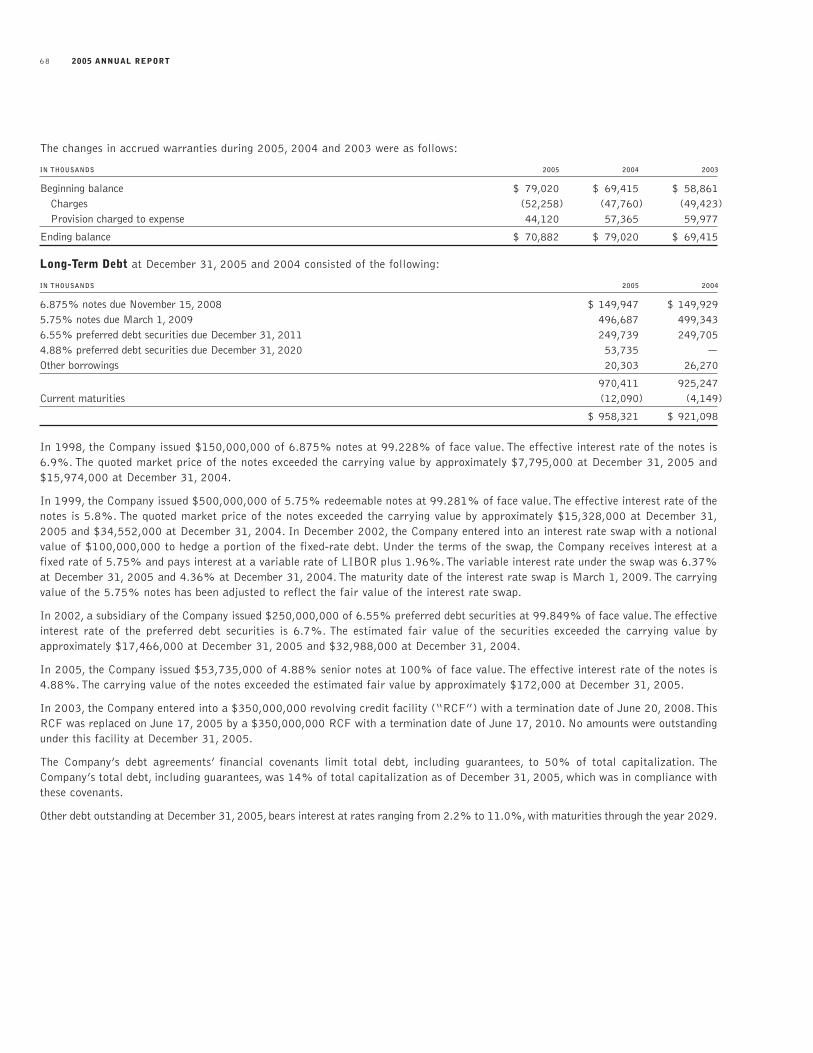
2005 ANNUAL REPORT68
The changes in accrued warranties during 2005, 2004 and 2003 were as follows:
IN THOUSANDS 2005 2004 2003
Beginning balance $ 79,020 $ 69,415 $ 58,861Charges (52,258) (47,760) (49,423)Provision charged to expense 44,120 57,365 59,977
Ending balance $ 70,882 $ 79,020 $ 69,415
Long-Term Debt at December 31, 2005 and 2004 consisted of the following:
IN THOUSANDS 2005 2004
6.875% notes due November 15, 2008 $ 149,947 $ 149,9295.75% notes due March 1, 2009 496,687 499,3436.55% preferred debt securities due December 31, 2011 249,739 249,7054.88% preferred debt securities due December 31, 2020 53,735 —Other borrowings 20,303 26,270
970,411 925,247Current maturities (12,090) (4,149)
$ 958,321 $ 921,098
In 1998, the Company issued $150,000,000 of 6.875% notes at 99.228% of face value. The effective interest rate of the notes is6.9%. The quoted market price of the notes exceeded the carrying value by approximately $7,795,000 at December 31, 2005 and$15,974,000 at December 31, 2004.
In 1999, the Company issued $500,000,000 of 5.75% redeemable notes at 99.281% of face value.The effective interest rate of thenotes is 5.8%. The quoted market price of the notes exceeded the carrying value by approximately $15,328,000 at December 31,2005 and $34,552,000 at December 31, 2004. In December 2002, the Company entered into an interest rate swap with a notionalvalue of $100,000,000 to hedge a portion of the fixed-rate debt. Under the terms of the swap, the Company receives interest at afixed rate of 5.75% and pays interest at a variable rate of LIBOR plus 1.96%.The variable interest rate under the swap was 6.37%at December 31, 2005 and 4.36% at December 31, 2004. The maturity date of the interest rate swap is March 1, 2009. The carryingvalue of the 5.75% notes has been adjusted to reflect the fair value of the interest rate swap.
In 2002, a subsidiary of the Company issued $250,000,000 of 6.55% preferred debt securities at 99.849% of face value.The effectiveinterest rate of the preferred debt securities is 6.7%. The estimated fair value of the securities exceeded the carrying value by approximately $17,466,000 at December 31, 2005 and $32,988,000 at December 31, 2004.
In 2005, the Company issued $53,735,000 of 4.88% senior notes at 100% of face value. The effective interest rate of the notes is4.88%. The carrying value of the notes exceeded the estimated fair value by approximately $172,000 at December 31, 2005.
In 2003, the Company entered into a $350,000,000 revolving credit facility (“RCF”) with a termination date of June 20, 2008.ThisRCF was replaced on June 17, 2005 by a $350,000,000 RCF with a termination date of June 17, 2010. No amounts were outstandingunder this facility at December 31, 2005.
The Company’s debt agreements’ financial covenants limit total debt, including guarantees, to 50% of total capitalization. TheCompany’s total debt, including guarantees, was 14% of total capitalization as of December 31, 2005, which was in compliance withthese covenants.
Other debt outstanding at December 31, 2005, bears interest at rates ranging from 2.2% to 11.0%, with maturities through the year 2029.
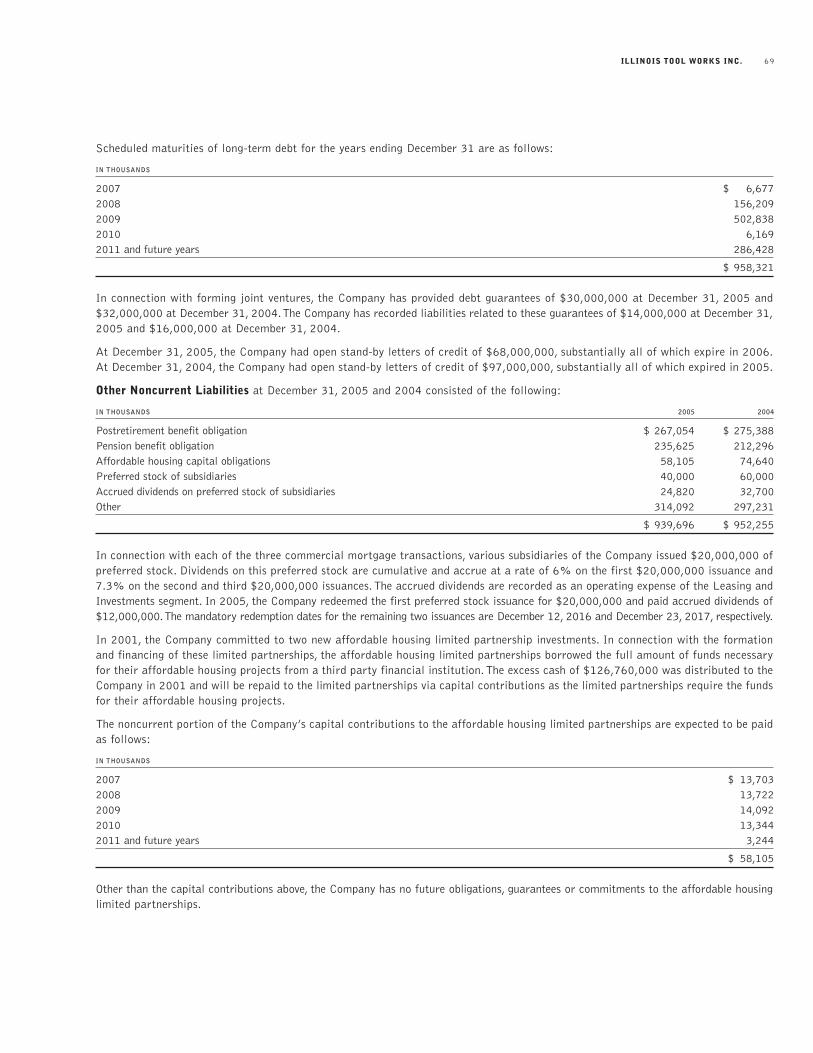
ILLINOIS TOOL WORKS INC. 69
Scheduled maturities of long-term debt for the years ending December 31 are as follows:
IN THOUSANDS
2007 $ 6,6772008 156,2092009 502,8382010 6,1692011 and future years 286,428
$ 958,321
In connection with forming joint ventures, the Company has provided debt guarantees of $30,000,000 at December 31, 2005 and$32,000,000 at December 31, 2004.The Company has recorded liabilities related to these guarantees of $14,000,000 at December 31,2005 and $16,000,000 at December 31, 2004.
At December 31, 2005, the Company had open stand-by letters of credit of $68,000,000, substantially all of which expire in 2006.At December 31, 2004, the Company had open stand-by letters of credit of $97,000,000, substantially all of which expired in 2005.
Other Noncurrent Liabilities at December 31, 2005 and 2004 consisted of the following:
IN THOUSANDS 2005 2004
Postretirement benefit obligation $ 267,054 $ 275,388Pension benefit obligation 235,625 212,296Affordable housing capital obligations 58,105 74,640Preferred stock of subsidiaries 40,000 60,000Accrued dividends on preferred stock of subsidiaries 24,820 32,700Other 314,092 297,231
$ 939,696 $ 952,255
In connection with each of the three commercial mortgage transactions, various subsidiaries of the Company issued $20,000,000 ofpreferred stock. Dividends on this preferred stock are cumulative and accrue at a rate of 6% on the first $20,000,000 issuance and7.3% on the second and third $20,000,000 issuances.The accrued dividends are recorded as an operating expense of the Leasing andInvestments segment. In 2005, the Company redeemed the first preferred stock issuance for $20,000,000 and paid accrued dividends of$12,000,000.The mandatory redemption dates for the remaining two issuances are December 12, 2016 and December 23, 2017, respectively.
In 2001, the Company committed to two new affordable housing limited partnership investments. In connection with the formationand financing of these limited partnerships, the affordable housing limited partnerships borrowed the full amount of funds necessaryfor their affordable housing projects from a third party financial institution.The excess cash of $126,760,000 was distributed to theCompany in 2001 and will be repaid to the limited partnerships via capital contributions as the limited partnerships require the fundsfor their affordable housing projects.
The noncurrent portion of the Company’s capital contributions to the affordable housing limited partnerships are expected to be paidas follows:
IN THOUSANDS
2007 $ 13,7032008 13,7222009 14,0922010 13,3442011 and future years 3,244
$ 58,105
Other than the capital contributions above, the Company has no future obligations, guarantees or commitments to the affordable housinglimited partnerships.
2005 ANNUAL REPORT70
Commitments and Contingencies—The Company is subject to various legal proceedings and claims that arise in the ordinary courseof business, including those involving environmental, tax, product liability (including toxic tort) and general liability claims. TheCompany accrues for such liabilities when it is probable that future costs will be incurred and such costs can be reasonably estimated.Such accruals are based on developments to date, the Company’s estimates of the outcomes of these matters and its experience incontesting, litigating and settling other similar matters. The Company believes resolution of these matters, individually and in theaggregate, will not have a material adverse effect on the Company’s financial position, liquidity or future operations.
Among the toxic tort cases in which the Company is a defendant, the Company as well as its subsidiaries Hobart Brothers Companyand Miller Electric Mfg. Co., have been named, along with numerous other defendants, in lawsuits alleging injury from exposure towelding consumables.The plaintiffs in these suits claim unspecified damages for injuries resulting from the plaintiffs’ alleged exposure toasbestos, manganese and/or toxic fumes in connection with the welding process. Based upon the Company’s experience in defending theseclaims, the Company believes that the resolution of these proceedings will not have a material adverse effect on the Company’s financialposition, liquidity or future operations. The Company has not recorded any significant reserves related to these cases.
Wilsonart International, Inc. (“Wilsonart”), a wholly owned subsidiary of ITW, is a defendant in a consolidated class action lawsuitfiled in 2000 in U.S. federal district court in White Plains, New York on behalf of purchasers of high-pressure laminate. The complaintalleges that Wilsonart participated in a conspiracy with competitors to fix, raise, maintain or stabilize prices for high-pressure laminate between 1994 and 2000 and seeks injunctive relief and treble damages. Indirect purchasers of high-pressure laminate filedsimilar purported class action cases under various state antitrust and consumer protection statutes in 13 states and the District ofColumbia, all of which cases have been stayed pending the outcome of the consolidated class action. These lawsuits were brought following the commencement of a federal grand jury investigation into price-fixing in the high-pressure laminate industry, which investigation was subsequently closed by the Department of Justice with no further proceedings and with all documents being returnedto the parties. Plaintiffs are seeking damages of $470,000,000 before trebling. Without admitting liability, Wilsonart’s co-defendants,International Paper Company and Panolam International, Inc., have settled the federal consolidated class action case for$31,000,000 and $9,500,000, respectively. The plaintiffs’ claims against Formica Corporation, the remaining co-defendant in thecase, were dismissed with prejudice on September 27, 2004 as a result of its bankruptcy proceedings. As a result, Wilsonart is thesole remaining defendant in the consolidated class action lawsuit. While no assurances can be given regarding the ultimate outcomeor the timing of the resolution of these claims, the Company believes that the plaintiffs’ claims are without merit and intends to continueto defend itself vigorously in this action and all related actions that are now pending or that may be brought in the future. TheCompany has not recorded any reserves related to this case.
Preferred Stock, without par value, of which 300,000 shares are authorized, is issuable in series.The Board of Directors is authorizedto fix by resolution the designation and characteristics of each series of preferred stock.The Company has no present commitment toissue its preferred stock.
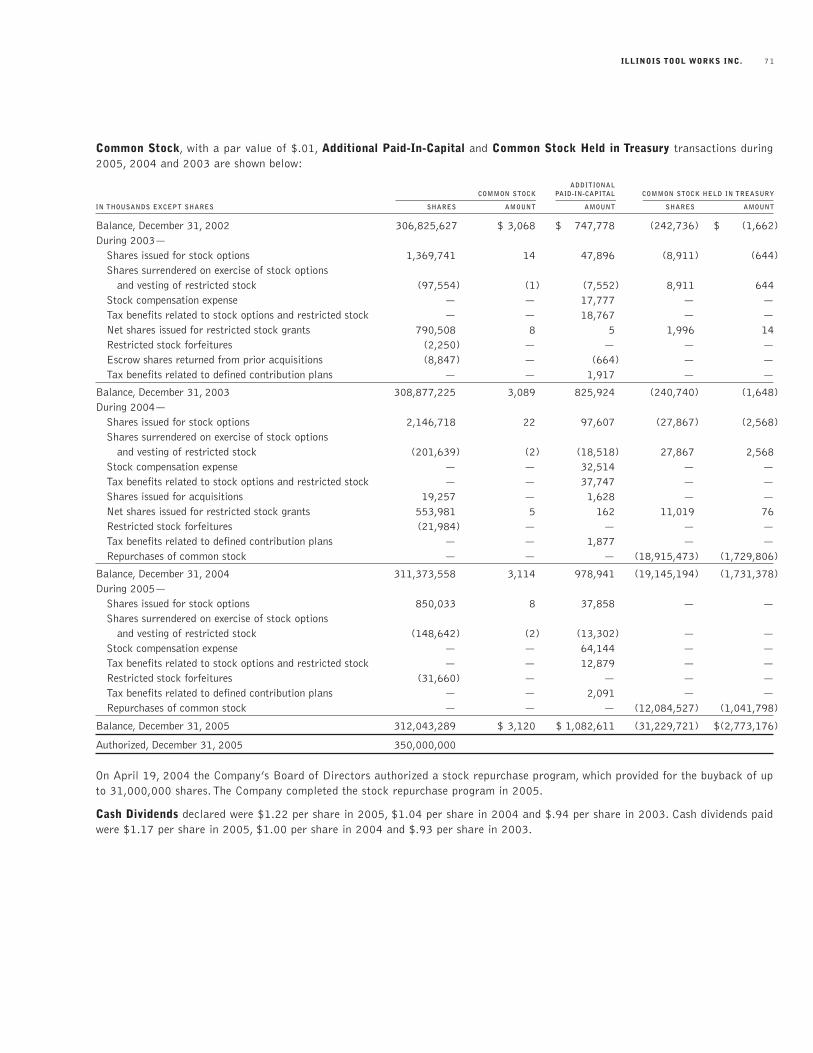
ILLINOIS TOOL WORKS INC. 71
Common Stock, with a par value of $.01, Additional Paid-In-Capital and Common Stock Held in Treasury transactions during2005, 2004 and 2003 are shown below:
ADDITIONALCOMMON STOCK PAID-IN-CAPITAL COMMON STOCK HELD IN TREASURY
IN THOUSANDS EXCEPT SHARES SHARES AMOUNT AMOUNT SHARES AMOUNT
Balance, December 31, 2002 306,825,627 $ 3,068 $ 747,778 (242,736) $ (1,662)During 2003—
Shares issued for stock options 1,369,741 14 47,896 (8,911) (644)Shares surrendered on exercise of stock options
and vesting of restricted stock (97,554) (1) (7,552) 8,911 644Stock compensation expense — — 17,777 — —Tax benefits related to stock options and restricted stock — — 18,767 — —Net shares issued for restricted stock grants 790,508 8 5 1,996 14Restricted stock forfeitures (2,250) — — — —Escrow shares returned from prior acquisitions (8,847) — (664) — —Tax benefits related to defined contribution plans — — 1,917 — —
Balance, December 31, 2003 308,877,225 3,089 825,924 (240,740) (1,648)During 2004—
Shares issued for stock options 2,146,718 22 97,607 (27,867) (2,568)Shares surrendered on exercise of stock options
and vesting of restricted stock (201,639) (2) (18,518) 27,867 2,568Stock compensation expense — — 32,514 — —Tax benefits related to stock options and restricted stock — — 37,747 — —Shares issued for acquisitions 19,257 — 1,628 — —Net shares issued for restricted stock grants 553,981 5 162 11,019 76Restricted stock forfeitures (21,984) — — — —Tax benefits related to defined contribution plans — — 1,877 — —Repurchases of common stock — — — (18,915,473) (1,729,806)
Balance, December 31, 2004 311,373,558 3,114 978,941 (19,145,194) (1,731,378)During 2005—
Shares issued for stock options 850,033 8 37,858 — —Shares surrendered on exercise of stock options
and vesting of restricted stock (148,642) (2) (13,302) — —Stock compensation expense — — 64,144 — —Tax benefits related to stock options and restricted stock — — 12,879 — —Restricted stock forfeitures (31,660) — — — —Tax benefits related to defined contribution plans — — 2,091 — —Repurchases of common stock — — — (12,084,527) (1,041,798)
Balance, December 31, 2005 312,043,289 $ 3,120 $ 1,082,611 (31,229,721) $(2,773,176)
Authorized, December 31, 2005 350,000,000
On April 19, 2004 the Company’s Board of Directors authorized a stock repurchase program, which provided for the buyback of upto 31,000,000 shares. The Company completed the stock repurchase program in 2005.
Cash Dividends declared were $1.22 per share in 2005, $1.04 per share in 2004 and $.94 per share in 2003. Cash dividends paidwere $1.17 per share in 2005, $1.00 per share in 2004 and $.93 per share in 2003.
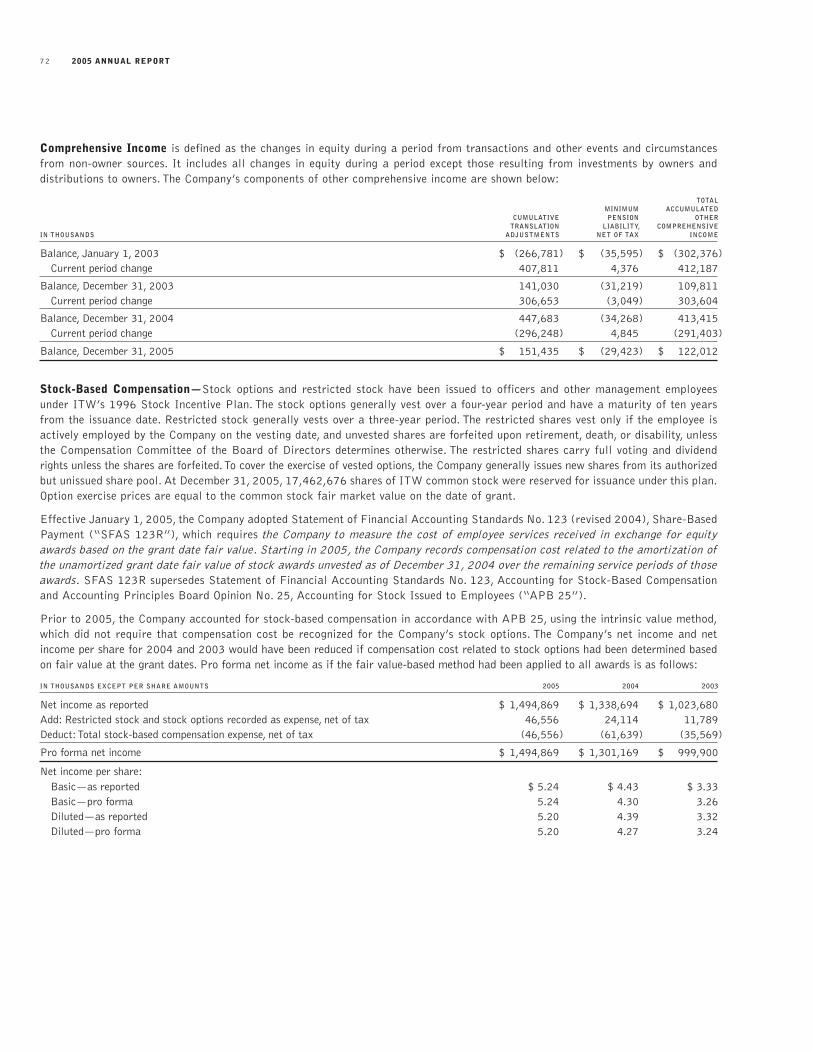
2005 ANNUAL REPORT72
Comprehensive Income is defined as the changes in equity during a period from transactions and other events and circumstancesfrom non-owner sources. It includes all changes in equity during a period except those resulting from investments by owners and distributions to owners. The Company’s components of other comprehensive income are shown below:
TOTAL MINIMUM ACCUMULATED
CUMULATIVE PENSION OTHERTRANSLATION LIABILITY, COMPREHENSIVE
IN THOUSANDS ADJUSTMENTS NET OF TAX INCOME
Balance, January 1, 2003 $ (266,781) $ (35,595) $ (302,376)Current period change 407,811 4,376 412,187
Balance, December 31, 2003 141,030 (31,219) 109,811Current period change 306,653 (3,049) 303,604
Balance, December 31, 2004 447,683 (34,268) 413,415Current period change (296,248) 4,845 (291,403)
Balance, December 31, 2005 $ 151,435 $ (29,423) $ 122,012
Stock-Based Compensation—Stock options and restricted stock have been issued to officers and other management employeesunder ITW’s 1996 Stock Incentive Plan. The stock options generally vest over a four-year period and have a maturity of ten yearsfrom the issuance date. Restricted stock generally vests over a three-year period. The restricted shares vest only if the employee isactively employed by the Company on the vesting date, and unvested shares are forfeited upon retirement, death, or disability, unlessthe Compensation Committee of the Board of Directors determines otherwise. The restricted shares carry full voting and dividendrights unless the shares are forfeited.To cover the exercise of vested options, the Company generally issues new shares from its authorizedbut unissued share pool. At December 31, 2005, 17,462,676 shares of ITW common stock were reserved for issuance under this plan.Option exercise prices are equal to the common stock fair market value on the date of grant.
Effective January 1, 2005, the Company adopted Statement of Financial Accounting Standards No. 123 (revised 2004), Share-BasedPayment (“SFAS 123R”), which requires the Company to measure the cost of employee services received in exchange for equityawards based on the grant date fair value. Starting in 2005, the Company records compensation cost related to the amortization ofthe unamortized grant date fair value of stock awards unvested as of December 31, 2004 over the remaining service periods of thoseawards. SFAS 123R supersedes Statement of Financial Accounting Standards No. 123, Accounting for Stock-Based Compensationand Accounting Principles Board Opinion No. 25, Accounting for Stock Issued to Employees (“APB 25”).
Prior to 2005, the Company accounted for stock-based compensation in accordance with APB 25, using the intrinsic value method,which did not require that compensation cost be recognized for the Company’s stock options. The Company’s net income and netincome per share for 2004 and 2003 would have been reduced if compensation cost related to stock options had been determined basedon fair value at the grant dates. Pro forma net income as if the fair value-based method had been applied to all awards is as follows:
IN THOUSANDS EXCEPT PER SHARE AMOUNTS 2005 2004 2003
Net income as reported $ 1,494,869 $ 1,338,694 $ 1,023,680Add: Restricted stock and stock options recorded as expense, net of tax 46,556 24,114 11,789Deduct:Total stock-based compensation expense, net of tax (46,556) (61,639) (35,569)
Pro forma net income $ 1,494,869 $ 1,301,169 $ 999,900
Net income per share:Basic—as reported $ 5.24 $ 4.43 $ 3.33Basic—pro forma 5.24 4.30 3.26Diluted—as reported 5.20 4.39 3.32Diluted—pro forma 5.20 4.27 3.24
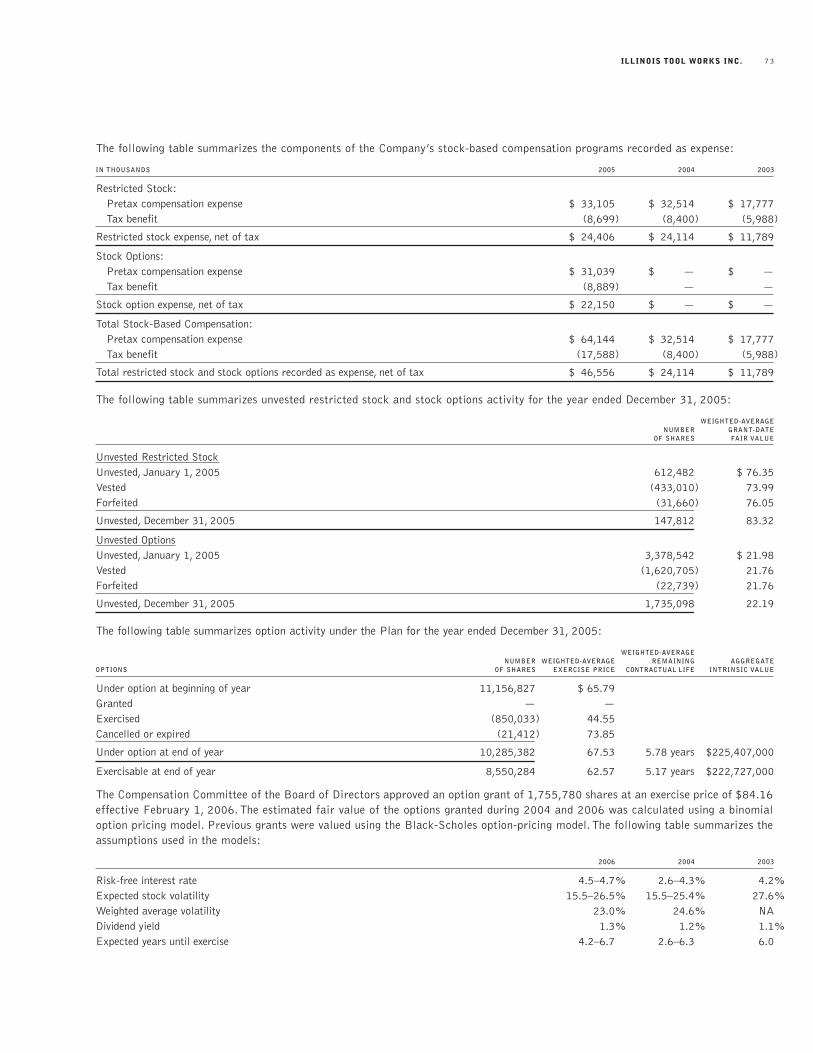
ILLINOIS TOOL WORKS INC. 73
The following table summarizes the components of the Company’s stock-based compensation programs recorded as expense:
IN THOUSANDS 2005 2004 2003
Restricted Stock:Pretax compensation expense $ 33,105 $ 32,514 $ 17,777Tax benefit (8,699) (8,400) (5,988)
Restricted stock expense, net of tax $ 24,406 $ 24,114 $ 11,789
Stock Options:Pretax compensation expense $ 31,039 $ — $ —Tax benefit (8,889) — —
Stock option expense, net of tax $ 22,150 $ — $ —
Total Stock-Based Compensation:Pretax compensation expense $ 64,144 $ 32,514 $ 17,777Tax benefit (17,588) (8,400) (5,988)
Total restricted stock and stock options recorded as expense, net of tax $ 46,556 $ 24,114 $ 11,789
The following table summarizes unvested restricted stock and stock options activity for the year ended December 31, 2005:
WEIGHTED-AVERAGENUMBER GRANT-DATE
OF SHARES FAIR VALUE
Unvested Restricted StockUnvested, January 1, 2005 612,482 $ 76.35Vested (433,010) 73.99Forfeited (31,660) 76.05
Unvested, December 31, 2005 147,812 83.32
Unvested OptionsUnvested, January 1, 2005 3,378,542 $ 21.98Vested (1,620,705) 21.76Forfeited (22,739) 21.76
Unvested, December 31, 2005 1,735,098 22.19
The following table summarizes option activity under the Plan for the year ended December 31, 2005:
WEIGHTED-AVERAGENUMBER WEIGHTED-AVERAGE REMAINING AGGREGATE
OPTIONS OF SHARES EXERCISE PRICE CONTRACTUAL LIFE INTRINSIC VALUE
Under option at beginning of year 11,156,827 $ 65.79Granted — —Exercised (850,033) 44.55Cancelled or expired (21,412) 73.85
Under option at end of year 10,285,382 67.53 5.78 years $225,407,000
Exercisable at end of year 8,550,284 62.57 5.17 years $222,727,000
The Compensation Committee of the Board of Directors approved an option grant of 1,755,780 shares at an exercise price of $84.16effective February 1, 2006. The estimated fair value of the options granted during 2004 and 2006 was calculated using a binomialoption pricing model. Previous grants were valued using the Black-Scholes option-pricing model. The following table summarizes theassumptions used in the models:
2006 2004 2003
Risk-free interest rate 4.5–4.7% 2.6–4.3% 4.2%Expected stock volatility 15.5–26.5% 15.5–25.4% 27.6%Weighted average volatility 23.0% 24.6% NADividend yield 1.3% 1.2% 1.1%Expected years until exercise 4.2–6.7 2.6–6.3 6.0
2005 ANNUAL REPORT74
Lattice-based option valuation models, such as a binomial option pricing model, incorporate ranges of assumptions for inputs. Therisk-free rate of interest for periods within the contractual life of the option is based on a zero-coupon U.S. government instrumentover the contractual term of the equity instrument. Expected volatility is based on implied volatility from traded options on theCompany’s stock and historical volatility of the Company’s stock. The Company uses historical data to estimate option exercise timingand employee termination rates within the valuation model. Separate groups of employees that have similar historical exercise behaviorare considered separately for valuation purposes. The expected term of options granted is derived from the output of the option valuation model and represents the period of time that options granted are expected to be outstanding.The ranges presented result fromseparate groups of employees assumed to exhibit different behavior.
The weighted-average grant-date fair value of options granted during 2006, 2004 and 2003 was $23.73, $21.99 and $25.65 pershare, respectively.The aggregate intrinsic value of options exercised during the years ended December 31, 2005, 2004 and 2003, was$36,754,000, $95,253,000 and $50,002,000, respectively. Exercise of options during the years ended December 31, 2005, 2004 and2003, resulted in cash receipts of $24,563,000, $79,108,000 and $40,357,000, respectively. As of December 31, 2005, there was$32,675,000 of total unrecognized compensation cost related to non-vested equity awards. That cost is expected to be recognizedover a weighted-average period of 2.0 years.
Segment Information—Statement of Financial Accounting Standards No. 131, Disclosures about Segments of an Enterprise andRelated Information, requires that segment information be reported based on the way the segments are organized within the Companyfor making operating decisions and assessing performance.
The Company has approximately 700 operations in 48 countries, which are aggregated and organized for internal reporting purposes in2005 into the following five segments:
Engineered Products—North America: Businesses in this segment are located in North America and manufacture a variety of shortlead-time plastic and metal components and fasteners, as well as specialty products for a diverse customer base. These commerciallyoriented, value-added products become part of the customers’ products and typically are manufactured and delivered in a time periodless than 30 days.
Engineered Products—International: Businesses in this segment are located outside North America and manufacture a variety ofshort lead-time plastic and metal components and fasteners, as well as specialty products for a diverse customer base. These commercially oriented, value-added products become part of the customers’ products and typically are manufactured and deliveredin a time period less than 30 days.
Specialty Systems—North America: Businesses in this segment are located in North America and design and manufacture longerlead-time machinery and related consumables, as well as specialty equipment for a diverse customer base.These commercially oriented,value-added products become part of the customers’ processes and typically are manufactured and delivered in a time period of morethan 30 days.
Specialty Systems—International: Businesses in this segment are located outside North America and design and manufacture longerlead-time machinery and related consumables as well as specialty equipment for a diverse customer base. These commercially oriented,value-added products become part of the customers’ processes and typically are manufactured and delivered in a time period of morethan 30 days.
Leasing and Investments: Businesses in this segment make investments in mortgage entities; leases of telecommunications, aircraft,air traffic control and other equipment; properties; affordable housing and a venture capital fund.
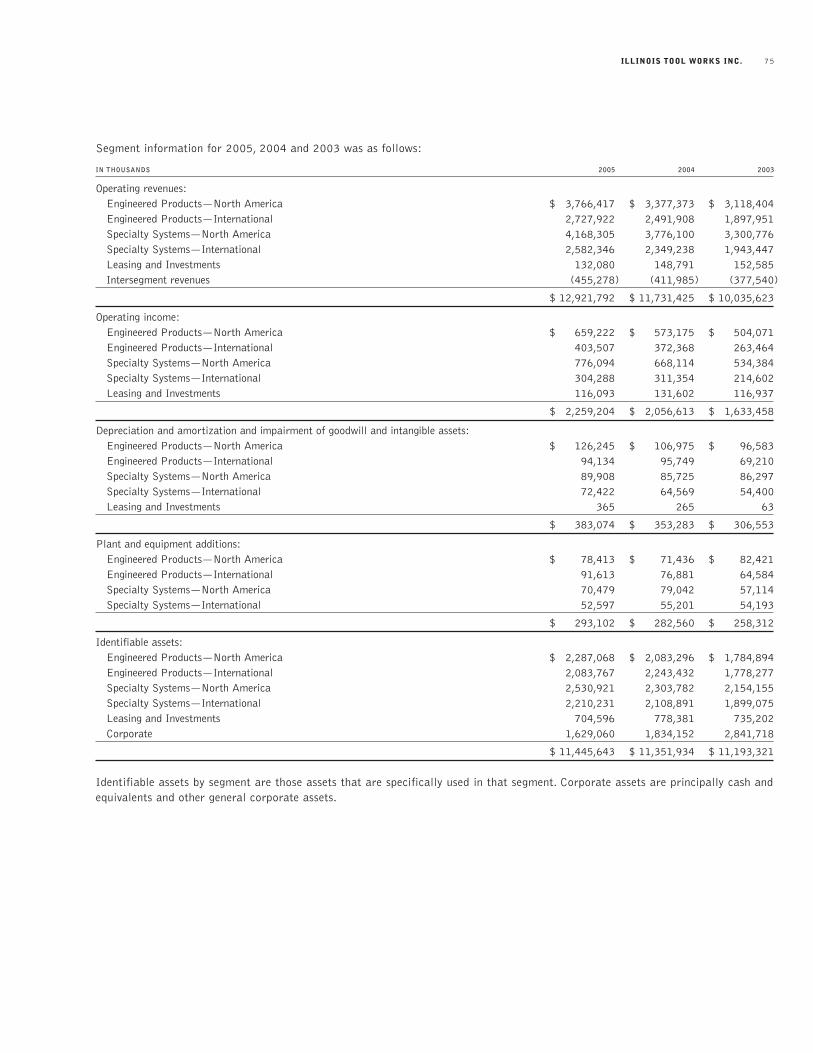
ILLINOIS TOOL WORKS INC. 75
Segment information for 2005, 2004 and 2003 was as follows:
IN THOUSANDS 2005 2004 2003
Operating revenues:Engineered Products—North America $ 3,766,417 $ 3,377,373 $ 3,118,404Engineered Products—International 2,727,922 2,491,908 1,897,951Specialty Systems—North America 4,168,305 3,776,100 3,300,776Specialty Systems—International 2,582,346 2,349,238 1,943,447Leasing and Investments 132,080 148,791 152,585Intersegment revenues (455,278) (411,985) (377,540)
$ 12,921,792 $ 11,731,425 $ 10,035,623
Operating income:Engineered Products—North America $ 659,222 $ 573,175 $ 504,071Engineered Products—International 403,507 372,368 263,464Specialty Systems—North America 776,094 668,114 534,384Specialty Systems—International 304,288 311,354 214,602Leasing and Investments 116,093 131,602 116,937
$ 2,259,204 $ 2,056,613 $ 1,633,458
Depreciation and amortization and impairment of goodwill and intangible assets:Engineered Products—North America $ 126,245 $ 106,975 $ 96,583Engineered Products—International 94,134 95,749 69,210Specialty Systems—North America 89,908 85,725 86,297Specialty Systems—International 72,422 64,569 54,400Leasing and Investments 365 265 63
$ 383,074 $ 353,283 $ 306,553
Plant and equipment additions:Engineered Products—North America $ 78,413 $ 71,436 $ 82,421Engineered Products—International 91,613 76,881 64,584Specialty Systems—North America 70,479 79,042 57,114Specialty Systems—International 52,597 55,201 54,193
$ 293,102 $ 282,560 $ 258,312
Identifiable assets:Engineered Products—North America $ 2,287,068 $ 2,083,296 $ 1,784,894Engineered Products—International 2,083,767 2,243,432 1,778,277Specialty Systems—North America 2,530,921 2,303,782 2,154,155Specialty Systems—International 2,210,231 2,108,891 1,899,075Leasing and Investments 704,596 778,381 735,202Corporate 1,629,060 1,834,152 2,841,718
$ 11,445,643 $ 11,351,934 $ 11,193,321
Identifiable assets by segment are those assets that are specifically used in that segment. Corporate assets are principally cash andequivalents and other general corporate assets.
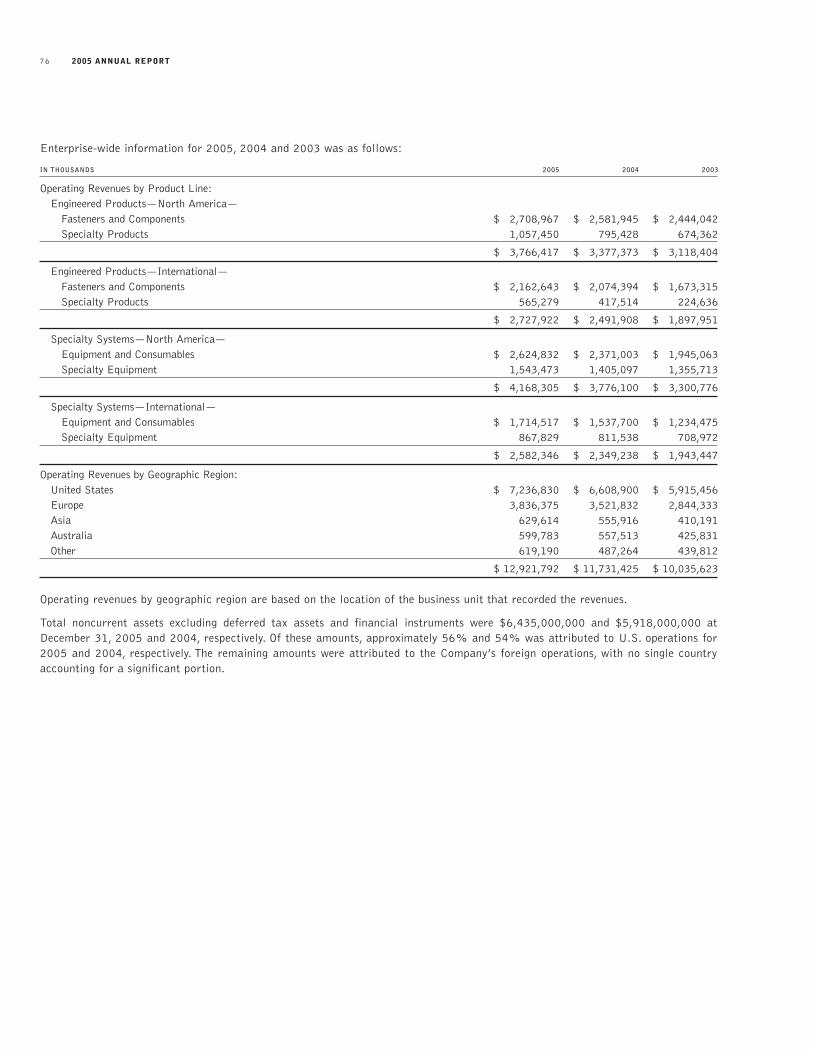
2005 ANNUAL REPORT76
Enterprise-wide information for 2005, 2004 and 2003 was as follows:
IN THOUSANDS 2005 2004 2003
Operating Revenues by Product Line:Engineered Products—North America—
Fasteners and Components $ 2,708,967 $ 2,581,945 $ 2,444,042Specialty Products 1,057,450 795,428 674,362
$ 3,766,417 $ 3,377,373 $ 3,118,404
Engineered Products—International—Fasteners and Components $ 2,162,643 $ 2,074,394 $ 1,673,315Specialty Products 565,279 417,514 224,636
$ 2,727,922 $ 2,491,908 $ 1,897,951
Specialty Systems—North America—Equipment and Consumables $ 2,624,832 $ 2,371,003 $ 1,945,063Specialty Equipment 1,543,473 1,405,097 1,355,713
$ 4,168,305 $ 3,776,100 $ 3,300,776
Specialty Systems—International—Equipment and Consumables $ 1,714,517 $ 1,537,700 $ 1,234,475Specialty Equipment 867,829 811,538 708,972
$ 2,582,346 $ 2,349,238 $ 1,943,447
Operating Revenues by Geographic Region:United States $ 7,236,830 $ 6,608,900 $ 5,915,456Europe 3,836,375 3,521,832 2,844,333Asia 629,614 555,916 410,191Australia 599,783 557,513 425,831Other 619,190 487,264 439,812
$ 12,921,792 $ 11,731,425 $ 10,035,623
Operating revenues by geographic region are based on the location of the business unit that recorded the revenues.
Total noncurrent assets excluding deferred tax assets and financial instruments were $6,435,000,000 and $5,918,000,000 atDecember 31, 2005 and 2004, respectively. Of these amounts, approximately 56% and 54% was attributed to U.S. operations for2005 and 2004, respectively. The remaining amounts were attributed to the Company’s foreign operations, with no single countryaccounting for a significant portion.
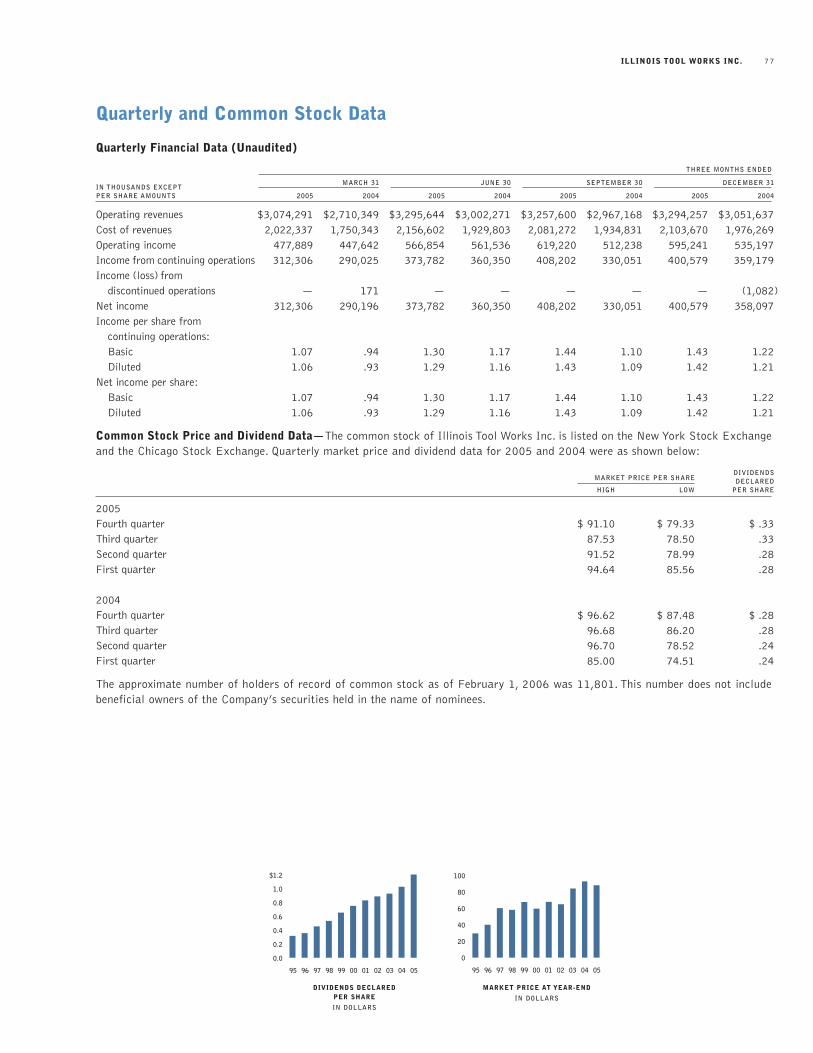
Quarterly and Common Stock Data
Quarterly Financial Data (Unaudited)
THREE MONTHS ENDED
MARCH 31 JUNE 30 SEPTEMBER 30 DECEMBER 31
2005 2004 2005 2004 2005 2004 2005 2004
Operating revenues $3,074,291 $2,710,349 $3,295,644 $3,002,271 $3,257,600 $2,967,168 $3,294,257 $3,051,637Cost of revenues 2,022,337 1,750,343 2,156,602 1,929,803 2,081,272 1,934,831 2,103,670 1,976,269Operating income 477,889 447,642 566,854 561,536 619,220 512,238 595,241 535,197Income from continuing operations 312,306 290,025 373,782 360,350 408,202 330,051 400,579 359,179Income (loss) from
discontinued operations — 171 — — — — — (1,082)Net income 312,306 290,196 373,782 360,350 408,202 330,051 400,579 358,097Income per share from
continuing operations:Basic 1.07 .94 1.30 1.17 1.44 1.10 1.43 1.22Diluted 1.06 .93 1.29 1.16 1.43 1.09 1.42 1.21
Net income per share:Basic 1.07 .94 1.30 1.17 1.44 1.10 1.43 1.22Diluted 1.06 .93 1.29 1.16 1.43 1.09 1.42 1.21
Common Stock Price and Dividend Data—The common stock of Illinois Tool Works Inc. is listed on the New York Stock Exchangeand the Chicago Stock Exchange. Quarterly market price and dividend data for 2005 and 2004 were as shown below:
DIVIDENDSDECLARED
HIGH LOW PER SHARE
2005Fourth quarter $ 91.10 $ 79.33 $ .33Third quarter 87.53 78.50 .33Second quarter 91.52 78.99 .28First quarter 94.64 85.56 .28
2004Fourth quarter $ 96.62 $ 87.48 $ .28Third quarter 96.68 86.20 .28Second quarter 96.70 78.52 .24First quarter 85.00 74.51 .24
The approximate number of holders of record of common stock as of February 1, 2006 was 11,801. This number does not includebeneficial owners of the Company’s securities held in the name of nominees.
ILLINOIS TOOL WORKS INC. 77
IN THOUSANDS EXCEPTPER SHARE AMOUNTS
MARKET PRICE PER SHARE
DIVIDENDS DECLARED PER SHARE
IN DOLLARS
MARKET PRICE AT YEAR-END
IN DOLLARS
0.0
0.2
0.4
0.6
0.8
1.0
$1.2
0504030201009998979695 0504030201009998979695
0
20
40
60
80
100
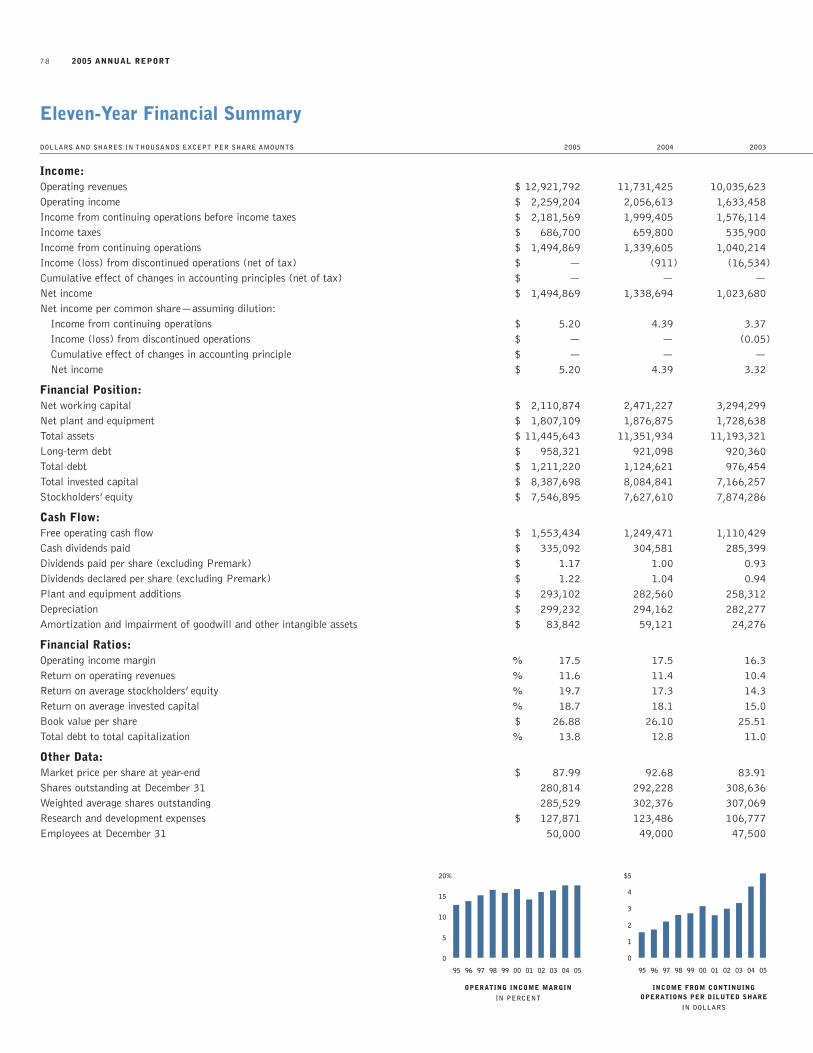
2005 ANNUAL REPORT78
Eleven-Year Financial Summary
DOLLARS AND SHARES IN THOUSANDS EXCEPT PER SHARE AMOUNTS 2005 2004 2003
Income:Operating revenues $ 12,921,792 11,731,425 10,035,623Operating income $ 2,259,204 2,056,613 1,633,458Income from continuing operations before income taxes $ 2,181,569 1,999,405 1,576,114Income taxes $ 686,700 659,800 535,900Income from continuing operations $ 1,494,869 1,339,605 1,040,214Income (loss) from discontinued operations (net of tax) $ — (911) (16,534)Cumulative effect of changes in accounting principles (net of tax) $ — — —Net income $ 1,494,869 1,338,694 1,023,680Net income per common share—assuming dilution:
Income from continuing operations $ 5.20 4.39 3.37Income (loss) from discontinued operations $ — — (0.05)Cumulative effect of changes in accounting principle $ — — —Net income $ 5.20 4.39 3.32
Financial Position:Net working capital $ 2,110,874 2,471,227 3,294,299Net plant and equipment $ 1,807,109 1,876,875 1,728,638Total assets $ 11,445,643 11,351,934 11,193,321Long-term debt $ 958,321 921,098 920,360Total debt $ 1,211,220 1,124,621 976,454Total invested capital $ 8,387,698 8,084,841 7,166,257Stockholders’ equity $ 7,546,895 7,627,610 7,874,286
Cash Flow:Free operating cash flow $ 1,553,434 1,249,471 1,110,429Cash dividends paid $ 335,092 304,581 285,399Dividends paid per share (excluding Premark) $ 1.17 1.00 0.93Dividends declared per share (excluding Premark) $ 1.22 1.04 0.94Plant and equipment additions $ 293,102 282,560 258,312Depreciation $ 299,232 294,162 282,277Amortization and impairment of goodwill and other intangible assets $ 83,842 59,121 24,276
Financial Ratios:Operating income margin % 17.5 17.5 16.3Return on operating revenues % 11.6 11.4 10.4Return on average stockholders’ equity % 19.7 17.3 14.3Return on average invested capital % 18.7 18.1 15.0Book value per share $ 26.88 26.10 25.51Total debt to total capitalization % 13.8 12.8 11.0
Other Data:Market price per share at year-end $ 87.99 92.68 83.91Shares outstanding at December 31 280,814 292,228 308,636Weighted average shares outstanding 285,529 302,376 307,069Research and development expenses $ 127,871 123,486 106,777 Employees at December 31 50,000 49,000 47,500
OPERATING INCOME MARGIN
IN PERCENT
INCOME FROM CONTINUINGOPERATIONS PER DILUTED SHARE
IN DOLLARS
0
5
10
15
20%
0504030201009998979695 0504030201009998979695
0
1
2
3
$5
4
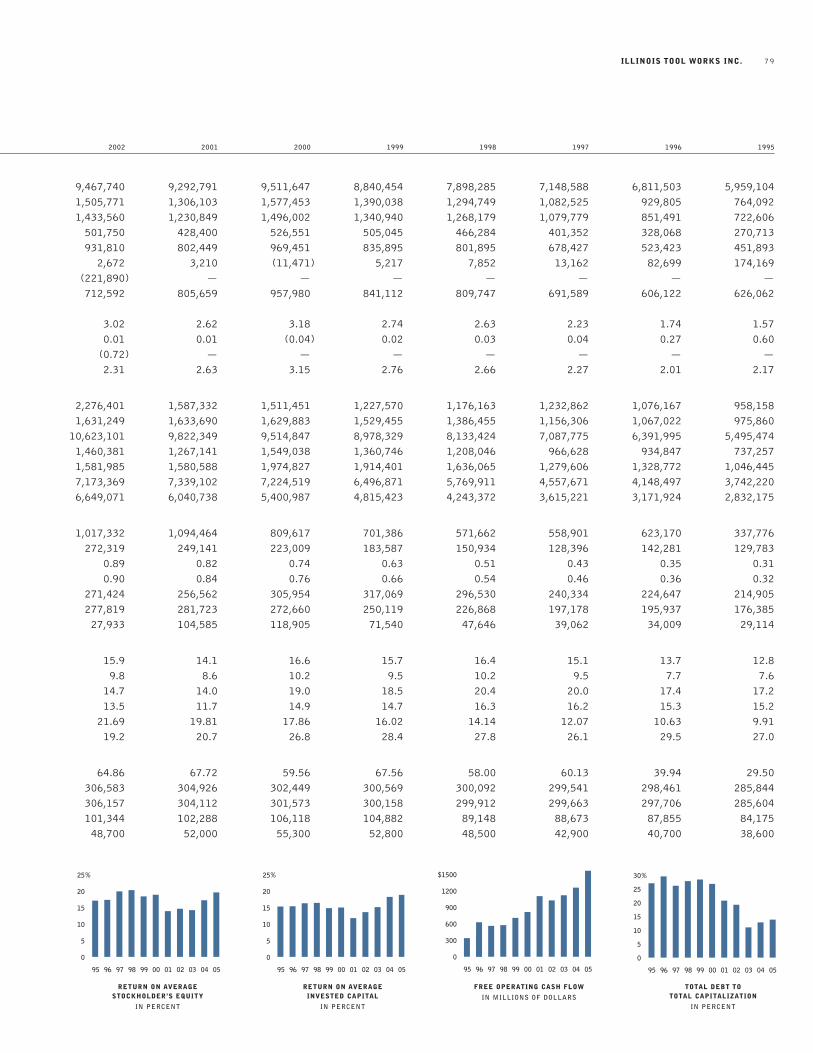
ILLINOIS TOOL WORKS INC. 79
RETURN ON AVERAGE INVESTED CAPITAL
IN PERCENT
FREE OPERATING CASH FLOW
IN MILLIONS OF DOLLARS
TOTAL DEBT TO TOTAL CAPITALIZATION
IN PERCENT
0504030201009998979695
0
5
10
15
20
25%
0504030201009998979695
0
300
600
900
1200
$1500
0504030201009998979695
0
5
10
15
20
25
30%
RETURN ON AVERAGESTOCKHOLDER’S EQUITY
IN PERCENT
0504030201009998979695
0
5
10
15
20
25%
2002 2001 2000 1999 1998 1997 1996 1995
9,467,740 9,292,791 9,511,647 8,840,454 7,898,285 7,148,588 6,811,503 5,959,1041,505,771 1,306,103 1,577,453 1,390,038 1,294,749 1,082,525 929,805 764,092 1,433,560 1,230,849 1,496,002 1,340,940 1,268,179 1,079,779 851,491 722,606
501,750 428,400 526,551 505,045 466,284 401,352 328,068 270,713 931,810 802,449 969,451 835,895 801,895 678,427 523,423 451,893
2,672 3,210 (11,471) 5,217 7,852 13,162 82,699 174,169 (221,890) — — — — — — —712,592 805,659 957,980 841,112 809,747 691,589 606,122 626,062
3.02 2.62 3.18 2.74 2.63 2.23 1.74 1.57 0.01 0.01 (0.04) 0.02 0.03 0.04 0.27 0.60
(0.72) — — — — — — —2.31 2.63 3.15 2.76 2.66 2.27 2.01 2.17
2,276,401 1,587,332 1,511,451 1,227,570 1,176,163 1,232,862 1,076,167 958,158 1,631,249 1,633,690 1,629,883 1,529,455 1,386,455 1,156,306 1,067,022 975,860
10,623,101 9,822,349 9,514,847 8,978,329 8,133,424 7,087,775 6,391,995 5,495,474 1,460,381 1,267,141 1,549,038 1,360,746 1,208,046 966,628 934,847 737,257 1,581,985 1,580,588 1,974,827 1,914,401 1,636,065 1,279,606 1,328,772 1,046,4457,173,369 7,339,102 7,224,519 6,496,871 5,769,911 4,557,671 4,148,497 3,742,220 6,649,071 6,040,738 5,400,987 4,815,423 4,243,372 3,615,221 3,171,924 2,832,175
1,017,332 1,094,464 809,617 701,386 571,662 558,901 623,170 337,776 272,319 249,141 223,009 183,587 150,934 128,396 142,281 129,783
0.89 0.82 0.74 0.63 0.51 0.43 0.35 0.310.90 0.84 0.76 0.66 0.54 0.46 0.36 0.32
271,424 256,562 305,954 317,069 296,530 240,334 224,647 214,905277,819 281,723 272,660 250,119 226,868 197,178 195,937 176,385
27,933 104,585 118,905 71,540 47,646 39,062 34,009 29,114
15.9 14.1 16.6 15.7 16.4 15.1 13.7 12.89.8 8.6 10.2 9.5 10.2 9.5 7.7 7.6
14.7 14.0 19.0 18.5 20.4 20.0 17.4 17.213.5 11.7 14.9 14.7 16.3 16.2 15.3 15.2
21.69 19.81 17.86 16.02 14.14 12.07 10.63 9.9119.2 20.7 26.8 28.4 27.8 26.1 29.5 27.0
64.86 67.72 59.56 67.56 58.00 60.13 39.94 29.50306,583 304,926 302,449 300,569 300,092 299,541 298,461 285,844306,157 304,112 301,573 300,158 299,912 299,663 297,706 285,604101,344 102,288 106,118 104,882 89,148 88,673 87,855 84,175
48,700 52,000 55,300 52,800 48,500 42,900 40,700 38,600
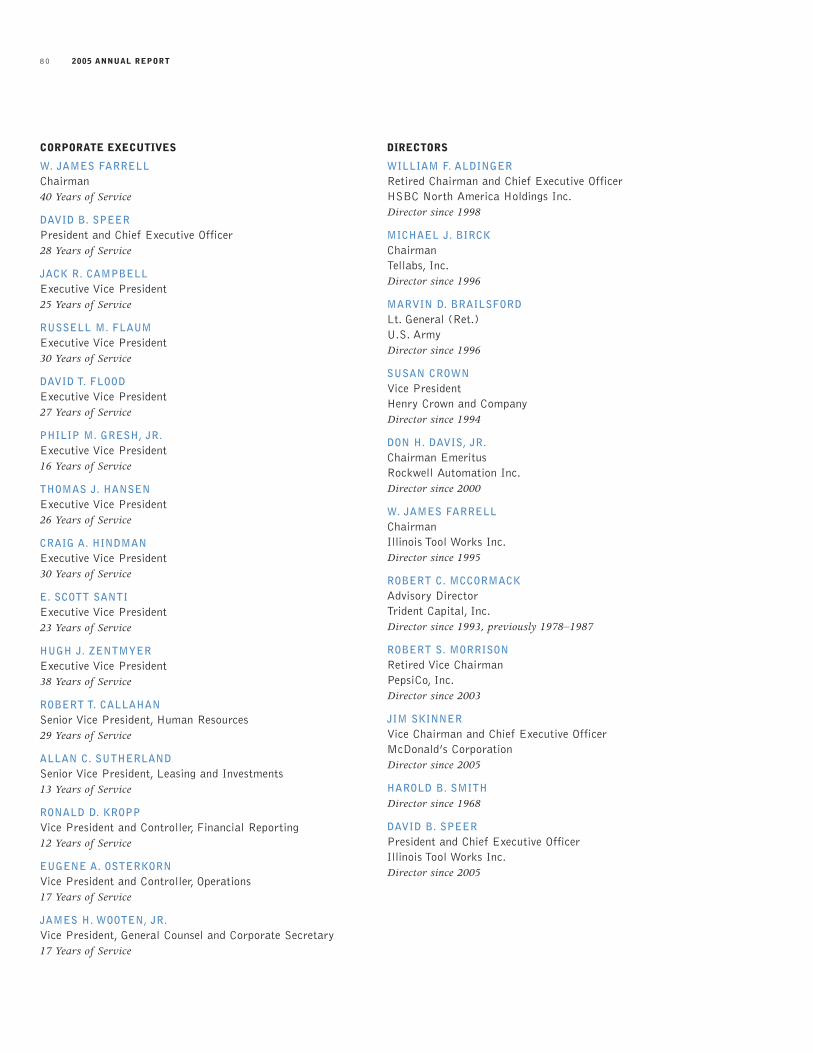
2005 ANNUAL REPORT80
CORPORATE EXECUTIVES
W. JAMES FARRELLChairman40 Years of Service
DAVID B. SPEERPresident and Chief Executive Officer28 Years of Service
JACK R. CAMPBELLExecutive Vice President25 Years of Service
RUSSELL M. FLAUMExecutive Vice President30 Years of Service
DAVID T. FLOODExecutive Vice President27 Years of Service
PHILIP M. GRESH, JR.Executive Vice President16 Years of Service
THOMAS J. HANSENExecutive Vice President26 Years of Service
CRAIG A. HINDMANExecutive Vice President30 Years of Service
E. SCOTT SANTIExecutive Vice President23 Years of Service
HUGH J. ZENTMYERExecutive Vice President38 Years of Service
ROBERT T. CALLAHANSenior Vice President, Human Resources29 Years of Service
ALLAN C. SUTHERLANDSenior Vice President, Leasing and Investments13 Years of Service
RONALD D. KROPPVice President and Controller, Financial Reporting12 Years of Service
EUGENE A. OSTERKORNVice President and Controller, Operations17 Years of Service
JAMES H. WOOTEN, JR.Vice President, General Counsel and Corporate Secretary17 Years of Service
DIRECTORS
WILLIAM F. ALDINGER Retired Chairman and Chief Executive OfficerHSBC North America Holdings Inc.Director since 1998
MICHAEL J. BIRCKChairmanTellabs, Inc.Director since 1996
MARVIN D. BRAILSFORDLt. General (Ret.)U.S. ArmyDirector since 1996
SUSAN CROWNVice PresidentHenry Crown and Company Director since 1994
DON H. DAVIS, JR.Chairman EmeritusRockwell Automation Inc.Director since 2000
W. JAMES FARRELLChairmanIllinois Tool Works Inc.Director since 1995
ROBERT C. MCCORMACKAdvisory DirectorTrident Capital, Inc.Director since 1993, previously 1978–1987
ROBERT S. MORRISONRetired Vice ChairmanPepsiCo, Inc.Director since 2003
JIM SKINNERVice Chairman and Chief Executive OfficerMcDonald’s CorporationDirector since 2005
HAROLD B. SMITHDirector since 1968
DAVID B. SPEERPresident and Chief Executive OfficerIllinois Tool Works Inc.Director since 2005
TRANSFER AGENT AND REGISTRARComputershare Investor Services, L.L.C.2 North LaSalle StreetChicago, IL 60602888.829.7424
AUDITORSDeloitte & Touche LLP111 South Wacker DriveChicago, IL 60606-4301
COMMON STOCKITW common stock is listed on the New York Stock Exchange and Chicago Stock Exchange. Symbol—ITW
ANNUAL MEETINGFriday, May 5, 2006, 3:00 p.m.The Northern Trust Company50 South LaSalle StreetChicago, IL 60675
STOCK AND DIVIDEND ACTIONEffective with the October 17, 2005 payment,the quarterly cash dividend on ITW common stockwas increased 18 percent to 33 cents a share.This represents an increase of 20 cents pershare annually. ITW’s annual dividend paymenthas increased 42 consecutive years, except duringa period of government controls in 1971.
DIVIDEND REINVESTMENT PLANThe ITW Common Stock Dividend ReinvestmentPlan enables registered shareholders to reinvestthe ITW dividends they receive in additionalshares of common stock of the Company at noadditional cost. Participation in the plan is voluntary, and shareholders may join or withdrawat any time. The plan also allows for additionalvoluntary cash investments in any amount from$100 to $10,000 per month. For a brochure and full details of the program, please directinquiries to:
Computershare Trust CompanyDividend Reinvestment ServiceP.O. Box A3309Chicago, IL 60690-3309888.829.7424
SHAREHOLDERS INFORMATIONQuestions regarding stock ownership, dividend payments or change of address should bedirected to the Company’s transfer agent,Computershare Investor Services.Computershare Shareholders ServiceDepartment may be reached at 888.829.7424.
For additional assistance regarding stock holdings, please contact Jill Hansen,Shareholder Relations, 847.657.4929.
Shareholder Relations may be reached at:Illinois Tool Works Inc.3600 West Lake Avenue Glenview, IL 60026Telephone: 847.724.7500Facsimile: 847.657.4261
Security analysts and investment professionalsshould contact the Company’s Vice President ofInvestor Relations, John L. Brooklier,847.657.4104.
CORPORATE GOVERNANCEOn June 1, 2005, the Company’s President andChief Executive Officer certified to the New YorkStock Exchange (“NYSE”) that he is not aware of any violation by the Company of theNYSE corporate governance listing standards.The Company has provided certifications by the President and Chief Executive Officer andVice President and Controller, Financial Reportingregarding the quality of the Company’s public disclosure, as required by Section 302 of theSarbanes-Oxley Act, on Exhibit 31 in itsAnnual Report on Form 10-K.
TRADEMARKSCertain trademarks in this publication are ownedor licensed by Illinois Tool Works Inc. or its wholly owned subsidiaries.
HI-CONE RECYCLINGITW Hi-Cone, manufacturer of recyclablemulti-pack ring carriers, offers assistance toschools, offices and communities interested inestablishing carrier collection programs.
For more information, please contact:
ITW HI-CONE1140 West Bryn Mawr AvenueItasca, IL 60413Telephone: 630.438.5300Visit our Web site at www.ringleader.com
Outside the United States, contact:
ITW HI-CONE (ITW LIMITED)Greenock Road, Slough Trading Estate, Slough,Berkshire, SL1 4QQ, United KingdomTelephone: 44.1753.479980
ITW HI-CONE (ITW AUSTRALIA)8–12 Eskay Road, South OakleighVictoria 3167, AustraliaTelephone: 61.3.9579.5111
ITW HI-CONE (ITW ESPAÑA)Polg. Ind. Congost P-5, Naves 7-8-9,08530 La Garriga, Barcelona, SpainTelephone: 34.93.860.5020
SIGNODE PLASTIC STRAPRECYCLING AND PET BOTTLECOLLECTION PROGRAMSSome of Signode’s plastic strapping is madefrom post-consumer strapping and PET beverage bottles.The Company has collection programs for both these materials. For more information about post-consumer strapping recycling andpost-consumer PET bottles (large volume only),please contact:
ITW SIGNODE7080 Industrial RoadFlorence, KY 41042Telephone: 859.342.6400
INTERNET HOME PAGEwww.itw.com
DESIGNSmith Design Co.Evanston, Illinois
PHOTOGRAPHYDan DryAlec Huff
Page 6:
© 2006 TAYLORMADE is a trademark
of the Taylor Made Golf Company, Inc.
Used with permission.
CORPORATE INFORMATION

I L L I N O I S T O O L W O R K S I N C .
3600 West Lake AvenueGlenview, Illinois 60026