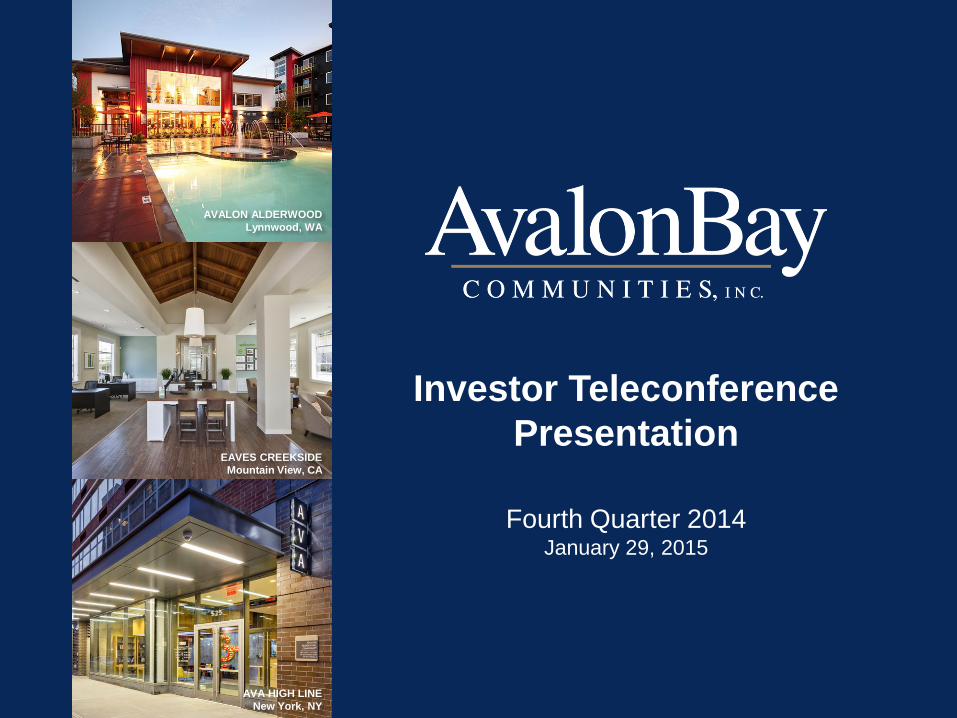
Fourth Quarter 2014 January 29, 2015
Investor Teleconference
Presentation
AVALON ALDERWOOD
Lynnwood, WA
EAVES CREEKSIDE
Mountain View, CA
AVA HIGH LINE
New York, NY
2
See Appendix for information about
Forward-Looking Statements and definitions
of non-GAAP financial measures and other terms.
INTRODUCTION
Participants:
Tim Naughton, Chairman & CEO
Kevin O’Shea, Chief Financial Officer
Matt Birenbaum, Chief Investment Officer
Sean Breslin, Chief Operating Officer
3
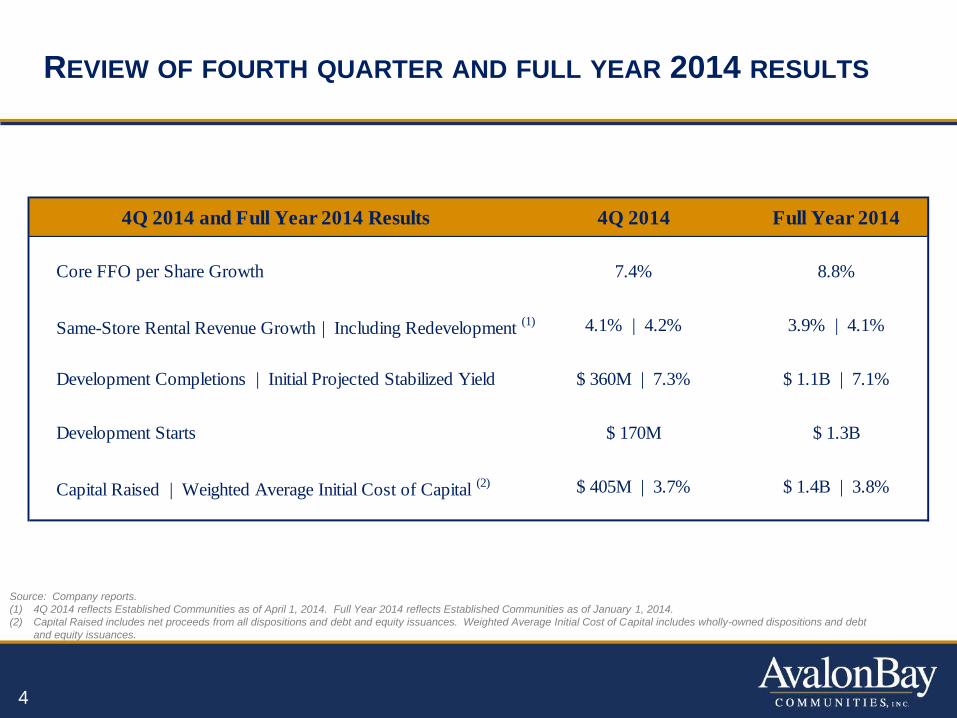
REVIEW OF FOURTH QUARTER AND FULL YEAR 2014 RESULTS
Source: Company reports.
(1) 4Q 2014 reflects Established Communities as of April 1, 2014. Full Year 2014 reflects Established Communities as of January 1, 2014.
(2) Capital Raised includes net proceeds from all dispositions and debt and equity issuances. Weighted Average Initial Cost of Capital includes wholly-owned dispositions and debt
and equity issuances.
4
4Q 2014 and Full Year 2014 Results 4Q 2014 Full Year 2014
Core FFO per Share Growth 7.4% 8.8%
Same-Store Rental Revenue Growth | Including Redevelopment
(1) 4.1% | 4.2% 3.9% | 4.1%
Development Completions | Initial Projected Stabilized Yield $ 360M | 7.3% $ 1.1B | 7.1%
Development Starts $ 170M $ 1.3B
Capital Raised | Weighted Average Initial Cost of Capital (2) $ 405M | 3.7% $ 1.4B | 3.8%
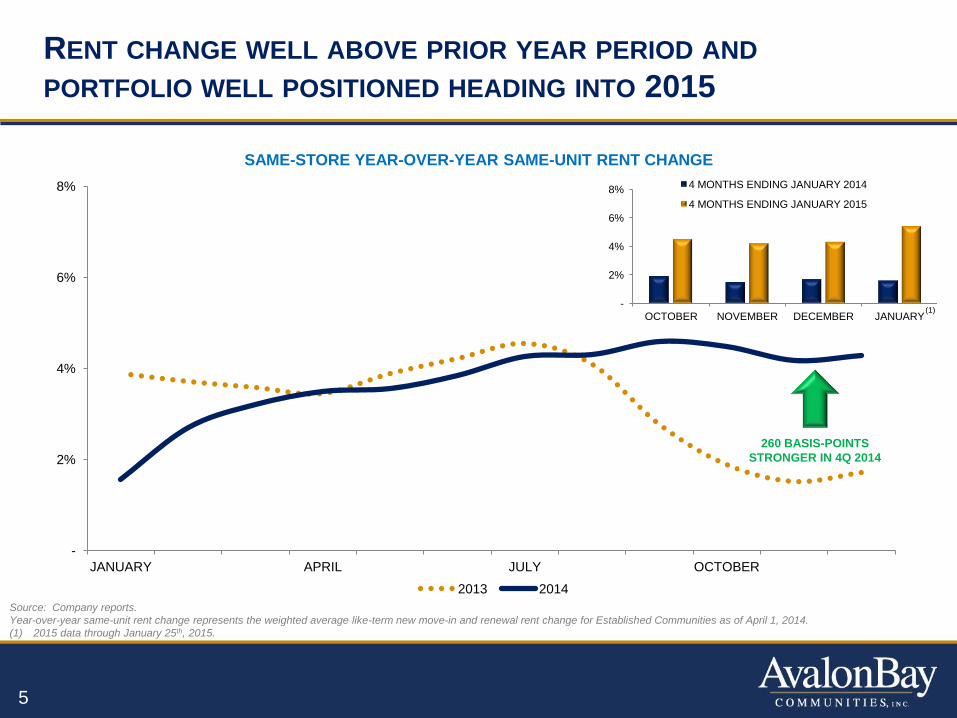
RENT CHANGE WELL ABOVE PRIOR YEAR PERIOD AND
PORTFOLIO WELL POSITIONED HEADING INTO 2015
Source: Company reports.
Year-over-year same-unit rent change represents the weighted average like-term new move-in and renewal rent change for Established Communities as of April 1, 2014.
(1) 2015 data through January 25th, 2015.
SAME-STORE YEAR-OVER-YEAR SAME-UNIT RENT CHANGE
-
2%
4%
6%
8%
JANUARY APRIL JULY OCTOBER
2013 2014
-
2%
4%
6%
8%
OCTOBER NOVEMBER DECEMBER JANUARY
4 MONTHS ENDING JANUARY 2014
4 MONTHS ENDING JANUARY 2015
(1)
260 BASIS-POINTS
STRONGER IN 4Q 2014
5
ActualOriginal
ProjectionD
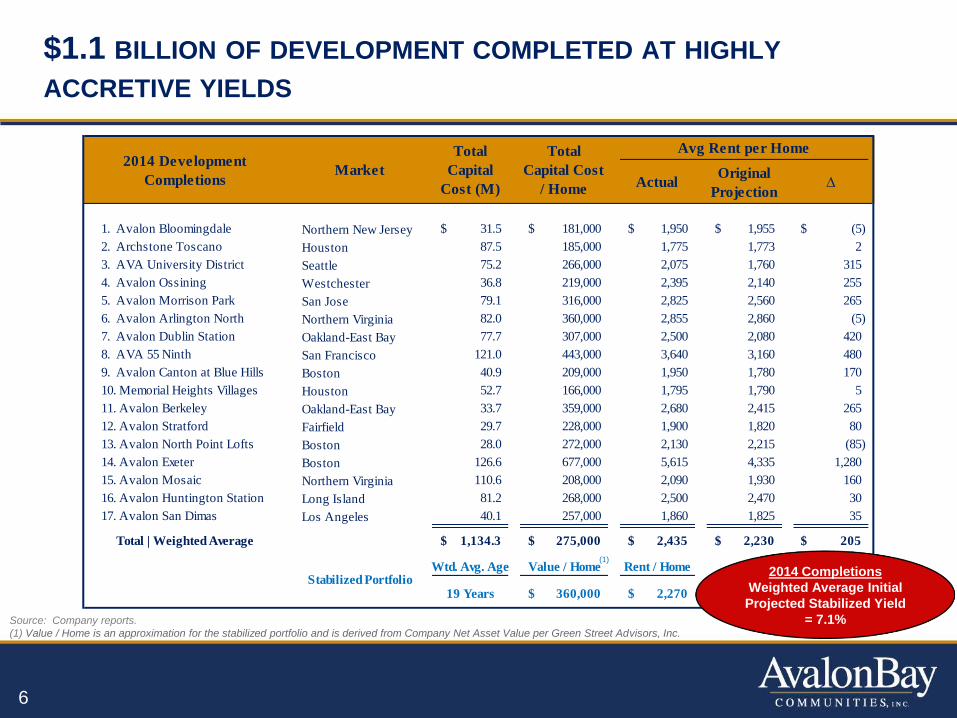
1. Avalon Bloomingdale Northern New Jersey 31.5$ 181,000$ 1,950$ 1,955$ (5)$
2. Archstone Toscano Houston 87.5 185,000 1,775 1,773 2
3. AVA University District Seattle 75.2 266,000 2,075 1,760 315
4. Avalon Ossining Westchester 36.8 219,000 2,395 2,140 255
5. Avalon Morrison Park San Jose 79.1 316,000 2,825 2,560 265
6. Avalon Arlington North Northern Virginia 82.0 360,000 2,855 2,860 (5)
7. Avalon Dublin Station Oakland-East Bay 77.7 307,000 2,500 2,080 420
8. AVA 55 Ninth San Francisco 121.0 443,000 3,640 3,160 480
9. Avalon Canton at Blue Hills Boston 40.9 209,000 1,950 1,780 170
10. Memorial Heights Villages Houston 52.7 166,000 1,795 1,790 5
11. Avalon Berkeley Oakland-East Bay 33.7 359,000 2,680 2,415 265
12. Avalon Stratford Fairfield 29.7 228,000 1,900 1,820 80
13. Avalon North Point Lofts Boston 28.0 272,000 2,130 2,215 (85)
14. Avalon Exeter Boston 126.6 677,000 5,615 4,335 1,280
15. Avalon Mosaic Northern Virginia 110.6 208,000 2,090 1,930 160
16. Avalon Huntington Station Long Island 81.2 268,000 2,500 2,470 30
17. Avalon San Dimas Los Angeles 40.1 257,000 1,860 1,825 35
Total | Weighted Average 1,134.3$ 275,000$ 2,435$ 2,230$ 205$
Wtd. Avg. Age Value / Home Rent / Home
19 Years 360,000$ 2,270$ Stabilized Portfolio
2014 Development
Completions
Total
Capital
Cost (M)
Total
Capital Cost
/ Home
Market
Avg Rent per Home
$1.1 BILLION OF DEVELOPMENT COMPLETED AT HIGHLY
ACCRETIVE YIELDS
Source: Company reports.
(1) Value / Home is an approximation for the stabilized portfolio and is derived from Company Net Asset Value per Green Street Advisors, Inc.
(1)
6
2014 Completions
Weighted Average Initial
Projected Stabilized Yield
= 7.1%
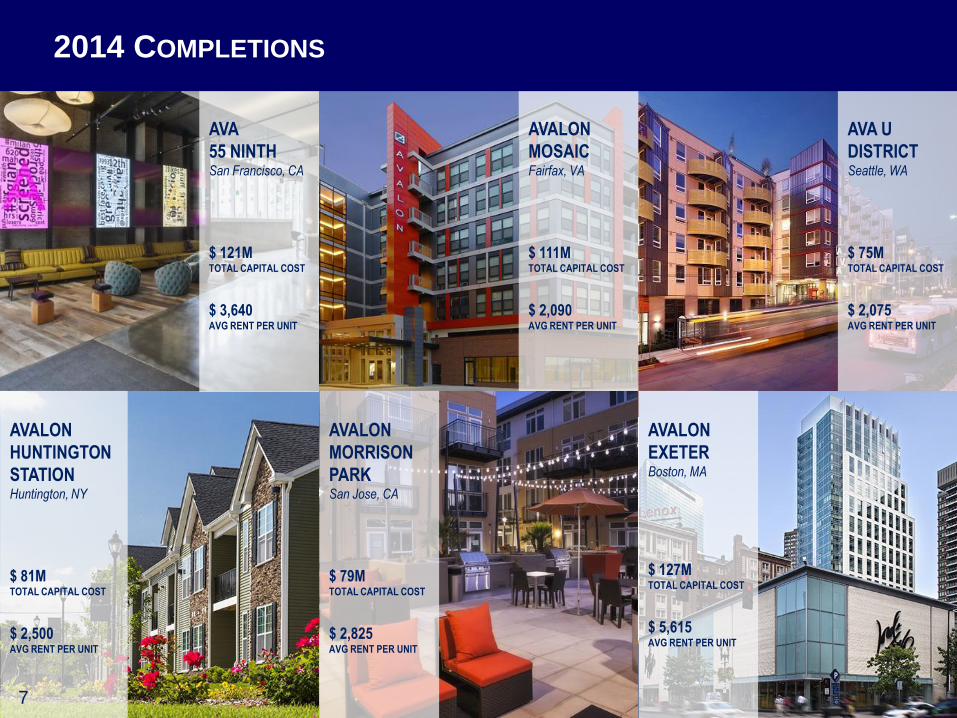
AVA U
DISTRICT Seattle, WA
$ 75M TOTAL CAPITAL COST
$ 2,075 AVG RENT PER UNIT
AVALON
MOSAIC Fairfax, VA
$ 111M TOTAL CAPITAL COST
$ 2,090 AVG RENT PER UNIT
AVA
55 NINTH San Francisco, CA
$ 121M TOTAL CAPITAL COST
$ 3,640 AVG RENT PER UNIT
AVALON
EXETER Boston, MA
$ 127M TOTAL CAPITAL COST
$ 5,615 AVG RENT PER UNIT
AVALON
MORRISON
PARK San Jose, CA
$ 79M TOTAL CAPITAL COST
$ 2,825 AVG RENT PER UNIT
AVALON
HUNTINGTON
STATION Huntington, NY
$ 81M TOTAL CAPITAL COST
$ 2,500 AVG RENT PER UNIT
2014 COMPLETIONS
7
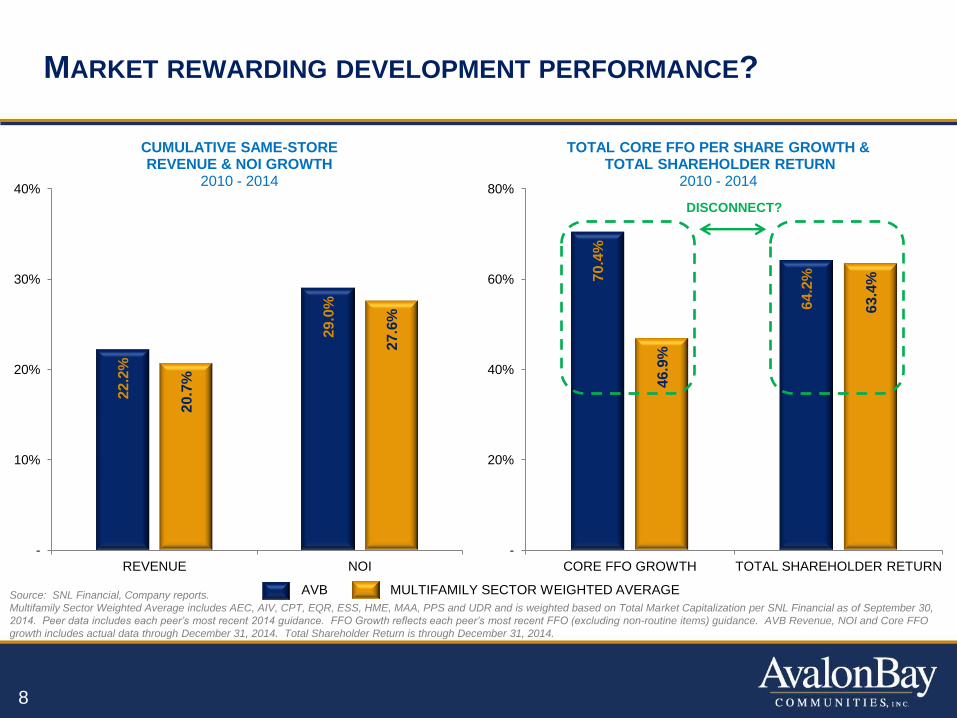
MARKET REWARDING DEVELOPMENT PERFORMANCE?
Source: SNL Financial, Company reports.
Multifamily Sector Weighted Average includes AEC, AIV, CPT, EQR, ESS, HME, MAA, PPS and UDR and is weighted based on Total Market Capitalization per SNL Financial as of September 30,
2014. Peer data includes each peer’s most recent 2014 guidance. FFO Growth reflects each peer’s most recent FFO (excluding non-routine items) guidance. AVB Revenue, NOI and Core FFO
growth includes actual data through December 31, 2014. Total Shareholder Return is through December 31, 2014.
22.2
%
29.0
%
20.7
%
27.6
%
-
10%
20%
30%
40%
REVENUE NOI
CUMULATIVE SAME-STORE REVENUE & NOI GROWTH
2010 - 2014
70.4
%
64.2
%
46.9
%
63.4
%
-
20%
40%
60%
80%
CORE FFO GROWTH TOTAL SHAREHOLDER RETURN
TOTAL CORE FFO PER SHARE GROWTH & TOTAL SHAREHOLDER RETURN
2010 - 2014
AVB MULTIFAMILY SECTOR WEIGHTED AVERAGE
8
DISCONNECT?
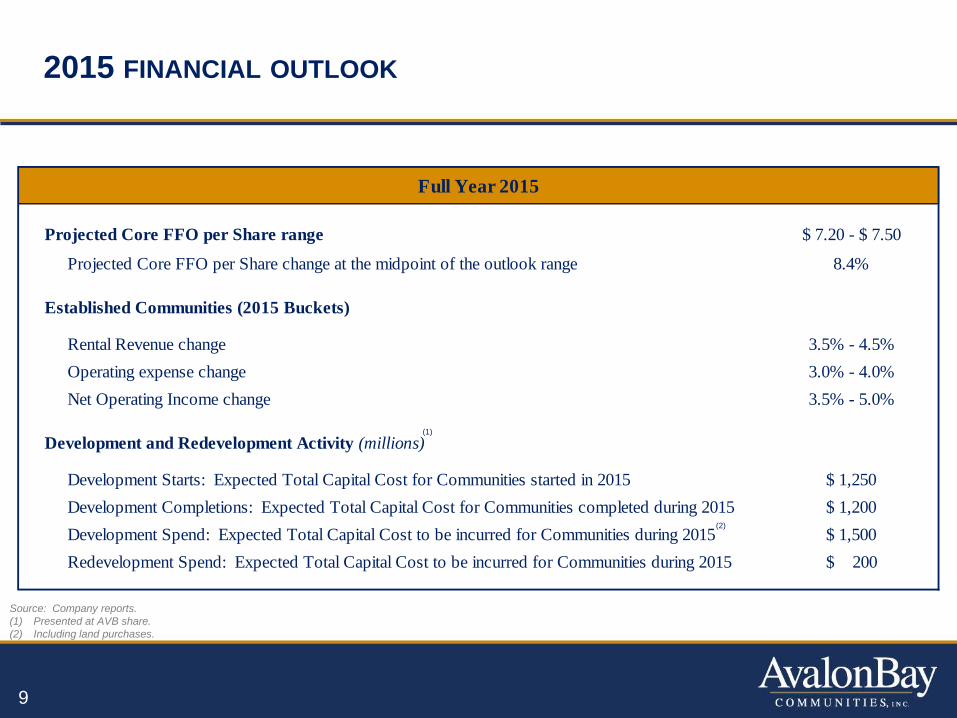
Full Year 2015
Projected Core FFO per Share range $ 7.20 - $ 7.50
Projected Core FFO per Share change at the midpoint of the outlook range 8.4%
Established Communities (2015 Buckets)
Rental Revenue change 3.5% - 4.5%
Operating expense change 3.0% - 4.0%
Net Operating Income change 3.5% - 5.0%
Development and Redevelopment Activity (millions)
Development Starts: Expected Total Capital Cost for Communities started in 2015 $ 1,250
Development Completions: Expected Total Capital Cost for Communities completed during 2015 $ 1,200
Development Spend: Expected Total Capital Cost to be incurred for Communities during 2015 $ 1,500
Redevelopment Spend: Expected Total Capital Cost to be incurred for Communities during 2015 $ 200
2015 FINANCIAL OUTLOOK
Source: Company reports.
(1) Presented at AVB share.
(2) Including land purchases.
9
(1)
(2)
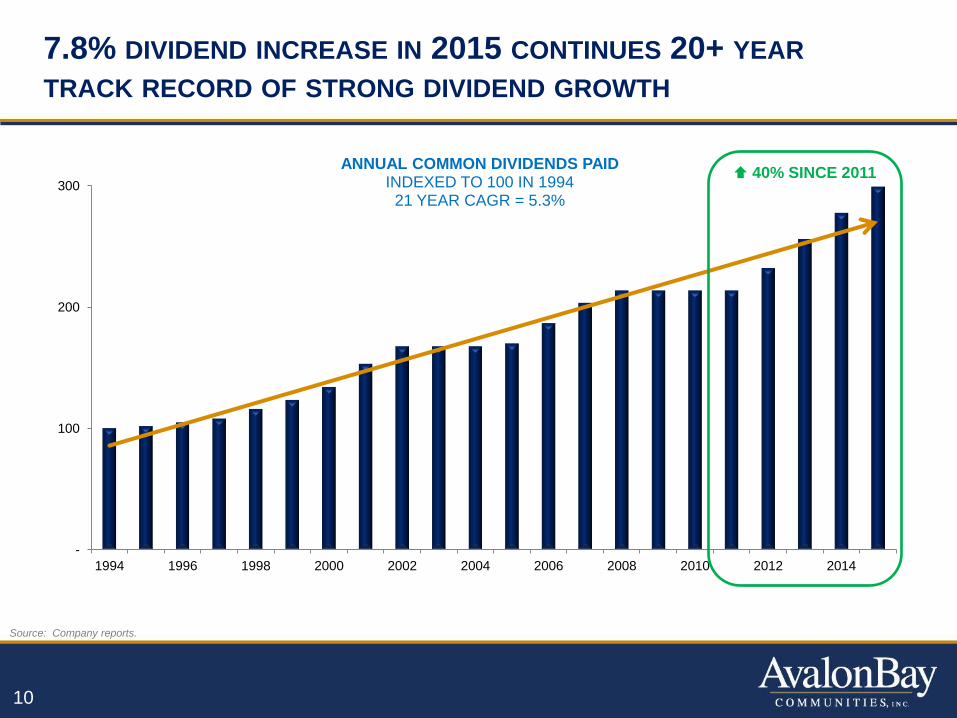
7.8% DIVIDEND INCREASE IN 2015 CONTINUES 20+ YEAR
TRACK RECORD OF STRONG DIVIDEND GROWTH
Source: Company reports.
-
100
200
300
1994 1996 1998 2000 2002 2004 2006 2008 2010 2012 2014
ANNUAL COMMON DIVIDENDS PAID INDEXED TO 100 IN 1994
21 YEAR CAGR = 5.3%
40% SINCE 2011
10
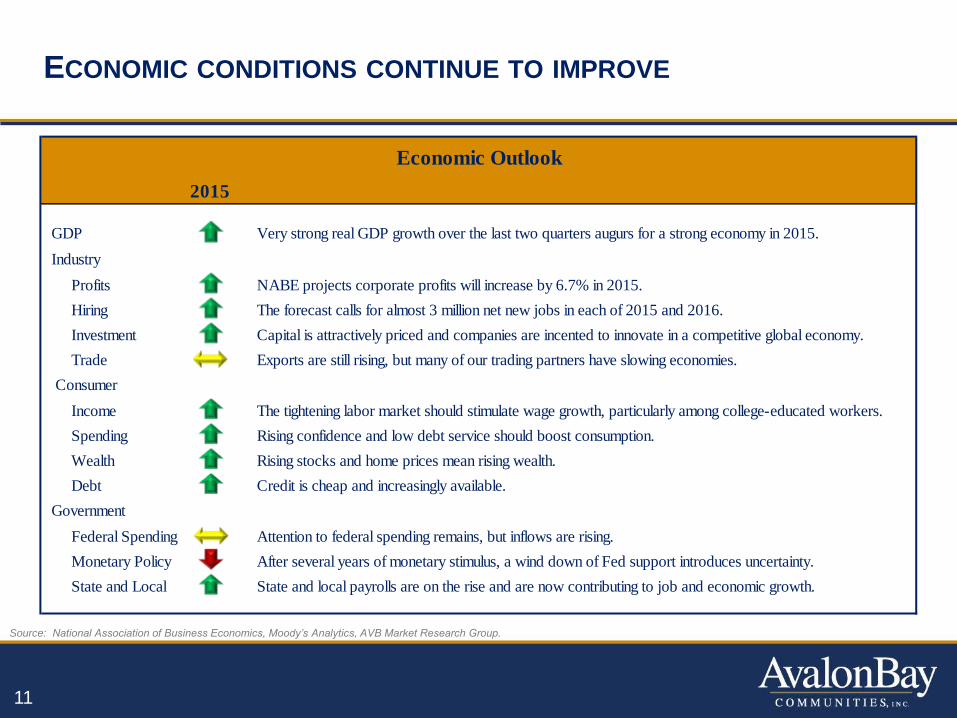
ECONOMIC CONDITIONS CONTINUE TO IMPROVE
11
Source: National Association of Business Economics, Moody’s Analytics, AVB Market Research Group.
Economic Outlook
2015
GDP Very strong real GDP growth over the last two quarters augurs for a strong economy in 2015.
Industry
Profits NABE projects corporate profits will increase by 6.7% in 2015.
Hiring The forecast calls for almost 3 million net new jobs in each of 2015 and 2016.
Investment Capital is attractively priced and companies are incented to innovate in a competitive global economy.
Trade Exports are still rising, but many of our trading partners have slowing economies.
Consumer
Income The tightening labor market should stimulate wage growth, particularly among college-educated workers.
Spending Rising confidence and low debt service should boost consumption.
Wealth Rising stocks and home prices mean rising wealth.
Debt Credit is cheap and increasingly available.
Government
Federal Spending Attention to federal spending remains, but inflows are rising.
Monetary Policy After several years of monetary stimulus, a wind down of Fed support introduces uncertainty.
State and Local State and local payrolls are on the rise and are now contributing to job and economic growth.
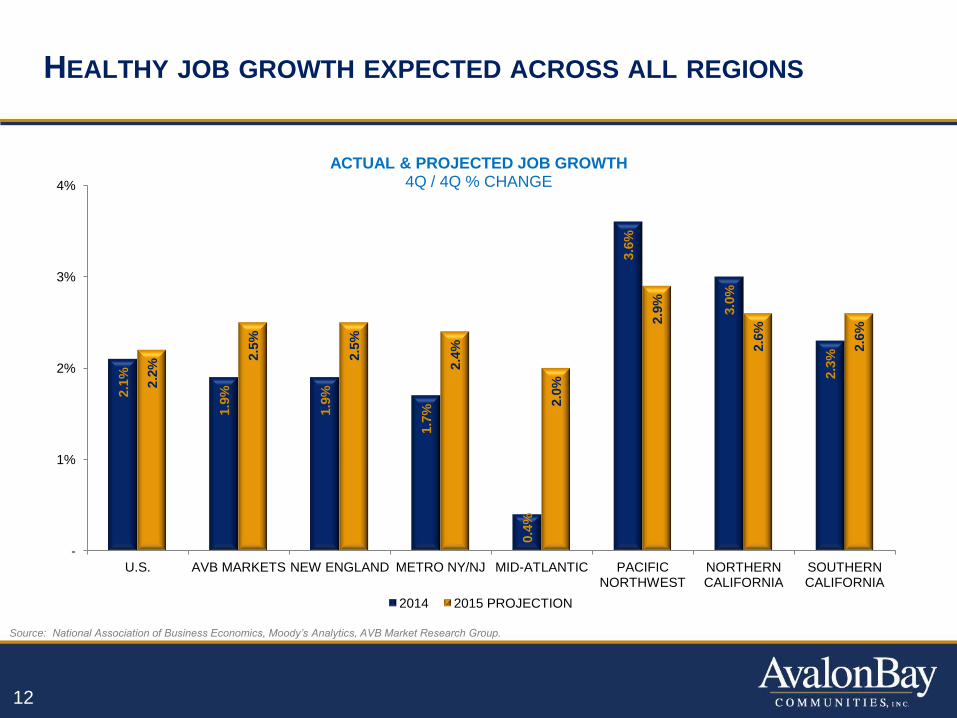
2.1
%
1.9
%
1.9
%
1.7
%
0.4
%
3.6
%
3.0
%
2.3
%
2.2
% 2.5
%
2.5
%
2.4
%
2.0
%
2.9
%
2.6
%
2.6
%
-
1%
2%
3%
4%
U.S. AVB MARKETS NEW ENGLAND METRO NY/NJ MID-ATLANTIC PACIFIC NORTHWEST
NORTHERN CALIFORNIA
SOUTHERN CALIFORNIA
ACTUAL & PROJECTED JOB GROWTH 4Q / 4Q % CHANGE
2014 2015 PROJECTION
HEALTHY JOB GROWTH EXPECTED ACROSS ALL REGIONS
12
Source: National Association of Business Economics, Moody’s Analytics, AVB Market Research Group.
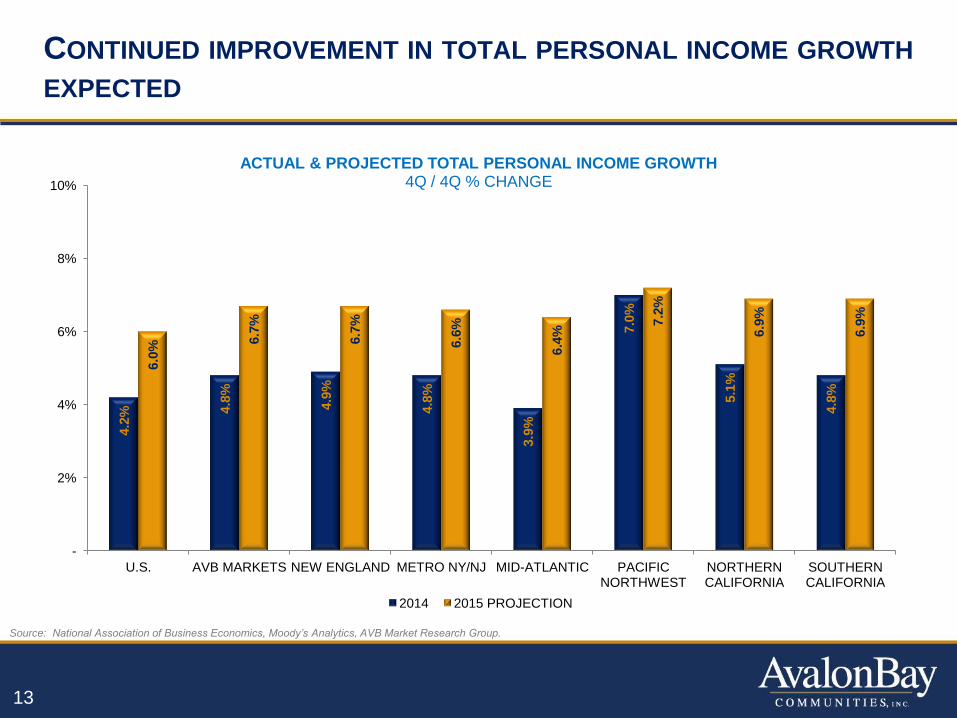
4.2
%
4.8
%
4.9
%
4.8
%
3.9
%
7.0
%
5.1
%
4.8
%
6.0
% 6.7
%
6.7
%
6.6
%
6.4
% 7.2
%
6.9
%
6.9
%
-
2%
4%
6%
8%
10%
U.S. AVB MARKETS NEW ENGLAND METRO NY/NJ MID-ATLANTIC PACIFIC NORTHWEST
NORTHERN CALIFORNIA
SOUTHERN CALIFORNIA
ACTUAL & PROJECTED TOTAL PERSONAL INCOME GROWTH 4Q / 4Q % CHANGE
2014 2015 PROJECTION
CONTINUED IMPROVEMENT IN TOTAL PERSONAL INCOME GROWTH
EXPECTED
13
Source: National Association of Business Economics, Moody’s Analytics, AVB Market Research Group.
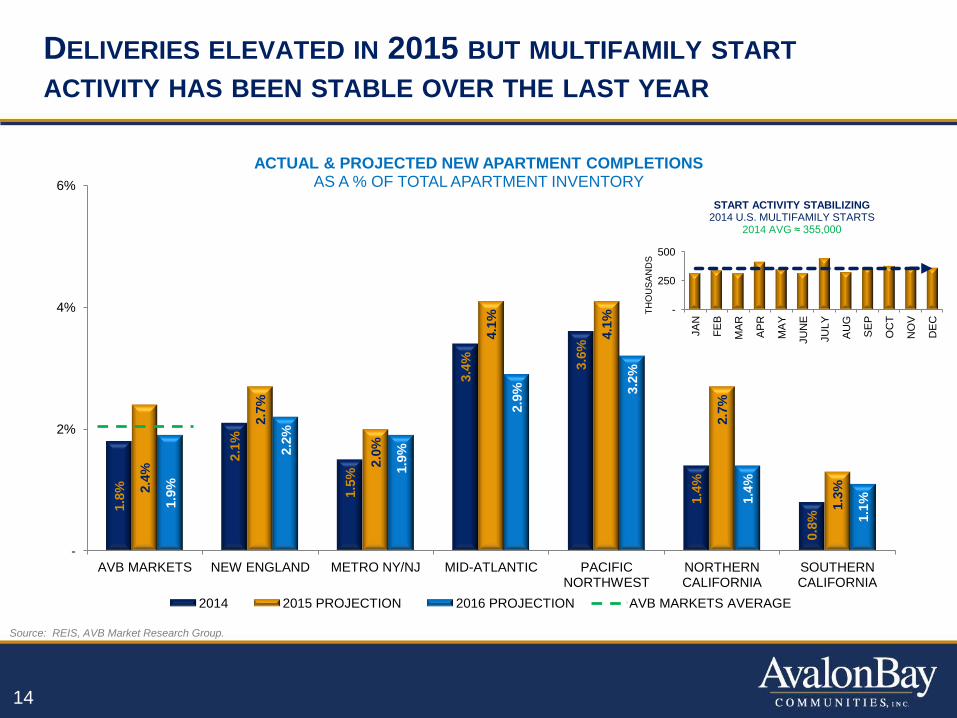
1.8
%
2.1
%
1.5
%
3.4
%
3.6
%
1.4
%
0.8
%
2.4
%
2.7
%
2.0
%
4.1
%
4.1
%
2.7
%
1.3
%
1.9
%
2.2
%
1.9
%
2.9
%
3.2
%
1.4
%
1.1
%
-
2%
4%
6%
AVB MARKETS NEW ENGLAND METRO NY/NJ MID-ATLANTIC PACIFIC NORTHWEST
NORTHERN CALIFORNIA
SOUTHERN CALIFORNIA
ACTUAL & PROJECTED NEW APARTMENT COMPLETIONS AS A % OF TOTAL APARTMENT INVENTORY
2014 2015 PROJECTION 2016 PROJECTION AVB MARKETS AVERAGE
DELIVERIES ELEVATED IN 2015 BUT MULTIFAMILY START
ACTIVITY HAS BEEN STABLE OVER THE LAST YEAR
14
Source: REIS, AVB Market Research Group.
-
250
500
JA
N
FE
B
MA
R
AP
R
MA
Y
JU
NE
JU
LY
AU
G
SE
P
OC
T
NO
V
DE
C T
HO
US
AN
DS
START ACTIVITY STABILIZING 2014 U.S. MULTIFAMILY STARTS
2014 AVG ≈ 355,000
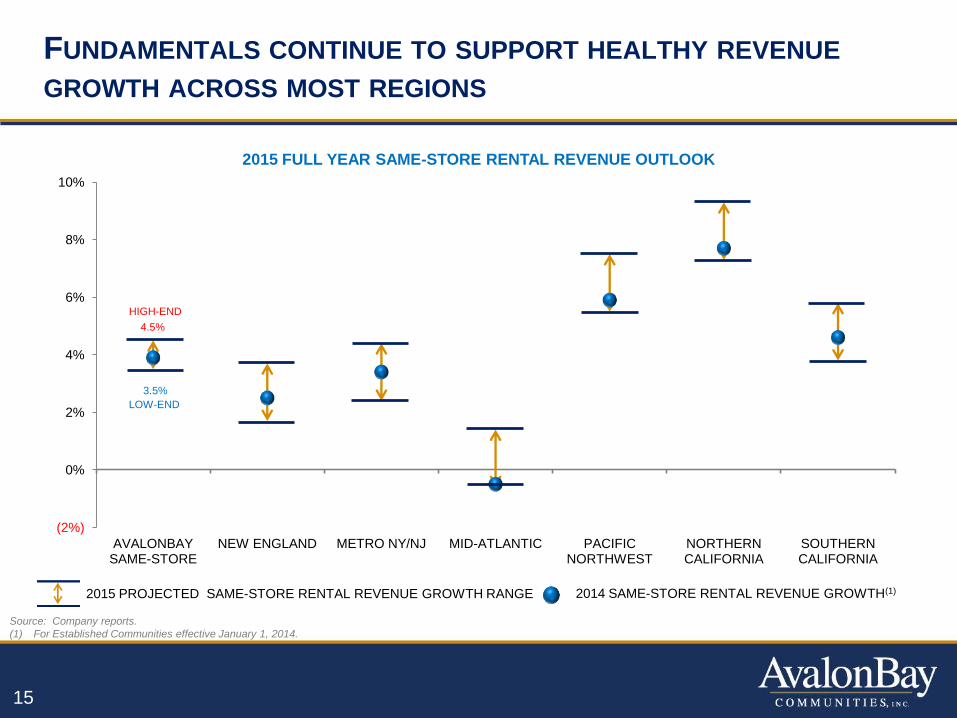
FUNDAMENTALS CONTINUE TO SUPPORT HEALTHY REVENUE
GROWTH ACROSS MOST REGIONS
15
Source: Company reports.
(1) For Established Communities effective January 1, 2014.
4.5%
3.5%
(2%)
0%
2%
4%
6%
8%
10%
AVALONBAY SAME-STORE
NEW ENGLAND METRO NY/NJ MID-ATLANTIC PACIFIC NORTHWEST
NORTHERN CALIFORNIA
SOUTHERN CALIFORNIA
2015 FULL YEAR SAME-STORE RENTAL REVENUE OUTLOOK
HIGH-END
LOW-END
2014 SAME-STORE RENTAL REVENUE GROWTH(1) 2015 PROJECTED SAME-STORE RENTAL REVENUE GROWTH RANGE
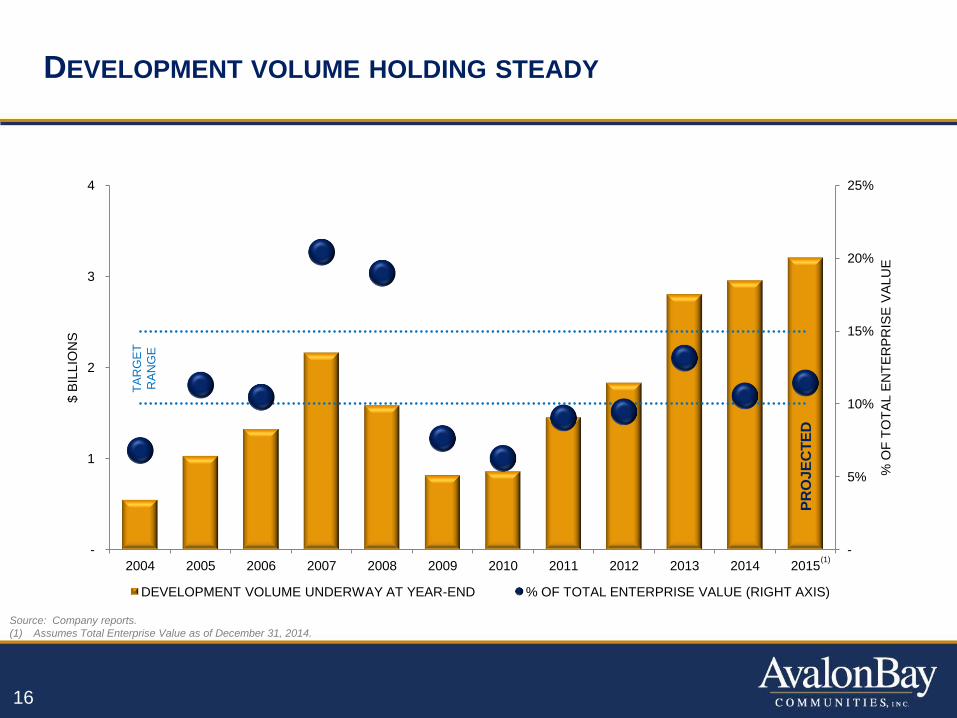
DEVELOPMENT VOLUME HOLDING STEADY
-
5%
10%
15%
20%
25%
-
1
2
3
4
2004 2005 2006 2007 2008 2009 2010 2011 2012 2013 2014 2015
% O
F T
OT
AL E
NT
ER
PR
ISE
VA
LU
E
$ B
ILLIO
NS
DEVELOPMENT VOLUME UNDERWAY AT YEAR-END % OF TOTAL ENTERPRISE VALUE (RIGHT AXIS)
PR
OJ
EC
TE
D
TA
RG
ET
RA
NG
E
Source: Company reports.
(1) Assumes Total Enterprise Value as of December 31, 2014.
16
(1)
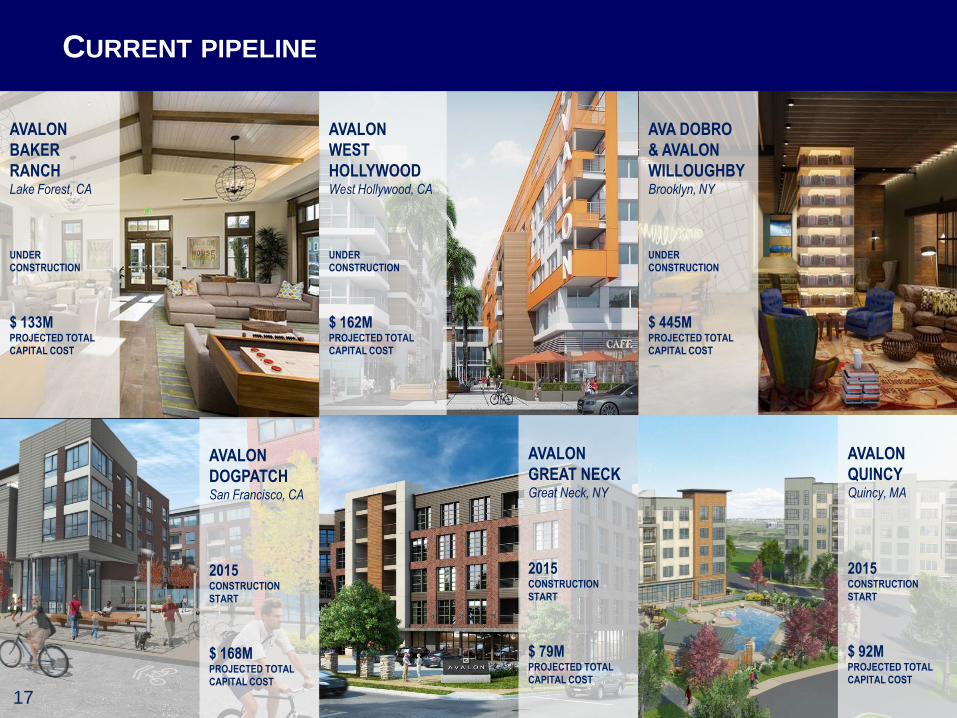
AVALON
BAKER
RANCH Lake Forest, CA
UNDER
CONSTRUCTION
$ 133M PROJECTED TOTAL
CAPITAL COST
AVA DOBRO
& AVALON
WILLOUGHBY Brooklyn, NY
UNDER
CONSTRUCTION
$ 445M PROJECTED TOTAL
CAPITAL COST
AVALON
WEST
HOLLYWOOD West Hollywood, CA
UNDER
CONSTRUCTION
$ 162M PROJECTED TOTAL
CAPITAL COST
AVALON
QUINCY Quincy, MA
2015 CONSTRUCTION
START
$ 92M PROJECTED TOTAL
CAPITAL COST
AVALON
DOGPATCH San Francisco, CA
2015 CONSTRUCTION
START
$ 168M PROJECTED TOTAL
CAPITAL COST
AVALON
GREAT NECK Great Neck, NY
2015 CONSTRUCTION
START
$ 79M PROJECTED TOTAL
CAPITAL COST
CURRENT PIPELINE
17
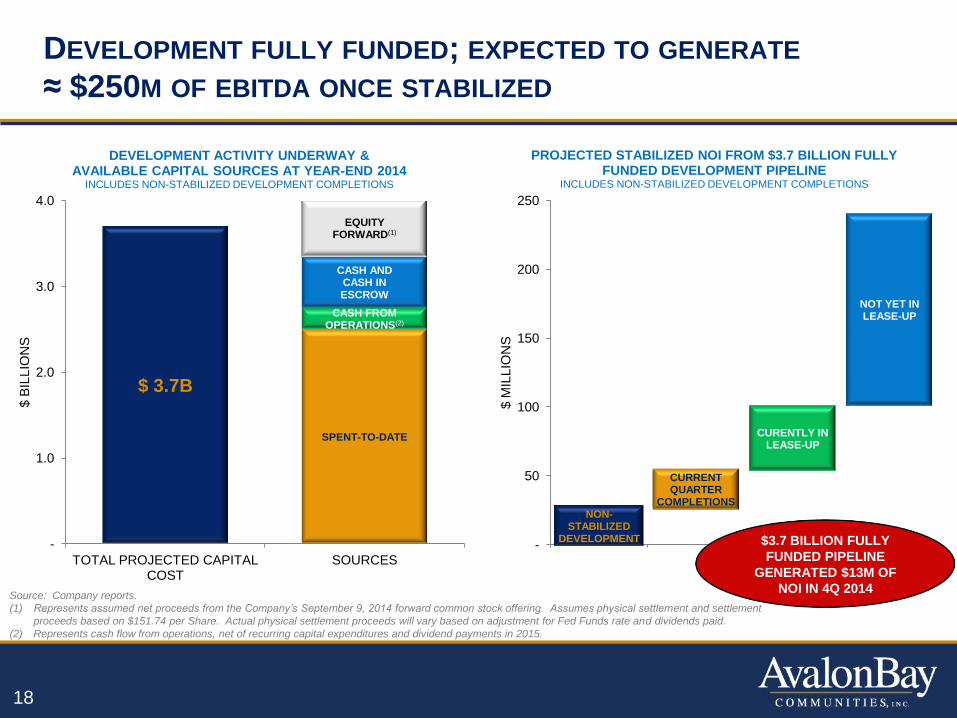
DEVELOPMENT FULLY FUNDED; EXPECTED TO GENERATE
≈ $250M OF EBITDA ONCE STABILIZED
$ 3.7B
SPENT-TO-DATE
CASH FROM OPERATIONS(2)
CASH AND CASH IN ESCROW
EQUITY FORWARD(1)
-
1.0
2.0
3.0
4.0
TOTAL PROJECTED CAPITAL COST
SOURCES
$ B
ILLIO
NS
DEVELOPMENT ACTIVITY UNDERWAY & AVAILABLE CAPITAL SOURCES AT YEAR-END 2014
INCLUDES NON-STABILIZED DEVELOPMENT COMPLETIONS
18
NON-STABILIZED
DEVELOPMENT
CURRENT QUARTER
COMPLETIONS
CURENTLY IN LEASE-UP
NOT YET IN LEASE-UP
-
50
100
150
200
250
$ M
ILLIO
NS
PROJECTED STABILIZED NOI FROM $3.7 BILLION FULLY FUNDED DEVELOPMENT PIPELINE
INCLUDES NON-STABILIZED DEVELOPMENT COMPLETIONS
Source: Company reports.
(1) Represents assumed net proceeds from the Company’s September 9, 2014 forward common stock offering. Assumes physical settlement and settlement
proceeds based on $151.74 per Share. Actual physical settlement proceeds will vary based on adjustment for Fed Funds rate and dividends paid.
(2) Represents cash flow from operations, net of recurring capital expenditures and dividend payments in 2015.
$3.7 BILLION FULLY
FUNDED PIPELINE
GENERATED $13M OF
NOI IN 4Q 2014
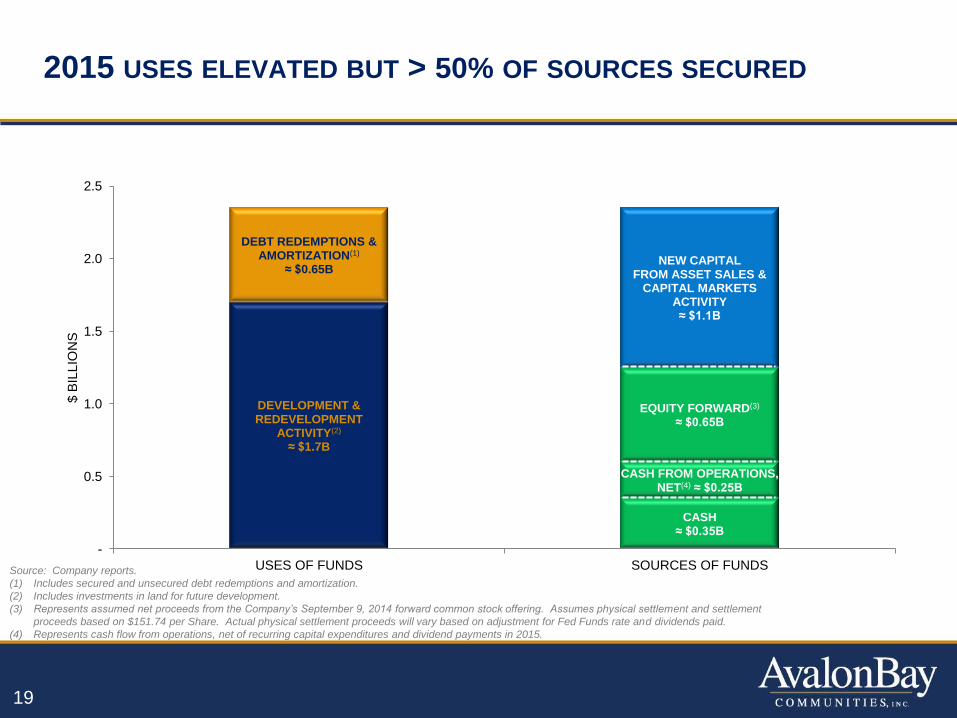
2015 USES ELEVATED BUT > 50% OF SOURCES SECURED
CASH ≈ $0.35B
CASH FROM OPERATIONS, NET(4) ≈ $0.25B
EQUITY FORWARD(3)
≈ $0.65B
NEW CAPITAL FROM ASSET SALES &
CAPITAL MARKETS ACTIVITY ≈ $1.1B
DEVELOPMENT & REDEVELOPMENT
ACTIVITY(2) ≈ $1.7B
DEBT REDEMPTIONS & AMORTIZATION(1)
≈ $0.65B
-
0.5
1.0
1.5
2.0
2.5
USES OF FUNDS SOURCES OF FUNDS
$ B
ILLIO
NS
Source: Company reports.
(1) Includes secured and unsecured debt redemptions and amortization.
(2) Includes investments in land for future development.
(3) Represents assumed net proceeds from the Company’s September 9, 2014 forward common stock offering. Assumes physical settlement and settlement
proceeds based on $151.74 per Share. Actual physical settlement proceeds will vary based on adjustment for Fed Funds rate and dividends paid.
(4) Represents cash flow from operations, net of recurring capital expenditures and dividend payments in 2015.
19
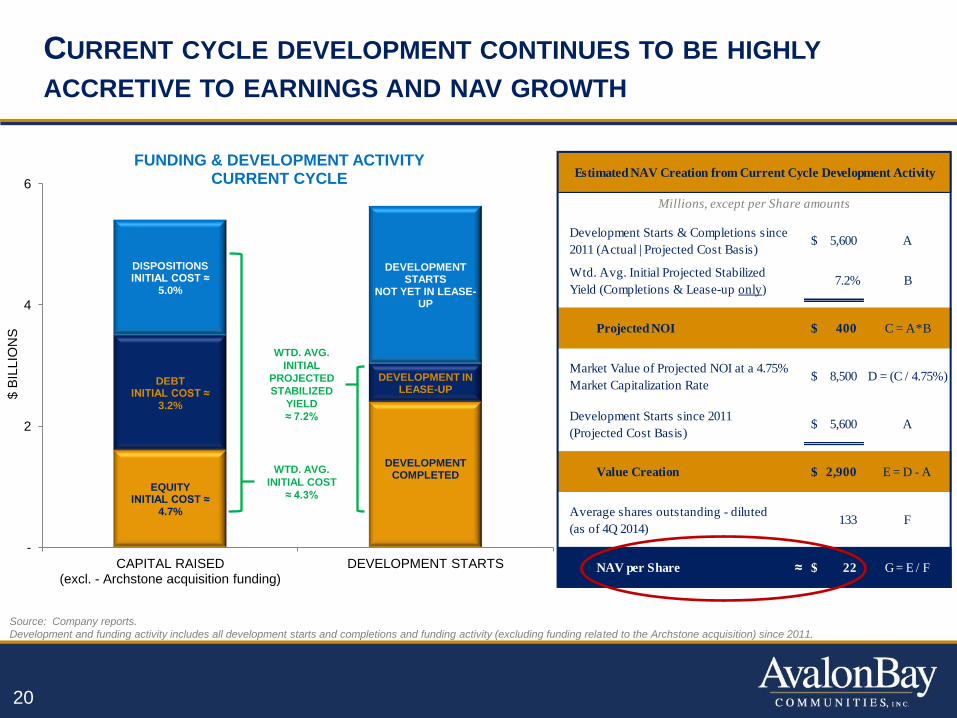
Estimated NAV Creation from Current Cycle Development Activity
Millions, except per Share amounts
Development Starts & Completions since
2011 (Actual | Projected Cost Basis)5,600$ A
Wtd. Avg. Initial Projected Stabilized
Yield (Completions & Lease-up only)7.2% B
Projected NOI 400$ C = A*B
Market Value of Projected NOI at a 4.75%
Market Capitalization Rate8,500$ D = (C / 4.75%)
Development Starts since 2011
(Projected Cost Basis)5,600$ A
Value Creation 2,900$ E = D - A
Average shares outstanding - diluted
(as of 4Q 2014)133 F
NAV per Share ≈ 22$ G = E / F
CURRENT CYCLE DEVELOPMENT CONTINUES TO BE HIGHLY
ACCRETIVE TO EARNINGS AND NAV GROWTH
EQUITY INITIAL COST ≈
4.7%
DEBT INITIAL COST ≈
3.2%
DISPOSITIONS INITIAL COST ≈
5.0%
DEVELOPMENT COMPLETED
DEVELOPMENT IN LEASE-UP
DEVELOPMENT STARTS
NOT YET IN LEASE-UP
-
2
4
6
CAPITAL RAISED (excl. - Archstone acquisition funding)
DEVELOPMENT STARTS
$ B
ILLIO
NS
FUNDING & DEVELOPMENT ACTIVITY CURRENT CYCLE
Source: Company reports.
Development and funding activity includes all development starts and completions and funding activity (excluding funding related to the Archstone acquisition) since 2011.
20
WTD. AVG.
INITIAL COST
≈ 4.3%
WTD. AVG.
INITIAL
PROJECTED
STABILIZED
YIELD
≈ 7.2%
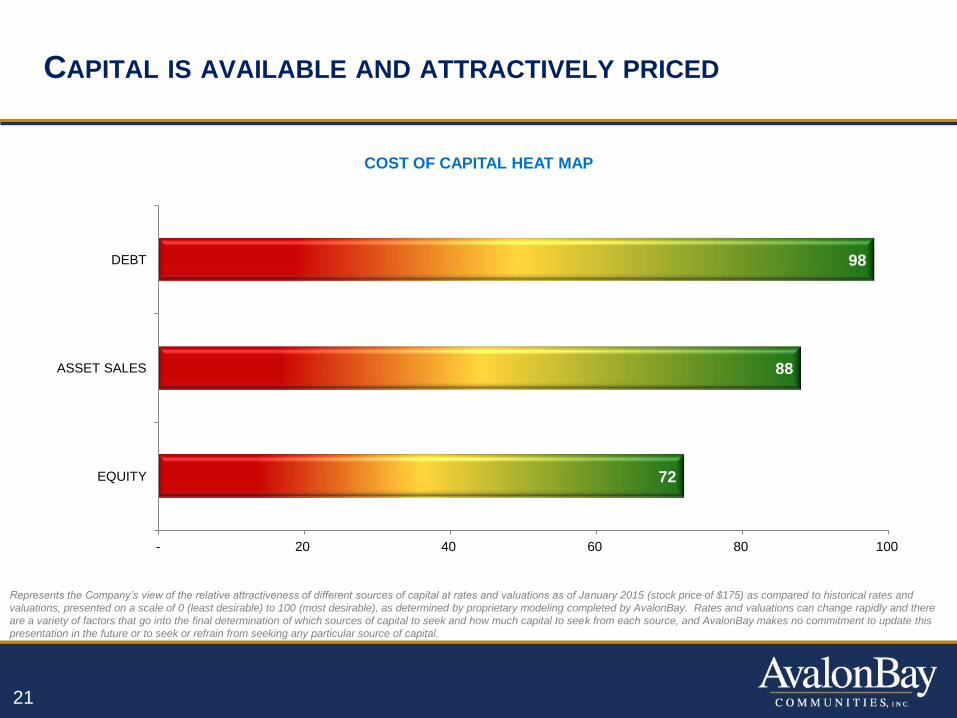
CAPITAL IS AVAILABLE AND ATTRACTIVELY PRICED
Represents the Company’s view of the relative attractiveness of different sources of capital at rates and valuations as of January 2015 (stock price of $175) as compared to historical rates and
valuations, presented on a scale of 0 (least desirable) to 100 (most desirable), as determined by proprietary modeling completed by AvalonBay. Rates and valuations can change rapidly and there
are a variety of factors that go into the final determination of which sources of capital to seek and how much capital to seek from each source, and AvalonBay makes no commitment to update this
presentation in the future or to seek or refrain from seeking any particular source of capital.
72
88
98
- 20 40 60 80 100
EQUITY
ASSET SALES
DEBT
COST OF CAPITAL HEAT MAP
21
22
FORWARD-LOOKING STATEMENTS
This presentation and the related Management Letter dated January 29, 2015 contain
forward-looking statements, which are indicated by the use of words such as “expects,”
“projects,” “forecast,” “outlook,” “estimate” and other words that do not relate to historical
matters. Actual results may differ materially. For information concerning risks and other
factors that could cause such differences, see “Forward Looking Statements” in AvalonBay’s
earnings release dated January 28, 2015. For definitions and additional information
concerning certain defined terms and non-GAAP financial information included in this
presentation, see Attachment 20 to the earnings release.
This presentation and the related Management Letter are provided in connection with
AvalonBay’s fourth quarter 2014 earnings conference call on January 29, 2015. This
presentation and the Management Letter are intended to accompany the earnings release,
and should be read in conjunction with the earnings release. AvalonBay does not intend to
update any of these documents, which speak only as of their respective dates.
The earnings release is available on AvalonBay’s website at www.avalonbay.com
23
ADDITIONAL DEFINITIONS & RECONCILIATIONS OF NON-GAAP
FINANCIAL MEASURES AND OTHER TERMS
Total Enterprise Value represents the aggregate of the market value of the
Company’s common stock, the market value of the Company’s operating partnership
units outstanding (based on the market value of the Company’s common stock) and
the outstanding principal balance of the Company’s debt. Total Enterprise Value is
subject to change depending on market prices, which may be volatile.
24
Recommended