DEPARTMENT OF CIVIL AND ENVIRONMENTAL ENGINEERING, UNIVERSITY
OF AUCKLAND
Investigation of the
Variability in the Results
of the NZ Vibrating
Hammer Compaction Test
Amin Wasfy Shahin
Supervisor
Dr Doug Wilson
A thesis submitted in partial fulfilment of the requirements for the degree of Master of
Engineering, The University of Auckland, 2010.


iii
Dedicated to my parents Huda Abu Neama and Wasfy Shahin


v
ABSTRACT
The New Zealand vibrating hammer compaction test procedure has been proven to
provide inconsistent results. As supported by the Opus investigation, repeatability and
reproducibility values of the New Zealand Standard for the vibrating hammer compaction
test method are higher than those values found in standards both in America and the
United Kingdom.
The research examined the variability in the vibrating hammer compaction test results.
Two approaches were implemented to achieve a sound and scientific understanding of the
variability associated with the test results. Firstly, repeated testing of the vibrating
hammer compaction test was conducted under constant conditions to determine the
natural variability of the test. Secondly, X-ray diffraction tests were conducted to verify
the homogeneity of the source aggregate being used for testing.
Results have confirmed that the variability is significantly large considering the tests have
been conducted under constant test conditions. Under these conditions, factors that could
possibly affect the reliability of the test results have been kept the same throughout
testing. The natural variability in the source aggregate explains approximately 30% of the
observed variation in the Opus Interlaboratory study. As evident in the results, the amount
of compactive effort applied to the sample during compaction determines the degree of
Dry Density achieved.
X-ray diffraction results have shown that there are some differences within the aggregate
in terms of physical properties and mineral constituents. However, it is unknown to what
extent, if any, these differences contributed to the variation in the vibrating hammer
compaction test results.
Future research is recommended in areas such as the amount of contribution that
segregation and degradation has on the variation of the results. Additional testing should
be done on aggregates passing the 19 mm sieve to observe whether oversized particles
have the effect of interlocking and interfering with compaction.

vii
ACKNOWLEDGEMENTS
A significant amount of people and organisations have contributed their valuable time
and experience to help through research issues faced and compliance of the thesis.
I would like to deeply thank my supervisor Douglas Wilson, for not only the skilled and
experienced advice he has given me throughout the progression of this research, but also
for the motivation and support I have received during those times where it seemed
hopeless. The time he dedicated for my research provided a feeling of significance which
pushed me to work hard and keep it as a priority. I would also like to thank my co-
supervisor Asaad Shamseldin for his exceptional statistical support and advice he has
given me throughout the analysis phase of the data.
Jayden Ellis from Stevensons Ltd requires special thanks for his continued support and
great advice regarding any problems faced during the testing phase of the research. His
immense knowledge and experience in laboratory testing has guided me through
challenging situations during testing. Testing would not have been possible if it weren‟t
for the generosity and hospitality of Jayden Ellis and the Stevensons Laboratory staff.
I would also like to thank Philippa Black from the geology department at the University
of Auckland for putting up with my amateur geological knowledge and helping me
immensely throughout the geological aspect of the testing phase. Thanks to Sujith
Padiyara and Noel Perinpanayagam from the University of Auckland for allowing me to
borrow test hall equipment to allow for testing.
Many thanks to Adam Griffith from Hiway Stabilizers for allowing me on a field
compaction site visit and taking me through the basic steps of field compaction.
Thanks to Vincent Drnevich, Adam Prochaska and Aaron Evans from the University of
Purdue in the United States of America for offering great feedback and advice regarding
the data obtained from the research.


ix
TABLE OF CONTENTS
Abstract .............................................................................................................................. iii
Acknowledgements ............................................................................................................ vii
Table of Contents ................................................................................................................ ix
List of Figures .................................................................................................................. xiii
List of Tables ..................................................................................................................... xv
Abbreviations and Acronyms .......................................................................................... xvii
Chapter 1. Introduction .................................................................................................... 1
1.1 Research Motivation ............................................................................................. 1
1.2 Research Objectives .............................................................................................. 2
1.3 Research Methodology Overview ......................................................................... 2
1.4 Organisation of the Thesis ..................................................................................... 3
Chapter 2. Compaction of Pavement Materials ............................................................... 5
2.1 Pavement Structure ............................................................................................... 5
2.1.1 Introduction .................................................................................................... 5
2.1.2 Flexible Pavements ........................................................................................ 5
2.1.3 Rigid Pavements ............................................................................................ 8
2.2 Compaction Process .............................................................................................. 8
2.2.1 Importance of Compaction .......................................................................... 10
2.3 Compaction Curve............................................................................................... 11
2.3.1 Introduction .................................................................................................. 11
2.3.2 Water Content – Dry Density Relationship ................................................. 11
2.3.3 Compaction Suitability ................................................................................ 15
2.4 Laboratory Compaction ....................................................................................... 15
2.4.1 Impact Compaction ...................................................................................... 16
2.4.2 Static Compaction ........................................................................................ 18
2.4.3 Kneading Compaction ................................................................................. 18
2.4.4 Vibratory Compaction ................................................................................. 19
2.4.5 Gyratory Compaction ................................................................................... 20
2.5 Field Compaction ................................................................................................ 21
2.6 Compaction of Unbound Pavement Layers in NZ .............................................. 23

x
2.6.1 Introduction .................................................................................................. 23
2.6.2 Compaction Criteria ..................................................................................... 23
2.7 Summary ............................................................................................................. 25
Chapter 3. New Zealand Basecourse Aggregates .......................................................... 27
3.1 Introduction ......................................................................................................... 27
3.2 Aggregate Property Tests .................................................................................... 28
3.2.1 TNZ Basecourse Specifications ................................................................... 28
3.2.2 Source and Production Properties ................................................................ 28
3.2.3 Source Property Tests .................................................................................. 31
3.2.4 Production Properties ................................................................................... 32
3.2.5 Concerns about the Property Tests in New Zealand .................................... 33
3.3 Aggregate Mineral Composition Testing ............................................................ 34
3.4 The effect of grading on performance of basecourse aggregate ......................... 35
3.5 Summary ............................................................................................................. 37
Chapter 4. Variation in Vibrating Hammer Compaction Tests ..................................... 39
4.1 Introduction ......................................................................................................... 39
4.2 Possible Causes of Variation ............................................................................... 40
4.2.1 General sources of variability in a laboratory-based test ............................. 40
4.2.2 Sources of variability specific to vibrating hammer test ............................. 42
4.3 Ruggedness Test .................................................................................................. 45
4.3.1 Introduction .................................................................................................. 45
4.3.2 Concept of the Ruggedness test ................................................................... 45
4.3.3 Suitability to vibrating hammer test ............................................................. 46
4.4 Inter-laboratory (Round Robin) Study ................................................................ 46
4.4.1 Introduction .................................................................................................. 46
4.4.2 Discussion of Results ................................................................................... 47
4.4.3 Conclusions Drawn From the Study ............................................................ 53
4.5 Summary ............................................................................................................. 53
Chapter 5. Review of Methodologies ............................................................................ 55
5.1 Introduction ......................................................................................................... 55
5.2 Scope ................................................................................................................... 56
5.3 Apparatus ............................................................................................................ 58
5.4 Sample Preparation ............................................................................................. 58
5.5 Procedure ............................................................................................................. 59

xi
5.6 Summary ............................................................................................................. 61
Chapter 6. Adopted Research Methodology.................................................................. 63
6.1 Introduction ......................................................................................................... 63
6.2 Research Tasks .................................................................................................... 63
6.3 Quality Control .................................................................................................... 65
6.4 Vibrating Hammer Compaction Test Methodology ............................................ 65
6.4.1 Introduction .................................................................................................. 65
6.4.2 Scope ............................................................................................................ 66
6.4.3 Apparatus ..................................................................................................... 66
6.4.4 Procedure ..................................................................................................... 70
6.5 X-ray Diffraction Test Methodology .................................................................. 72
6.5.1 Sample Preparation ...................................................................................... 72
6.5.2 Experiment Set-up ....................................................................................... 75
Chapter 7. Test Results and Discussion......................................................................... 77
7.1 Aggregate Property Test Results ......................................................................... 77
7.1.1 Source Property Tests .................................................................................. 77
7.1.2 Production Property Tests ............................................................................ 79
7.2 Vibrating hammer compaction test results .......................................................... 82
7.2.1 Data Selection .............................................................................................. 82
7.2.2 Overall Variation – Scatter / Box and Whisker Plot .................................... 83
7.2.3 Comparison of Dry Density at 6% Water Content – Opus and UoA .......... 89
7.2.4 Numerical Comparison of data .................................................................... 91
7.2.5 Sample Size needed to Achieve Target Confidence Interval ....................... 94
7.2.6 Scatter of Opus Data with Respect to UoA 95% Confidence Interval ........ 95
7.2.7 Effect of Different Compactive Efforts on Compaction .............................. 96
7.3 X-ray Diffraction Test Results ............................................................................ 99
7.3.1 Bulk Sample Results .................................................................................... 99
7.3.2 Oriented Sample Results ............................................................................ 100
7.4 Power Output Test ............................................................................................. 101
7.4.1 Introduction ................................................................................................ 101
7.4.2 Experiment Set-up ..................................................................................... 102
7.4.3 Problems with the test ................................................................................ 102
Chapter 8. Conclusions and Recommendations .......................................................... 105
8.1 Conclusions ....................................................................................................... 105

xii
8.2 Summary of Conclusions .................................................................................. 108
8.3 Recommendations and Future Research ........................................................... 109
References ........................................................................................................................ 111

xiii
LIST OF FIGURES
Figure 2-1: Cross-section of Flexible Pavement (Papagiannakis & Masad, 2008) ............. 6
Figure 2-2: Cross-section of Rigid Pavement (Papagiannakis & Masad, 2008) ................. 8
Figure 2-3: Soil Structure Before and After Compaction (Carson, 2004) ........................... 9
Figure 2-4: Different Forms of Compaction Curves (BS EN 13286 - 4, 2003) ................ 12
Figure 2-5: Typical Compaction Curve for Cohesive Material (Drnevich et al., 2007) .... 13
Figure 2-6: Typical Compaction Curve for Granular Material (Drnevich et al., 2007) .... 14
Figure 2-7: Methods of Vibratory Compaction ................................................................. 19
Figure 2-8: Effect of Compaction Effort on the Compaction Curve – Laboratory and Field
(Ping et al., 2003) ............................................................................................................... 22
Figure 2-9: Effect of Compaction Effort on the Compaction Curve - Different Hammers
(Ping et al., 2003) ............................................................................................................... 22
Figure 2-10: Field Compaction Rollers ............................................................................. 23
Figure 2-11: Nuclear Density Meter .................................................................................. 24
Figure 3-1: Quality Control Flow Chart for Basecourse Aggregate (Transit New Zealand,
2006b) ................................................................................................................................ 30
Figure 3-2: Effect of Talbot‟s Grading Exponent n on Rutting Performance for Material 1
and 7 (Arnold et al., 2007) ................................................................................................. 36
Figure 4-1: Dry Density Variation with Retained Water Content (Opus International
Consultants Limited, 2008) ................................................................................................ 50
Figure 4-2: Variation GAP40 Dry Density with Vibration Hammer Power (Opus
International Consultants Limited, 2008) .......................................................................... 51
Figure 5-1: Sequence of 152 mm Tamper Positions in 279.4 mm Mould (ASTM D 7382 -
08, 2008) ............................................................................................................................ 60
Figure 6-1: Compaction Mould used for Testing .............................................................. 67
Figure 6-2: Vibrating Hammers used in Testing ............................................................... 69
Figure 6-3 Flow Chart Showing the Main Steps of the Adopted Procedure ..................... 70
xiv
Figure 6-4: Different Rock Types used in X-ray Diffraction Test .................................... 73
Figure 6-5 Professor Philippa Black Conducting an XRD Analysis on the Source
Aggregate ........................................................................................................................... 75
Figure 7-1: Weathering Quality Results ............................................................................ 78
Figure 7-2: Source Aggregate Particle Size Distribution .................................................. 81
Figure 7-3: Contribution (by Percentage) of each Group of 10 Tests to the Total Variation
............................................................................................................................................ 82
Figure 7-4: Variation of Vibration Hammer Compaction Test ......................................... 85
Figure 7-5: Natural Variability in Dry Density at each Water Content ............................. 86
Figure 7-6: Effect of the Gap between the Tamper and the Mould on the Loss of Water
and/or Material ................................................................................................................... 87
Figure 7-7 Cross -section of Mould and Tamper Apparatus used in BS 5835 (BS 5835,
1980) .................................................................................................................................. 88
Figure 7-8: Comparison of Dry Density at 6% WC - Opus vs. UoA ................................ 90
Figure 7-9: Number of Samples needed to be Tested to Achieve a Desired Precision ..... 94
Figure 7-10: Scatter plot of Opus 6% WC with Regards to 95% Confidence Interval of
UoA 6% WC ...................................................................................................................... 95
Figure 7-11: Effects of Different Compactive Efforts on Compaction ............................. 98
Figure 7-12: Output of X-ray Diffraction Bulk Sample B ................................................. 99
Figure 7-13: Output of X-ray Diffraction Bulk Sample C ................................................. 99
Figure 7-14: Output of X-ray Diffraction Oriented Sample A – Glycolated ................... 100
Figure 7-15: Output of X-ray Diffraction Oriented Sample A - Untreated ..................... 101
Figure 7-16: Power Output Experiment Set-up ............................................................... 102
xv
LIST OF TABLES
Table 2-1: Comparison of the Standard and Modified Proctor Compaction Test Methods –
Reproduced from (Brandl, 2001) ....................................................................................... 17
Table 2-2: Mean and Minimum Value of Pavement Layer Compaction as Percentage of
Maximum Dry Density – Reproduced from (Transit New Zealand, 2005b) ..................... 24
Table 3-1: Minimum Sampling Rate for 'Production' Property Tests – Reproduced from
(Transit New Zealand, 2006b) ........................................................................................... 32
Table 4-1: Potential Factors Affecting Variability in Vibrating Hammer Compaction Test
Results ................................................................................................................................ 40
Table 4-2: Variability Parameters of the Dry Density – Reproduced from (Opus
International Consultants Limited, 2008) .......................................................................... 48
Table 4-3: Comparison of the Repeatability and Reproducibility Values ......................... 49
Table 4-4: Predicted Increases in Dry Density When Changing from an 1140 W Vibrating
Hammer to a 1700 W Vibrating Hammer – Reproduced from (Opus International
Consultants Limited, 2008) ................................................................................................ 51
Table 5-1: Apparatus Properties for Different Standards .................................................. 58
Table 6-1: Properties of the Vibrating Hammers used in Testing ..................................... 68
Table 7-1: California Bearing Ratio Results ...................................................................... 79
Table 7-2: Broken Face Content Results ........................................................................... 80
Table 7-3: Shape Control of Source Aggregate ................................................................. 81
Table 7-4: Statistical Parameters of Dry Density at each Water Content .......................... 93


xvii
ABBREVIATIONS AND ACRONYMS
AADT Annual Average Daily Traffic
AM Asphalt Mix
ASTM American Society for testing and materials
BSI British Standard Institution
CBR California Bearing Ratio
CETANZ Civil Engineering Testing Association of New Zealand
CI Clay Index
CoV Coefficient of Variation
CS Chip Seal
DD Dry Density
ESA Equivalent Standard Axles
MDD Maximum Dry Density
NZ New Zealand
NZS New Zealand Standard
NZTA New Zealand Transport Agency
OWC Optimum Water Content
PI Plasticity Index
PSD Particle Size Distribution
SE Sand Equivalent
TNZ Transit New Zealand
UK United Kingdom
UoA University of Auckland
USA United States of America
WC Water Content
XRD X-ray Diffraction
ZAV Zero Air Voids


Chapter 1. INTRODUCTION
1.1 Research Motivation
Vibratory hammer compaction is a relatively new approach in aggregate laboratory
testing. Originally, the test had been developed specifically for the compaction of
granular aggregates. The reason for the development of this test was that the Standard
Proctor compaction method was deemed an ineffective approach to compacting materials
of a granular nature. The issue with the Standard Proctor test method was that the
granular material would often break down and displace when struck by the impact
rammer (Farrar, 2000; Felt, 1968). However, the method which was adopted by the New
Zealand Standards authority (NZS) for the vibrating hammer compaction test was also
deemed inadequate due to its inconsistent nature. Consequently, Opus Ltd conducted an
inter-laboratory investigation to identify the degree of variability in the vibrating hammer
compaction test results where the study found repeatability and reproducibility values of
the New Zealand vibrating hammer test method to be significantly higher than those
specified in the British and American Standards. Therefore, it is evident by the
repeatability and reproducibility values in the Opus investigation that the New Zealand
test produces inconsistent results and therefore may need revision and/or minor
alterations (New Zealand Standards, 1986b; Opus International Consultants Limited,
2008). The variation and unreliability in the results of the test is not only apparent in New
Zealand (NZ) but also by countries abroad (British Standards Institution, 1980; Opus
International Consultants Limited, 2008)
The purpose of laboratory compaction is to determine the Maximum Dry Density (MDD)
and corresponding Optimum Water Content (OWC) so that these values could be targeted
in field compaction. However, previous research has shown that the laboratory vibrating
hammer compaction test adopted in NZ produces unreliable and significantly variable
results. Therefore, research is essential to identify the reasons for the variability and
where possible to better control those variables.
This research, kindly funded by the New Zealand Transport Authority (NZTA) through a
Roading New Zealand project, will undertake laboratory testing facilitated by Stevensons

Chapter 1.Introduction
2
Ltd. It will consider one source aggregate material (Greywacke) to determine the
minimum statistical variation associated with the test method adopted in NZ.
1.2 Research Objectives
The primary objective of this research was to determine a sound and scientific
understanding of the variability in the results of the NZ Vibrating Hammer Compaction
Test (New Zealand Standards, 1986b) through rigorous testing and provide conclusions
and recommendations based on the results obtained. Essentially, there are two factors
which can influence the vibrating hammer compaction test results. The first factor is the
natural variability in the properties and mineral constituents of the aggregate, where
samples taken from the same aggregate source tested under the same test conditions can
yield different results. The second factor being the test conditions of the experiment (such
as hammer type and age, mould size and technician experience) (Wilson & Shamseldin,
2010). The research focuses on identifying the natural variability in the test procedure.
Thus, although aggregate quality control and natural aggregate variability will be briefly
tested, a large portion of the research will be focused on conducting the vibrating hammer
compaction test to note its variability.
1.3 Research Methodology Overview
The research methodology was split into three main phases.
Phase 1 Review of Literature – A comprehensive review of appropriate literature
available.
Phase 2 Testing – The testing phase was further split into three stages, namely:
Quality Control Testing – Strength and durability tests were carried
out on the source aggregate to ensure a certain level of quality was
maintained.
Vibrating Hammer Compaction Testing – This is the main stage of
the testing phase. Conducting the vibrating hammer test a sufficient
amount of times to obtain viable data to provide statistical analysis
on the results.
Investigation of the Variability in the Results of the NZ Vibrating Hammer Compaction Test
3
X-ray Diffraction testing – Perform X-ray Diffraction tests to
determine any variability in the properties and mineral composition
of the source aggregate.
Phase 3 Results Analysis and Conclusions – Evaluation and analysis of results
obtained from the testing phase to provide conclusions and
recommendations.
1.4 Organisation of the Thesis
The structure of the thesis follows from a literature review of existing studies through to
testing, analysis and presentation of results obtained. This Section provides an overview
of the subsequent chapters of the thesis.
Chapter 2 provides an introduction to the theory of compaction. The chapter begins by
defining the pavement structure followed by an outline of the compaction process
including the importance of compaction. The compaction curve is then described, where
the two variables which make up the curve, the Water Content and Dry Density, are
explained. The types of laboratory compaction used today are then reviewed. Field
compaction is then briefly outlined. Specifications relating to the compaction of unbound
pavement layers in New Zealand are then discussed, followed by a summary of the
chapter.
Chapter 3 describes the typical aggregates used in New Zealand for the basecourse layer
in pavement construction. A brief history of the types of aggregates sourced for
basecourse is initially introduced in the chapter. Aggregate quality control tests are then
described followed by a review of the X-ray Diffraction analysis used for identifying the
variability in the properties and mineral constituents of the source aggregate. The effect of
an aggregates‟ grading on its performance is then discussed, followed by a summary of
the chapter.
Chapter 4 reviews and describes the possible factors which could contribute to the
variation of the vibrating hammer compaction test results. It also describes the ruggedness
test, which is used in identifying factors which have a major effect on the variation of a
test experiment. A case study which is relevant to this research is then discussed. The
chapter is then summarised.

Chapter 1.Introduction
4
Chapter 5 provides a review of the various vibrating hammer compaction test standard
methodologies available, including those from the United States of America (USA) and
United Kingdom (UK) test standards. In this chapter, the New Zealand Standard for the
vibrating hammer compaction test method is compared to international standards which
have adopted a slightly different approach to using the vibrating hammer for compaction
testing. Evaluation of each section of the standard is conducted to find any major
differences between these standards.
Chapter 6 describes the research methodology that has been adopted to successfully and
efficiently perform the research. The research tasks are first identified, followed by a
detailed description of the methodology of each of the three different types of tests
performed.
Chapter 7 presents and discusses the results obtained from the various tests conducted in
the research. It begins by a brief introduction to the chapter, followed by discussion of the
quality control test results obtained for the source aggregate. Chapter 7 then discusses the
statistically analysed results of the vibrating hammer compaction tests. And finally the
results of the X-ray diffraction tests are discussed.
Chapter 8 provides the conclusions drawn from the research and the recommendations for
important issues within the vibrating hammer compaction topic which require further
research.
Chapter 2. COMPACTION OF PAVEMENT
MATERIALS
2.1 Pavement Structure
2.1.1 Introduction
Pavements are primarily designed to provide a stiff surface that serves a specific
transportation need. The surface stresses by the tyre pressure on the pavement must be
transferred to the subgrade (underlying materials beneath the pavement) with the least
amount of unrecoverable deformation strain. The function of a pavement is thus to reduce
and distribute the surface stresses to an acceptable level at the subgrade. This basic
function must be conducted under different seasonal and environmental conditions and
without permanent deformation or cracking. The initiation of any of these distress
conditions would reduce the functionality of the pavement (Huang, 1993; Thom, 2008).
The key mechanism used in the transfer and reduction of loads in a pavement is the use of
layers of decreasing strength from top to bottom. The different layers distribute the load,
thus, decreasing its intensity with depth, and resulting in subgrade stresses being much
less than stresses on the surface. These lower stresses at the subgrade ensure it does not
undergo excessive deformations (Papagiannakis & Masad, 2008).
There are two basic pavement types but with a number of variations to each type. The two
types used in the roading industry are flexible and rigid pavements. Theoretically, flexible
pavements transfer uniform stresses throughout the layers but deflections are non
uniform. Conversely for a rigid pavement, the transferred stresses are not uniform but the
deflections are uniform. In practice, the stress and deflection distributions throughout the
flexible and rigid pavements depend on the relative stiffness of the top layers to the
underlying granular layers (Huang, 1993; Thom, 2008).
2.1.2 Flexible Pavements
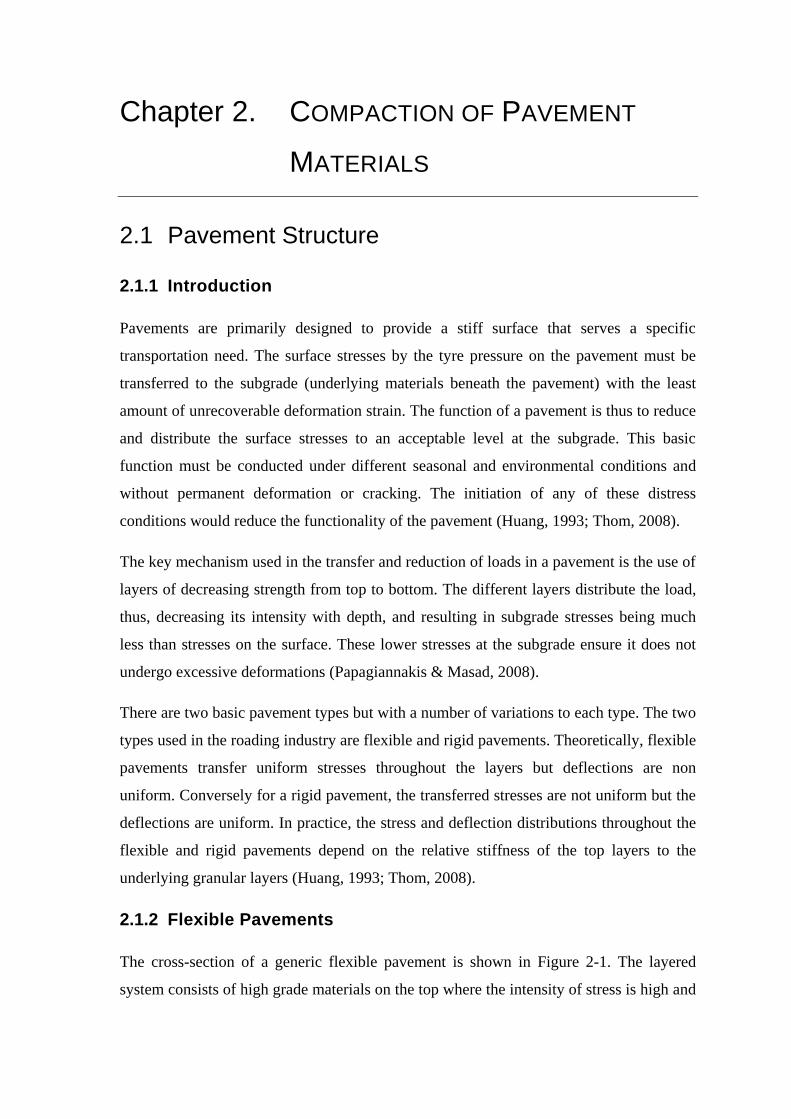
The cross-section of a generic flexible pavement is shown in Figure 2-1. The layered
system consists of high grade materials on the top where the intensity of stress is high and
Chapter 2.Compaction of Pavement Materials
6
inferior materials at the bottom where the stress intensity is low. Starting from the top, the
pavement consists of a wearing surface, basecourse, subbase and subgrade (Thom, 2008).
Figure 2-1: Cross-section of Flexible Pavement (Papagiannakis & Masad, 2008)
The wearing surface is the top course of a flexible pavement, sometimes called the
surface course. Within NZ, the wearing surface is usually made from an Asphalt mix
(AM) layer or Chipseal (CS). The CS surface is better known as the „surface dressing‟ in
many parts of the world such as the United Kingdom. It is considered the dominant
surfacing type in NZ and comprises of a uniformly sized stone chips embedded onto a 1
to 2mm layer of sprayed bitumen (Transit New Zealand et al., 2005). The wearing surface
must be tough to resist distortion under traffic and provide a smooth and skid-resistant
riding surface. It must also be impermeable to protect the entire pavement and subgrade
from the weakening effect of water (Thom, 2008).
The basecourse layer sits directly below the surface layer, as shown in Figure 2-1, and
helps provide additional load distribution where the imposed load on the surface course is
spread over a bigger area of the road base. Because it lies directly below the wearing
surface layer, it experiences the second highest intensity of stresses. The depth of the
basecourse layer largely depends on the California Bearing Ratio (CBR), a measure of the
bearing strength, of the layers below it (Subbase and subgrade layers). It also depends on
the traffic characteristics of the road being built such as the Annual Average Daily Traffic
(AADT) and Equivalent Standard Axles (ESA). The basecourse layers are usually
constructed in NZ from unbound aggregates. As will be discussed in Section 2.2.1,
unbound aggregates are essentially free-bound particles with no cohesion. Due to this
fact, compaction becomes a key role in achieving the desired strength of the basecourse
Wearing Surface
Basecourse
Subbase
Subgrade

Investigation of the Variability in the Results of the NZ Vibrating Hammer Compaction Test
7
layer as it compresses the free-bound particles tightly together and provides confinement
as shown in Figure 2-3. In New Zealand, typical basecourse aggregates require a 95%
minimum relative compaction to achieve the desired strength. Thus, aggregates used for
the basecourse layer must be compacted effectively to prolong the pavement‟s design life
and to avoid pavement damage such as rutting (Henning, 2008a; Hoffman, 2008; Transit
New Zealand, 2005b).
The basecourse layer also serves to contribute to frost resistance and shrinkage and
swelling control. If water reaches the subgrade, it may cause it to shrink or swell; the
basecourse layer serves as a surcharge load imposed on top of the subgrade reducing the
amount of swelling or shrinkage taking place. The basecourse layer also contributes to
drainage. As water enters the pavement structure through cracks and joints, an open-
graded basecourse layer can carry this water away to the road side (Huang, 1993).
The subbase is the layer of material beneath the basecourse and usually consists of larger
sized crushed aggregate. This material has better engineering properties, such as modulus
of elasticity, than the subgrade layer thus resulting in a higher bearing capacity; however,
it is lower in quality than the basecourse layer above it. It is important to note that the use
of two layers, basecourse and subbase, consisting of aggregates is for economic reasons.
The basecourse is the stiffer layer because it uses higher quality aggregates and because
the stress intensity decreases further down the layers, lower quality aggregates can be
used thus forming the subbase (Papagiannakis & Masad, 2008; Thom, 2008).
The final layer in the pavement is the subgrade and can consist of the local in-situ soil or
compacted fill imported from different locations. If the in-situ soil is used, the top layer of
soil is usually scarified, sometimes undercut and the replaced fill is then compacted to the
desired density and Optimum Water Content (OWC) (Huang, 1993; Thom, 2008).
The thickness of each layer varies with the type of axle loading, available materials and
expected pavement design life. The expected design life is the number of years the
pavement is expected to provide an adequate service with the expected ESA before it
requires asset intervention and a major rehabilitation is required.

Chapter 2.Compaction of Pavement Materials
8
2.1.3 Rigid Pavements
In contrast to flexible pavements, rigid pavements can be placed either directly on the
prepared subgrade or on a single layer of granular or stabilised material. Figure 2-2 shows
a cross-section of a generic rigid pavement structure. As is the case with flexible
pavements, the subgrade is often scarified, blended and compacted to the desired density.
Above this layer is the basecourse which has the same function and is from the same
material as the basecourse layer in the flexible pavement. The top layer is constructed
from either unreinforced or reinforced concrete and acts as an impervious layer that
reduces water ingress. It also provides a skid-resistant smooth surface on which vehicles
can operate. The disadvantage of using concrete is that it cracks under thermal stresses.
To counter the effect of shrinkage, transverse contraction joints are built into the
pavement. Load transfer devices, such as dowel bars, are placed in the joints to minimise
deflections and reduce stresses near the edges of the slabs (Papagiannakis & Masad,
2008).
Figure 2-2: Cross-section of Rigid Pavement (Papagiannakis & Masad, 2008)
2.2 Compaction Process
The compaction process (also known as densification) is defined as the removal of air
voids from the material by application of mechanical energy with zero or minimal change
in the water content. Compaction should not be confused with soil consolidation, which is
void reduction in saturated soils over a length of time due to the expulsion of water.
Compaction modifies and enhances the engineering properties of the material. Compacted
materials display higher strength, lower permeability and lower compressibility (Drnevich
Basecourse
Subgrade
Concrete

Investigation of the Variability in the Results of the NZ Vibrating Hammer Compaction Test
9
et al., 2007). Carson (2004) defines compaction as “the method of mechanically
increasing the density of soil”. Carson (2004) best explains this by the use of a diagram as
shown in Figure 2-3.
Figure 2-3: Soil Structure Before and After Compaction (Carson, 2004)
The expulsion of air during the compaction process causes both the density and unit
weight of the material to increase. Although similar, these two parameters are different
and are commonly confused between each other. Density is the amount of mass per unit
volume and is expressed as kg/m³ (kilograms per meter cubed) using the symbol ρ. On
the other hand, unit weight refers to the measure of weight per unit volume and is
expressed as kN/m³ (kilo Newtons per meter cubed) using the symbol γ (Drnevich et al.,
2007).
The degree of compaction is expressed in terms of the dry density ( ). The reason for
expressing the degree of compaction by the dry density and not the bulk density (ρ) is that
the bulk density contains water, and water offers no strength. Hence, the performance of a
compacted material can be best expressed as the amount of dry soil solids per unit of
volume (Drnevich et al., 2007). The formula used to calculate the dry Density is as
follows:
( )⁄ (2-1)
where:
= Dry Density of Soil (t/m³)
= Bulk Density of Soil (t/m³)
= Water Content expressed as a decimal number

Chapter 2.Compaction of Pavement Materials
10
However, it is important to note that Dry Density (DD) is not a direct measure of material
properties, that is, different material with the same or similar DD will not exhibit the
same or similar engineering properties (Drnevich et al., 2007).
2.2.1 Importance of Compaction
Compaction is an imperative process during the pavement construction phase to ensuring
the desired performance levels from the pavement are achieved (Christopher et al., 2006).
Budhu (2000) mentions that compaction is one of the most popular techniques of
aggregate property improvement. Some of these improvements include:
The increase in shear strength of the aggregate.
The decrease in compressibility; reducing the potential of excessive long term
settlement of fills and soils.
The reduction in permeability; restraining flow of water through the compacted
basecourse layer.
The general decrease in void ratio; this helps prevent water from being withheld
by the basecourse layer, thus maintaining strength and stiffness properties
Achieving a state of increased unit weight.
These aggregate property enhancements are vital to prolonging the life of the pavement.
To achieve an optimum degree of compaction, Maximum Dry Density (MDD) must be
reached. The MDD largely depends on the Water Content (WC) of the aggregate. Thus,
preliminary laboratory compaction tests are conducted on the sample to obtain the MDD
value and corresponding Optimum Water Content (OWC) value. Subsequent to obtaining
these values from laboratory testing, optimum field compaction can be targeted according
to these values.
In addition, New Zealand pavements are fatigue structures that are predominantly (>90%)
unbound granular aggregates. These types of aggregates and pavements rely heavily upon
reaching design compaction levels to be able to withstand an adequate design life of
repeated traffic cycles. Thus, achieving the desired compaction levels is immensely
important to getting the expected design life out of the total pavement structure (Black,
2009; Henning, 2008a).
Investigation of the Variability in the Results of the NZ Vibrating Hammer Compaction Test
11
Unbound aggregates are a skeleton of particles with principally no cohesion to keep these
particles stuck together. Thus, there must be a significantly high degree of confinement of
these particles to achieve the desired stiffness of the unbound granular layer. Confinement
of these particles is provided by the horizontal stresses that arise as a result of compaction
and subsequent traffic loading (New Zealand Institute of Highway Technology, 2000).
Contractors are required to determine the laboratory Maximum Dry Density (MDD) and
the Optimum Water Content (OWC) by using the Vibrating Hammer Compaction method
specified in the NZS 4402: Test 4.1.3. This test will set the target dry density that the
contractor must achieve when compaction occurs on the field (Frobel & Moulding, 2006;
Transit New Zealand, 2005b).
2.3 Compaction Curve
2.3.1 Introduction
The Water Content (WC) at which a material is compacted defines the degree of
compaction achieved. The WC is usually expressed in percentage and is defined as the
ratio of the mass of the water to the mass of the solids in an aggregate.
Defined as the mass per unit volume, Dry Density (DD) is considered an important
property of engineering stabilisation. The symbol used to denote Dry Density is and is
expressed in terms of kg/m³ (or t/m³). The degree of density is defined by how loosely or
closely the particles are packed.
2.3.2 Water Content – Dry Density Relationship
Subsequent to obtaining laboratory compaction results, the OWC at which the MDD
occurs is determined from the graph of plotted results. Theoretically, the results obtained
from the laboratory vibrating hammer compaction test produces a bell-shaped curve. The
peak of the curve is defined as the Maximum Dry Density (MDD), the WC at which this
MDD occurs is better known as the Optimum Water Content (OWC).
The Dry Density and Water Content relationship varies depending on the type of material
being compacted. According to the British Standard of the vibrating hammer compaction
test “BS EN 13286 – part 4 Test methods for laboratory reference density and water
content – Vibrating hammer” aggregate compaction curves can take three different forms

Chapter 2.Compaction of Pavement Materials
12
as shown in Figure 2-4. The first two forms are discussed in the next two Sections to
come where the convex downwards curve appears when cohesive material is compacted,
the convex upwards curve shown in Figure 2-4 occurs when cohesionless material is
compacted. Because this research is testing a cohesionless unbound granular aggregate,
more focus will be given to the curve produced by cohesionless material. The flat curve,
where the material dry density is independent and insensitive to the water content, is rare
and does not occur often and hence will not be discussed (BS EN 13286 - 4, 2003).
Figure 2-4: Different Forms of Compaction Curves (BS EN 13286 - 4, 2003)
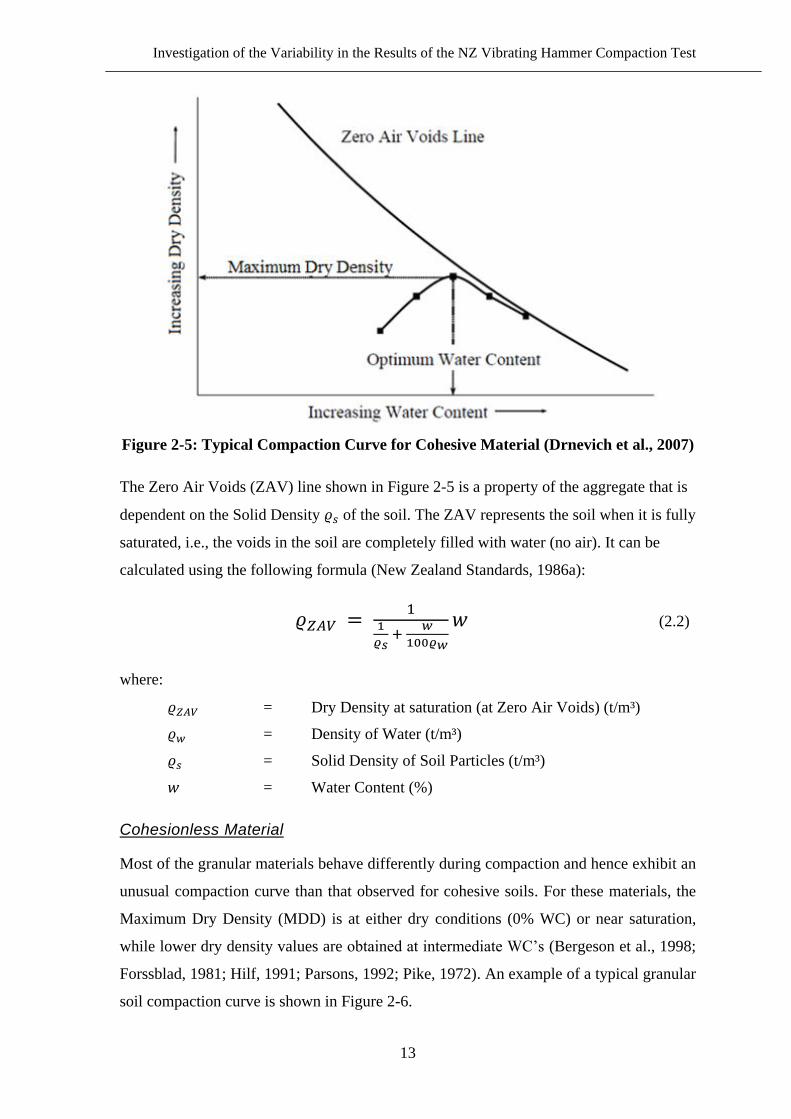
Cohesive Material
An optimal degree of compaction will only be reached when the Optimum Water Content
(OWC) has been achieved. This is because compactive forces are resisted by the friction
between the material‟s particles. The water available in the voids helps reduce this
friction. For every aggregate type there exists an Optimum Water Content and a
Maximum Dry Density as illustrated in Figure 2-5. It however, must be noted that the
curve shown below is a typical curve based on a compacted cohesive material. As will be
discussed in the next Section, cohesionless graded materials exhibit a slightly different
curve.
From Figure 2-5, it can be seen that water contents less than the OWC provide an
increase in dry density if the water content is increased, this is where the increase in water
acts as a lubricant and helps reduce friction between particles. However, at water contents
above the OWC, the increase in water prevents the expulsion of air and/or water and
hence a decrease in dry density is observed (Drnevich et al., 2007).
Investigation of the Variability in the Results of the NZ Vibrating Hammer Compaction Test
13
Figure 2-5: Typical Compaction Curve for Cohesive Material (Drnevich et al., 2007)
The Zero Air Voids (ZAV) line shown in Figure 2-5 is a property of the aggregate that is
dependent on the Solid Density of the soil. The ZAV represents the soil when it is fully
saturated, i.e., the voids in the soil are completely filled with water (no air). It can be
calculated using the following formula (New Zealand Standards, 1986a):
(2.2)
where:
= Dry Density at saturation (at Zero Air Voids) (t/m³)
= Density of Water (t/m³)
= Solid Density of Soil Particles (t/m³)
= Water Content (%)
Cohesionless Material
Most of the granular materials behave differently during compaction and hence exhibit an
unusual compaction curve than that observed for cohesive soils. For these materials, the
Maximum Dry Density (MDD) is at either dry conditions (0% WC) or near saturation,
while lower dry density values are obtained at intermediate WC‟s (Bergeson et al., 1998;
Forssblad, 1981; Hilf, 1991; Parsons, 1992; Pike, 1972). An example of a typical granular
soil compaction curve is shown in Figure 2-6.

Chapter 2.Compaction of Pavement Materials
14
Forssblad (1981) explains that effective compaction at oven-dry conditions works well
for graded materials with as much as 30% fines. In contrast, Brandl (2001) reported that
even though the Maximum Dry Density may occur at oven-dry conditions, the MDD
should nevertheless be chosen at its other peak where the Optimum Water Content lies
near saturation, he supports his argument by explaining that if the material was to be
compacted at oven-dry conditions it would favour long-term grain rearrangement and
hence differential deformation.
On the other hand, a compacted layer of material where the MDD and corresponding
OWC were achieved on the saturation curve can exhibit „sponge-like‟ behaviour. Hence,
Brandl‟s (2001) report suggests that if the MDD and corresponding OWC lie on the
saturation curve, a slightly lower Water content should be chosen as an OWC to prevent
the „sponge-like‟ behaviour of the layer.
Figure 2-6: Typical Compaction Curve for Granular Material (Drnevich et al., 2007)
The low dry densities that occur in the compaction curve of granular material at
intermediate Water Contents (as seen in Figure 2-6) is explained by a phenomenon
known as bulking (Hilf, 1991); the range of Water Contents at which this phenomenon
occurs are called bulking Water Contents. Capillary stresses which exist under low Water
Contents cause bulking. Tension stresses are formed in partially saturated material where
a curved surface develops at the air-water boundary. The tension stresses (and water

Investigation of the Variability in the Results of the NZ Vibrating Hammer Compaction Test
15
available within the material) help keep the particles in place and resist the compactive
effort applied on the sample (USBR, 1990). Thus, this phenomenon only occurs at
intermediate Water Contents because the tensile stresses do not exist at completely dry
conditions, and begin to reduce as the aggregate starts to saturate; allowing for higher
compactive effort and therefore effective compaction (Bergeson et al., 1998).
Engineering judgement should be exercised when selecting the OWC, to achieve the
appropriate MDD. This is because, as mentioned earlier, sometimes a curve would
indicate that, at completely dry conditions, the OWC and corresponding MDD have been
achieved, however these values should not be chosen due to the fact that a compacted soil
that is too dry favours long term grain rearrangement and hence differential deformation.
Also on the other hand, if the optimum appears to be on the saturation line (ZAV) then
the optimum should be selected a little below this value, because at saturation level the
compacted layer would be rather spongy.
2.3.3 Compaction Suitability
A various number of laboratory compaction tests have been developed to suit the
different aggregate types that exist. These different aggregate types require different
methods of compaction in order to be compacted correctly to an optimum level. This is
because different aggregates behave differently under the application of loads. The main
two material types are cohesionless and cohesive materials. This research deals with the
compaction of cohesionless granular graded materials. Thus, it is important to analyse the
different methods of compaction and determine the advantages and/or disadvantages of
these methods particularly when compacting granular graded materials.
2.4 Laboratory Compaction
This Section discusses the different methods of compaction and discusses the advantages
and/or disadvantages of each technique relative to granular soils. Compaction processes
in a laboratory can be classified under five categories (Luxford, 1975), namely:
Impact Compaction
Static Compaction
Kneading Compaction
Vibratory Compaction, and

Chapter 2.Compaction of Pavement Materials
16
Gyratory Compaction.
2.4.1 Impact Compaction
Developed originally by Proctor in 1933 to aid in earth dam stabilisation (Proctor, 1933),
Impact compaction is one of the most widely used compaction techniques today. The
Proctor test (named after its developer) basically involves dropping a hammer of a known
weight from a set height onto the sample. The test is relatively easy and cheap to perform,
however some disadvantages exist within the test (Luxford, 1975)
Felt (1968) reports that the impact compaction test is not suitable for cohesionless
material containing sands and/or course graded crushed stones or similar material
possessing inherent angular stability. Felt (1968) further explains that the test is
unworkable with cohesionless material due to a number of factors; firstly, because there is
no confinement on the sample, the cohesionless particles easily displace when struck by
the rammer. Second, the impact force is considered small and limited when compacting
cohesionless soils. Third, the mould restraint and friction between the particles oppose the
requirement of the particles packing closer together by moving horizontally.
Furthermore, repetitive ramming degrades the sample. Reports by Hoover, Kumar and
Best (1970), and Dunlap (1966) confirm that impact compaction does not produce
satisfactory results when compacting cohesionless granular materials due to degradation
of the sample. Strikes produced by the impact hammer tend to “break down” the course
granular material otherwise known as degradation (Farrar, 2000; Felt, 1968). Degradation
tends to increase and become more of a problem as the percentage of coarse aggregates is
increased in graded materials (Johnson & Sallberg, 1960).
An article by Sherwood (1970) showed that reproducibility of the impact compaction test
is unsatisfactory for compaction control purposes. However, the degree of reproducibility
was considered acceptable for design purposes. Hence, it could be argued that this is
unacceptable for testing purposes.
In addition, another problem in using the Proctor test on granular materials is that it is
very difficult to get a flat surface of the specimen by levelling the top of the mould for
testing measurements (Strohm et al., 1967).
Investigation of the Variability in the Results of the NZ Vibrating Hammer Compaction Test
17
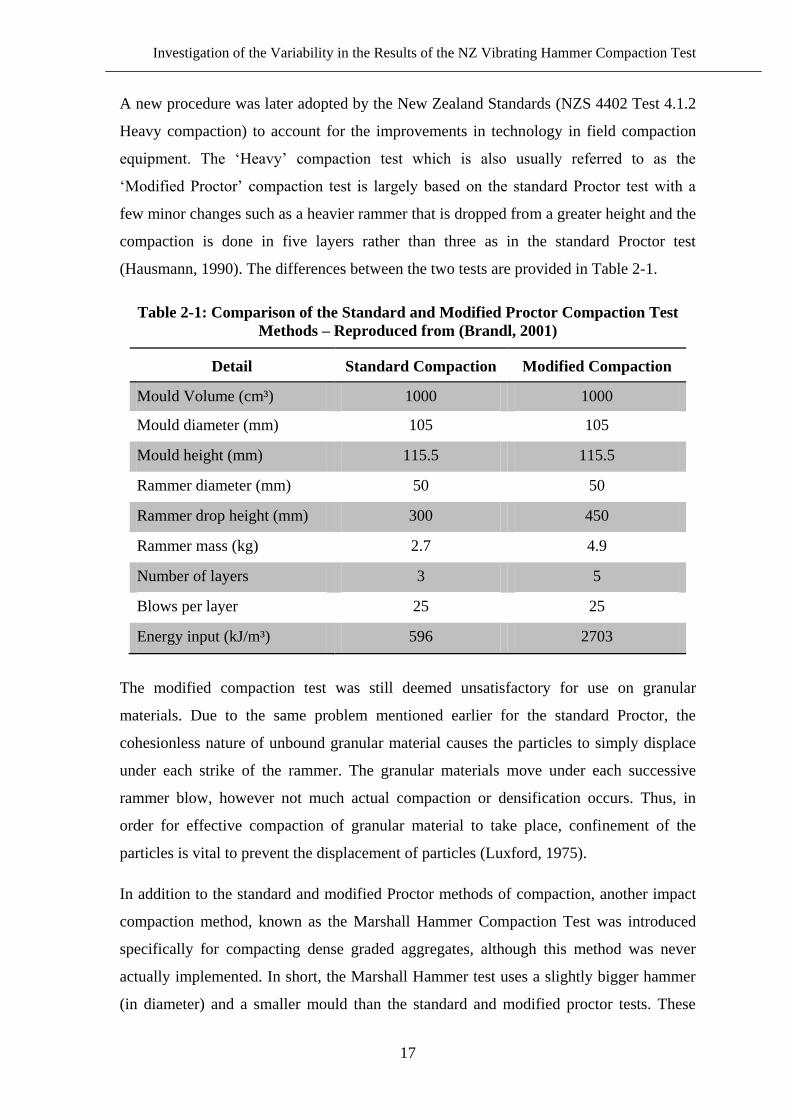
A new procedure was later adopted by the New Zealand Standards (NZS 4402 Test 4.1.2
Heavy compaction) to account for the improvements in technology in field compaction
equipment. The „Heavy‟ compaction test which is also usually referred to as the
„Modified Proctor‟ compaction test is largely based on the standard Proctor test with a
few minor changes such as a heavier rammer that is dropped from a greater height and the
compaction is done in five layers rather than three as in the standard Proctor test
(Hausmann, 1990). The differences between the two tests are provided in Table 2-1.
Table 2-1: Comparison of the Standard and Modified Proctor Compaction Test
Methods – Reproduced from (Brandl, 2001)
Detail Standard Compaction Modified Compaction
Mould Volume (cm³) 1000 1000
Mould diameter (mm) 105 105
Mould height (mm) 115.5 115.5
Rammer diameter (mm) 50 50
Rammer drop height (mm) 300 450
Rammer mass (kg) 2.7 4.9
Number of layers 3 5
Blows per layer 25 25
Energy input (kJ/m³) 596 2703
The modified compaction test was still deemed unsatisfactory for use on granular
materials. Due to the same problem mentioned earlier for the standard Proctor, the
cohesionless nature of unbound granular material causes the particles to simply displace
under each strike of the rammer. The granular materials move under each successive
rammer blow, however not much actual compaction or densification occurs. Thus, in
order for effective compaction of granular material to take place, confinement of the
particles is vital to prevent the displacement of particles (Luxford, 1975).
In addition to the standard and modified Proctor methods of compaction, another impact
compaction method, known as the Marshall Hammer Compaction Test was introduced
specifically for compacting dense graded aggregates, although this method was never
actually implemented. In short, the Marshall Hammer test uses a slightly bigger hammer
(in diameter) and a smaller mould than the standard and modified proctor tests. These

Chapter 2.Compaction of Pavement Materials
18
changes allow for increased confinement for the sample preventing it (to a certain extent)
from displacing freely and actually compacting. This test was found to produce
Maximum Dry Densities of graded aggregates which were much more achievable in the
field than the standard and modified compaction methods (Roberts, 1976).
2.4.2 Static Compaction
Static compaction involves compressing a pre-weighed specimen in a cylindrical mould
by placing it in a compression testing machine. Compression forces are progressively
increased until the Maximum Dry Density is reached (Hausmann, 1990). However,
because of the way the test is done, particle orientation is likely to be different from that
achieved in the field since the field technique of compaction is not simulated in any way
in this test. A report conducted by Johnson and Sallberg (1962) showed a few factors that
influence the test, these include:
In order to prevent segregation graded granular aggregates must be placed
into the mould very carefully.
Long periods of static load application onto the sample results in expulsion of
water producing a Maximum Dry Density at unrealistic water contents.
2.4.3 Kneading Compaction
Inspired by the kneading action produced by the sheepsfoot roller (see Section 2.5) in
field compaction, the kneading compaction laboratory test was developed. Similar to the
sheepsfoot roller in the field, the laboratory compaction efforts on the sample are
gradually built up then gradually released.
The development of an automatic kneading compactor by Dodd and Dunlop (1971)
showed that the kneading compaction method is not suitable for the compaction of
granular materials such as sand; it was observed that surface deformation occurred under
the compactor foot and that compaction results were unsatisfactory. Significantly higher
Dry Density (DD) values were achieved at lower Water Contents (WC) by vibratory
compaction.

Investigation of the Variability in the Results of the NZ Vibrating Hammer Compaction Test
19
2.4.4 Vibratory Compaction
Compaction of granular soils and aggregates is often confounded by the lack of an
appropriate test method. Other methods of compaction such as impact compaction have
been deemed unsuitable to compact these types of soils due to their cohesionless nature.
Thus, new methods such as vibratory compaction have been developed in an attempt to
better compact these types of soils. Since field compaction equipment use vibrations to
compact aggregates effectively, vibratory compaction yields a better correlation between
field and laboratory results. Compaction by vibratory means can be achieved in two ways
as illustrated in Figure 2-7.
a) Vibrating Hammer Compaction
b) Vibrating Table Compaction
Figure 2-7: Methods of Vibratory Compaction
The difference between the two procedures is that the vibrating table method (Figure 2-
7b) places a static surcharge load on top of the sample contained within a mould and
applies continuous vertical vibrations from the bottom. In contrast, the vibrating hammer
method (Figure 2-7a) utilizes a vibrating hammer which is placed on top of the sample
contained within the mould and applies vibratory forces for a specific set time from the
top. The vibrating hammer method is considered better due to the fact that it better
simulates field compaction (Drnevich et al., 2007). Since this research is concerned with
the vibrating hammer compaction test, focus will be given to this method.
Initially designed for heavy duty demolition work, vibrating hammers were later utilised
for soil compaction. Being considered the most suitable for the compaction of granular

Chapter 2.Compaction of Pavement Materials
20
soils, the vibrating hammer compaction method provides the required confinement
granular aggregates need in order for effective compaction. In this method, compaction
occurs by vibration, which means the specimen is compacted thoroughly throughout its
depth (Luxford, 1975).
Since its development, extensive research has been carried out on the vibrating hammer
test not to only ensure its validity, but to also seek its acceptance by international
standards Authorities such as the American Society for Testing and Materials (ASTM),
British Standards Institution (BSI) and New Zealand Standards (NZS).
The first to perform a thorough investigation and research on the use of the vibrating
hammer compaction test was Parsons (1964). Where the focus was on five different
factors affecting the test:
Type of hammer and tamper size used
Magnitude of static load applied
Period of operation of hammer
Size and shape of mould, and
Voltage supplied to hammer.
The results in Parsons‟ (1964) investigation led to the adoption of the vibratory hammer
compaction test by the British Standards Institution “BS EN 13286 – 4:2003 Unbound
and hydraulically bound mixtures – Part 4: Test methods for laboratory reference density
and water content – Vibrating Hammer” (BS EN 13286 - 4, 2003; Luxford, 1975).
ASTM approved the vibrating hammer test in December 2007 as a result of research
conducted by Drnevich, Porchaska and Evans, where a comprehensive investigation was
conducted by them at the University of Purdue in Indiana regarding the vibrating hammer
test and its reliability (IHS, 2010). Thus, the test is slowly being recognised worldwide,
however due to some of its uncertainties (such as its repeatability and reproducibility)
some parts of the world (such as Australia) continue to use the Standard Proctor
compaction method for granular materials.
2.4.5 Gyratory Compaction
Gyratory compaction is the result of research and studies conducted by the U.S Army
corps of Engineers and the Texas Transportation Institute (Ping et al., 2003). The

Investigation of the Variability in the Results of the NZ Vibrating Hammer Compaction Test
21
compaction method has shown great promise for compacting granular base course
aggregates. Because sample preparation is done in one layer, segregation and
stratification are prevented (Luxford, 1975).
There are conflicting reports on the degradation that occurs in gyratory compaction. Some
authors have observed very little or no degradation in the sample whilst others have stated
significant amounts of degradation has been observed (Luxford, 1975).
2.5 Field Compaction
It is important to understand the process and theory behind field compaction in order to
devise a satisfactory laboratory experimental compaction procedure which replicates and
realistically represents actual compaction in the field.
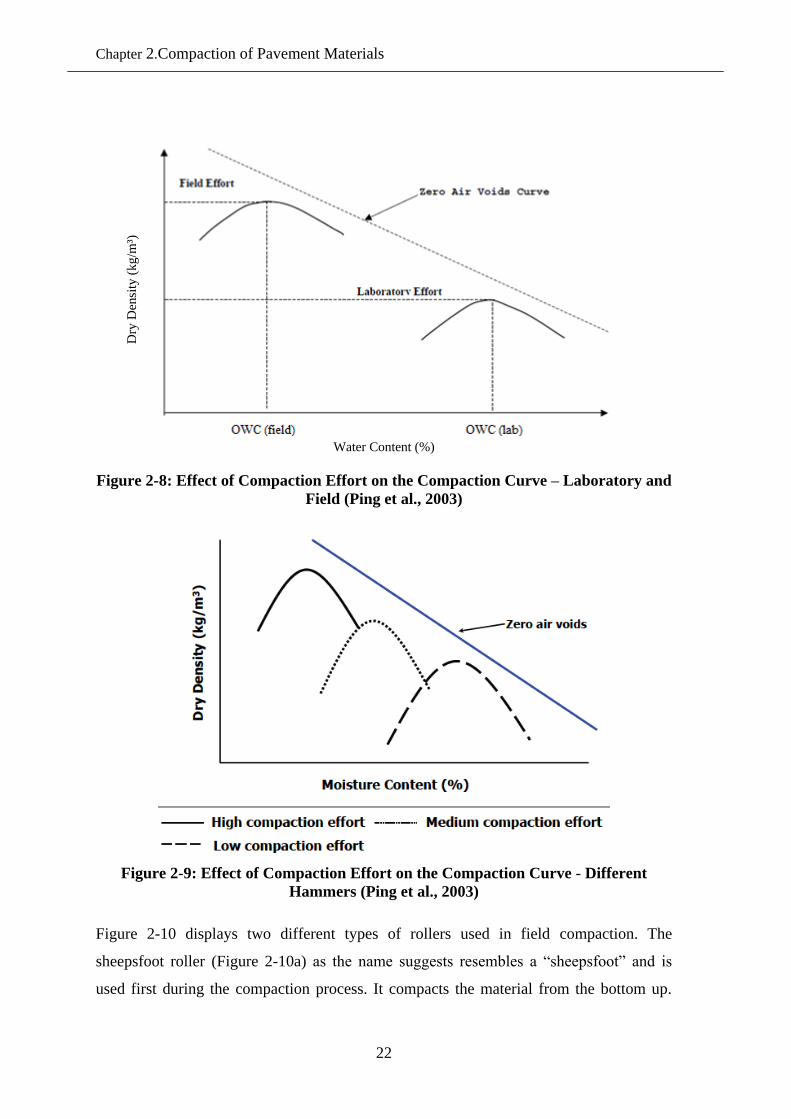
Because of the advancements and improvements in field compaction equipment in more
recent years, the MDD and corresponding OWC can be reached in the field at much lower
values than those obtained in the laboratory (as shown in Figure 2-8). The improved
heavy rollers could achieve MDD at much lower Water Contents than those specified in
the laboratory. However, this could lead to degradation of the material being compacted
and so it is imperative that very heavy compactors are not used in the field. A balanced
relationship between laboratory compaction and field compaction should be established.
As can be seen in Figure 2-9, the compactive effort greatly affects the MDD achieved,
thus, reasonable field equipment that are not too powerful should be specified depending
on the compactive effort used in the laboratory.
The NZ specification for the compaction of unbound pavement layers, which will be
discussed in greater detail in Section 2.6, specifies that the Maximum Dry Density for
field compaction is the higher of the maximum laboratory dry density and the pleatau
density at Optimum Water Content (OWC). This requirement ensures that the maximum
laboratory dry density is the minimum requirement achieved on the field and therefore
prevents the need for the TNZ B/2 specification to specify restrictions on the allowable
weight of compaction rollers to be used on the field (Transit New Zealand, 2005a). The
TNZ B/2 also specifies “A maximum number of tonnes mass per meter of roll width has
been retained to give some guidance on when rollers are likely to significantly change the
gradation of TNZ M/4 basecourse materials” (Transit New Zealand, 2005a)
Chapter 2.Compaction of Pavement Materials
22
Figure 2-8: Effect of Compaction Effort on the Compaction Curve – Laboratory and
Field (Ping et al., 2003)
Figure 2-9: Effect of Compaction Effort on the Compaction Curve - Different
Hammers (Ping et al., 2003)
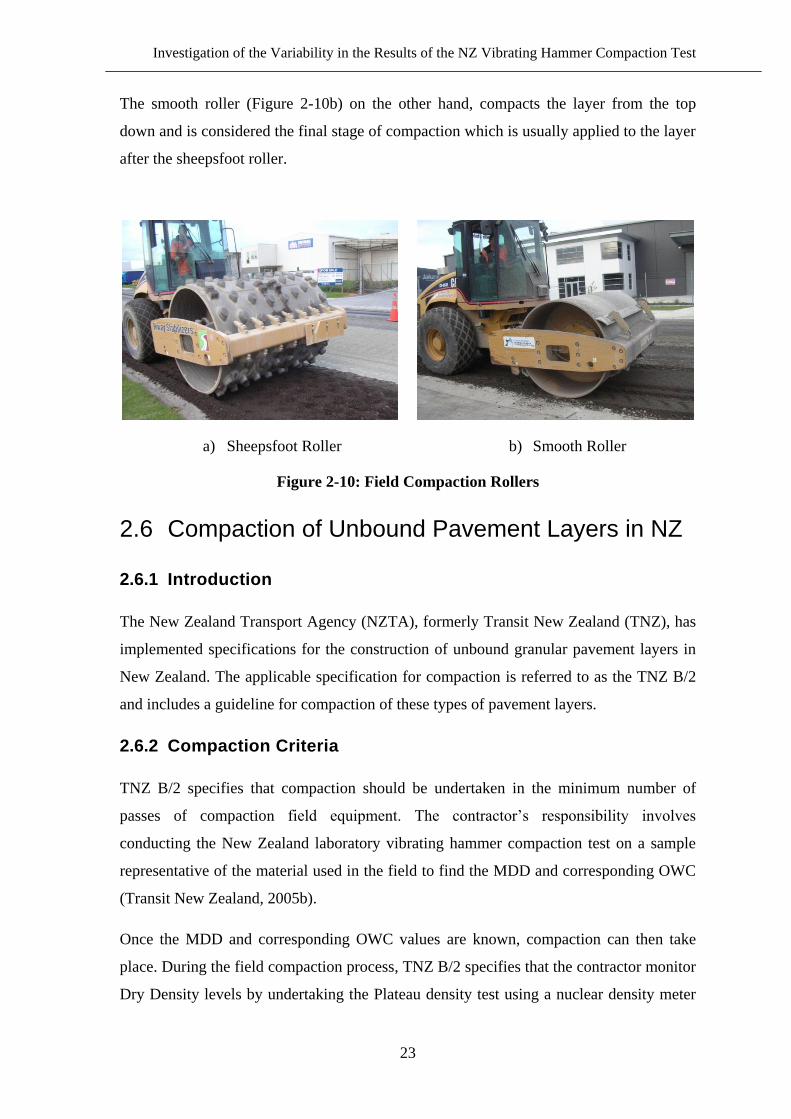
Figure 2-10 displays two different types of rollers used in field compaction. The
sheepsfoot roller (Figure 2-10a) as the name suggests resembles a “sheepsfoot” and is
used first during the compaction process. It compacts the material from the bottom up.
Dry
Den
sity
(k
g/m
³)
Water Content (%)
Investigation of the Variability in the Results of the NZ Vibrating Hammer Compaction Test
23
The smooth roller (Figure 2-10b) on the other hand, compacts the layer from the top
down and is considered the final stage of compaction which is usually applied to the layer
after the sheepsfoot roller.
a) Sheepsfoot Roller
b) Smooth Roller
Figure 2-10: Field Compaction Rollers
2.6 Compaction of Unbound Pavement Layers in NZ
2.6.1 Introduction
The New Zealand Transport Agency (NZTA), formerly Transit New Zealand (TNZ), has
implemented specifications for the construction of unbound granular pavement layers in
New Zealand. The applicable specification for compaction is referred to as the TNZ B/2
and includes a guideline for compaction of these types of pavement layers.
2.6.2 Compaction Criteria
TNZ B/2 specifies that compaction should be undertaken in the minimum number of
passes of compaction field equipment. The contractor‟s responsibility involves
conducting the New Zealand laboratory vibrating hammer compaction test on a sample
representative of the material used in the field to find the MDD and corresponding OWC
(Transit New Zealand, 2005b).
Once the MDD and corresponding OWC values are known, compaction can then take
place. During the field compaction process, TNZ B/2 specifies that the contractor monitor
Dry Density levels by undertaking the Plateau density test using a nuclear density meter

Chapter 2.Compaction of Pavement Materials
24
shown in Figure 2-11. This meter is a sophisticated piece of equipment which measures
the Dry Density at the location it is placed.
Figure 2-11: Nuclear Density Meter
In order to achieve a satisfactory degree of compaction, the TNZ B/2 standard specifies a
requirement which the compacted pavement layer must comply with in order to be
deemed an acceptable level of compaction. These requirements are given in Table 2-2.
Table 2-2: Mean and Minimum Value of Pavement Layer Compaction as
Percentage of Maximum Dry Density – Reproduced from (Transit New Zealand,
2005b)
Parameter Values Basecourse Pavement
Layer, % of MDD
Mean Value ≥98
Minimum Value ≥95
These values given in Table 2-2 are believed to be achievable in the field. However, this
largely depends on the power produced by the field compaction equipment. Thus, it is
vital that the contractor utilises appropriate equipment depending on the nature and size
of the pavement being compacted. The choice is usually dependent on the strength of
aggregate, and layer thickness (Transit New Zealand, 2005a).

Investigation of the Variability in the Results of the NZ Vibrating Hammer Compaction Test
25
2.7 Summary
This chapter discussed the theory of compaction and its vital role in achieving stable
pavement structures with an adequate design life. Pavement structures in New Zealand
are predominantly constructed from unbound granular material. These types of material
rely heavily upon reaching optimum compaction to be able to withstand repeated traffic
loadings. Thus, effective compaction of these types of materials is imperative to
constructing a pavement structure that will meet the expected design life criterion.
Different types of materials behave differently under the application of load due to their
natural characteristics and properties. To effectively compact a particular type of material,
an optimum method should be selected which best suits that type of material. The
vibrating hammer compaction test was deemed the best approach to compacting
cohesionless granular material. Although this research is concerned with the laboratory
vibrating hammer compaction test, field compaction was discussed due to the fact that
grasping an understanding of field compaction is imperative to devising a method in the
laboratory which realistically reflects compaction on the field.
The NZTA has implemented a specification for the construction of unbound granular
layers in pavement structures, which includes a guideline to effective compaction. The
specification includes compaction criteria that must be met to ensure proper compaction
levels have been met. In addition to these requirements, basecourse material used for the
construction of these unbound granular layers must also comply with a set of
requirements specified in the TNZ M/4 specification. The next chapter discusses these
basecourse aggregates in greater detail.


Chapter 3. NEW ZEALAND BASECOURSE
AGGREGATES
3.1 Introduction
Most aggregates in New Zealand are sourced from Greywacke and Volcanic rocks.
Within these two categories falls a range of different rock types, each having a unique
matrix of properties which are defined by the minerals and other constituents contained
(and their arrangement) in these rocks. The roading industry in New Zealand is a major
consumer of aggregates, using approximately 24 million tonnes per year on New
Zealand‟s roading network. Failure to meet MDD reduces the pavement‟s stability and
strength, consequently reducing its life expectancy leading to expensive rehabilitation
works. Because aggregates are a non-renewable source, they must be used sparingly and
effectively. There are very limited high quality aggregates available in New Zealand with
many already exhausted. Thus, optimum compaction levels must be met to avoid the
inefficient use of these valuable limited resources (Black, 2009).
New Zealand aggregates are only about 150 million years old; this is considered
geologically young as opposed to aggregates internationally, where in some areas (such
as North America and Australia), Greywacke rocks are about 1 billion years old. An
aggregate‟s age can influence its homogeneity, geological constituents, physical strength
and response to application of loading. Relatively young aggregates have not been
exposed to geological metamorphism, where pressure and heating over long geological
time periods modify the rock source physical and chemical properties. Therefore, these
aggregates tend to be much more heterogeneous than significantly older aggregates.
Geologically heterogeneous aggregates are inconsistent; the aggregate does not behave in
the same manner throughout. Thus, heterogeneous rocks are undesirable for civil
engineering purposes due to their unpredictable behaviour (Black, 2009).
For example a sample from a 1000 kg batch of heterogeneous aggregate may have an
MDD of 2.24 kg/m³ in a laboratory test, however because the laboratory test only uses
about a 5kg portion, the MDD value of 2.24 kg/m³ may not be representative of the full

Chapter 3.New Zealand Basecourse Aggregates
28
1000kg batch. Furthermore, if the aggregate is heterogeneous, then different parts of the
quarry can produce significantly different results.
3.2 Aggregate Property Tests
3.2.1 TNZ Basecourse Specifications
TNZ M/4 refers to a standard specification for basecourse use in flexible granular
pavements. The specification states that the aggregate shall be of high quality to be used
on NZ road pavements as a road base (Henning, 2008a). Typical aggregates used on
heavily trafficked roads such as State Highways are usually crushed from sources
accepted as a regional basecourse aggregate (Transit New Zealand, 2006b).
The aggregate being used in this research is predominately Greywacke and is sourced
from an accepted region as stated in the TNZ M/4 acceptable regional basecourse table
(Transit New Zealand, 2006b). It is quarried and crushed (All Passing 40 mm) by
Stevensons Ltd, south of Auckland.
Aggregates must be tested using standardised procedures to maintain quality of the
aggregates being used as basecourse layers in New Zealand pavements. Quality control is
sometimes referred to as quality assurance and is defined as providing a product or
service that will satisfy certain requirements for quality (Geological Society Engineering
Geology, 2001). The NZTA has specified a specification (TNZ M/4 2006 – Specification
for basecourse Aggregate) which includes a quality control procedure where the
aggregate must undergo a set of tests to ensure its performance is up to an acceptable
level (Black, 2009; Transit New Zealand, 2006b). As will be discussed in the Section
3.2.2, quality control tests are split into „Source‟ and „Production‟ tests.
3.2.2 Source and Production Properties
The specification set out by NZTA for basecourse aggregates (TNZ M/4:2006)
distinguishes between source and production properties. It is thought that the „source‟
properties are those which are inherent properties of the rock and should not change or
differ significantly over time, tests such as crushing resistance, weathering resistance fall
under this category. On the other hand, „production‟ properties refer to properties which
are solely influenced by the production process of the rock, and are known to

Investigation of the Variability in the Results of the NZ Vibrating Hammer Compaction Test
29
significantly change over time. Particle-size distribution (PSD), Broken face Content and
Sand Equivalent (SE) are classified as „production‟ property tests (Black, 2009; Transit
New Zealand, 2006a).
This distinction made between „source‟ and „production‟ properties may have been valid
at the time the TNZ M/4 specification was created, however due to the advancements in
quarry equipment and technology, all property tests including „source‟ properties (which
are initially thought to be governed only by the inherent characteristics of the aggregate)
can now be controlled and manipulated through the processing method a quarry
undertakes (Ellis, 2010). This fact is also supported by Black (2009) where it is reported
that “all aggregate properties are dependent on the processing methodology used to
produce them” (Black, 2009).
Black (2009) reports a test that has been carried out where a range of aggregates sourced
from the same rock have been processed in a quarry in different ways and levels in an aim
to observe if any source properties would be affected by the different levels and methods
of processing. The results revealed that there was a significant variation in „source‟
properties between the aggregates meaning that the different methods and levels of
processing do affect the „source‟ properties of an aggregate. Hence, all of the standard
aggregate properties tests are, to some extent, influenced by the processing method a
quarry undertakes.
Based on the original NZTA distinction made between „source‟ and „production‟
properties, the flow chart shown in Figure 3-1 shows the TNZ M/4 quality control
procedure in accepting an aggregate for use as a basecourse layer.
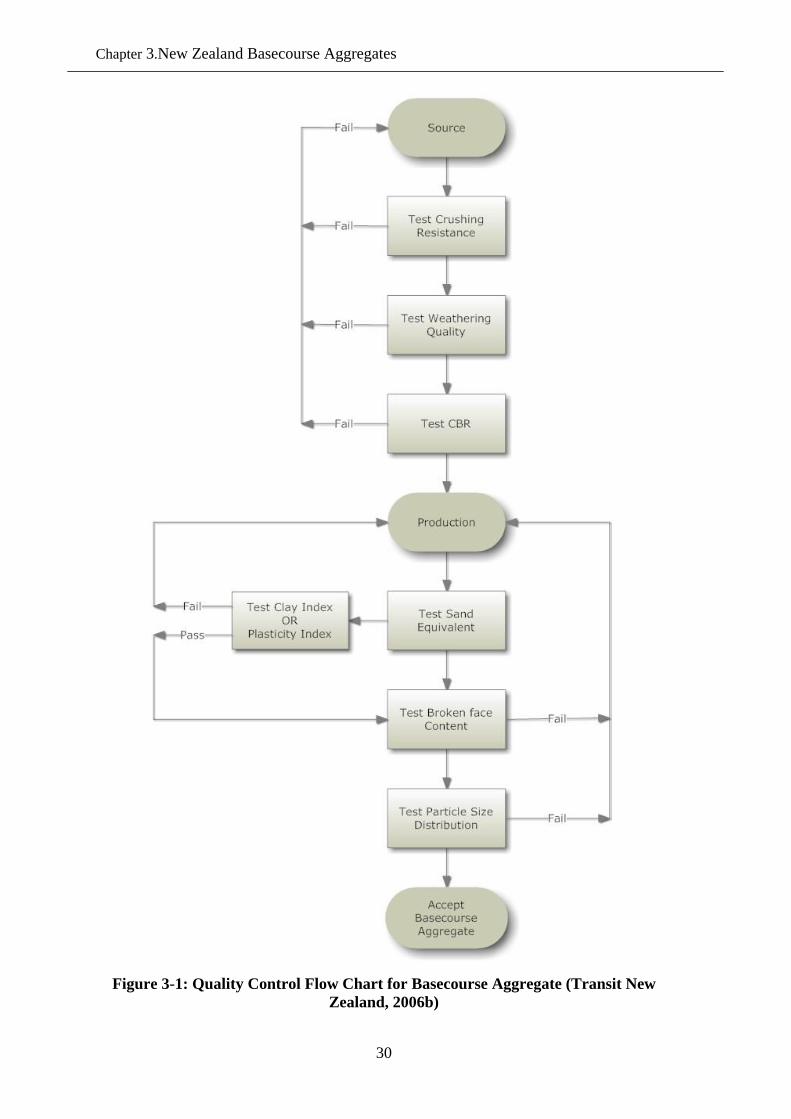
Chapter 3.New Zealand Basecourse Aggregates
30
Figure 3-1: Quality Control Flow Chart for Basecourse Aggregate (Transit New
Zealand, 2006b)
Investigation of the Variability in the Results of the NZ Vibrating Hammer Compaction Test
31
3.2.3 Source Property Tests
„Source‟ properties define the properties at which the aggregate is sourced from.
Theoretically speaking, these are not dependant on the processing method a quarry
undertakes; rather they rely on the basic inherent properties (such as crushing and
weathering resistance) of the source these aggregates are extracted from. A brief
description of each of the source property tests performed on the aggregate is provided in
the following Sections (Transit New Zealand, 2006a).
Because source properties for a reasonably homogenous quarry do not change
significantly over time, they shall be sampled and tested (using all source property tests
such as Crushing Resistance, Weathering Quality and CBR) at least once every 10,000m³
(Transit New Zealand, 2006b).
Crushing Resistance
The purpose of the Crushing Resistance Test is to indicate the strength and likelihood of
attrition of the aggregate. In the aggregate industry the strength of a rock is defined by the
stress at which the material begins to fail. Hence, the Crushing Resistance test involves
applying a specified load to the aggregate and consequently measuring the amount of
fines it produces (Black, 2009; New Zealand Standards, 1991g; Transit New Zealand,
2006a).
Weathering Quality Index
The aggregate being used as a basecourse layer must not degrade under environmental
changes, hence, it must meet minimum weathering quality index criterion.
The weathering quality test assesses the degree of the aggregate‟s ability to resist the
effects of environmental changes such as wetting, drying, heating and cooling. The test
attempts to represent natural adverse weather conditions where aggregates are exposed to
the combined agencies of wetting and drying and heating and cooling (New Zealand
Standards, 1991h; Transit New Zealand, 2006a).
California Bearing Ratio
The California Bearing Ratio (CBR) is a penetration test that was developed in California
by the California State Highway Department, the test assesses the aggregate‟s bearing

Chapter 3.New Zealand Basecourse Aggregates
32
capacity and compares to that of a high quality crushed stone. The test is used to evaluate
the strength of an aggregate (HEICO, 2010; New Zealand Standards, 1991i).
The TNZ M/4 aggregate to be used as a basecourse layer must attain a minimum required
CBR of 80% (Henning, 2008b; Transit New Zealand, 2006b).
3.2.4 Production Properties
The production properties of an aggregate are defined by how the aggregate is processed
in a quarry. Different quarries process aggregates in different ways and hence the TNZ
M/4 specification for basecourse aggregates specifies a number of tests (such as Sand
equivalent, Broken Face content and Particle size distribution etc.) that an aggregate must
be tested for to ensure that a satisfactory quality assurance is met. The following Sections
identify and give a brief description about the production property tests. The number of
samples of each of the production tests to be performed depends on the lot size as shown
in Table 3-1.
Table 3-1: Minimum Sampling Rate for 'Production' Property Tests – Reproduced
from (Transit New Zealand, 2006b)
Lot Size Number of Samples
From To
1 m³ 400 m³ 2
400 m³ 1500 m³ 3
1500 m³ 4000 m³ 4
If a lot size exceeds 4000m³ then the number of additional tests performed should be at
the rate of one per 1000m³
Sand Equivalent
The Sand Equivalent test (SE) measures the relative amounts of silt or clay size particles
in granular soils indicating its cleanness.
Black (2009) argues that although the SE test replaces two other tests (Plasticity Index
and Clay Index), these tests are not directly comparable, studies of the relationship
between the three tests for a range of different aggregate types indicate that there is no
strong correlation between these three tests. The study also revealed that the three tests

Investigation of the Variability in the Results of the NZ Vibrating Hammer Compaction Test
33
lack the ability to determine the presence of moisture sensitive fine particles. The
presence of fine clay particles in the aggregate has a deleterious effect on the aggregates
permeability (Black, 2009; New Zealand Standards, 1991f; Transit New Zealand, 2006a).
Clay Index
The Clay Index (CI) test is basically a methylene blue titration test that is used to
“...estimate the percentage of expansive clay minerals in natural fines or rock powders”
(New Zealand Standards, 1991b). Black (2009) defines the test as a measure of the
surface area of fraction fines in the aggregate by determining how much methylene blue
can be adsorbed on the surface of the aggregate fines.
Plasticity Index
The Plasticity Index (PI) is the difference between the plastic and liquid limits. The test
determines the PI of fine fractions of an aggregate. It is heavily criticised as the results are
subjective and are dependent on the experience of the lab technician (Black, 2009; New
Zealand Standards, 1991c).
Broken Face Content
The Broken Face Content test determines how many „broken faces‟ an aggregate fraction
of a test sample has. In order for an acceptable level of performance an aggregate must
have a number of broken faces when crushed. This helps increase the strength and
interlock forces of the particles in the aggregate (New Zealand Standards, 1991d).
Particle Size Distribution
The Particle Size Distribution (PSD) method (also known as aggregate grading) is a
simple sieving test which can be performed wet or dry (wet sieving is the preferred
method). The PSD must conform to the envelope limits (upper and lower). The test
provides an assessment of how well the material may mix and compact, thus providing
the interstitial strength of an unbound granular material (Black, 2009; New Zealand
Standards, 1991e; Transit New Zealand, 2006a).
3.2.5 Concerns about the Property Tests in New Zealand
Most of the property tests that have been mentioned above were developed in Europe and
North America to help predict those countries‟ aggregate performance. Since then, these
tests have been adopted with minor modifications to suit New Zealand aggregates.

Chapter 3.New Zealand Basecourse Aggregates
34
However, Black (2009) argues that these tests have been developed specifically for
Europe and North America‟s aggregates which are considered old continental rocks. 69%
of America‟s crushed stone aggregate production is carbonate, and Europe produces
approximately 60% of carbonate aggregates. In contrast, New Zealand produces around
70% of greywacke aggregate where the remainder is derived from young volcanic rocks.
Thus, there are major differences in the natural properties of Europe/North America‟s
aggregates and New Zealand‟s geologically young aggregates. This follows that “the tests
that have been developed specifically for old continental rocks may not be an effective
predictive tool on our geologically young aggregates” (Black, 2009; Lowe et al., 2010).
Most of these property tests are measuring more than one physical property at one time,
because these properties cannot be independently controlled, it is quite difficult to
interpret results. The physical strength of an aggregate for example (i.e. the crushing
resistance) has an effect on more than one property test; it governs (to some extent)
whether or not the aggregate will conform with other tests such as PSD, weathering
quality and SE (Black, 2009).
There is also growing criticism regarding the weathering resistance test, as it is thought
that the test does not reflect real environmental weathering conditions. The test offers a
poor prediction of the weathering of the aggregate in service, however, the weathering
resistance test is better than many inadequate tests and gives an indication of the
aggregates weathering performance (Black, 2009; Transit New Zealand, 2006a).
3.3 Aggregate Mineral Composition Testing
The mineral composition of an aggregate defines its performance and behaviour under the
application of load. Aggregates containing different mineral constituents could be
contributing to the variation in the vibratory hammer compaction test results. Testing of
the aggregate‟s mineral composition is therefore imperative to achieving a sound
understanding of the variability in the vibratory hammer compaction test results.
X-ray Diffraction (XRD) is a test method used to understand the mineral composition of
an aggregate. Wavelength X-rays are introduced to a powdered sample of the aggregate,
where the reflections are then recorded and the data analysed to calculate the inter-atomic
spacing between each mineral layer. These inter-atomic spacings provide unique patterns

Investigation of the Variability in the Results of the NZ Vibrating Hammer Compaction Test
35
which allow the identification of the minerals present within the aggregate (Lowe et al.,
2010).
Clay minerals that are most commonly found in NZ rocks are chlorite, illite and smectite.
Of particular concern, is the smectite clay mineral which is classed as a swelling clay.
Swelling is defined as the volume change in the aggregate due to the absorption of water.
The effect of swelling clays is problematic to the durability and overall performance of
the aggregate (Lowe et al., 2010).
To test for the presence of these expansive minerals, two X-ray diffractions tests are
conducted on the sample. The first sample being untreated and is tested in its natural
state, this sample does not identify any swelling clays. Ethylene glycol is added to the
second sample to allow for the identification of the expansive swelling clay minerals
during X-ray diffraction testing (Lowe et al., 2010).
3.4 The effect of grading on performance of
basecourse aggregate
Land Transport New Zealand (now NZTA, as of 2008) has carried out a research
investigation into the effect of the Particle Size Distribution (PSD) on the performance of
aggregates. The PSD also referred to as the grading of an aggregate plays an important
role in aggregate behaviour under an imposed load. A dense graded material refers to a
material in which each particle size fits closely into the space left between bigger particle
sizes within the grading. Uniformly graded aggregates refer to those aggregates which
predominately contain one particle size (Arnold et al., 2007).
Grading envelope curves are specified in the TNZ M/4 basecourse specification to ensure
that dense grading is achieved. Grading curves are established by plotting the diameter of
particles (in mm) on a negative log scale, against the mass percentage of the material
smaller than that diameter. Formula 3-1 is used to work out the grading curve of a
particular aggregate.
Chapter 3.New Zealand Basecourse Aggregates
36
(
)
(3-1)
where:
= Percent passing sieve size d
= Maximum particle size and
= known as Talbot‟s exponent n value, it is an integer which
has a common range of 0.3 (fine grading) and 0.6 (coarse
grading)
It is hence, a simple and convenient way to describe the grading of an aggregate by the
use of Talbot‟s exponent n-value, where n-values > 0.5 refer to course graded aggregates
and n-values < 0.5 are fine graded aggregates (Arnold et al., 2007).
The study involved testing a similar material to that used in this research, the TNZ M/4
AP40, however sourced from a different quarry located in the south island. This material
was referred to as “Material 1” in the study. “Material 7” was kept anonymous in the
research and hence will not be discussed as the source of the material is unknown.
Figure 3-2: Effect of Talbot’s Grading Exponent n on Rutting Performance for
Material 1 and 7 (Arnold et al., 2007)
Figure 3-2 shows the observed trend for Material 1 under dry and wet conditions. It can
be seen that in dry conditions, PSD‟s with fairly fine particles outperform PSD‟s with
fairly fine particles at wet conditions. Literature reviewed in this study also supported that
dry materials with a high fines content can help reduce permanent deformation. On the

Investigation of the Variability in the Results of the NZ Vibrating Hammer Compaction Test
37
other hand, as Talbot‟s n-value increases (i.e. as the particle size distribution increases
within an aggregate) from approximately 0.4 to 0.8, Material 1 (wet) begins to outperform
the Material 1 (dry) as shown in Figure 3-2. The report concluded from the findings that
testing on the TNZ M/4 AP40 at gradings with a Talbot‟s n-value of 0.3, 0.4, 0.55 and 0.8
showed that the best performance with the least rutting observed in wet conditions was at
the n-value of 0.8 (coarse graded). While the best performance ratings obtained at dry
conditions was observed at the n-value of 0.3 (fine graded) (Arnold et al., 2007).
In conclusion, a balanced aggregate grading is recommended for the basecourse layer,
where the particle size distribution is slightly balanced in terms of fine aggregate to
coarse aggregates. This will allow for optimum performance under dry and wet
conditions.
3.5 Summary
This chapter discussed the basecourse aggregates used in New Zealand. NZTA
implemented a specification known as the TNZ M/4 which sets out the requirements for a
basecourse aggregate to be used in New Zealand pavements. The TNZ M/4 includes a set
of tests to ensure quality of the aggregate is met before it is used as a basecourse layer.
Each of these tests were discussed in this chapter. A test procedure known as the X-ray
Diffraction test, which allows for the determination of mineral constituents of the
aggregates, is also discussed. The X-ray Diffraction test is hoped to determine the natural
variability of the aggregate being used in testing. While other sources of variation which
could be contributed by test conditions are discussed in greater detail in the next chapter.
The effect of grading on the performance of the pavement was also discussed. It was
found through a literature search that aggregates with a relatively coarse grading
outperform finer grading aggregates when wet. In contrast, fine grading aggregates
outperform coarser aggregates in dry conditions. Thus, a balanced gradation must be
achieved in order to obtain an aggregate which can perform well under wet and dry
conditions.
In addition to the grading, several other factors can significantly affect the performance
and consequently the results of the vibrating hammer compaction test. These are
discussed in the next chapter.


Chapter 4. VARIATION IN VIBRATING
HAMMER COMPACTION TESTS
4.1 Introduction
Growing concern over the repeatability and reproducibility of the laboratory-based
vibrating hammer compaction test has been expressed from the time the test was adopted
by the New Zealand Standards (NZS). The test is known to produce inconsistent and
significantly variable results (Opus International Consultants Limited, 2008). These
laboratory results are used as benchmark values on the field. Thus, it is important that
these values are reliable and accurate (Frobel & Moulding, 2006). However, it was clear
from field experience that contractors often could not reach the target Dry Density
specified by the laboratory test.
To address the problem of varying results, NZTA requested an inter-laboratory (round
robin) study be carried out to investigate the influence of a range of test factors on the
reproducibility and repeatability of the New Zealand vibrating hammer compaction test
(Opus International Consultants Limited, 2008).
The vibrating hammer compaction test is used by several countries such as USA, Britain
and New Zealand. Unlike New Zealand, the USA and Britain have designed distinct test
methods for both unbound granular materials and cohesive material (ASTM D 7382 - 08,
2008; BS EN 13286 - 4, 2003). In the case of the New Zealand Standard, a generic test
method is used for all material types. However, the standard does mention that the
vibrating hammer compaction test is particularly suitable for granular material (New
Zealand Standards, 1986b). It seems intuitive that different materials which have different
physical properties, mineral composition and behaviour under application of load should
not be tested using the same test method.
It is worth noting that the UK initially had only one test method for all types of material.
However, after experiencing the same problems that are currently experienced in NZ, the
UK authorities introduced an additional standard specifically targeted for graded granular
materials (BS 5835, 1980).

Chapter 4.Variation in Vibrating Hammer Compaction Tests
40
4.2 Possible Causes of Variation
Inconsistency in the results of an experiment, which has been repeated a number of times
in the same manner and under the same conditions, could be due to a number of factors.
This Section discusses the possible causes of variation in the results of an experiment and
particularly in the vibrating hammer compaction test. The possible factors contributing to
the variability of a test result are split into two categories as shown in Table 4-1 (ASTM E
177 - 10, 2010).
Table 4-1: Potential Factors Affecting Variability in Vibrating Hammer Compaction
Test Results
General sources of variability Sources of variability specific to
the vibrating hammer test
Operator/Technician Hammer
Calibration of Apparatus Segregation
Environmental Conditions Degradation
Test Sample Mould Type and Size
Time Oversized Particles
It is important to investigate all the sources of variability and quantify their effects on the
results in an attempt to substantially reduce or eliminate their contribution. The factors
illustrated in Table 4-1 are discussed in more detail in Sections 4.2.1 and 4.2.2.
4.2.1 General sources of variability in a laboratory-based test
General sources which may contribute to the variation in an experiment‟s results are those
which arise in any experiment conducted. Such variations include different technicians
conducting the test, the duration of the test and the environment at which the test was
done. This Section identifies these sources and describes their potential significance to the
variation in an experiment‟s results.
Operator/Technician
Variability among different operators/technicians carrying out the same test can be
significant. It is therefore vital that a test method is written in a very clear and concise
manner to avoid confusion and serious differences in interpretation by various operators.
Investigation of the Variability in the Results of the NZ Vibrating Hammer Compaction Test
41
It is also important that technicians follow the test method closely and accurately.
However, no matter how clear and concise a test method is, different operators have
different techniques in conducting an experiment. Human error such as reaction time,
colour sensitivity, scale reading and interpolation differs from person to person, which in
turn could affect the nature of the test results (ASTM E 177 - 10, 2010).
The level of experience and familiarity of the test method by technicians also contributes
to the variability in test results. Experienced technicians are aware of common faults and
mistakes within a test method. Therefore, the level of uncertainty in a test conducted by
an experienced technician is much lower than that for an amateur technician who is
unfamiliar with the test.
Calibration of Apparatus
Improper calibration of apparatus, different levels of tolerances and uncertainties can
contribute to the variation in test results. The test methods should provide information on
the frequency at which an equipment must be recalibrated (ASTM E 177 - 10, 2010).
Environment
Material properties are sensitive and can be easily influenced by environmental effects
such as temperature, humidity, atmospheric pressure and contaminants. Although it is
common for a test method to specify the environmental conditions for testing, these
conditions cannot be perfectly controlled within and between laboratories. A margin of
error must be incorporated in test methods relating to the inevitable variability which will
occur due to environmental effects (ASTM E 177 - 10, 2010).
Test Sample
A bulk of material should be checked for quality periodically through property testing
because it is unlikely that the material is homogenous throughout. As discussed in Section
3.1 aggregates, particularly in New Zealand, are geologically young materials that have
not been exposed to geological metamorphism. This means that these materials may be
heterogeneous and may have varying mineral constituents. The differences in mineral
compositions (and other properties) can yield varying test results (Black, 2009).
X-ray diffraction and property tests should be conducted periodically on the material to
ensure its uniformity throughout a quarry source. This helps eliminate any variations

Chapter 4.Variation in Vibrating Hammer Compaction Tests
42
caused by the non-uniformity of the material (Lowe et al., 2010). The test specimen must
also be prepared and tested in the same manner every time to avoid inconsistencies in
sample preparation. If sample storage conditions are specified within a test standard, these
should be followed and kept constant for all samples being tested (ASTM E 177 - 10,
2010).
Time
Time can influence each of the factors mentioned above; the longer the period between
two or more test results, the less likely the changes in the factors mentioned above will
stay at a minimum, and therefore would increase observed differences in test results. The
degree of control exercised by a laboratory over the above factors will govern the amount
of variation due to time (ASTM E 177 - 10, 2010).
The duration of each test can also contribute to the variation in test results. Tests must all
be conducted from the same source in roughly the same amount of time to avoid
uncertainties due to settlement of water in a material for example. In addition, the
vibrating hammer compaction test samples require a curing period after being wetted to
the required level of Water Content. This curing period ensures that the test sample has
thoroughly been soaked in water to establish equilibrium. It is important to ensure that all
samples being tested are given equal periods of curing time (New Zealand Standards,
1986b).
4.2.2 Sources of variability specific to vibrating hammer test
Within the vibrating hammer compaction test, there are a number of factors which could
possibly affect the reliability of this test method. These factors include segregation and
degradation of the material, mould shape and size, type and age of hammer and any
oversized particles present during compaction. A discussion of each factor follows.
Hammer
It is no surprise that the type of hammer could have a significant impact on the results
produced. Hammers with different power and frequency ratings yield different results. A
round robin study carried out by Opus (2008) proved that laboratories which used
hammers with low power ratings generally produced lower Dry Densities. Those which
used hammers with power ratings in the higher end of the spectrum yielded notably

Investigation of the Variability in the Results of the NZ Vibrating Hammer Compaction Test
43
higher Dry Densities, this will be discussed in greater detail in Section 4.4 of this chapter
(Opus International Consultants Limited, 2008).
The calibration test for acceptable hammers that is incorporated in the New Zealand
Standard test method for the vibrating hammer compaction test (NZS 4402 Test 4.1.3) is
highly criticised. It involves compacting Leighton Buzzard Silica Sand at a specified
Water Content, and only has a minimum requirement and not a maximum. Because an
upper limit does not exist, bigger and more powerful hammers can be used to achieve
higher Dry Densities. However, powerful hammers can affect and damage the nature of
the material (degradation) (Frobel & Moulding, 2006; New Zealand Standards, 1986b).
Degradation
As discussed in Section 3.4, the grading of a material influences its characteristics and
performance, therefore it is vital to ensure that the specified gradation does not change
during compaction. Degradation, which is a phenomenon opposite to gradation, is defined
as the breakdown of aggregate particles in smaller sized fragments. It can occur during
compaction due to the compactive effort. As mentioned above, high compactive efforts
can damage the nature of the aggregate and cause it to breakdown. Because an aggregate
is carefully graded before its intended use, the breakdown of particles will affect the
gradation of the aggregate and in turn the performance of this aggregate (Luxford, 1975).
Segregation
Segregation is defined as the non-uniform distribution of the coarse and fine particles
within an aggregate. The tendency of fine particles separating from the larger coarse
particles creates an inevitable scenario where segregation will occur, especially in the
vibrating hammer compaction test where segregation becomes most pronounced.
Segregation occurs either during the compaction process or when placing the specimen
into the compaction mould. Thus, in order to keep segregation to a minimum, it is
essential that the placement of the specimen into the mould is done very carefully and in a
consistent manner. Although segregation during compaction is inevitable, it can be
substantially reduced through the application of adequate surcharge weight on the top
surface of the test specimen. The imposed weight on the sample helps prevent movement
of finer particles away from coarse particles and therefore helps minimise segregation.
(Panarese, 1972). It seems that as a result of excessive segregation, a British Standard for
the vibrating hammer compaction test method (BSI 5835 “Compactibility test for graded

Chapter 4.Variation in Vibrating Hammer Compaction Tests
44
aggregates” has repeatedly increased its surcharge specification in the vibrating hammer
compaction test over the years. Two amendments (amendment 1 in 1983 and amendment
2 in 1987) have been introduced to the original specification to increase the surcharge
weight from 350 N to 450 N (BS 5835, 1980).
In order for an aggregate to perform adequately, its gradation must be uniform throughout
its depth; however during compaction, the vibrating action causes the finer particles
within the aggregate to roll down to the bottom outer edges of the mould. When the finer
particles of the aggregate accumulate in one layer during compaction on the field, the
permeability of the aggregate can be grossly influenced (Luxford, 1975).
Unfortunately, a standard qualitative method for measuring the amount of segregation
(and degradation) which takes place during compaction does not exist. Researchers in the
field of compaction studies state that segregation should be visually analysed. However,
some suggest (without any experimental development yet), that it is possible to measure
the degree of segregation by extruding out thin sections of a compacted sample and
carrying out gradation analysis on these sections (Luxford, 1975).
Mould shape and size
Mould size and shape can influence the reliability in the results of the vibrating hammer
compaction test. The mould diameter size selected can influence results depending on the
maximum particle size available in the sample being compacted. According to Drnevich
et. al. (2007) research has found that the Maximum Dry Density (MDD) is reached in
moulds six to eight times the maximum particle size available in the sample. The NZ
vibrating hammer compaction test standard does not conform to this theory. It allows for
particles of maximum size of 37.5 mm to be compacted in a 152 ± 0.5 mm. The diameter
of the specified NZ mould is only four times the maximum permissible particle size (New
Zealand Standards, 1986b). Research conducted by Bishop and Green (1965) suggests
that the height to diameter ratio should not be less than 2 to 1. The NZ vibrating hammer
compaction test standard (NZS 4402 Test 4.1.3 “New Zealand vibrating hammer
compaction test”) specifies a mould size such that the height to diameter ratio is
approximately 1 to 1.

Investigation of the Variability in the Results of the NZ Vibrating Hammer Compaction Test
45
Oversized particles
The NZS 4402 Test 4.1.3 allows for up to 37.5 mm particles in a 152 ± 0.5 mm diameter
mould, international standards such as the USA does not allow for particles of this size in
such a small mould. As will be discussed in Section 5.4, the USA standard employs two
methods, each specified for different maximum allowable particle sizes available within
the sample. Drnevich et. al. (2007) suggest that particles retained on the 19mm sieve that
are compacted in a 152 mm diameter can lead to interlocking of particles which can
ultimately interfere with the compaction process.
4.3 Ruggedness Test
4.3.1 Introduction
The purpose of the Ruggedness, also known as robustness, test is described in the ASTM
standard as the identification of “...those factors that strongly influence the measurements
provided by a specific test method and to estimate how closely those factors need to be
controlled” (ASTM E 1169 - 07, 2007). The ruggedness test was initially introduced to
avoid facing problems in inter-laboratory tests and to identify the potential factors
responsible for inconsistency of results. Thus, the ruggedness test is part of the validation
phase of the development of a standard test method; it is recommended that the
ruggedness test precedes an inter-laboratory (round robin) study (ASTM E 1169 - 07,
2007; Massart et al., 2006).
4.3.2 Concept of the Ruggedness test
The ruggedness test is a planned experiment where environmental and test factors are
intentionally varied in order to record the effects on the test results of such variation. It
requires making systematic changes in the test factors which are believed to have
potential effect on the results, and then observing the subsequent effects of these changes
on the end results of a test method. The steps involved in conducting the ruggedness test
are briefly identified (ASTM E 1169 - 07, 2007):
1. Identification of relevant factors
2. Selection of levels for each factor (two realistic extremes for each factor, usually a
high and low extreme)
3. Display the treatment combinations in a cyclic shifter order

Chapter 4.Variation in Vibrating Hammer Compaction Tests
46
4. Execution of runs arranged in a random order
5. Statistical analysis to determine the effect of factors on the test method results,
and
6. Possible revision of test method if needed.
4.3.3 Suitability to vibrating hammer test
The ruggedness test was initially incorporated in the research proposal as part of this
study. It is important to determine which factors have a significant effect on the vibrating
hammer compaction test results (Wilson & Shamseldin, 2010). However, before
identifying these factors using the ruggedness test, it is vital that an understanding of the
natural variability of the test is achieved.
4.4 Inter-laboratory (Round Robin) Study
4.4.1 Introduction
The build-up of uncertainty in the results of the vibrating hammer compaction test in New
Zealand was agreed upon at a Civil Engineering Testing Association of New Zealand
(CETANZ) meeting in 2008. At the meeting, the New Zealand vibrating hammer
compaction test (NZS4402:1986 Test 4.1.3) was discussed and it was agreed by
participants that an inter-laboratory study be carried out between current laboratories
conducting the test to establish actual repeatability and reproducibility values of the test.
Thus, this Section reviews the inter-laboratory study that has been conducted by Opus
international Consultants Ltd., Central Laboratories (Opus International Consultants
Limited, 2008).
In order for a full rework or replacement of the current test standard for the vibrating
hammer compaction, the repeatability and reproducibility values must be evidently higher
than those values obtained by previous inter-laboratory studies conducted by the UK and
USA.
The round robin study conducted by Opus consisted of thirty three laboratories and was
aimed at determining the effect of a range of different equipment variables on the
reproducibility and repeatability values of the New Zealand vibrating hammer
compaction test. As a requirement set out by ASTM to determine repeatability values,
Investigation of the Variability in the Results of the NZ Vibrating Hammer Compaction Test
47
testing was to be carried out by the same technician in each lab (ASTM E 691 - 09, 2009).
Two materials were tested; TNZ M/4AP40 and GAP40. These were tested at two water
contents; 2.0% and 6.0% for the TNZ M/4AP40 (denoted by TNZ2 and TNZ6
respectively) and 1.0% and 4.0% for the GAP40 (denoted by GAP1 and GAP4
respectively). The determination of water contents after compaction was carried out as
specified in the NZS 4407 Test 3.1 “The Water Content of aggregate” (New Zealand
Standards, 1991a).
Results from five laboratories were excluded from the data analysis from the study simply
because these results varied significantly from the rest of the data. All laboratories used
identical samples to conduct the test. Therefore, this variability by the five laboratories
could be attributed largely to the inconsistency in the operating procedures.
4.4.2 Discussion of Results
The inter-laboratory study conducted by Opus produced some important results which
helped in setting the objectives for this research. This Section analyses and discusses
these results in relation to the objectives set in this research.
Repeatability and Reproducibility
The precision of an experiment is defined by the “closeness of agreements between
independent test results obtained under stipulated conditions” (ASTM E 691 - 09, 2009).
Precision is measured by two parameters; Repeatability and Reproducibility.
Repeatability is the precision of a test method where the independent test results are
obtained using the same equipment and conducted by the same technician in the same
laboratory. Hence, repeatability ensures the reliability of a test method under constant
conditions (ASTM E 691 - 09, 2009).
The precision of a test method where the results are obtained following the same test
method, in different laboratories with different technicians and equipment is measured by
the reproducibility value of that test method (ASTM E 691 - 09, 2009).
The repeatability and reproducibility values were calculated in the report produced by
Opus and are shown in Table 4-2.
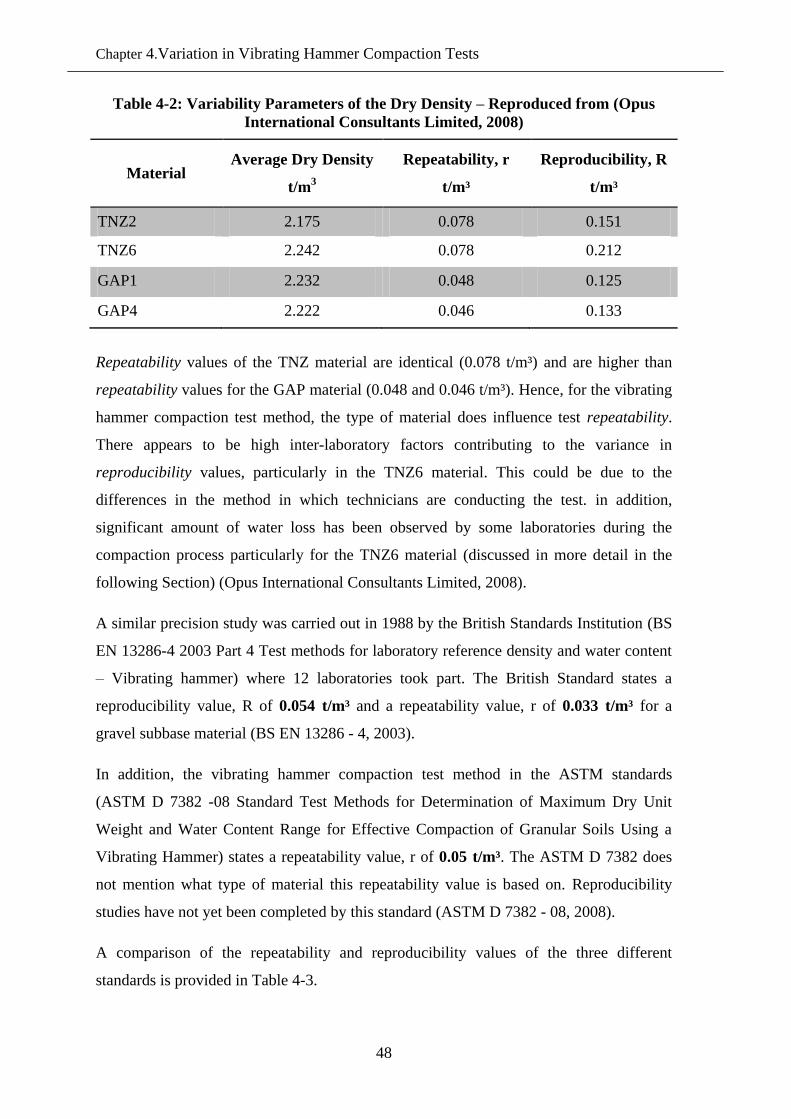
Chapter 4.Variation in Vibrating Hammer Compaction Tests
48
Table 4-2: Variability Parameters of the Dry Density – Reproduced from (Opus
International Consultants Limited, 2008)
Material Average Dry Density
t/m3
Repeatability, r
t/m³
Reproducibility, R
t/m³
TNZ2 2.175 0.078 0.151
TNZ6 2.242 0.078 0.212
GAP1 2.232 0.048 0.125
GAP4 2.222 0.046 0.133
Repeatability values of the TNZ material are identical (0.078 t/m³) and are higher than
repeatability values for the GAP material (0.048 and 0.046 t/m³). Hence, for the vibrating
hammer compaction test method, the type of material does influence test repeatability.
There appears to be high inter-laboratory factors contributing to the variance in
reproducibility values, particularly in the TNZ6 material. This could be due to the
differences in the method in which technicians are conducting the test. in addition,
significant amount of water loss has been observed by some laboratories during the
compaction process particularly for the TNZ6 material (discussed in more detail in the
following Section) (Opus International Consultants Limited, 2008).
A similar precision study was carried out in 1988 by the British Standards Institution (BS
EN 13286-4 2003 Part 4 Test methods for laboratory reference density and water content
– Vibrating hammer) where 12 laboratories took part. The British Standard states a
reproducibility value, R of 0.054 t/m³ and a repeatability value, r of 0.033 t/m³ for a
gravel subbase material (BS EN 13286 - 4, 2003).
In addition, the vibrating hammer compaction test method in the ASTM standards
(ASTM D 7382 -08 Standard Test Methods for Determination of Maximum Dry Unit
Weight and Water Content Range for Effective Compaction of Granular Soils Using a
Vibrating Hammer) states a repeatability value, r of 0.05 t/m³. The ASTM D 7382 does
not mention what type of material this repeatability value is based on. Reproducibility
studies have not yet been completed by this standard (ASTM D 7382 - 08, 2008).
A comparison of the repeatability and reproducibility values of the three different
standards is provided in Table 4-3.

Investigation of the Variability in the Results of the NZ Vibrating Hammer Compaction Test
49
Table 4-3: Comparison of the Repeatability and Reproducibility Values
Material Repeatability, r
t/m³
Reproducibility, R
t/m³
GAP1 (NZ) 0.048 0.125
GAP4 (NZ) 0.046 0.133
TNZ1 (NZ) 0.078 0.151
TNZ6 (NZ) 0.078 0.212
Gravel Subbase (UK) 0.033 0.054
Unknown (USA) 0.05 N/A
The New Zealand repeatability results are of the same order as the ASTM D 7382
repeatability value (approximately 0.05 for GAP samples and 0.08 for TNZ samples,
compared to 0.05 for USA ASTM). Reproducibility values for the New Zealand precision
study (0.13 t/m³ to 0.21 t/m³) appear to be significantly higher (up to four times) than the
UK value of 0.054 t/m³ (Opus International Consultants Limited, 2008).
However, it is important to note that the values produced by the UK and USA studies are
not directly comparable to the NZ values. This is due to a number of reasons:
The materials used in each study (USA, UK, and NZ) are quite different.
Water Content ranges used for each study could have been different (the USA
and UK studies do not specify over which Water Contents the tests were
undertaken).
Each study adopted their own test methodology of the vibrating hammer test,
which vary slightly (as will be discussed in chapter 5).
Thus, although the values cannot be directly compared, UK and USA values can be used
as an indication of likely repeatability and reproducibility values for this type of test
(Opus International Consultants Limited, 2008).
Effect of Water Content on Variability of Dry Density Results
The water content at which a material is compacted determines the degree of compaction
achieved. Hence, Opus (2008) investigated if water content was a major factor in causing

Chapter 4.Variation in Vibrating Hammer Compaction Tests
50
the significant variability evident in the test method results. Two graphs (for the two
materials) were plotted to analyse this. One of them is reproduced in Figure 4-1.
Figure 4-1: Dry Density Variation with Retained Water Content (Opus
International Consultants Limited, 2008)
From Figure 4-1 the Opus (2008) report explains that a significant effect of water content
on dry density can be seen particularly for the TNZ6 material. The R² value of this
particular material (TNZ6) denotes approximately 7% of variation can be explained by
water content variation, assuming the WC-DD relationship is linear. However, since it is
known that this relationship is non-linear (parabolic), this is not a valid assumption.
Thus, the Opus report concludes that although WC is known to affect the attained DD,
Figure 4-1 indicates that the variability due to the between-laboratory factors overwhelm
this effect (Opus International Consultants Limited, 2008).
Effect of Hammer Power Rating on Variability of Dry Density Results
The degree of compaction (Dry Density), among other factors is dependent on the
compactive effort applied. Thus, the hammer input power rating has significant influence
on the variation of the vibrating hammer compaction test results. This is due to the fact
that hammers with high input power ratings apply a greater compactive effort on the
specimen during compaction than a hammer with a relatively lower input power rating.
y = 0.0392x + 2.0562
R2 = 0.0728
y = 0.0279x + 2.1212
R2 = 0.0082
1.7
1.8
1.9
2.0
2.1
2.2
2.3
2.4
2.5
2.6
2.7
2.8
0 1 2 3 4 5 6 7
Percent Water
Dry
De
ns
ity
t/m
3
TNZ6DRY
TNZ2DRY

Investigation of the Variability in the Results of the NZ Vibrating Hammer Compaction Test
51
Figure 4-2: Variation GAP40 Dry Density with Vibration Hammer Power (Opus
International Consultants Limited, 2008)
Opus (2008) investigated the hammer input power rating effect on dry density by plotting
a graph of DD (t/m³) against Hammer input power (watts). Figure 4-2 is an example of
one of the graphs analysed by the Opus (2008) report, as can be seen, there is a general
trend for DD to increase as the hammer power input Rating increases.
Table 4-4: Predicted Increases in Dry Density When Changing from an 1140 W
Vibrating Hammer to a 1700 W Vibrating Hammer – Reproduced from (Opus
International Consultants Limited, 2008)
Material
Dry Density Increase
with Hammer Power,
t/m3
TNZ2 0.045
TNZ6 0.074
GAP1 0.038
GAP 4 0.053
Based on the equations shown in Figure 4-1 and other graphs plotted in the Opus (2008)
report for the other materials, Table 4-4 was produced, which shows the predicted DD
increase when changing from an 1140 W vibrating hammer to a 1700 W hammer. These
GAP4
y = 9.4446E-05x + 2.0859
R2 = 0.2042
2.05
2.10
2.15
2.20
2.25
2.30
2.35
2.40
800 900 1000 1100 1200 1300 1400 1500 1600 1700 1800
Hammer Input Power W
Dry
Den
sit
y t
/m3

Chapter 4.Variation in Vibrating Hammer Compaction Tests
52
increases appear to be quite significant, considering the repeatability and reproducibility
values shown in Table 4-2 are quite low.
Calibration of Hammer
It is a requirement that the hammer used for compaction testing be properly maintained.
To ensure a satisfactory level of compactive effort is applied on the specimen, a test
method for hammer calibration is incorporated in Note (5) of the NZS 4402:1986 Test
4.1.3 (New Zealand Standards, 1986b).
Leighton Buzzard sand passing a 600µm sieve with a permissible water content of 2.5 ±
0.5% is to be compacted according to the standard‟s test methodology. The hammer is
considered satisfactory if the DD of the sample exceeds 1.74 t/m³ (New Zealand
Standards, 1986b).
Criticism of the hammer calibration method has been expressed. The calibration method
only has a minimum requirement and of the hammer power input rating not a maximum.
This can lead to potential variation in the results. In addition, because a maximum limit of
the hammer power input rating does not exist, degradation (as discussed in chapter 2) can
further contribute to the variation in results (Frobel & Moulding, 2006).
Luxford (1975) reports an investigation carried out by Parsons on the hammer type and
power rating stating that care should be taken when selecting a suitable hammer for
laboratory compaction. Although hammers with a high power rating achieve
corresponding high DD values, this can lead to degradation and damage of the nature of
the material which contributes to additional variation in results obtained.
In Opus‟ (2008) investigation, seventeen of the thirty three laboratories supplied
calibration results based on the NZS 4402:1986 test 4.1.3 method. Two DD values of the
seventeen laboratories were below the minimum limit of 1.74 t/m³. Both of these
laboratories used hammers of the same model with a power input of 1140 W, which are
near the bottom of the power input rating range of the hammers used in the study.
Although the NZS 4402 Test 4.1.3 standard does not specify the hammer power rating, it
recommends hammers with ratings of 600 to 1200 W with the following comment
“Hammers with ratings of 600 to 1200 W power consumption have been found to be
satisfactory” (New Zealand Standards, 1986b). This however, may reflect the power

Investigation of the Variability in the Results of the NZ Vibrating Hammer Compaction Test
53
ratings of many hammers at the time the test method standard was created, with the
advancements in technology, vibrating hammer power ratings have increased
significantly. As there is no maximum limit on the hammer power output, most
laboratories use hammers slightly higher than the recommended range stated in the NZS
4402 Test 4.1.3.
4.4.3 Conclusions Drawn From the Study
The conclusions drawn from the Inter-laboratory study conducted by Opus were as
follows:
The hammer calibration method may need revision. An attempt should be made
to perhaps incorporate a maximum limit of vibrating power input rating.
NZ reproducibility values appear to be two to four times larger than those stated
in the British Standard. This is quite significant and may justify a rework and/or
revision of the current test standard.
Hammers with high input power ratings tend to provide higher dry density
values. Although this only accounts for roughly 10% of the variability.
Five laboratory results out of the thirty three laboratories have been excluded
from data analysis due to the extent of variability observed in these five results.
It is evident by these five laboratories that the way in which the vibrating
hammer compaction test method is conducted can significantly influence the
reliability of the results obtained.
4.5 Summary
This chapter discussed the possible causes of variation due to the test conditions. The
precision of a test experiment is affected by the experiment‟s factors such as uncertainties
in apparatus used, technician level of experience and the environmental conditions.
The chapter discussed the concern expressed over the reliability of the vibrating hammer
compaction test results and identified the possible causes of this variation. Sources of
variability in a test experiment were described briefly.
A similar study that has been conducted by Opus in the past focused on the between-
laboratory variability of the test showed that the variation amongst different laboratories
in New Zealand is significant. Factors such as different equipment, different levels of

Chapter 4.Variation in Vibrating Hammer Compaction Tests
54
technician experience and general laboratory environmental conditions can affect
between-laboratory studies.

Chapter 5. REVIEW OF METHODOLOGIES
5.1 Introduction
Laboratory compaction by an electric vibrating hammer has spread widely since its
development in the early 1970‟s. To date, the test method has been adopted by various
Standards‟ Institutions worldwide including the New Zealand Standards institution (NZ),
British Standards Institution (UK) and ASTM (USA). Although the fundamentals of the
test method are identical, variations in the test method between each institution exists.
These variations are based on the institution‟s knowledge and extensive research carried
out regarding the test. Hence, an important step to understanding the variability in the
results of the New Zealand test method is to compare New Zealand‟s version of the
vibrating hammer test method to USA and UK‟s versions of the test. Any apparent
differences in the NZ standard, which the American and/or British standards do not
concur with, could be contributing factors to the variation in test results observed in NZ.
The comparison process should help point out any major differences in the New Zealand
vibrating hammer test. Whether these differences contribute significantly to the variation
in results or not can be investigated once testing is conducted and results are analysed.
Due to the fact the New Zealand Standards authority works closely with the Australian
Standards authority, it was hoped to include the Australian Standards method of vibrating
hammer in the comparison. Unfortunately the Australian Standards has not adopted a
vibrating hammer compaction test method to this day. Australia uses either the Standard
Proctor or the Modified Proctor methods for the compaction of cohesionless soils (SAI
AS 1289.5.1.1, 2003; SAI AS 1289.5.2.1, 2003).
The test method adopted by NZS for the vibrating hammer compaction test is described in
the NZS 4402 Test 4.1.3 titled “Determination of the Dry Density/Water Content
relationship – New Zealand Vibrating hammer compaction test” (New Zealand Standards,
1986b).
The American Society for testing and materials (ASTM) have also adopted a standard for
the vibrating hammer compaction test described in D 7382-08 titled “Standard tests
methods for determination of Maximum Dry Unit Weight and Water Content range for

Chapter 5.Review of Methodologies
56
effective compaction of granular soils using a vibrating hammer”; the standard in itself is
divided into two methods to account for the difference in materials being compacted
(ASTM D 7382 - 08, 2008).
The British Standards Institution (BSI), however, has adopted 3 different standards to
accommodate for a suitable compaction method for every type of material. Initially the
BS 1377:1975 Part 4.3 titled “determination of the dry density/moisture content
relationship of granular soil (vibrating hammer method)” test method, which is
considered a purely British Standard, was developed and published by BSI. However, the
BS 1377 brought rise to another standard known as the BS 5835 Part 1: in 1980 titled
“Recommendations for testing of aggregates Part 1 – Compactibility test for graded
aggregates”, due to the fact that the BS 1377 test method was deemed unreliable when
applied to aggregates that are commonly used for road sub-bases and base materials. It is
important to note though, that the BS 5835 did not supersede BS 1377 because although
BS 1377 was deemed unreliable when applied to graded aggregates, the test method was
still applicable to other types of materials and soils. Since this research is dealing with
graded aggregates, the comparison of standards will include the BS 5835 and not the BS
1377. The third British Standard for the vibrating hammer compaction test is the BS EN
13286-4:2003 Part 4 “Test methods for laboratory reference density and water content –
vibrating hammer” which was originally a European Standard that was later adopted by
BSI as a British Standard. As will be discussed in later Sections of this chapter, the type
of material (and particle size) being compacted governs which one of these British
standards should be used (BS 5835, 1980; BS EN 13286 - 4, 2003).
This chapter will examine the main sections common to the three standards and discuss
the differences found.
5.2 Scope
The NZS 4402 Test 4.1.3 test method determines the dry density when soil passing a
37.5mm sieve is compacted by a vibrating hammer over a range of water contents,
including that which provides the Maximum Dry Density (MDD).
The ASTM D 7382 test method determines the dry unit weight of granular soils
specifically, by compaction using the vibrating hammer. The standard is divided into two

Investigation of the Variability in the Results of the NZ Vibrating Hammer Compaction Test
57
methods (Method A and Method B), each is created based on percentage of maximum
particle size present in the aggregate.
Method A – Applies to material passing a 19.0 mm sieve and containing up
to 35% of the total dry mass passing a 75 µm sieve.
Method B – Applies to material passing a 50 mm sieve and containing up to
35% of the total dry mass passing a 75 µm sieve.
If however, the material contains 30% or less of its mass retained on the 19.0 mm sieve
Method A can still be used by applying a correction procedure specified in Practice D
4718. As will be discussed in the procedure Section of this chapter, Method B is a lengthy
and more complicated method. Thus, for ease of operations, it is highly recommended to
use Method A, unless Method B is required due to the gradation of the aggregate not
meeting the above requirement of no more than 30% of the aggregates‟ mass retained on
the 19.0mm sieve. The aggregate being used in this research does not comply with
method A, thus, method B will be analysed for comparison purposes.
The BS EN 13286 test method also determines the relationship between the dry density
and water content by the process of compaction using a vibrating hammer. It applies to
mixtures containing less than 30% of their mass retained on the 20 mm sieve. It does not
apply to aggregate mixtures containing more than 10% of its mass retained on the 40 mm
sieve. However, the standard includes an annex that has a different procedure designed
specifically for mixtures with particles that do not conform to the 20 mm sieve
requirement.
The BS 5835 allows for aggregates with particles smaller than 37.5 mm, any material
retained on the 37.5 mm sieve is removed and discarded.

Chapter 5.Review of Methodologies
58
5.3 Apparatus
Table 5-1 identifies the apparatus used in the various test methods and their associated
dimensions.
Table 5-1: Apparatus Properties for Different Standards
Apparatus Standard
NZ BS 5835 BS EN 13286 ASTM D 7382
Mould
Diameter (mm) 152 ± 0.5 150 to 150.08 149.8 to 150.5 279.4 ± 1.1
Height (mm) 125 to 127 NA NA 230.9 ± 0.5
Perforation Base Side Side Non perforated
Hammer
Frequency (Hz) 25 to 60 N/A 33 53 to 58
Power (W) 600 to 1700 W N/A 900 N/A
Frame
Surcharge Load (N) 350 ± 50 N/A 640 ± 10 285 to 570
5.4 Sample Preparation
Proper sample preparation is vital to achieving correct and accurate end results. All the
standards being reviewed suggest that samples being tested be kept in a cool dry place
and well away from direct sunlight, to help minimize the problem of condensation and
water loss from the material.
Some differences in the way samples are prepared do exist among the standards being
reviewed, more specifically the curing period after wetting up the samples. The NZS
4402 Test 4.1.3 specifies a period of at least 16 hours before any testing is done on the
sample and advises that for some soils such as heavy clays, an even longer period is
required to establish equilibrium. ASTM D 7382 on the other hand specifies a short
soaking period of only half an hour. Both British standards (BS EN 13286 and BS 5835)
suggest a 12 hour period to allow for thorough wetting.
As discussed earlier, each standard specifies a limit on the maximum particle size allowed
in the material being compacted. Preparation of samples involves sieving out any

Investigation of the Variability in the Results of the NZ Vibrating Hammer Compaction Test
59
oversized particles present in the material. The NZS 4402 Test 4.1.3 specifies that any
material retained on the 37.5 mm sieve is to be removed and discarded from the sample.
The NZS 4402 Test 4.1.3 does not specify an additional procedure for materials over the
maximum particle size limit of 37.5 mm. Method B of the ASTM D 7382 standard
applies to those aggregates which pass the 50.0 mm sieve. On the other hand, the BS EN
13286 provides two separate methods. The first method is applied for aggregates which
contain less than 30% by mass retained on the 20.0 mm sieve, and the other method is
applied for those aggregates which do not conform to this requirement. The BS 5835 is
similar to the NZS 4402 Test 4.1.3 in that it only adopts one method to compact any
material passing the 37.5 mm sieve, any material retained on this sieve is weighed and
noted down.
It can be seen by the sample preparation review; both the NZS 4402 Test 4.1.3 and the BS
5835 contain one broad method which applies to material having a wide range of particle
sizes. In terms of other standards such as the ASTM D 7382 and BS EN 13286, particles
over the 19.0 – 20.0 mm range are considered oversized and hence require a special
method to be compacted properly and effectively.
5.5 Procedure
The most critical step which can significantly affect the precision of results is the
procedure in which the vibrating hammer compaction test is conducted. Each standard
sets out a different procedure in terms of the number of layers the sample is compacted,
the time period of hammer operation and the different parameters measured during the
test.
The NZS 4402 Test 4.1.3 achieves compaction in two layers to ensure effective
compaction throughout the depth of the sample. The first layer which approximately half-
fills the mould is compacted by the vibrating hammer for 180 ±5 seconds. The hammer is
then removed and an additional layer of the sample is added, enough to protrude into the
extension collar of the mould. The sample is then compacted by the vibrating hammer for
a further 180 ± 5 seconds. The mass of the mould and sample, and the height of the
sample are two of the main measurements which are recorded during the test for
calculation purposes.

Chapter 5.Review of Methodologies
60
The ASTM D 7382 standard, as mentioned earlier, specifies two methods – Method A
and Method B. This research deals with an aggregate which contains more than 30% by
mass retained on the 19.0 mm sieve, this is a case which only conforms to method B of
the ASTM D 7382 standard. Hence, only Method B will be discussed and used for
comparison. The ASTM D 7382 Method B uses a large 279.4 mm diameter mould to
prevent interlocking of particles during compaction. Since the permissible maximum
particle size in this method is around 50 mm, a small 152.4 mm diameter mould may
cause these large particles to interlock against each other and the inner walls of the mould
which consequently interferes with effective compaction of the sample. Method B
specifies that the sample be compacted in 3 layers. The specified tamper used cannot
cover the full surface of this large mould of 279.4 mm diameter; thus each layer is
compacted in 8 locations, as shown in Figure 5-1, for 52 ± 5 seconds at each location.
The BS EN 13286 test standard also specifies two methods as mentioned earlier. The
method that is suitable for the material used in this research specifies that compaction be
done in one single layer. The hammer is applied to the sample for a period of 180 ± 5
seconds.
Figure 5-1: Sequence of 152 mm Tamper Positions in 279.4 mm Mould (ASTM D
7382 - 08, 2008)

Investigation of the Variability in the Results of the NZ Vibrating Hammer Compaction Test
61
5.6 Summary
This chapter reviewed the New Zealand Standard for the vibrating hammer compaction
test with international standards. The United Kingdom and United States of America
employ similar test methodologies for the compaction of cohesionless material. As a part
of the investigation in the variability of the results in the New Zealand vibrating hammer
compaction test, it was suggested to compare this standard with international standards.
The comparison proved that differences do exist with the New Zealand Standard. The
testing and analysis of results will help in determining whether these differences in the
New Zealand Standard are the reason for the variability in the results.
Important differences that exist in the New Zealand Standard include:
The NZS allows for particles up to 37.5 mm to be compacted in a 152 mm
diameter mould. Whereas the USA and UK standards specify special methods
for particles larger than 19 mm.
Procedural differences such as compacting the sample in two layers in the
NZS rather than 3 layers as in the USA method, or a single layer as in the UK
method.
Curing time subsequent to wetting the samples differs in each standard. The
NZS specifies a curing time of at least 16 hours. While the USA standard
specifies only 30 minutes. The United Kingdom standard specifies a curing
period of 12 hours.


Chapter 6. ADOPTED RESEARCH
METHODOLOGY
6.1 Introduction
This chapter describes the methodology adopted to conduct this research and perform
testing in order to achieve the specified objectives stated in Section 1.2. Two different
tests were conducted to achieve a sound and scientific understanding of the variability in
the results of the New Zealand vibrating hammer compaction test. Each test focused on
one aspect of the two possible contributing factors, these are:
Variability Due to Vibrating Hammer Compaction Test Conditions – The
test methodology used is largely based on the NZS 4402:1986 Test 4.1.3
“New Zealand vibrating hammer compaction test” with a few minor
modifications applied to help reduce inconsistencies in the results.
Variability Due to Aggregate Property Variation – The X-ray diffraction
method was utilised to provide results (such as aggregate property and
mineral constituents) regarding the material being used in the test.
In addition to these two tests, quality control tests were also performed to ensure that the
aggregate being used in this research maintained an acceptable level of quality.
6.2 Research Tasks
To meet the primary objective of determining an understanding of the variability in the
results of the vibrating hammer test the following research tasks were implemented.
1. Grasp a Deeper Understanding of the Problem – The first step was to obtain a
better and much deeper understanding of the problem at hand. This was done in a
number of ways:
A review of existing literature available.
Seeking advice of personnel who have experience and have dealt with
the test in question.

Chapter 6.Adopted Research Methodology
64
Analysis of raw data provided by Opus from similar research conducted
in the past.
2. Quality Control Tests – Conduct aggregate property tests such as strength and
durability tests on the source aggregate to ensure an acceptable level of quality is
maintained.
3. XRD Analysis – Perform X-ray Diffraction analysis on the aggregate being used
in this research to determine if there was any major variability in the properties
and mineral composition of the aggregate that could explain any significant
variation from one test result to another.
4. Adopt an Experimental Methodology for the Vibrating Hammer Compaction
Test – Perform a thorough comparison of the New Zealand Standard for the
vibrating Hammer Compaction Test (NZS 4402 : 1986 Test 4.1.3 New Zealand
vibrating hammer compaction test) with other international standards such as the
British Standard (BS EN 13286-4:2003 Part 4: Test methods for laboratory
reference density and water content – Vibrating hammer) and American Standard
(ASTM D 7382 – 07 Standard test methods for determination of maximum dry
unit weight and water content range for effective compaction of granular soils
using a Vibrating Hammer). Adopt a modified experimental procedure based on
the comparison of these standards to use for testing.
5. Calibration of Apparatus – Perform necessary calibration tests on all apparatus
used (such as hammer, scales, moulds, timers, straight edges etc.) to control
variability due to equipment.
6. Hammer Power Output Test – Devise a test which measures the power output
of the vibrating hammer and use it to measure the output before any compaction
tests were conducted and then after compaction testing was completed.
7. Perform Vibrating Hammer Compaction Tests – Conduct multiple vibrating
hammer compaction tests at various Water Contents until a sufficient number of

Investigation of the Variability in the Results of the NZ Vibrating Hammer Compaction Test
65
tests were reached to enable reliable statistical analysis of the results. Sub-tasks in
this step included:
Keeping as many test factors constant (such as hammer type, mould size
etc.), to determine the minimum natural variability of the test method.
Conduct the vibrating hammer compaction test using a more powerful
hammer than the one initially used and compare results between the two
hammers.
Conduct a Standard Proctor compaction test on the same aggregate and
compare results with the vibratory hammer compaction test results.
Conduct a Modified (heavy) Proctor compaction test and compare the
results with the vibrating hammer compaction test results.
8. Evaluation and Analysis of Test Results – Statistically analyse test results
obtained by utilising the statistical analysis software SPSS. Manipulate test
results to graphically show trends and correlations.
9. Presentation and Conclusion of Findings – Report findings and provide
conclusions and recommendations based on the analysis of results.
6.3 Quality Control
Quality control tests were carried out to ensure the aggregate being tested was up to the
specified acceptable standard to be used as a basecourse aggregate. This phase was
carried out before any compaction testing took place. It was also hoped to carry out these
tests regularly as the compaction tests were underway to maintain a certain standard of
quality, however due to the length of time it takes to conduct these tests and considering
the time constraints for this research, this was not possible. The brief outline of each
quality control test is described in Section 3.2.
6.4 Vibrating Hammer Compaction Test Methodology
6.4.1 Introduction
The adopted test method is largely based on the New Zealand Standard method (NZS
4402:1986 test 4.1.3 “New Zealand vibrating hammer compaction test.”). It was

Chapter 6.Adopted Research Methodology
66
developed progressively throughout the practice runs of testing. Initially, it was decided
to adhere to the NZS 4402 Test 4.1.3 as much as possible and carry out the steps stated in
the NZS 4402 Test 4.1.3 precisely. The reason for following the NZS 4402 Test 4.1.3
closely was to investigate the variation and suggest a revision of the current test method.
However, during practice tests carried out by the researcher, a few minor modifications
were suggested to keep variation to a minimum and enable consistent testing.
The degree of accuracy of data analysis relies heavily on the amount of data available.
For research projects of this nature, where variation in results for a particular test method
is investigated, repeating the test to acquire a considerable amount of data is desirable.
However, due to time constraints, it was advised that the test be conducted forty times,
which is considered an acceptable number of repeats to ensure that the statistical data
analysis is reliable.
The adopted experimental procedure used to carry out the laboratory vibrating hammer
compaction test is described below.
6.4.2 Scope
This test method is used for determining the dry density of granular soils, passing a
37.5mm sieve, by the use of a vibratory hammer over a range of Water Contents. The Dry
Density will then be used to calculate the MDD and OWC.
6.4.3 Apparatus
The apparatus used to conduct the tests are described below.
Mould
The New Zealand vibrating hammer compaction test standard specifies an allowable
internal diameter of 152 mm ± 0.5 mm and an adequate depth to provide a specimen
height of 125 to 127 mm.
The NZS 4402 Test 4.1.3 also suggested that perforations be present in the base of the
mould, however, consequent to practice tests conducted using the perforated base mould,
it was recommended that a non-perforated base mould be used for actual testing due to
the significant amount of water escaping through these perforations. As discussed in
Section 2.1, compaction is defined as the expulsion of air voids from the aggregate by the
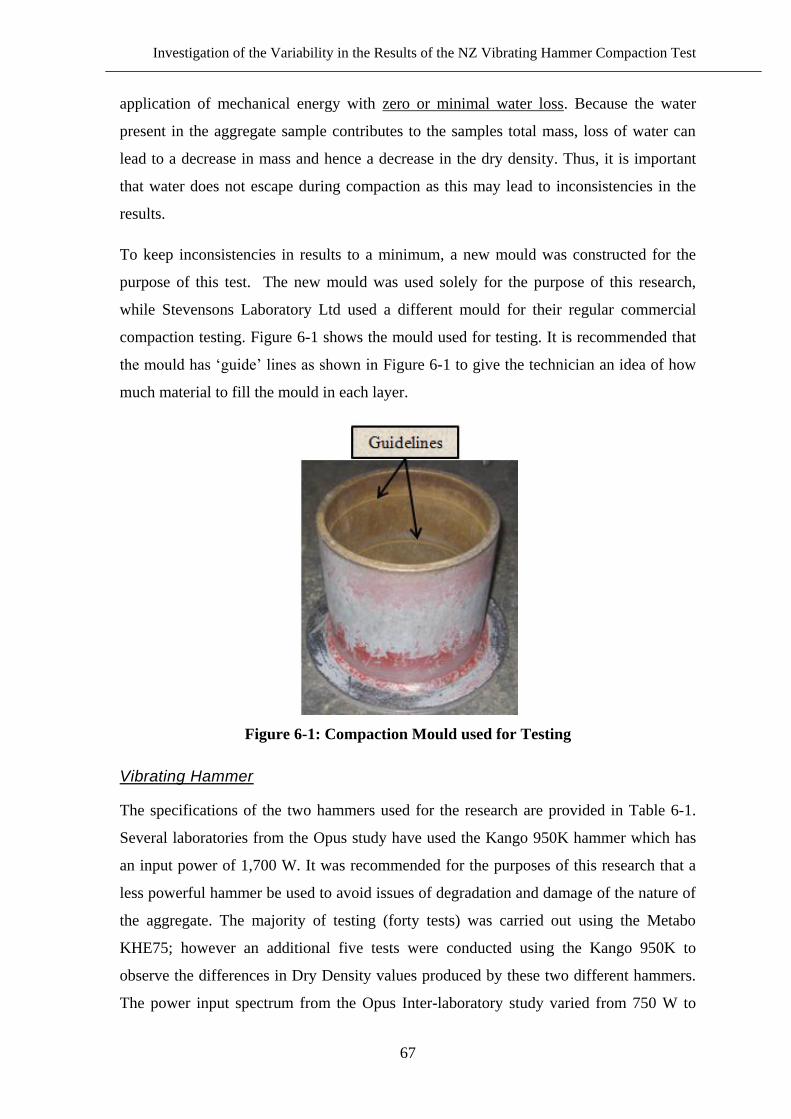
Investigation of the Variability in the Results of the NZ Vibrating Hammer Compaction Test
67
application of mechanical energy with zero or minimal water loss. Because the water
present in the aggregate sample contributes to the samples total mass, loss of water can
lead to a decrease in mass and hence a decrease in the dry density. Thus, it is important
that water does not escape during compaction as this may lead to inconsistencies in the
results.
To keep inconsistencies in results to a minimum, a new mould was constructed for the
purpose of this test. The new mould was used solely for the purpose of this research,
while Stevensons Laboratory Ltd used a different mould for their regular commercial
compaction testing. Figure 6-1 shows the mould used for testing. It is recommended that
the mould has „guide‟ lines as shown in Figure 6-1 to give the technician an idea of how
much material to fill the mould in each layer.
Figure 6-1: Compaction Mould used for Testing
Vibrating Hammer
The specifications of the two hammers used for the research are provided in Table 6-1.
Several laboratories from the Opus study have used the Kango 950K hammer which has
an input power of 1,700 W. It was recommended for the purposes of this research that a
less powerful hammer be used to avoid issues of degradation and damage of the nature of
the aggregate. The majority of testing (forty tests) was carried out using the Metabo
KHE75; however an additional five tests were conducted using the Kango 950K to
observe the differences in Dry Density values produced by these two different hammers.
The power input spectrum from the Opus Inter-laboratory study varied from 750 W to

Chapter 6.Adopted Research Methodology
68
1,700 W. Thus, the Metabo KHE75 approximately falls in the middle of this spectrum.
Therefore, the compactive effort provided by the Metabo hammer is neither too high nor
too low, this will consequently help in obtaining average dry density values that are not
disadvantaged the by application of significantly low or high compactive efforts.
Unfortunately, the hammer calibration method incorporated into the NZ vibrating
hammer compaction test in the New Zealand Standards, is a heavily criticised and broad
method which only specifies a minimum limit on the permissible hammers used in the
test (Frobel & Moulding, 2006). Therefore, although the standard does not specify an
upper limit, a hammer with an appropriate level of power input must be selected, due to
the fact that significantly more powerful hammers can easily degrade the sample being
compacted, leading to additional problems in the variation of results.
Table 6-1: Properties of the Vibrating Hammers used in Testing
Hammer
Model
Input Power,
(W)
Output Power
(W)
Power/blow
(J)
Weight
(kg)
Metabo KHE75 1,150 690 10 6.4
Kango 950K 1,700 850 7 - 27 11.8
The Metabo KHE75 and Kango 950K vibrating hammers are shown in Figure 6-2. The
tampers used in each hammer are of similar dimensions and weight and are designed as
per the specifications stated in the NZ vibrating hammer compaction test standard, where
the diameter of the tamper is 145 mm and its weight does not exceed 3 kg. As shown in
Figure 6-2, the Kango hammer is much larger than the Metabo hammer. These two
hammers impose different surcharge loads on the sample due to the differences in their
weight as shown in Table 6-1. The differences in imposed loads can affect the
consistency of the test results. The Kango hammer is much heavier at 11.8 kg than the
Metabo hammer which is only 6.4 kg. However, combined with the surcharge load in the
hammer frame, both of these hammers are within the NZS 4402 Test 4.1.3 imposed load
specification limits of 30 to 40 kg (350 ± 50 N) (New Zealand Standards, 1986b).

Investigation of the Variability in the Results of the NZ Vibrating Hammer Compaction Test
69
Figure 6-2: Vibrating Hammers used in Testing
Other equipment
Associated apparatus that are needed for conducting the tests include:
A balance that is readable and accurate to 10 grams
A timer that is readable and accurate to 1 second
Trays with various sizes ranging from 600mm x 500mm x 80mm to smaller sized
trays of roughly 300mm x 300mm x 80mm
Heavy grade plastic bags
Commercial drying oven capable of heating up to 110ºC, and
A soundproof cabinet is recommended to conduct the test in.
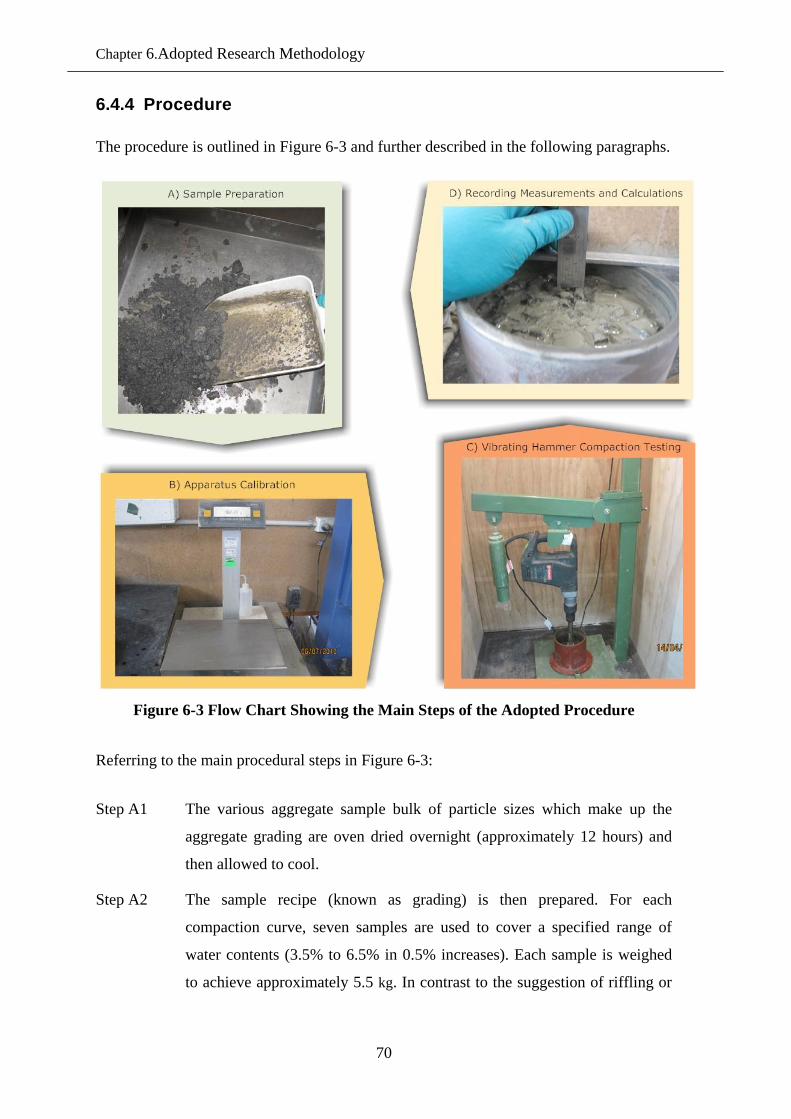
Chapter 6.Adopted Research Methodology
70
6.4.4 Procedure
The procedure is outlined in Figure 6-3 and further described in the following paragraphs.
Figure 6-3 Flow Chart Showing the Main Steps of the Adopted Procedure
Referring to the main procedural steps in Figure 6-3:
Step A1 The various aggregate sample bulk of particle sizes which make up the
aggregate grading are oven dried overnight (approximately 12 hours) and
then allowed to cool.
Step A2 The sample recipe (known as grading) is then prepared. For each
compaction curve, seven samples are used to cover a specified range of
water contents (3.5% to 6.5% in 0.5% increases). Each sample is weighed
to achieve approximately 5.5 kg. In contrast to the suggestion of riffling or
Investigation of the Variability in the Results of the NZ Vibrating Hammer Compaction Test
71
quartering as specified in the New Zealand Standard for the vibrating
hammer compaction test, the adopted procedure makes each sample grading
from scratch to help minimise the effect of segregation.
Step A3 The seven samples which are prepared according to the specified grading
are then wetted to the chosen range of Water Contents (which are 3.5%,
4.0%, 4.5%, 5.0%, 5.5%, 6.0%, and 6.5%).
Step A4 Each wetted sample is then placed in a heavy grade plastic bag, which is
sealed to reduce air space between the sample and the bag to minimize the
problem of condensation. The samples are left to cure overnight in a cool
place away from direct sunlight for a recommended period of 16 hours.
Note that it is important to stay consistent in this step by giving all samples
the same amount of time for curing.
Step B1 Ensure that the apparatus assembly is perfectly clean and dry. Determine to
the nearest 0.5 mm the average internal diameter of the mould and record.
Step B2 Place a straight-edge across the top of the surface of the mould and measure
the depth from the straight-edge to the bottom of the mould using a steel
ruler. Take at least six readings around the mould and calculate the mean
height and record.
Step B3 Weigh the mould to the nearest 10 g and record.
Step C1 The mould is then placed onto the base of the loading frame with the
vibrating hammer drawn aside to allow free access to the mould.
Step C2 Empty one sample into a tray and thoroughly mix to help minimize
segregation, and scoop enough of the material to half fill the mould when
compacted (the first guide line shown in the mould in Figure 6-1 represents
the „half fill‟ mark). It is important to take extra care when scooping the
sample into the mould to ensure segregation is kept to a minimum.
Step C3 Place the vibrating hammer with the tamper inside the mould so that the
vibrating hammer is in position for operation. Operate the vibrating
hammer for 180 seconds. Then remove the vibrating hammer and tamper
from the mould.
Step C4 Add another layer of the aggregate sample, ensuring to scoop enough
Chapter 6.Adopted Research Methodology
72
material into the mould so that when compacted, the specimen just
protrudes the second guide line in the mould. Repeat Step C3.
Step C5 Remove the mould from the loading frame and clean, with a dry cloth, any
sample particles from the outside of the mould.
Step D1 Adopt a consistent measurement approach to measure the height of the
sample in the mould. That is to say, measure the height of every sample in
approximately the same six locations every time, to avoid inconsistency in
results. Place a straight edge across the top surface of the mould and
measure, to the nearest 0.5 mm, the depth from the straight-edge to the
surface of the specimen. Take at least six readings from six different
locations around the mould and record.
Step D2 Weigh the mould complete with the specimen to the nearest 10 g and
record.
Step D3 Remove the compacted specimen from the mould and place it in a small
pre-weighed tray. Immediately take a portion over the full height of the
specimen and determine the Water Content as specified in the NZS 4402
Test 3.1 “The Water Content of Aggregate” (New Zealand Standards,
1991a).
Step D4 Perform calculations to determine Water Content – Dry Density curve as
specified in the NZS 4402 test 4.1.3 “New Zealand vibrating hammer
compaction test” (New Zealand Standards, 1986b).
6.5 X-ray Diffraction Test Methodology
6.5.1 Sample Preparation
The source aggregate was examined and split into three different types. Each type
represented aggregates with a similar physical appearance and particle size. Figure 6-4
shows the three different types.

Investigation of the Variability in the Results of the NZ Vibrating Hammer Compaction Test
73
a) Rock type A – Fine Siltstone
b) Rock type B – Sandstone
c) Rock type C – Green Appearance
Figure 6-4: Different Rock Types used in X-ray Diffraction Test
Two types of samples are usually required for the X-ray diffraction test. Each type
requires a slightly different method in sample preparation. These methods will be
discussed below.
Bulk or Random Orientation Sample
This type of sample is used to identify the mineral constituents of the aggregate and also
to determine the proportion of minerals in the aggregate. The methodology used in
preparation of this type of sample is as follows:
1. The aggregate which contains coarse chips is reduced in grain size by crushing it
in a Rocklabs steel ring mill.
2. The Rocklabs steel ring mill should not be used to powder the sample as this may
damage and distort the mineral grains in the sample. Instead, the sand sized
sample is hand powdered in a pestle and mortar.
3. The powder is then loosely packed into an aluminium holder. Care should be
taken when packing the powdered sample, it should not be pressed as this may
risk damaging and orienting the mineral grains in the sample.
Chapter 6.Adopted Research Methodology
74
4. Once packed into the aluminium holder, the sample is then ready to be inserted
into the X-ray diffractometer.
Oriented Sample
These samples are used to determine the nature of the clay minerals. The sample
preparation procedure is as follows:
1. The powdered bulk sample can be used for this method.
2. Approximately 1.5 ml of the powdered sample is deposited into a plastic test tube.
3. The tube is then filled with distilled water and hand shaken until the sample is
completely dispersed in the distilled water.
4. The tube is then left to settle for approximately 20 – 30 minutes. Subsequently, a
portion is drawn off from the top 2 ml of the test tube and carefully deposited onto
a glass slide and allowed to spread over an area of around 20 mm in diameter.
5. The glass slide is then air dried in a dust-free environment to allow the clay
particles in the sample to sediment onto the glass slide.
6. The oriented sample is X-rayed three times. Initially as an untreated sample.
Followed by another X-ray on the now glycolated sample. And finally the
glycolated sample is heated at 550ºC for at least an hour before it is X-rayed for
the last time. Performing the X-ray on the glycolated sample allows for the
identification of zeolites present in the aggregate which usually cause volume
changes such as swelling. Swelling is an unwanted phenomenon in aggregate
properties as it negatively affects the performance of the aggregate. The final X-
ray on the heated sample reveals the collapsed dehydrated basal layer of the clays.

Investigation of the Variability in the Results of the NZ Vibrating Hammer Compaction Test
75
6.5.2 Experiment Set-up
Figure 6-5 Professor Philippa Black Conducting an XRD Analysis on the Source
Aggregate
The set-up of the experiment is shown in Figure 6-5. The goniometer is computer
controlled and data is obtained by using the XRD software. After inserting the sample
slide into the diffractometer, a printout is outputted from the computer.

Chapter 7. TEST RESULTS AND DISCUSSION
7.1 Aggregate Property Test Results
Results of the conducted quality control tests will be presented and their significance
discussed in this Chapter. A number of different tests have been carried out to identify the
physical properties and mineral composition of the aggregate being used for testing. The
analysis of these test results is imperative to better understand the level of quality of the
source aggregate being used for testing. The classification of the aggregate property tests
will be similar to that in Section 3.2.2 where tests fall under “Source Property Tests” or
“Production Property Tests”, depending on the nature of the test.
7.1.1 Source Property Tests
Crushing Resistance
The TNZ M/4 basecourse specification states that the test should done under a load of
130 kN where fines passing the 2.36 mm sieve as a result of the load application must be
less than 10% to deem the aggregate of acceptable strength. The test returned a result of
0.5% of fines passing the 2.36 mm sieve under the specified 130 kN load. This result
indicates that the source aggregate being used for testing is of high strength quality,
however during the vibrating hammer compaction tests, slight degradation to the
aggregate was visually observed.
Weather Quality
Figure 7-1 shows the results obtained from the weathering quality tests conducted. The
graph displays the different indices based on the cleanness value and percentage of
sample material retained on the 4.75 mm sieve. The TNZ M/4 specification for
basecourse aggregates allows weathering quality values of AA, AB, AC, BA, BB or CA.
Thus, the results obtained for weathering quality are „AA‟ as shown by the highlighted
cell in Figure 7-1. The aggregate displays an extremely high resistance to environmental
effects. In comparison with the specification, the aggregate obtained the highest
permissible weathering quality index of „AA‟ with a cleanness value of 98 with 98% of
particles being retained on the 4.75mm sieve. Before the oven drying process, the bulk

Chapter 7.Test Results and Discussion
78
material used for the vibrating hammer compaction test was left outside due to space
constraints in the laboratory. Thus, weathering of the material was a concern, however the
results shown here indicate that the material is highly resistant to environmental effects
(such as wetting, drying, heating and cooling). Hence, these results imply that
environmental effects on the source aggregate that has been left outside should not be a
concern as the aggregate appears to be highly resistant to the environmental effects. In
saying that, concern has been expressed regarding the weathering quality test, as it is
believed that it does not reflect real environmental weathering conditions. Weathering
effects should nevertheless be controlled as best as possible in laboratory testing to help
reduce inconsistencies in results.
Figure 7-1: Weathering Quality Results
California Bearing Ratio
Table 7-1 summarises the results obtained from the California Bearing Ratio test and also
the specifications that the results must meet in order to pass the test. As can be seen the
minimum permissible CBR for a material being used as a basecourse layer is 80%, the
result obtained is well above that at 275%. The CBR test provides an idea of the strength
of the material being tested and in this case the source aggregate is considered high
quality having a relatively high strength characteristic.

Investigation of the Variability in the Results of the NZ Vibrating Hammer Compaction Test
79
Table 7-1: California Bearing Ratio Results
Detail Results Specification
Period of Soaking (days) 4 Minimum 4
Compacted Dry Density (t/m³) 2.24 -
Compacted Water Content (%) 5.0 -
Soaked Water Content (%) 5.9 -
Rate of Penetration (mm/min) 1 1
Depth CBR Recorded (mm) 5.0 0
California Bearing Ratio CBR 275% Minimum 80%
7.1.2 Production Property Tests
Sand Equivalent
The TNZ M/4 specification for basecourse aggregates specifies that the Sand Equivalent
Index achieved must be above 40 for the aggregate to be compliant. The result obtained
from the test was 51, considering the minimum limit is 40, this result is deemed above
satisfactory.
Clay Index
The fraction of the aggregate passing the 75 µm sieve shall have a clay index value of less
than 3 in order to be compliant to the TNZ M/4 specification for basecourse aggregates.
The result obtained from this test method is 0.7; this is relatively low compared to the
specification value.
Plasticity Index
The plasticity index of the fraction of aggregate passing the 425µm sieve shall not be
greater than five according to the TNZ M/4 specification. The result obtained for this test
is five. The result is barely complies with the limit specified. However, the TNZ M/4
specification states that in order for compliance, the aggregate being tested shall pass at
least one of the three tests (Sand Equivalent, Clay Index or Plasticity Index). Thus, even
though the result barely passes the specification stated, it has already complied with the
other two tests mentioned above.

Chapter 7.Test Results and Discussion
80
Broken Face Content
Table 7-2 summarises the results obtained from the Broken Face Content test. The results
achieved are 100% for all fractions exceeding the specified 70% minimum stated in the
TNZ M/4 specification. 100% Broken face content for all particle fractions is considered
very good. The angularity and broken faces of particles helps to define its performance
when compacted. As these irregularly shaped aggregates are compacted, they provide a
much stiffer structure than aggregates with a lower broken face content.
Table 7-2: Broken Face Content Results
Sieve Fraction (mm) Results (%) Specification (%)
>37.5 - -
19 – 37.5 100 Minimum 70
9.5 – 19 100 Minimum 70
4.75 – 9.5 100 Minimum 70
Particle Size Distribution
The particle size distribution is sometimes referred to as the grading of the aggregate.
Grading has a major effect on the performance of the aggregate. Figure 7-2 shows the
grading of the aggregate used for testing as well as the upper and lower limits specified
by the TNZ M/4 basecourse specification. The dotted line (which represents the grading
of the aggregate) lies between the upper and lower specified limits. Table 7-3 provides
more detailed information regarding the results obtained. As can be seen, the results are
always within the limits specified at each aggregate fraction. Keeping a constant
grading/particle size distribution throughout the vibrating hammer compaction tests was a
vital step to ensuring the consistency in end results.

Investigation of the Variability in the Results of the NZ Vibrating Hammer Compaction Test
81
Figure 7-2: Source Aggregate Particle Size Distribution
Table 7-3: Shape Control of Source Aggregate
Fraction (mm) Result (mm) Specification (mm)
19 – 4.75 33 28 – 48
9.5 – 2.36 21 14 – 34
4.75 – 1.18 20 7 – 27
2.36 – 0.600 16 6 – 22
1.18 – 0.300 12 5 – 19
0.600 – 0.150 8 2 – 14
0
10
20
30
40
50
60
70
80
90
100
0.0 0.1 1.0 10.0 100.0
Sie
ve
Pa
ss
ing
(%
)
Sieve Size (mm)
Particle Size Distribution
TNZ M/4 Upper Limit [%] TNZ M/4 Lower Limit [%] Mix Design - UoA

Chapter 7.Test Results and Discussion
82
7.2 Vibrating hammer compaction test results
7.2.1 Data Selection
Statistics were used to analyse and determine the extent of variation in the results
obtained from testing. Data was analysed in various ways in an attempt to better
understand the causes of variation. In addition to this research‟s data, the raw data of the
Opus inter-laboratory investigation was also included in the analysis to better understand
and compare results.
Although forty vibrating hammer compaction tests have been conducted, initial analysis
of the data has shown that the first ten test results exhibited a considerably larger
variation than the rest of the data as can be seen in Figure 7-3. Consequently, a decision
was made to exclude the first ten test results from the data analysis. The exclusion of the
first ten tests can be justified by the fact that the researcher was initially inexperienced
and unfamiliar with the test. After approximately ten tests, results show that the
researcher began to gain confidence and progressively improved whilst initially
conducting the test.
Figure 7-3: Contribution (by Percentage) of each Group of 10 Tests to the Total
Variation
Figure 7-3 shows that Tests 1 to 10 contribute approximately 40% of the total variation of
the test. This is an unrealistically high contribution; the inexperienced researcher is more
37.8
23.1 21.0
18.1
0
10
20
30
40
50
Tests 1 to 10 Tests 11 to 20 Tests 21 to 30 Tests 31 to 40
Co
ntr
ibu
tio
n t
o V
ari
ati
on
(%
)
Contribution (by Percentage) of each Group of 10 Tests to the Total Variation

Investigation of the Variability in the Results of the NZ Vibrating Hammer Compaction Test
83
likely to make errors than a technician who is experienced. Thus, the inclusion of the first
ten tests in the analysis could falsely represent the actual variation present within the test
method. Tests 11 to 40 all seem to be contributing a relatively equal amount of variation
indicating the true and natural variation of the test method.
7.2.2 Overall Variation – Scatter / Box and Whisker Plot
The natural variation in the vibrating hammer compaction test is shown in Figure 7-4.
The 2.0% WC data from the Opus Round Robin study have been included in Figure 7-4
for comparison purposes. The data appears to follow the general trend shown in Figure
2-6 where the Dry Density exhibits an initial peak at dry conditions (in this case at 2.0%
WC since data for 0% WC was not available). This was then followed by a decrease in
the Dry Density at intermediate WC levels and finally a gradual increase again in the Dry
Density as the WC increases until saturation (Zero Air Voids) creating another peak at
approximately 6.5% WC. The phenomenon of bulking appears to be taking place as
supported in the literature review in Section 2.3.2.
This variability in the aggregate source is quite large considering that as many factors that
could possibly affect the test have been kept constant. Thus, the variation, which is
represented by the spread of the points at each Water Content shown in Figure 7-4
represents the natural variation of the New Zealand vibrating hammer test method.
Natural sources such as the test method itself and/or the natural variability in the
aggregate properties are to be held responsible for the observed variability.
The variability (excluding that from the Opus data at 2.0% WC) appears to be increasing
as the WC increases. This can be explained by the increase in the amount of „splashing‟
of water and material as the WC increased. As the sample gets wetter it becomes difficult
to compact without some loss of material and/or water. This loss contributes to a decrease
in mass and hence a variation in results. The New Zealand Standard for the vibrating
hammer compaction test method specifies mould and tamper sizes such that there is a gap
between the tamper and inner walls of the mould that is approximately 3.5 mm. Although
the reason for this gap is not mentioned in the New Zealand Standard, it could simply be
the specified gap prevents rubbing between the tamper and inner walls of the mould
which can cause interference to the compaction process. However, the issue with the gap

Chapter 7.Test Results and Discussion
84
between the tamper and inner walls of the mould is that it allows material and/or water to
escape during compaction as shown in Figure 7-6.

Investigation of the Variability in the Results of the NZ Vibrating Hammer Compaction Test
85
Figure 7-4: Variation of Vibration Hammer Compaction Test
1.9
2.0
2.1
2.2
2.3
2.4
2.5
0.0 1.0 2.0 3.0 4.0 5.0 6.0 7.0 8.0 9.0 10.0
Dry
De
ns
ity (
t/m
³)
Water Content (%)
Variation of the Vibrating Hammer Compaction Test
Zero Air Voids Line
2.0% WC OPUS
3.5% WC
4.0% WC
4.5% WC
5.0% WC
5.5% WC
6.0% WC
6.5% WC
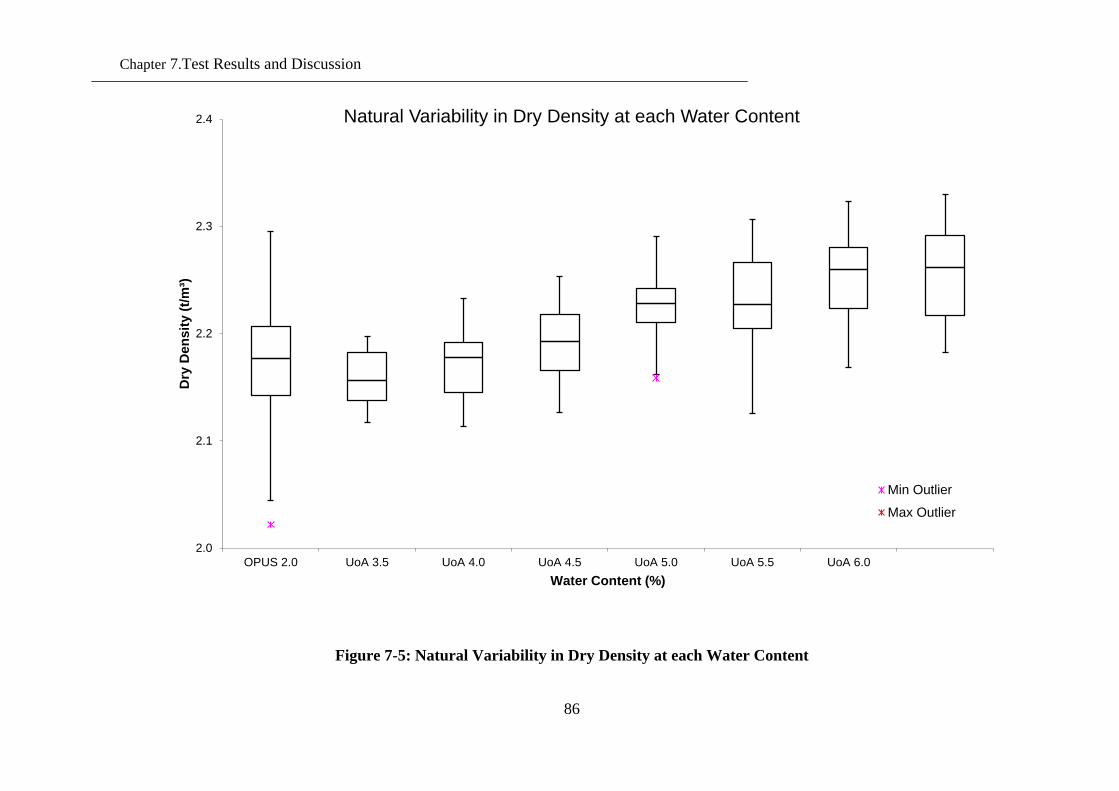
Chapter 7.Test Results and Discussion
86
Figure 7-5: Natural Variability in Dry Density at each Water Content
2.0
2.1
2.2
2.3
2.4
OPUS 2.0 UoA 3.5 UoA 4.0 UoA 4.5 UoA 5.0 UoA 5.5 UoA 6.0
Dry
De
ns
ity (
t/m
³)
Water Content (%)
Natural Variability in Dry Density at each Water Content
Min Outlier
Max Outlier

Investigation of the Variability in the Results of the NZ Vibrating Hammer Compaction Test
87
The apparatus used in the British Standard on the other hand, completely surrounds and
contains the sample in place to prevent any loss of material and/or water during
compaction. The tamper (otherwise known as anvil in the BS) is in contact with the inner
walls of the mould and does not allow any gaps and provides full confinement to the
sample. A cross sectional diagram of the apparatus used in the BS is shown in Figure 7-7;
a similar apparatus should be considered in the New Zealand Standard as even a minor
loss of material and/or water can cause significant variation in the end result due to the
change in mass.
Figure 7-6: Effect of the Gap between the Tamper and the Mould on the Loss of
Water and/or Material
Whilst it is difficult to measure, phenomena such as segregation and degradation were
visually noted during compaction. It is unknown whether segregation and degradation
contributed to the variation observed in the results and if so to what extent. This should be
investigated in future research. According to past research segregation is inevitable during
the compaction process, however as mentioned in Section 4.2.2 it can be substantially
reduced by applying an adequate amount of surcharge weight.
The large variability in the Opus data at 2.0% WC is mostly contributed to the nature of
the study. The Opus round robin study involved thirty three different laboratories and
therefore the larger variation can be explained by the different technicians and equipment
used by each laboratory.

Chapter 7.Test Results and Discussion
88
As can be seen from Figure 7-4, some points at 6.5% WC have crossed the Zero Air
Voids (ZAV) line which is theoretically impossible. This could be due to human error
during the compaction test.
Figure 7-7 Cross -section of Mould and Tamper Apparatus used in BS 5835 (BS
5835, 1980)
Although the range of variability in DD only appears to be quite small (approximately
0.15 t/m³) minor uncertainties in the DD is largely pronounced in the degree of
compaction achieved.
The Dry Density variability at each Water Content is represented by a box and whisker
plot in Figure 7-5. The medians (and means, as are shown in Table 7-4) are gradually
increasing as the WC increases. This follows the same trend presented in Figure 2-6 for
cohesionless material, where a relatively high increase in DD from intermediate WC to
high WC levels is noted. Followed by a minor increase in DD where the curve begins to
level off before reaching saturation.
The median at 5.5% is slightly lower than its preceding WC; this however, can be
explained by the large variability exhibited at this WC which seems to have caused the
median to reduce. The mean on the other hand, follows the general trend, where it is
larger than its preceding WC. The variability observed at 5.5% WC is slightly larger than

Investigation of the Variability in the Results of the NZ Vibrating Hammer Compaction Test
89
that of any other WC value. Although the reason behind this particularly large variability
at 5.5% WC is unknown, it could be due to a number of factors such as errors in test
procedures and recording of measurements at that particular WC. However, as seen in
Table 7-4 the coefficient of variation at 5.5% WC is not significantly larger than that for
6.0% and 6.5% Water Contents.
The spread of data at each Water Content shown in Figure 7-5 could be due to
interlocking of particles during the compaction process. The NZS standard for the
vibrating hammer compaction test method allows for particles of 37.5 mm to be
compacted in a 152 mm diameter mould. International standards such as the ASTM
standard for the vibrating hammer compaction test, consider these particles „oversized‟
and specify that for compaction of an aggregate with these oversized particles, a much
larger mould should be used. Moreover, the ASTM D 7382 specification states that
particles retained on the 19 mm sieve should be compacted in a 279.4 mm mould (ASTM
D 7382 - 08, 2008). The compaction of an aggregate which contains 37.5 mm particles in
a 152 mm mould could lead to the interlocking of these oversized angular particles.
Interference to the compaction process can occur once these particles interlock against
each other and the inner walls of the mould.
7.2.3 Comparison of Dry Density at 6% Water Content – Opus and
UoA
In the Opus Round Robin study, the same TNZ M/4 AP40 material as was tested in this
research at Water Contents of 2% and 6% was used. The UoA research however, tested
the TNZ M/4 material across a wider range of Water Contents. To observe the variability
between studies, a DD box and whisker graph has been plotted for both 6% Water
Contents (Figure 7-8).
As would be expected, the variability from the Opus Round Robin test is much greater
due to the fact that the study involved testing across a various number of laboratories
rather than just one laboratory as in the UoA study. As discussed in chapter 4, the same
test being conducted in different laboratories can yield significantly variable results due to
the different equipment being used, different technicians and variations in test
methodologies used in conducting the test.

Chapter 7.Test Results and Discussion
90
Figure 7-8: Comparison of Dry Density at 6% WC - Opus vs. UoA
If it is assumed that the variability observed in the UoA 6% WC is explained by the
natural variability present within the test method and natural variability in the source
aggregate, Figure 7-8 shows that an approximated 30% (ratio of the size of the UoA box-
plot to the size of the Opus box-plot) of the variability can be contributed to the natural
variability of the test method/source aggregate; this means factors such as unreliability in
test methods, and natural variability of the material are to be held accountable for 30% of
the total variation. The other 70% of the variation can be attributed to the variability in
different equipment used to conduct the test, the different technicians, and in general
between-lab variation.
The median in the UoA 6% WC is slightly higher than that obtained in the Opus 6% WC,
this could be due to the types of hammers used in both studies. The UoA research
conducted all tests by using the same hammer which had an input power of 1,150 W,
while the Opus study involved using a variety of different hammers with input powers
ranging from 750 W to 1700 W. Lower end power input hammers produce relatively low
1.8
1.9
2.0
2.1
2.2
2.3
2.4
2.5
2.6
2.7
Opus 6 UoA 6
Dry
De
ns
ity (
t/m
³)
Water Content (%)
Comparison of Dry Density at 6% WC - Opus vs. UoA
Min Outlier
Max Outlier

Investigation of the Variability in the Results of the NZ Vibrating Hammer Compaction Test
91
Dry Density values and hence hammers used in the Opus study with a relatively low input
power could be the reason for the decrease in the median in the results.
It is important to note that the majority of residual Water Contents of the Opus Study at
6% were considerably lower than 6%; in fact the average of residual water contents at 6%
was a low 4.9%. There has been considerable water loss during compaction in the Opus
study, although the UoA study has experienced problems with water loss during
compaction, an acceptable variance level of 0.3% was put in place, that is to say if the
sample had lost more than 0.2% of its water content during compaction then that result
was rejected a new sample compacted instead. Opus did not have a similar restriction in
place, and thus part of the variation experienced in the Opus data can be explained by this
highly variable residual Water Content.
7.2.4 Numerical Comparison of data
Table 7-4 provides statistical results based on the analysis of the raw test data. The
number of samples analysed from the UoA data was 30 samples at each WC after the first
initial ten tests were removed. The Opus data on the other hand, had tested 66 samples at
each WC.
By comparing the statistical range of values in Table 7-4, it can be seen that, as would be
expected, the ranges for the Opus data are significantly larger than any range obtained for
the UoA data. However, the comparison of the range value has its limits due to the fact
that it is defined as the difference between the maximum and minimum value, where
outliers in the data can influence this statistic significantly.
The standard deviation and Coefficient of Variation (CoV) provide a much more genuine
and accurate representation of the degree of variability in the data. Thus, by comparing
the standard deviation, it can be seen that the Opus data has values larger than that of the
UoA. The standard deviation in the UoA data appears to increase gradually as the WC
increases, however at 5.5% WC, the standard deviation is larger than WC values
subsequent to it. This was not expected from the results as it was thought that variation
tended to increase as the WC increased due to the fact that the wetter the sample gets the
more the problem of water splashing/loss of fine material during compaction was
pronounced. The CoV follows a very similar trend to the standard deviation in that there
is a gradual increase in CoV as the WC increases, with the same exception observed in

Chapter 7.Test Results and Discussion
92
the standard deviation at 5.5% WC where the CoV is slightly larger than its subsequent
WC values.
The mean values on the other hand, confirm the general trend (with no exceptions at 5.5%
WC) of a gradual increase in DD from intermediate levels of WC to high levels of WC
followed by a slow levelling off of the curve at approximately saturation levels (6.5%
WC).
The repeatability values shown in Table 7-4 for the UoA results (0.07 to 0.13 t/m³) are
quite large when compared to other repeatability studies by ASTM D 7382 and BS EN
13286 where repeatability values are 0.033 t/m³ and 0.05 t/m³ respectively. Since
repeatability values are based on tests conducted in the same laboratory, by the same
technician, using the same apparatus, a high repeatability value suggests a natural
variation in the test procedure or the aggregate being tested.
It was concluded in the Opus Interlaboratory study that the repeatability values vary with
the material being tested but are not significantly affected by the target water content.
Repeatability values for the TNZ material tested in the Opus study at 2% and 6% WC
were both 0.078 t/m³ (Opus International Consultants Limited, 2008). On the other hand,
the UoA results shown in Table 7-4 suggest otherwise, where repeatability values
increase as the Water Content increases.

Investigation of the Variability in the Results of the NZ Vibrating Hammer Compaction Test
93
Table 7-4: Statistical Parameters of Dry Density at each Water Content
Water
Content
(%)
Number of
Samples Range Minimum Maximum Mean
Standard
Deviation Skewness
Coefficient
of Variation
(CoV)
Repeatability
Opus
2 66 0.290 2.020 2.310 2.177 0.059 -0.040 0.027 N/A
6 66 0.770 1.930 2.700 2.248 0.113 1.289 0.050 N/A
UoA
3.5 30 0.080 2.118 2.198 2.159 0.026 -0.139 0.012 0.073
4.0 30 0.119 2.114 2.233 2.172 0.031 0.020 0.014 0.085
4.5 30 0.128 2.126 2.254 2.191 0.033 -0.190 0.015 0.091
5.0 30 0.132 2.158 2.290 2.226 0.031 -0.160 0.014 0.086
5.5 30 0.181 2.126 2.307 2.229 0.048 -0.243 0.022 0.133
6.0 30 0.155 2.168 2.323 2.255 0.042 -0.225 0.019 0.116
6.5 30 0.148 2.182 2.330 2.259 0.043 -0.140 0.019 0.120

Chapter 7.Test Results and Discussion
94
7.2.5 Sample Size needed to Achieve Target Confidence Interval
In Figure 7-9 a graph is shown that represents the number of samples required to be tested
in order to achieve a certain confidence limit. As would be expected, targeting a high
allowable error such as 10% yields a relatively low number of samples to be tested. On
the other hand, as the allowable error target decreases, that is to say as the precision target
of the test increases the number of samples rapidly increases following an exponential
behaviour.
Figure 7-9: Number of Samples needed to be Tested to Achieve a Desired Precision
All WC curves follow the same general trend with little difference in the quantity of
samples to be tested at each allowable error. As discussed previously, since the variability
at 5.5% WC is the largest, the curve experiences the most number of samples required to
be tested out of all other Water Contents at each allowable error. The rest of the curves
follow the logical trend of an increase in variation as the WC increases and therefore an
increase in the number of samples as the WC increases at each allowable error.
The curves shown in Figure 7-9 are based on the CoV values of each WC, thus, the
number of samples that should be tested to attain a certain target of precision in the test is
based on the UoA data. The number of samples to achieve only 90% precision in the test
0.0%
1.0%
2.0%
3.0%
4.0%
5.0%
6.0%
7.0%
8.0%
9.0%
10.0%
0 500 1000 1500 2000 2500 3000 3500 4000 4500 5000
All
ow
ab
le E
rro
r (%
)
Number of Samples to be Tested
Number of Samples to be Tested to Achieve a Certain Precision
3.5% WC
4.0% WC
4.5% WC
5.0% WC
5.5% WC
6.0% WC
6.5% WC

Investigation of the Variability in the Results of the NZ Vibrating Hammer Compaction Test
95
stands quite large at 50 samples. Hence, the variation associated with this test is
significant and a revision of the test method should be considered with further research.
7.2.6 Scatter of Opus Data with Respect to UoA 95% Confidence
Interval
Figure 7-10: Scatter plot of Opus 6% WC with Regards to 95% Confidence Interval
of UoA 6% WC
Figure 7-10 shows the scatter of the Opus data with reference to the upper and lower 95%
confidence limits of the UoA data.
As expected only a small portion of the Opus data falls within the upper and lower 95%
confidence limits of the UoA data. This proves that between-laboratory testing creates a
much higher variation than testing within a single laboratory. The variation observed by
the Opus data is mainly contributed to factors such as the differences in technicians
conducting the test, different hammers and moulds used. Although all technicians follow
the same test standard, each has their own ways of conducting the test according to their
interpretation of the test standard. Thus, this puts an emphasis on the importance of the
2.1
2.2
2.3
2.4
2.00 3.00 4.00 5.00 6.00 7.00
Dry
De
ns
ity (
t/m
³)
Water Content (%)
Opus Dry Density at 6% WC and 95% Confidence Limits of UoA 6% WC
6% WC Opus
Upper 95% ConfInterval 6% UoA
Lower 95% ConfInterval 6% UoA

Chapter 7.Test Results and Discussion
96
clarity of a test standard to avoid different interpretations by different laboratory
technicians.
This graph once more emphasises the degree of variability of the test if carried out in
different labs rather than just one lab. Only roughly around 10% of the Opus data falls
within the limits. The limits are based on the data obtained from the testing in this
research where 30 tests have been conducted under exactly the same conditions, thus, the
reason for the small gap between the two limits.
7.2.7 Effect of Different Compactive Efforts on Compaction
In addition to the thirty vibrating hammer compaction tests conducted, Standard Proctor
and Modified (heavy) Proctor tests were carried out along with an additional five
vibrating hammer compaction tests conducted with a much more powerful hammer than
the one initially used, as shown in Figure 7-11. These tests were carried out for
comparison purposes to observe the differences when conducting compaction in different
ways.
An average of every 5 tests from the total thirty tests of the initial hammer was taken. The
more powerful hammer (Kango 950K) has an input power of 1700 Watts which is 550
Watts more than the initial Metabo hammer used. The two hammers have passed the
calibration test specified in the NZS 4402 Test 4.1.3 test method. Yet both have produced
significantly different results as can be seen in Figure 7-11. The Kango-based tests
produced higher DD values as expected, as it is the more powerful hammer. There has
been growing criticism about the calibration test within the NZS vibrating hammer test
method due to the fact that it only specifies a minimum limit over the power of hammer
and not a maximum. Therefore, significantly more powerful hammers can be used for the
test since the test standard does not enforce a maximum limit. These powerful hammers
however, can easily cause degradation of the sample. A way forward to this problem is to
develop a correlation between the powers produced by field compactors and laboratory
hammers used for compaction. This will ensure the MDD obtained in the laboratory
better predicts the compaction achieved in the field at the same OWC specified by the
laboratory.
The results shown in Figure 7-11 align with what has been discussed in the literature
review. The application of a higher compactive effort yields higher Dry Density values as

Investigation of the Variability in the Results of the NZ Vibrating Hammer Compaction Test
97
shown in Figure 7-11. The Standard Proctor method applies the least amount of
compactive effort onto the sample and hence has yielded the lowest Dry Density results.
This is followed by the Modified Proctor method, which as discussed in Section 2.4.1
applies a greater amount of compactive effort than the Standard Proctor; this is evident by
the Dry Density values achieved which are higher than that for the Standard Proctor. The
vibrating hammer compaction test method is known to apply a greater compactive effort
than both of the Proctor tests; this is evident by the Metabo Dry Density values shown in
Figure 7-11. The Kango hammer is known to produce an even greater compactive effort
than that of the Metabo due to its powerful 1700 W power input. Evidently the Dry
Density values achieved by the Kango hammer are much higher than the Metabo
hammer.
The curves produced by the Metabo hammer appear to be erratic, while the Kango
hammer curves are considerably more consistent. This could be due to the fact that the
Metabo hammer is not delivering a sufficient amount of compactive effort on the sample
during compaction and hence not achieving the optimum Dry Density results. During the
testing phase at the Stevensons laboratory, there was a transition from using the Metabo
hammer to using the Kango hammer for the vibrating hammer compaction tests. This
change simply came about due to the fact that the Kango hammer produces much more
consistent results as opposed to the erratic curves produced by the Metabo hammer as can
be seen in Figure 7-11.

Chapter 7.Test Results and Discussion
98
Figure 7-11: Effects of Different Compactive Efforts on Compaction
1.8
1.9
2.0
2.1
2.2
2.3
2.4
2.5
2.6
2.7
2.8
0.0 1.0 2.0 3.0 4.0 5.0 6.0 7.0 8.0 9.0 10.0
Dry
De
ns
ity (
t/m
³)
Water Content (%)
Effect of different Compactive Efforts/Test Methods on Vibrating Hammer Compaction Test
Kango 1-5
Metabo 1-5
Metabo 6-10
Metabo 11-15
Metabo 16-20
Metabo 21-25
Metabo 26-30
Standard Proctor
Modified (Heavy) Proctor
ZAV
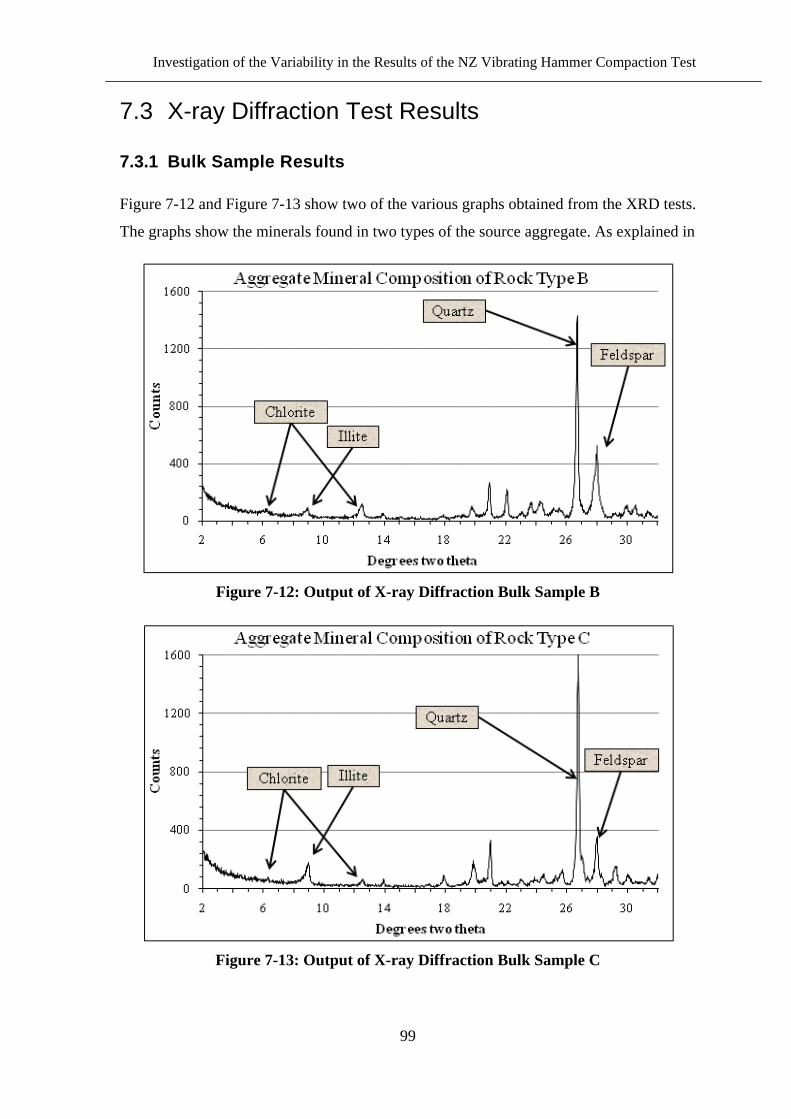
Investigation of the Variability in the Results of the NZ Vibrating Hammer Compaction Test
99
7.3 X-ray Diffraction Test Results
7.3.1 Bulk Sample Results
Figure 7-12 and Figure 7-13 show two of the various graphs obtained from the XRD tests.
The graphs show the minerals found in two types of the source aggregate. As explained in
Figure 7-12: Output of X-ray Diffraction Bulk Sample B
Figure 7-13: Output of X-ray Diffraction Bulk Sample C

Chapter 7.Test Results and Discussion
100
Section 6.5, the aggregate was classified into 3 types. Samples were grouped based on
their similar physical features. The two graphs shown in Figures 7-12 and 7-13 represent
XRD tests for Types B and C. The amount of minerals available within each type is
represented by the curves shown in Figure 7-12 and Figure 7-13. As can be seen, the
quantity of quartz is much higher in Type C than Type B, and conversely the quantity of
Feldspar in Type B is higher than type C. The amount of clays present in rock types B
and C also differs. Chlorite seems to be generally larger in quantity in rock type B, while
illite is present in larger amounts in rock Type C.
Thus, there are differences within the same source aggregate; however it is unknown to
what extent, these differences contribute to the variation of the vibratory hammer
compaction results. A correlation must be investigated between the differences in mineral
composition and the variation in the vibrating hammer compaction test to see if these
differences do play a dominant role in the variability in results or not.
7.3.2 Oriented Sample Results
The oriented sample was X-rayed twice. Once untreated and again when it has been
glycolated to note if there are any volume changes/swelling occurring in the aggregate
due to zeolites (swelling clays). However, as can be seen from Figure 7-14 and Figure
7-15, the peaks appear to be relatively equal with the exception of the beginning of the
curve where the untreated peak is at 400 counts and the glycolated peak is at roughly 320
counts.
Figure 7-14: Output of X-ray Diffraction Oriented Sample A – Glycolated

Investigation of the Variability in the Results of the NZ Vibrating Hammer Compaction Test
101
Figure 7-15: Output of X-ray Diffraction Oriented Sample A - Untreated
7.4 Power Output Test
7.4.1 Introduction
As per the research tasks, a test measuring the power output of the vibrating hammer was
developed. The test was to be conducted twice, once before the vibrating hammer
compaction testing phase started and again after the phase was completed. The purpose
of conducting the same test twice was to note any differences in the results between the
two identical tests. Due to the fact that these commercial vibrating hammers are heavy
duty and usually last several years, an investigation of the ageing of these hammers on the
contribution of the significant variability within the test is essential. The Opus Inter-
laboratory study provided information on the age of hammers in each laboratory. Based
on this information, the average age of hammers in NZ laboratories is approximately 8.5
years old.
Theoretically speaking, the vibrating hammer degrades and loses its full power as it gets
older. This reduction in power could be contributing to the variation in the vibrating
hammer compaction test results.
Figure 7-16 presents the experiment set up and identifies the components and equipment
used in the test to allow for the effective measurement of the hammer‟s power output.

Chapter 7.Test Results and Discussion
102
7.4.2 Experiment Set-up
Figure 7-16: Power Output Experiment Set-up
The purpose of the test was to measure the displacement (using the portal gauge shown in
Figure 7-16) produced by the hammer when a certain amount of weight is imposed on the
tamper. The displacement which is measured by the portal gauge was expected to
resemble a wavelength where it will oscillate about the x axis. The portal gauge which is
supported by two rods as shown in Figure 7-16; one rod that is embedded into a wooden
block and the other rod which is attached to the tamper to record vertical displacements.
7.4.3 Problems with the test
Unfortunately the test did not produce understandable test results as was initially hoped.
The problem faced during the test was that the portal gauge was not very sensitive to
register every movement created by the vibrating hammer. As the hammer was operating,
movement of the tamper was too rapid for the portal gauge to record and thus the output
obtained gave a false impression of what was actually happening in reality.

Investigation of the Variability in the Results of the NZ Vibrating Hammer Compaction Test
103
Another challenging problem faced was keeping the weights attached to the tamper. The
use of clamps allowed for hammer operation for approximately 30 seconds, thereafter the
clamps began to loosen and the weights would fall off. Due to time constraints, it was not
possible to redevelop the test to turn it into a viable one. However, it is hoped that future
research investigates the possibilities of the development of a new and feasible test.


Chapter 8. CONCLUSIONS AND
RECOMMENDATIONS
8.1 Conclusions
The results of this research have proven that the natural variability associated with the
New Zealand vibrating hammer compaction test is a lot higher than international
experience has shown. Repeatability values stated in the USA and UK standards for the
vibrating hammer compaction test method are 0.05 t/m³ and 0.033 t/m³ respectively. In
comparison to this study‟s repeatability value of 0.086 for 5% Water Content, UoA
repeatability values are significantly larger than those obtained in international standards.
This means that either the New Zealand vibrating hammer compaction test procedure is
less precise or the source aggregate being used is more variable than those procedures and
materials being used in the USA and UK.
The natural variation within the source aggregate used for testing in this research explains
approximately 30% of the total variation observed by the Opus Round Robin Inter-
laboratory tests. The other 70% can be explained by the between-laboratory differences in
equipment and technician level of experience.
Due to suspected interlocking of oversized particles during compaction, the New Zealand
Standard for the vibrating hammer compaction test should specify that vibratory hammer
compaction tests be conducted on aggregates passing the 19 mm sieve. Material retained
on the 19 mm sieve should be discarded.
The NZS 4402 Test 4.1.3 allows for particles of 37.5 mm to be compacted in a 152 mm
diameter mould. International standards such as the USA standard consider these particles
„oversized‟ and state that these particles should not be compacted in such a small mould
due to boundary effects. The USA standard for the vibrating hammer compaction test
(ASTM D 7382 - 08, 2008) specifies that compaction of aggregates with particles
retained on the 19 mm sieve should be compacted in a 279.4 mm diameter mould.
Compacting particles passing the 37.5 mm sieve in a 152 mm diameter mould can lead to
the interlocking of these oversized angular particles during the compaction process.
Consequently, the interlocking of these particles interferes with effective compaction.
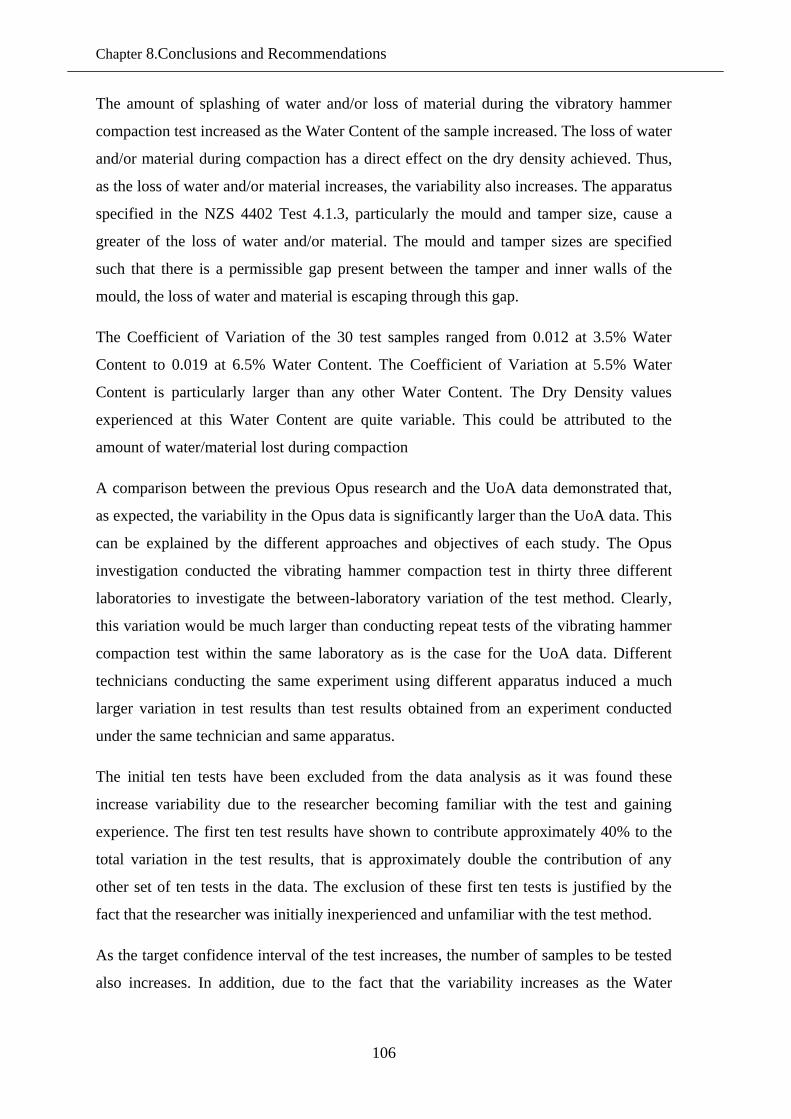
Chapter 8.Conclusions and Recommendations
106
The amount of splashing of water and/or loss of material during the vibratory hammer
compaction test increased as the Water Content of the sample increased. The loss of water
and/or material during compaction has a direct effect on the dry density achieved. Thus,
as the loss of water and/or material increases, the variability also increases. The apparatus
specified in the NZS 4402 Test 4.1.3, particularly the mould and tamper size, cause a
greater of the loss of water and/or material. The mould and tamper sizes are specified
such that there is a permissible gap present between the tamper and inner walls of the
mould, the loss of water and material is escaping through this gap.
The Coefficient of Variation of the 30 test samples ranged from 0.012 at 3.5% Water
Content to 0.019 at 6.5% Water Content. The Coefficient of Variation at 5.5% Water
Content is particularly larger than any other Water Content. The Dry Density values
experienced at this Water Content are quite variable. This could be attributed to the
amount of water/material lost during compaction
A comparison between the previous Opus research and the UoA data demonstrated that,
as expected, the variability in the Opus data is significantly larger than the UoA data. This
can be explained by the different approaches and objectives of each study. The Opus
investigation conducted the vibrating hammer compaction test in thirty three different
laboratories to investigate the between-laboratory variation of the test method. Clearly,
this variation would be much larger than conducting repeat tests of the vibrating hammer
compaction test within the same laboratory as is the case for the UoA data. Different
technicians conducting the same experiment using different apparatus induced a much
larger variation in test results than test results obtained from an experiment conducted
under the same technician and same apparatus.
The initial ten tests have been excluded from the data analysis as it was found these
increase variability due to the researcher becoming familiar with the test and gaining
experience. The first ten test results have shown to contribute approximately 40% to the
total variation in the test results, that is approximately double the contribution of any
other set of ten tests in the data. The exclusion of these first ten tests is justified by the
fact that the researcher was initially inexperienced and unfamiliar with the test method.
As the target confidence interval of the test increases, the number of samples to be tested
also increases. In addition, due to the fact that the variability increases as the Water
Investigation of the Variability in the Results of the NZ Vibrating Hammer Compaction Test
107
Content increases, the number of samples increases even further as the target confidence
interval increases.
As expected, very few points of the Opus 6% WC data fall within the 95% confidence
interval limits of the UoA 6% WC. This proves that the variability associated with the
Opus results is far greater than that in the UoA results.
Different methods of compaction yield different results. The results in Figure 7-11 show
that as the compactive effort is increased, higher Dry Density values were achieved. The
Standard Proctor test method achieved the lowest Dry Density values, followed by the
Modified Proctor test method. The modified (heavy) Proctor test method is largely based
on the standard Proctor method but utilises a significantly higher compactive effort. The
Metabo hammer of the vibrating hammer compaction method achieved higher Dry
Density values than the Standard and Modified Proctor methods. Lastly, the Kango
hammer of the vibrating hammer compaction method achieved the highest Dry Density
values. The Kango hammer is a much more powerful hammer than the Metabo
(producing a higher compactive effort) and seems to produce a much clearer Water
Content – Dry Density relationship.
The Metabo hammer curves (1-30) are noticeably erratic, while the Kango curves are
relatively more consistent. This could be due to the fact that the Metabo hammer is not
delivering sufficient compactive effort onto the sample to achieve a consistent behaviour
from the aggregate.
The hammer calibration method incorporated in the New Zealand Standard requires
updating, as although it specifies a minimum limit on the hammer power spectrum, a
maximum limit does not exist. Furthermore, the minimum limit appears to be quite low,
as a hammer with apparent insufficient power can pass the calibration test. However,
these hammers‟ power may not be sufficient to effectively compact the sample.
Analysis of production and source tests of the aggregate has shown that the aggregated
used in the testing phase of this research is of high quality.

Chapter 8.Conclusions and Recommendations
108
8.2 Summary of Conclusions
This research investigated the variability in the results of the New Zealand vibrating
hammer compaction test. Based on the comprehensive review of literature and the
analysis of results, the investigation has found the following:
The natural variability within an aggregate explains approximately 30% of the
variation observed by the Opus Inter-laboratory study.
The compactive effort applied to the sample during compaction governs the
degree of Dry Density achieved.
Repeatability values obtained are significantly larger than those stated by similar
studies conducted in the USA and UK.
The New Zealand vibrating hammer compaction mould of 152 mm nominal
diameter should only use a maximum particle size of 19 mm due to the suspected
effect of interlocking of particles.
The mould and tamper apparatus specified in the New Zealand Standard for the
vibrating hammer compaction test should be reconsidered due to the significant
loss of water/material during compaction through the permissible gap between the
tamper and inner walls of the mould.
The between-laboratory variability as observed in the Opus investigation, is much
larger than that observed in the within a single laboratory variation in the UoA
study.
Compaction curves produced by the Metabo hammer appear to be erratic, while
the Kango hammer curves are much smoother and consistent. The Metabo
hammer appears to be delivering an insufficient amount of compactive effort on
the sample.
The laboratory vibrating hammer compaction test for aggregates produces a much
flatter and less definable shape of curve. It is sometimes difficult to determine the
Optimum Water Content and Maximum Dry Density values are for field
compaction.

Investigation of the Variability in the Results of the NZ Vibrating Hammer Compaction Test
109
8.3 Recommendations and Future Research
The extent of segregation and degradation occurring during the vibrating hammer
compaction test should be further investigated. Research is required to determine to what
extent these two phenomena have on the affect of the precision of the test results.
The development and implementation of a hammer power output measurement test is
required. The test will help determine whether the hammer output decreases as the
hammer gets older, and whether the decrease in hammer power output has an effect on
the DD results achieved.
It is recommended that similar apparatus to that used in the BS 5835 for the mould and
tamper, be adopted and incorporated in the NZS for the vibrating hammer compaction test
method (New Zealand Standards, 1986b). This will help in the prevention of water and/or
material loss during compaction through the permitted gap in the current New Zealand
Standard test method.
Vibrating hammer compaction testing should be conducted on samples with particles
passing the 19.0 mm sieve to observe whether the variability has slightly decreased or
not. If the variability decreases then interlocking of particles can be determined to be
interfering with compaction and consequently, affecting the reliability of the test results.


REFERENCES
Arnold, G., Werkmeister, S., & Alabaster, D. (2007). The effect of grading on the
performance of basecourse aggregate. Wellington: Land Transport New Zealand.
ASTM D 7382 - 08. (2008). Standard Test Methods for Determination of Maximum Dry
Unit Weight and Water Content Range for Effective Compaction of Granular
Soils Using a Vibrating Hammer (Vol. 04.09). West Conshohocken, PA, USA:
ASTM International.
ASTM E 177 - 10. (2010). Standard Practice for Use of the Terms Precision and Bias in
ASTM Test Methods (Vol. 14.02). West Conshohocken, PA, USA: ASTM
International.
ASTM E 691 - 09. (2009). Standard Practice for Conducting an Interlaboratory Study to
Determine the Precision of a Test Method (Vol. 14.02). West Conshohocken, PA,
USA: ASTM International.
ASTM E 1169 - 07. (2007). Standard Practice for Conducting Ruggedness Tests (Vol.
14.02). West Conshohocken, PA, USA: ASTM International.
Bergeson, K., Jahren, C., Wermager, M., & White, D. (1998). Embankment Quality
Phase I Report. Iowa: Iowa State University.
Bishop, A. W., & Green, G. E. (1965) The influence of end restraint on the compression
strength of a cohesionless soil. Vol. 15. Geotechnique (pp. 243-266). London:
Thomas Telford Limited.
Black, P. M. (2009). Geologic Inventory of North Island Aggregate Resources: Influences
on Engineering Materials Properties. Auckland: Geology, School of the
Environment, The University of Auckland.
Brandl, H. (2001). The importance of optimum compaction of soil and other granular
material. In A. G. Correia & H. Brandl (Eds.), Geotechnics for roads, rail tracks
and earth structures. Lisse, The Netherlands: A.A.Balkema Publishers.
British Standards Institution. (1980). BS 5835: Part `:1980 Recommendations for testing
of aggregates, Part 1. Compactibility test for graded aggregates.
BS 5835. (1980). Recommendations for testing of aggregates – Part 1: Compactibility test
for graded aggregates. London, Uk: British Standards Institution (BSI).
BS EN 13286 - 4. (2003). Unbound and hydraulically bound mixtures - Part 4: Test
methods for laboratory reference density and water content - Vibrating hammer,
British Standards. London, UK: British Standards Institution (BSI).
Carson. (2004). Soil Compaction Handbook. California, USA: Multiquip Inc.
Christopher, B. R., Schwartz, C., & Boudreau, R. (2006). Geotechnical Aspects of
Pavements. Woodbury: National Highway Institute.
Dodd, T. A. H., & Dunlop, R. J. (1971). An improved kneading compaction machine:
University of Canterbury.
Drnevich, V., Evans, A., & Prochaska, A. (2007). A Study of Effective Soil Compaction
Control of Granular Soils. Purdue University, West Lafayette.

112
Dunlap, W. A. (1966). Deformation characteristics of granular materials subjected to
rapid repetitive loading: Texas Transportation Institution.
Ellis, J. (2010). TNZ M/4 Property tests explanation. In A. Shahin (Ed.). Auckland.
Farrar, J. A. (2000). Bureau of Reclamation Experience with Construction and Control of
Earth Materials for Hydraulic Structures. In D. W. Shanklin, K. R. Rademacher &
J. R. Talbot (Eds.), Constructing and Controlling Compaction of Earth Fills,
ASTM STP 1384. West Conshohocken: ASTM.
Felt, E. J. (1968). Laboratory Methods of Compacting Granular Soils. A.S.T.M Special
Technical Publication No. 239.
Forssblad, L. (1981). Compaction meter on vibrating rollers for improved compaction
control. Paper presented at the Proceedings from internation conference on
compaction, Paris.
Frobel, T., & Moulding, S. (2006). Errors in the vibrating hammer compaction test. Paper
presented at the Inaugral Civil Engineering Laboratories Conference.
Geological Society Engineering Geology. (2001). Aggregates: Sand, gravel and crushed
rock aggregates for construction purposes (Third ed. Vol. 17). London:
Geological Society.
Hausmann, M. R. (1990). Engineering principles of ground modification. Sydney:
Mcgraw-Hill Inc.
HEICO. (2010). California Bearing Ratio.
Henning, T. (2008a). Pavement Design - Introduction. Unpublished Lecture Notes.
University of Auckland.
Henning, T. (2008b). The performance of unbound aggregates in granular material.
Unpublished Lecture notes. University of Auckland.
Hilf, J. W. (1991). Compacted Fill. In H.-Y. Fang (Ed.), Foundation engineering
handbook (2 ed., pp. 249-316). New York: Chapman & Hall.
Hoffman, C. (2008). HMA Pavement. Pavement Interactive Core Retrieved 06/12/2010,
2010
Hoover, J. M., Kumar, S., & Best, T. W. (1970). degradation control of crushed stone
basecourse mixes during laboratory compaction. (Highway Research Record No.
301).
Huang, Y. H. (1993). Pavement Analysis and Design. Upper Saddle River, New Jersey:
Prentice-Hall Inc,.
IHS. (2010). ASTM International Approves Vibrating Hammer Test - ASTM D 7382.
Retrieved 03/05/2010, 2010, from http://aec.ihs.com/news/astm-vibrating-
hammer.htm
Johnson, A. W., & Sallberg, J. R. (1960). Factors that influence field compaction of soils.
Highway Research Board(Highway Research Board Bulletin 272).
Lowe, J. S., Wilson, D. J., & Black, P. M. (2010). The proficiency of sand equivalent and
methylene blue (clay index) test methods for determining the deleterious mineral
content of weakly metamorphosed sedimentary rock. Road & Transport Research,
19(4), 14.

113
Luxford, N. S. (1975). Compaction test for Aggregate Studies. Wellington: National
Roads Board,.
Massart, D. L., Heyden, Y. V., Nijhuis, A., Smeyers-Verbeke, J., & Vandeginste, B. G.
M. (2006). Guidance for Robustness/Ruggedness Tests in Method Validation.
Brussel, Belgium: Pharmaceutical Institute.
New Zealand Institute of Highway Technology. (2000). Hiway 6011 - Pavement design.
New Plymouth, NZ: New Zealand Institute of Highway Technology Ltd.
New Zealand Standards. (1986a). NZS 4402: Methods of testing soils for civil
engineering purposes, Part 1 Preliminary and general. New Zealand.
New Zealand Standards. (1986b). NZS 4402: Methods of testing soils for Civil
Engineering purposes: Soil Compaction tests, Determination of the Dry
Density/Water Content relationship Test 4.1.3 New Zealand vibrating hammer
compaction test. New Zealand.
New Zealand Standards. (1991a). NZS 4407 Methods of sampling and testing road
aggregates, Test 3.1 The Water Content of aggregate. New Zealand.
New Zealand Standards. (1991b). NZS 4407: Methods of sampling and testing road
aggregates, Test 3.5 The Clay Index Test. New Zealand.
New Zealand Standards. (1991c). NZS 4407: Methods of sampling and testing road
aggregates, Test 3.4 The Plasticity Index. New Zealand.
New Zealand Standards. (1991d). NZS 4407: Methods of sampling and testing road
aggregates, Test 3.14 The broken faces content of aggregate. New Zealand.
New Zealand Standards. (1991e). NZS 4407: Methods of sampling and testing road
aggregates, Test 3.8 The particle-size distribtuion. New Zealand.
New Zealand Standards. (1991f). NZS 4407: Methods of sampling and testing road
aggregates, Test 3.6 The Sand Equivalent. New Zealand.
New Zealand Standards. (1991g). NZS 4407: Methods of sampling and testing road
aggregates, Test 3.10 The crushing resistance of coarse aggregate under a
specified load. New Zealand.
New Zealand Standards. (1991h). NZS 4407: Methods of sampling and testing road
aggregates, Test 3.11 The weathering quality index of coarse aggregate. New
Zealand.
New Zealand Standards. (1991i). NZS 4407: Methods of sampling and testing road
aggregates, Test 3.15 The California Bearing Ratio (CBR). New Zealand.
Opus International Consultants Limited. (2008). New Zealand Vibrating Hammer
Compaction Test Interlaboratory Study. Auckland: OPUS International
Consultants Limited
Papagiannakis, A. T., & Masad, E. A. (2008). Pavement Design and Materials. Hoboken,
New Jersey: John & Wiley Sons Inc.
Parsons, A. W. (1992). Compaction of soils and granular materials: A review of research
performed at the transport research laboratory. London: HMSO.
Pike, D. C. (1972). Compactability of graded aggregates. 1. Standard laboratory tests.
Crowthorne Berkshire: Department of the Environment, TRRL.

114
Ping, W. V., Xing, G., Leonard, M., & Yang, Z. (2003). Evaluation of laboratory
compaction techniques for simulation field compaction (Phase II). Florida State
University, Tallahassee, Florida.
Proctor, R. R. (1933). Fundamental Principles of Soil Compaction. Engineering News-
Record, 111(No. 9), 245-248.
Roberts, F. L. (1976). An evaluation of a proposed test method for determining the
maximum dry density of dense graded aggregate. Journal of Testing and
Evaluation, 4(5), 303-312.
SAI AS 1289.5.1.1. (2003). Determination of the dry density/moisture content relation of
a soil using standard compaction - standard method, Australian Standards.
Australia.
SAI AS 1289.5.2.1. (2003). Determination of the dry density/moisture content relation of
a soil using modified compactive effort, Australian Standards. Australia.
Sherwood, P. T. (1970). The reproducibility of the results of soil classification and
compaction tests.
Strohm, W. E., Nettles, E. H., & Calhoun, C. C. (1967). A study of drainage
characteristics of basecourse materials. (Highway Research Record No. 203).
Thom, N. (2008). Principles of Pavement Engineering. London: Thomas Telford Ltd.
Transit New Zealand. (2005a). Notes for the Specification for Construction of Unbound
Granular Pavement Layers, TNZ B/02 Notes: 2005 (pp. 6). Auckland: TNZ.
Transit New Zealand. (2005b). Specification for Construction of Unbound Granular
Pavement Layers, TNZ B/02:2005 (pp. 10). Auckland: TNZ.
Transit New Zealand. (2006a). Notes to the specification for basecourse aggregate, TNZ
M/4 NOTES:2006 (pp. 22). Auckland: TNZ.
Transit New Zealand. (2006b). Specification for basecourse aggregate, TNZ M/4:2006
(pp. 15). Auckland: TNZ.
Transit New Zealand, Road Controlling Authorities, & Roading New Zealand. (2005).
Chipsealing in New Zealand. Wellington: Transit New Zealand, Road Controlling
Authorities, Roading New Zealand,.
Wilson, D. J., & Shamseldin, A. Y. (2010). Research Proposal: Investigation of the
variability in the results of the NZ vibrating hammer compaction test stage I.
Unpublished Research Proposal Report. University of Auckland.
Recommended