INVESTIGATION OF ANTIOXIDANT AND ANTIMICROBIAL EFFECTS OF
PLANTAGO MAJOR LEAVES
A THESIS SUBMITTED TO
THE GRADUATE SCHOOL OF NATURAL AND APPLIED SCIENCES
OF
MIDDLE EAST TECHNICAL UNIVERSITY
BY
ÖZGE KAYA
IN PARTIAL FULLFILLMENT OF THE REQUIREMENTS
FOR
THE DEGREE OF MASTER OF SCIENCE
IN
BIOCHEMISTRY
SEPTEMBER 2011
Approval of the thesis:
INVESTIGATION OF ANTIOXIDANT AND ANTIMICROBIAL EFFECTS
OF PLANTAGO MAJOR LEAVES
submitted by ÖZGE KAYA in partial fulfillment of the requirements for the degree
of Master of Science in Department of Biochemistry, Middle East Technical
University by,
Prof. Dr. Canan Özgen ________________
Dean, Graduate School of Natural and Applied Sciences
Prof. Dr. G.Candan Gürakan ________________
Head of Department, Biochemistry,METU
Assoc. Prof. Dr. Nursen Çoruh ________________
Supervisor, Chemistry Dept., METU
Assist. Prof. Dr. A. Gülçin Sağdıçoğlu Celep ________________
Co-Supervisor, Family and Consumer Sci. Dept., Gazi Unv.
Examining Committee Members:
Prof. Dr. Musa Doğan ________________
Biology Dept., METU
Assoc. Prof. Dr. Nursen Çoruh ________________
Chemistry Dept., METU
Prof. Dr. Orhan Adalı ________________
Biology Dept., METU
Prof. Dr. Ceyhan Kayran ________________
Chemistry Dept., METU
Assist. Prof. Dr. A. Gülçin Sağdıçoğlu Celep ________________
Family and Consumer Sci. Dept., Gazi University
Date: 09.09.2011
iii
I hereby declare that all information in this document has been obtained and
presented in accordance with academic rules and ethical conduct. I also declare
that, as required by these rules and conduct, I have fully cited and referenced
all material and results that are not original to this work.
Name, Last name: Özge KAYA
Signature:
iv
ABSTRACT
INVESTIGATION OF ANTIOXIDANT AND ANTIMICROBIAL EFFECTS OF
PLANTAGO MAJOR LEAVES
KAYA, Özge
M.Sc., Department of Biochemistry
Supervisor: Assoc. Prof. Dr. Nursen ÇORUH
Co-Supervisor: Assist. Prof. Dr. A. Gülçin Sağdıçoğlu CELEP
September 2011, 96 pages
This study was designed to investigate Plantago major leaves, which is widely used
in ethnobotanical uses in Turkey as is the case in all over the world, for their
antioxidant capacities and antimicrobial effect on two gram-positive and two gram-
negative bacteria.
Extracts of P. major leaves prepared in the methanol and fraction samples were
collected in solvents in increasing polarity, from non-polar to polar, to separate
bioactive compound in crude extract. Antioxidant capacities of the crude extracts and
fractions were examined by radical scavenging methods, namely 2,2-azinobis(3-
ethylbenzothiazoline-6-sulfonic acid) ABTS and 1,1-diphenyl-2-picryl-hydrazyl
(DPPH); as well, total phenolic and total flavonoid contents were determined.
Furthermore, antimicrobial activities of crude extract and fractions were calculated in
terms of minimum inhibitory concentration (MIC) and minimum bactericidal
concentration (MBC) methods together with disc diffusion method.
v
Among the investigated samples, ethyl acetate phase had the highest radical
scavenging capacity with the ABTS value of 2130.4±9.845 µmol equivalents of
trolox/ g of ethyl acetate fraction DW, and with EC50 value of 0.011±0.001 mg/mL;
further, the highest phenolic content was found in ethyl acetate phase with values of
0.452 GAE mg/mg of ethyl acetate fraction DW and 0.434± 0.0017 mg catechin
equivalent in per mg of ethyl acetate fraction DW.
In general, it was found that the crude extract and aqueous phase of Plantago major
had a weak antimicrobial effect on S. aureus, P.mirabilis, S.pyogenes and E. coli,
along with the highest bacteriostatic and bactericidal upshot on selected bacterial
populations in ethyl acetate fraction.
Keywords: Plantago major, Antioxidant, Antimicrobial, Free Radicals.
vi
ÖZ
PLANTAGO MAJOR YAPRAKLARININ ANTİOKSİDAN VE
ANTİMİKROBİYAL ETKİLERİNİN ARAŞTIRILMASI
KAYA,Özge,
Yüksek Lisans, Biyokimya Bölümü
Tez Yöneticisi: Doç.Dr. Nursen ÇORUH
Ortak Tez Yöneticisi: Yrd. Doç. Dr. A. Gülçin Sağdıçoğlu CELEP
Eylül 2011, 96 sayfa
Bu çalışma, Dünyada olduğu gibi Türkiye’de de geniş bir alanda etnobotanik olarak
kullanılan Plantago major bitkisinin antioksidan kapasitesini belirlemek ve iki gram-
pozitif iki gram negatif bakteri üzerindeki antimikrobial etkilerinin tesbiti için
tasarlanmıştır.
Plantago major yapraklarının total özütü methanolde hazırlandıktan sonra total özüt
içindeki biyoaktif maddelerin çözünürlük farklarından yararlanılarak total özüte artan
polaritelerde apolardan polara doğru organik solventler uygulanarak fraksiyonlama
işlemi yapılmıştır. Total özüt ve fraksiyonların antioksidan kapasiteleri radical
yakalama kapasitesini ölçme methodları olan olan 2,2'-azino-bis(3-
ethylbenzthiazoline-6-sulphonic acid) ABTS ve 1,1-diphenyl-2-picryl-hydr`azyl
DPPH methodları ile belirlenmiştir. Bunun yanısıra total fenolik ve total flavonoid
madde miktarlarıda hesaplanmıştır. Antimikrobiyal aktivite tayininin belirlenemesi
vii
için minimum inhibe edici konsantrasyon, minimum bakterisidal konsantrasyon ve
disk difüzyon teknikleri kullanılmıştır.
Total özüt ve fraksiyonlar içinde en yüksek radikal sönümleme kapasitesini etil
asetat fazı ABTS 2130.4±9.845 µmol trolox eşleniği/g, 0.011±0.001 mg/mL DPPH
EC50 değerleri ile göstermiştir.Aynı zamanda toplam fenolik madde miktarı 0.452
GAEmg/mg ve total flavonoid miktarı 0.434 mg catechine eşdeğer madde/mg olarak
hesaplanmıştır.
Genel olarak Plantago major bitkisinin S. aureus, P.mirabilis, S.pyogenes ve E. coli
bakterileri üzerinde zayıf bir etkisi olduğu saptanmış. Etil asetat fraksiyonunun en
etkili antimikrobiyal faz olmanın yanı sıra antioksidan olarak da en etkili olduğu
gözlenmiştir.
Anahtar Kelimeler: Plantago major, Antioksidan, Serbest Radikal, Antimikrobiyal.

viii
To my sister and my mother…
ix
ACKNOWLEDGEMENTS
I wish to express my sincere appreciation and thanks to my supervisor Assoc. Prof.
Dr. Nursen Çoruh for her guidance, valuable advices, moral support and for
enlightening my professional and academic vision throughout my study.
I would like to thank to my co-supervisor Assist. Prof. Dr. A. Gülçin Sağdıçoğlu
Celep for her guidance and valuable advices.
I would like to also thanks to Prof. Dr. Mesude İşcan to give me opportunity to use
her laboratory equipment.
I appreciate for patience, criticism and advice of my thesis examining committee
members Prof. Dr. Musa Doğan, Prof. Dr. Orhan Adalı, Prof. Dr. Ceyhan Kayran,
and Assist. Prof. Dr. A. Gülçin Sağdıçoğlu Celep, while reading and commenting on
my thesis study.
I would like to express my great thanks to all the members of Nursen Çoruh
Research Group Yeşim Kümbet, Nizamettin Özdoğan , Can Nebigil, and my friends
Sule Sahin, Asligül Aksoy, Ayten Eroglu , Elif Asik, Emrah Sagır for their helps and
friendship. I express my special thanks to research assistant Can Yılmaz helping me
in the usage of ELISA
I would like to express my sincere thanks to Göktuğ Seymen, Neslihan Şalcı
Akdoğan, Serap Altınay, Münire Ekmekçigil, Tevfik Akdoğan, Buket Çarbaş, Serdar
Çarbaş, Yeşim Kümbet for their endless support, patience and motivation throughout
this work.
Finally, I would like to express my deepest thanks to my family my mother, my
sister, my cousin İrem Gözübüyük… for helping, encouraging and loving me all
through my life. I cannot ask for more from them as they are simply perfect.
x
TABLE OF CONTENTS
ABSTRACT .............................................................................................................. iv
ÖZ .............................................................................................................................. vi
ACKNOWLEDGEMENTS ..................................................................................... viii
TABLE OF CONTENTS .............................................................................................x
LIST OF TABLES .................................................................................................... xii
LIST OF FIGURES ................................................................................................. xiii
LIST OF ABBREVIATIONS .................................................................................. xvi
CHAPTERS
1.INTRODUCTION ..................................................................................................1
1.1 PLANTAGO MAJOR L...........................................................................................2
1.1.1 Botany of the Plantago major L..........................................................................3
1.1.2 Ethnobotanical Studies on P. major in Turkey....................................................3
1.1.3 Medicinal Investigation of P. major....................................................................5
1.2 FREE RADICALS ...............................................................................................9
1.2.1 Free Radical Chain Reaction...............................................................................9
1.2.2 Sources of Free Radicals................................................................................... 10
1.3 ANTIOXIDANTS................................................................................................ 11
1.3.1 Enzymatic Antioxidants.....................................................................................11
1.3.1.1 Superoxide Dismutas (SOD)...........................................................................12
1.3.1.2 Catalase (CAT)...............................................................................................12
1.3.1.3 Glutathione Peroxidase (GPX) ......................................................................12
1.3.2 Non- Enzymatic Antioxidants............................................................................13
1.4 PHYTOCHEMICALS..........................................................................................13
1.5 ANTIOXIDANT CAPACITY EVALUATION METHOD................................15
1.5.1 DPPH Method:...................................................................................................15
1.5.2 ABTS Method....................................................................................................16
1.5.3 Total Phenol……...............................................................................................17
1.5.4 Total Flavonoid………………..........................................................................17
1.6 ANTIBACTERIAL ACTIVITIES........................................................................18
xi
1.6.1 Gram-positive Bacteria Used in This study.......................................................18
1.6.1.1 Staphylococcus aureus...................................................................................18
1.6.1.2 Streptococcus pyogenes..................................................................................19
1.6.2 Gram-negative Bacteria Used in This study......................................................19
1.6.2.1 Escherichia coli..............................................................................................19
1.6.2.2 Proteus mirabilis............................................................................................ 20
1.7 PHYTOCHEMICALS AS ANTIMICROBIAL AGENTS................................ 20
1.7.1 Major Groups of Antimicrobial Compounds from Phytochemicals..................21
1.7.1.1 Simple Phenols and Phenolic Acids.............................................................. 21
1.7.1.2 Quinones. ...................................................................................................... 21
1.7.1.3 Tanins............................................................................................................. 22
1.7.1.4 Alkaloids........................................................................................................ 22
1.7.1.5 Flavones, flavonoids, and flavonols.............................................................. 23
1.8 METHODS USED FOR EVALUATION ANTIBACTERIAL BACTERIA…23
1.8.1 Minimum Inhibitory Concentration...................................................................23
1.8.2 Minimum Bactericidal Concetration................................................................. 24
1.8.3 Agar Disc Diffusion Assay............................................................................... 24
1.9 Scope of The Study ............................................................................................. 25
2. MATERIALS AND METHODS ....................................................................... 26
2.1 MATERIAL……………………………………….…………………………….26
2.1.1 Chemicals.......................................................................................................... 26
2.1.2 Apparatus ......................................................................................................... 28
2.2 METHODS ......................................................................................................... 29
2.2.1 Extraction ......................................................................................................... 29
2.2.2 Fractionation of Crude Extract.......................................................................... 29
2.2.3 Analytical High Performance Liquid Chromatography (HPLC) Analysis........31
2.2.4 Determination of Antioxidant Capacity.............................................................32
2.2.4.1 DPPH Method................................................................................................ 32
2.2.4.2 ABTS Method.................................................................................................33
2.2.5 Determination of the Total Phenolic Content................................................... 34
2.2.6 Determination of the Total Flavonoid Content……………..………….……...35
2.2.7 Antimicrobial tests………………………………………………...……….….36
2.2.7.1 Preparation of Microbial Stock...................................................................... 36
xii
2.2.7.2 Determination of the Minimum Inhibitory Concentration............................36
2.2.7.1 Solvent Effect……………………………………………………….…….…36
2.2.7.2.2 Minimum Inhibitory Concentration (MIC) Value Evaluation…...….….....38
2.2.7.2.3 Minimum Bactericidal Concentration (MBC) Value Evaluation…............39
2.2.7.3 Agar Disk Diffusion Assay.............................................................................39
3. RESULTS AND DISCUSSION ..........................................................................40
3.1 EXTRACTION OF Plantago major LEAVES. .................................................40
3.1.1 Prufication of Crude Extract with Fractionation...............................................40
3.2 EXPLORATION OF ANTIOXIDANT CAPACITIES………...........................42
3.2.1 Antioxidant capacity by ABTS Method............................................................42
3.2.2 Antioxidant capacity by DPPH Method……………………….……………...45
3.3 TOTAL PHENOL CONTENT OF CRUDE EXTRACT AND FRACTIONS of
P. major ……………………………………………………………………………..48
3.4 TOTAL FLAVONOID CONTENT OF CRUDE EXTRACT AND
FRACTIONS…………………..................................................................................50
3.5 ANTIMICROBIAL ACTIVITY………………………..……..……...……..…53
3.5.1 Solvent Effect................................................................................................... 53
3.5.2 Antimicrobial Effect of Crude Extract and Fractions.......................................53
3.5.3 Antimicrobial Effect of Antioxidant Standard ………….……………………54
3.5.4 Minimum Bactericidal Concentration............................................................... 65
3.5.4.2 Bactericidal Evaluation of Crude extract and Fractions.................................66
3.5.4.2 Bactericidal Evaluation of Standard Antioxidants.........................................67
3.5.5 Agar Disc Diffusion Assay (Kirby-Bauer Test) for total extract and
fractions…………………………………………………………………………….. 68
3.5.6 Agar Disc Diffusion Assay (Kirby-Bauer Test) for standard phenolics……....70
3.6 Analytical High Performance Liquid Chromatography (HPLC) analyses…...…73
4. CONCLUSIONS ..................................................................................................75
REFERENCES ........................................................................................................77
APPENDIX
A: Radical scavenging activities of crude extract and fractions...................………. 88
B: RSA (%) versus final concentration graph of quercetin........................................91
C: UV- Scan for crude extract and fractions…………………………….………… 92
D: HRMS Spectra for hispidulin 7-glucuronide and luteolin 7-glucoside………….95
xiii
LIST OF TABLES
TABLES
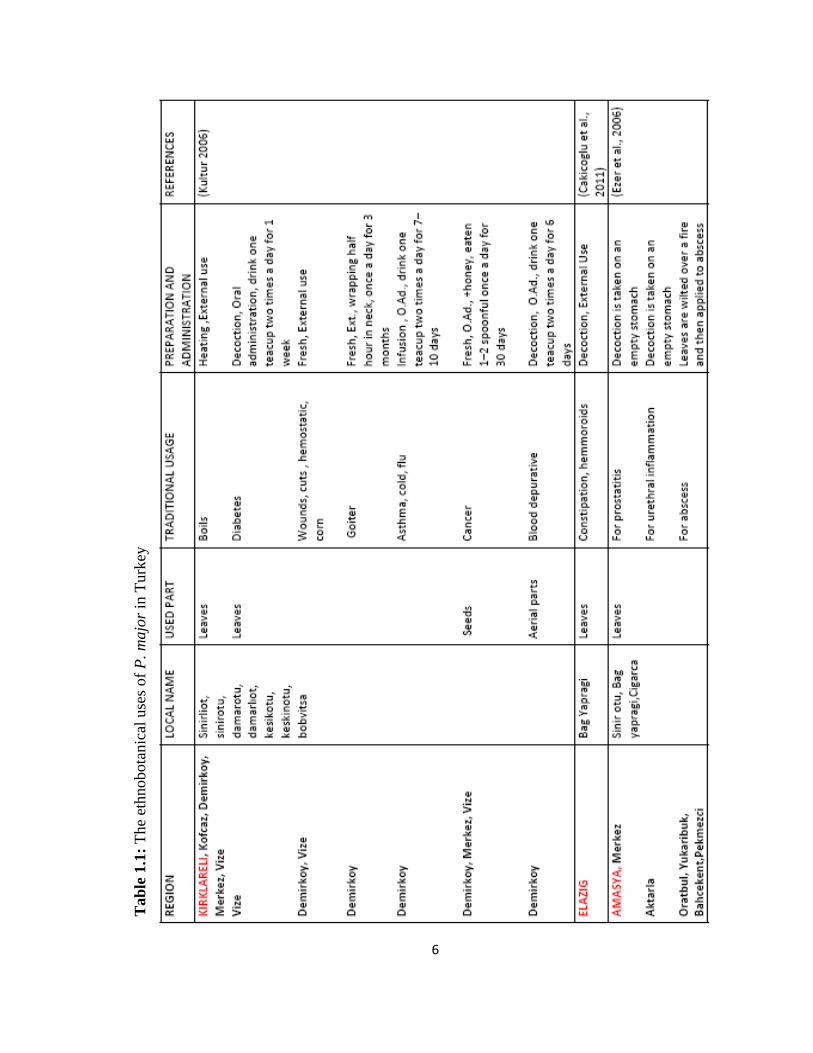
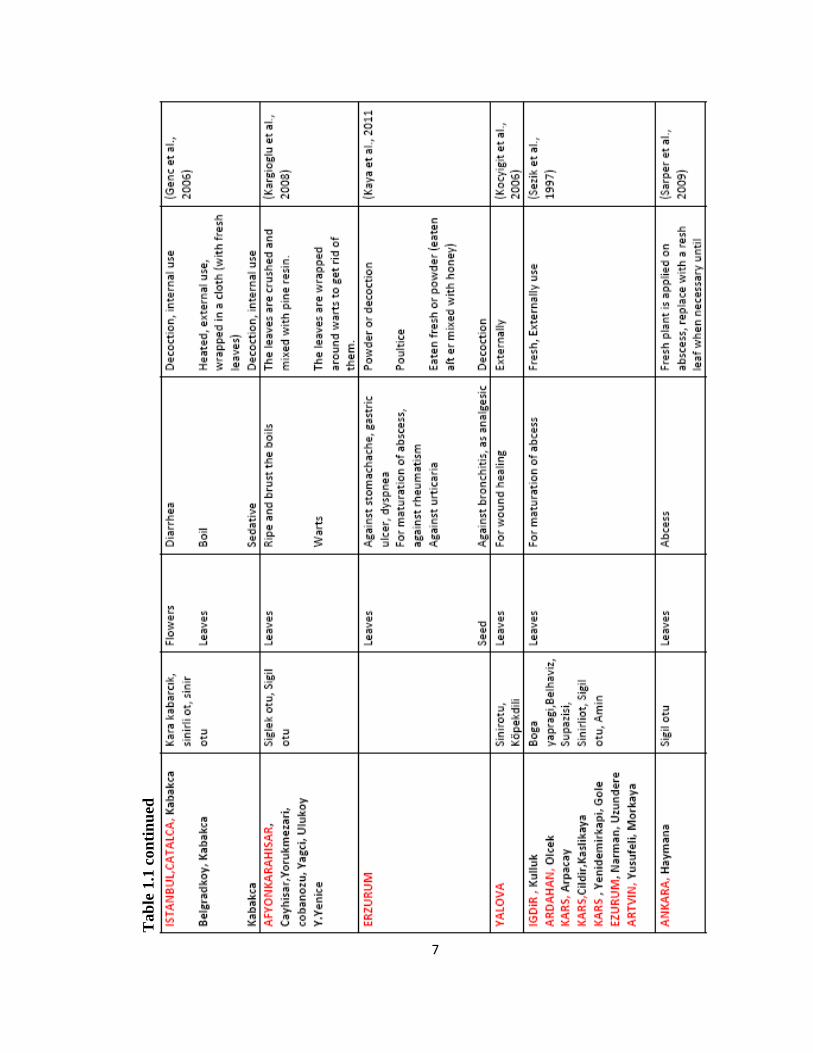
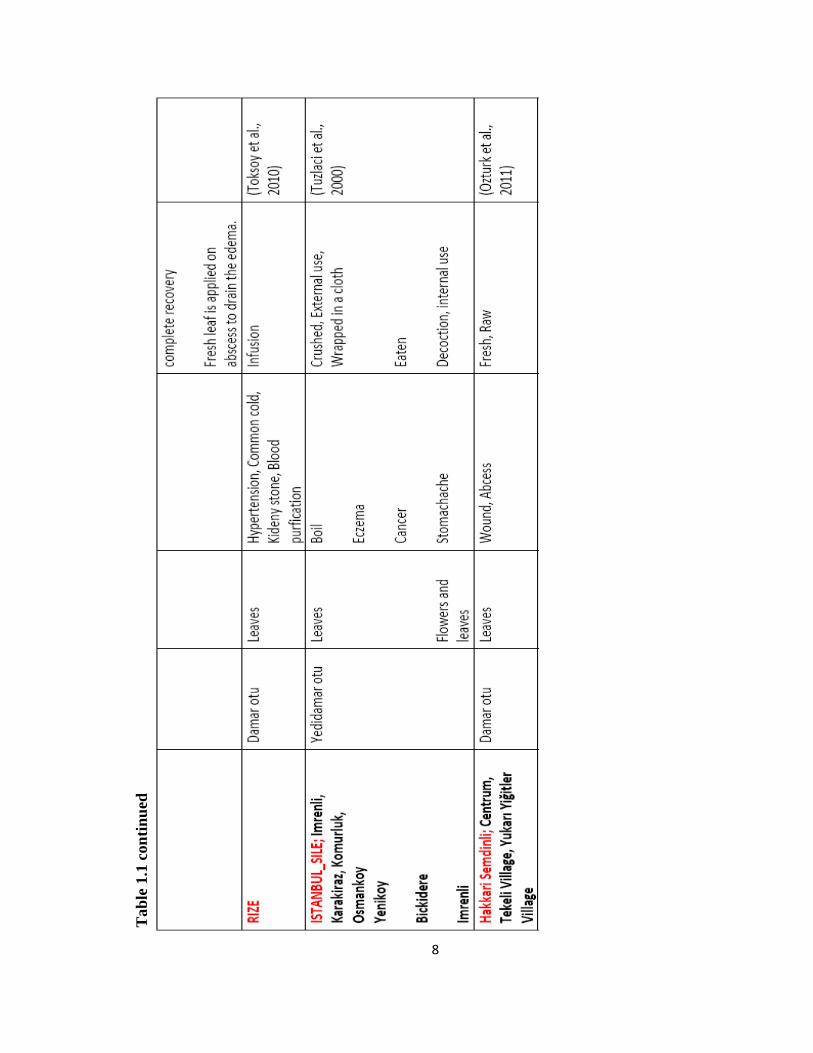
Table 1.1 The ethnobotanical uses of P. major in Turkey ..........................................6
Table 2.1 96-well plate desing for the solvent effect determination …………...…..37
Table 2.2 96-well plate design in MIC experiments……………………………......38
Table 3.1 Trolox equivalent antioxidant capacities (TEAC) of crude extract and
fractions……………………………………………………………………...………44
Table 3.2 Fifty percent effective concentration for DPPH radical scavenging
capacities……………………………………………………….……………………46
Table 3.3 Total phenolic content of crude extract and fractions………………....…49
Table 3.4 Total flavonoid content of crude extract and fractions………….……….51
Table 3.5 Comparison of the TEAC (µmol/g), DPPH EC50 (mg/mL), TP GAE
(mg/mg), TF Cathechin Equivalent (mg/mg)…….…………………………...…….52
Table3.6: Comparition of MIC, MBC, Disc Diffusion Method for crude extract,
fractions and phenolic compounds……………………………………………..……72
xiv
LIST OF FIGURES
FIGURES
Figure 1.1 Distribution of the taxon over Turkey (TUBIVES) based on grids...........4
Figure 1.2 Schematic diagram for types of phytochemicals ………….....................14
Figure 1.3 Schematic illustration of radical (oxidized) and non radical (reduced)
form of DPPH molecule .............................................................................................15
Figure 1.4 Schematic illustration of the reaction between the ABTS.+
radical and the
antioxidant. (Huang, 2005)……… …………………………………….......……….16
Figure 2.1 Schematic illustration of extraction and fractionation procedure.............30
Figure 2.2 Formation of ABTS radical cation………………...................................34
Figure 3.1 Schematically illustration of extraction and fractionation steps and yield
as gram………………………………………………………………………………41
Figure 3.2 Trolox Standart Curve..............................................................................43
Figure 3.3 DPPH radical scavenging activity in percent versus the final
concentration of crude extract and fractions (mg/ml) at 517 nm................................45
Figure 3.4 Gallic acid standard curve........................................................................48
Figure 3.5 Cathechin standard curve.........................................................................50
Figure 3.6 Evaluation of methanol effect on growth of S.aureus, E.coli, P. mirabilis,
S. pyogenes after 16 h incubation...............................................................................54
Figure 3.7 Evaluation of minimum inhibitory concentration of crude extract on
S.aureus, E.coli, P. mirabilis, S. pyogenes after 16 h incubation. .............................56
Figure 3.8 Evaluation of minimum inhibitory concentration of ethyl acetate fraction
on S.aureus, E.coli, P. mirabilis, S. pyogenes after 16 h incubation..........................57
Figure 3.9 Evaluation of minimum inhibitory concentration of aqueous fraction on
S.aureus, E.coli, P. mirabilis, S. pyogenes after 16 h incubation...............................57
Figure 3.10 Evaluation of minimum inhibitory concentration of tannic acid on
S.aureus, E.coli, P. mirabilis, S. pyogenes after 16 h incubation...............................60
Figure 3.11 Evaluation of minimum inhibitory concentration of gallic acid on
S.aureus, E.coli, P. mirabilis, S. pyogenes after 16 h incubation...............................60
xv
Figure 3.12 Evaluation of minimum inhibitory concentration of caffeic acid on
S.aureus, E.coli, P. mirabilis, S. pyogenes after 16 h incubation...............................61
Figure 3.13 Evaluation of minimum inhibitory concentration of catechin on
S.aureus, E.coli, P. mirabilis, S. pyogenes after 16 h incubation...............................61
Figure 3.14 Evaluation of minimum inhibitory concentration of trolox on S.aureus,
E.coli, P. mirabilis, S. pyogenes after 16 h incubation...............................................62
Figure 3.15 Evaluation of minimum inhibitory concentration of rutin on S.aureus,
E.coli, P. mirabilis, S. pyogenes after 16 h incubation...............................................62
Figure 3.16 Evaluation of minimum inhibitory concentration of quercetin on
S.aureus, E.coli, P. mirabilis, S. pyogenes after 16 h incubation...............................63
Figure 3.17 Minimum bactericidal concentration of crude extract,and chloroform,
ethyl acetate, aqueous fractions..................................................................................66
Figure 3.18 Minimum bactericidal concentration of trolox, catechin, cafeic acid,
gallic acid, tannic acid, rutin………………………………………………….……..68
Figure 3.19 Evaluation of antimicrobial susceptibilities of crude extract , fraction and
antibiotics with agar disc diffusion assay.inhibition zones(mm) include the 6mm disc
diameter.................................................................................................................................69
Figure 3.20 Evaluation of antimicrobial susceptibilities of phenolic compound with
agar disc diffusion assay. Inhibition zones (mm) include the 6mm disc diameter.....72
Figure 3.21 HPLC chromatogram of ethyl acetate fraction………………………..73
Figure A.1 Radical scavenging activities of crude extract with ABTS…………….88
Figure A.2 Radical scavenging activities of hexane fraction with ABTS……...…..88
Figure A.3 Radical scavenging activities of diethyl ether fraction with ABTS…....89
Figure A.4 Radical scavenging activities of chloroform fraction with ABTS….….89
Figure A.5 Radical scavenging activities of ethyl acetate fraction with ABTS…....89
Figure A.6 Radical scavenging activities of aqueous phase with ABTS…….……..90
Figure B.1 RSA (%) versus final concentration graph of quercetin………….….…91
Figure C.1 UV-Scan of crude extract………………………………….….………..92
Figure C.2 UV-Scan of hexane fraction……………………………….….…….….92
Figure C.3 UV-Scan of diethyl ether fraction…………………………….…….….93
Figure C.4 UV-Scan of chloroform fraction…………………………..…….….….93
xvi
Figure C.5 UV-Scan of ethyl acetate fraction……………………….….….…….…93
Figure C.6 UV-Scan of aqueous fraction……………………………………..…….…94
Figure D.1 Mass Spectrum for hispidulin 7-glucuronide……….…….……..……..95
Figure D.2 Mass Spectrum for luteolin 7-glucoside……………………….……….96
xvii
LIST OF ABBREVIATIONS
mg : Milligram
mL : Milliliter
μL : Microliter
mm : Millimeter
nm : Nanometer
ABTS : 2,2’-azinobis-(3-ethylbenzothiazoline-6-sulfonic acid)
DPPH : 2,2-diphenyl-1-picrylhydrazyl
TEAC : Trolox equivalent antioxidant capacity
GAE : Gallic acid equivalent
MIC : Minimum inhibitory concentration
MBC : Minimum bactericidal concentration
CFU : Colony forming units
a.u. : Absorbance unit
HPLC : High pressure liquid chromatography
HPLC-DAD : Photo diode array detector
RSA : Radical scavenging activity
ROS : Radical Oxygen Species
RNS : Radical Nitrogen Species
SD : Standard deviation
HRMS : High Resolution Mass Spectroscopy
1
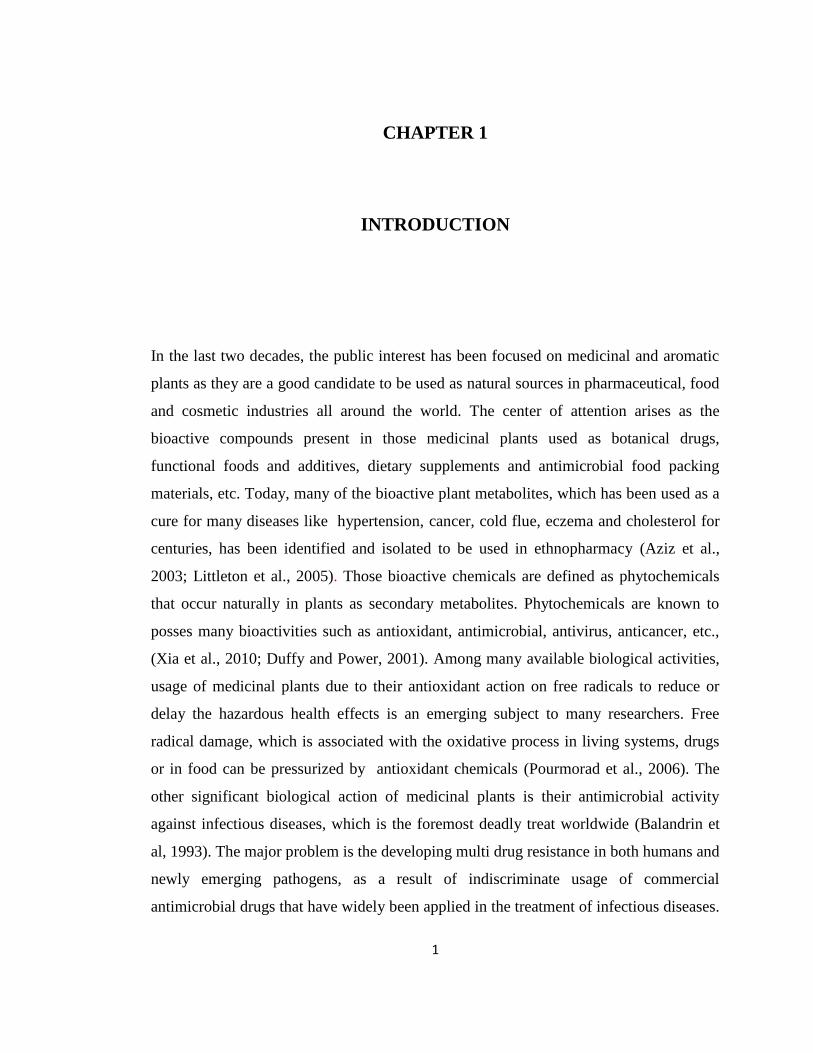
CHAPTER 1
INTRODUCTION
In the last two decades, the public interest has been focused on medicinal and aromatic
plants as they are a good candidate to be used as natural sources in pharmaceutical, food
and cosmetic industries all around the world. The center of attention arises as the
bioactive compounds present in those medicinal plants used as botanical drugs,
functional foods and additives, dietary supplements and antimicrobial food packing
materials, etc. Today, many of the bioactive plant metabolites, which has been used as a
cure for many diseases like hypertension, cancer, cold flue, eczema and cholesterol for
centuries, has been identified and isolated to be used in ethnopharmacy (Aziz et al.,
2003; Littleton et al., 2005). Those bioactive chemicals are defined as phytochemicals
that occur naturally in plants as secondary metabolites. Phytochemicals are known to
posses many bioactivities such as antioxidant, antimicrobial, antivirus, anticancer, etc.,
(Xia et al., 2010; Duffy and Power, 2001). Among many available biological activities,
usage of medicinal plants due to their antioxidant action on free radicals to reduce or
delay the hazardous health effects is an emerging subject to many researchers. Free
radical damage, which is associated with the oxidative process in living systems, drugs
or in food can be pressurized by antioxidant chemicals (Pourmorad et al., 2006). The
other significant biological action of medicinal plants is their antimicrobial activity
against infectious diseases, which is the foremost deadly treat worldwide (Balandrin et
al, 1993). The major problem is the developing multi drug resistance in both humans and
newly emerging pathogens, as a result of indiscriminate usage of commercial
antimicrobial drugs that have widely been applied in the treatment of infectious diseases.
2
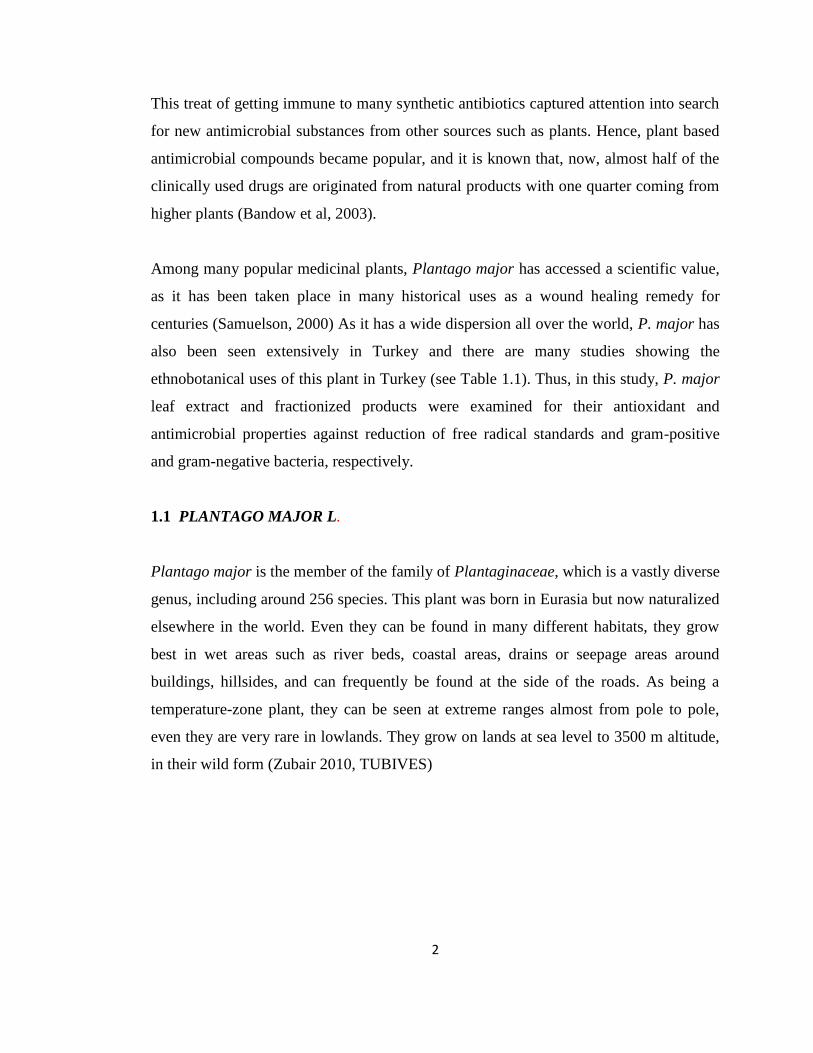
This treat of getting immune to many synthetic antibiotics captured attention into search
for new antimicrobial substances from other sources such as plants. Hence, plant based
antimicrobial compounds became popular, and it is known that, now, almost half of the
clinically used drugs are originated from natural products with one quarter coming from
higher plants (Bandow et al, 2003).
Among many popular medicinal plants, Plantago major has accessed a scientific value,
as it has been taken place in many historical uses as a wound healing remedy for
centuries (Samuelson, 2000) As it has a wide dispersion all over the world, P. major has
also been seen extensively in Turkey and there are many studies showing the
ethnobotanical uses of this plant in Turkey (see Table 1.1). Thus, in this study, P. major
leaf extract and fractionized products were examined for their antioxidant and
antimicrobial properties against reduction of free radical standards and gram-positive
and gram-negative bacteria, respectively.
1.1 PLANTAGO MAJOR L.
Plantago major is the member of the family of Plantaginaceae, which is a vastly diverse
genus, including around 256 species. This plant was born in Eurasia but now naturalized
elsewhere in the world. Even they can be found in many different habitats, they grow
best in wet areas such as river beds, coastal areas, drains or seepage areas around
buildings, hillsides, and can frequently be found at the side of the roads. As being a
temperature-zone plant, they can be seen at extreme ranges almost from pole to pole,
even they are very rare in lowlands. They grow on lands at sea level to 3500 m altitude,
in their wild form (Zubair 2010, TUBIVES)
3
1.1.1 Botany of the Plantago major L.
Taxonomic Hierarchy
Kingdom Plantae
Subkingdom Tracheobionta
Division Magnoliophyta
Class Magnoliopsida
Subclass Asteridae
Order Plantaginales
Family Plantaginaceae
Genus Plantago
Species Plantago major L.
Plantago major has ovate to elliptic leaves that forms basal rosette and can grow up to
30 cm in length. Leaves are usually green with purple shades, glabrous or hairy. The leaf
blade is either entire or toothed unevenly, and it contracts through the petiole. Leaf
petiole has almost the same length as leaf blade. They have short, stout and erect
herbaceous stems (Samuelsen, 2000). Plantago major may produce whitish color roots,
which can grow up to 1m (Sagar and Harper, 1964). The total number of the leaves, the
biomass buildup or the flowering time may vary greatly depending on the habitat of the
plant, but, usually the flowering time is in between May and September for temperature
zones (Sagar and Harper, 1964). Inflorescence of P. major is a spike, which is usually
simple but sometimes branched and can grow up to 30 cm in length. They can bloom
yellowish white flowers of 2–4 mm diameter. Grazing animals do not prefer to consume
spikes since they are hard compared to succulent and soft leaves. (Zubair, 2010)
1.1.2 Ethnobotanical Studies on P. major in Turkey
Plantago major species have widely been used as traditional medicine because of having
high degree of phenotypic content. The major morphological plasticity of Plantago
4
major has been biomass variations and water content as this was correlated in many
studied traits. Also, the soil variables such as moisture content, soil salinity, sulphates,
calcium carbonates, Ca++
ions and phosphorus in the soil has been found as the effective
contributors to the phenotypic plasticity of Plantago major (Serag et al., 2010). Thus,
the habitat of the plant has a great effect on the biological activity and P. major cultured
in Turkey needs to be determined for its antioxidant capacity and antimicrobial effect on
many human pathogenic bacteria.
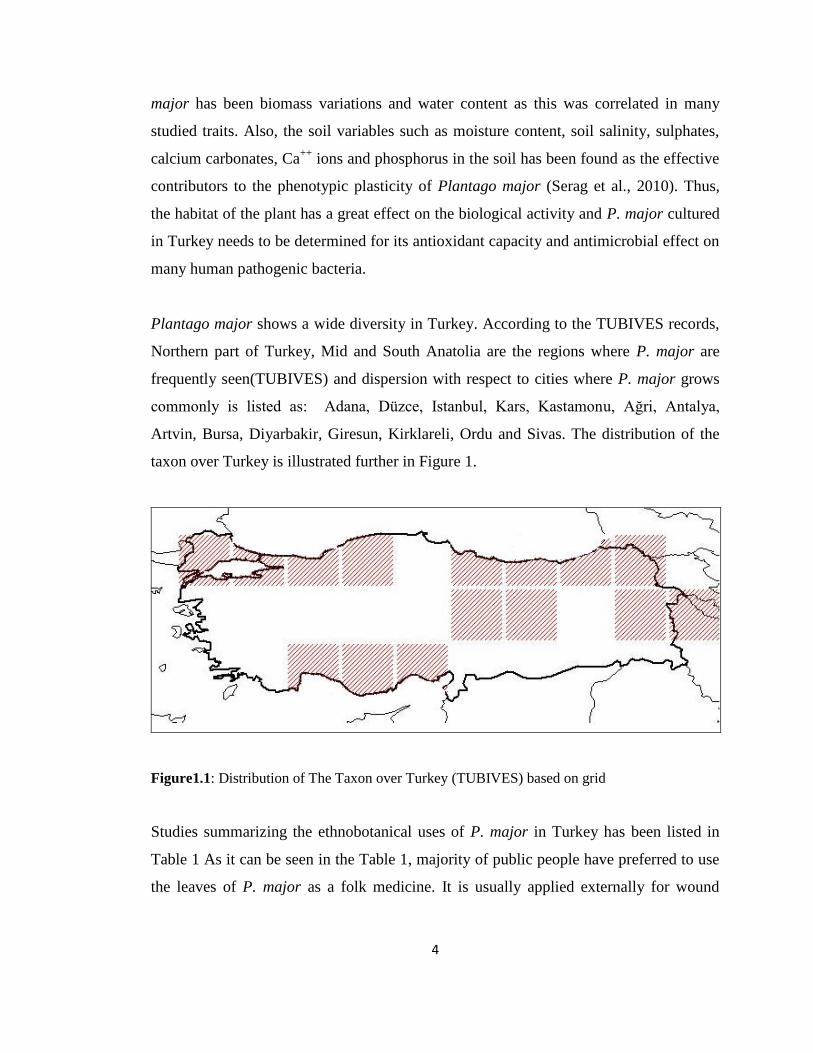
Plantago major shows a wide diversity in Turkey. According to the TUBIVES records,
Northern part of Turkey, Mid and South Anatolia are the regions where P. major are
frequently seen(TUBIVES) and dispersion with respect to cities where P. major grows
commonly is listed as: Adana, Düzce, Istanbul, Kars, Kastamonu, Ağri, Antalya,
Artvin, Bursa, Diyarbakir, Giresun, Kirklareli, Ordu and Sivas. The distribution of the
taxon over Turkey is illustrated further in Figure 1.
Figure1.1: Distribution of The Taxon over Turkey (TUBIVES) based on grid
Studies summarizing the ethnobotanical uses of P. major in Turkey has been listed in
Table 1 As it can be seen in the Table 1, majority of public people have preferred to use
the leaves of P. major as a folk medicine. It is usually applied externally for wound
5
healing or consumed as a drink for ulcer, cancer, kidney stone, and urethral
inflammation treatments (Table 1).
1.1.3 Medicinal Investigation of P. major
Current studies have been focused on the medicinal effects of P. major leaves, especially
on ulcer (Than et al, 1996; Yesilada et al., 1993), anti-inflammatory (Nathan and Hibbs,
1991; Flores, 2000) and cancer (Yokozawa et al, 1997) treatments. P. major leaves were
investigated for healing effect against alcohol- and aspirin-induced gastric ulcer (Atta
and El-Sooud, 2004; Than et al, 1996) on mice. In another study, the methanol and water
extract of leaves were examined for ulcer inhibition capacity, and it was shown that
water extract (1 g/kg) inhibited ulcer formation by 37% relative to 29% inhibition with
methanol. The combined methanol- and water extract (1.2 g/kg) resulted in best
inhibition with 40% reduced ulcer formation rate (Yesilada et al, 1993).
Similar to ulcer studies, P. major has also been showed to be successful against tumor
formation and infection development. P. major leaf extract has an inducing effect on
production of nitric oxide and tumor necrosis factor-alpha (TNF-∝) (Nathan and Hibbs,
1991). It is known that nitric oxide is to inhibit the synthesis of DNA and ATP; and
tumor necrosis factor-alpha (TNF-∝) is one of the essential mediators of host
inflammatory responses in natural immunity. Thus, P. major leaf extracts induces these
immunity parameters; and along with this, it is fair to consider P. major as clinically
relevant in numerous disease processes including tuberculosis, AIDS and cancer (Flores
et al., 2000).
Also, great antioxidant capacity of the extract of P. major was assigned to the
mechanisms that contribute to its wound healing properties (Yokozawa et al, 1997).
6
Tab
le 1
.1:
The
ethnobota
nic
al u
ses
of
P.
majo
r in
Turk
ey
7
Tab
le 1
.1 c
on
tin
ued
8
Tab
le 1
.1 c
on
tin
ued
9
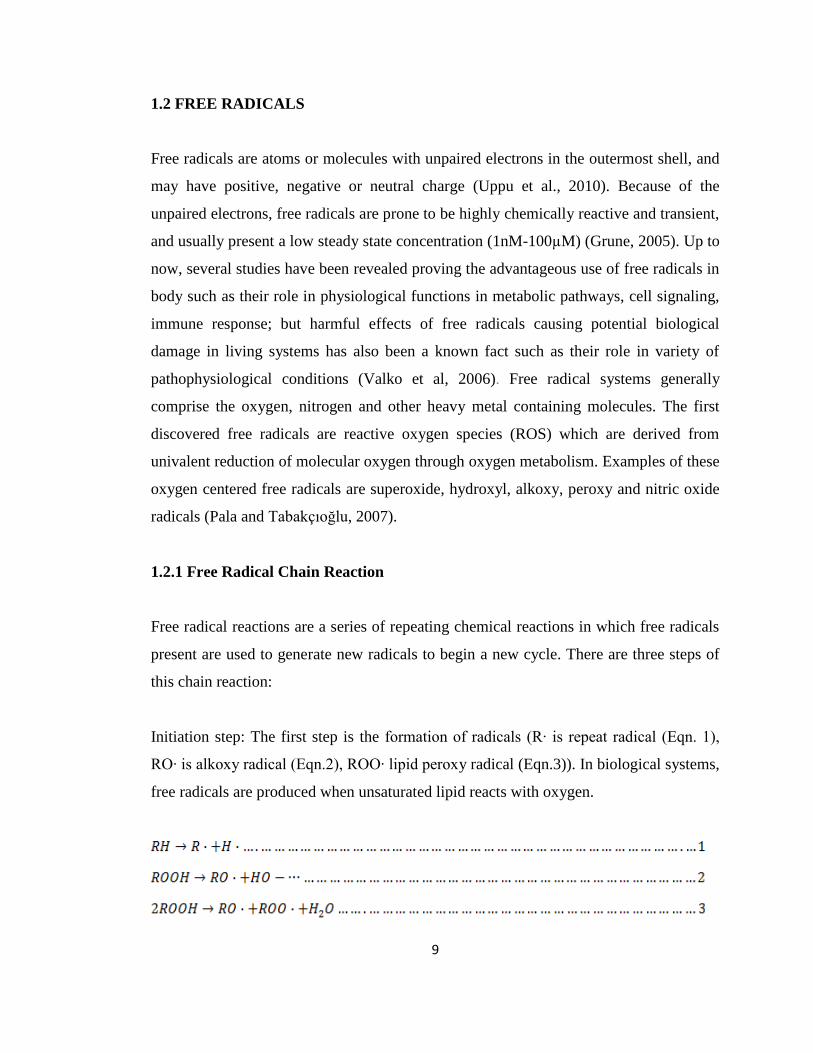
1.2 FREE RADICALS
Free radicals are atoms or molecules with unpaired electrons in the outermost shell, and
may have positive, negative or neutral charge (Uppu et al., 2010). Because of the
unpaired electrons, free radicals are prone to be highly chemically reactive and transient,
and usually present a low steady state concentration (1nM-100µM) (Grune, 2005). Up to
now, several studies have been revealed proving the advantageous use of free radicals in
body such as their role in physiological functions in metabolic pathways, cell signaling,
immune response; but harmful effects of free radicals causing potential biological
damage in living systems has also been a known fact such as their role in variety of
pathophysiological conditions (Valko et al, 2006). Free radical systems generally
comprise the oxygen, nitrogen and other heavy metal containing molecules. The first
discovered free radicals are reactive oxygen species (ROS) which are derived from
univalent reduction of molecular oxygen through oxygen metabolism. Examples of these
oxygen centered free radicals are superoxide, hydroxyl, alkoxy, peroxy and nitric oxide
radicals (Pala and Tabakçıoğlu, 2007).
1.2.1 Free Radical Chain Reaction
Free radical reactions are a series of repeating chemical reactions in which free radicals
present are used to generate new radicals to begin a new cycle. There are three steps of
this chain reaction:
Initiation step: The first step is the formation of radicals (R∙ is repeat radical (Eqn. 1),
RO∙ is alkoxy radical (Eqn.2), ROO∙ lipid peroxy radical (Eqn.3)). In biological systems,
free radicals are produced when unsaturated lipid reacts with oxygen.
10
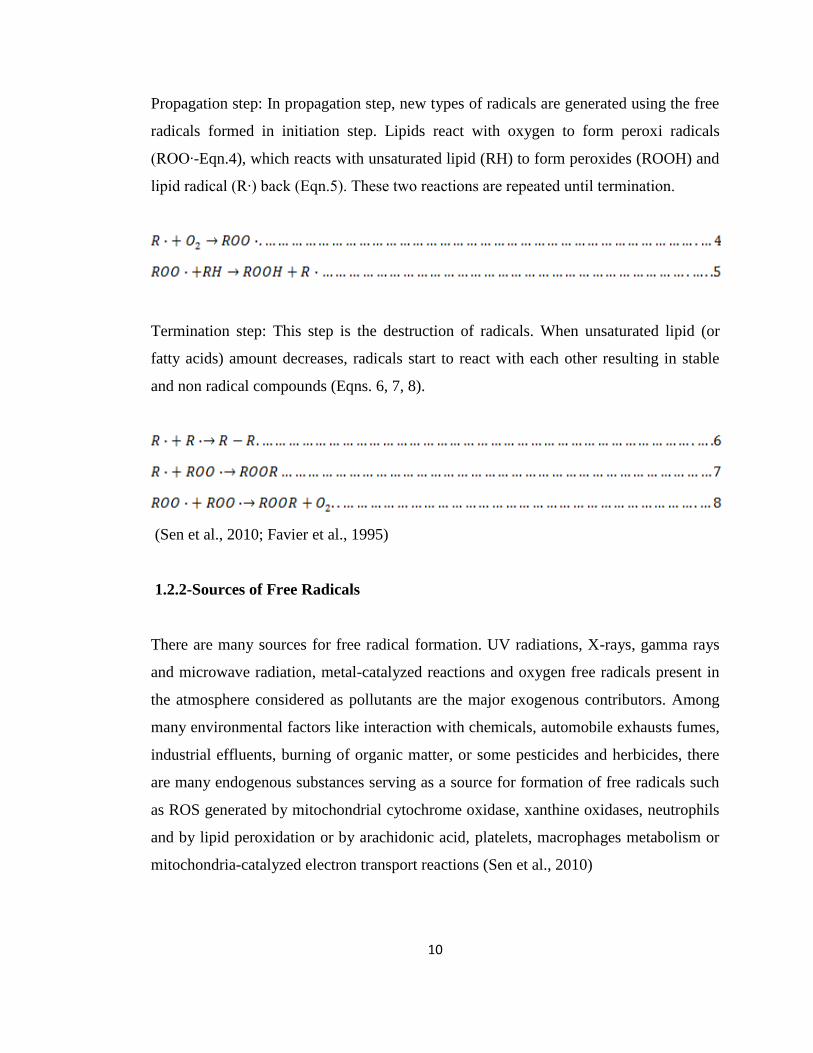
Propagation step: In propagation step, new types of radicals are generated using the free
radicals formed in initiation step. Lipids react with oxygen to form peroxi radicals
(ROO∙-Eqn.4), which reacts with unsaturated lipid (RH) to form peroxides (ROOH) and
lipid radical (R∙) back (Eqn.5). These two reactions are repeated until termination.
Termination step: This step is the destruction of radicals. When unsaturated lipid (or
fatty acids) amount decreases, radicals start to react with each other resulting in stable
and non radical compounds (Eqns. 6, 7, 8).
(Sen et al., 2010; Favier et al., 1995)
1.2.2-Sources of Free Radicals
There are many sources for free radical formation. UV radiations, X-rays, gamma rays
and microwave radiation, metal-catalyzed reactions and oxygen free radicals present in
the atmosphere considered as pollutants are the major exogenous contributors. Among
many environmental factors like interaction with chemicals, automobile exhausts fumes,
industrial effluents, burning of organic matter, or some pesticides and herbicides, there
are many endogenous substances serving as a source for formation of free radicals such
as ROS generated by mitochondrial cytochrome oxidase, xanthine oxidases, neutrophils
and by lipid peroxidation or by arachidonic acid, platelets, macrophages metabolism or
mitochondria-catalyzed electron transport reactions (Sen et al., 2010)
11
1.3 ANTIOXIDANTS
Antioxidant is defined as “any substance, when present in low concentration compared
to that of an oxidizable substrate, significantly delays or inhibit the oxidation of that
substrate” (Richer and Milbury, 2008)
As described previously, oxygen and nitrogen free radicals, ROS and RNS, are the
products of cellular metabolism in body. Living systems align themselves with these
species, since they can play a dual role as both harmful and advantageous species (Valko
et al., 2006). At low/moderate concentrations, they have many beneficial physiological
roles such as functioning in cellular responses against protection from infectious agents;
or they induce mitogenic response when present at low/moderate concentrations. In
reverse, high concentrations of free radicals may result in some harmful effects. For
example, they can attack to membrane lipids by generating carbon radicals. Carbon
radicals can react with oxygen to form peroxyl radicals, which in turn can conjugate
with fatty acids of membrane lipids to produce new carbon radicals. This chain reaction
mechanism is known as lipid peroxidation, and in biological systems, this occurs when
ROS/RNS overproduction happens. This indicates that even one free radical may affect
many molecules by initiating the lipid oxidation chain reaction and when there is a
deficiency of enzymes or antioxidants of interest, auto-oxidation reactions increase
exponentially. Thus, body has some defense mechanisms against the potential damaging
nature of free radicals, such as enzymes of superoxide dismutase and catalase; or water-
soluble and lipid-soluble molecular antioxidants (Croft, 2006)
1.3.1 Enzymatic Antioxidants:
Free radical reaction chain has three stages: initiation, propagation and termination.
Body defense mechanism against damaging effect of free radicals includes antioxidant
enzymes, which can be effective in each step of chain reaction mechanism to lower the
burden of free radicals. They act on precursor molecules by inactivating them to prevent
the ROS formation. (Mates et al., 1999)
12
1.3.1.1 Superoxide Dismutase (SOD)
One of two antioxidant enzymes that act at initiation step of auto-oxidation chain
reaction is superoxide dismutase (SOD). This enzyme catalyses the reduction reaction of
highly reactive O2- to less reactive H2O2 molecules (Eqn.9). There are three forms of
SOD which are Cu/Zn containing-SOD found in cytoplasm, Mn containing-SOD found
in mitochondria, and extra- cellular SOD (EC-SOD) in humans(Mates et al., 1999).
1.3.1.2 Catalase (CAT)
After dismutasing activity of SOD to convert O2- to H2O2, Fe- containing metallo
enzyme of catalase (CAT) enzyme can decompose the produced H2O2 molecules to form
water and molecular oxygen (Eqn.10). CAT, also, can react very efficiently with
hydrogen donors such as methanol, ethanol, formic acid, or phenols with peroxidase
activity (Eqn.11) (Mates et al., 1999; Garewal, 1997)
1.3.1.3 Glutathione Peroxidase (GPX)
In addition to two metalloenzymes of SOD and CAT described above, the glutathione
peroxidase (GPX) has an antioxidant capacity. Selenium-containing GPX acts during
propagation stage of auto-oxidation chain reaction and catalyses the decomposition
reaction of H2O2 by using the reduced glutathione (GSH) to form water and oxidized
glutathione (GSSH). Thus, GPX has a very important role in antioxidative defense
mechanisms (Eqn.12) (Mates et al., 1999, Garewal, 1997)
13
1.3.2 Non- Enzymatic Antioxidants
There are two types of non-enzymatic antioxidants: metabolic antioxidants and
nutritional antioxidants. Metabolic antioxidants are the endogenous. They are produced
by normal metabolism in living systems. Examples are: lipoid acid, glutathione, L-
ariginine, melatonin, uric acid, coenzyme Q10, bilirubin, metal-chelating proteins,
transferrin or glutathione. Reduced glutathione (GSH) can be produced in normal cells,
as well; they can be provided through diet. On the other hand, nutritional antioxidants
are exogenous, which means they cannot be found in body but can be taken from
outside. Examples are: omega-3 and omega-6 fatty acids, vitamin E and C, ad some
trace amount of metals such as selenium, manganese, zinc. Those metals can only serve
as antioxidant when incorporated into their respective enzymes. And the
phytoconstituents, which are employing a vital role in preventing the free radical
induced injuries in body (Sen et al., 2010).
1.4 PHYTOCHEMICALS
Up to now, more than 5000 phytochemicals have been identified but majority still
remains undefined and is waiting to be discovered and characterized to fully understand
their health benefits. Besides, as growing evidences accumulate, it becomes obvious that
this is just a tip of iceberg, and even greater health advantages than what is currently
understood. The interest on natural phytochemicals increases because they are effective
on reduction of free radical formation which is the foremost contributor in the etiology
of many diseases. (Liu, 2003). In order to suppress or prevent the oxidative stress in
cells induced by free radicals, abundant amounts of antioxidants need to be consumed.
The antioxidants (phytochemicals) can be taken by consuming various nutrient rich
vegetables, fruits or grains. This may strengthen the defense mechanism against free
radicals in cellular systems, and decrease the oxidative damage, and in parallel the risk
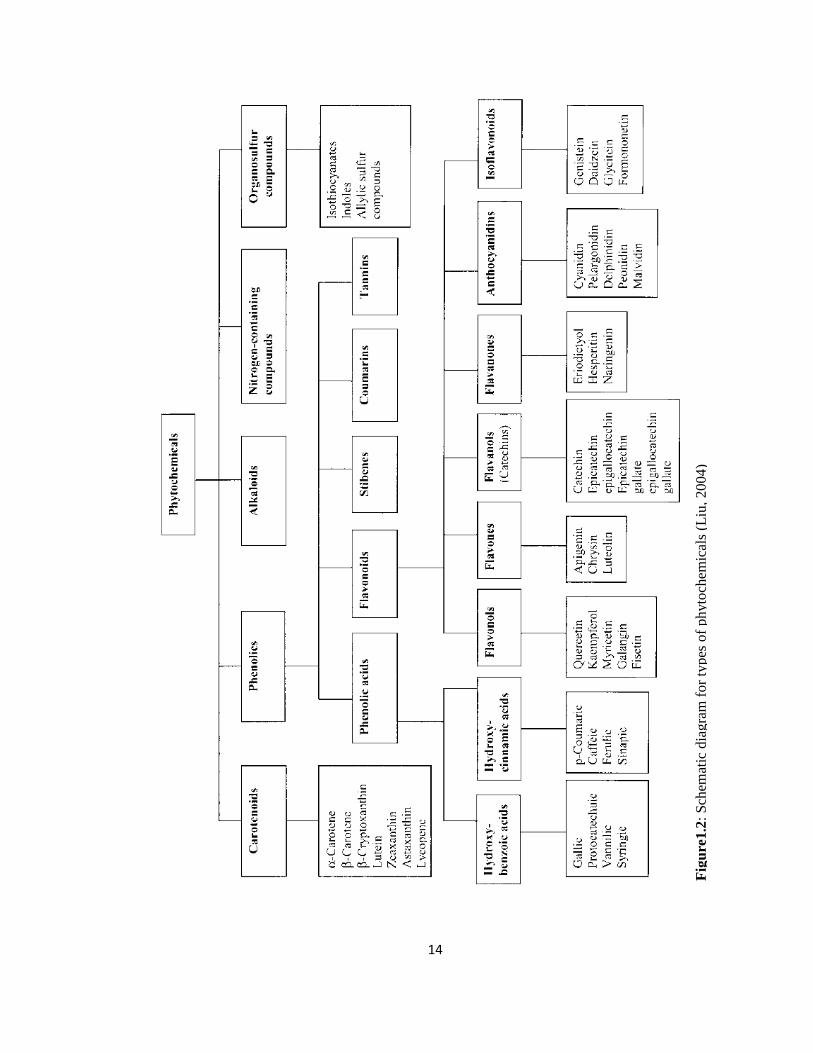
of disease which can be related with oxidative damage In Figure 1.2 the types of the
phytochemicals are summarized. In general, they are classified in 5 sub-classes which
are: carotenoids, phenolics, alkaloids, nitrogen-containing compounds, and organosulfur
14
Fig
ure
1.2
: S
chem
atic
dia
gra
m f
or
types
of
phyto
chem
ical
s (L
iu,
2004)
15
compounds. Among those, phenolics and carotenoids are the ones that studied the most.
(Liu, 2004)
1.5 ANTIOXIDANT CAPACITY EVALUATION METHODS USED
There is an increasing demand for antioxidants as they are capable of suppress the
deleterious effects of free radicals in body, and natural sources of antioxidants are more
preferable compared to synthetic ones (Abdalla and Roozen, 1999). Hence, the methods
to estimate the efficiency of antioxidants become important as the interest in
antioxidants from natural sources get popular (Schwarz et al., 2000)
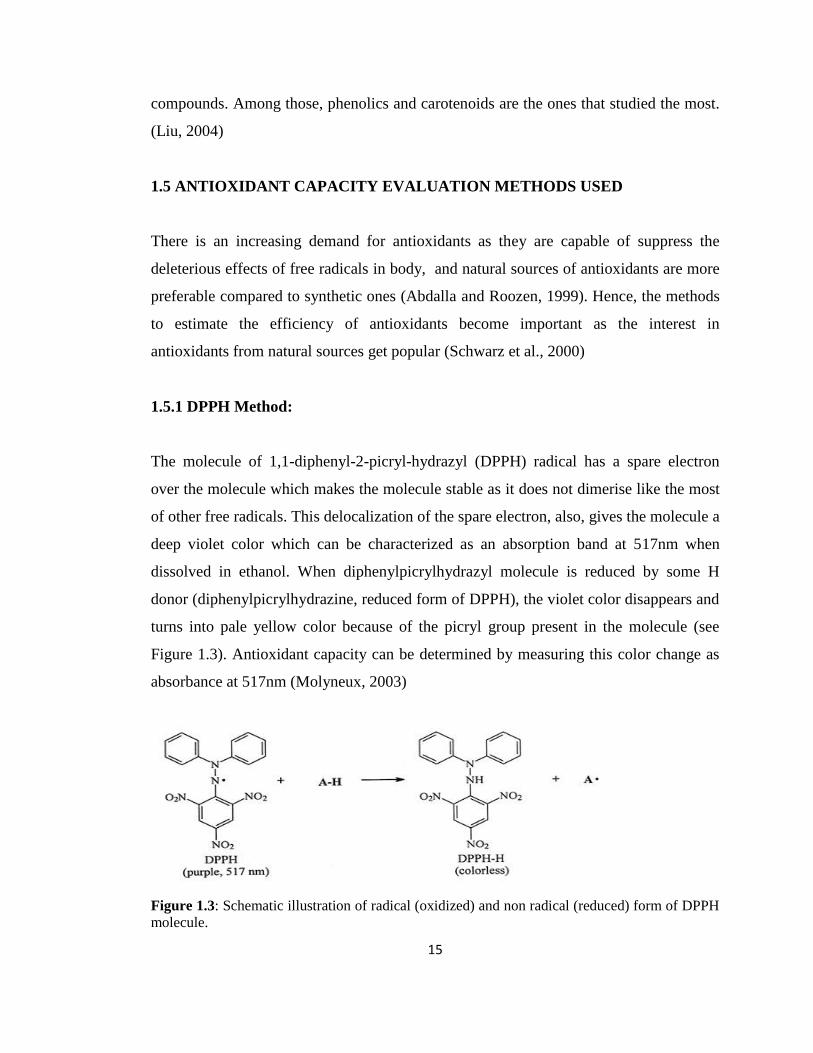
1.5.1 DPPH Method:
The molecule of 1,1-diphenyl-2-picryl-hydrazyl (DPPH) radical has a spare electron
over the molecule which makes the molecule stable as it does not dimerise like the most
of other free radicals. This delocalization of the spare electron, also, gives the molecule a
deep violet color which can be characterized as an absorption band at 517nm when
dissolved in ethanol. When diphenylpicrylhydrazyl molecule is reduced by some H
donor (diphenylpicrylhydrazine, reduced form of DPPH), the violet color disappears and
turns into pale yellow color because of the picryl group present in the molecule (see
Figure 1.3). Antioxidant capacity can be determined by measuring this color change as
absorbance at 517nm (Molyneux, 2003)
Figure 1.3: Schematic illustration of radical (oxidized) and non radical (reduced) form of DPPH
molecule.
16
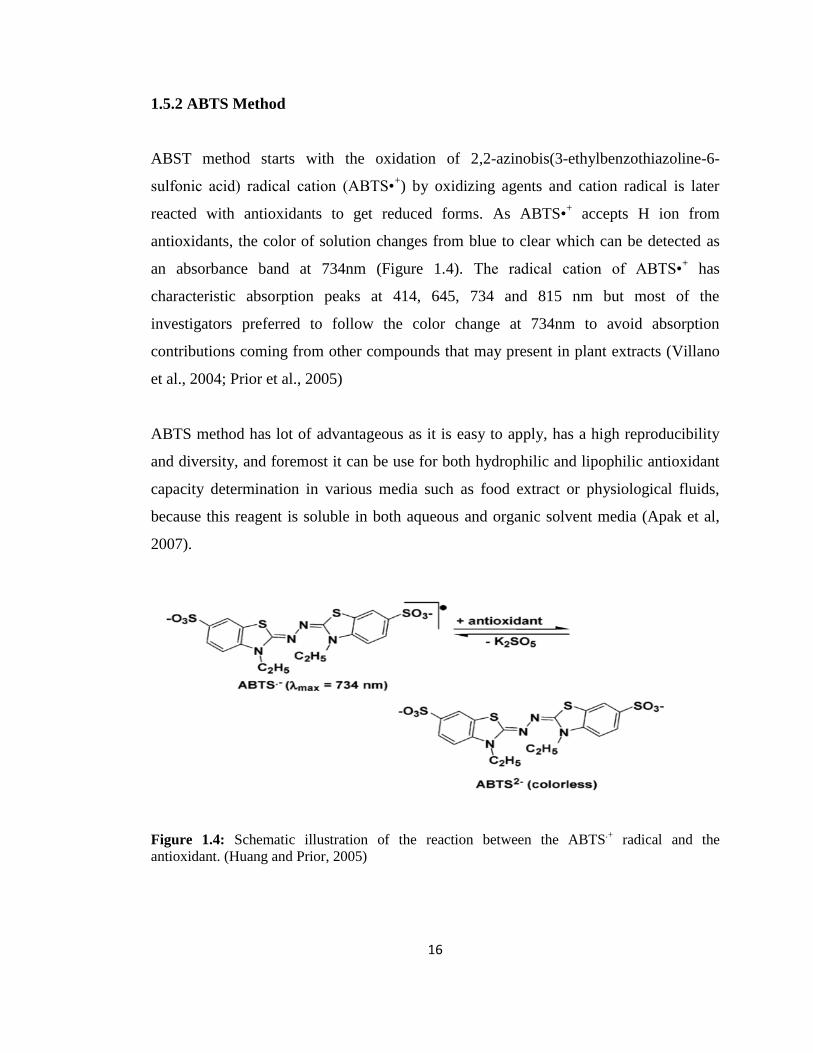
1.5.2 ABTS Method
ABST method starts with the oxidation of 2,2-azinobis(3-ethylbenzothiazoline-6-
sulfonic acid) radical cation (ABTS•+) by oxidizing agents and cation radical is later
reacted with antioxidants to get reduced forms. As ABTS•+ accepts H ion from
antioxidants, the color of solution changes from blue to clear which can be detected as
an absorbance band at 734nm (Figure 1.4). The radical cation of ABTS•+ has
characteristic absorption peaks at 414, 645, 734 and 815 nm but most of the
investigators preferred to follow the color change at 734nm to avoid absorption
contributions coming from other compounds that may present in plant extracts (Villano
et al., 2004; Prior et al., 2005)
ABTS method has lot of advantageous as it is easy to apply, has a high reproducibility
and diversity, and foremost it can be use for both hydrophilic and lipophilic antioxidant
capacity determination in various media such as food extract or physiological fluids,
because this reagent is soluble in both aqueous and organic solvent media (Apak et al,
2007).
Figure 1.4: Schematic illustration of the reaction between the ABTS.+
radical and the
antioxidant. (Huang and Prior, 2005)
17
1.5.3 Total Phenol
Total phenol determination assay depends on the oxidation of phenols by
molybdotungstophosphoric heteropolyanion reagent (namely, Folin-Ciocalteu (FC)
Reagent). As phenol oxidation happens, the yellow color of the
molybdotungstophosphoric heteropolyanion reagent turns into
molybdotungstophosphate blue, and this color change is recorded as absorbance at
750nm. In this method, the operating conditions have a great influence on results
because of the low stability of the oxidizing reagent, and so as the blue color, in alkaline
solutions, which is a must to react phenols with the reagent rapidly. Thus, a well known
phenol, usually the gallic acid, is used as a reference standard in order to obtain
satisfactory analytical results by providing identical conditions for gallic acid, the known
phenol used as the reference standard.
Phenolic compounds can only react with FC reagent when medium is basic, because FC
reagent is not only specific to phenolic compounds but also to nonphenolic compounds
like vitamin C, Cu(I), etc. The mechanism involves the dissociation of phenolic proton
to phenolate anion, which later reduces the FC reagent and blue color appears. And this
blue compounds formed are independent of the specific structure of phenolic
compounds, but valid for all phenols. Even FC reagent has a nonspecific affinity for
phenol groups; this method is still easy to handle, convenient, and reproducible. That‟s
why FC reagent became a routine assay to study phenolic antioxidants (Huang and prior,
2005)
1.5.4 Total Flavonoid
In order to determine the total flavonoids in samples, the classical aluminum chloride
colorimetric test was applied. The basic principle of this method depends on the reaction
between the aluminum chloride and C-4 keto group or either the C-3 or C-5 hydroxyl
group of flavones and flavonols. The resultant has a characteristic absorption band at
510 nm as visually observable pink color appears. As well, AlCl3 can react with the -
18
dihydroxyl groups in the A- or B-ring of flavonoids to form acid labile complexes
(Chang et al., 2002) In fact, the AlCl3 colorimetric test is not a liable test to determine
the flavonoids that do not have characteristic chelating functional groups for Al binding.
Thus, this method is used to evaluate the flavones like chrysin, apigenin, luteolin, and
flavonols like quercetin, myricetin, morin, rutin but it is not suitable for flavanones and
flavanonols (Apak et al, 2007).
1.6 ANTIBACTERIAL ACTIVITIES
1.6.1 Gram-positive Bacteria Used in This study
1.6.1.1 Staphylococcus aureus:
Appearance: Medium to large; most of the colonies pigmented pale yellow smooth,
whole, translucent yellow; most colonies beta-hemolytic.
Habitat: Normal flora of human anterior nares, nasopharynx, perineal area, and skin; can
colonize various epithelial or mucosal surfaces.
Mode of transmission: Spread of patient‟s endogenous strain to normally sterile site by
traumatic introduction (e.g., surgical wound or microabrasions).Also may be transmitted
person to person by fomites, air or unwashed hands of health care workers, especially in
the nosocominal setting. May be transmitted from infected skin lesion of heal care
worker to person.
Virulance Factor: Produces and secretes toxins and enzymes that have a role in virulence
acts on the cell membranes and mediate the cell destruction. Leucocidin (PVL) mediates
destruction of phagocytes. Clumping factor, coagulase, and hyaluronidase enhance
invasion and survival in tissues.
19
Spectrum of disease and infections: Infections generally involve intense suppuration and
destruction (necrosis) of tissue. Infections can be generally grouped as localized skin
infections such as folliculitis, various wound infections; deep infections that spread from
skin to cause bacterimia.(Forbes et al., 2007)
1.6.1.2 Streptococcus pyogenes:
Appearance: Large colonies; translucent to opaque; flat; glossy; zone of beta hemolysis.
Habitat: Inhabits skin and upper respiratory tract of humans. Not considered part of
normal flora but may be carried on nasal, pharyngeal, and some times, anal mucosa.
Presence in specimens is almost always considered clinically significant.
Mode of transmission: Person to person by direct contact with mucosa or secretions, or
by contaminated droplet produced by coughs, sneezes. Once exposed, recipient may
become colonized, with subsequent development of infection.
Virulence Factor: Protein F mediates epithelial cell attachment, and M protein is anti
phagocytic; produces several enzymes and hemolysins that contribute to tissue invasion
and destruction.
Spectrum of disease and infections: Acute pharyngitis, impetigo, erysipelas, necrotizing
faciitis, and myocitis; bacteremia with potential for infection any of several organs,
pneumonia. (Forbes et al., 2007)
1.6.2 Gram-negative Bacteria Used in This study
1.6.2.1 Escherichia coli:
Appearance: Flat, dry, pink colonies enclosed with darker pink area
20
Habitat: Normal bowel flora of humans and other animals may also inhabit female
genital tract.
Mode of transmission: Varies with the type of E.coli organism may be endogenous or
spread person to person, fecal-oral spread between humans via contaminated food or
water or consumption of undercooked beef or milk from colonized cattle.
Virulence Factor: Several, including endotoxin, capsule production and pilithat mediate
attachment to host cell.
Spectrum of disease and infections: Urinary tract infections, bacteremia, nosocomial
infections of various body sites. Most common cause of gram-negative nosocomial
infections. (Forbes et al., 2007)
1.6.2.2 Proteus mirabilis:
Appearance: May swarm depending on the amount of agar in the medium. Characteristic
foul smell
Habitat: Normal human gastrointestinal flora
Mode of transmission: Endogenous, or person to person spread, especially in
hospitalized patients.
Virulence Factor: Several factors, including endotoxins, capsules, adhesion proteins, and
resistance to multiple antimicrobial agent.
Spectrum of disease and infections: Wide variety of nosocomial infections of
respiratory tract, urinary tract, blood and several other normally sterile sites; most
frequently hospitalized and seriously debilitated patient(Forbes et al., 2007)
21
1.7 PHYTOCHEMICALS AS ANTIMICROBIAL AGENTS
The synthetic drugs have modest antimicrobial activity even they have been successfully
designed and used as enzyme inhibitors, probably because of the complex structure of
cell uptake of those drugs (Cushine, 2005). Thus, scientist tended to look for more
effective plant based antimicrobial sources as an alternative to synthetic ones and now it
is estimated that more 50% of the Western drugs are plant derived, which have been
once used in crude form in traditional or folk healing practices. Plant based drugs has
proven themselves as they serve relatively safer and more affordable treatments. Since
this is the way it is, there has been an improved interest in natural products resulted from
factors such as consumer‟s displeasure from conventional medicines and boosted
confidence in natural products as being superior. Changing law enforcements to supply
structure-function claims, national concerns about health care cost or even changes in
advertising have contributed to enhanced interest in natural products. Thus, it is fair to
consider including antimicrobials into medicines is rewarding for both standpoints of
drug development and phytomedicines (Ciocan and Bara, 2007)
1.7.1 Major Groups of Antimicrobial Compounds from Phytochemicals
1.7.1.1 Simple Phenols and Phenolic Acids:
Simple phenols are the simplest bioactive phytochemicals comprise of a phenolic ring.
The toxicity of phenols to microorganisms were found to depend on the number of
hydroxyl groups bound to phenol group since increased hydroxylation results in
increased toxicity. Some other researchers have proposed that more highly oxidized
phenols are inhibitorier. The toxicity to microorganisms are bond to enzyme inhibition
as a result of the reaction between oxidized compounds and sulfhydryl groups, or may it
is just because of nonspecific interactions of phenols with the proteins. Essential oils are
phenolic compounds having a C3 side chain at a lower level of oxidation and they are
often referred as antimicrobial as well (Cowan, 1999)
22
1.7.1.2 Quinones:
Quinones have highly reactive characteristic which is unique in nature. They are
composed of aromatic rings with two ketone substitutions. They are responsible from the
process known as browning reaction seen in cut or injured fruits and vegetables. The
antimicrobial property of quinines depends on their irreversible binding with
nucleophilic amino acids in proteins, which usually results in function loss of protein
bound. That‟s why quinines are very popular as antimicrobial agents. Cell-wall proteins,
surface-exposed adhesins, and many membrane bound enzymes are targeted structures
for quinones.
Potential targets in the microbial cell are surface-exposed adhesins, cell wall
polypeptides, and membrane-bound enzymes. Quinones may also deliver substrates
unavailable to the microorganism. As with all plant-derived antimicrobials, the possible
toxic effects of quinones must be thoroughly examined (Ciocan and Bara, 2007)
1.7.1.3 Tanins:
Tanin is a general name of a class of polyphenolic compounds that binds to various
organic compounds such as amino acids and proteins via hydrophobic effects or by
hydrogen bonding or covalent bonding. Thus it is considered that the antimicrobial
properties of tannin come from their ability to inactivate microbial adhesins, transport
proteins or enzymes. Plant based tannin can be classified as hydrolyzable tannins, e.g
gallic acid, non- hydrolyzable tannins, e.g., flavones. Tanins may be formed from flavan
derivatives located in woody tissues of plants or from quinine units by polymerization.
Besides their capability to form complexes with proteins, they were assigned to many
other molecular activity in human such as host-mediated tumor activity, phagocytic cells
stimulation or anti-infective actions (Cowan, 1999).
23
1.7.1.4 Alkaloids:
Alkaloids are one of the most effective therapeutically active plant derived compounds.
They are generally composed of rings of carbon atoms with nitrogen atom in ring.
Therapeutical efficacy comes from their very high toxicity capacity on microorganisms.
That‟s why they usually applied externally instead of using as folk medicine. The
antispasmodic, analgesic, and bactericidal properties of plant derived alkaloids and their
synthetic derivates make them popular all over the world (Ciocan and Bara, 2007)
1.7.1.5 Flavones, Flavonoids, and Flavonols:
One of the undoubted role of favonoids and related polyphenols in plants is protecting
against microbial invasion (Harborne and Williams, 2000). Flavonoids are polyphenolic
compounds containing 15 C atoms with 2 ring structure bound by a 3-C bridge. They are
sub-classed into 6 groups as flavonols, flavan-3-ols, flavones, isoflavones, flavanones,
and anthocyanidins according to different forms of central C-ring (Fraga, 2010)
Antibacterial property of flavonoids comes from the inhibitory effect of flavonoids on
the DNA and RNA synthesis, which was proposed as intercalation or hydrogen bonding
of the B ring of the flavonoids with the nucleic acid bases has an inhibitory action on
nucleic acid formation. Another research claims that, flavonoids have an inhibitory
effect on function of cytoplasmic membrane which was supported with evidence of
reduced the fluidity of cell membranes when flavonoids (specifically sophoraflavanone
G) are present. Another mechanism of antimicrobial activity of flavonoids is related with
the energy metabolism inhibition. The theory is that the licochalcones may be interfering
with energy metabolism in a way that it affects the energy required for metabolite uptake
or macromolecule biosynthesis (Cushine and Lamb, 2005)
24
1.8 METHODS USED FOR EVALUATION ANTIBACTERIAL ACTIVITY
1.8.1 Minimum Inhibitory Concentration
Minimum inhibitory concentration (MIC) is described as the lowest concentration of an
antibacterial substance that will provide a complete inhibition on the observable growth
of a microorganism after 24h incubation. (MIC) is thought as „gold standard‟ for
establishing the susceptibility of organisms to antibacterial. For that reason it is used to
evaluate the efficiency of all other methods of susceptibility testing. (Andrews, 2001)
With the purpose of test natural substances, MIC is recommended as general standard
method.
1.8.2 Minimum Bactericidal Concentration
The minimal bactericidal concentration (MBC) is described as the lowest concentration
of an antibacterial substance killing the 99.9% of bacterial inoculums. As MIC is the
inhibition effect of the antibacterial substance on the growth of the bacteria, it is possible
that if antibacterial substance is removed, the bacteria can start to grow again. To find
out the ability of the antibacterial substance to kill the bacteria, a growth test can be
performed and this test is called as the MBC (Schwalbe et al., 2007).
1.8.3 Agar Disc Diffusion Assay
Disc diffusion test is a general antibacterial susceptibility testing procedure. The
suspension pathogen that is including definite number of uncontaminated pathogen
spread onto the whole surface of the proper agar medium to inoculate it. Paper discs
impregnated with different antibiotic or substance thought has antimicrobial effect, are
placed on to the inoculated agar medium and incubated. Meanwhile they penetrate to
agar media, if the pathogen sensitive to the antibacterial substance growth inhibition is
seen as apparent region around the disk. Some conditions like type of medium, density
25
of inoculums on the plates etc. for the procedure must be standardized in order to
interpret the presence or diameter of the apparent region correctly (Singelton, 2004).
1.9 SCOPE OF THE STUDY
This study was designed to investigate the antioxidative and antimicrobial properties of
P. major leaves extracts. Purification of bioactive compounds from the leaves was
carried out by applying the fractionation method. Isolates in the most active fraction then
were tried to identify. Furthermore, the crude extracts and fractions were examined for
their antioxidative activity and for their growth inhibitory or bacterisiodal effects on S.
aureus, E. coli, P. mirabilis, and S. pyogenes.
26
CHAPTER 2
MATERIALS AND METHODS
2.1 MATERIALS
2.1.1 Chemicals
Chromatography grade methanol using in the extraction assay and HPLC assay,
chromatography grade hexane, chloroform, diethyl ether, ethyl acetate, which were used
for fractionation, and acetonitrile for HPLC were taken from Merck (Darmstadt,
Germany), and magnesium sulfate was taken from Sigma Chemical Company (St.Louis,
MO, USA).
To obtain ultra pure water (18.2 M ohm.cm) Milli-Q system (Milli-pore, Bedford, MA,
USA) was used.
Not reusable syringe filters (pore size: 0.22 μm and 0.45 μm ) were taken from Millipore
Corporation (Bedford, MA USA) before injection of extracts and sterilize solvent used
for antimicrobial studies.
Gallic acid, trolox, caffeic acid, catechin, tannic acid, rutin, quercetin, 2,2'-azino-bis (3-
ethylbenzthiazoline-6-sulphonic acid) (ABTS), 6-hydroxy-2,5,7,8-tetramethylchroman-
2-carboxylic acid (trolox), 2,2-diphenyl-1-picrylhydrazyl (DPPH), sodium carbonate
(Na2CO3), sodium hydroxide, aluminum chloride were taken from Sigma Chemical
27
Company (St.Louis, MO, USA). Folin Ciocalteu‟s phenol reagent was taken from Merck
(Darmstadt, Germany).
Streptococcus pyogenes code: (RSKK 03019, ATCC 19615), Proteus mirabilis (code:
RSKK 737, Pasteur Institute), Staphylococcus aureus (code: RSKK 95084, Pasteur
Institute), Escherichia coli (code: RSKK 234, Pasteur Institute) used for antibacterial
experiments were taken from Refik Saydam Hygiene Center.
Luria Bertani agar, Luria Bertani broth, Brain-Heart Infusion agar, Brain Heart Infusion
broth, and Muller-Hinton agar and Muller-Hinton broth were taken from Merck.
(Darmstadt, Germany)
Ready to use sheep-blood agar plates, to ensure long cultivation of bacteria, were bought
from OR-BAK (Istanbul, Türkiye).
6 mm diameter empty sterile discs for antibacterial activity test used in agar diffusion
assay were taken from Oxoid (Hants, UK).
Standard antibiotic discs Gentamycin (10 mcg), Trimethoprim, Clindamycin, Penicilin,
Tetracyclin and Kanamycin (30 mcg) were bought from Bioanalyse (50 susceptibility
tests for in vitro diagnostic use).
Gentamycin powder which is used for MIC experiments (cell culture tested grade) was
taken from Sigma-Aldrich (Germany).
Penicillin G Potassium powder which is used for MIC experiments (cell culture tested
grade) was taken from (St.Louis, MO, USA)
28
2.1.2 Apparatus
For the spectroscopic experiments Cary 50 Bio UV-VIS spectrophotometer (Varian)
were used.
Apparatus which are used throughout this study were; rotary evaporator (Heidolph
Laborota 4000) ultrasonic bath (Bandelin Sonorex); stainless-steel blender (Waring,
32BL80); Oval-rotating incubator (Optic Ivymen System).
Class II Safety Cabinet (ESCO, Thailand) was used for antimicrobial assays.
ELISA, 96-well microplate reader (Bio-tek, Elx808, Germany) was used from Prof. Dr.
Mesude İşcan Laboratory in Biological Sciences Department, METU.
Nuve EN-500 incubator, Rotary evaporator (Heidolph Laborata 4000
12 multichannel 5-50 μL, 8 multichannel 5-50 μL, and 12 multichannel 100-300 μL
pipettes (Thermo Electron Corporation, Finnpipette) were used during the antibacterial
activity tests.
HPLC analysis were performed using an analytic apparatus including online degasser
unit, detection systems with both photodiode array (2996 Waters) detectors and a multi
wavelength fluorescence detector (Waters, 2475). A multi solvent delivery system
(Waters, 600E), 100μl sample loops were used for analytical HPLC sample injections.
The manual sample injectors for analytical (Hamilton model 700 Nr) were used.
Stationary phases used for analytical methods was a Symmetry C18 reverse phase
column, 5 μm, 4.6 x 150mm (Part No: WAT045905) was utilized. Data acquisition and
quantification were performed with Waters Empower Software. HRMS analysis were
performed with Waters SYNAPT MS System, in Central Laborary, METU.
29
2.2 METHODS
2.2.1 Extraction
Plantogo major leaves were gifted from Van Yüzüncüyil University identified by Fevzi
Özgökçe and a sample of the plant kept at the Herbarium of Biology Department of the
Van Yuzuncuyil University. A classical methanol extraction method was applied.
Briefly, 160 grams of shade dried plant leaves were ground to get similar size of
powdered plant material with a Waring blender. A 40 g sample of ground leaves portion
was mixed with 400 mL methanol in dark colored bottles for the extraction process.
Each sample bottle was first subject to ultrasonification for 30 minutes in an ultrasonic
bath. Ultrasonicated sample was then incubated in oval-rotating incubator at a fixed 180
rpm for 24 h at 25oC. Resulted suspension was filtered through white watman filter
paper. Pellet was re-extracted using methanol repeatedly for 2 more times. But each
time the amount of the methanol was 100mL decreased. Three filtrates were collected to
remove the methanol by keeping in rotary evaporator at 30oC. The extraction yield was
calculated as the weight percentage. Crude methanol extract was kept at -20oC until
further experiments.
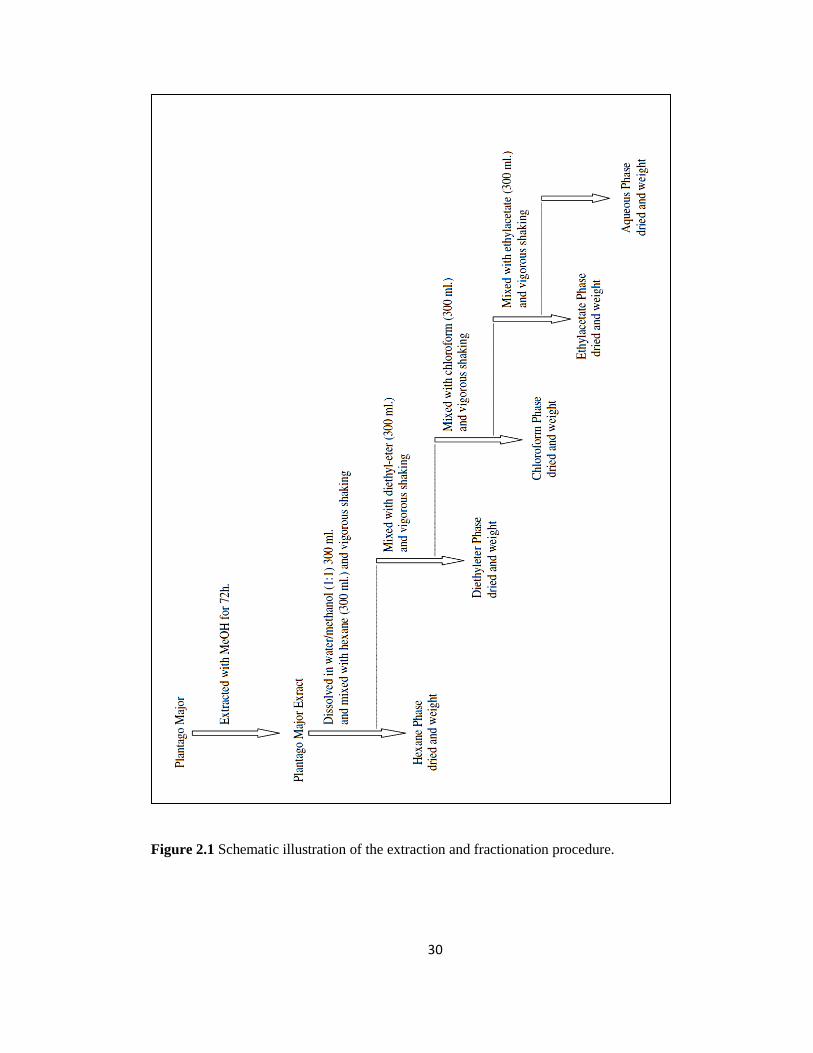
2.2.2 Fractionation of Crude Extract
The fractionation of crude extracts was performed by using solvents in increasing
polarity from non-polar to polar. The fractionation method described by Naczk and
Shahidi (2004) was adapted. First, a 3.7 g of crude extract was dissolved in a total 300
mL of water /methanol mixture (1:1 v/v) and immediately a 300 mL hexane was added
in a separatory funnel, and mixture was vigorously shaken and kept steady until organic
and aqueous phase were separated. Aqueous phase, at the bottom of the separatory
funnel, was drained into a beaker for the further fractionation steps; on the other hand
the organic phase (hexane) was transferred into rotary evaporator for evaporation. This
separation procedure on the aqueous phase was repeated until organic phase was
completely transparent.
30
Figure 2.1 Schematic illustration of the extraction and fractionation procedure.
31
The trace amount of water left in the organic phase was absorbed by using anhydrous
magnesium sulfate at the end of each step. The organic phase (hexane) collected from
separation method was evaporated to dryness evaporating and was stored at +4 oC until
analysis. Fractionation steps were further continued with aqueous phase mixed with
organic solvents in increasing polarity. The second fractionation steps were carried out
with, mixing diethyl ether and aqueous phase. The other applied organic solvents were
chloroform and ethyl acetate in given order. Each fractionated phase was evaporated to
dryness and was kept at +4oC. The yield of each fractionation step was determined in
terms of (w/w) % per 3.7 g crude extract. The residual aqueous phase was liyophilized
and kept for further analysis. Figure 2.1 summarizes the extraction and fractionation
procedures.
2.2.3 Analytical High Performance Liquid Chromatography (HPLC) Analysis
Ethyl acetate fraction which has the heights antioxidant capacity worthed to analyze for
its bioactive compounds was analyzed by using HPLC-DAD. The operating conditions
were arranged as described previously described in our laboratory: “Mobile phase was
consisted of two mixtures. Solution A was water, solution B was consist of acetonitrile,
methanol and 2% acetic acid in a ratio of 2:2:1. The gradient was linear with 99% from
0 to 10th min, 85% at 11th min., 65% at 50th min and 0% at 74th 85th minutes of
solution A. Then column was washed with 100% solution B and re-equilibriated for 15
min. All runs were carried out at a flow rate of 1.3 mL/min and a constant column
temperature of 30 °C. Stationary phase was Reverse Phase Symmetry Column – C18.
4.6 x 150mm, 5μm (4.6mm: column internal diameter; 150mm: column length; 5 μm:
column dimension) Absorption spectra were observed in the range of 210-700 nm by
diode array detector” (Nebigil, 2011).
32
2.2.4 Determination of Antioxidant Capacity
Antioxidant capacities of the crude extract and fractions were evaluated using DPPH
radical scavenging, ABTS methods and calculating the total phenolic content and total
flavonoid content.
2.2.4.1 DPPH Method
DPPH procedure was taken from (Blois, 1958) with a modified protocol adapted from
Coruh et. al was utilized to decide DPPH radical scavenging capacity (Coruh et al.,
2007). A 0.05 mg/mL DPPH solution was prepared by dissolving 15 mg of DPPH
radical in 300 mL absolute ethanol to get approximately 1.4 absorbance unit at 517nm.
Varying concentrations of crude extract and fraction mixtures in methanol were prepared
and EC50 values were determined in order to compare the EC50 values of known
standard of quercetin prepared at varying concentrations in methanol. The time needed
to the complete the reaction was optimized for each standard, crude extract and
fractions, separately. The absorbance values were recorded against ethanol after adding
100µL of sample (standards, crude extract and fractions) into 1400µL DPPH radical
solution at the end of previously optimized time period. All the experiments were carried
out in duplicates and repeated for three different assays.
The percentage of radical scavenging capacity (RSA %) was calculated according to the
following equation:
Where, A0 is the absorbance unit of the blank, which is 1400µL DPPH radical solution
with 100 µL pure methanol, A1 is the absorbance unit of mixture of 100µL of quercetin
standards/crude extracts/fractions at varying concentration in 1400 µL DPPH solution at
optimized incubation time.
33
EC50 values were calculated in order to evaluate the antioxidant capacity. EC50 values
were thought as the concentration of substance needed to reduce the % 50 DPPH activity
by means of color change. EC50 values were calculated from Equation 2 by using the
graph of RSA (%) versus final concentration of substance (mg/ml).
Where, y is the percent activity (%), x is the corresponding concentration (mg/ml), TOP
corresponds to the highest observed RSA (%) and BOT is the lowest observed RSA (%)
values.
2.2.4.2 ABTS Method
2,2'-azino-bis(3-ethylbenzthiazoline-6-sulphonic acid) ABTS method was performed as
previously described by Re et al (Re et al., 1998 ) ABTS radical cation (ABTS.+
) was
formed by utilizing the reaction between ABTS and potassium persulfate. The
antioxidant capacity values were given in terms of trolox equivalent antioxidant capacity
(TEAC) value. TEAC values for crude extract and fragments were calculated by taking
the ratio of slopes of RSA (%) versus concentration (mg/ml) graphs for samples to
standard (trolox). A stock mixture with final concentration of 7mM ABTS and 2.45mM
potassium persulfate in ultra pure water was prepared and kept in dark room overnight
before use (Figure 2.2 ) The working solution was prepared by diluting 1 mL of ABTS
stock solution in 100mL pure ethanol in order to get approximately 0.70 (±0.02)
absorbance unit at 734 nm. A 2.5 mM stock trolox solution was prepared in methanol
and serial dilutions were prepared by taking 2.0, 4.0, 6.0, 8.0 mL from stock trolox
solution and completing to 10 mL with methanol. A 10 µL from each diluted trolox
solution having varying concentrations (final concentrations of 5.0, 10.0, 15.0 and 20.0
µM trolox in the cuvette ) was added in 1ml ABTS solution as described above after the
dilution in 100 mL ethanol and resultant absorbance (trolox + ABTS) were recorded at
34
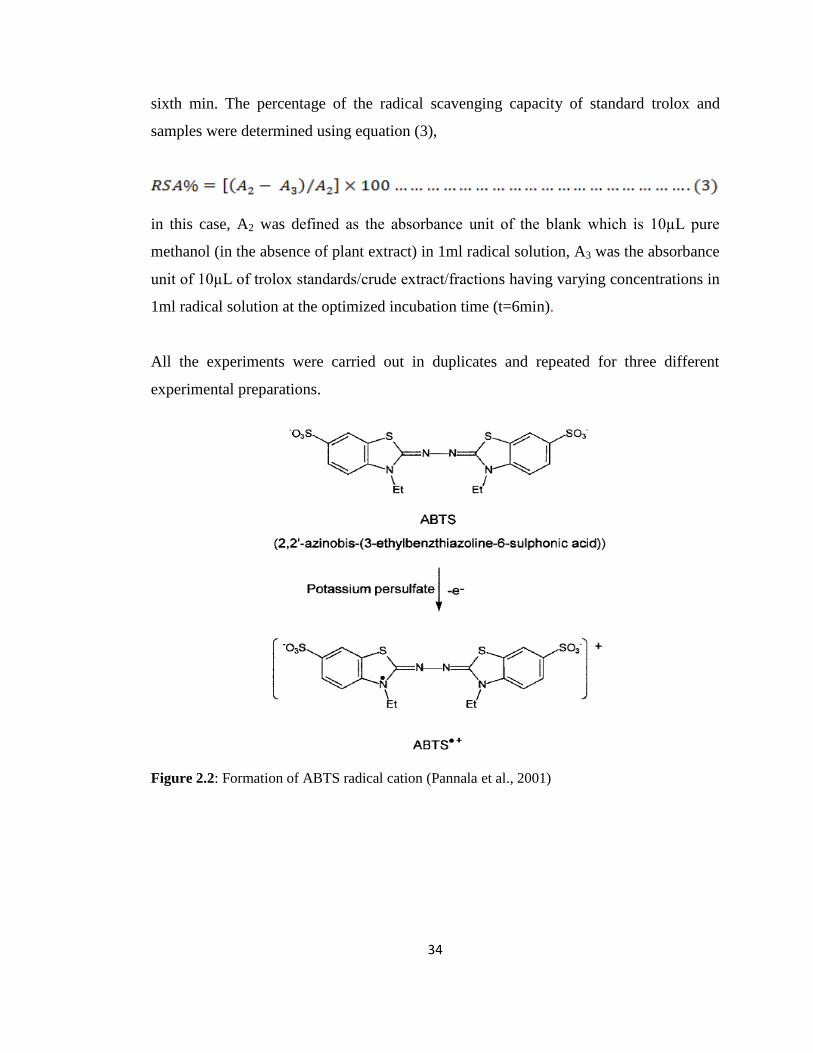
sixth min. The percentage of the radical scavenging capacity of standard trolox and
samples were determined using equation (3),
in this case, A2 was defined as the absorbance unit of the blank which is 10µL pure
methanol (in the absence of plant extract) in 1ml radical solution, A3 was the absorbance
unit of 10µL of trolox standards/crude extract/fractions having varying concentrations in
1ml radical solution at the optimized incubation time (t=6min).
All the experiments were carried out in duplicates and repeated for three different
experimental preparations.
Figure 2.2: Formation of ABTS radical cation (Pannala et al., 2001)
35
2.2.5 Determination of Total Phenolic Content
Total phenol content of the crude extract and fractions were evaluated according to the
folin-ciocaltaeu method proposed previously by Singleton and Rosi (1965). For this,
varying concentrations of gallic acid a, well known phenol, as a standard, crude extracts
and fractions were prepared in methanol. 100µL of samples were added to the 100µL of
%50 folin-ciocaltaeu reagent in a test tube, vortex mixed for a few seconds and mixed
with 2000µL of 2% Na2CO3. The mixture was set aside at in dark at room temperature
for 30 minutes. At the end of the incubation time, absorbance values at 750nm were
recorded against blank, which was prepared 100µL pure methanol instead of sample.
The curve of gallic acid concentration (prepared as 0.05, 0.1, 0.2, 0.3 mg/ml) versus
absorbance was used as calibration curve to calculate the amount of phenolic content of
dry samples in terms of gallic acid equivalent (GAE) value. All the experiments were
carried out in duplicates and repeated for three different experiments.
2.2.6 Determination of Total Flavonoid Content
Modified aluminum chloride method proposed previously by Zhishen et al (1999) and
Dewanto et al. (2002) was used to determine the total flavonoid content of crude extract
and fraction samples. Briefly, catechin standards/crude extract/fractions in various
concentrations were prepared in methanol. 125µL of samples were put into to a test tube,
mixed with 625µl of water and 37.5µl 5% NaNO2 and vortexed. Next at 5th
min, 75µl
%10 AlCl3 was added and vortexed then at 11th
min, 250µl 1.0M NaOH together with
387µL water were added to get final volume of 1.5 mL. The mixture was left in dark
room at room temperature for another 10 min. At the end of the incubation time, the
absorbance values at 510nm were read against blank, which was prepared by using
125µL pure methanol instead of sample. The catechin standard curve drawn for recorded
absorbance value versus known concentrations of standard (mg/ml) was used to evaluate
total flavonoid content of crude extract and fraction samples in terms of catechin
equivalents.
36
2.2.7 Antimicrobial tests
2.2.7.1 Preparation of Microbial Stock:
Selected bacterial populations, which were Proteus mirabilis (RSKK 737, Pasteur
Institute), Escherichia coli (RSKK 234, Pasteur Institute), Staphylococcus aureus
(RSKK 95084, Pasteur Institute), Streptococcus pyogenes (RSKK 03019, ATCC 19615)
were bought from Refik Saydam Hygiene Center. A pellet of E. coli and P. mirabilis
were suspended in 1 ml of Luria-Bertani (LB) broth, for S. aureus Brain Heart Infusion
(BHI) broth and for S. pyogenes Mueller-Hinton (MHB) broth was used to prepare 1 ml
of bacterial suspension. Suspensions were used to streak onto the sheep blood agar
plates prepared previously in our lab from these new agar plates were prepared and were
incubated at 37oC for 24 h and individual colonies selected by needle head were spread
onto new sheep blood agar plates in every two weeks, to keep the freshness of selected
bacteria and use morphologically similar colonies. A pellet of bacteria of interest was
further suspended in 1 mL specified broth mediums and 100 µL suspensions were
transferred into 10 mL specified broth mediums for optimal growth at 37oC and fixed
180 rpm for 24 h. in sterile falcon tubes. Cultures were used in minimum inhibitory
concentration (MIC) and agar disk diffusion assay analyses. For long term storage, 24 h-
grown cultures were diluted to obtain 0.6 absorbance unit at 570nm, and 100µL of
diluted suspension were completed to 1 mL with sterile % 20 (v/v) glycerol solutions
and stored at -80oC.
2.2.7.2 Determination of the Minimum Inhibitory Concentration:
2.2.7.2.1 Solvent effect
The solvent to dissolve the crude extract, fractions, and phenolic compounds samples
was selected according to the following criteria: First, the inhibitory effect of the
selected solvent was tested using minimum inhibitory concentration (MIC) method and
later the solubility in selected solvent was determined. Tested solvents were: ethanol,
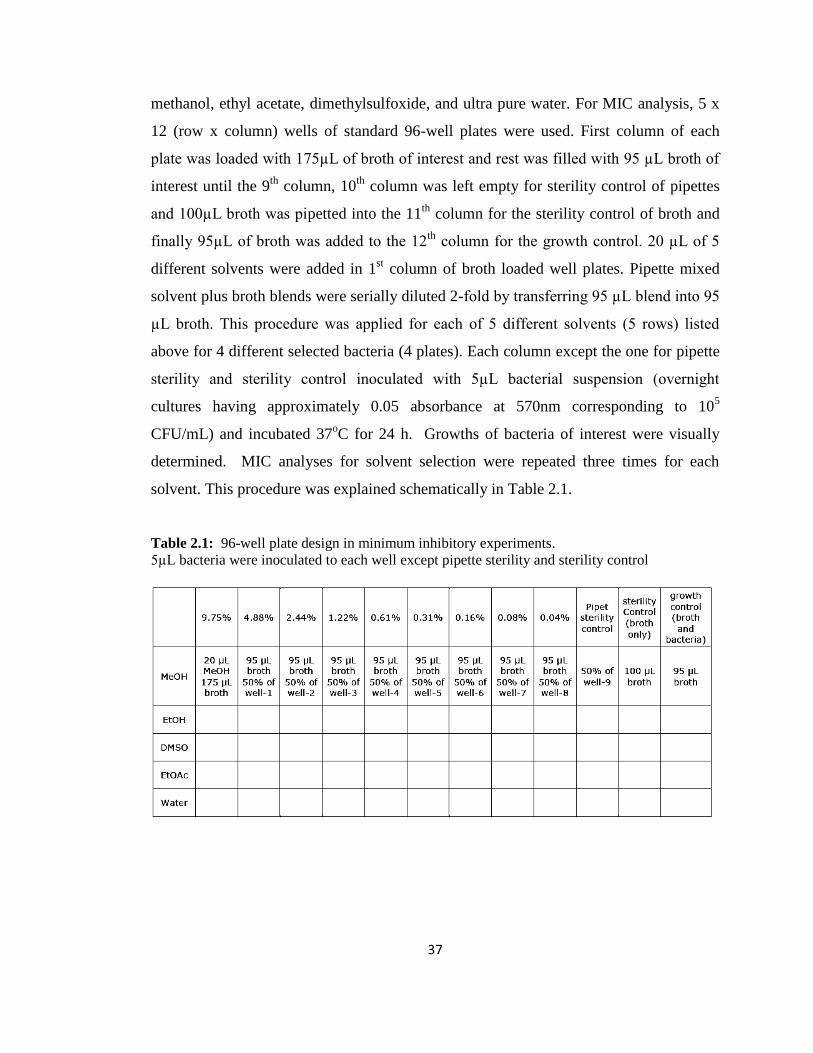
37
methanol, ethyl acetate, dimethylsulfoxide, and ultra pure water. For MIC analysis, 5 x
12 (row x column) wells of standard 96-well plates were used. First column of each
plate was loaded with 175µL of broth of interest and rest was filled with 95 µL broth of
interest until the 9th
column, 10th
column was left empty for sterility control of pipettes
and 100µL broth was pipetted into the 11th
column for the sterility control of broth and
finally 95µL of broth was added to the 12th
column for the growth control. 20 µL of 5
different solvents were added in 1st column of broth loaded well plates. Pipette mixed
solvent plus broth blends were serially diluted 2-fold by transferring 95 µL blend into 95
µL broth. This procedure was applied for each of 5 different solvents (5 rows) listed
above for 4 different selected bacteria (4 plates). Each column except the one for pipette
sterility and sterility control inoculated with 5µL bacterial suspension (overnight
cultures having approximately 0.05 absorbance at 570nm corresponding to 105
CFU/mL) and incubated 37oC for 24 h. Growths of bacteria of interest were visually
determined. MIC analyses for solvent selection were repeated three times for each
solvent. This procedure was explained schematically in Table 2.1.
Table 2.1: 96-well plate design in minimum inhibitory experiments.
5µL bacteria were inoculated to each well except pipette sterility and sterility control
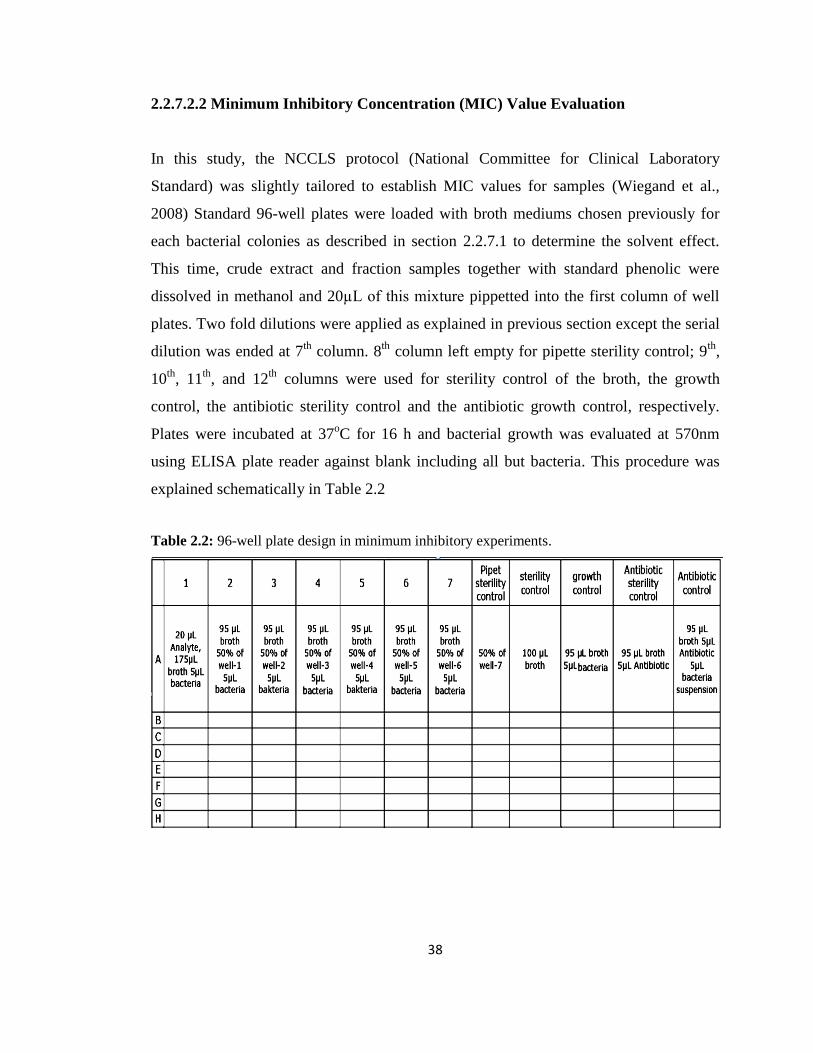
38
2.2.7.2.2 Minimum Inhibitory Concentration (MIC) Value Evaluation
In this study, the NCCLS protocol (National Committee for Clinical Laboratory
Standard) was slightly tailored to establish MIC values for samples (Wiegand et al.,
2008) Standard 96-well plates were loaded with broth mediums chosen previously for
each bacterial colonies as described in section 2.2.7.1 to determine the solvent effect.
This time, crude extract and fraction samples together with standard phenolic were
dissolved in methanol and 20µL of this mixture pippetted into the first column of well
plates. Two fold dilutions were applied as explained in previous section except the serial
dilution was ended at 7th
column. 8th
column left empty for pipette sterility control; 9th
,
10th
, 11th
, and 12th
columns were used for sterility control of the broth, the growth
control, the antibiotic sterility control and the antibiotic growth control, respectively.
Plates were incubated at 37oC for 16 h and bacterial growth was evaluated at 570nm
using ELISA plate reader against blank including all but bacteria. This procedure was
explained schematically in Table 2.2
Table 2.2: 96-well plate design in minimum inhibitory experiments.
39
2.2.7.2.3 -Minimum Bactericidal Concentration (MBC) Value Evaluation
Before the MIC values were monitored, 10µL of mixtures from each well were
transferred into another well-plate which were pre-loaded with agar medium specific to
studied bacterial colonies. Plates were incubated at 37oC for 24 h and growth was
determined by using ELISA plate reader operated at 570 nm against blank mixture
without bacteria. The minimum bactericidal concentration was determined as the lowest
concentration of crude extract/fraction/standard phenol needed to kill bacteria of interest.
2.2.7.3 Agar Disk Diffusion Assay
The NCCLS protocol (National Committee for Clinical Laboratory Standard) with little
modifications was adapted to perform the agar disk diffusion assay (Wiegand et al.,
2008). 100 µL of overnight cultures of bacteria (108 CFU/mL) was spread onto agar
plates. 20µL of crude extract and fraction samples together with standard phenolic were
dissolved in methanol and pippetted onto discs with 6mm diameter. Discs were placed
into sterilized 96-well plates for impregnation, methanol was evaporated and dried discs
were placed onto the inoculated agar plates. For positive control, antibiotic impregnated
discs were also placed onto agar plates and plates were incubated at 37oC for 16 h. The
antimicrobial agent activity was determined by measuring the area of inhibition zone
which was observed as a transparent area enclosing the discs.
2.3 Statistical analysis
All results are expressed as mean ± standard deviation (SD). Comparison of means was
analyzed by Student‟s t test and differences were considered significant when p<0.05.
40
CHAPTER 3
RESULTS AND DISCUSSION
3.1 EXTRACTION OF PLANTAGO MAJOR LEAVES
160 g of powdered P. major leaves were extracted in total of 3600mL methanol and
shook in ultrasonic bath for 30 minutes. Suspension was later incubated in oval-rotating
incubator at a fixed 180 rpm for 24 h and 25 oC. Extraction mixture was dried in rotary
evaporator at 30oC as described in section 2.2.1. Resultant dry extract was weighted as
27.3 g and (%) yield was calculated as 17.06.
3.1.1 Prufication of Crude Extract with Fractionation
After the extraction of crude extract from the P. major, 3.70 g of crude extract was
mixed with 300 mL water-methanol (1:1) and mixture was poured in separatory funnel
and same volume of hexane was added to the mixture. When aqueous and organic phase
separation obtained, organic phase and aqueous phase were separated from each other,
then, organic phase was evaporated. Same procedure was carried on with other organic
solvents (diethyl ether, chloroform, and ethyl acetate) and at each time, the remaining
aqueous phase was re-fractionated with the other organic solvent. At the end, the
remaining aqueous phase was lyophilized. After the fractionation with hexane, diethyl
ether, chloroform ethyl acetate, and aqueous solvents, dried matter was weighed out as
0.1980, 0.133, 0.068, 1.080, and 2.03 g respectively.
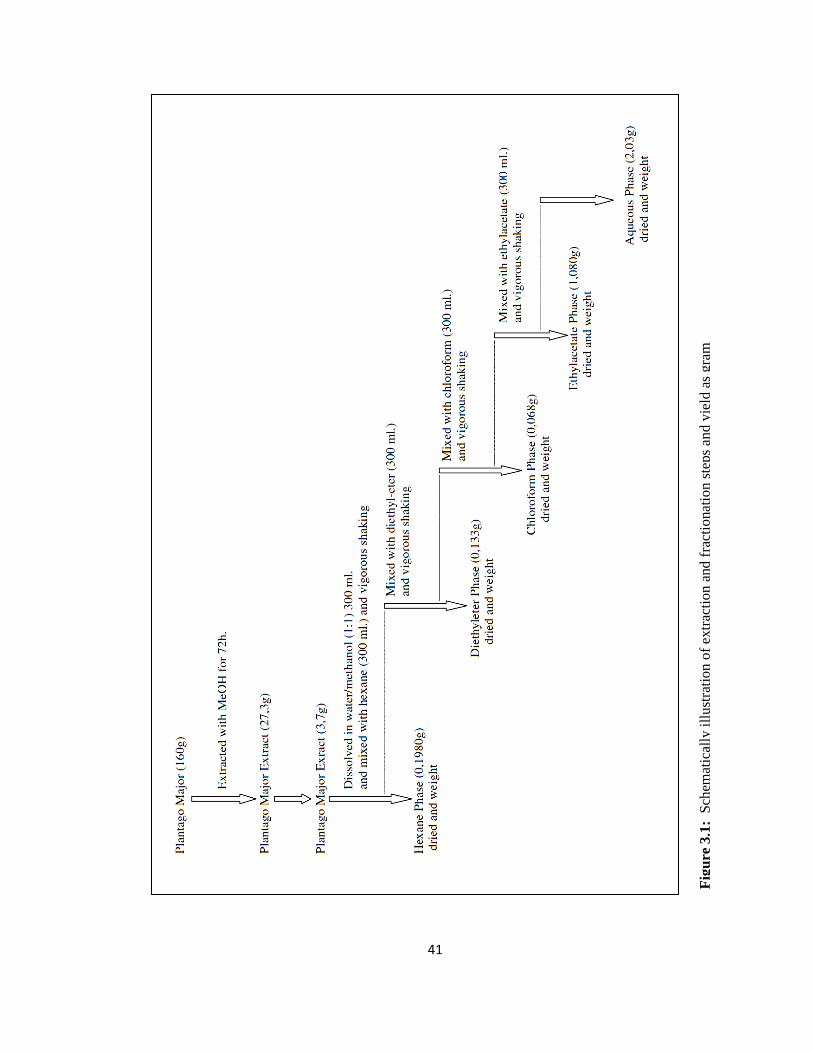
41
Fig
ure
3.1
: S
chem
atic
ally
ill
ust
rati
on o
f ex
trac
tion a
nd f
ract
ionat
ion s
teps
and y
ield
as
gra
m
42
3.2 EXPLORATION OF ANTIOXIDANT CAPACITIES
Antioxidants were explored by using DPPH radical scavenging, ABTS methods and
determined in terms of the total amount of phenolics and flavonoids, which are well
known compounds with strong antioxidant properties.
3.2.1 Antioxidant capacity by ABTS Method
Antioxidant capacities of the crude extracts and the fractions of the P. major were
determined according to their radical scavenging potential with ABTS method as
described previously in section 2.2.4.2. The concentration of trolox standard versus RSA
(%) graph was shown in Figure 3.2, below. The linear regression equation driven from
this curve was further used to calculate the trolox equivalent antioxidant concentration
(TEAC) values for the samples of crude extract and fractions. For this, the slopes of
regression models of samples (determined using the same procedure as done for trolox
standard calibration curve for each sample-see Appendix A) were divided to the slope of
trolox standard in order to calculate the TEAC values of each sample in terms of µmol
Trolox equivalent/g extract. Results were listed in Table 3.1.
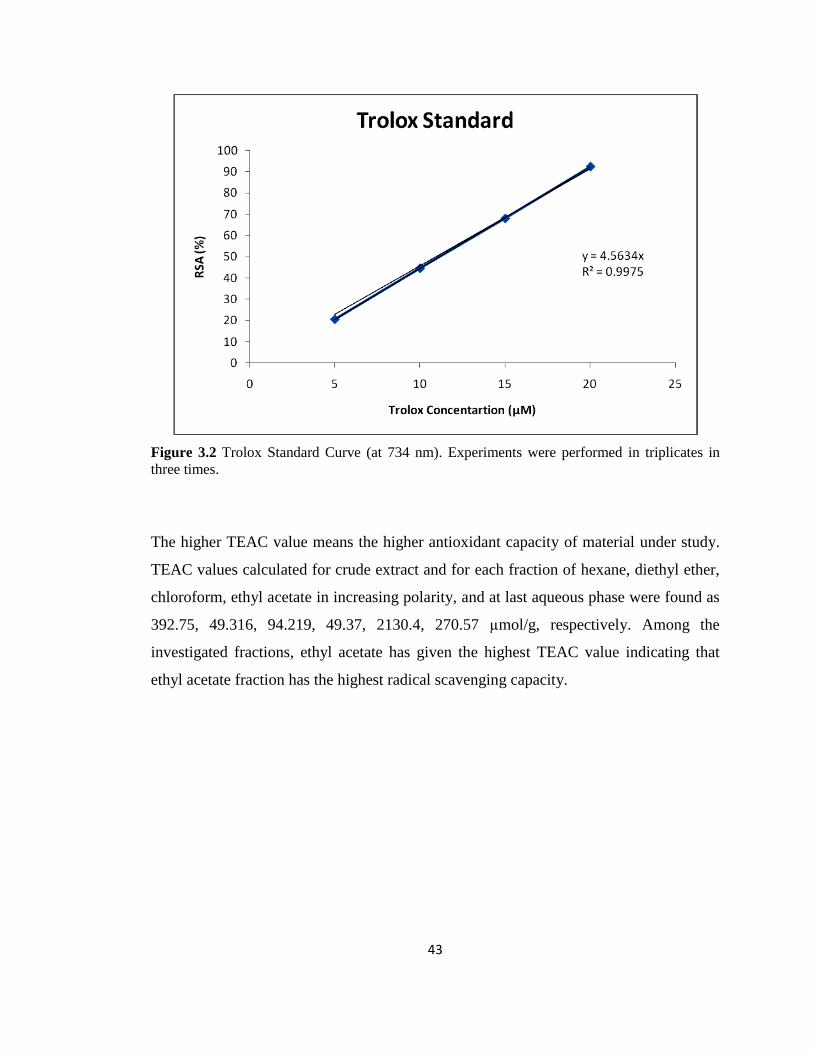
43
Figure 3.2 Trolox Standard Curve (at 734 nm). Experiments were performed in triplicates in
three times.
The higher TEAC value means the higher antioxidant capacity of material under study.
TEAC values calculated for crude extract and for each fraction of hexane, diethyl ether,
chloroform, ethyl acetate in increasing polarity, and at last aqueous phase were found as
392.75, 49.316, 94.219, 49.37, 2130.4, 270.57 µmol/g, respectively. Among the
investigated fractions, ethyl acetate has given the highest TEAC value indicating that
ethyl acetate fraction has the highest radical scavenging capacity.
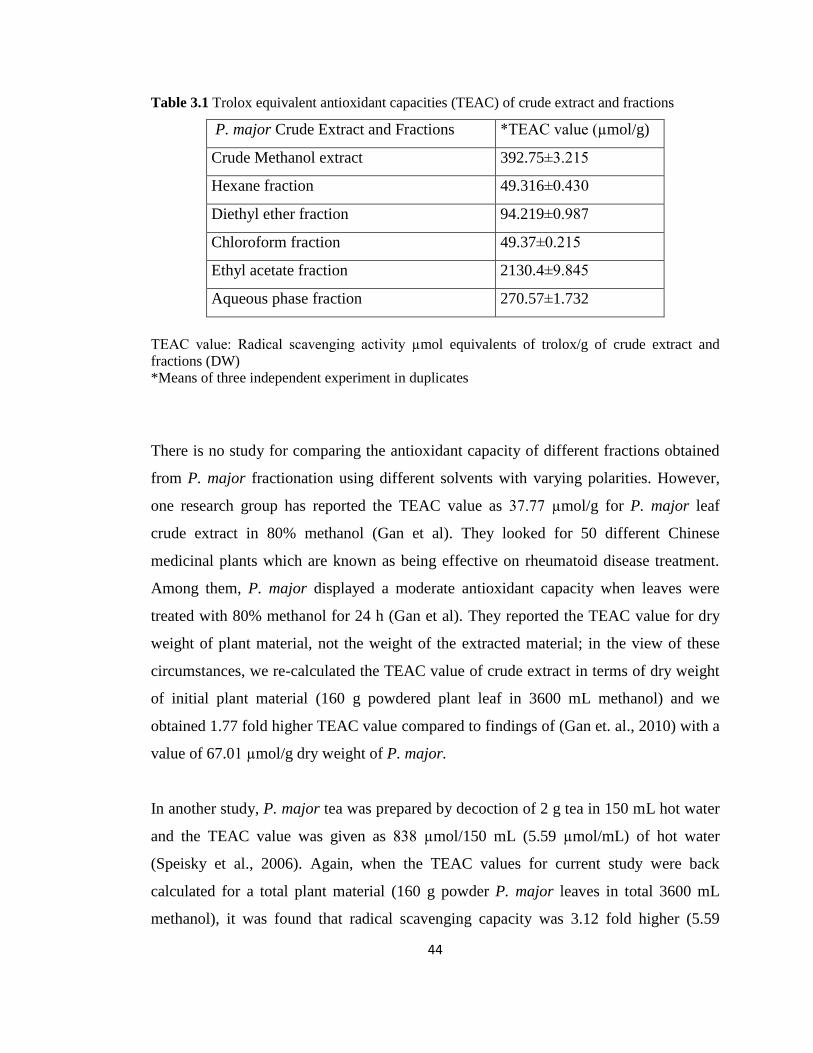
44
Table 3.1 Trolox equivalent antioxidant capacities (TEAC) of crude extract and fractions
P. major Crude Extract and Fractions *TEAC value (µmol/g)
Crude Methanol extract 392.75±3.215
Hexane fraction 49.316±0.430
Diethyl ether fraction 94.219±0.987
Chloroform fraction 49.37±0.215
Ethyl acetate fraction 2130.4±9.845
Aqueous phase fraction 270.57±1.732
TEAC value: Radical scavenging activity µmol equivalents of trolox/g of crude extract and
fractions (DW)
*Means of three independent experiment in duplicates
There is no study for comparing the antioxidant capacity of different fractions obtained
from P. major fractionation using different solvents with varying polarities. However,
one research group has reported the TEAC value as 37.77 µmol/g for P. major leaf
crude extract in 80% methanol (Gan et al). They looked for 50 different Chinese
medicinal plants which are known as being effective on rheumatoid disease treatment.
Among them, P. major displayed a moderate antioxidant capacity when leaves were
treated with 80% methanol for 24 h (Gan et al). They reported the TEAC value for dry
weight of plant material, not the weight of the extracted material; in the view of these
circumstances, we re-calculated the TEAC value of crude extract in terms of dry weight
of initial plant material (160 g powdered plant leaf in 3600 mL methanol) and we
obtained 1.77 fold higher TEAC value compared to findings of (Gan et. al., 2010) with a
value of 67.01 µmol/g dry weight of P. major.
In another study, P. major tea was prepared by decoction of 2 g tea in 150 mL hot water
and the TEAC value was given as 838 µmol/150 mL (5.59 µmol/mL) of hot water
(Speisky et al., 2006). Again, when the TEAC values for current study were back
calculated for a total plant material (160 g powder P. major leaves in total 3600 mL
methanol), it was found that radical scavenging capacity was 3.12 fold higher (5.59
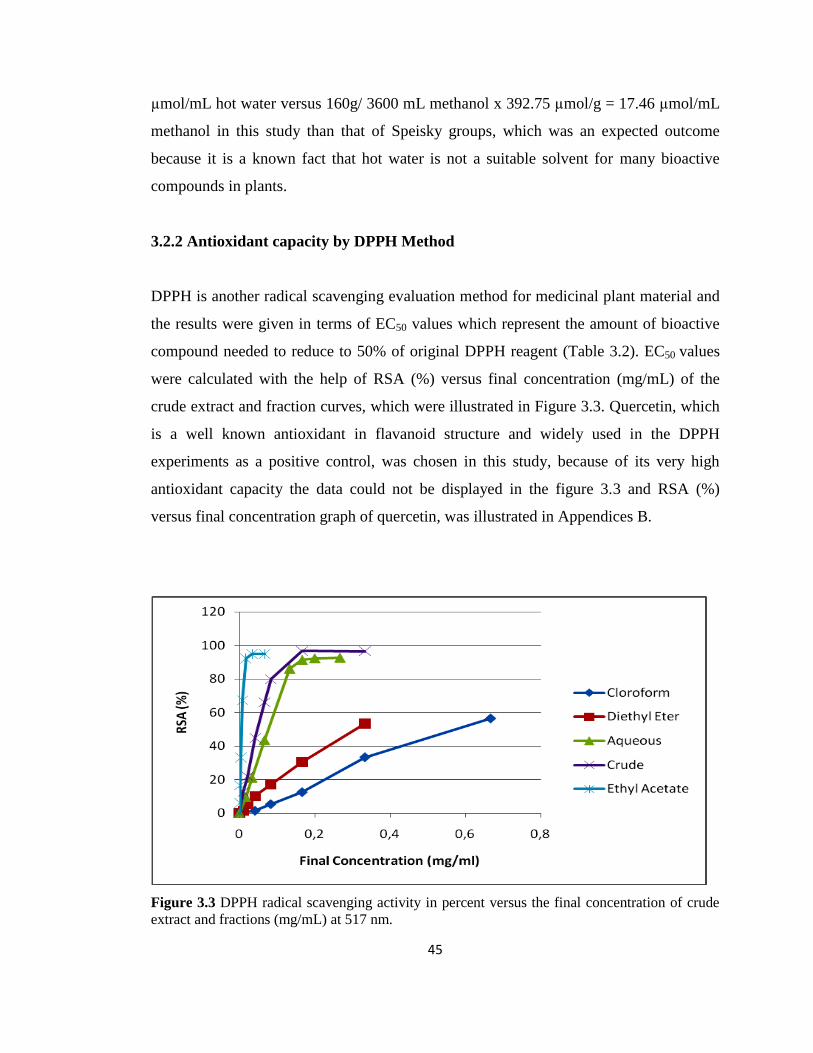
45
µmol/mL hot water versus 160g/ 3600 mL methanol x 392.75 µmol/g = 17.46 µmol/mL
methanol in this study than that of Speisky groups, which was an expected outcome
because it is a known fact that hot water is not a suitable solvent for many bioactive
compounds in plants.
3.2.2 Antioxidant capacity by DPPH Method
DPPH is another radical scavenging evaluation method for medicinal plant material and
the results were given in terms of EC50 values which represent the amount of bioactive
compound needed to reduce to 50% of original DPPH reagent (Table 3.2). EC50 values
were calculated with the help of RSA (%) versus final concentration (mg/mL) of the
crude extract and fraction curves, which were illustrated in Figure 3.3. Quercetin, which
is a well known antioxidant in flavanoid structure and widely used in the DPPH
experiments as a positive control, was chosen in this study, because of its very high
antioxidant capacity the data could not be displayed in the figure 3.3 and RSA (%)
versus final concentration graph of quercetin, was illustrated in Appendices B.
Figure 3.3 DPPH radical scavenging activity in percent versus the final concentration of crude
extract and fractions (mg/mL) at 517 nm.
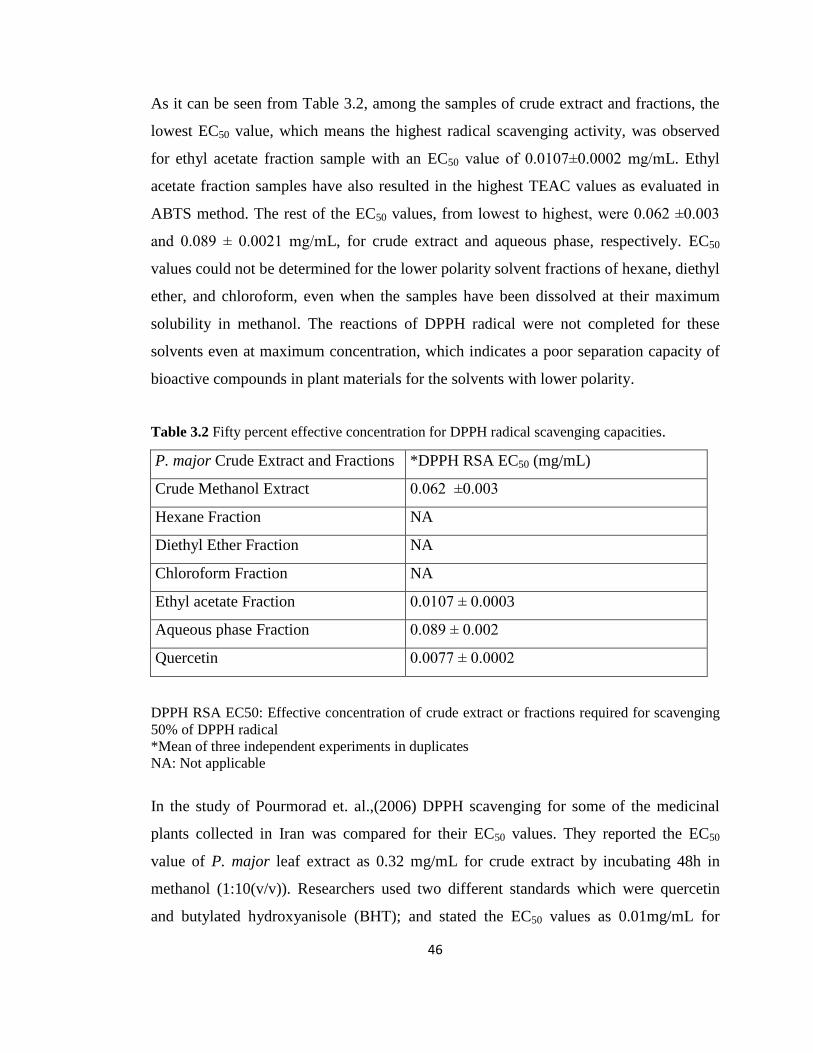
46
As it can be seen from Table 3.2, among the samples of crude extract and fractions, the
lowest EC50 value, which means the highest radical scavenging activity, was observed
for ethyl acetate fraction sample with an EC50 value of 0.0107±0.0002 mg/mL. Ethyl
acetate fraction samples have also resulted in the highest TEAC values as evaluated in
ABTS method. The rest of the EC50 values, from lowest to highest, were 0.062 ±0.003
and 0.089 ± 0.0021 mg/mL, for crude extract and aqueous phase, respectively. EC50
values could not be determined for the lower polarity solvent fractions of hexane, diethyl
ether, and chloroform, even when the samples have been dissolved at their maximum
solubility in methanol. The reactions of DPPH radical were not completed for these
solvents even at maximum concentration, which indicates a poor separation capacity of
bioactive compounds in plant materials for the solvents with lower polarity.
Table 3.2 Fifty percent effective concentration for DPPH radical scavenging capacities.
P. major Crude Extract and Fractions *DPPH RSA EC50 (mg/mL)
Crude Methanol Extract 0.062 ±0.003
Hexane Fraction NA
Diethyl Ether Fraction NA
Chloroform Fraction NA
Ethyl acetate Fraction 0.0107 ± 0.0003
Aqueous phase Fraction 0.089 ± 0.002
Quercetin 0.0077 ± 0.0002
DPPH RSA EC50: Effective concentration of crude extract or fractions required for scavenging
50% of DPPH radical
*Mean of three independent experiments in duplicates
NA: Not applicable
In the study of Pourmorad et. al.,(2006) DPPH scavenging for some of the medicinal
plants collected in Iran was compared for their EC50 values. They reported the EC50
value of P. major leaf extract as 0.32 mg/mL for crude extract by incubating 48h in
methanol (1:10(v/v)). Researchers used two different standards which were quercetin
and butylated hydroxyanisole (BHT); and stated the EC50 values as 0.01mg/mL for
47
quercetin and 0.054 mg/mL for BHT. In the present study, EC50 was found 11.6 times
more than the quercetin standard, while Pourmorad et. al.’s work resulted in 32 times
more EC50, which points to approximately 3 fold higher antioxidant capacity in crude
extract in the present study (was much higher antioxidant capacity when plant extract in
ethyl acetate results were considered).
Another research group has investigated the P. major leaves collected from Serbia
(Beara et al., 2009). They extracted plant material in 80% aqueous methanol for 72 h
and calculated the EC50 value as 0.00535 mg/mL while it was 0.00828 mg/mL for BHT
standard. The crude extract was further washed with petroleum ether which is non polar
solvent. The EC50 values for ethyl acetate fraction samples in the currents study are
comparable with their outcomes, and in this case, they found 2.1 fold higher radical
scavenging capacity. However, it is known that BHT has lower antioxidant capacity
compared to quercetin standard (almost 5 times higher EC50 values were reported in
previous reference- see Pourmorad et. al). The difference can be explained by this fact.
Additionally, in another study from Serbia (Stanisavljevic´ et al., 2008) the EC50 value
was found almost 6 times higher (EC50 = 0.360±0.001 mg/mL) with respect to our
findings. In that study, they applied ultrasonic bath for P. major leaf extraction in
ethanol. This difference may be due to the extraction method selected but most probably
because of the plant material collected. Even, the last two studies have collected their
plant material from the same region (Serbia), they reported very different antioxidant
capacities for P. major leaves (almost 12 times lower scavenging capacity was found in
the second study), indicating the importance of starting plant material and also the
extraction method applied (solvents with higher polarity are more suitable to gather the
bioactive compounds). For example, a research group from Scotland has given
EC50value of 0.034 mg/mL while quercetin has EC50 value of 0.0028 mg/mL for P.
major leaves. They followed the strategy of applying non-polar solvents first and going
up to higher polarities for fractionation. The expected antioxidant capacity was much
lower than our findings when compared with ethyl acetate phase seeing that it was 1.3
fold higher with respect to quercetin standard, and it was 12.4 fold higher than
standard’s EC50 value in the study of Kumarasamy et. al (Kumarasamy et al., 2007).
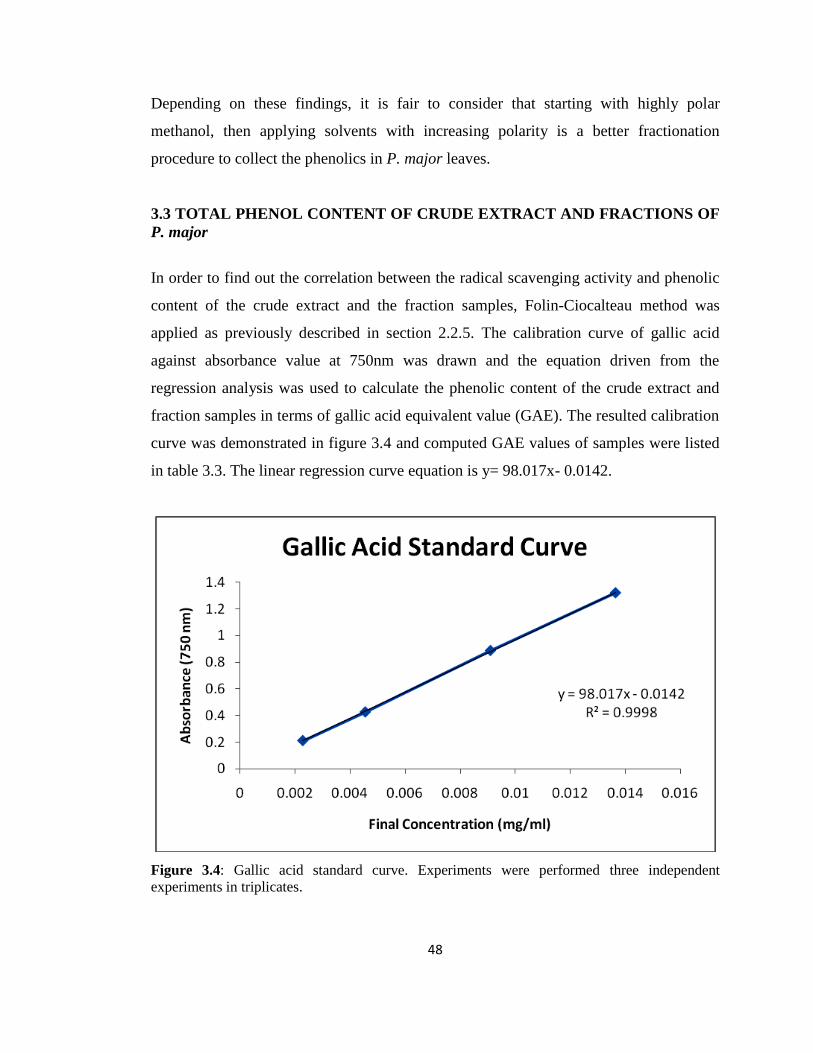
48
Depending on these findings, it is fair to consider that starting with highly polar
methanol, then applying solvents with increasing polarity is a better fractionation
procedure to collect the phenolics in P. major leaves.
3.3 TOTAL PHENOL CONTENT OF CRUDE EXTRACT AND FRACTIONS OF
P. major
In order to find out the correlation between the radical scavenging activity and phenolic
content of the crude extract and the fraction samples, Folin-Ciocalteau method was
applied as previously described in section 2.2.5. The calibration curve of gallic acid
against absorbance value at 750nm was drawn and the equation driven from the
regression analysis was used to calculate the phenolic content of the crude extract and
fraction samples in terms of gallic acid equivalent value (GAE). The resulted calibration
curve was demonstrated in figure 3.4 and computed GAE values of samples were listed
in table 3.3. The linear regression curve equation is y= 98.017x- 0.0142.
Figure 3.4: Gallic acid standard curve. Experiments were performed three independent
experiments in triplicates.
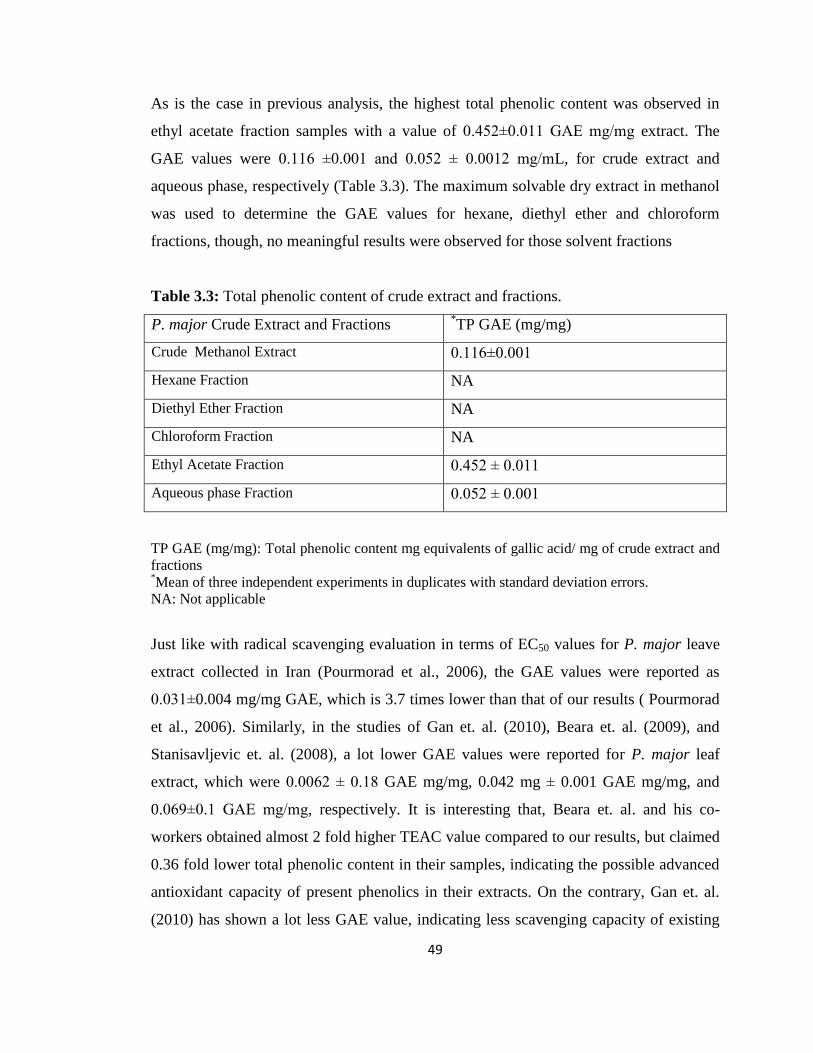
49
As is the case in previous analysis, the highest total phenolic content was observed in
ethyl acetate fraction samples with a value of 0.452±0.011 GAE mg/mg extract. The
GAE values were 0.116 ±0.001 and 0.052 ± 0.0012 mg/mL, for crude extract and
aqueous phase, respectively (Table 3.3). The maximum solvable dry extract in methanol
was used to determine the GAE values for hexane, diethyl ether and chloroform
fractions, though, no meaningful results were observed for those solvent fractions
Table 3.3: Total phenolic content of crude extract and fractions.
P. major Crude Extract and Fractions *TP GAE (mg/mg)
Crude Methanol Extract 0.116±0.001
Hexane Fraction NA
Diethyl Ether Fraction NA
Chloroform Fraction NA
Ethyl Acetate Fraction 0.452 ± 0.011
Aqueous phase Fraction 0.052 ± 0.001
TP GAE (mg/mg): Total phenolic content mg equivalents of gallic acid/ mg of crude extract and
fractions *Mean of three independent experiments in duplicates with standard deviation errors.
NA: Not applicable
Just like with radical scavenging evaluation in terms of EC50 values for P. major leave
extract collected in Iran (Pourmorad et al., 2006), the GAE values were reported as
0.031±0.004 mg/mg GAE, which is 3.7 times lower than that of our results ( Pourmorad
et al., 2006). Similarly, in the studies of Gan et. al. (2010), Beara et. al. (2009), and
Stanisavljevic et. al. (2008), a lot lower GAE values were reported for P. major leaf
extract, which were 0.0062 ± 0.18 GAE mg/mg, 0.042 mg ± 0.001 GAE mg/mg, and
0.069±0.1 GAE mg/mg, respectively. It is interesting that, Beara et. al. and his co-
workers obtained almost 2 fold higher TEAC value compared to our results, but claimed
0.36 fold lower total phenolic content in their samples, indicating the possible advanced
antioxidant capacity of present phenolics in their extracts. On the contrary, Gan et. al.
(2010) has shown a lot less GAE value, indicating less scavenging capacity of existing
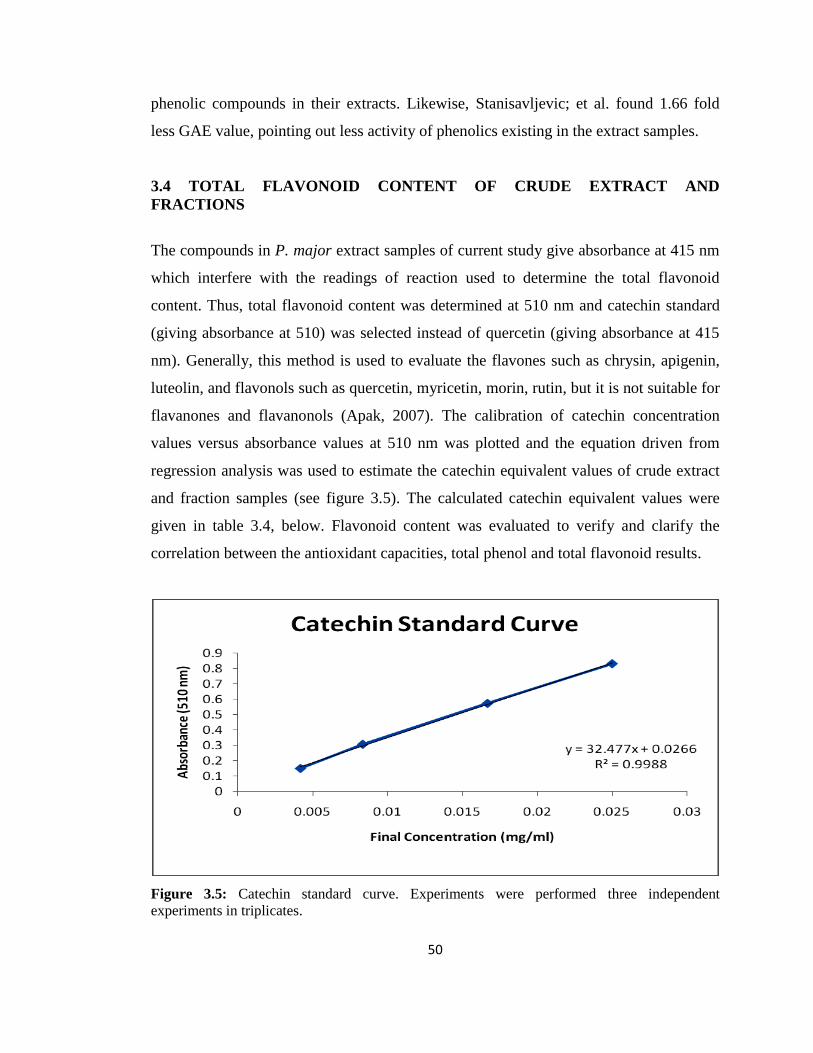
50
phenolic compounds in their extracts. Likewise, Stanisavljevic; et al. found 1.66 fold
less GAE value, pointing out less activity of phenolics existing in the extract samples.
3.4 TOTAL FLAVONOID CONTENT OF CRUDE EXTRACT AND
FRACTIONS
The compounds in P. major extract samples of current study give absorbance at 415 nm
which interfere with the readings of reaction used to determine the total flavonoid
content. Thus, total flavonoid content was determined at 510 nm and catechin standard
(giving absorbance at 510) was selected instead of quercetin (giving absorbance at 415
nm). Generally, this method is used to evaluate the flavones such as chrysin, apigenin,
luteolin, and flavonols such as quercetin, myricetin, morin, rutin, but it is not suitable for
flavanones and flavanonols (Apak, 2007). The calibration of catechin concentration
values versus absorbance values at 510 nm was plotted and the equation driven from
regression analysis was used to estimate the catechin equivalent values of crude extract
and fraction samples (see figure 3.5). The calculated catechin equivalent values were
given in table 3.4, below. Flavonoid content was evaluated to verify and clarify the
correlation between the antioxidant capacities, total phenol and total flavonoid results.
Figure 3.5: Catechin standard curve. Experiments were performed three independent
experiments in triplicates.
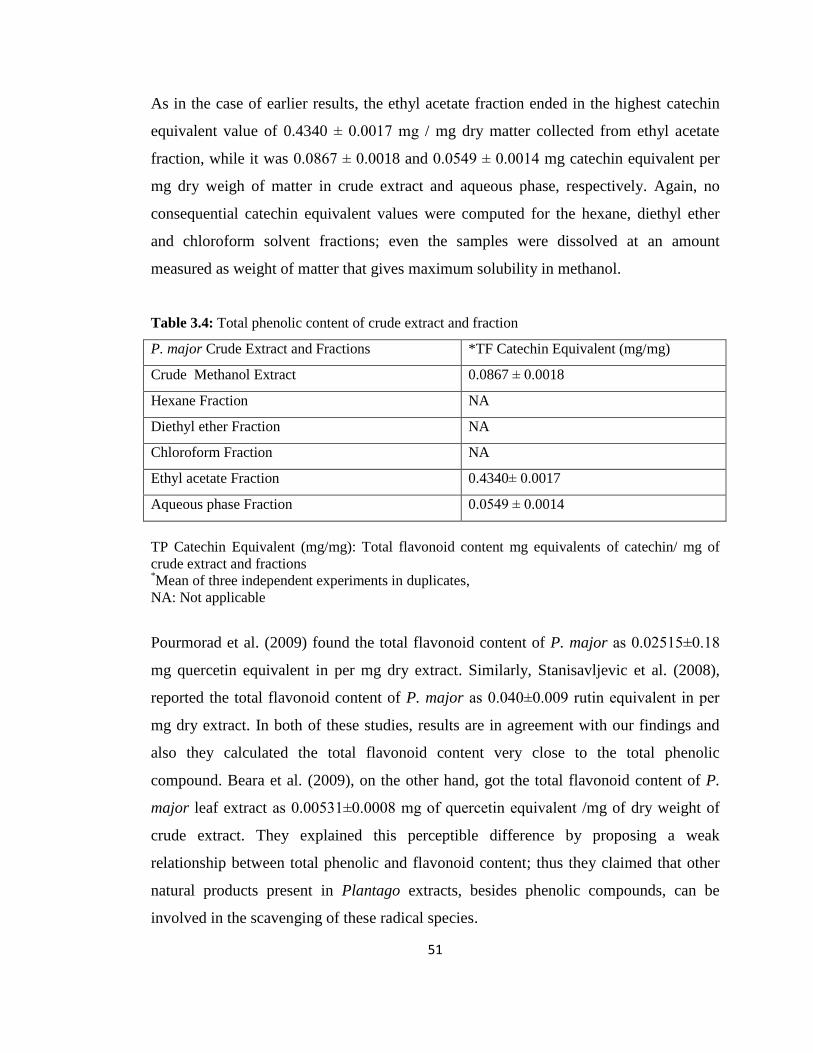
51
As in the case of earlier results, the ethyl acetate fraction ended in the highest catechin
equivalent value of 0.4340 ± 0.0017 mg / mg dry matter collected from ethyl acetate
fraction, while it was 0.0867 ± 0.0018 and 0.0549 ± 0.0014 mg catechin equivalent per
mg dry weigh of matter in crude extract and aqueous phase, respectively. Again, no
consequential catechin equivalent values were computed for the hexane, diethyl ether
and chloroform solvent fractions; even the samples were dissolved at an amount
measured as weight of matter that gives maximum solubility in methanol.
Table 3.4: Total phenolic content of crude extract and fraction
P. major Crude Extract and Fractions *TF Catechin Equivalent (mg/mg)
Crude Methanol Extract 0.0867 ± 0.0018
Hexane Fraction NA
Diethyl ether Fraction NA
Chloroform Fraction NA
Ethyl acetate Fraction 0.4340± 0.0017
Aqueous phase Fraction 0.0549 ± 0.0014
TP Catechin Equivalent (mg/mg): Total flavonoid content mg equivalents of catechin/ mg of
crude extract and fractions *Mean of three independent experiments in duplicates,
NA: Not applicable
Pourmorad et al. (2009) found the total flavonoid content of P. major as 0.02515±0.18
mg quercetin equivalent in per mg dry extract. Similarly, Stanisavljevic et al. (2008),
reported the total flavonoid content of P. major as 0.040±0.009 rutin equivalent in per
mg dry extract. In both of these studies, results are in agreement with our findings and
also they calculated the total flavonoid content very close to the total phenolic
compound. Beara et al. (2009), on the other hand, got the total flavonoid content of P.
major leaf extract as 0.00531±0.0008 mg of quercetin equivalent /mg of dry weight of
crude extract. They explained this perceptible difference by proposing a weak
relationship between total phenolic and flavonoid content; thus they claimed that other
natural products present in Plantago extracts, besides phenolic compounds, can be
involved in the scavenging of these radical species.
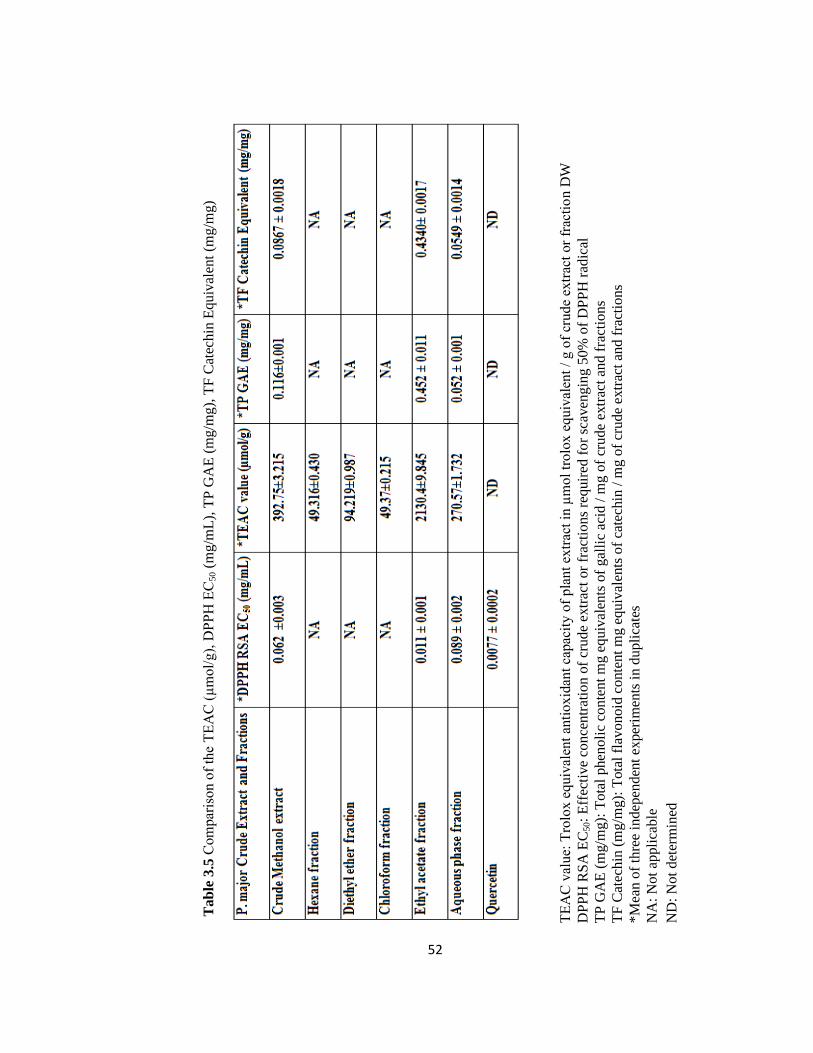
52
Tab
le 3
.5 C
om
par
iso
n o
f th
e T
EA
C (
µm
ol/
g),
DP
PH
EC
50 (
mg/m
L),
TP
GA
E (
mg/m
g),
TF
Cat
ech
in E
qu
ival
ent
(mg
/mg)
TE
AC
val
ue:
Tro
lox
eq
uiv
alen
t an
tioxid
ant
capac
ity o
f pla
nt
extr
act
in µ
mol
trolo
x e
quiv
alen
t /
g o
f cr
ud
e ex
trac
t or
frac
tio
n D
W
DP
PH
RS
A E
C50:
Eff
ecti
ve
con
cen
trat
ion o
f cr
ude
extr
act
or
frac
tions
requir
ed f
or
scav
engin
g 5
0%
of
DP
PH
rad
ical
TP
GA
E (
mg/m
g):
To
tal
phen
oli
c co
nte
nt
mg e
quiv
alen
ts o
f gal
lic
acid
/ m
g o
f cr
ude
extr
act
and
fra
ctio
ns
TF
Cat
ech
in (
mg
/mg):
Tota
l fl
avo
noid
conte
nt
mg e
quiv
alen
ts o
f ca
tech
in /
mg o
f cr
ude
extr
act
and
fra
ctio
ns
*M
ean o
f th
ree
ind
epen
den
t ex
per
imen
ts i
n d
upli
cate
s
NA
: N
ot
appli
cable
ND
: N
ot
det
erm
ined
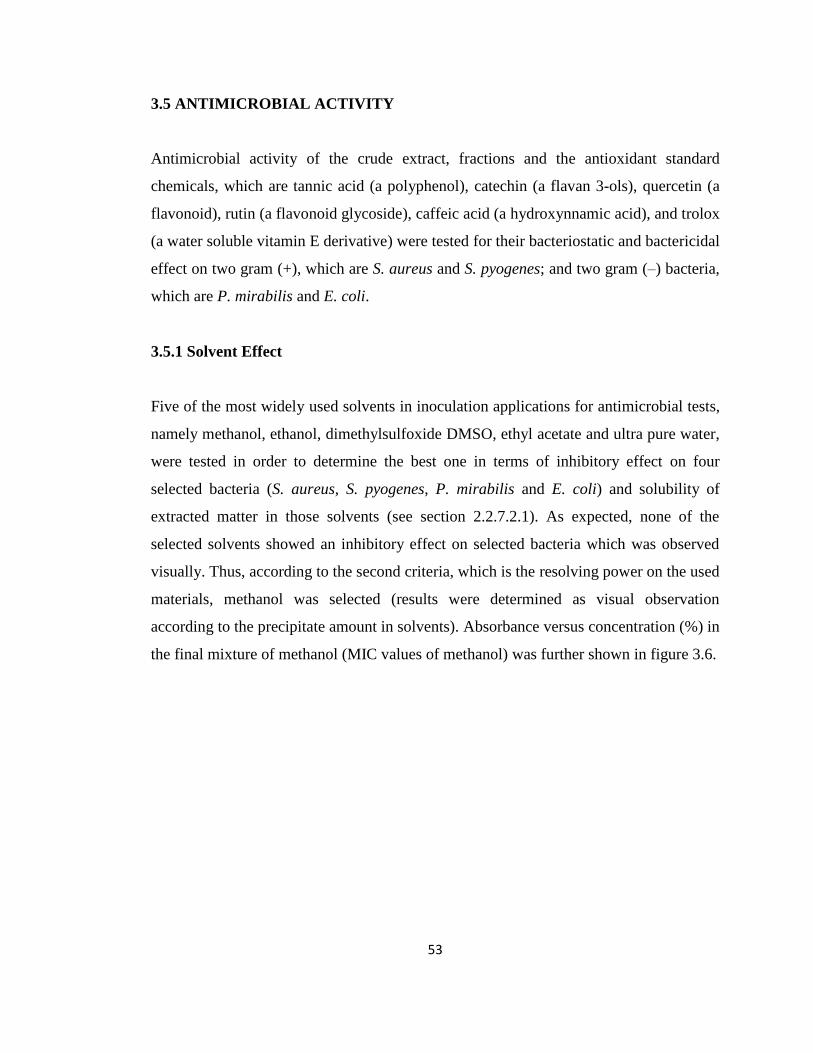
53
3.5 ANTIMICROBIAL ACTIVITY
Antimicrobial activity of the crude extract, fractions and the antioxidant standard
chemicals, which are tannic acid (a polyphenol), catechin (a flavan 3-ols), quercetin (a
flavonoid), rutin (a flavonoid glycoside), caffeic acid (a hydroxynnamic acid), and trolox
(a water soluble vitamin E derivative) were tested for their bacteriostatic and bactericidal
effect on two gram (+), which are S. aureus and S. pyogenes; and two gram (–) bacteria,
which are P. mirabilis and E. coli.
3.5.1 Solvent Effect
Five of the most widely used solvents in inoculation applications for antimicrobial tests,
namely methanol, ethanol, dimethylsulfoxide DMSO, ethyl acetate and ultra pure water,
were tested in order to determine the best one in terms of inhibitory effect on four
selected bacteria (S. aureus, S. pyogenes, P. mirabilis and E. coli) and solubility of
extracted matter in those solvents (see section 2.2.7.2.1). As expected, none of the
selected solvents showed an inhibitory effect on selected bacteria which was observed
visually. Thus, according to the second criteria, which is the resolving power on the used
materials, methanol was selected (results were determined as visual observation
according to the precipitate amount in solvents). Absorbance versus concentration (%) in
the final mixture of methanol (MIC values of methanol) was further shown in figure 3.6.
54
Figure 3.6: Evaluation of methanol effect on growth of S. aureus, E. coli, P. mirabilis, S.
pyogenes after 16 h incubation.
3.5.2 Antimicrobial Effect of Crude Extract and Fractions
MIC values, as mentioned earlier, indicate the bacteriostatic effect of the antimicrobial
agent on the selected bacteria. MIC values for crude extract and fractions were
determined as described in section 2.2.7.2.2 and the results were shown in figure 3.7-9
for crude extract, ethyl acetate, and aqueous phase, respectively. Other fractions
(hexane, diethyl ether and chloroform) did not show any bacteriostatic effect on selected
bacteria.
The final concentrations of samples in methanol were 0.3125-20.0 mg/mL for the crude
extract; 0.016-1.0 mg/mL for hexane, diethyl ether, and chloroform fractions, 0.078-5.0
mg/mL for ethyl acetate, 0.046-3.0 mg/mL for the aqueous fractions. The maximum
limit of concentration values were determined according to saturated amounts dissolved
in methanol.
Growth curves of bacteria used in this study and calculated CFU numbers which were
determined for earlier thesis works were taken as reference (Gerdan, 2009; Kumbet,
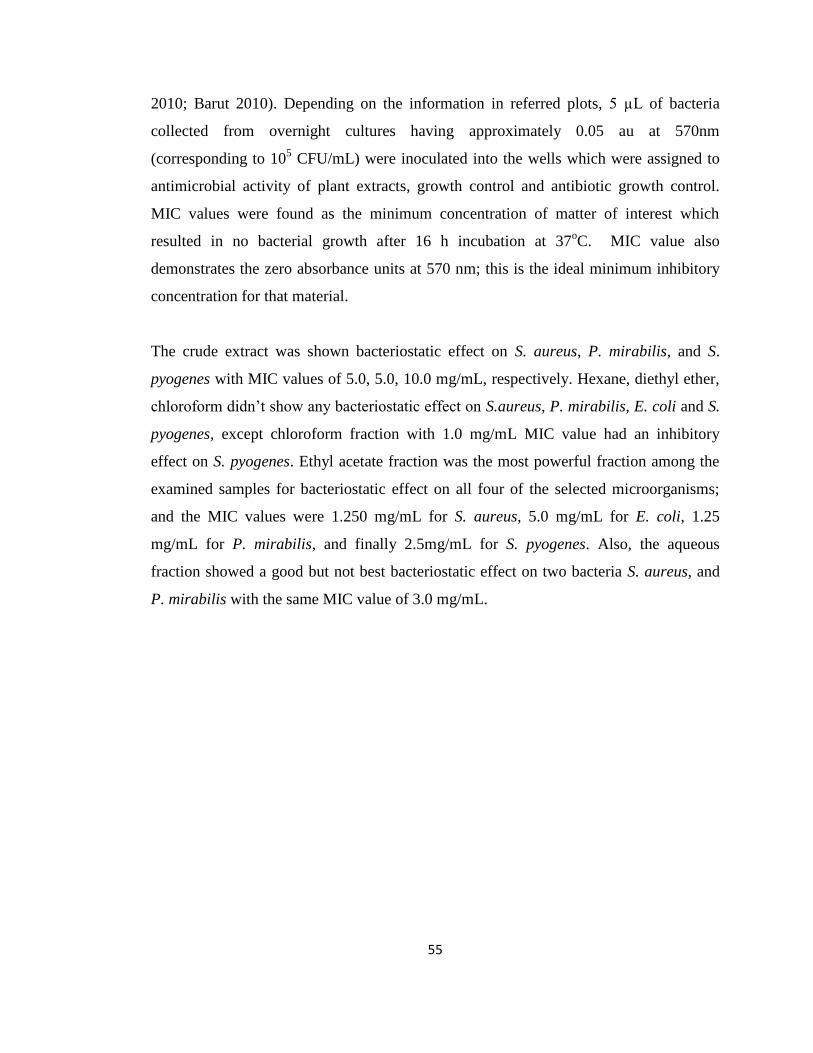
55
2010; Barut 2010). Depending on the information in referred plots, 5 µL of bacteria
collected from overnight cultures having approximately 0.05 au at 570nm
(corresponding to 105 CFU/mL) were inoculated into the wells which were assigned to
antimicrobial activity of plant extracts, growth control and antibiotic growth control.
MIC values were found as the minimum concentration of matter of interest which
resulted in no bacterial growth after 16 h incubation at 37oC. MIC value also
demonstrates the zero absorbance units at 570 nm; this is the ideal minimum inhibitory
concentration for that material.
The crude extract was shown bacteriostatic effect on S. aureus, P. mirabilis, and S.
pyogenes with MIC values of 5.0, 5.0, 10.0 mg/mL, respectively. Hexane, diethyl ether,
chloroform didn’t show any bacteriostatic effect on S.aureus, P. mirabilis, E. coli and S.
pyogenes, except chloroform fraction with 1.0 mg/mL MIC value had an inhibitory
effect on S. pyogenes. Ethyl acetate fraction was the most powerful fraction among the
examined samples for bacteriostatic effect on all four of the selected microorganisms;
and the MIC values were 1.250 mg/mL for S. aureus, 5.0 mg/mL for E. coli, 1.25
mg/mL for P. mirabilis, and finally 2.5mg/mL for S. pyogenes. Also, the aqueous
fraction showed a good but not best bacteriostatic effect on two bacteria S. aureus, and
P. mirabilis with the same MIC value of 3.0 mg/mL.
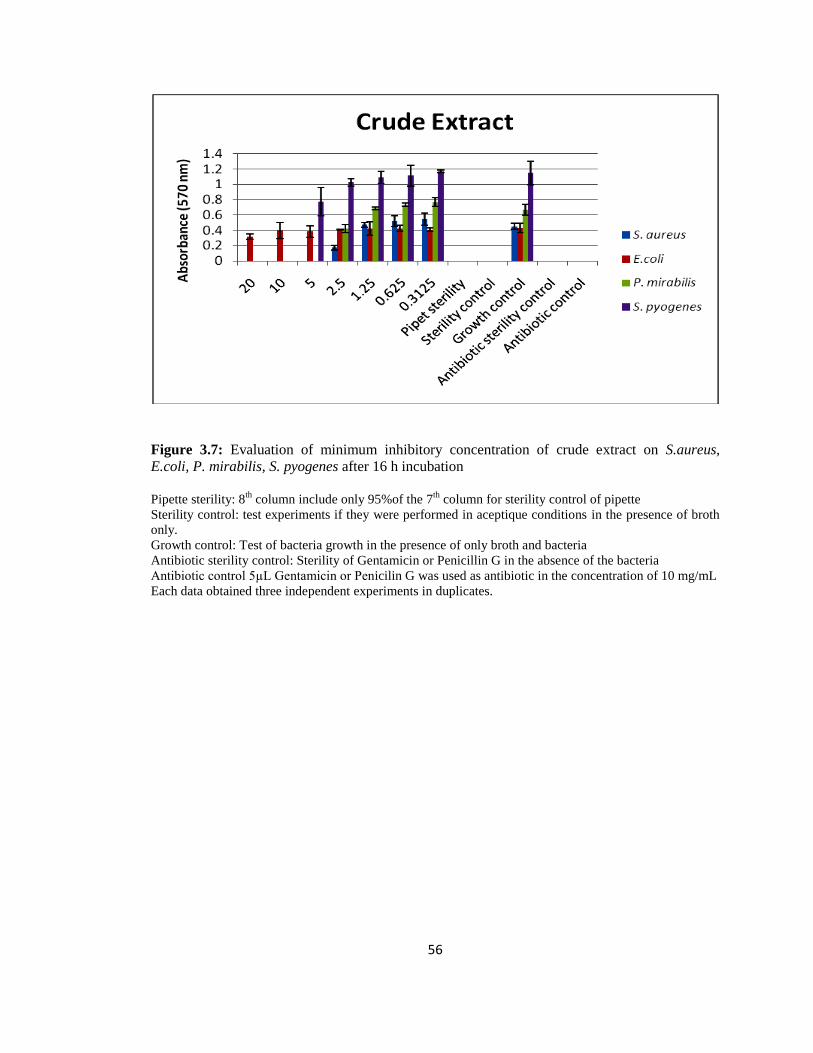
56
Figure 3.7: Evaluation of minimum inhibitory concentration of crude extract on S.aureus,
E.coli, P. mirabilis, S. pyogenes after 16 h incubation
Pipette sterility: 8
th column include only 95%of the 7
th column for sterility control of pipette
Sterility control: test experiments if they were performed in aceptique conditions in the presence of broth
only.
Growth control: Test of bacteria growth in the presence of only broth and bacteria
Antibiotic sterility control: Sterility of Gentamicin or Penicillin G in the absence of the bacteria
Antibiotic control 5µL Gentamicin or Penicilin G was used as antibiotic in the concentration of 10 mg/mL
Each data obtained three independent experiments in duplicates.
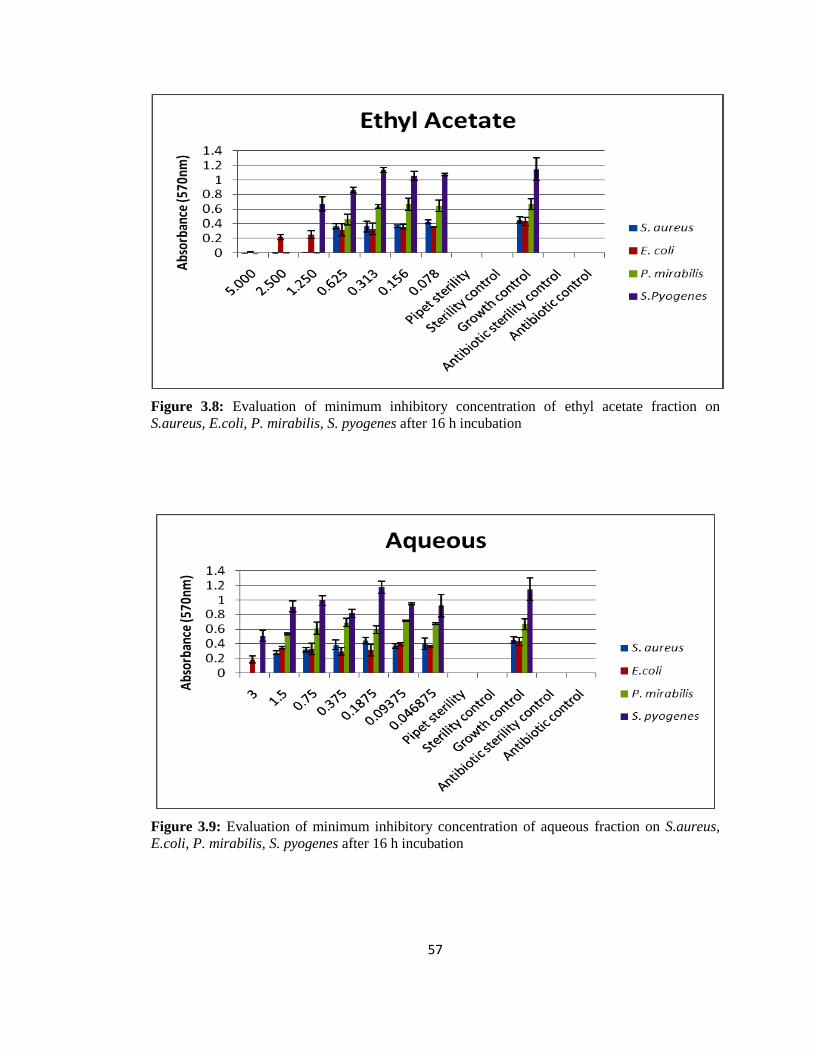
57
Figure 3.8: Evaluation of minimum inhibitory concentration of ethyl acetate fraction on
S.aureus, E.coli, P. mirabilis, S. pyogenes after 16 h incubation
Figure 3.9: Evaluation of minimum inhibitory concentration of aqueous fraction on S.aureus,
E.coli, P. mirabilis, S. pyogenes after 16 h incubation
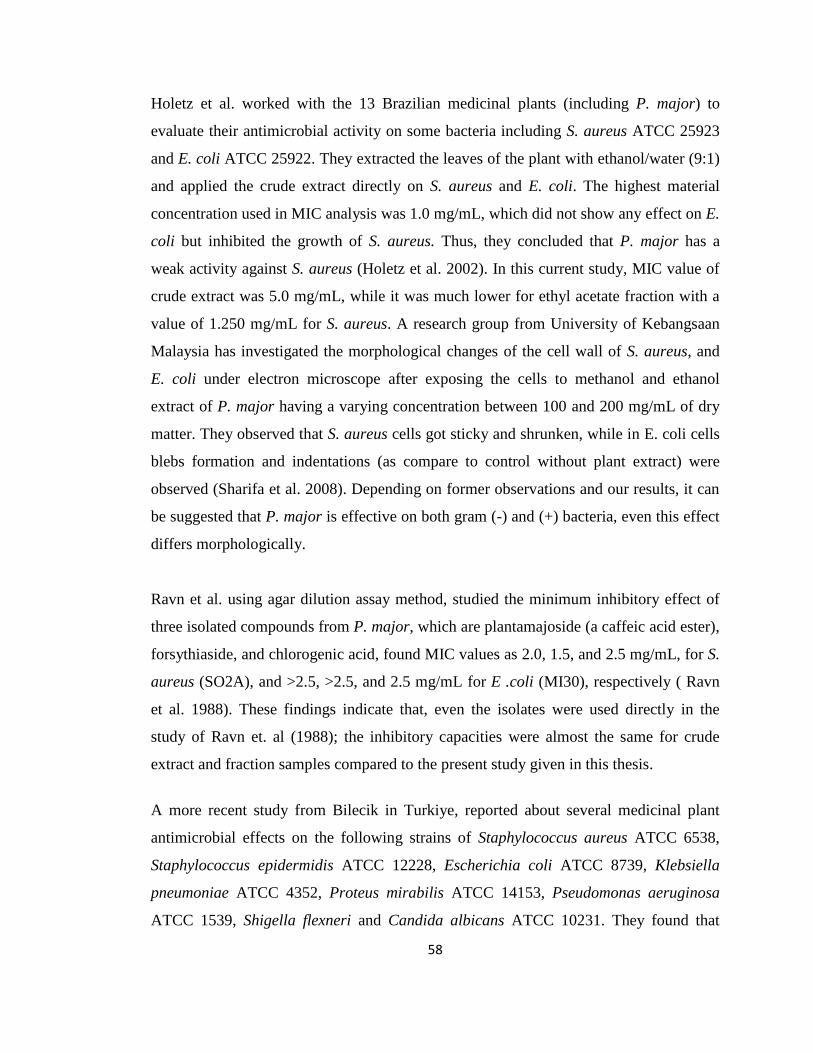
58
Holetz et al. worked with the 13 Brazilian medicinal plants (including P. major) to
evaluate their antimicrobial activity on some bacteria including S. aureus ATCC 25923
and E. coli ATCC 25922. They extracted the leaves of the plant with ethanol/water (9:1)
and applied the crude extract directly on S. aureus and E. coli. The highest material
concentration used in MIC analysis was 1.0 mg/mL, which did not show any effect on E.
coli but inhibited the growth of S. aureus. Thus, they concluded that P. major has a
weak activity against S. aureus (Holetz et al. 2002). In this current study, MIC value of
crude extract was 5.0 mg/mL, while it was much lower for ethyl acetate fraction with a
value of 1.250 mg/mL for S. aureus. A research group from University of Kebangsaan
Malaysia has investigated the morphological changes of the cell wall of S. aureus, and
E. coli under electron microscope after exposing the cells to methanol and ethanol
extract of P. major having a varying concentration between 100 and 200 mg/mL of dry
matter. They observed that S. aureus cells got sticky and shrunken, while in E. coli cells
blebs formation and indentations (as compare to control without plant extract) were
observed (Sharifa et al. 2008). Depending on former observations and our results, it can
be suggested that P. major is effective on both gram (-) and (+) bacteria, even this effect
differs morphologically.
Ravn et al. using agar dilution assay method, studied the minimum inhibitory effect of
three isolated compounds from P. major, which are plantamajoside (a caffeic acid ester),
forsythiaside, and chlorogenic acid, found MIC values as 2.0, 1.5, and 2.5 mg/mL, for S.
aureus (SO2A), and >2.5, >2.5, and 2.5 mg/mL for E .coli (MI30), respectively ( Ravn
et al. 1988). These findings indicate that, even the isolates were used directly in the
study of Ravn et. al (1988); the inhibitory capacities were almost the same for crude
extract and fraction samples compared to the present study given in this thesis.
A more recent study from Bilecik in Turkiye, reported about several medicinal plant
antimicrobial effects on the following strains of Staphylococcus aureus ATCC 6538,
Staphylococcus epidermidis ATCC 12228, Escherichia coli ATCC 8739, Klebsiella
pneumoniae ATCC 4352, Proteus mirabilis ATCC 14153, Pseudomonas aeruginosa
ATCC 1539, Shigella flexneri and Candida albicans ATCC 10231. They found that
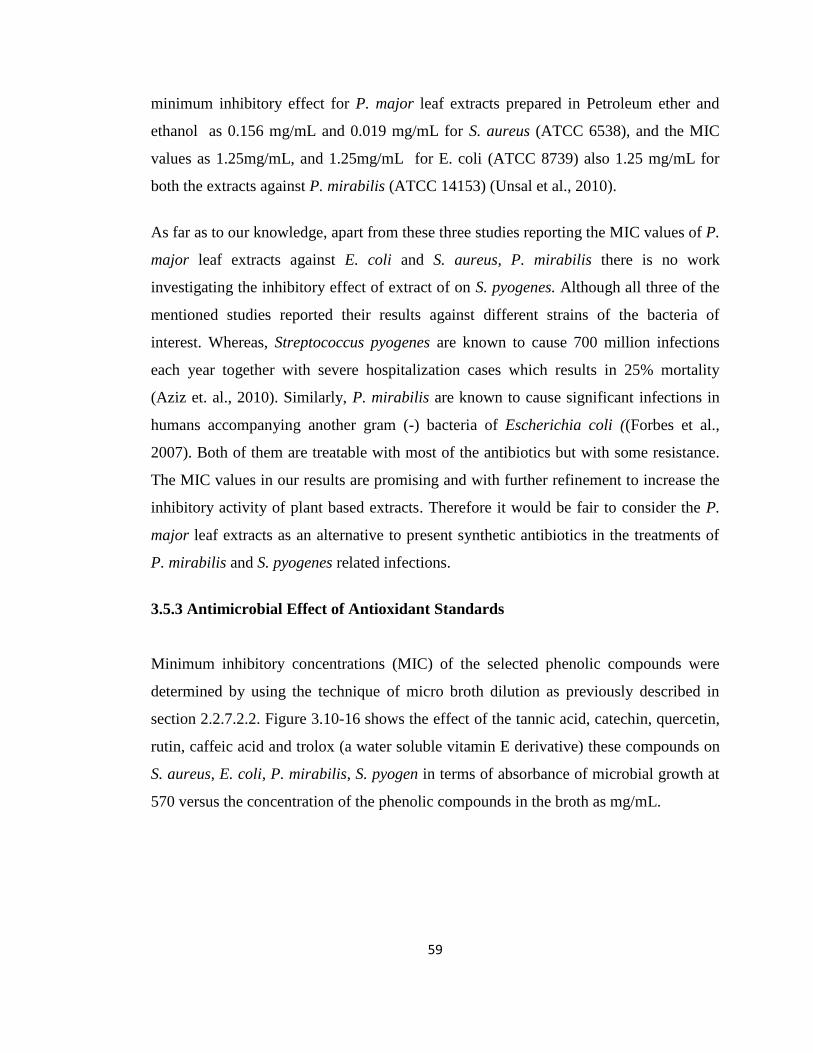
59
minimum inhibitory effect for P. major leaf extracts prepared in Petroleum ether and
ethanol as 0.156 mg/mL and 0.019 mg/mL for S. aureus (ATCC 6538), and the MIC
values as 1.25mg/mL, and 1.25mg/mL for E. coli (ATCC 8739) also 1.25 mg/mL for
both the extracts against P. mirabilis (ATCC 14153) (Unsal et al., 2010).
As far as to our knowledge, apart from these three studies reporting the MIC values of P.
major leaf extracts against E. coli and S. aureus, P. mirabilis there is no work
investigating the inhibitory effect of extract of on S. pyogenes. Although all three of the
mentioned studies reported their results against different strains of the bacteria of
interest. Whereas, Streptococcus pyogenes are known to cause 700 million infections
each year together with severe hospitalization cases which results in 25% mortality
(Aziz et. al., 2010). Similarly, P. mirabilis are known to cause significant infections in
humans accompanying another gram (-) bacteria of Escherichia coli ((Forbes et al.,
2007). Both of them are treatable with most of the antibiotics but with some resistance.
The MIC values in our results are promising and with further refinement to increase the
inhibitory activity of plant based extracts. Therefore it would be fair to consider the P.
major leaf extracts as an alternative to present synthetic antibiotics in the treatments of
P. mirabilis and S. pyogenes related infections.
3.5.3 Antimicrobial Effect of Antioxidant Standards
Minimum inhibitory concentrations (MIC) of the selected phenolic compounds were
determined by using the technique of micro broth dilution as previously described in
section 2.2.7.2.2. Figure 3.10-16 shows the effect of the tannic acid, catechin, quercetin,
rutin, caffeic acid and trolox (a water soluble vitamin E derivative) these compounds on
S. aureus, E. coli, P. mirabilis, S. pyogen in terms of absorbance of microbial growth at
570 versus the concentration of the phenolic compounds in the broth as mg/mL.
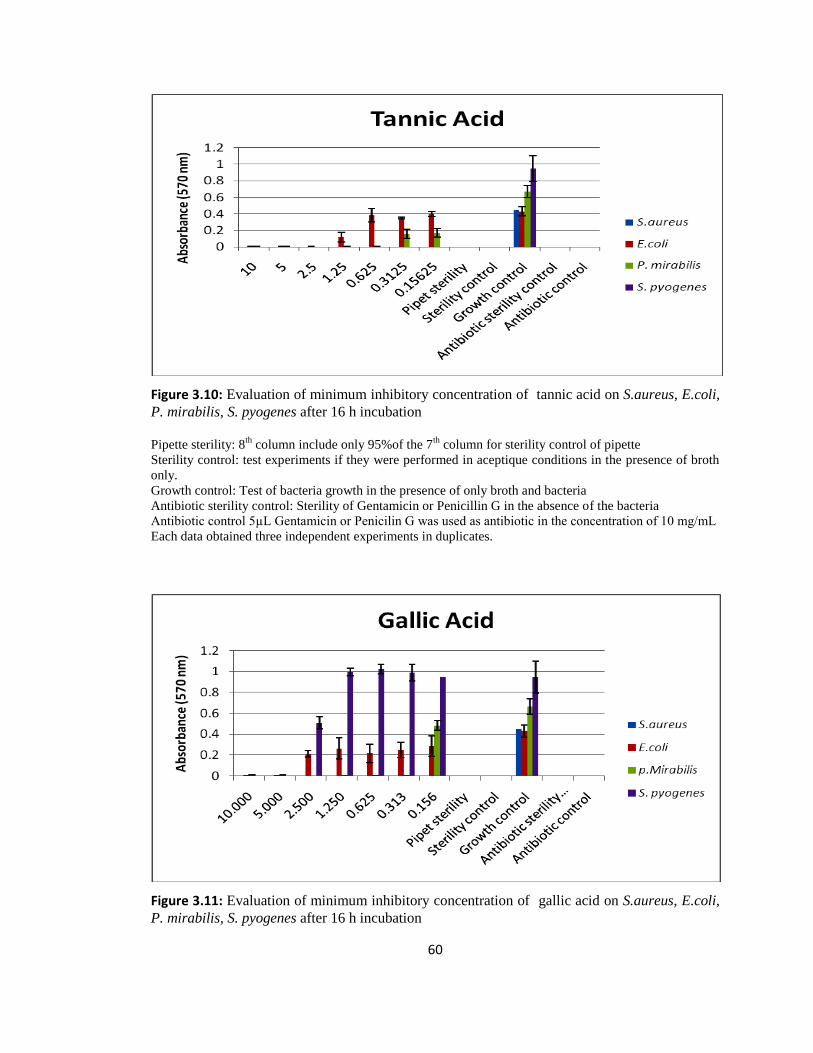
60
Figure 3.10: Evaluation of minimum inhibitory concentration of tannic acid on S.aureus, E.coli,
P. mirabilis, S. pyogenes after 16 h incubation
Pipette sterility: 8
th column include only 95%of the 7
th column for sterility control of pipette
Sterility control: test experiments if they were performed in aceptique conditions in the presence of broth
only.
Growth control: Test of bacteria growth in the presence of only broth and bacteria
Antibiotic sterility control: Sterility of Gentamicin or Penicillin G in the absence of the bacteria
Antibiotic control 5µL Gentamicin or Penicilin G was used as antibiotic in the concentration of 10 mg/mL
Each data obtained three independent experiments in duplicates.
Figure 3.11: Evaluation of minimum inhibitory concentration of gallic acid on S.aureus, E.coli,
P. mirabilis, S. pyogenes after 16 h incubation
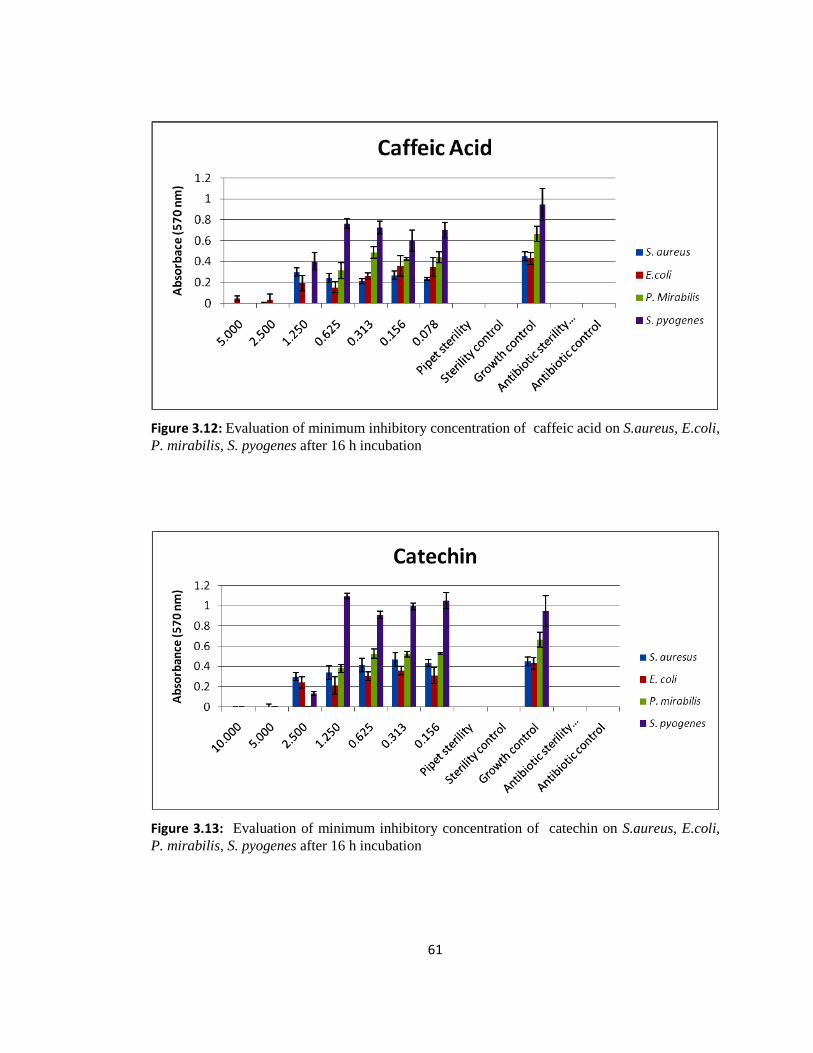
61
Figure 3.12: Evaluation of minimum inhibitory concentration of caffeic acid on S.aureus, E.coli,
P. mirabilis, S. pyogenes after 16 h incubation
Figure 3.13: Evaluation of minimum inhibitory concentration of catechin on S.aureus, E.coli,
P. mirabilis, S. pyogenes after 16 h incubation
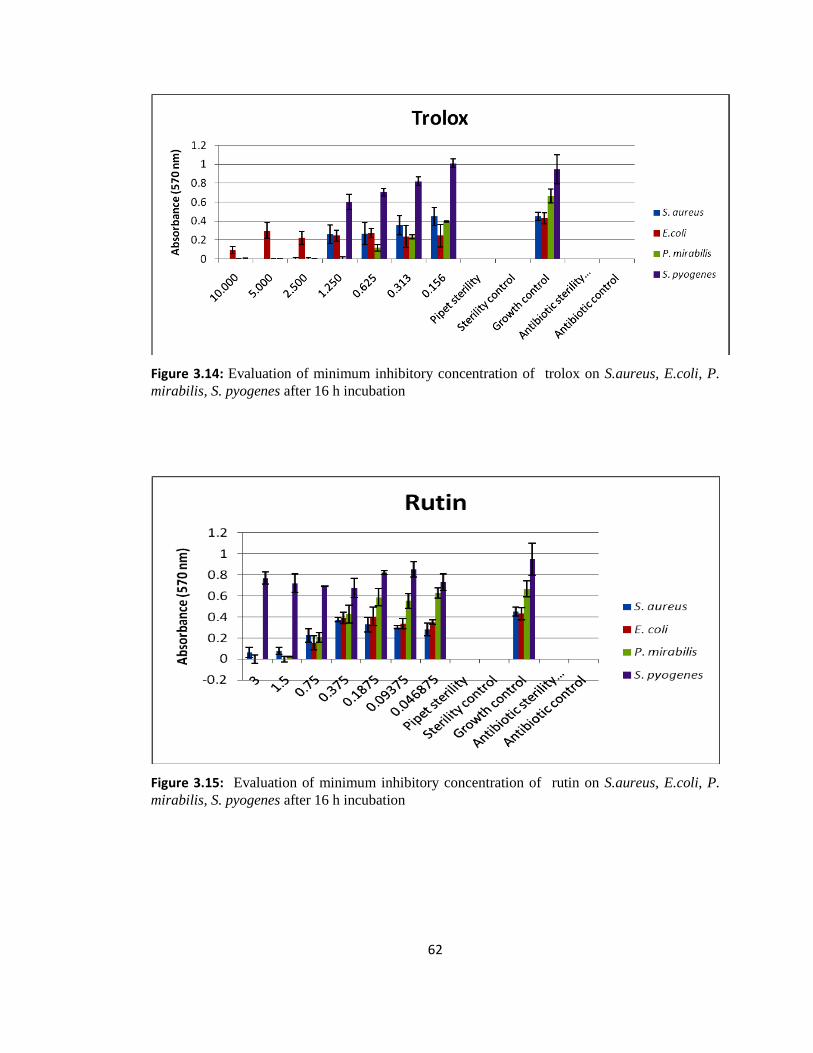
62
Figure 3.14: Evaluation of minimum inhibitory concentration of trolox on S.aureus, E.coli, P.
mirabilis, S. pyogenes after 16 h incubation
Figure 3.15: Evaluation of minimum inhibitory concentration of rutin on S.aureus, E.coli, P.
mirabilis, S. pyogenes after 16 h incubation
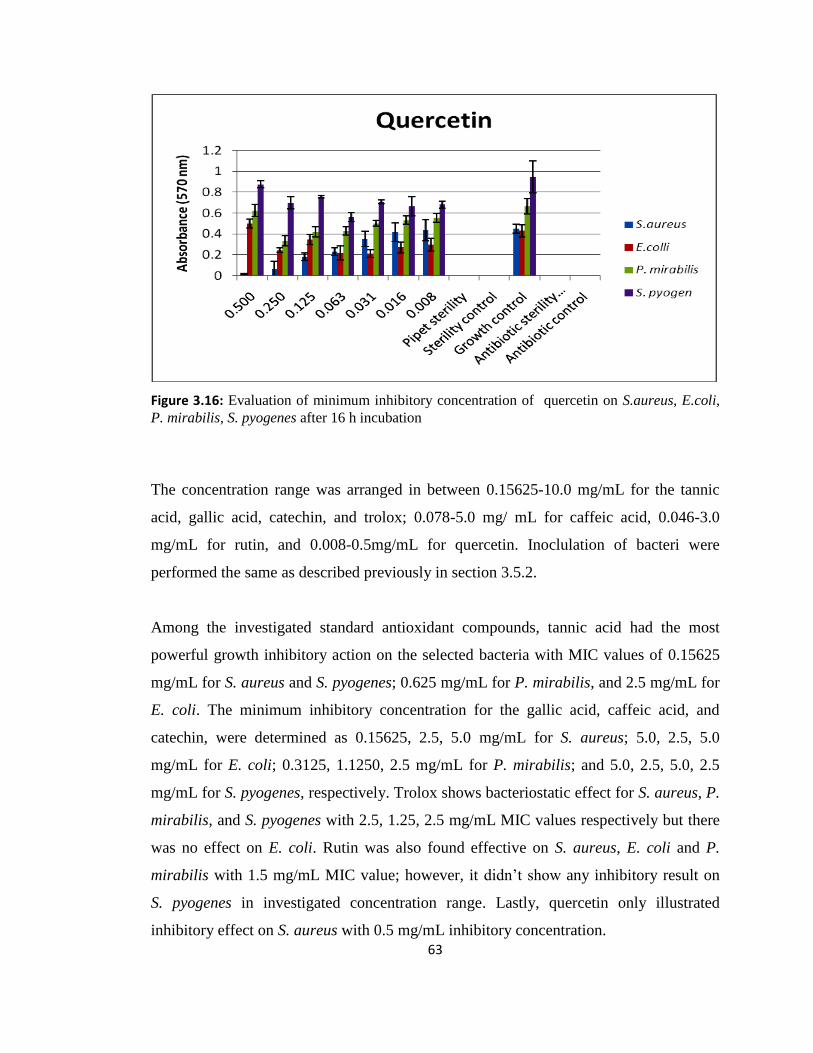
63
Figure 3.16: Evaluation of minimum inhibitory concentration of quercetin on S.aureus, E.coli,
P. mirabilis, S. pyogenes after 16 h incubation
The concentration range was arranged in between 0.15625-10.0 mg/mL for the tannic
acid, gallic acid, catechin, and trolox; 0.078-5.0 mg/ mL for caffeic acid, 0.046-3.0
mg/mL for rutin, and 0.008-0.5mg/mL for quercetin. Inoclulation of bacteri were
performed the same as described previously in section 3.5.2.
Among the investigated standard antioxidant compounds, tannic acid had the most
powerful growth inhibitory action on the selected bacteria with MIC values of 0.15625
mg/mL for S. aureus and S. pyogenes; 0.625 mg/mL for P. mirabilis, and 2.5 mg/mL for
E. coli. The minimum inhibitory concentration for the gallic acid, caffeic acid, and
catechin, were determined as 0.15625, 2.5, 5.0 mg/mL for S. aureus; 5.0, 2.5, 5.0
mg/mL for E. coli; 0.3125, 1.1250, 2.5 mg/mL for P. mirabilis; and 5.0, 2.5, 5.0, 2.5
mg/mL for S. pyogenes, respectively. Trolox shows bacteriostatic effect for S. aureus, P.
mirabilis, and S. pyogenes with 2.5, 1.25, 2.5 mg/mL MIC values respectively but there
was no effect on E. coli. Rutin was also found effective on S. aureus, E. coli and P.
mirabilis with 1.5 mg/mL MIC value; however, it didn’t show any inhibitory result on
S. pyogenes in investigated concentration range. Lastly, quercetin only illustrated
inhibitory effect on S. aureus with 0.5 mg/mL inhibitory concentration.
64
Aguri and his co-workers worked with the 47 different phenolic compounds, some were
isolated from plants and some were purchased standard phenolics containing tannic acid,
gallic acid, catechin, rutin, caffeic acid; and determined the antimicrobial effects of
listed phenolics on S. aureus (ATCC29213), E .coli (ATCC25922) and P. mirabilis
(ATCC7001) (Aguri et. al., 2006). Their findings are in agreement with our results for
tannic acid, catechin, rutin, caffeic acid, except gallic acid, which was 0.6 mg/mL (MIC)
for E. coli, but we found it as 5.0 mg/mL (MIC) in the current study. The same research
group has also reported the MIC values for 10 different phenolic compound including
tannic acid against 10-27 different strains of S. aureus, Salmonella, E.coli, and Vibrio, in
another study. What they found is surprising yet expected, as they showed that MIC
values of tannic acid were different but in range of 0.8 mg/mL to 3.2 mg/mL (MIC) for
the 23 different strains of the E.coli investigated. These results put the case clearly that
phenolics (even they are purchased standards) may have different inhibitory action on
even different strains of same bacteria. More surprisingly, they reported two different
MIC values of 1.34 mg/mL and 0.8 mg/mL for the same strain of E. coli, cultivated at
different times, which was also the case for the same strain of S. aureus, where MIC
values were 0.4 mg/mL and 0.1 mg/mL for tannic acid, when bacterial cultures were
cultivated in 2006 or 2004, respectively (Aguri et. al., 2006; Aguri et. al., 2004). Hence,
despite the quality of the extracted/ isolated phenolics, the bacterial strains, and even the
cultivation medium are important factors on MIC value determination experiments.
Binnuty et al. studied antibacterial effect of isolated gallic acid compound from the
leaves of Mezoneuron benthamianum on the gram (+) Staphylococcus aureus (ATCC
29213), and gram (-) Escherichia coli (ATCC 25922) and found the MIC values as 0.25
mg/ mL for S. aureus and 1.0 mg /mL for the E. coli (Binnuty, 2000), which were found
as 0.156 mg/mL for S. aureus and 5.0 mg/mL for E. coli in our work. However, as stated
above, the MIC values are ranging widely for different strains or even for different
operators as reported in the literature. For examples Henis et. al, has observed no
inhibitory effect up to tannic acid or gallic acid concentrations of 1.0 mg/mL, while, in
our case, 2.5 mg/mL tannic acid and 5.0 mg/mL gallic acid were effective for E. coli
(Henis et al., 1964). Similarly, for the other standards like caffeic acid much higher MIC
65
value of 27.6 mM for E. coli was evaluated (when MIC values were re-calculated in
units of mM) compared to 8mM reported value of Barbet et. al. (2000) for E. coli.
(Barbet, 2000)
Kajiya et al. evaluated the antibacterial activities of the catechin and catechin derivatives
with different alkyl chain lengths against gram (+) bacteria including S. aureus
(IAM1011) and found out minimum inhibitory concentrations as 12.8mg/mL for
catechin. On the other hand, catechin derivatives which have different alkyl chain
lengths showed lower MIC values up to 0.025 mg/mL. They presumed that the
antibacterial activity of the (+)-catechin derivatives and their interaction with the
bacterial membrane are closely correlated (Kajiya, 2004).
Gatto et al examined the antimicrobial activity of quercetin and its derivatives using
different clinically isolated microorganisms, including five gram (+) strains (S. aureus,
B. subtilis, Listeria ivanovi, Listeria monocytogenes, Listeria serligeri) and five different
gram (-) strains (Escherichia coli, Shigella flexneri, Shigella sonnei, Salmonella
enteritidis, Salmonella tiphymurium); and quercetin concentration up to 0.1 mg/mL did
not show antimicrobial activity against any of these bacteria, because of the low
solubility feature of quercetin in methanol (Gatto et al., 2001), in the current study it
was found only effective on S. aureus with the MIC value of 0.5mg/ mL.
3.5.4 Minimum Bactericidal Concentration
In order to evaluate whether the observed crude extract/fraction samples or standard
phenolic compounds’ MIC values were bacteriostatic or bactericidal, MBC/MIC ratios
should be calculated. The MBC is the minimal concentration of antimicrobial compound
that kills the inoculums and can be determined from broth dilution MIC tests by sub
culturing some to agar media as described in section 2.2.7.2.3. An antimicrobial
substance regarded as the bactericidal if the ratio of MBC/MIC is not more than four
(French, 2006)
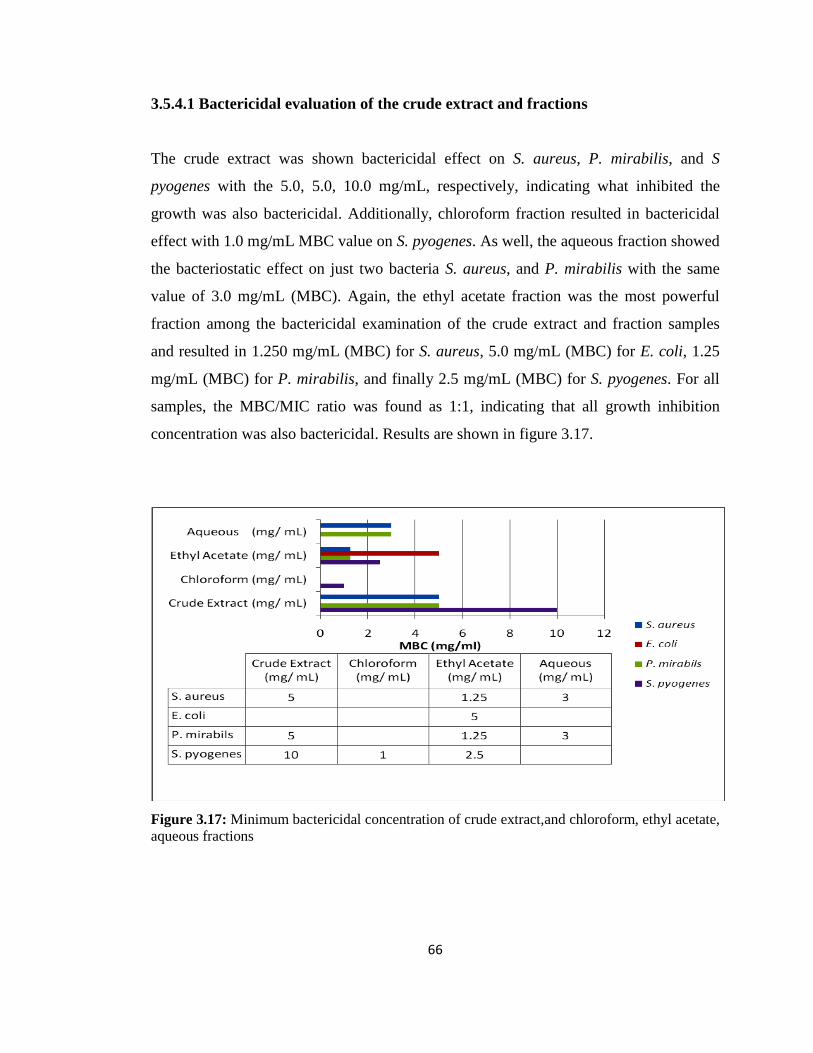
66
3.5.4.1 Bactericidal evaluation of the crude extract and fractions
The crude extract was shown bactericidal effect on S. aureus, P. mirabilis, and S
pyogenes with the 5.0, 5.0, 10.0 mg/mL, respectively, indicating what inhibited the
growth was also bactericidal. Additionally, chloroform fraction resulted in bactericidal
effect with 1.0 mg/mL MBC value on S. pyogenes. As well, the aqueous fraction showed
the bacteriostatic effect on just two bacteria S. aureus, and P. mirabilis with the same
value of 3.0 mg/mL (MBC). Again, the ethyl acetate fraction was the most powerful
fraction among the bactericidal examination of the crude extract and fraction samples
and resulted in 1.250 mg/mL (MBC) for S. aureus, 5.0 mg/mL (MBC) for E. coli, 1.25
mg/mL (MBC) for P. mirabilis, and finally 2.5 mg/mL (MBC) for S. pyogenes. For all
samples, the MBC/MIC ratio was found as 1:1, indicating that all growth inhibition
concentration was also bactericidal. Results are shown in figure 3.17.
Figure 3.17: Minimum bactericidal concentration of crude extract,and chloroform, ethyl acetate,
aqueous fractions
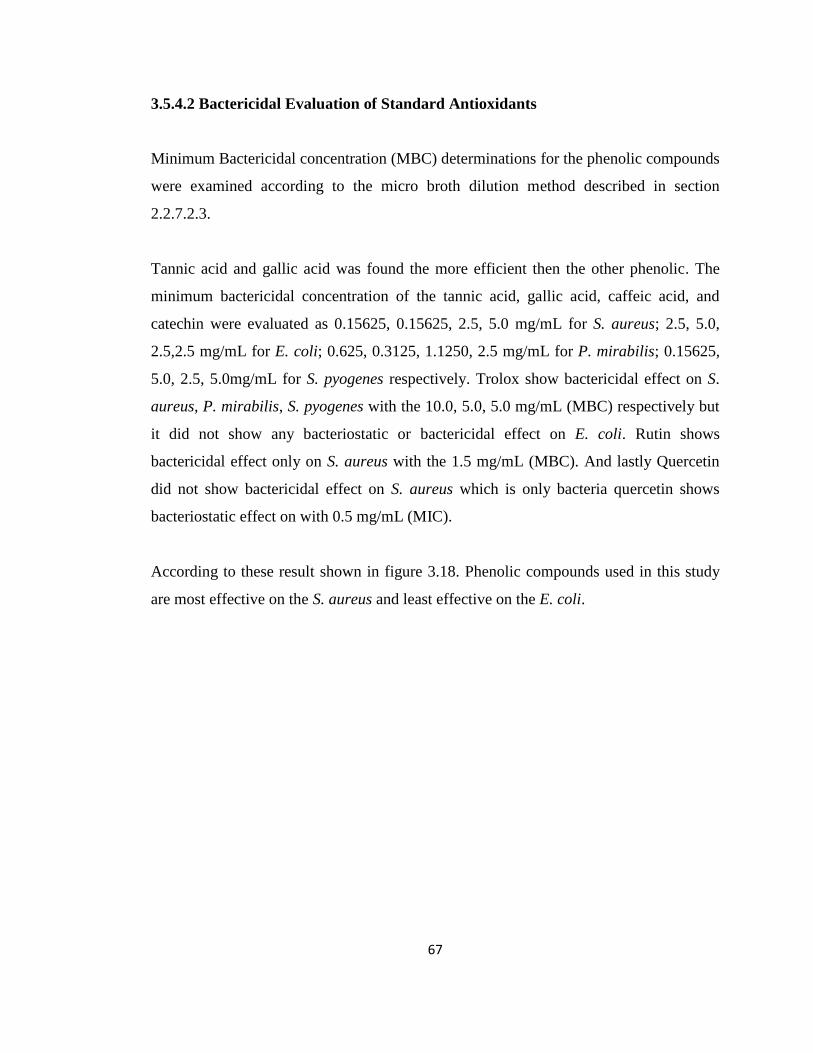
67
3.5.4.2 Bactericidal Evaluation of Standard Antioxidants
Minimum Bactericidal concentration (MBC) determinations for the phenolic compounds
were examined according to the micro broth dilution method described in section
2.2.7.2.3.
Tannic acid and gallic acid was found the more efficient then the other phenolic. The
minimum bactericidal concentration of the tannic acid, gallic acid, caffeic acid, and
catechin were evaluated as 0.15625, 0.15625, 2.5, 5.0 mg/mL for S. aureus; 2.5, 5.0,
2.5,2.5 mg/mL for E. coli; 0.625, 0.3125, 1.1250, 2.5 mg/mL for P. mirabilis; 0.15625,
5.0, 2.5, 5.0mg/mL for S. pyogenes respectively. Trolox show bactericidal effect on S.
aureus, P. mirabilis, S. pyogenes with the 10.0, 5.0, 5.0 mg/mL (MBC) respectively but
it did not show any bacteriostatic or bactericidal effect on E. coli. Rutin shows
bactericidal effect only on S. aureus with the 1.5 mg/mL (MBC). And lastly Quercetin
did not show bactericidal effect on S. aureus which is only bacteria quercetin shows
bacteriostatic effect on with 0.5 mg/mL (MIC).
According to these result shown in figure 3.18. Phenolic compounds used in this study
are most effective on the S. aureus and least effective on the E. coli.
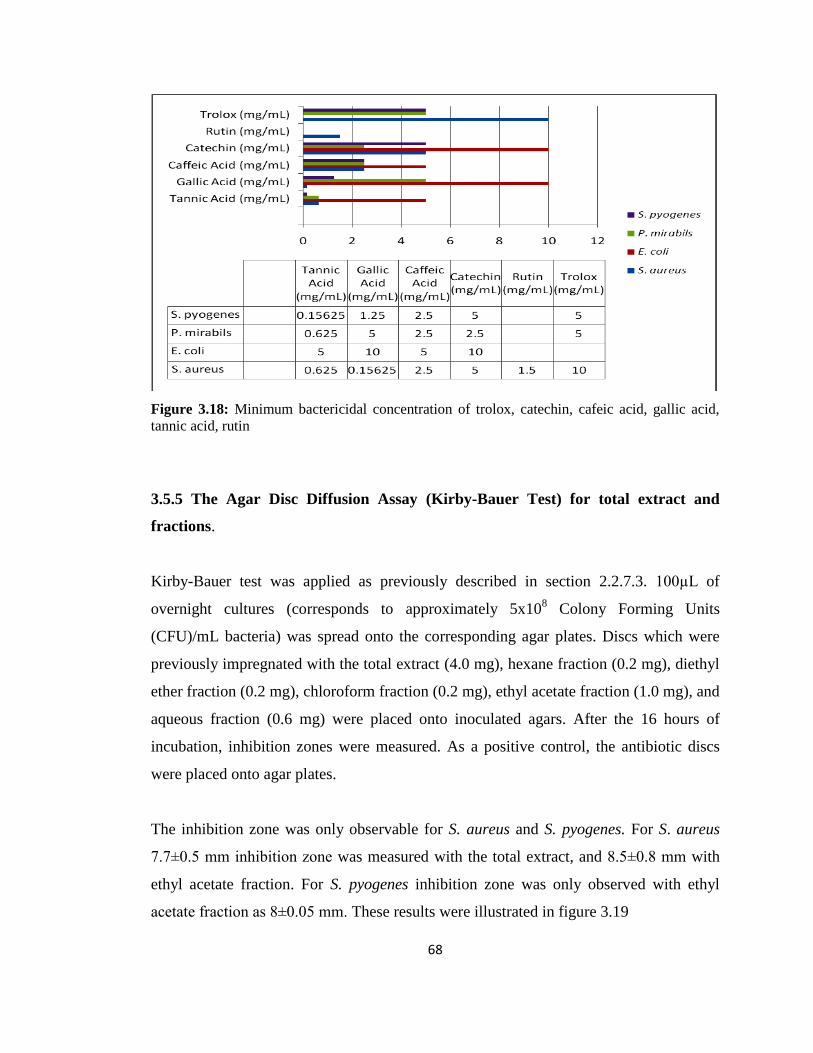
68
Figure 3.18: Minimum bactericidal concentration of trolox, catechin, cafeic acid, gallic acid,
tannic acid, rutin
3.5.5 The Agar Disc Diffusion Assay (Kirby-Bauer Test) for total extract and
fractions.
Kirby-Bauer test was applied as previously described in section 2.2.7.3. 100µL of
overnight cultures (corresponds to approximately 5x10⁸ Colony Forming Units
(CFU)/mL bacteria) was spread onto the corresponding agar plates. Discs which were
previously impregnated with the total extract (4.0 mg), hexane fraction (0.2 mg), diethyl
ether fraction (0.2 mg), chloroform fraction (0.2 mg), ethyl acetate fraction (1.0 mg), and
aqueous fraction (0.6 mg) were placed onto inoculated agars. After the 16 hours of
incubation, inhibition zones were measured. As a positive control, the antibiotic discs
were placed onto agar plates.
The inhibition zone was only observable for S. aureus and S. pyogenes. For S. aureus
7.7±0.5 mm inhibition zone was measured with the total extract, and 8.5±0.8 mm with
ethyl acetate fraction. For S. pyogenes inhibition zone was only observed with ethyl
acetate fraction as 8±0.05 mm. These results were illustrated in figure 3.19
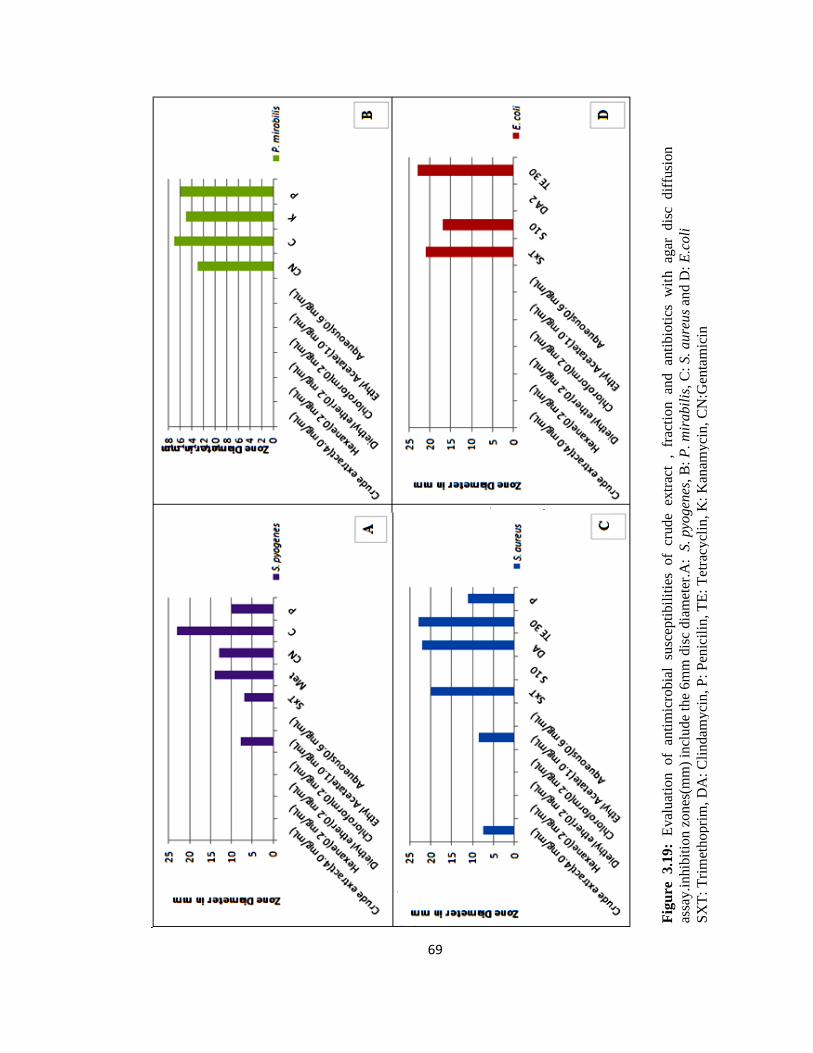
69
Fig
ure
3
.19
: E
val
uat
ion
o
f an
tim
icro
bia
l su
scep
tibil
itie
s of
crude
extr
act
, fr
acti
on an
d
anti
bio
tics
w
ith
ag
ar
dis
c d
iffu
sion
assa
y.i
nhib
itio
n z
on
es(m
m)
incl
ud
e th
e 6m
m d
isc
dia
met
er.A
: S
. pyo
gen
es,
B:
P. m
irabil
is,
C:
S.
au
reu
s an
d D
: E
.co
li
SX
T:
Tri
met
ho
pri
m, D
A:
Cli
ndam
yci
n, P
: P
enic
ilin
, T
E:
Tet
racy
clin
, K
: K
anam
yci
n,
CN
:Gen
tam
icin
DA
: C
lin
dam
yci
n
P:
Pen
icil
in
TE
: T
etra
cycl
in
K:
Kan
amy
cin
CN
:Gen
tam
icin
70
Stanisavljevic et al. studied antimicrobial effect of the P. major ethanol extract on the S.
aureus ATCC 6538, and E. coli ATCC 25922 with the agar well diffusion assay by
cutting a hole with 10mm diameter in inoculated agar plates (loaded cell= 106 CFU/mL )
and filling it with 30µL total extract in methanol (20mg/mL). They calculated the
inhibition zone as 10.7±0.3 and 11.7±0.4 mm for S. aureus and E. coli, respectively.
(Stanisavljevic et al., 2008)
Lezama et al. performed disk diffusion assay for P. major leaves extracted in four
different solvents, which were methanol, water, hexane, and chloroform extractions,
against E. coli and B. subtilis. They used cell suspensions with 108 CFU/mL
concentration as initial load and placed discs impregnated with 0.40, 0.20, 0.10, 0.05 and
0.025 mg/mL of the plant extracts collected by four different solvents. According to
their results, water and methanol extracts of the P. major did not show any inhibitory
effect on E. coli, on the other hand, hexane extract inhibited the growth of E. coli in a
dose-dependent fashion as 34.0, 30.0, 24.0, 18.0, 13.0 mm zone diameter for 0.40, 0.20,
0.10, 0.05 and 0.025 mg/mL, respectively; then again, it was 12.0, and 9.0 mm inhibition
zones for for 0.40 and 0.20 g/mL plant extract, respectively. Contrary to E. coli; water
and methanol extract of the P. major showed an inhibitory effect on B. subtilis.
Consequently, they interpreted these results as ‘finding may be related with the polarity
of the compounds in the extract and their capability to penetrate cell walls with
hydrophilic environments (Gram-positive bacteria) and hydrophobic or lipophilic
environments (Gram-negative bacteria), respectively’ (Lezama et al., 2005).
3.5.6 The Agar Disc Diffusion Assay (Kirby-Bauer Test) for standard phenolics
Kirby-Bauer test was applied as previously described in section 2.2.7.3. Briefly, 100µL
of overnight cultures, (approximately 5x10⁸ CFU/mL bacteria) were spread onto the
corresponding agar plates. Discs, which were previously impregnated with the tannic
acid (2.0 mg), gallic acid (2.0 mg), catechin (2.0 mg), trolox (2.0 mg), caffeic acid (1.0
mg), rutin (0.6 mg), and quercetin (0.1 mg), were placed onto inoculated agar. After 16
hours of incubation at 37oC, the diameter of inhibition zones were measured.
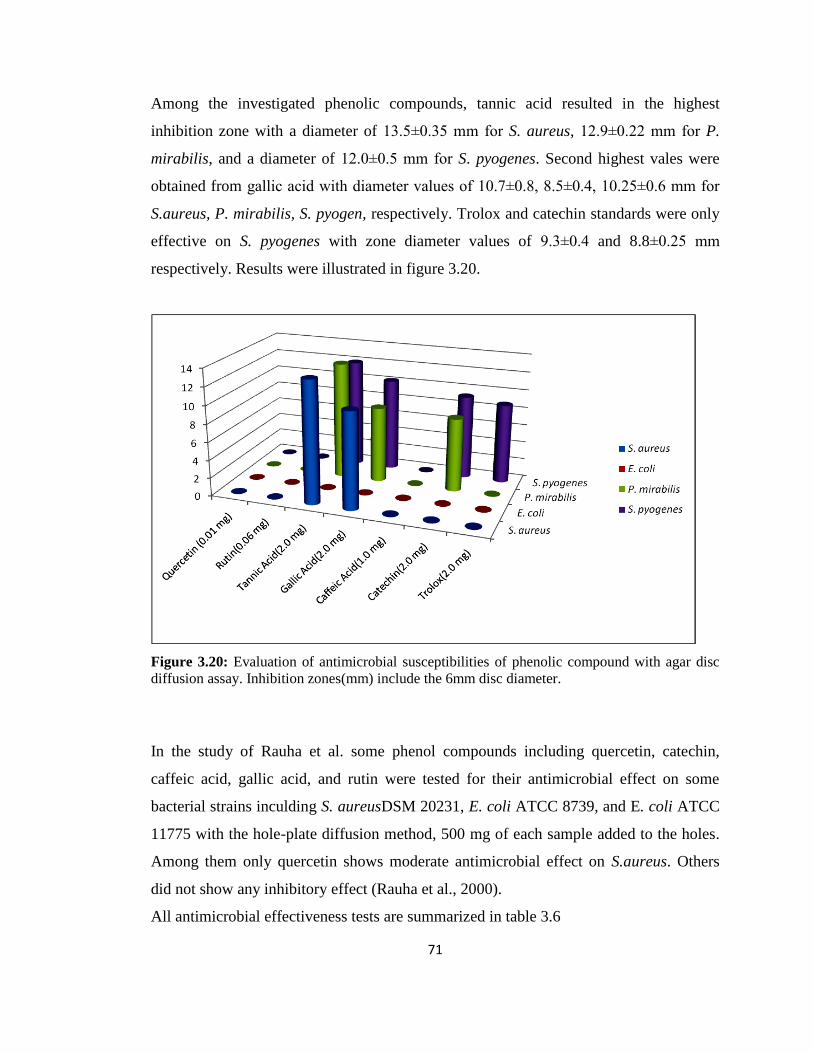
71
Among the investigated phenolic compounds, tannic acid resulted in the highest
inhibition zone with a diameter of 13.5±0.35 mm for S. aureus, 12.9±0.22 mm for P.
mirabilis, and a diameter of 12.0±0.5 mm for S. pyogenes. Second highest vales were
obtained from gallic acid with diameter values of 10.7±0.8, 8.5±0.4, 10.25±0.6 mm for
S.aureus, P. mirabilis, S. pyogen, respectively. Trolox and catechin standards were only
effective on S. pyogenes with zone diameter values of 9.3±0.4 and 8.8±0.25 mm
respectively. Results were illustrated in figure 3.20.
Figure 3.20: Evaluation of antimicrobial susceptibilities of phenolic compound with agar disc
diffusion assay. Inhibition zones(mm) include the 6mm disc diameter.
In the study of Rauha et al. some phenol compounds including quercetin, catechin,
caffeic acid, gallic acid, and rutin were tested for their antimicrobial effect on some
bacterial strains inculding S. aureusDSM 20231, E. coli ATCC 8739, and E. coli ATCC
11775 with the hole-plate diffusion method, 500 mg of each sample added to the holes.
Among them only quercetin shows moderate antimicrobial effect on S.aureus. Others
did not show any inhibitory effect (Rauha et al., 2000).
All antimicrobial effectiveness tests are summarized in table 3.6
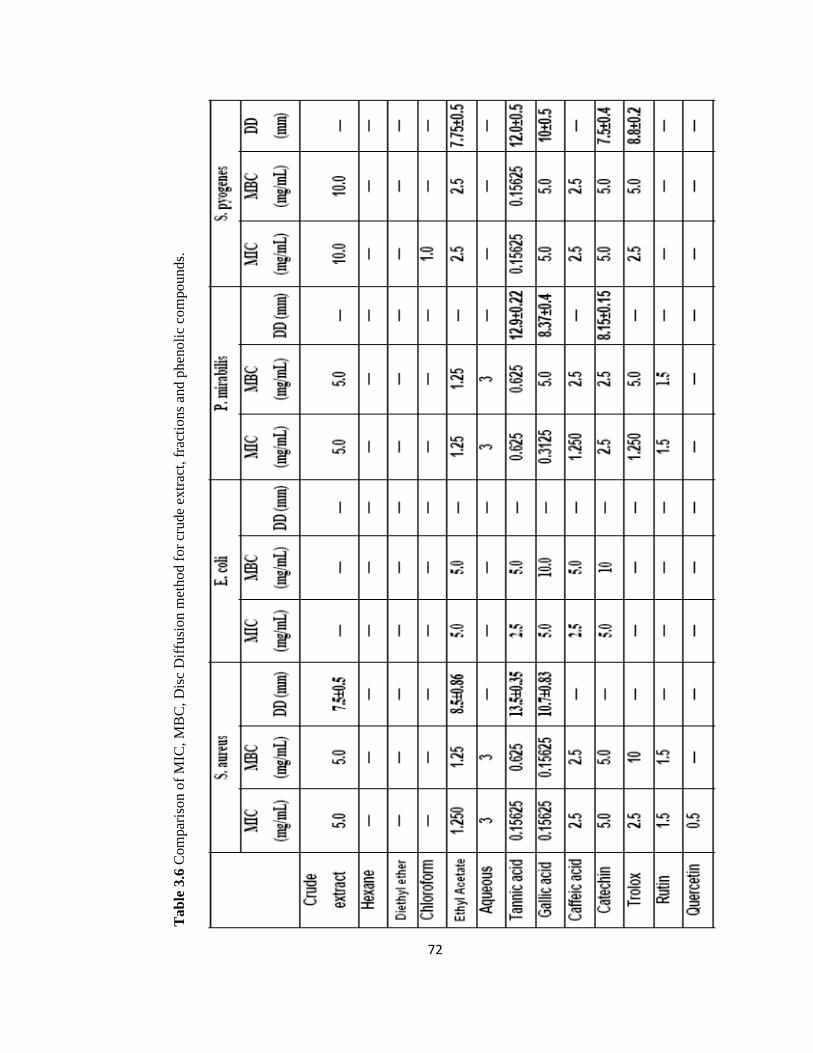
72
Tab
le 3
.6 C
om
par
iso
n o
f M
IC, M
BC
, D
isc
Dif
fusi
on m
ethod f
or
crude
extr
act,
fra
ctio
ns
and p
hen
oli
c co
mpo
un
ds.
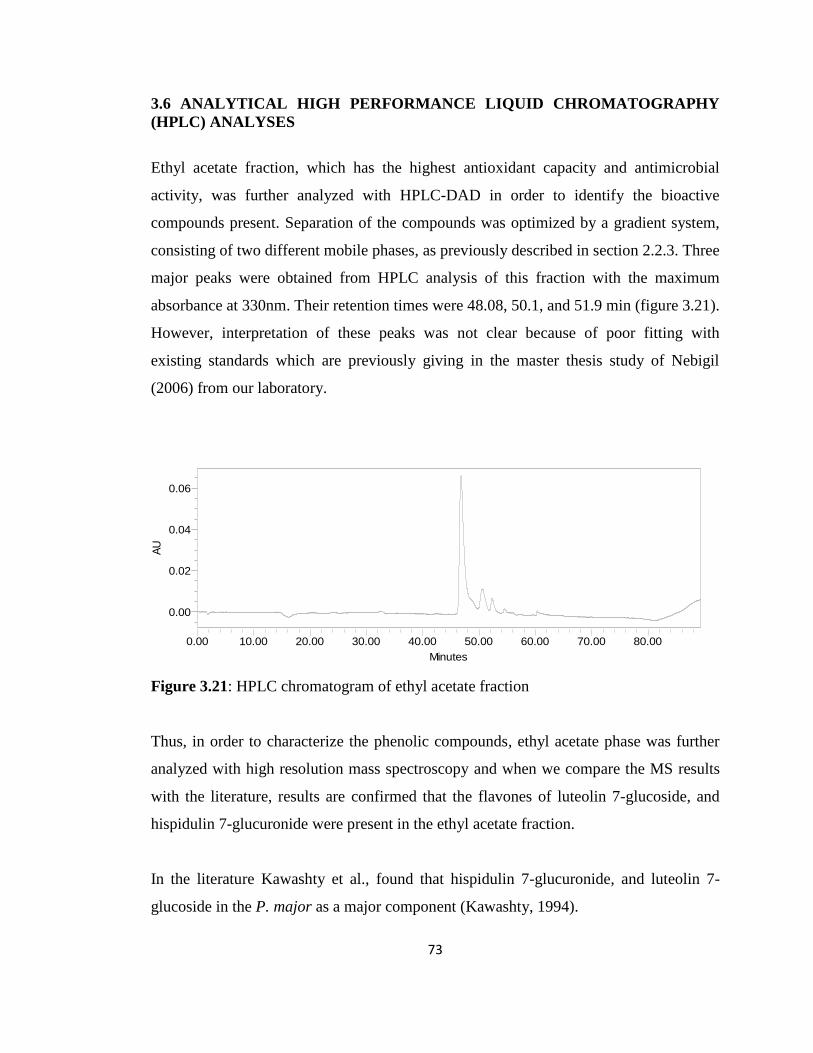
73
3.6 ANALYTICAL HIGH PERFORMANCE LIQUID CHROMATOGRAPHY
(HPLC) ANALYSES
Ethyl acetate fraction, which has the highest antioxidant capacity and antimicrobial
activity, was further analyzed with HPLC-DAD in order to identify the bioactive
compounds present. Separation of the compounds was optimized by a gradient system,
consisting of two different mobile phases, as previously described in section 2.2.3. Three
major peaks were obtained from HPLC analysis of this fraction with the maximum
absorbance at 330nm. Their retention times were 48.08, 50.1, and 51.9 min (figure 3.21).
However, interpretation of these peaks was not clear because of poor fitting with
existing standards which are previously giving in the master thesis study of Nebigil
(2006) from our laboratory.
AU
0.00
0.02
0.04
0.06
Minutes
0.00 10.00 20.00 30.00 40.00 50.00 60.00 70.00 80.00
Figure 3.21: HPLC chromatogram of ethyl acetate fraction
Thus, in order to characterize the phenolic compounds, ethyl acetate phase was further
analyzed with high resolution mass spectroscopy and when we compare the MS results
with the literature, results are confirmed that the flavones of luteolin 7-glucoside, and
hispidulin 7-glucuronide were present in the ethyl acetate fraction.
In the literature Kawashty et al., found that hispidulin 7-glucuronide, and luteolin 7-
glucoside in the P. major as a major component (Kawashty, 1994).
74
Shimoi and co workers investigated the intestinal absorption of luteolin and luteolin 7-
O-glucoside in rats by HPLC. The absorption analysis using rat everted small intestine
demonstrated that luteolin was converted to glucuronides during passing through the
intestinal mucosa and that luteolin 7-O-glucoside was absorbed after hydrolysis to
luteolin (Shimoi et al., 1998).
75
CHAPTER 4
CONCLUSION
There is abundance of literal evidences saying that Plantago major leaves are
effective on treatment of many diseases such as wound healing, ulcer or cancer.
Hereby, it was aimed to determine the phytochemicals responsible for that
pronounced antioxidant and antimicrobial effect when the plant was used as folk
medicine. Based on the knowledge of having diverse solubility of phytochemicals in
different solvents with different polarities, in this thesis study, we have started out to
investigate the extraction quality and fractionation capacity of P. major leaves by
using the classical methanol extraction method which was followed by fractioning
with solvents in increasing polarity, in order of hexane, diethyl ether, chloroform,
ethyl acetate. Final aqueous phase was also run to conclude on possible
phytochemicals present.
Among the entire investigated samples, ethyl acetate fraction was found as the most
effective in both DPPH and ABTS radical scavenging capacity measurements,
indicating that the concentrated form of existing phenolics were generally dissolved
in this mid-polarity solvent, after collected with highly polar methanol. As
supporting evidence, total phenolic content and the total flavonoid content were the
highest in ethyl acetate fraction; conversely, other solvents of hexane, diethyl ether,
and chloroform fractions did not show neither radical scavenging activity nor total
phenolic and flavonoid contents.
According to the minimum inhibitory concentration (MIC) results, only crude
extract, ethyl acetate fraction and aqueous phase showed a weak antimicrobial effect
on the bacteria used. Nonetheless, ethyl acetate fraction most effectively inhibited the
76
growth of the selected bacterial populations same as in the case of antioxidant
capacity determination. Similarly, hexane, diethyl ether and chloroform fractions did
not show any growth inhibition.
Minimum bactericidal concentration (MBC) findings showed a hundred percent
compatibility with the MIC results which means that what is bacteriostatic in crude
extract, aqueous phase and ethyl acetate fraction samples were also bactericidal
(MBC/MIC =1). Another probative evidence came from disc diffusion test, which
resulted in zone of inhibition on pre-inoculated agar plates with selected bacteria
when crude extract and ethyl acetate fraction samples, but not aqueous phase
samples, were impregnated onto discs. This test is something related with the
maximum solvable amount of bio-active compounds in solvents, and results can be
explained with poor solubility of agar in aqueous phase. Other than that, zone of
inhibition was only observable when agar plates were inoculated with the two of
gram positive bacteria which were S. aureus and S. pyogenes, not with that of gram
negative ones. This may also be an outcome of insufficient dispersion of bio-active
material onto solid media to kill gram negative bacteria.
As a final step, it was tried to identify and quantify the existing phenolic compounds
in ethyl acetate phase, thus HPLC analysis was conducted, however, poor separation
of observed peaks lead us to perform high resolution mass spectroscopy to
characterize these peaks. MS results confirmed that the flavones of Luteolin 7-
glucoside and hispidulin 7-glucuronide were present in the ethyl acetate fraction.
Depending on these findings, we concluded that the crude extract and ethyl acetate
fraction of P. major leaves owe the antioxidant capacity to high concentration of
listed flavonoid compounds, even they have a weak antimicrobial activity on
bacterial populations studied.
77
REFERENCES
Abdalla A. E., Roozen J. P. (1999). Effect of plant extracts on the oxidative
stability of sunflower oil and emulsion. Food Chemistry, 64, 323-329
Aguri T. T., Anaka T. T., Kouno I. (2006). Antibacterial spectrum of plant
polyphenols and extracts depending upon hydroxyphenyl structure, Forestry, 29,
2226-2235
Andrews J. M. (2001). Determination of minimum inhibitory concentrations.
Journal of Antimicrobial Chemotherapy, 48, 5-16
Apak R. , Güçlü K., Demirata B., Özyürek M., Çelik S. E., Bektaşoğlu B.,
Berker K. I., Özyurt D. (2007). Comparative evaluation of various total antioxidant
capacity assays applied to phenolic compounds with the CUPRAC assay. Molecules,
12, 1496-1547
Atta A.H., El-Sooud K.A. (2004) The antinociceptive effect of some Egyptian
medicinal plant extracts. Journal of Ethnopharmacology, 95: 235–238.
Aziz R. A., Sarmidi M. R., Kumaresan S., Taher Z. M., Yee F. C. (2003).
Phytochemical processing: the next emerging field in chemical engineering aspects
and opportunities. Jurnal Kkejuruteraan Kimia Malaysia, 3, 45–60
Balandrin M. F., Kinghorn A. D., Farnsworth N. R. (1993). Plant-derived natural
products in drug discovery and development. American Chemical Society, 2-10
Bandow J. E., Brötz H., Leichert L. I. O., Labischinski H., Hecker M. (2003).
Proteomic approach to understanding antibiotic action. Antimicrobial Agents and
Chemotherapy, 47, 948-955
78
Barber M. S., McConnell V. S., DeCaux B. S. (2000). Antimicrobial intermediates
of the general phenylpropanoid lignin specific pathways. Phytochemistry, 54, 53-56
Barut B. (2011) Antioxidant capacities of selected fruits and herbal teas consumed
in regular diet and their antimicrobial activities against Staphylococcus aureus, M.Sc
Thesis. Middle East Technical University., Turkey.
Beara I. N., Lesjak M. M., Jovin D., Balog K. J., Anackov G. T., Orcic D. Z.,
Mimica-Dukic N. M. (2009). Plantain (plantago L.) species as novel sources of
flavonoid antioxidants. Journal of Agricultural and Food Chemistry, 57, 9268-9273
Binutu O. A., Cordell G. A. (2000). Gallic acid derivatives from mezoneuron
benthamianum. Pharmaceutical Biology, 38, 284-286
Blois, M.S., (1958). Antioxidant determinations by use of a stable free radical.
Nature, 181, 1199-1200
Cakilcioglu U., Khatun S., Turkoglu I., Hayta S. (2011). Ethnopharmacological
survey of medicinal plants in Maden (Elazig-Turkey). Journal of
Ethnopharmacology, 1-18
Chang CC., Yang MH., Wen HM., Chern JC. (2002). Estimation of total
flavonoid content in propolis by two complementary colorimetric methods. Journal
of Food and Drug Analysis, 10, 178-182
Ciocan I. D., Bara I. I. (2007). Plant products as antimicrobial agents. Secţiunea
Genetică şi Biologie Moleculară, 151-156
Çoruh N., Celep A. G. S., Özgökçe F. (2007). Antioxidant properties of prangos
ferulacea (L.) Lindl., chaerophyllum macropodum boiss. and heracleum persicum
desf. from apiaceae family used as food in Eastern Anatolia and their inhibitory
effects on glutathione-S-transferase. Food Chemistryt, 100, 1237-1242
79
Cowan M. M. (1999). Plant products as antimicrobial agents. Clinical Microbiology
reviews, 12, 564-582
Croft K. D. (1998).The Chemistry and biological effects of flavonoids and phenolic
acidsAnn. N. Y. Acad. Sci, 854, 435-442
Cushnie T. P. T., Lamb A. J. (2005). Antimicrobial activity of flavonoids.
International Journal of Antimicrobial Agents, 26, 343-356
Dewanto V., Wu X., Adom K. K., Liu R. H. (2002). Thermal processing enhances
the nutritional value of tomatoes by increasing total antioxidant activity. Journal of
Agricultural and Food Chemistry, 50, 3010-3014
Duffy CF, Power RF. (2001). Antioxidant and antimicrobial properties of some
Chinese plants extracts; Int J of Antimicrob Agents, 17, 527-529
Ezer N., Arisan Ö. M. (2006). Folk medicines in Merzifon (Amasya, Turkey).
Tübitak, 30, 223-230
Favier A.E., Cadet J., Kalyanaraman B., Fontecave M., Pierre J. L. (1995)
Analysis of free radicals in biological systems , 1st Edition.; Birkhäuser Verlag,
Basel-Boston Berlin,42
Flores R.G., Calderon C.L., Scheibel L.W., Guerra P.T., Padilla C.R., Guerra
R.T., Weber R.J. (2000) Immunoenhancing properties of Plantago major leaf
extract. Phytotheropy Research, 14: 617–622.
Forbes A. B., Sahm F. D., Weissfeld A. S. (2007). Diagnostic Microbiology, 12th
Edition,Bailey&Scott’s, Missouri,265-350)
Fraga C. G. (2010). Plant phenolics and human healt: Biochemistry, Nutrition, and
Pharmacology, John Wiley & Sons, Inc., Canada, 2-10
80
French G. H. (2006). Bactericidal agents in the treatment of MRSA infections—the
potential role of daptomycin, Journal of Antimicrobial Chemotherapy, 58, 1107–111
Gan RY., Kuang L., Xu XR., Zhang Y., Xia EQ., Song FL. (2010). Screening of
natural antioxidants from traditional chinese medicinal plants associated with
treatment of rheumatic disease. Molecules, 15, 5988-5997
Garewal S. H. (1997). Antioxidant and Disease Prevention,1st Edition;CRC Press,
New York, 38
Gatto M. T., Falcocchio S., Grippa E., Mazzanti G., Battinelli L., Nicolosi G.,
Lambusta D., Saso L. (2001). Antimicrobial and anti-lipase activity of quercetin
and its C2-C16 3-O-acyl-esters. Bioorganic & Medicinal Chemistry, 10, 269-272
Gerdan O. F., (2010) Antioxidant and antimicrobial activities of dietary plants
against group A B-Haemolytic streptococci, M.Sc Thesis. Middle East Technical
University., Turkey.
Genç G. E., Özhayat N. (2006). An ethnobotanical study in Çatalca (European part
of Istanbul) II. Turkish Journal Pharmaceutical Sciences, 3 (2), 73-89
Grune T. (2005). Oxidant and Antioxidant Defense System; Springer, Berlin, 2nd
Edition, 35
Harborne J. B., Williams C. A. (2000). Advances in flavonoid research since 1992.
Phytochemistry, 55, 481-504
Henis Y., Tagari H., Volcani R. (1963). Effect of water extracts of carob pods,
tannic acid, and their derivatives on the morphology and growth of microorganisms.
American Society for Microbiology, 12 (3), 204-209
81
Holetz F. B., Pessini G. L., Sanches N. R., Cortez A. G., Nakamura C. V., Filho
B. P. D. (2002). Screening of some plants used in the brazilian folk medicine for the
treatment of infectious diseases. Mem Inst Oswaldo Cruz, 97, 1-5
Huang D., Ou B., Prior R. L. (2005). The Chemistry behind Antioxidant Capacity
Assays. Journal of Agricultural and Food Chemistry, 53, 1841-1856
Kajiya K., Hojo H., Suzuki M., Nanjo F., Kumazawa S., Nakayama T. (2004).
Relationship between antibacterial activity of (+)-catechin derivatives and their
interaction with a model membrane. Journal of Agricultural and Food Chemistry,
52, 1514-1519
Kargıoğlu M., Cenkci S., Serteser A., Konuk M., Vural G. (2010).Traditional
uses of wild plants in the middle aegean region of turkey. Springer Science+Business
Media, 38, 429-450
Kawashty S.A., Gamal-El-Din E., Abdalla M.F., Saleh N.A.M. (1994) Flavonoids
of Plantago species in Egypt. Biochemical Systematic and Ecology , 22, 729– 733.
Koçyiğit M., Özhayat N. (2006). Wild plants used as medicinal purpose in Yalova
(Northwest Turkey). Turkish Journal Pharmaceutical Sciences, 3 (2), 91-103
Kumarasamy Y., Byres M., Cox P. J., Jaspars M., Nahar L., Sarker S. D.
(2007). Screening seeds of some scottish plants for free radical scavenging activity.
Wiley InterScience, 21, 615-621
Kültür Ş. (2007). Medicinal plants used in Kırklareli Province (Turkey). Journal of
Ethnopharmacology, 111, 341-364
Kümbet Y. (2010). Investigation of antioxidant activities of fruit juices and herbal
teas and their antimicrobial effects on proteus mirabilis, M.Sc Thesis. Middle East
Technical University., Turkey.
82
Lezama R. V., Aguilar R. T., Ramos R. R., Avila E. V., Guti´errez Ma. S. P.
(2006). Effect of Plantago major on cell proliferation in vitro. Journal of
Ethnopharmacology, 103, 36-42
Littleton J., Rogers T., Falcone D. (2005). Novel approaches to plant drug
discovery based on high throughput pharmacological screening and genetic
manipulation. Life Sciences, 78, 467–475
Liu R. H. (2003). Health benefits of fruit and vegetables are from additive and
synergistic combinations of phytochemicals. American Journal Clinical Nutrition,
78, 517s-520s
Liu R. H. (2004). Potential synergy of phytochemicals in cancer prevention:
mechanism of action. American Society for Nutritional Sciences, 3479-3484
Mates J. M., Gomez C. P., Castro I. N. (1999). Antioxidant enzymes and human
diseases. Clinical Biochemistry, 32 (8), 595–603
Molyneux P. (2004). The use of the stable free radical diphenylpicrylhydrazyl
(DPPH) for estimating antioxidant activity, J. Sci. Technol, 26, 211-219.
Naczk M., Shahidi F. (2004). Extraction and analysis of phenolics in food. Journal
of Chromatography A, 1054, 95–111
Nathan C.F., Hibbs J.B.Jr. (1991) Role of nitric oxide synthesis in macrophage
antimicrobial activity. Curr op Immunol 3: 665–670.
Nebigil C. (2011) Characterization of antioxidant and antimicrobial isolates from
Quercus brantii L. extract, M.Sc Thesis. Middle East Technical University., Turkey.
Özgen U., Kaya Y., Coşkun M. (2004). Ethnobotancal studies in the villages of the
district of Ilıca (province Erzurum), Turkey. Economic Botany, 58 (4), 691-696
83
Öztürk F., Ölçücü C. (2011). Ethnobotanical features of some plants in the district
of Şemdinli (Hakkari-Turkey). International Journal of Academic Reserch, 3 (1),
117-121
Pala F. S., Tabakçıoğlu K. (2007). Free radicals: Our enemies or friends?. Advances
in Molecular Biology, 1, 63-69
Pannala A. S., Chan T. S., O’Brien P. J., Rice-Evans C. A. (2001). Flavonoid B-
Ring Chemistry and Antioxidant Activity: Fast Reaction Kinetics. Biochemical and
Biophysical Research Communications, 282, 1161-1168
Pourmorad F., Hosseinimehr S. J., Shahabimajd N. (2006).Antioxidant activity,
phenol and flavonoid contents of some selected Iranian medicinal plants. African
Journal of Biotechnology, 5 (11), 1142-1145
Rauha J., Remes S., Heinonen M., Hopia A., Kahkonen M., Kujala T., Pihlaja
K., Vuorela H., Vuorela P. (2000). Antimicrobial effects of Finnish plant extracts
containing flavonoids and other phenolic compounds. International Journal of Food
Microbiology, 56, 3–12
Ravn H., Brimer L. (1988). Structure and antibacterial activity of plantamajoside, a
caffeic acid sugar ester from plantago major subsp. major. Phytochemtstry, 27 (11),
3433-3437
Re R., Pellegrini N., proteggente A., Yang M, Rice- Evans C. (1998). Antioxidant
activity appliying an improved ABTS radical cation decolorization assay. Free
Radical Biology &Medicine, 26:1231-1237
Richer A. C., Milbury P. E. (2008) Understanding the Antioxidant Controversery,
1st Edition; Praeger,Westport Conneticut London,38
84
Prior, L. P., Wu X.., Schaich K.. (2005). Standardized methods for the
determination of antioxidant capacity and phenolic in foods and dietary supplements,
Agricultural Food Chemistry, 76,245-256
Sagar G. R., Harper J. L. (1964). Biological flora of the british isles: plantago
major L., P. media L. and P. lanceolata L.. Journal of Ecology,52(1),189-221
Samuelson A. B. (2000). The traditional uses, chemical constituents and biological
activities of Plantago major L. A review, Journal of Ethnopharmacology, 71, 1-21
Sarper F., Akaydin G., Şimşek I., Yeşilada E. (2009). An ethnobotanical field
survey in the haymana district of Ankara province in Turkey. Tübitak, 33, 79-88
Schwalbe R., Moore L., Goodwin A. C. (2007) Antimicrobial Susceptibility
Testing Protocols, Taylor&Francis Group., New York, 79
Schwarz K., Bertelsen G., Nissen L. R., Gardner P. T., Heinonen M. I., Hopia
A., Huynh-Ba T., Lambelet P., McPhail D., Skibsted L. H., Tijburg L. (2001).
Investigation of plant extracts for the protection of processed foods against lipid
oxidation. Comparison of antioxidant assays based on radical scavenging, lipid
oxidation and analysis of the principal antioxidant compounds. European Food
Research and Technology, 212, 319-328
Serag, M.M.S., Amina Z. A., Mahitab M.A. (2010) Ecological study on Plantago
major l. ın the different habitats of Damietta, J. Plant Production, Mansoura
University, 1 (7): 1007-1031
Sen S., Chakraborty R., Sridhar C., Reddy Y. S. R., De B. (2010). Free radicals,
antioxidants, diseases and phytomedicines: current status and future prospect.
International Journal of Pharmaceutical Sciences Review and Research, 3, 91-97
85
Sezik E., Yeşilada E., Tabata M., Honda G., Takaishi Y., Fujita T., Tanaka T.,
Takeda Y. (1997). Traditional medicine in Turkey VIII. folk medicine in east
Anatolia; Erzurum, Erzincan, Ağrı, Kars, Iğdır provinces. Economic Botany, 51 (3),
195-211
Shimoi K., Okada H., Furugori M., Goda T., Takase S., Suzuki M., Hara Y.,
Yamamoto H., Kinae N. (1998) Intestinal absorption of luteolin and luteolin 7-O-b-
glucoside in rats and humans. FEBS Lett. 438, 220–224.
Sharifa A.A., Neoh Y. L., Iswadi M. I., Khairul O., Abdul Halim M., Jamaludin
M., Mohamed Azman A.B., Hing H. L. (2008). Effects of methanol, ethanol and
aqueous extract of plantago major on gram positive bacteria, gram negative bacteria
and yeast. Annals of Microscopy, 8, 42-4
Singelton P. (2004) Bacteria in Biology Biotechnology and Medicine, 6th Edition.;
John Wiley &Songs, Ltd., USA, 470
Singleton, V. L., Rossi, J. A. (1965). Colorimetry of total phenolics with
phosphomolybdic phosphotungstic acid reagents. American Journal of Enology and
Viticulture, 16, 144-158
Speisky H., Rocco C., Carrasco C., Lissi E. A., Alarcon C. L. (2006). Antioxidant
screening of medicinal herbal teas. Phytotherapy Research, 20, 462-467
Stanisavljevic I. T., Stojicevic S. S., Velickovic D. T., Lazic M. L., Veljkovic V.
B. (2008). Screening the antioxidant and antimicrobial properties of the extracts from
plantain (Plantago Major L.) leaves. Separation Science and Technology, 43, 3652–
3662
Than A., Myint M.M.S., Myint W., Myint T., Hlaing S.S. (1996) The anti-
ulcerogenic acticity of Plantago major L. Myanmar Health sciences Research
Journal, 8: 74–77
86
Toksoy D., Bayramoglu M., Hacisalihoglu S. (2010). Usage and the economic
potential of the medicinal plants in Eastern Black Sea Region of Turkey. Journal of
Environmental Biology, 31 (5), 623-628
Tuzlacı E., Tolon E. (2000). Turkish folk medicinal plants, part III: Şile (Istanbul).
Fitoterapia, 71, 673-685
Uppu R.M., Murthy S.N., Pryor W.A., Parinandi N.L. (2010). Free Radicals and
Antioxidant protocols, 2nd
Edition.; Humana Press, UK, 3-5
Valko M., Leibfritz D., Moncol J., Cronin M. T. D., Mazur M., Telser J. (2006).
Free radicals and antioxidants in normal physiological functions and human disease.
International Journal of Biochemistry and Cell Biology,45-78
Valko M., Rhodes C. J., Moncol J., Izakovic M., Mazur M. (2006). Free radicals,
metals and antioxidants in oxidative stress-induced cancer. Chemico-Biological
Interactions, 160, 1–40
Villano D., Pachon F. M. S., Toroncoso A. M, Parrilla M. C. G. (2004). The
antioxidant activity of wines determined by the ABTS method: influence of sample
dilution and time. Talanta, 64, 501-509
Yesilada E., Sezik E., Fujita T., Tanaka S., Tabata M. (1993) Screening of some
Turkish medicinal plants for their antiulcerogenic activities. Phytotherapy Research,
7: 263–265.
Yokozawa T., Dong E., Liu Z.W., Shimizu M. (1997) Antioxidant activity of
flavonols In vitro. Phytotherapy Research, 11: 446–449.
Wiegand I., Hilpert K., Hancock R.E.W. (2008). Agar and broth dilution methods
to determine the minimal inhibitory concentration (MIC) of antimicrobial
substances; Nature Protocols, 3, 163 - 175.
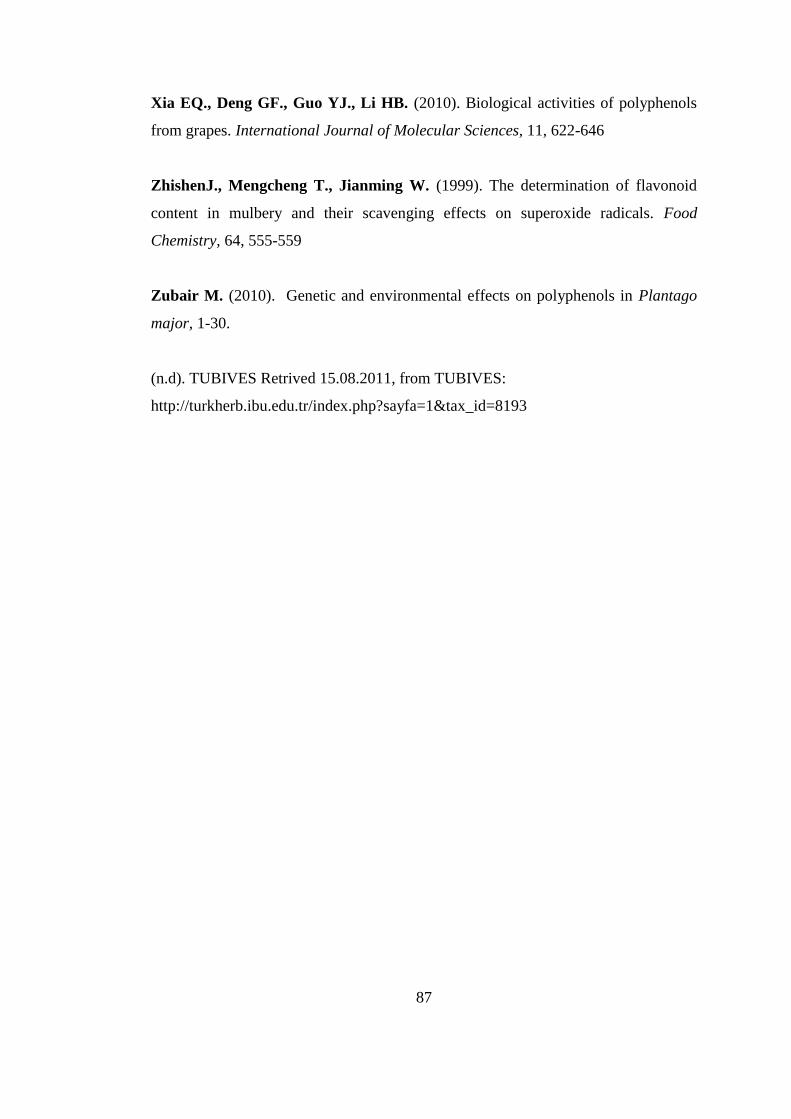
87
Xia EQ., Deng GF., Guo YJ., Li HB. (2010). Biological activities of polyphenols
from grapes. International Journal of Molecular Sciences, 11, 622-646
ZhishenJ., Mengcheng T., Jianming W. (1999). The determination of flavonoid
content in mulbery and their scavenging effects on superoxide radicals. Food
Chemistry, 64, 555-559
Zubair M. (2010). Genetic and environmental effects on polyphenols in Plantago
major, 1-30.
(n.d). TUBIVES Retrived 15.08.2011, from TUBIVES:
http://turkherb.ibu.edu.tr/index.php?sayfa=1&tax_id=8193
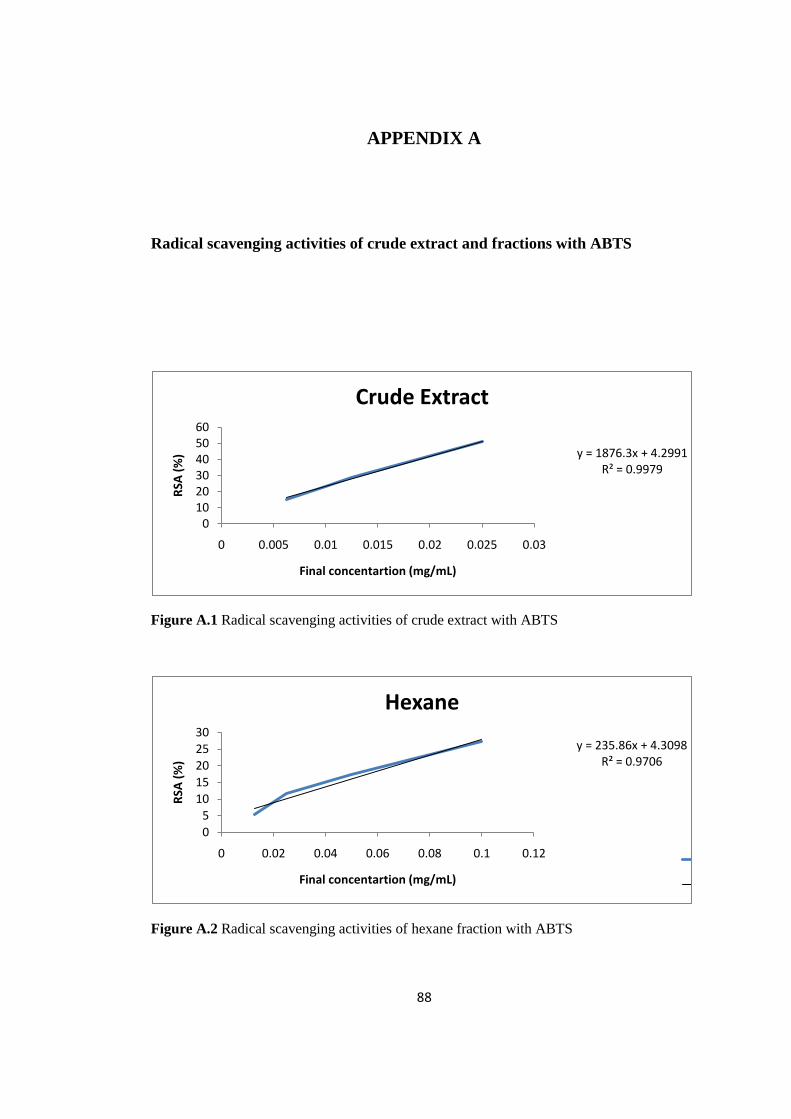
88
APPENDIX A
Radical scavenging activities of crude extract and fractions with ABTS
Figure A.1 Radical scavenging activities of crude extract with ABTS
Figure A.2 Radical scavenging activities of hexane fraction with ABTS
y = 1876.3x + 4.2991R² = 0.9979
0102030405060
0 0.005 0.01 0.015 0.02 0.025 0.03
RSA
(%
)
Final concentartion (mg/mL)
Crude Extract
y = 235.86x + 4.3098R² = 0.9706
0
5
10
15
20
25
30
0 0.02 0.04 0.06 0.08 0.1 0.12
RSA
(%
)
Final concentartion (mg/mL)
Hexane
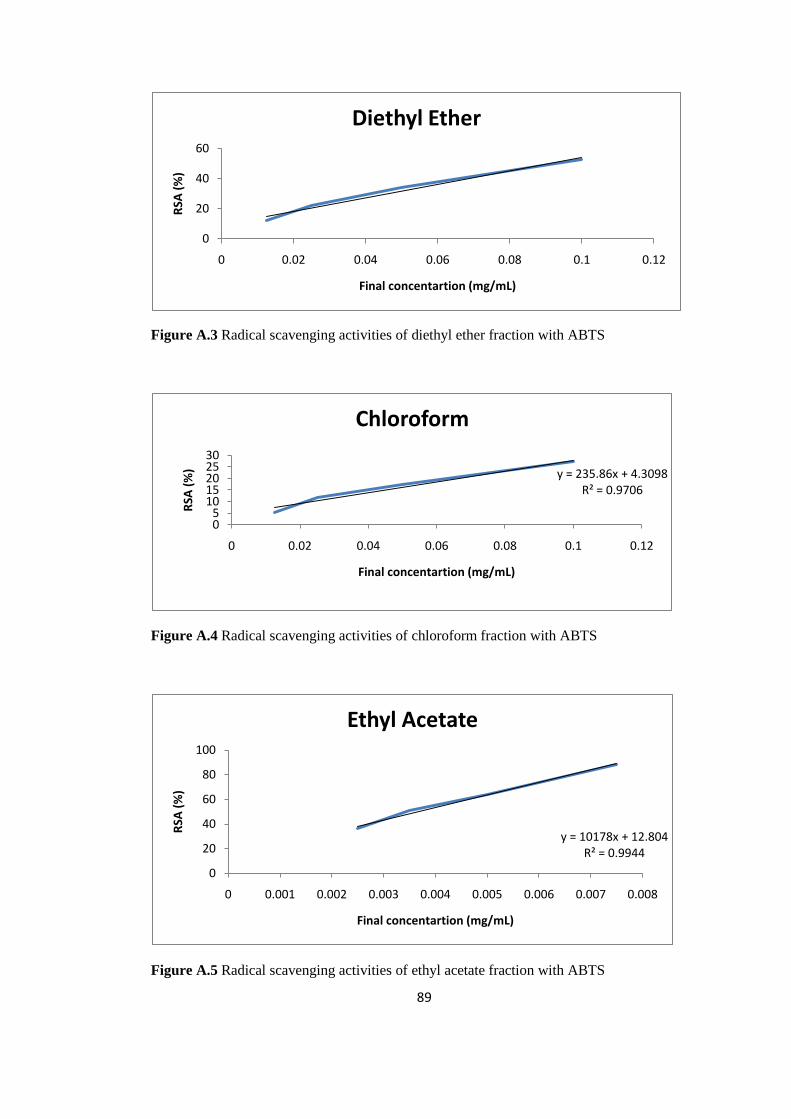
89
Figure A.3 Radical scavenging activities of diethyl ether fraction with ABTS
Figure A.4 Radical scavenging activities of chloroform fraction with ABTS
Figure A.5 Radical scavenging activities of ethyl acetate fraction with ABTS
0
20
40
60
0 0.02 0.04 0.06 0.08 0.1 0.12
RSA
(%
)
Final concentartion (mg/mL)
Diethyl Ether
y = 235.86x + 4.3098R² = 0.9706
05
1015202530
0 0.02 0.04 0.06 0.08 0.1 0.12
RSA
(%
)
Final concentartion (mg/mL)
Chloroform
y = 10178x + 12.804R² = 0.9944
0
20
40
60
80
100
0 0.001 0.002 0.003 0.004 0.005 0.006 0.007 0.008
RSA
(%
)
Final concentartion (mg/mL)
Ethyl Acetate
90
Figure A.6 Radical scavenging activities of aqueous phase with ABTS
y = 1295.7x + 2.8547R² = 0.9884
0
10
20
30
40
50
60
0 0.005 0.01 0.015 0.02 0.025 0.03 0.035 0.04 0.045
RSA
(%
)
Final concentration (mg/mL)
Aqueous
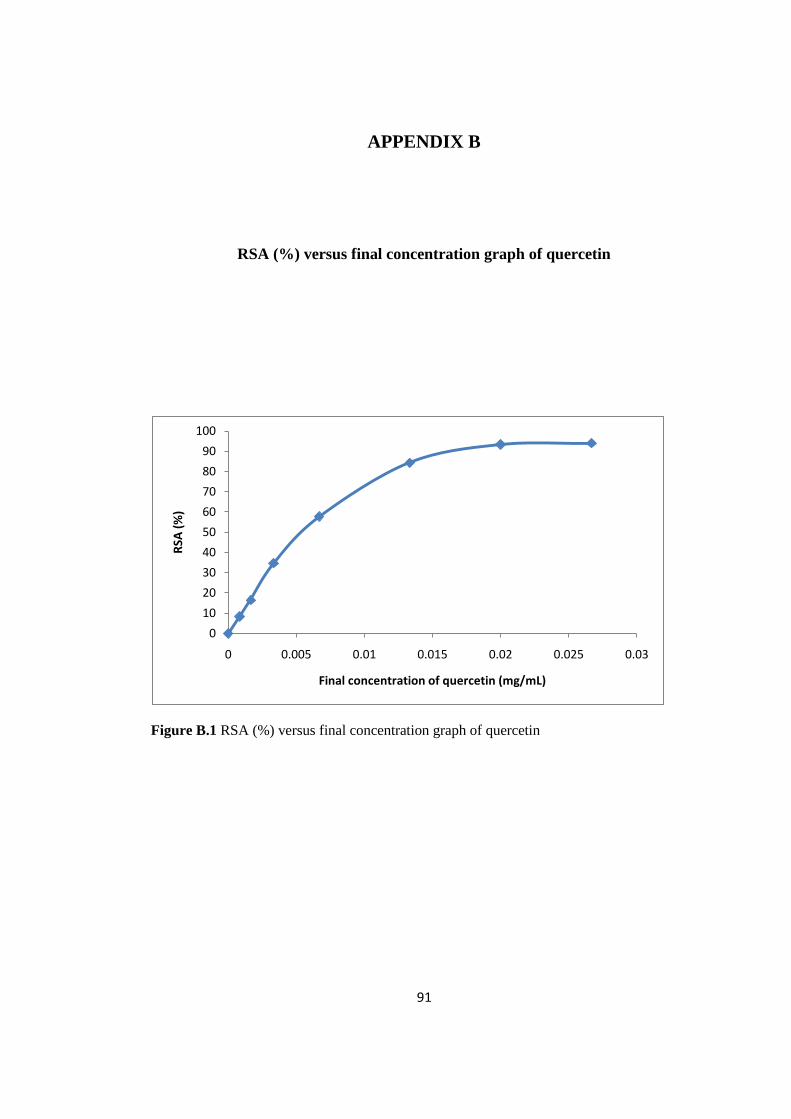
91
APPENDIX B
RSA (%) versus final concentration graph of quercetin
Figure B.1 RSA (%) versus final concentration graph of quercetin
0
10
20
30
40
50
60
70
80
90
100
0 0.005 0.01 0.015 0.02 0.025 0.03
RSA
(%
)
Final concentration of quercetin (mg/mL)
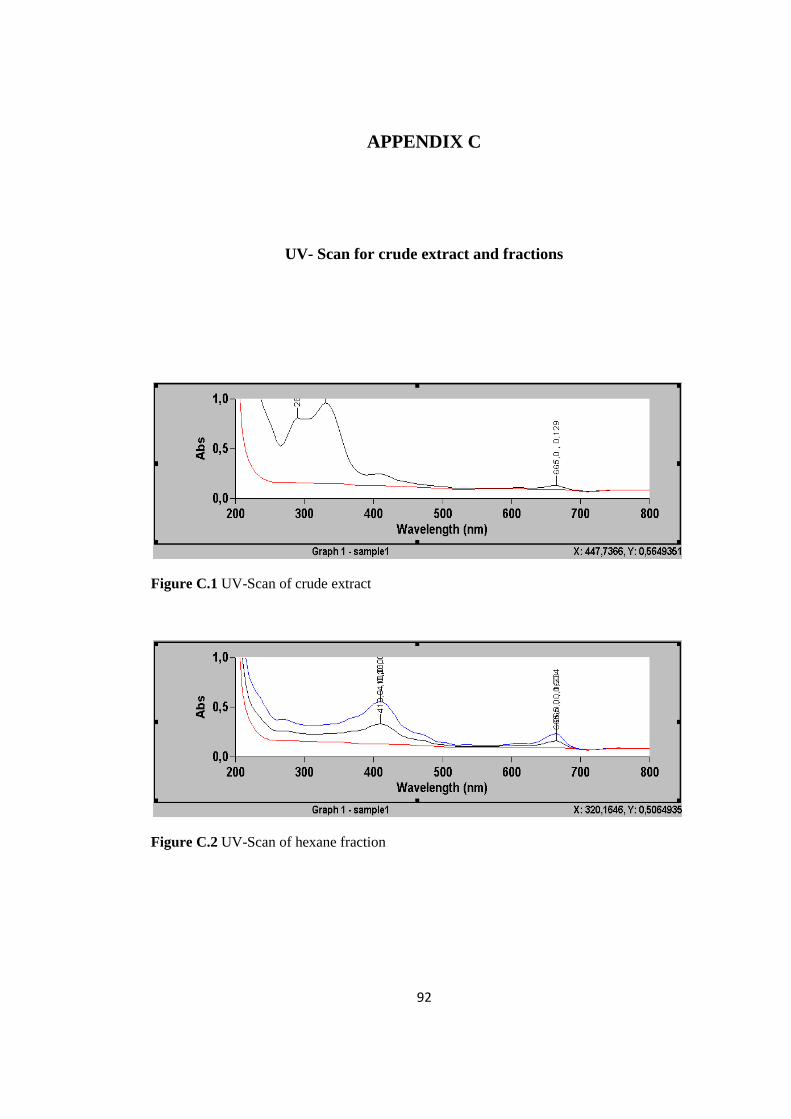
92
APPENDIX C
UV- Scan for crude extract and fractions
Figure C.1 UV-Scan of crude extract
Figure C.2 UV-Scan of hexane fraction
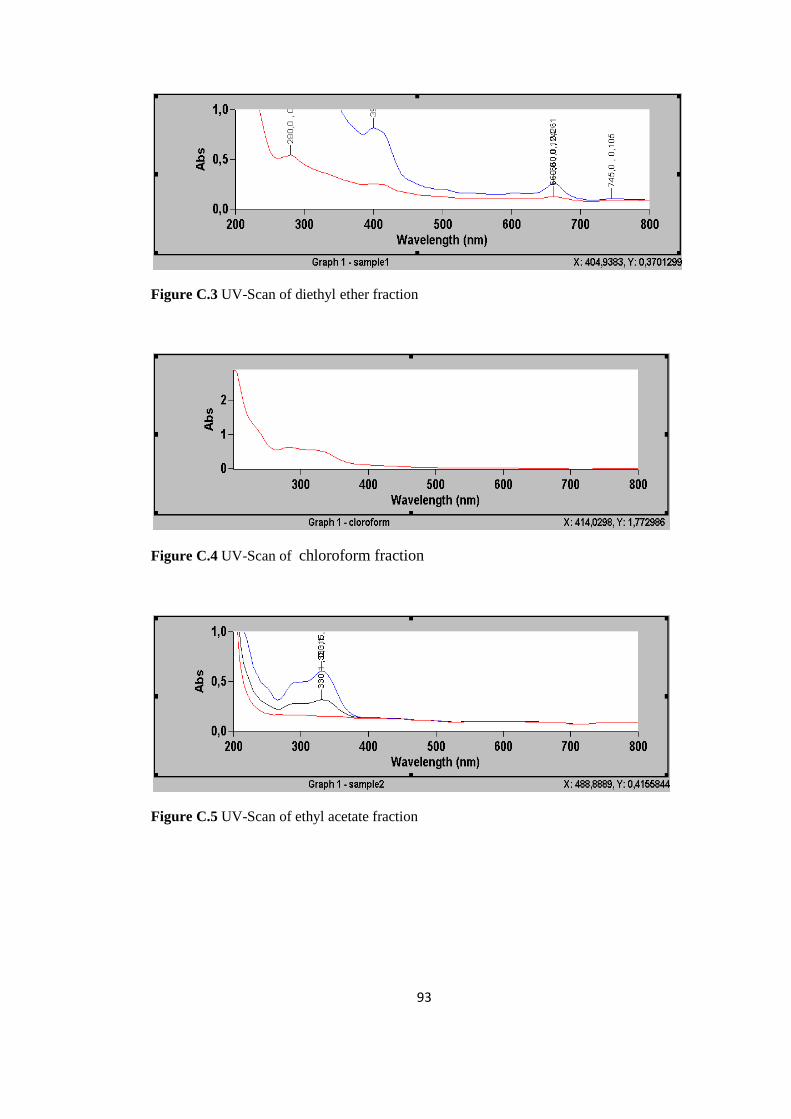
93
Figure C.3 UV-Scan of diethyl ether fraction
Figure C.4 UV-Scan of chloroform fraction
Figure C.5 UV-Scan of ethyl acetate fraction
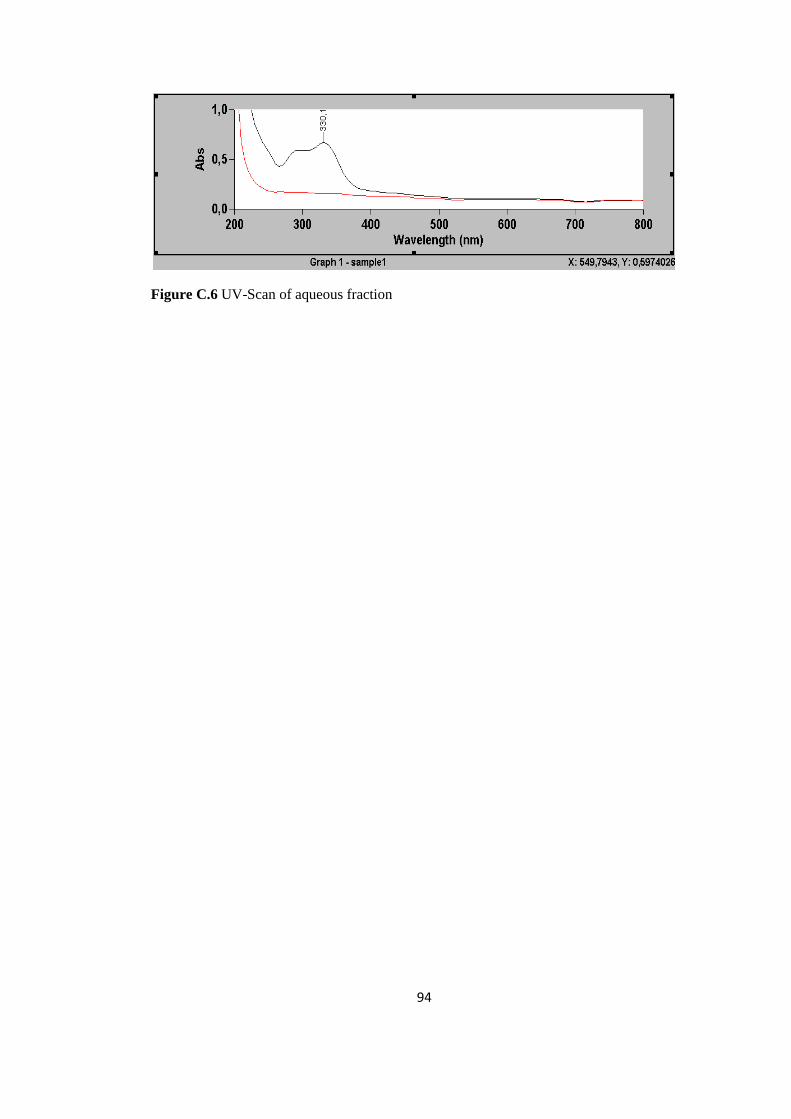
94
Figure C.6 UV-Scan of aqueous fraction
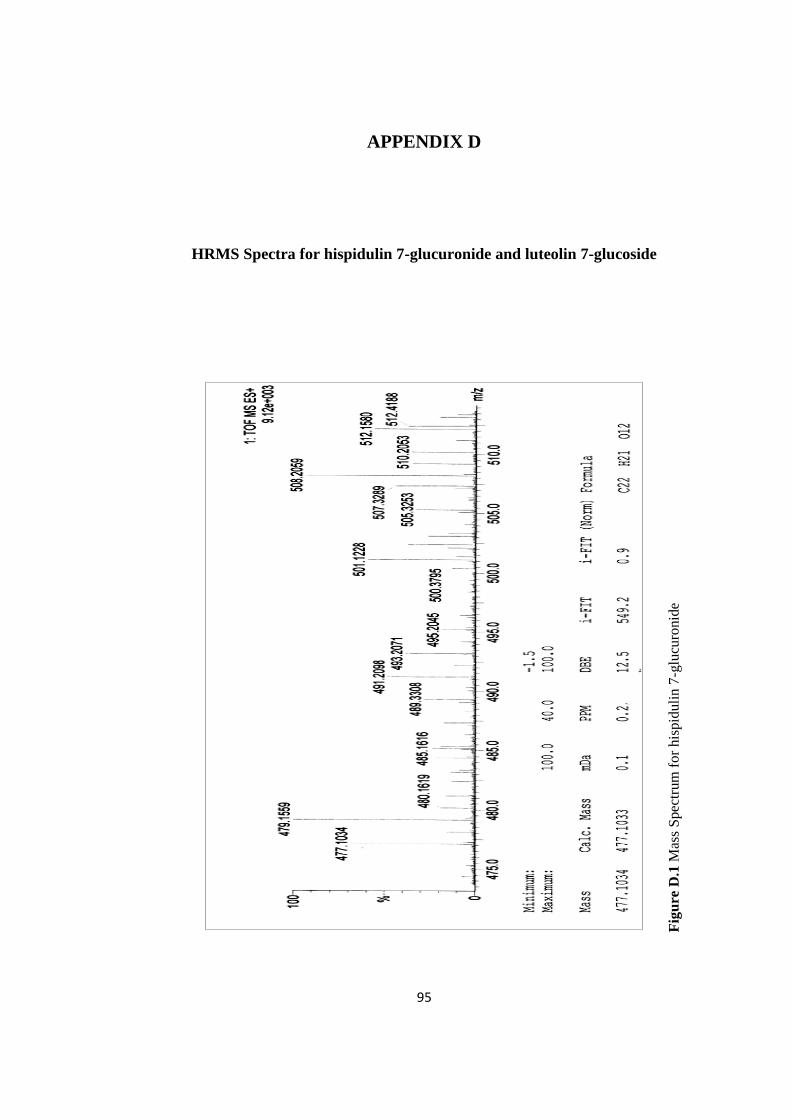
95
APPENDIX D
HRMS Spectra for hispidulin 7-glucuronide and luteolin 7-glucoside
Fig
ure
D.1
Mas
s S
pec
trum
for
his
pid
uli
n 7
-glu
curo
nid
e
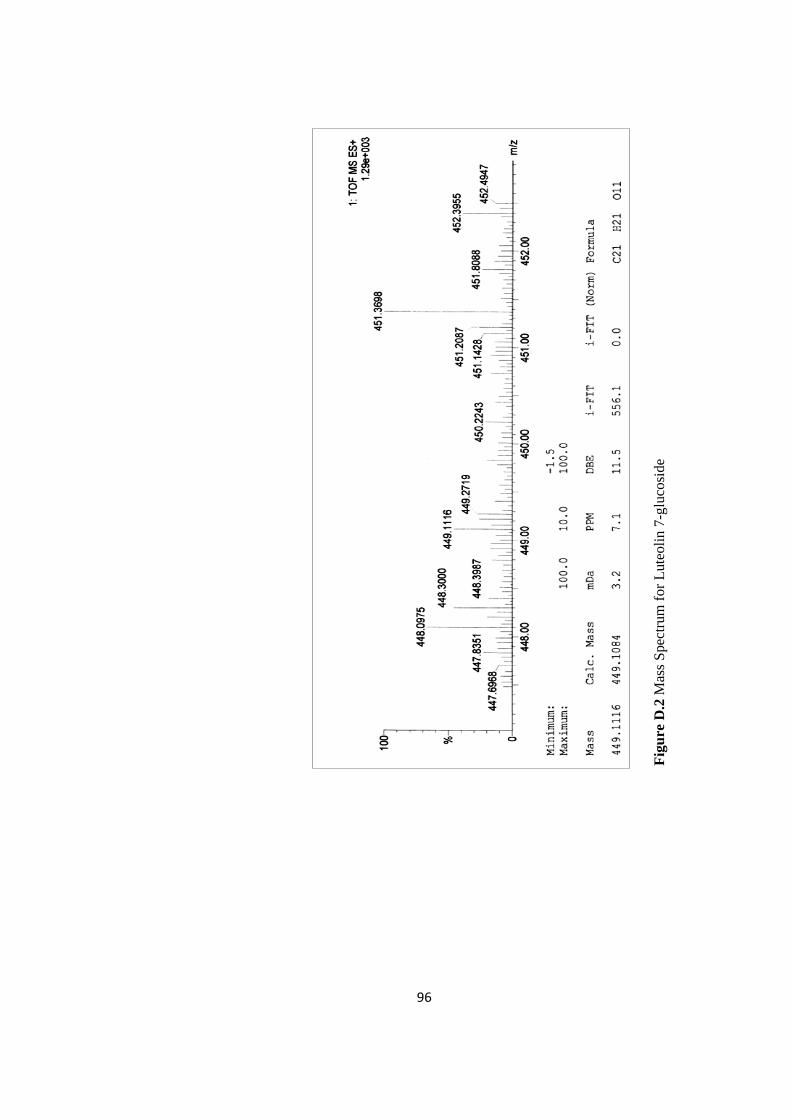
96
Fig
ure
D.2
Mas
s S
pec
trum
for
Lute
oli
n 7
-glu
cosi
de
Recommended


![Diganta Kalita Post Doctoral Research Associate San Luis ......Antioxidant activity DPPH DPPH radical-scavenging activity (%) = [( A control – A sample/A control)] ×100 where A](https://img.pdfslide.us/doc/110x75/603df06de0318729fc0081c9/diganta-kalita-post-doctoral-research-associate-san-luis-antioxidant-activity.jpg)