Introduction to bibliometrics
Gunnar Sivertsen
Nordic Institute for Studies in Innovation,
Research and Education, Oslo
0
200 000
400 000
600 000
800 000
1 000 000
1 200 000
1 400 000
1 600 000
World production in Web of Science 1980-2013
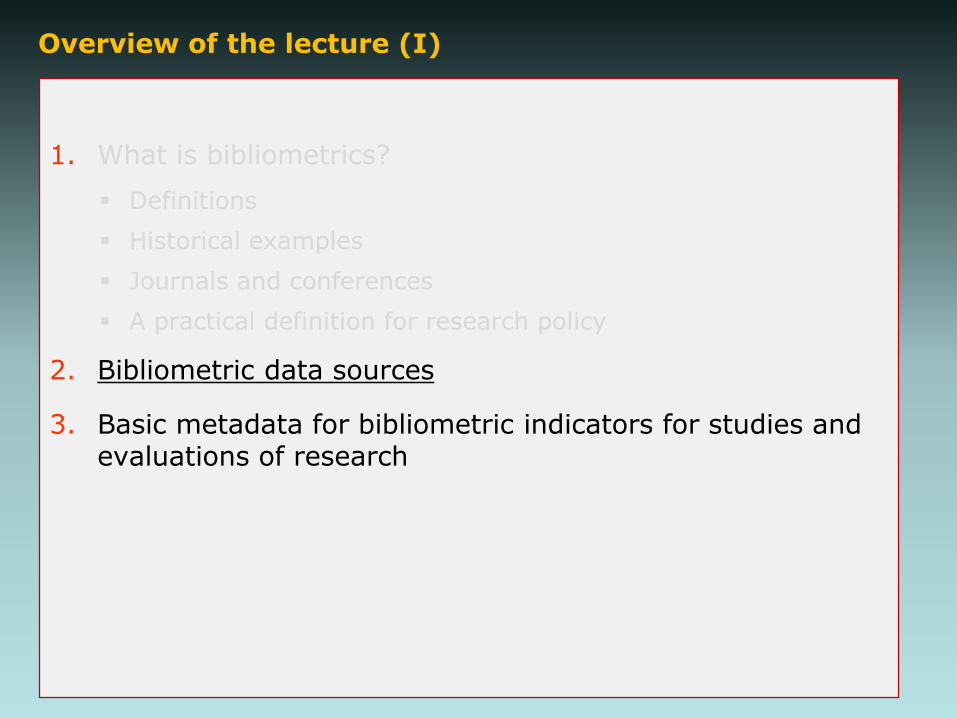
Overview of the lecture (I)
1. What is bibliometrics?
Definitions
Historical examples
Journals and conferences
A practical definition for research policy
2. Bibliometric data sources
3. Basic metadata for bibliometric indicators for studies and evaluations of research
Overview of the lecture (II)
1. Four useful types of indicators
Research activity
Research profile
Research collaboration
Impact on further research
2. Discussion I: Bibliometrics in the social sciences and humanities
3. Discussion II: Bibliometrics for research assessment
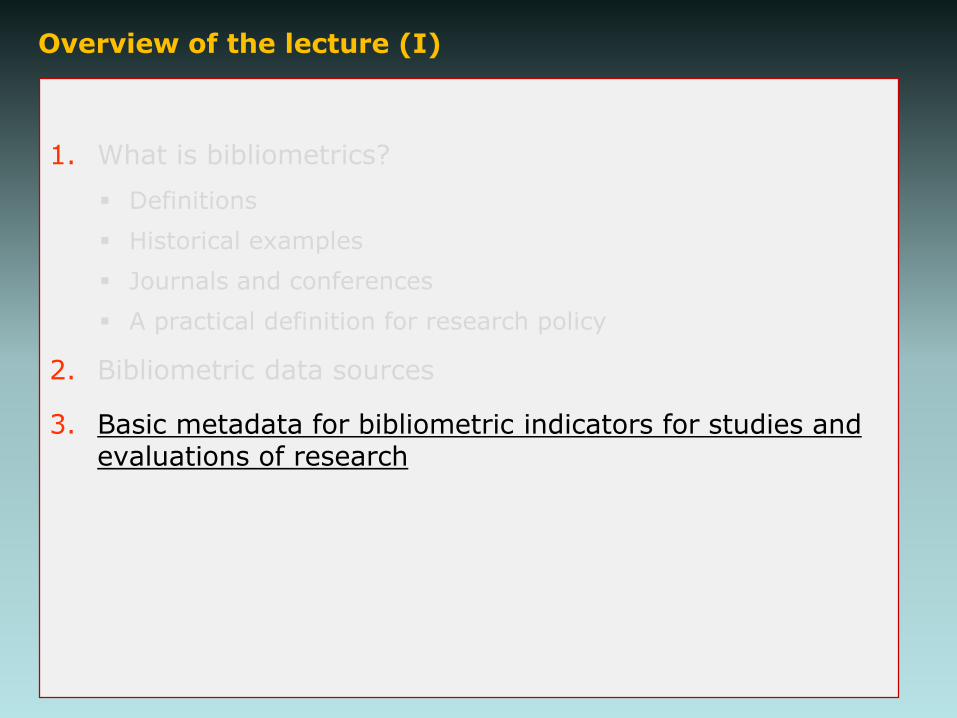
Overview of the lecture (I)
1. What is bibliometrics?
Definitions
Historical examples
Journals and conferences
A practical definition for research policy
2. Bibliometric data sources
3. Basic metadata for bibliometric indicators for studies and evaluations of research
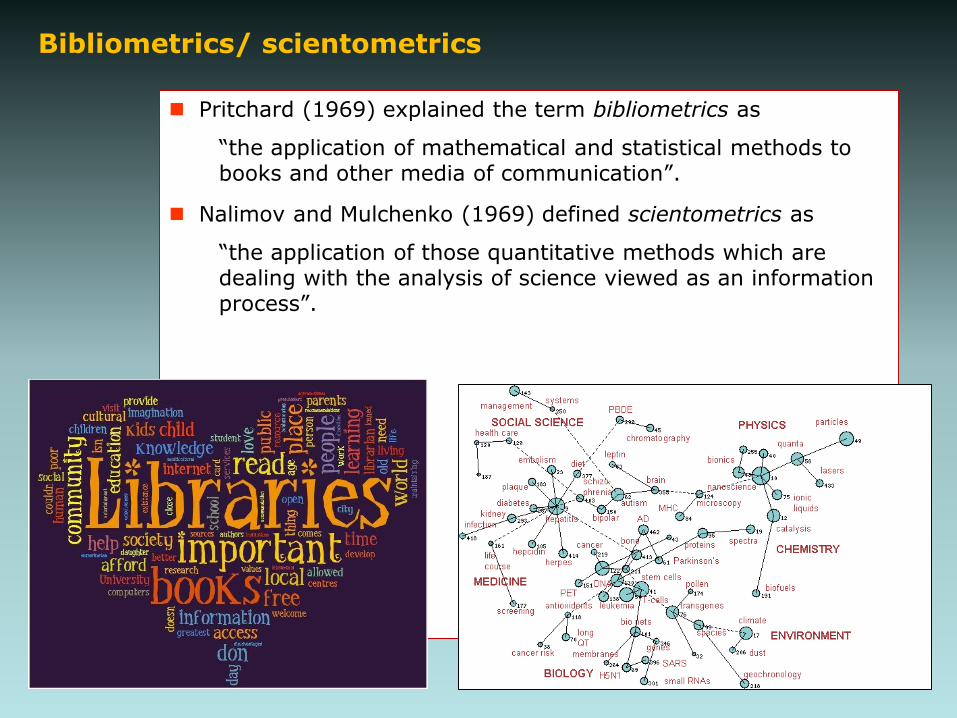
Bibliometrics/ scientometrics
Pritchard (1969) explained the term bibliometrics as
“the application of mathematical and statistical methods to books and other media of communication”.
Nalimov and Mulchenko (1969) defined scientometrics as
“the application of those quantitative methods which are dealing with the analysis of science viewed as an information process”.
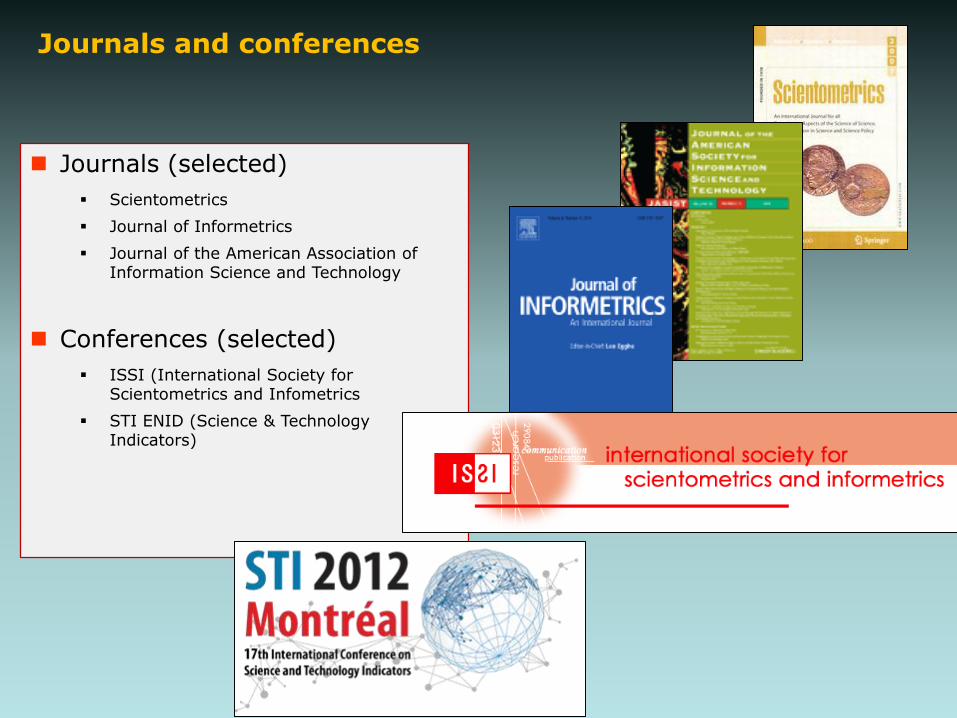
Journals and conferences
Journals (selected)
Scientometrics
Journal of Informetrics
Journal of the American Association of Information Science and Technology
Conferences (selected)
ISSI (International Society for Scientometrics and Infometrics
STI ENID (Science & Technology Indicators)
Historical examplesof results within – or contributions from - bibliometrics
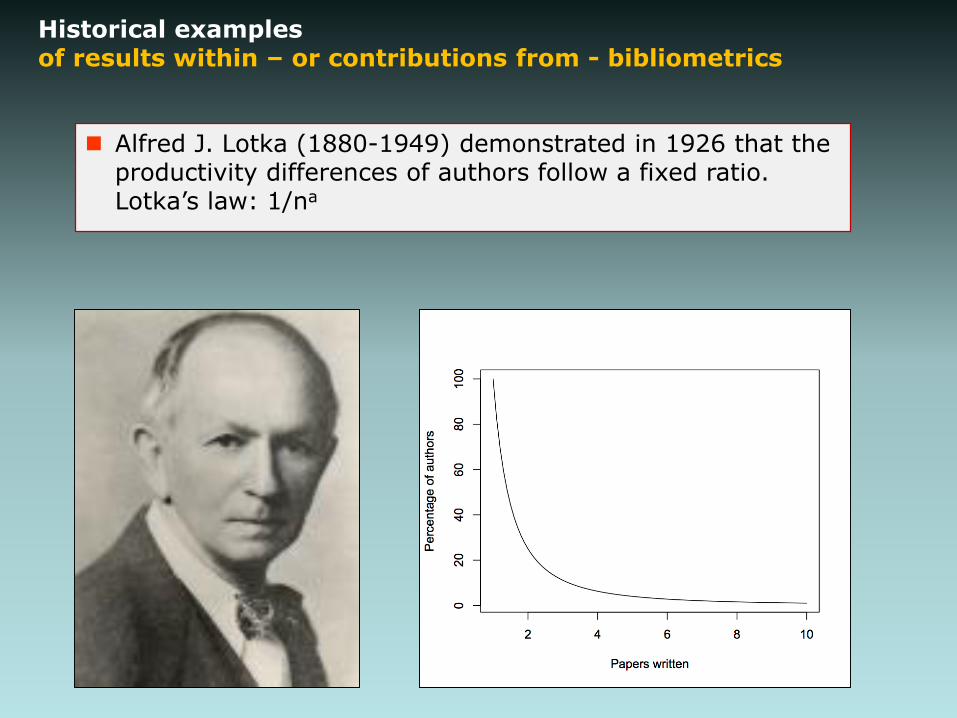
Alfred J. Lotka (1880-1949) demonstrated in 1926 that the productivity differences of authors follow a fixed ratio. Lotka’s law: 1/na
Historical examplesof results within – or contributions from - bibliometrics
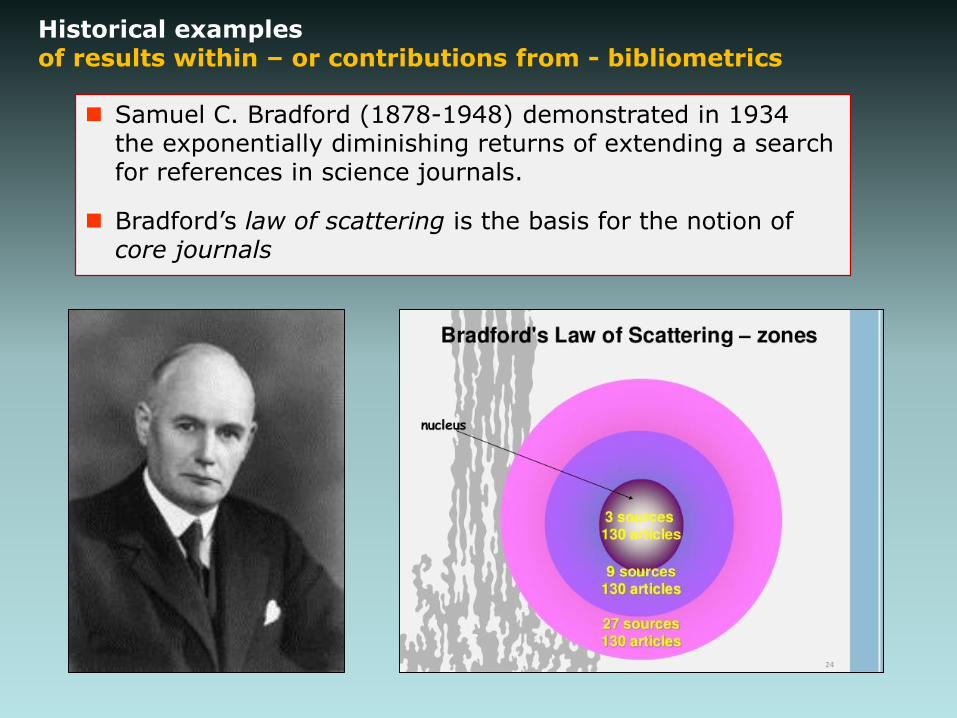
Samuel C. Bradford (1878-1948) demonstrated in 1934 the exponentially diminishing returns of extending a search for references in science journals.
Bradford’s law of scattering is the basis for the notion of core journals
Historical examplesof results within – or contributions from - bibliometrics
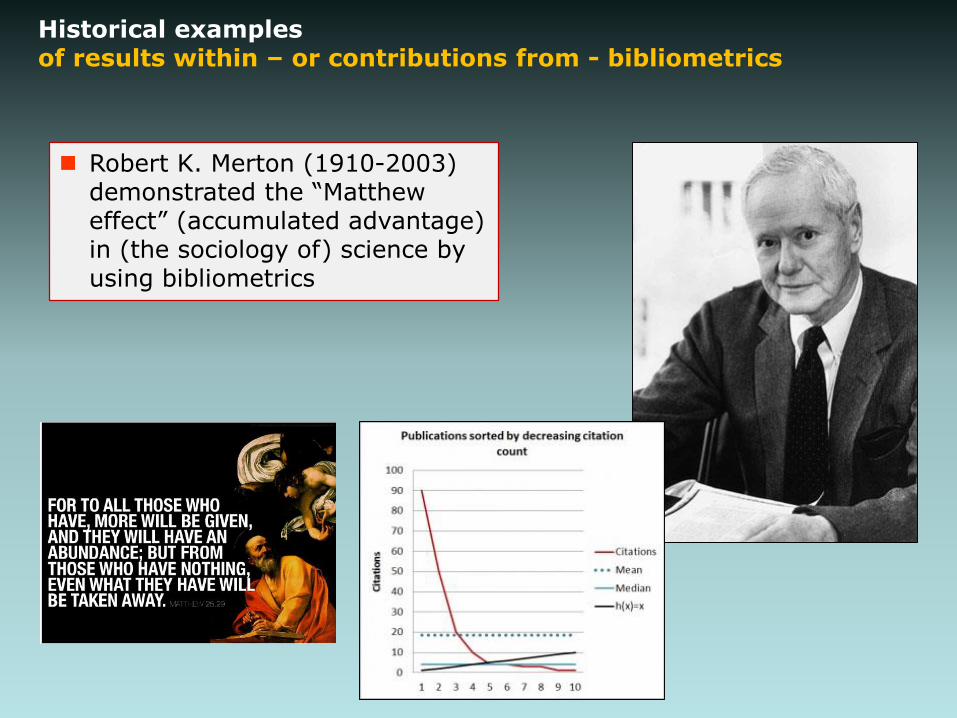
Robert K. Merton (1910-2003) demonstrated the “Matthew effect” (accumulated advantage) in (the sociology of) science by using bibliometrics
Historical examplesof results within – or contributions from - bibliometrics
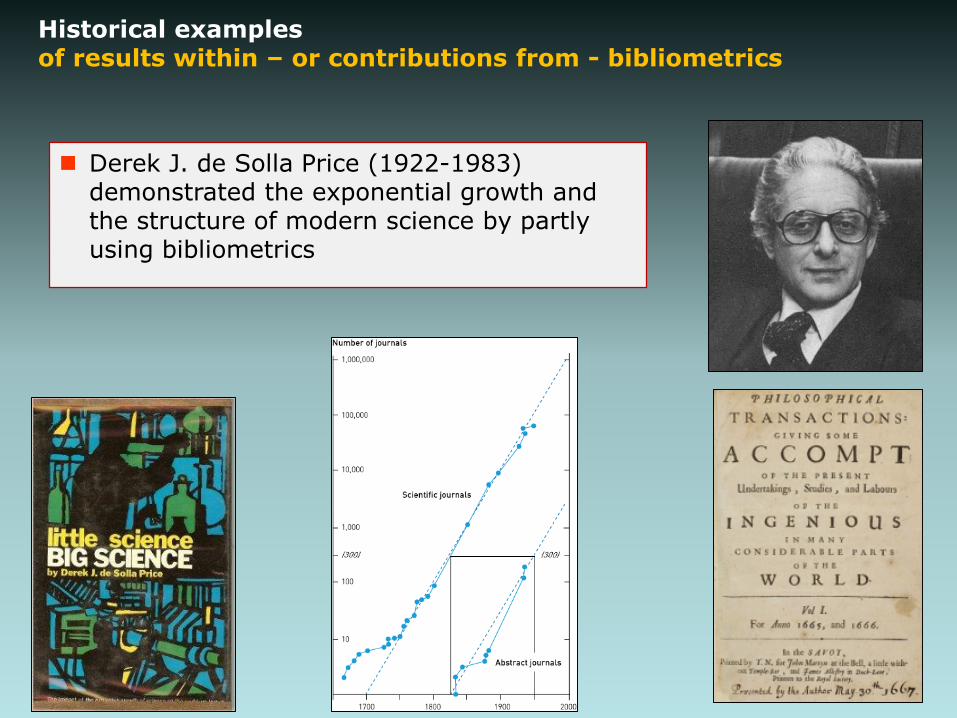
Derek J. de Solla Price (1922-1983) demonstrated the exponential growth and the structure of modern science by partly using bibliometrics
Historical examplesof results within – or contributions from - bibliometrics
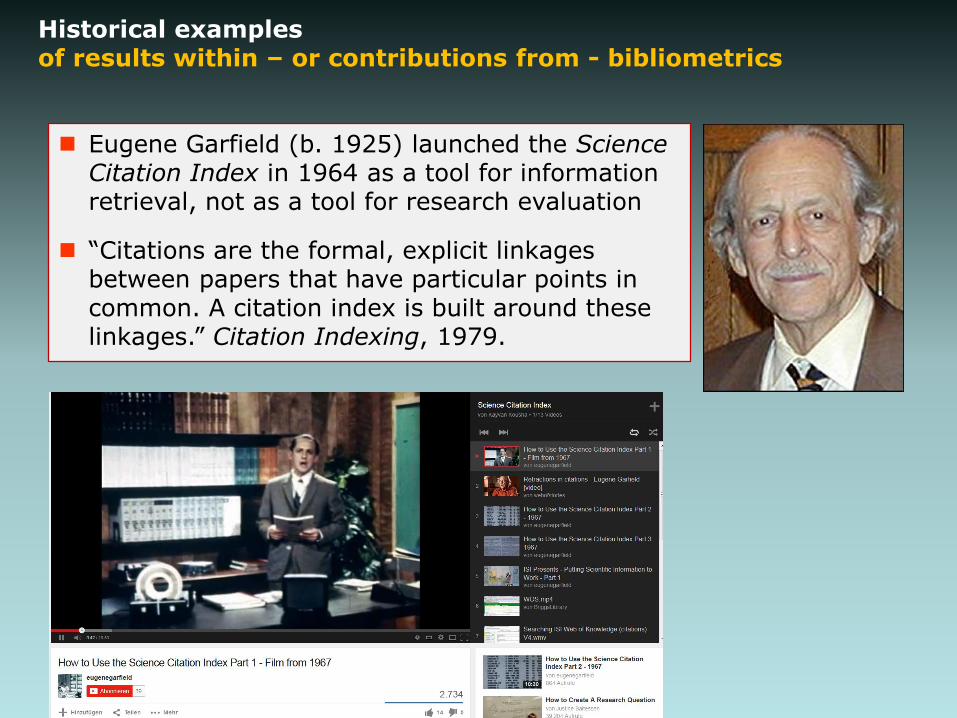
Eugene Garfield (b. 1925) launched the Science Citation Index in 1964 as a tool for information retrieval, not as a tool for research evaluation
“Citations are the formal, explicit linkages between papers that have particular points in common. A citation index is built around these linkages.” Citation Indexing, 1979.

Historical examplesof results within – or contributions from - bibliometrics
Eugene Garfield (b. 1925) developed the Journal Impact Factor as a management tool for libraries (journal selection), not as a tool for research evaluation
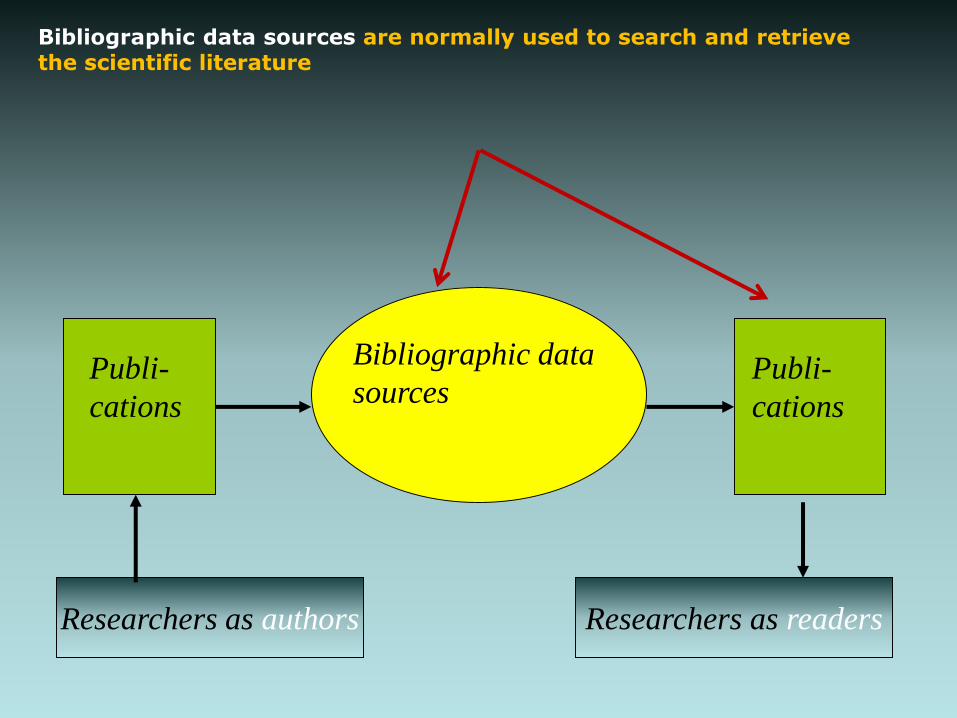
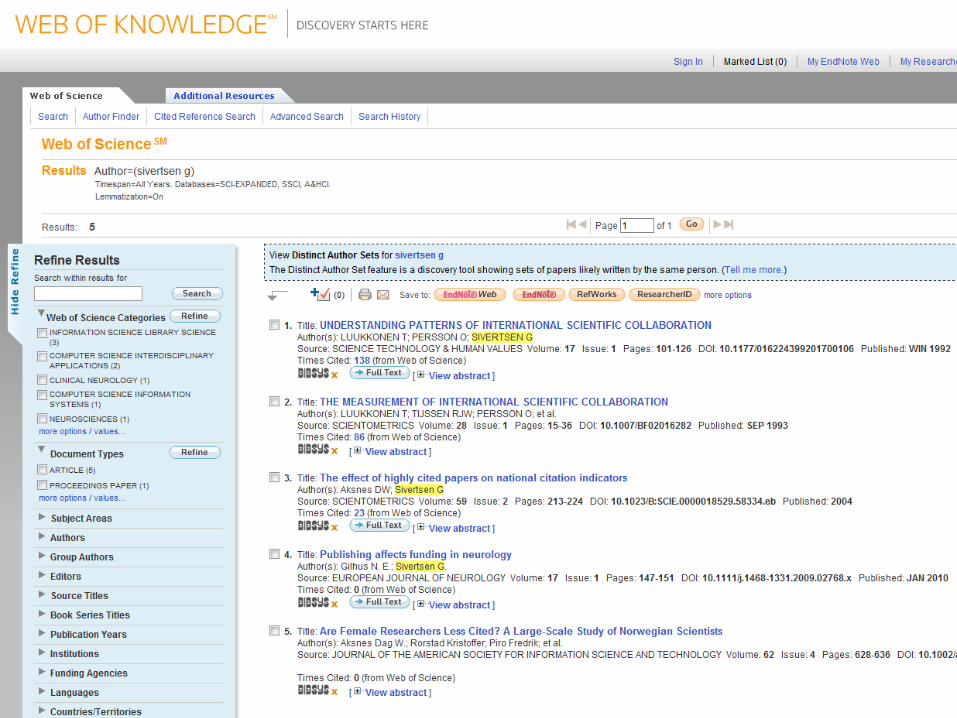
Bibliographic data sources are normally used to search and retrievethe scientific literature
Bibliographic data
sources
Researchers as authors
Publi-
cations
Publi-
cations
Researchers as readers
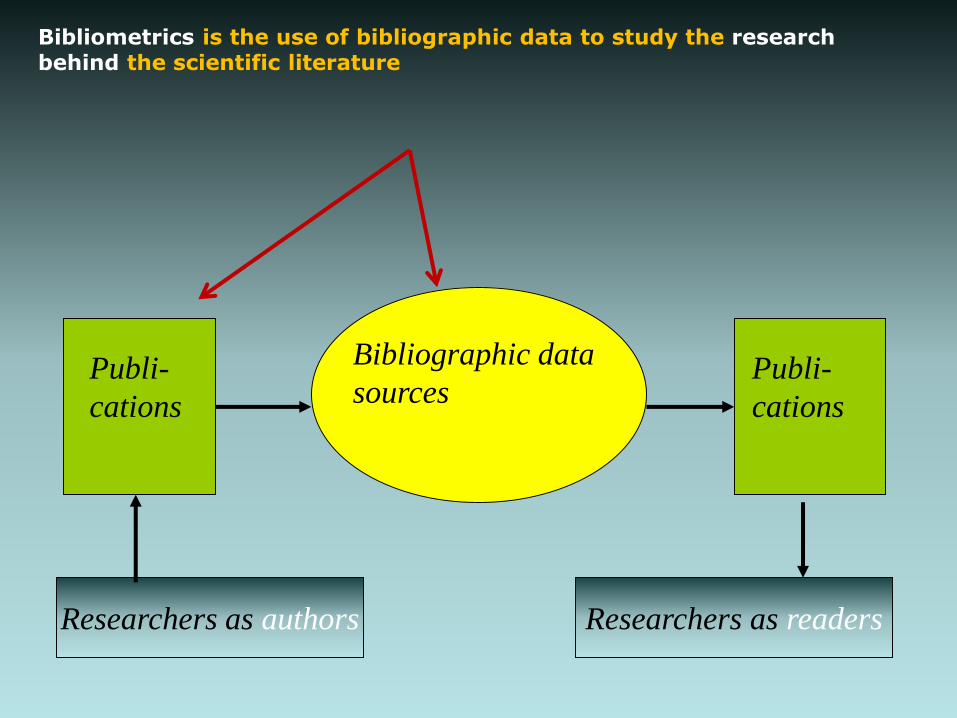
Bibliometrics is the use of bibliographic data to study the researchbehind the scientific literature
Bibliographic data
sources
Researchers as authors
Publi-
cations
Publi-
cations
Researchers as readers

Bibliometrics is possible because research must be published
Bibliographic data
sources
Researchers as authors
Publi-
cations
Publi-
cations
Researchers as readers
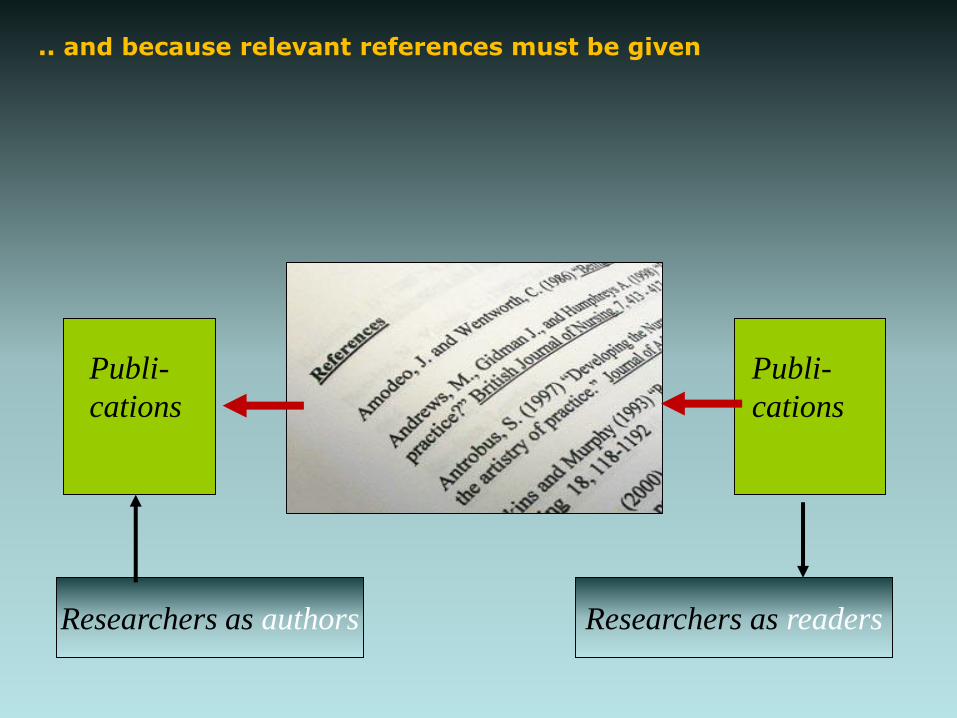
.. and because relevant references must be given
Bibliographic data
sources
Researchers as authors
Publi-
cations
Publi-
cations
Researchers as readers
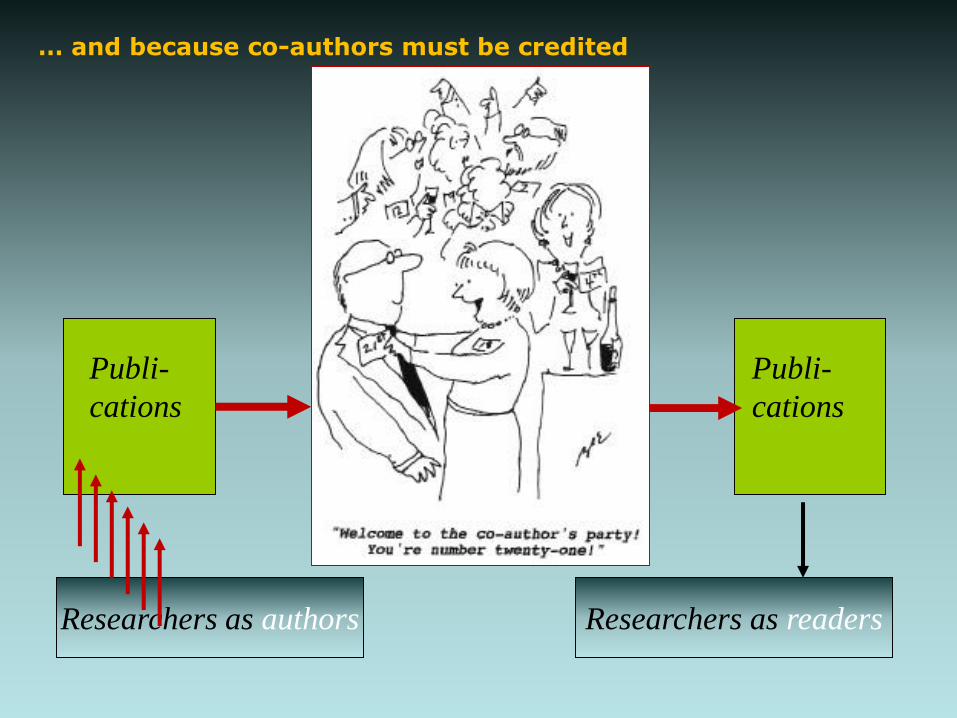
… and because co-authors must be credited
Bibliographic data
sources
Researchers as authors
Publi-
cations
Publi-
cations
Researchers as readers
Overview of the lecture (I)
1. What is bibliometrics?
Definitions
Historical examples
Journals and conferences
A practical definition for research policy
2. Bibliometric data sources
3. Basic metadata for bibliometric indicators for studies and evaluations of research
Indexedjournals
Journals and series
Books
0%
10%
20%
30%
40%
50%
60%
70%
80%
90%
100%
Health
Sciences
Natural
Sciences
Engineering Social Sciences Humanities
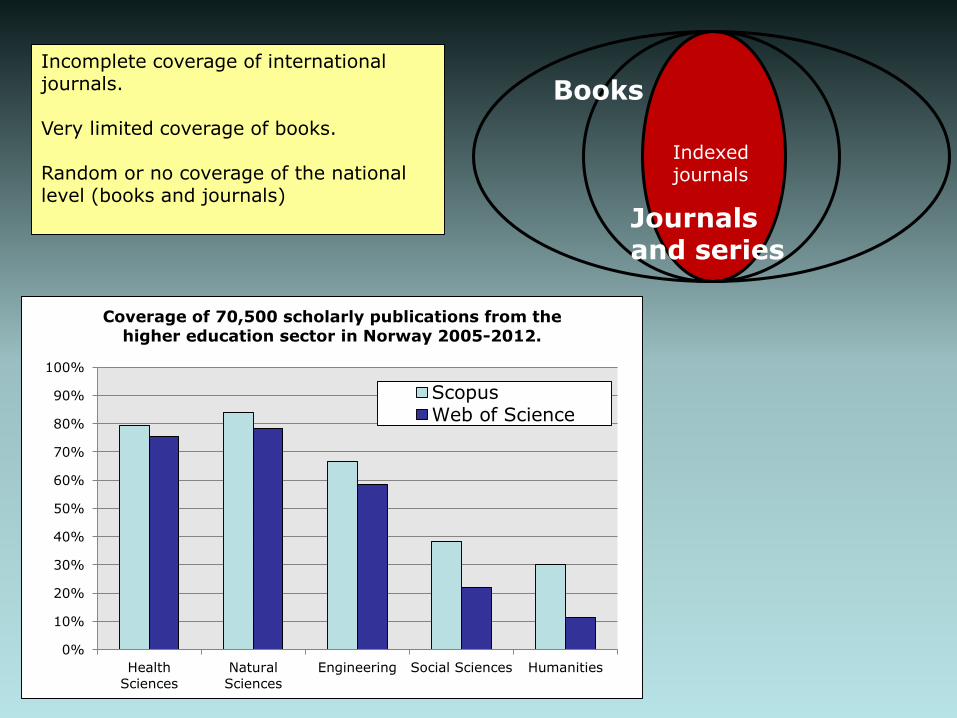
Coverage of 70,500 scholarly publications from thehigher education sector in Norway 2005-2012.
ScopusWeb of Science
Incomplete coverage of internationaljournals.
Very limited coverage of books.
Random or no coverage of the nationallevel (books and journals)
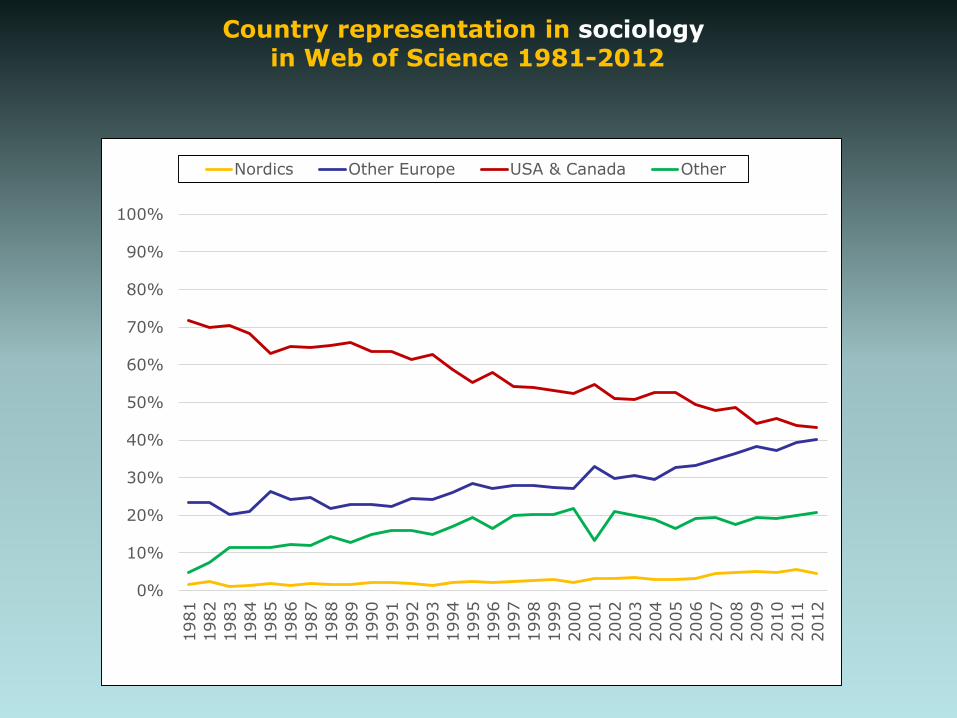
Country representation in sociologyin Web of Science 1981-2012
0%
10%
20%
30%
40%
50%
60%
70%
80%
90%
100%
1981
1982
1983
1984
1985
1986
1987
1988
1989
1990
1991
1992
1993
1994
1995
1996
1997
1998
1999
2000
2001
2002
2003
2004
2005
2006
2007
2008
2009
2010
2011
2012
Nordics Other Europe USA & Canada Other
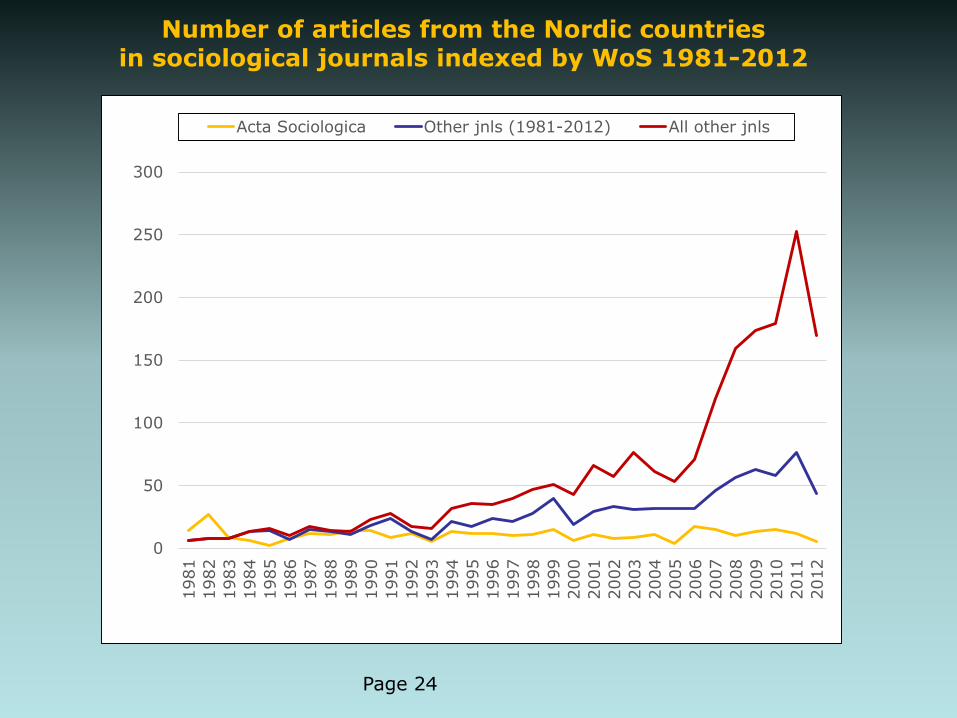
Number of articles from the Nordic countriesin sociological journals indexed by WoS 1981-2012
0
50
100
150
200
250
3001981
1982
1983
1984
1985
1986
1987
1988
1989
1990
1991
1992
1993
1994
1995
1996
1997
1998
1999
2000
2001
2002
2003
2004
2005
2006
2007
2008
2009
2010
2011
2012
Acta Sociologica Other jnls (1981-2012) All other jnls
Page 24

Number of sociological journals indexed by WoS 1981-2012and number of them with Nordic articles
0
20
40
60
80
100
120
140
1601981
1982
1983
1984
1985
1986
1987
1988
1989
1990
1991
1992
1993
1994
1995
1996
1997
1998
1999
2000
2001
2002
2003
2004
2005
2006
2007
2008
2009
2010
2011
2012
Indexed journals
Journals with Nordicarticles
Page 25
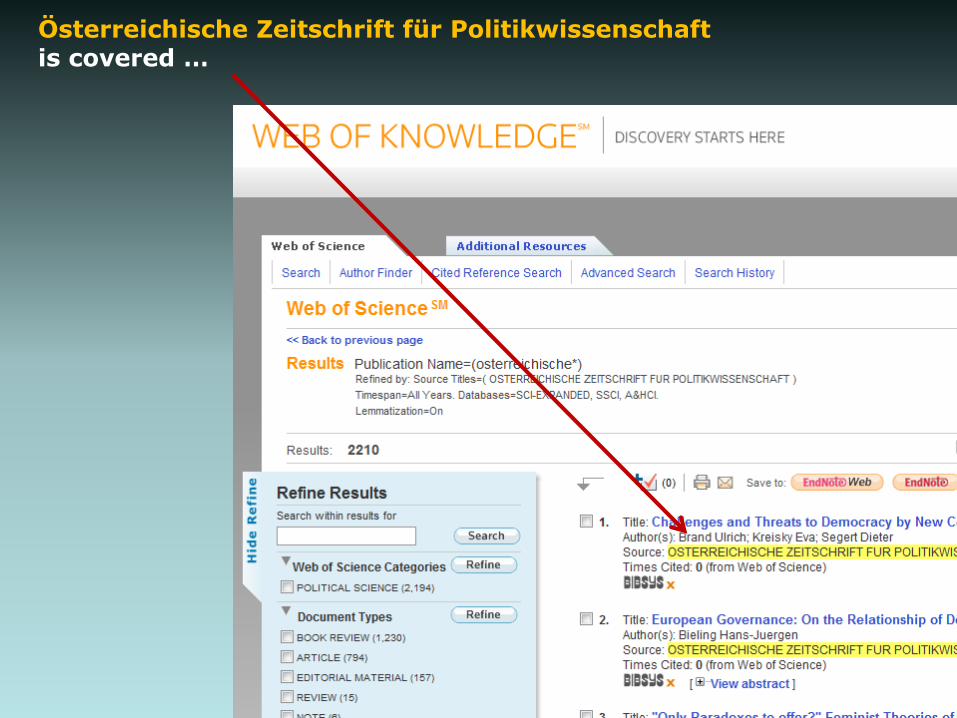
Österreichische Zeitschrift für Politikwissenschaftis covered …

But Österreichische Zeitschrift für Soziologie is not covered
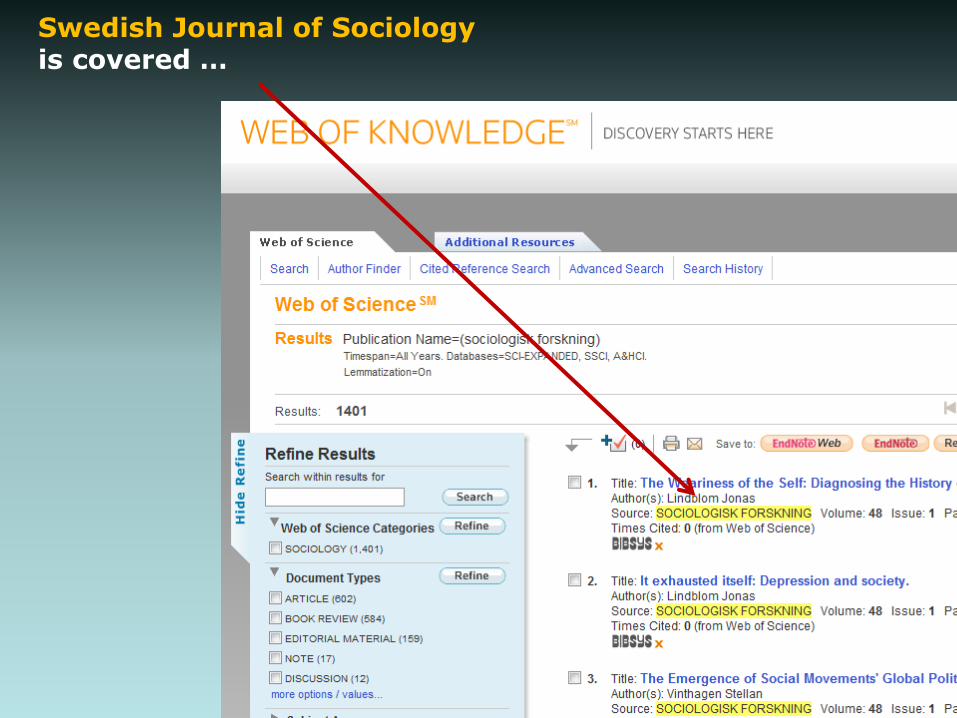
Swedish Journal of Sociologyis covered …
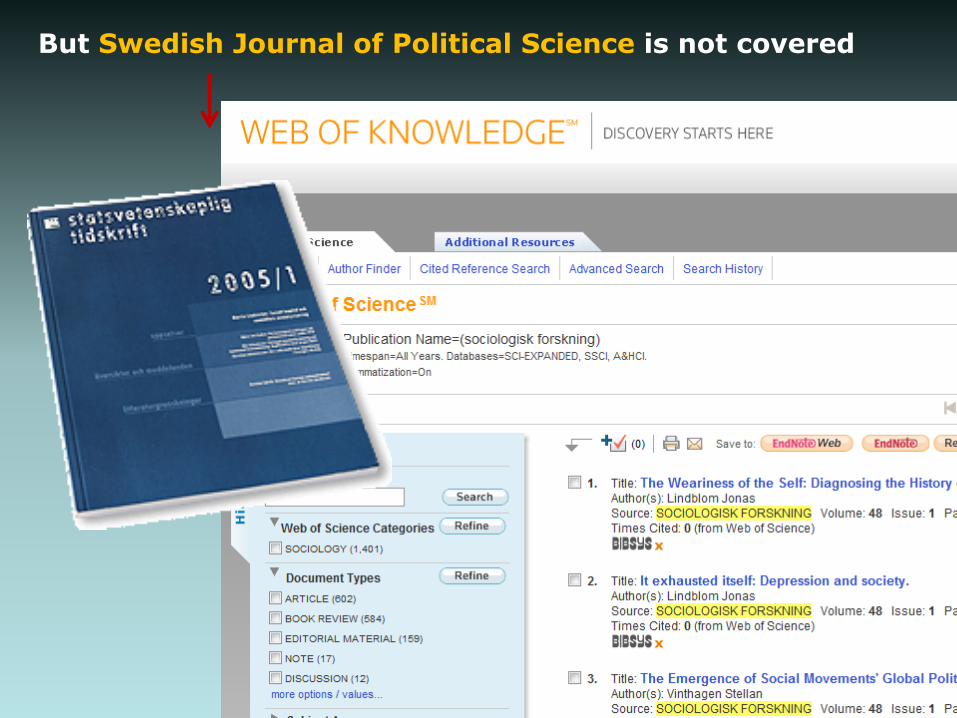
But Swedish Journal of Political Science is not covered
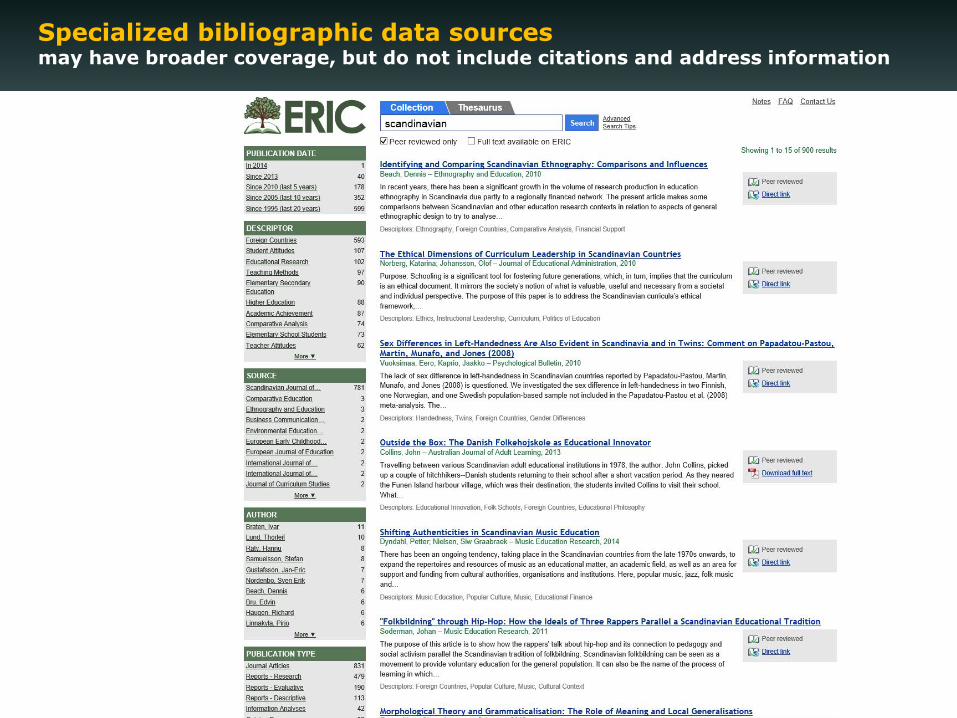
Specialized bibliographic data sourcesmay have broader coverage, but do not include citations and address information
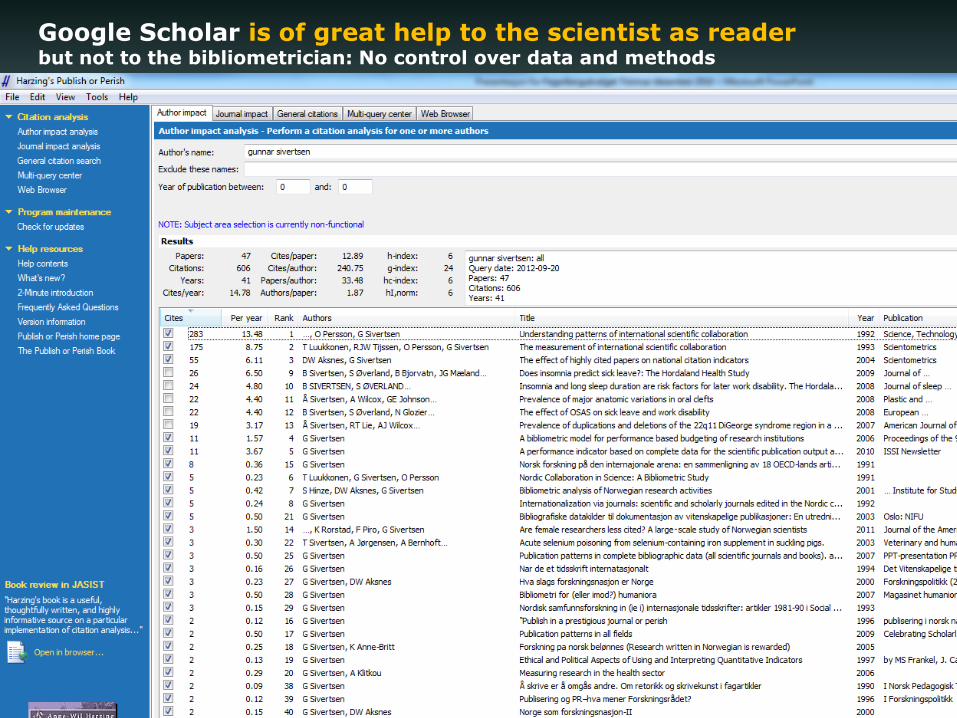
Google Scholar is of great help to the scientist as readerbut not to the bibliometrician: No control over data and methods

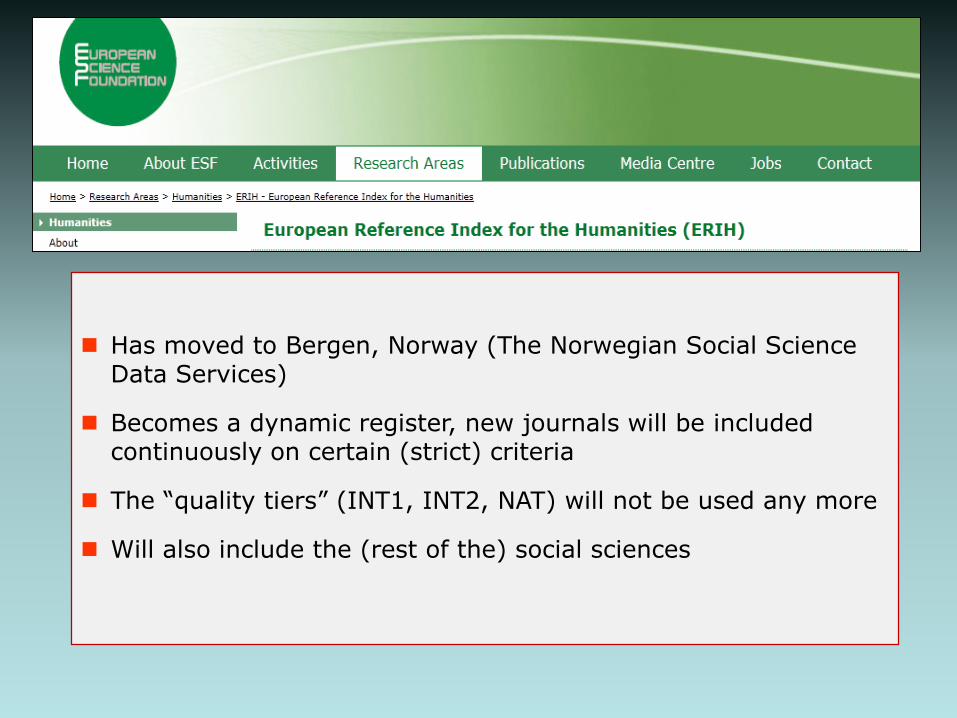
Has moved to Bergen, Norway (The Norwegian Social Science Data Services)
Becomes a dynamic register, new journals will be included continuously on certain (strict) criteria
The “quality tiers” (INT1, INT2, NAT) will not be used any more
Will also include the (rest of the) social sciences
Overview of the lecture (I)
1. What is bibliometrics?
Definitions
Historical examples
Journals and conferences
A practical definition for research policy
2. Bibliometric data sources
3. Basic metadata for bibliometric indicators for studies and evaluations of research
Page 35
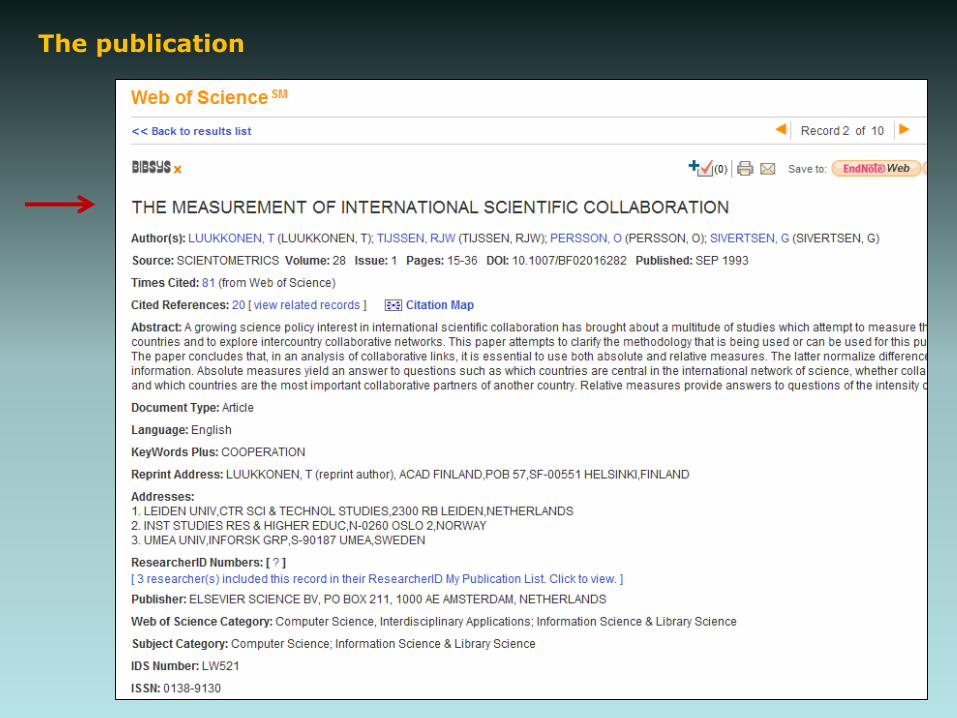
The publication

The publication: Where published?
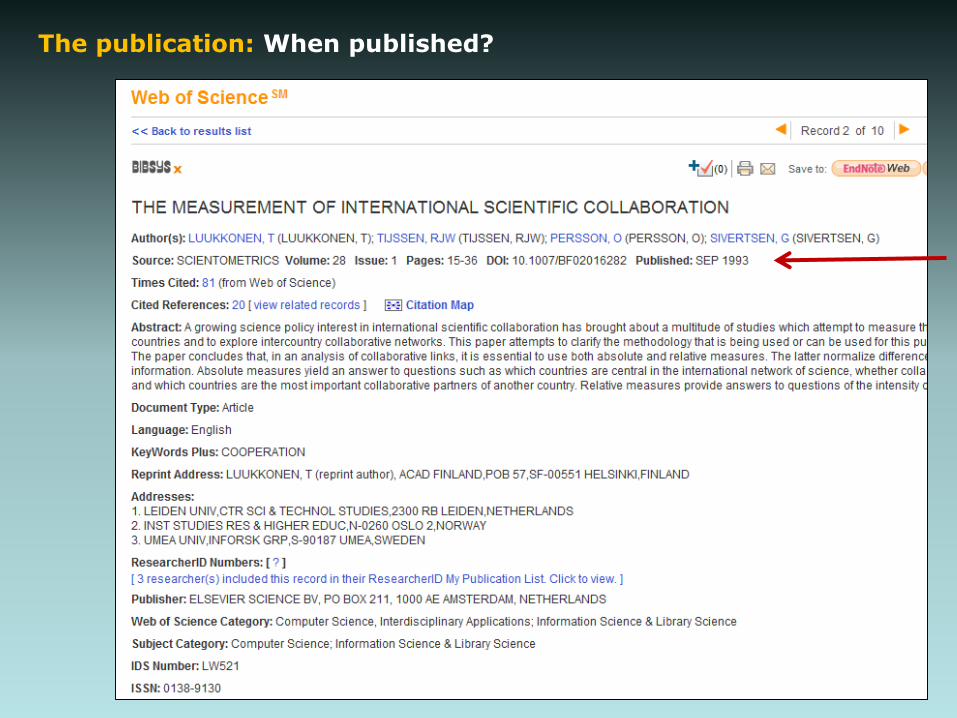
The publication: When published?
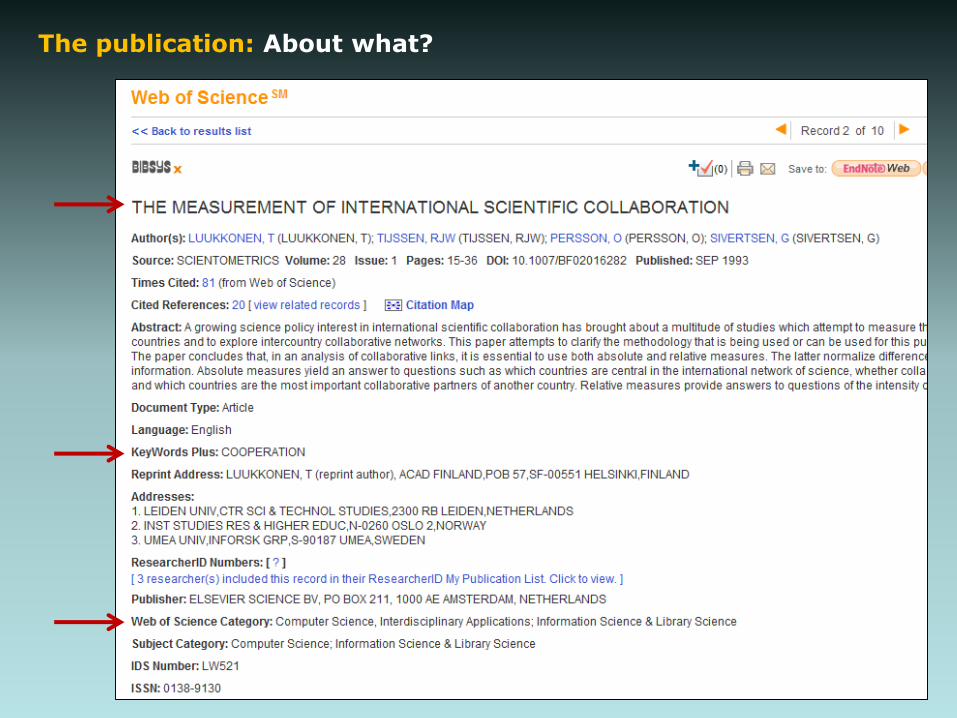
The publication: About what?

The publication: By whom?
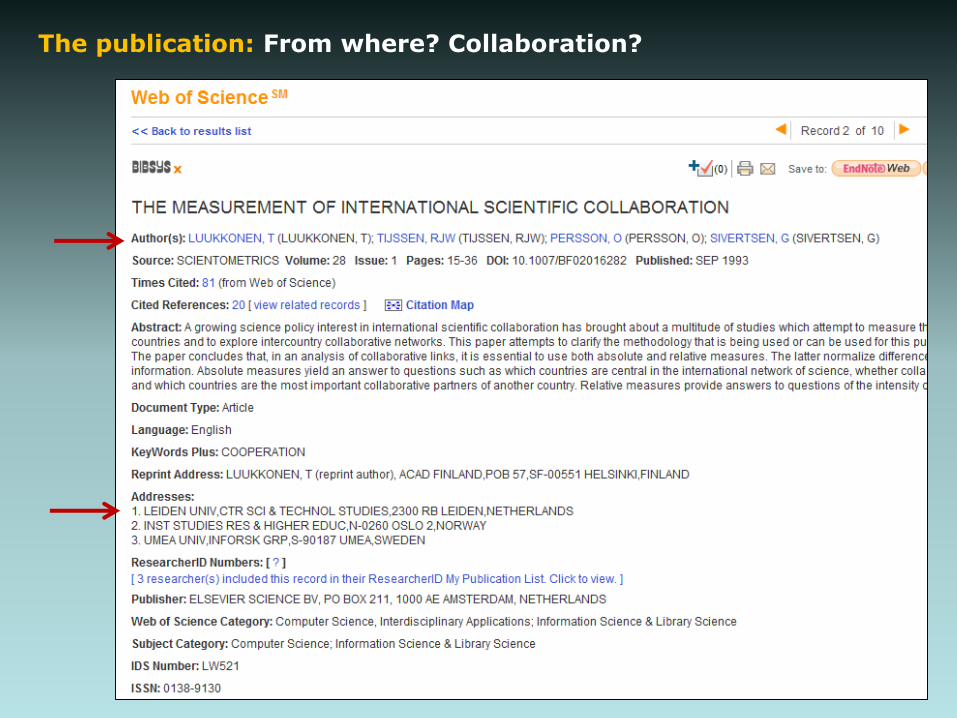
The publication: From where? Collaboration?
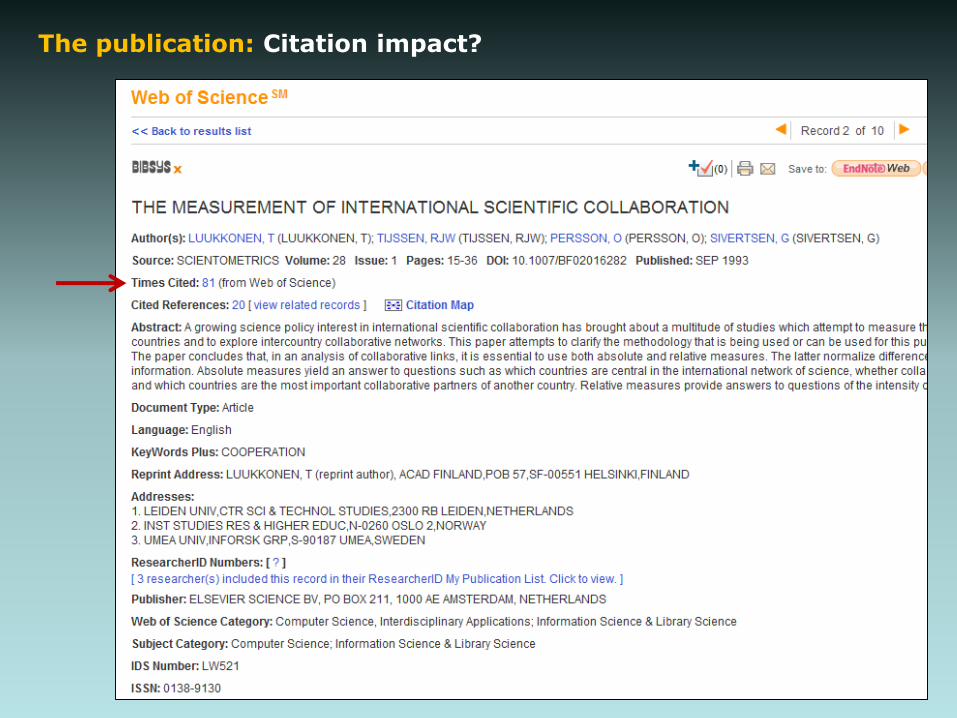
The publication: Citation impact?
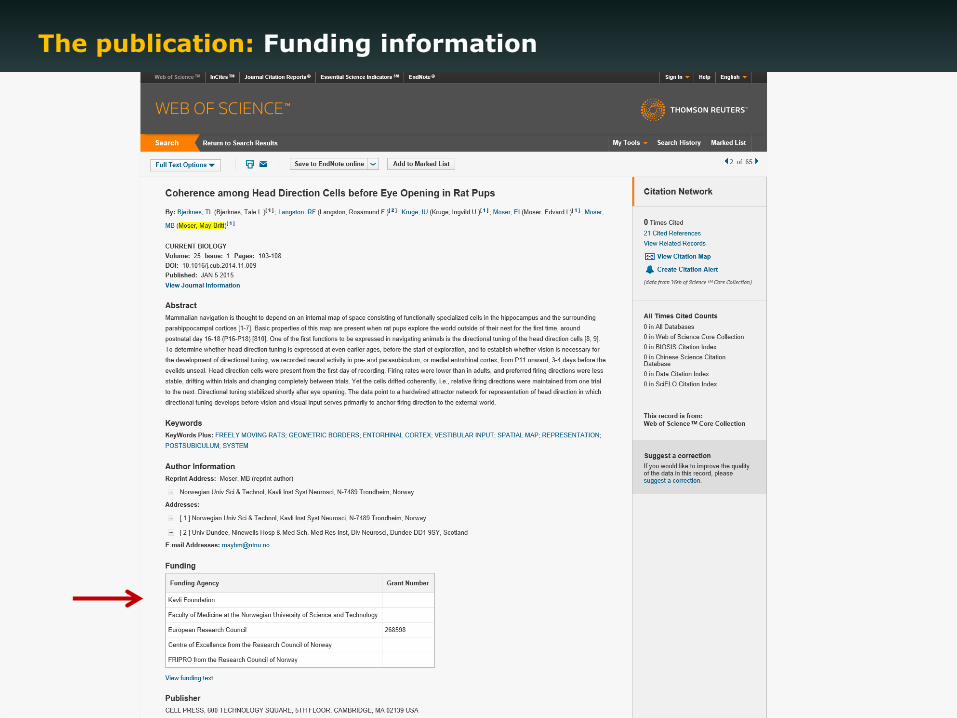
The publication: Funding information

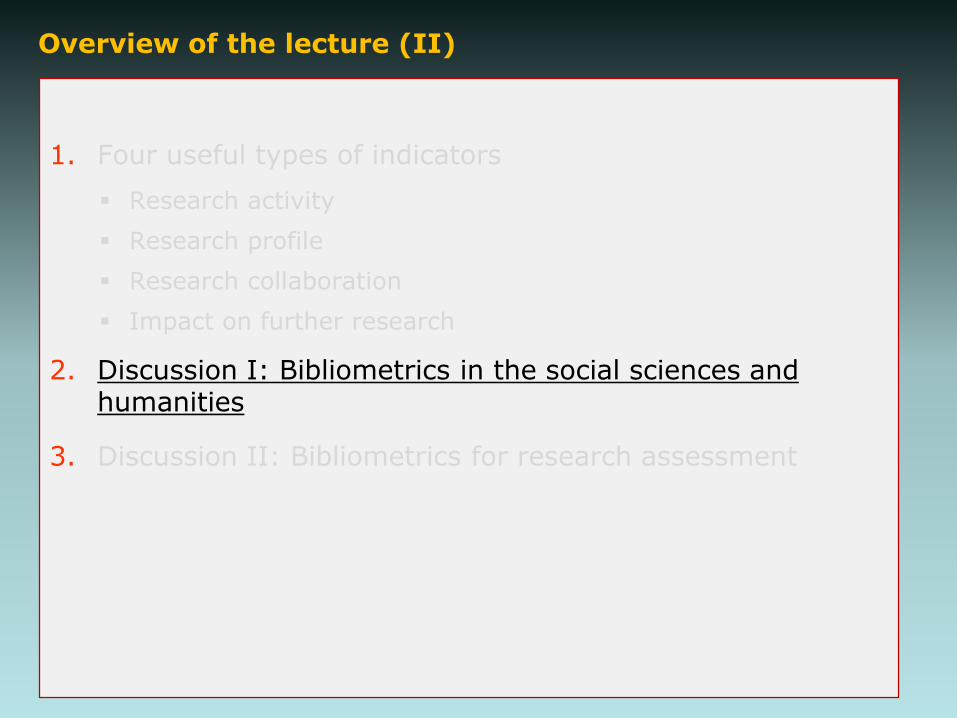
Overview of the lecture (II)
1. Four useful types of indicators
Research activity
Research profile
Research collaboration
Impact on further research
2. Discussion I: Bibliometrics in the social sciences and humanities
3. Discussion II: Bibliometrics for research assessment
Overview of the lecture (II)
1. Four useful types of indicators
Research activity
Research profile
Research collaboration
Impact on further research
2. Discussion I: Bibliometrics in the social sciences and humanities
3. Discussion II: Bibliometrics for research assessment
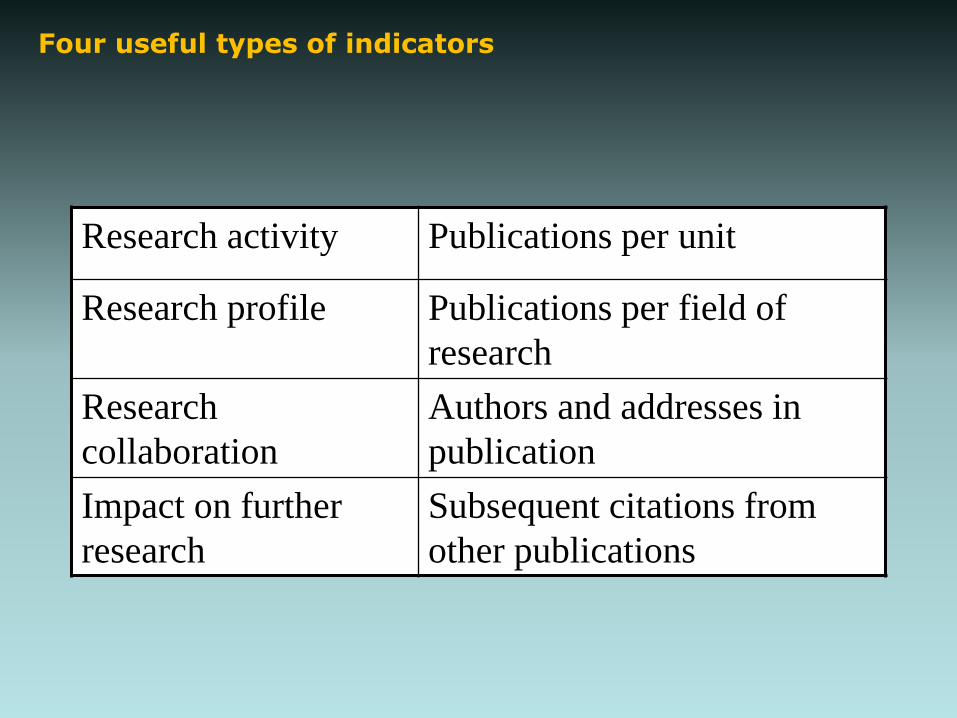
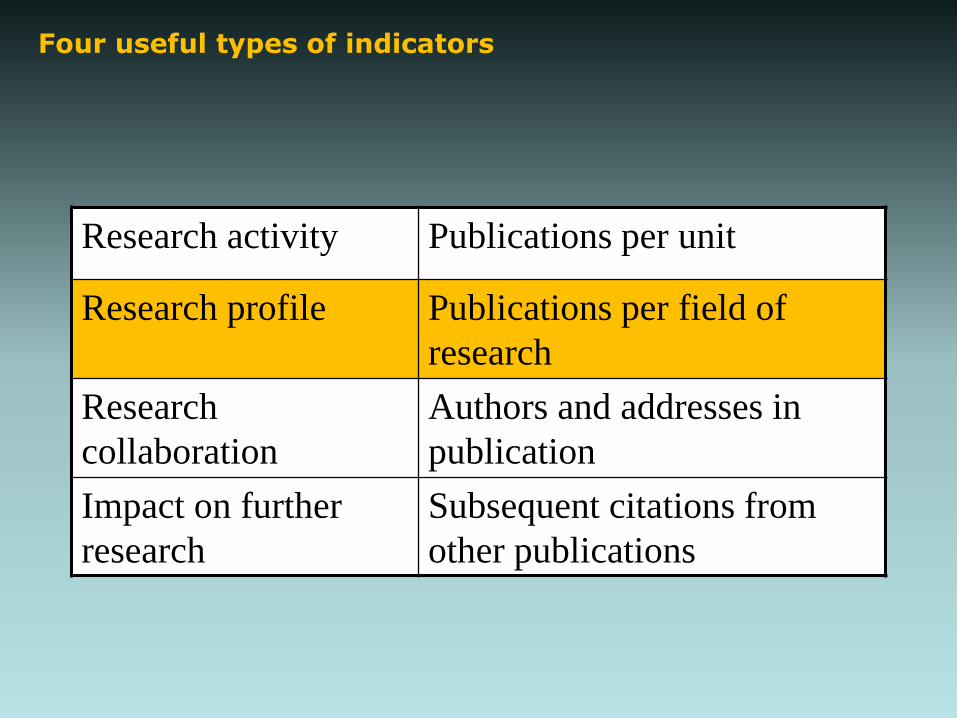
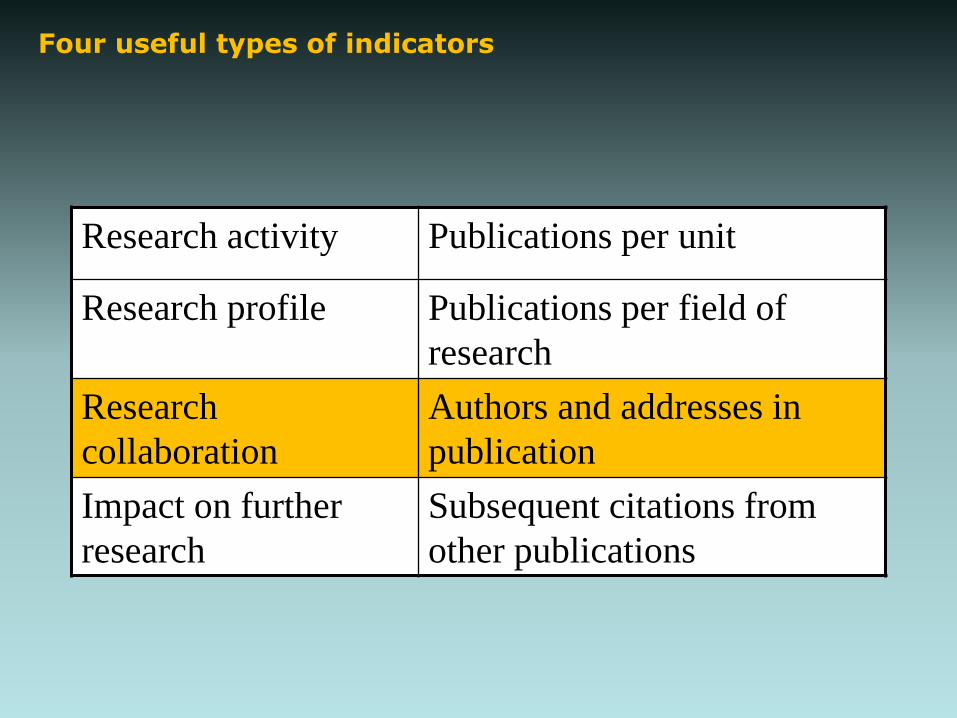
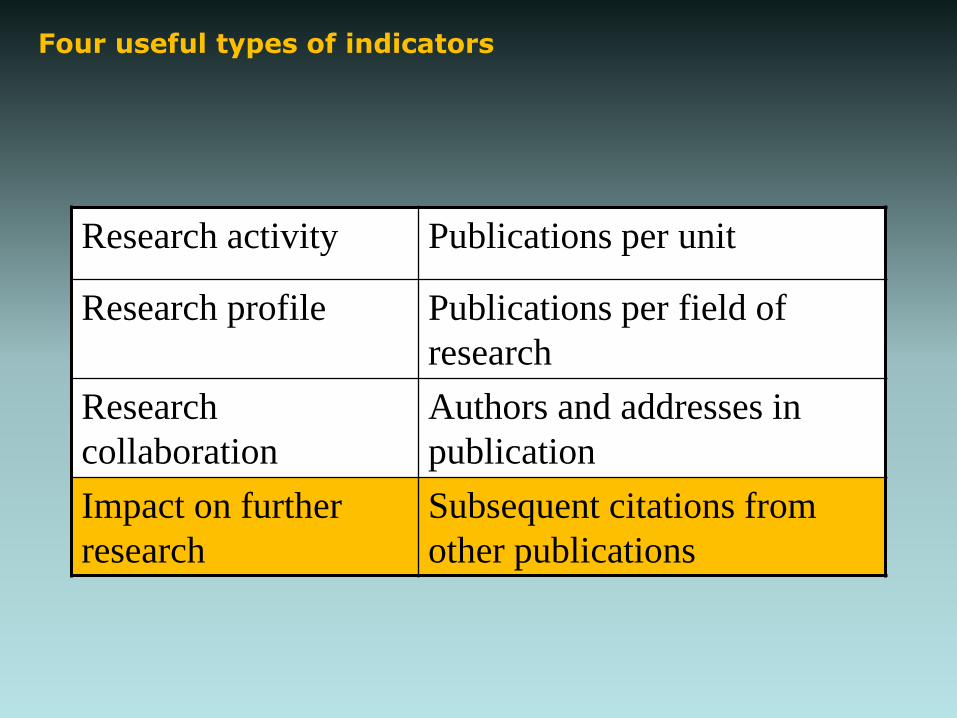
Research activity Publications per unit
Research profile Publications per field of
research
Research
collaboration
Authors and addresses in
publication
Impact on further
research
Subsequent citations from
other publications
Four useful types of indicators
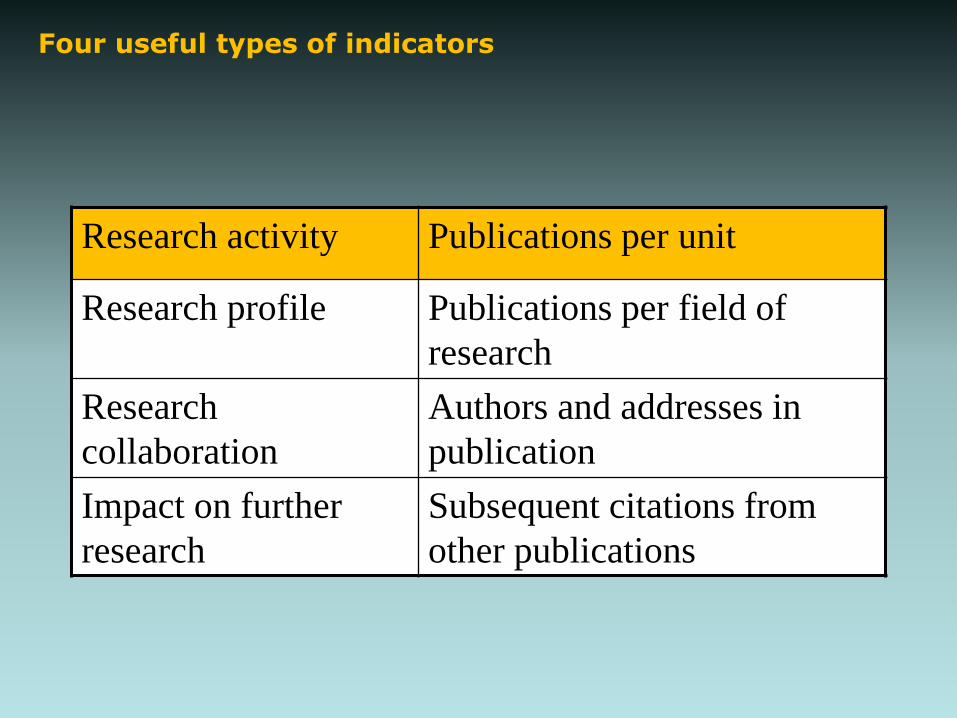
Research activity Publications per unit
Research profile Publications per field of
research
Research
collaboration
Authors and addresses in
publication
Impact on further
research
Subsequent citations from
other publications
Four useful types of indicators
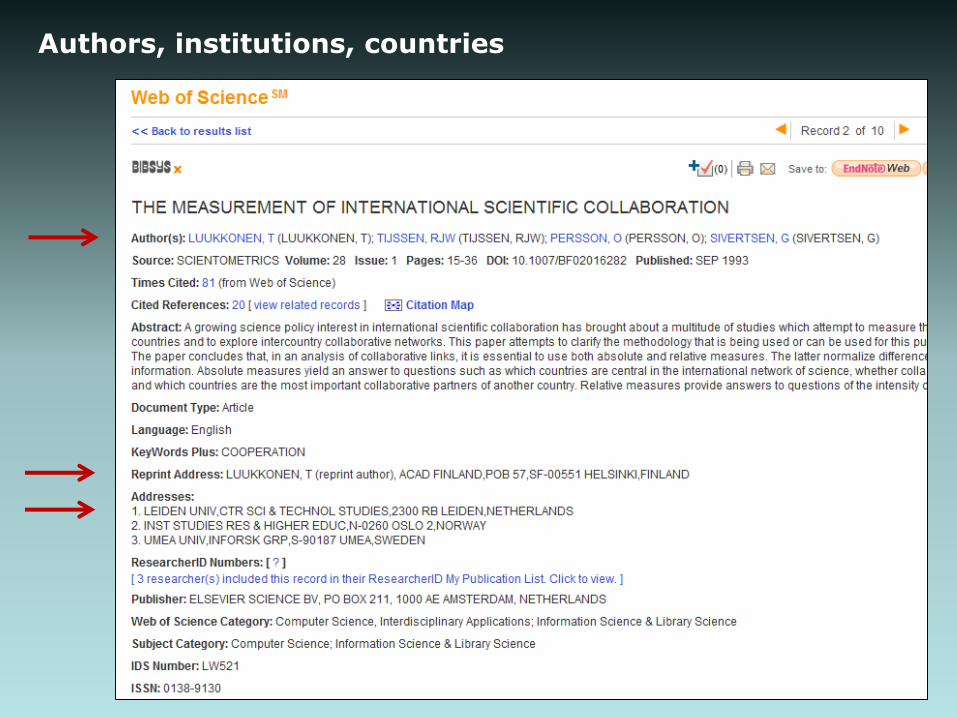
Authors, institutions, countries
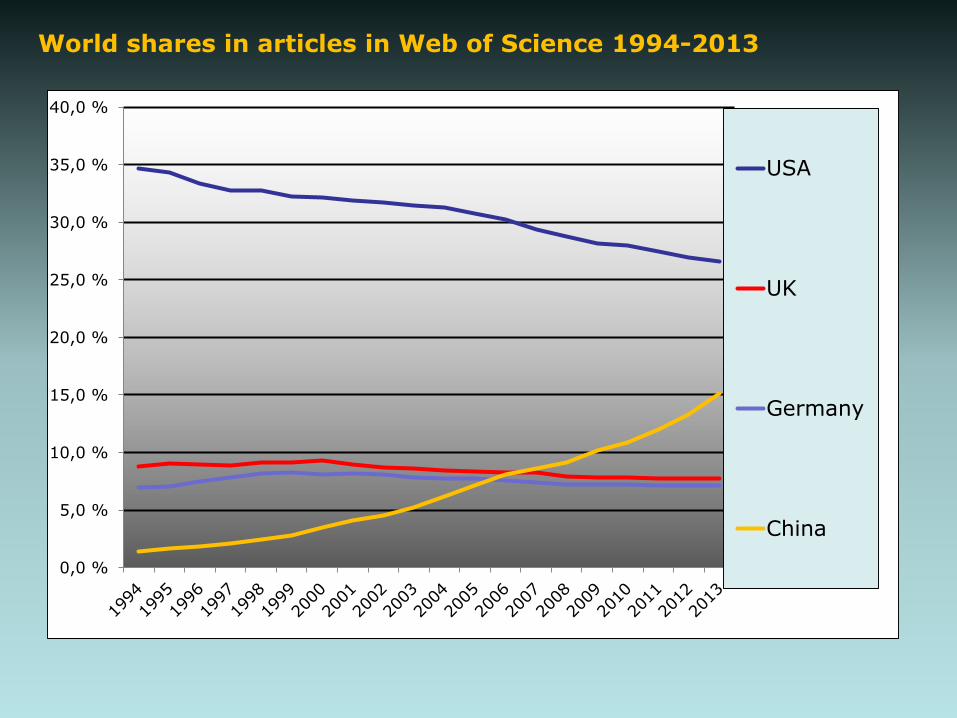
World shares in articles in Web of Science 1994-2013
0,0 %
5,0 %
10,0 %
15,0 %
20,0 %
25,0 %
30,0 %
35,0 %
40,0 %
USA
UK
Germany
China
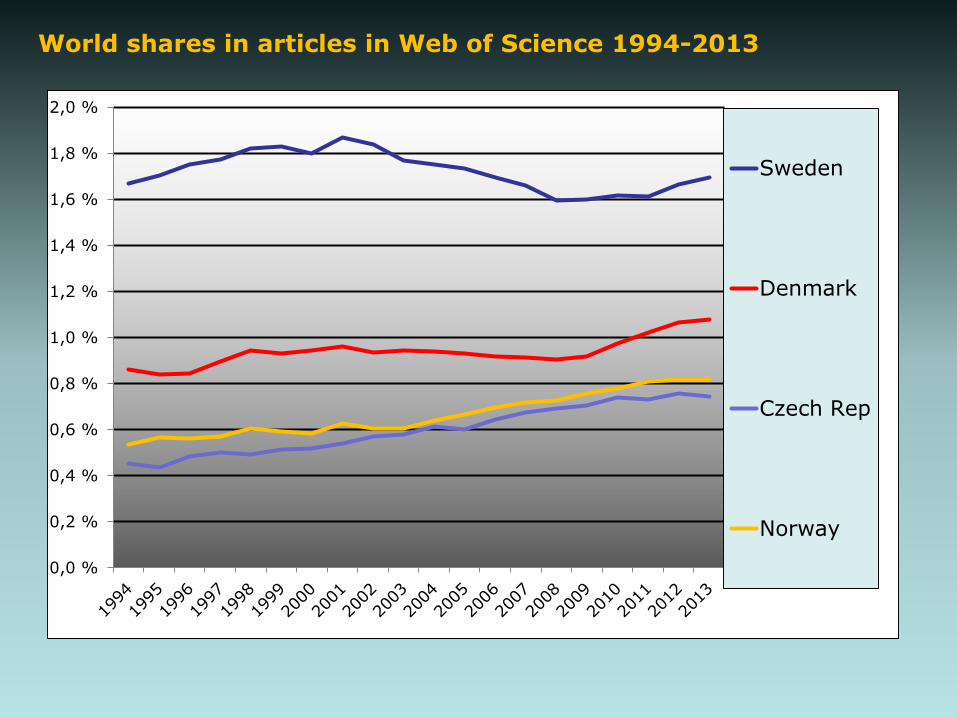
World shares in articles in Web of Science 1994-2013
0,0 %
0,2 %
0,4 %
0,6 %
0,8 %
1,0 %
1,2 %
1,4 %
1,6 %
1,8 %
2,0 %
Sweden
Denmark
Czech Rep
Norway
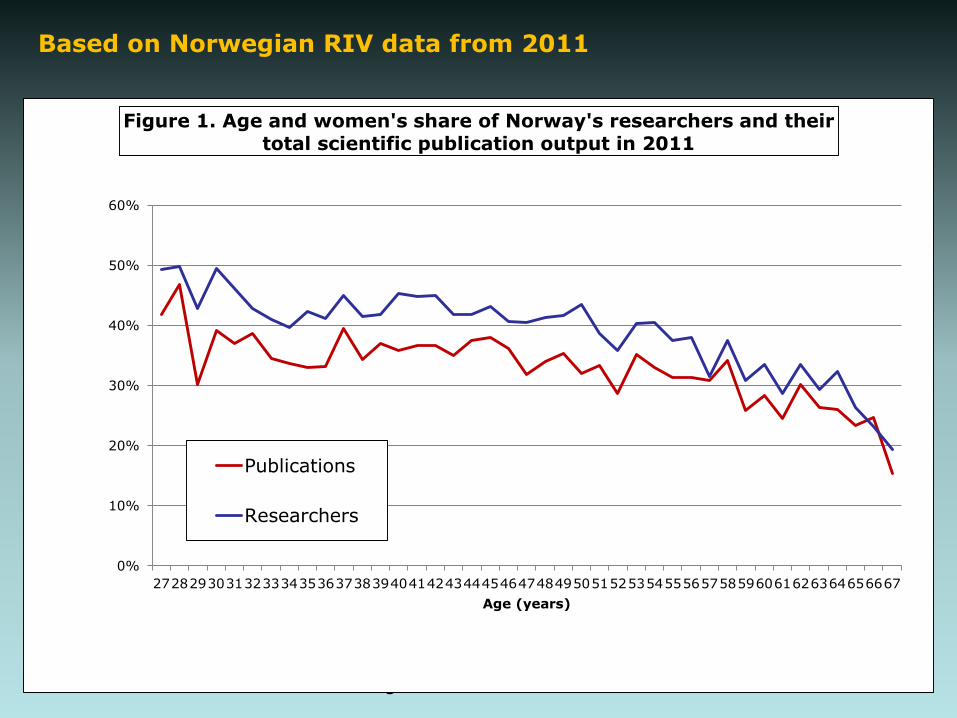
Based on Norwegian RIV data from 2011
Page 51
0%
10%
20%
30%
40%
50%
60%
2728293031323334353637383940414243444546474849505152535455565758596061626364656667
Age (years)
Figure 1. Age and women's share of Norway's researchers and their
total scientific publication output in 2011
Publications
Researchers
Research activity Publications per unit
Research profile Publications per field of
research
Research
collaboration
Authors and addresses in
publication
Impact on further
research
Subsequent citations from
other publications
Four useful types of indicators
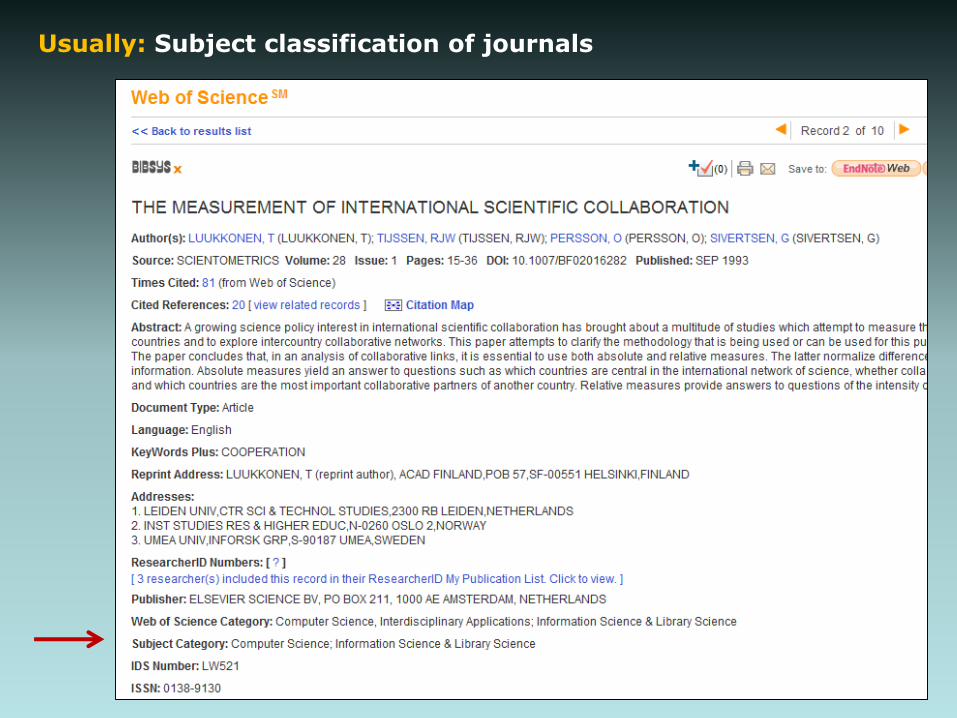
Usually: Subject classification of journals
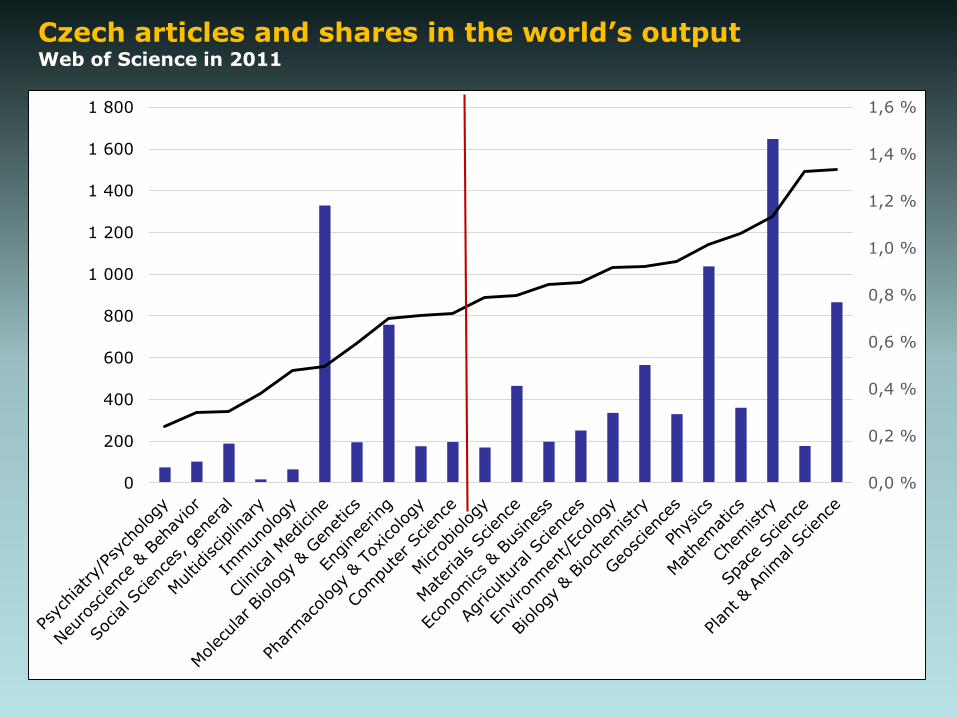
Czech articles and shares in the world’s output Web of Science in 2011
0,0 %
0,2 %
0,4 %
0,6 %
0,8 %
1,0 %
1,2 %
1,4 %
1,6 %
0
200
400
600
800
1 000
1 200
1 400
1 600
1 800
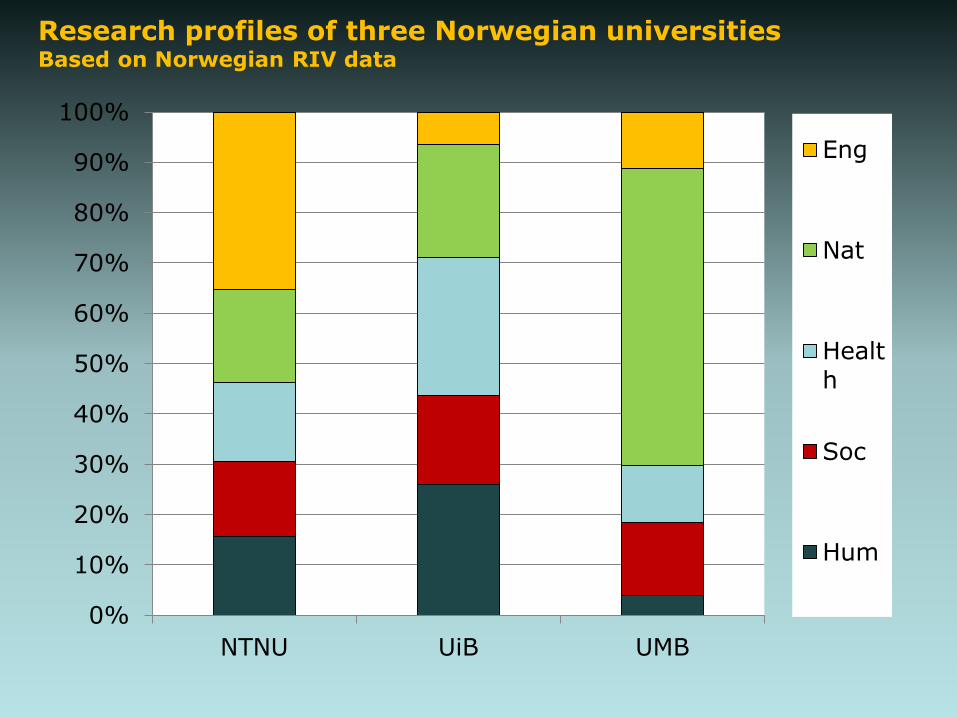
Research profiles of three Norwegian universitiesBased on Norwegian RIV data
0%
10%
20%
30%
40%
50%
60%
70%
80%
90%
100%
NTNU UiB UMB
Eng
Nat
Healt
h
Soc
Hum
Research activity Publications per unit
Research profile Publications per field of
research
Research
collaboration
Authors and addresses in
publication
Impact on further
research
Subsequent citations from
other publications
Four useful types of indicators
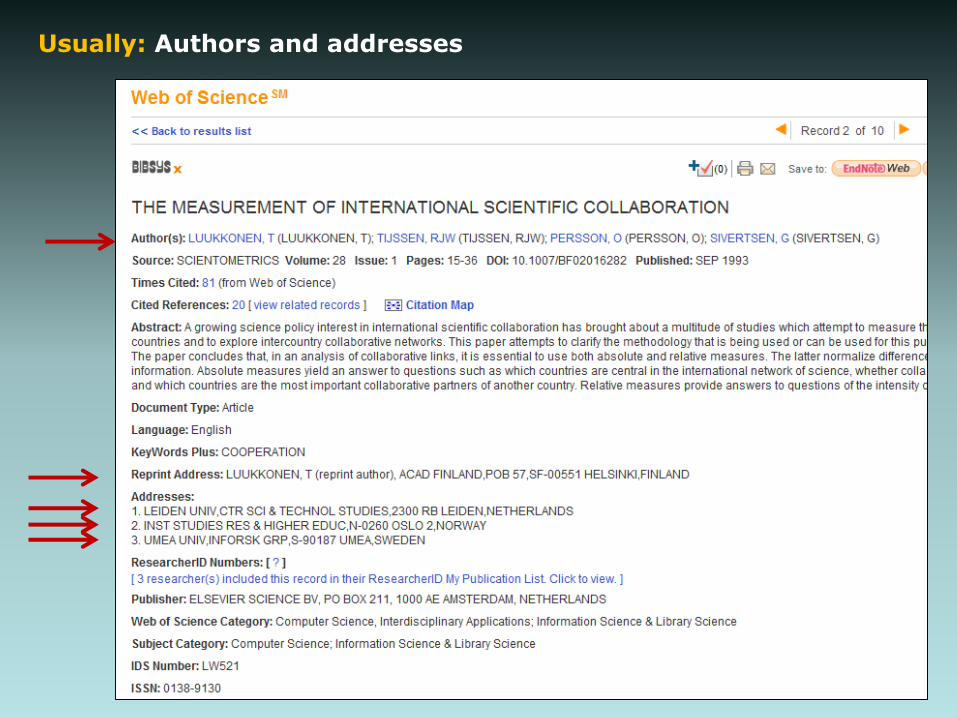
Usually: Authors and addresses
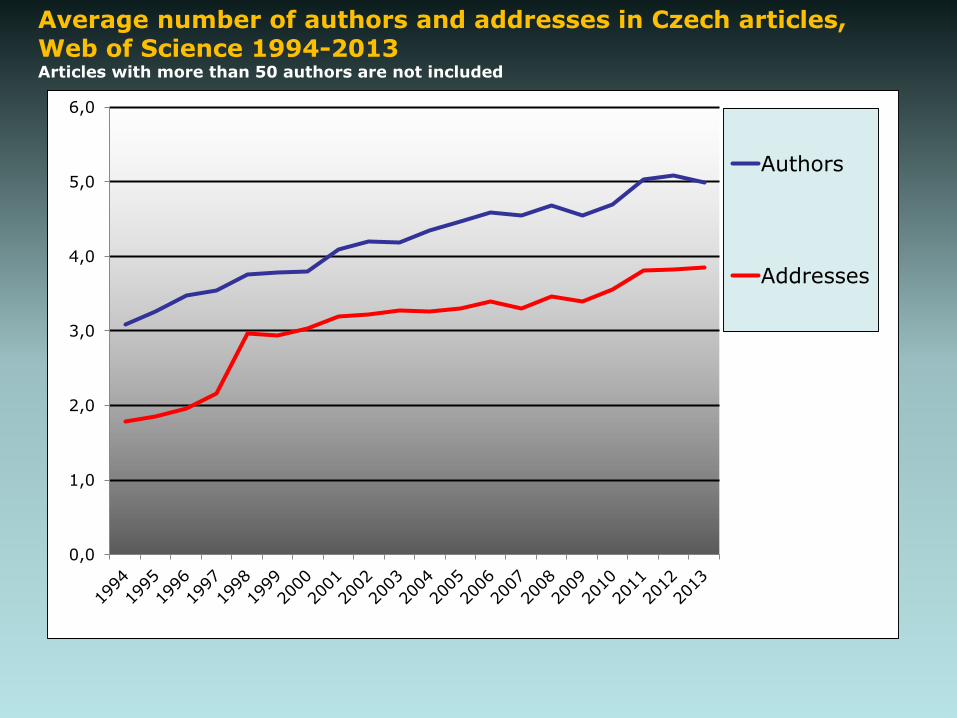
Average number of authors and addresses in Czech articles, Web of Science 1994-2013Articles with more than 50 authors are not included
0,0
1,0
2,0
3,0
4,0
5,0
6,0
Authors
Addresses
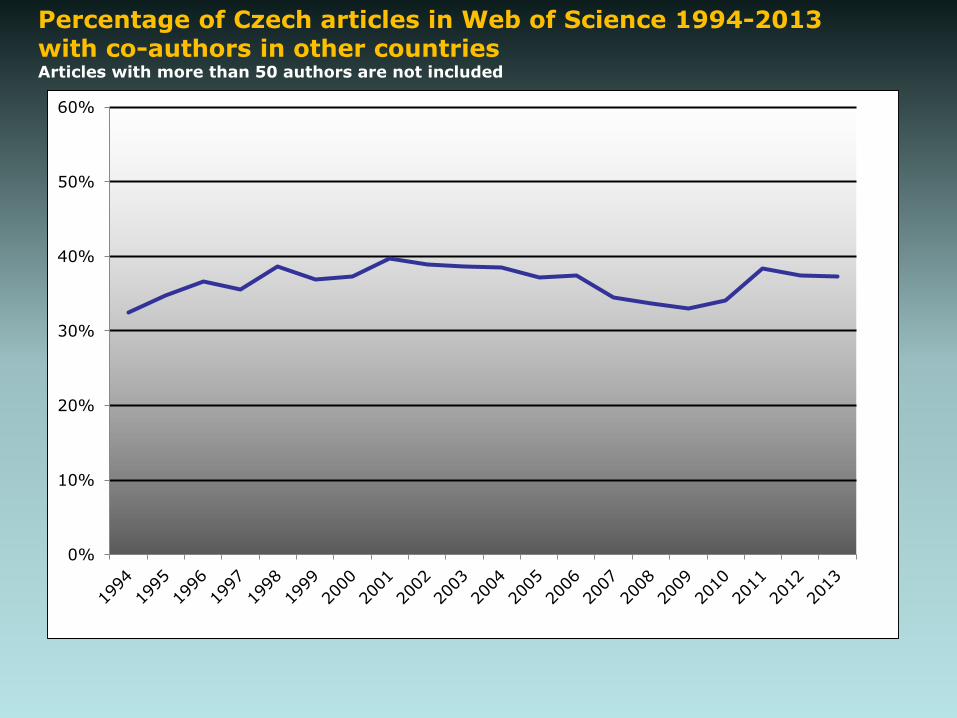
Percentage of Czech articles in Web of Science 1994-2013 with co-authors in other countriesArticles with more than 50 authors are not included
0%
10%
20%
30%
40%
50%
60%
Research activity Publications per unit
Research profile Publications per field of
research
Research
collaboration
Authors and addresses in
publication
Impact on further
research
Subsequent citations from
other publications
Four useful types of indicators
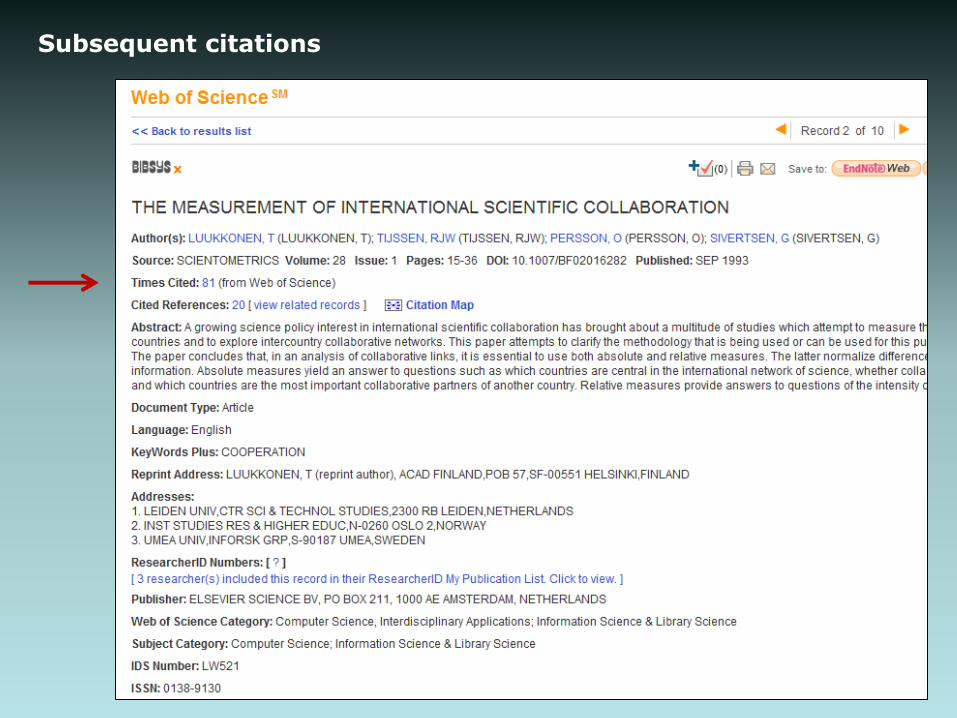
Subsequent citations

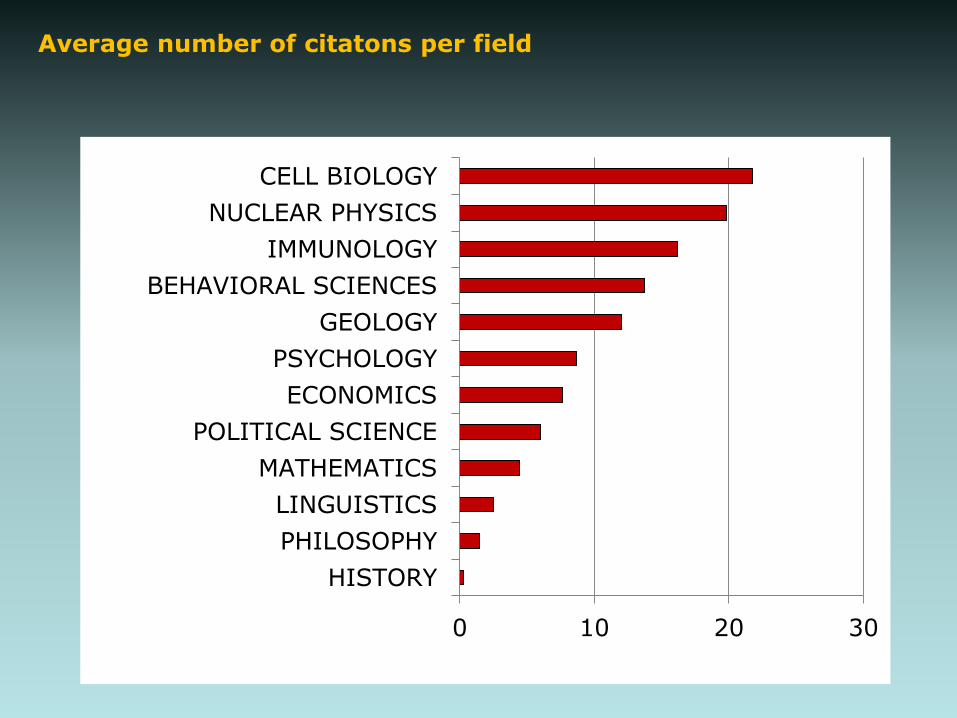
Average number of citatons per field:The need for field normalization
0 10 20 30
HISTORY
PHILOSOPHY
LINGUISTICS
MATHEMATICS
POLITICAL SCIENCE
ECONOMICS
PSYCHOLOGY
GEOLOGY
BEHAVIORAL SCIENCES
IMMUNOLOGY
NUCLEAR PHYSICS
CELL BIOLOGY
Overview of the lecture (II)
1. Four useful types of indicators
Research activity
Research profile
Research collaboration
Impact on further research
2. Discussion I: Bibliometrics in the social sciences and humanities
3. Discussion II: Bibliometrics for research assessment
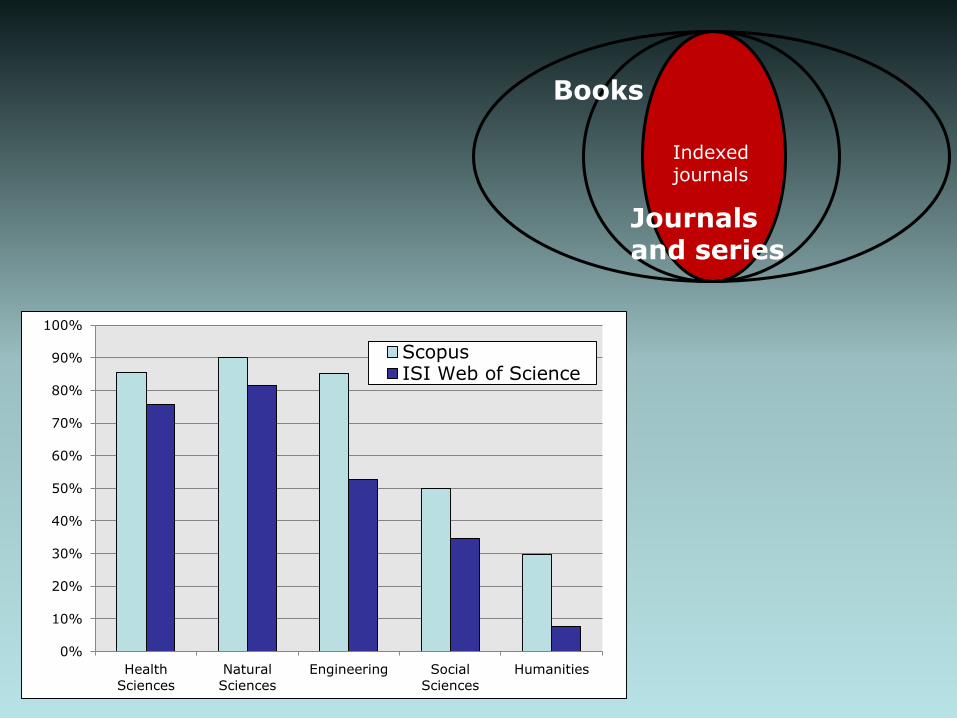
Indexedjournals
Journals and series
Books
0%
10%
20%
30%
40%
50%
60%
70%
80%
90%
100%
Health
Sciences
Natural
Sciences
Engineering Social
Sciences
Humanities
ScopusISI Web of Science
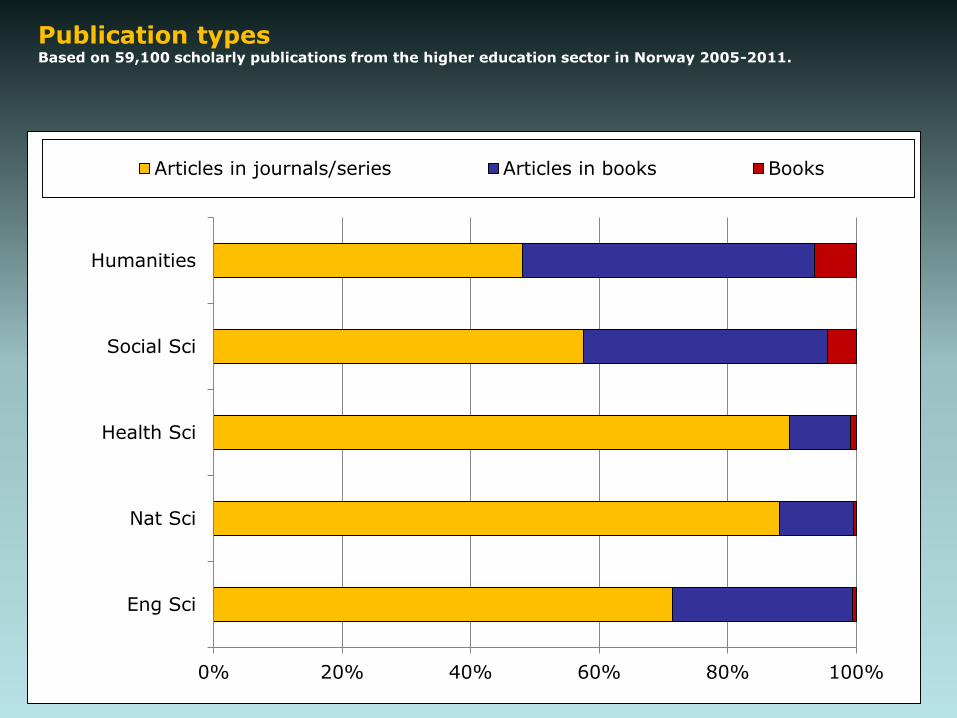
Publication typesBased on 59,100 scholarly publications from the higher education sector in Norway 2005-2011.
0% 20% 40% 60% 80% 100%
Eng Sci
Nat Sci
Health Sci
Social Sci
Humanities
Articles in journals/series Articles in books Books
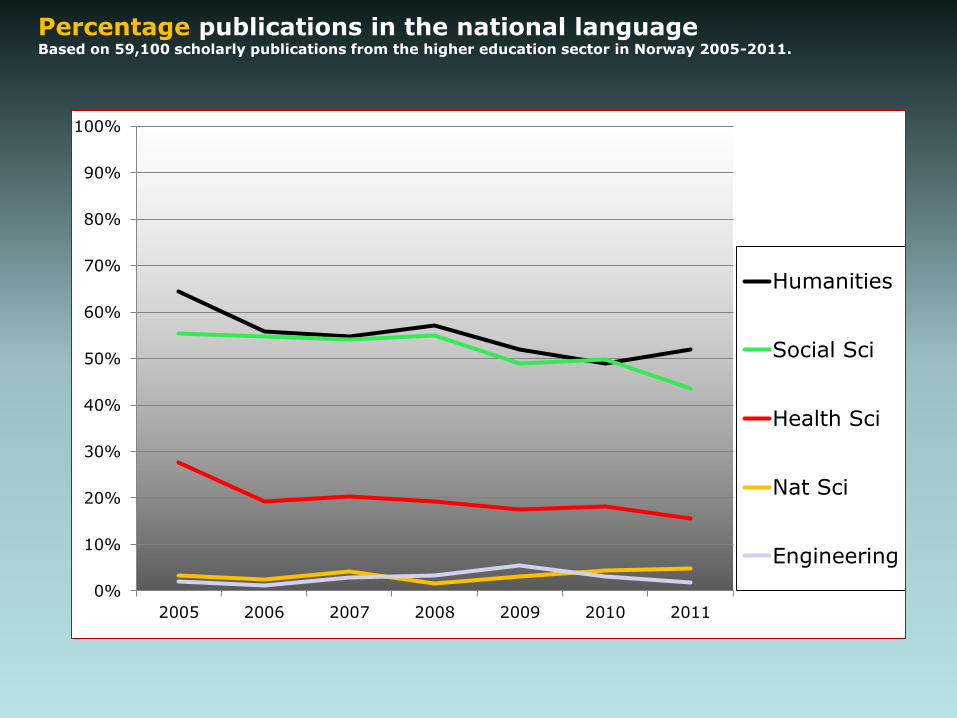
Percentage publications in the national languageBased on 59,100 scholarly publications from the higher education sector in Norway 2005-2011.
0%
10%
20%
30%
40%
50%
60%
70%
80%
90%
100%
2005 2006 2007 2008 2009 2010 2011
Humanities
Social Sci
Health Sci
Nat Sci
Engineering
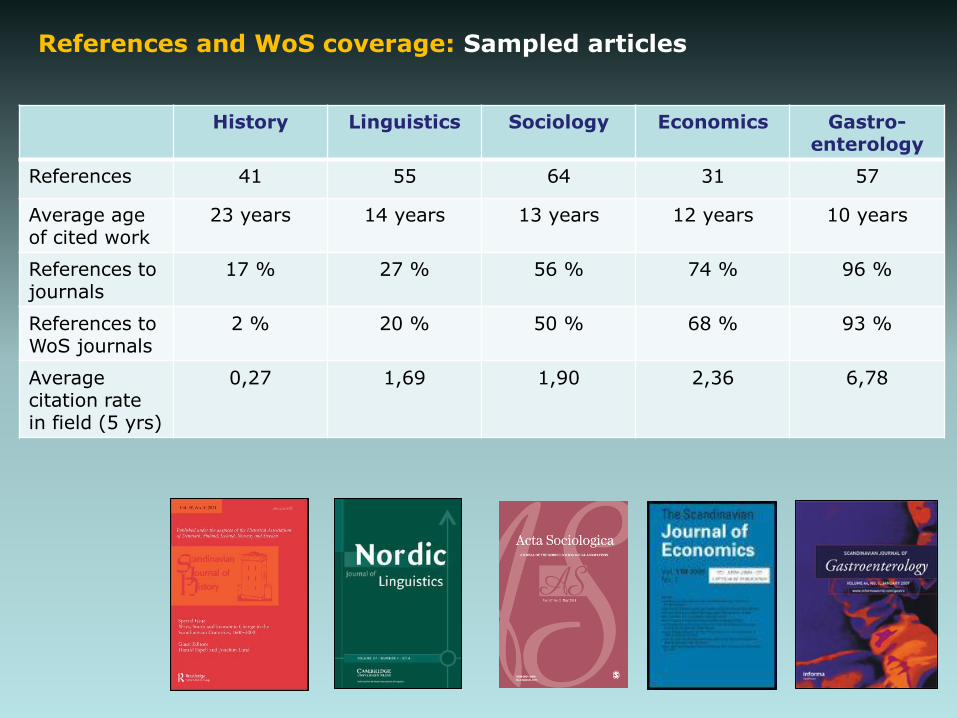
References and WoS coverage: Sampled articles
History Linguistics Sociology Economics Gastro-enterology
References 41 55 64 31 57
Average age of cited work
23 years 14 years 13 years 12 years 10 years
References to journals
17 % 27 % 56 % 74 % 96 %
References to WoS journals
2 % 20 % 50 % 68 % 93 %
Averagecitation rate in field (5 yrs)
0,27 1,69 1,90 2,36 6,78
Average number of citatons per field
0 10 20 30
HISTORY
PHILOSOPHY
LINGUISTICS
MATHEMATICS
POLITICAL SCIENCE
ECONOMICS
PSYCHOLOGY
GEOLOGY
BEHAVIORAL SCIENCES
IMMUNOLOGY
NUCLEAR PHYSICS
CELL BIOLOGY
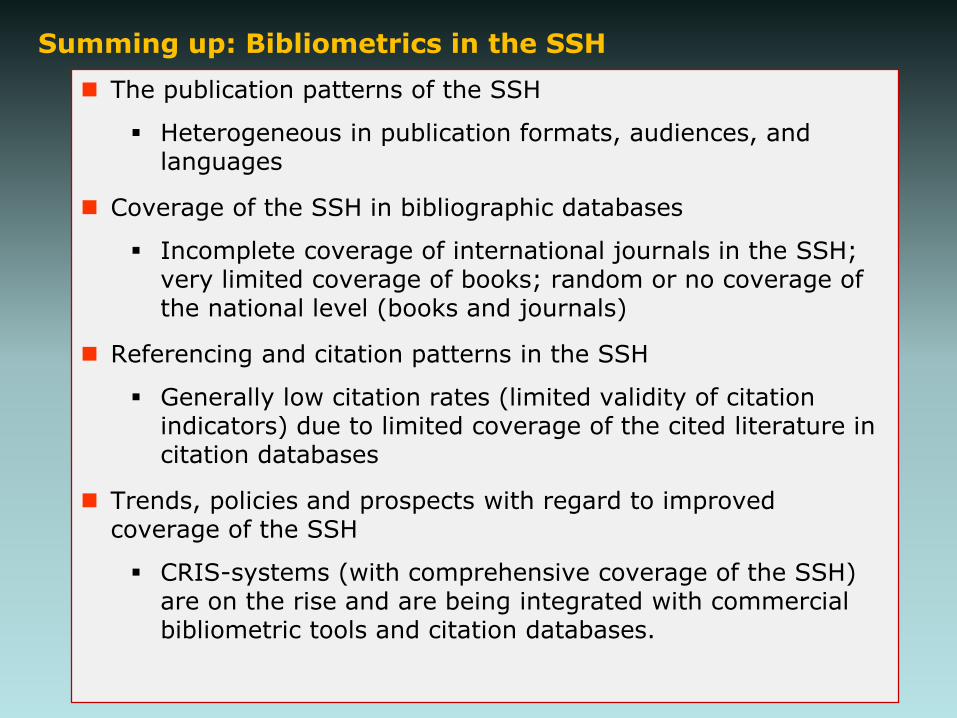
Summing up: Bibliometrics in the SSH
The publication patterns of the SSH
Heterogeneous in publication formats, audiences, and languages
Coverage of the SSH in bibliographic databases
Incomplete coverage of international journals in the SSH; very limited coverage of books; random or no coverage of the national level (books and journals)
Referencing and citation patterns in the SSH
Generally low citation rates (limited validity of citation indicators) due to limited coverage of the cited literature in citation databases
Trends, policies and prospects with regard to improved coverage of the SSH
CRIS-systems (with comprehensive coverage of the SSH) are on the rise and are being integrated with commercial bibliometric tools and citation databases.
Overview of the lecture (II)
1. Four useful types of indicators
Research activity
Research profile
Research collaboration
Impact on further research
2. Discussion I: Bibliometrics in the social sciences and humanities
3. Discussion II: Bibliometrics for research assessment
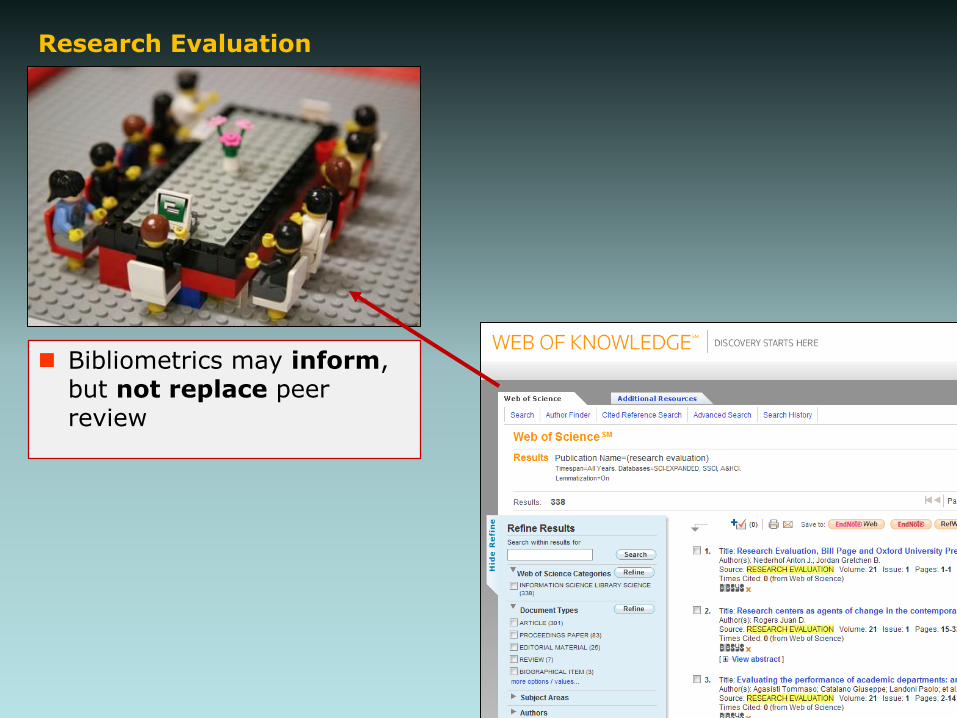
Research Evaluation
Bibliometrics may inform, but not replace peer review
2018?
2014
• Evaluation panels may be provided with bibliometrics upon request.
• Use of journal impact factors and other bibliometric indicators not supplied through the REF administration is forbidden.
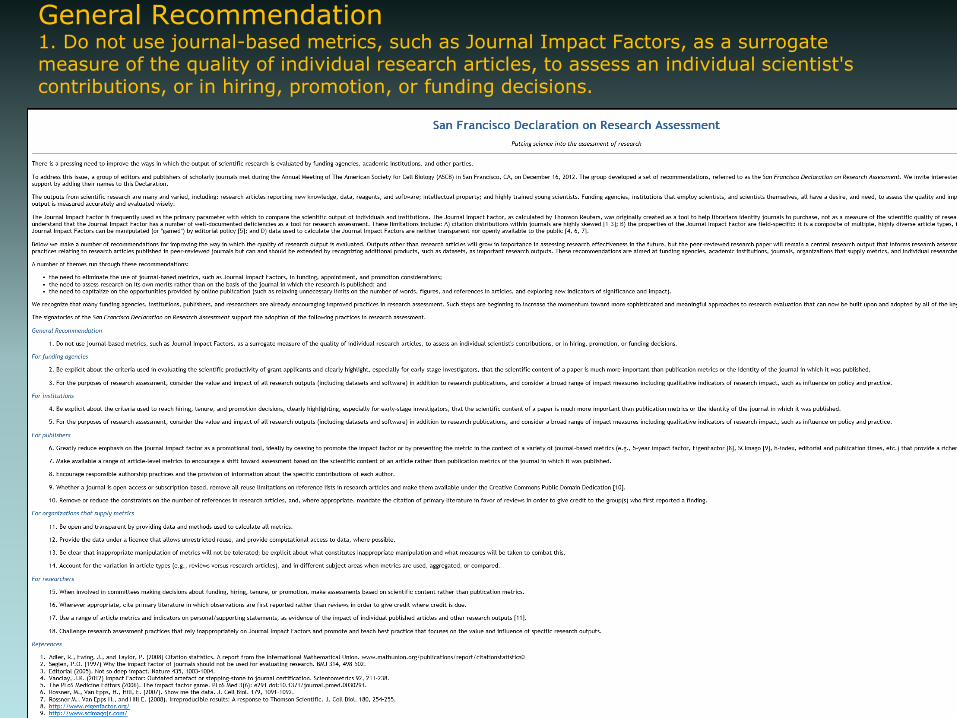
General Recommendation1. Do not use journal-based metrics, such as Journal Impact Factors, as a surrogate measure of the quality of individual research articles, to assess an individual scientist's contributions, or in hiring, promotion, or funding decisions.

The “Leiden Manifesto” (Draft September 2014)
1. Metrics properly used to support assessments; they do not substitute for judgment. Everyone retains responsibility for their assessments.
2. It is easy to underestimate the difficulty of constructing accurate data. Spend the time and money required to produce data of high quality. Those mandating use of metrics should be able to provide assurance that the data is accurate.
3. Metrics should be transparent, the construction of the data should follow a clearly stated set of rules. Everyone should have access to the data.
4. Data should be verified by those evaluated, who should be offered the opportunity to contribute explanatory notes if they wish.
5. Sensitivity to field differences is important. Metrics will differ by field. Humanists will not be able to use citation counts; computer scientists will need to ensure conference papers are included; and chemists will look the best in raw metrics constructed from Web of Science data. The state-of-the-art is to select a suite of possible indicators and allow fields to choose among them.
6. Normalize data to account for variation in citation and publication rates by field and over time.
7. Metrics should align with strategic goals.
Recommended