International Journal of Engineering Research and General Science Volume 3, Issue 3, May-June, 2015 ISSN 2091-2730
528 www.ijergs.org
A Review on the Recent Scenario of Municipal Solid Waste Management in
India
Shashikanta Keisham*, Dr Biswajit Paul
Department of Environmental Science and Engineering, Indian School of Mines Dhanbad-826004, Jharkhand, India
*Email ID: [email protected]
*Mobile No.: 8002321129
Abstract— The rapid pace of increasing population, economic growth, urbanization and industrialization is coupled with accelerated
solid waste generation. Waste generation has been a part and parcel of the development activities of mankind. Municipal Solid Waste
(MSW) is an example of socioeconomic activities that entails with solid waste generation. Management of municipal solid waste is a
national problem and is faced in all the cities of India. Two of the major problems being encountered are the insufficient collection
and inappropriate final disposal of MSW. Various collection systems employed by the municipalities collect less than half of the total
waste generated. As a result, wastes are either scattered in urban centers or disposed of in an unplanned manner in low lying areas or
open dumps, or burned by the residents in their backyards. Insufficient collection and inadequate have made the situation exasperating
due to which several environmental and health related problems are increasing. Keeping in mind of the present situation, the current
review examines the opportunities and improvements that could be brought about in MSW management (MSWM) system in the
country.
Keywords— Frameworks, Improvements, MSW, MSWM, Opportunities, Problems, Urbanization.
I. INTRODUCTION
Cities in the developing world have undergone a rapid urbanization during the past 50 years [1]. India, being the world’s second most
populous country, the level of urbanization in India has increased from 27.81 % in 2001 to 31.16 % in 2011 [2]. Urbanization in
developing countries like India implies the expansion of existing slum areas and the creation of new ones. Future need for waste
collection in slums, therefore, is likely to put additional strain on municipalities already unable to provide the service to their current
residents. The ever rising population is putting immense pressure on demand for food, shelter and other natural resources [3]. It also
intensifies the pressure on urban infrastructure in many cities already overburdened with the provision of urban services. Many cities
lack the resources to meet the demand for services such as water, sanitation, and municipal solid waste management (MSWM).
MSWM is one of the most overlooked basic services provided by the Government of India. Generation and characteristics of MSW
may vary at the level of country, state, city as well as within different areas of the same city. MSW generation rates range between 0.3
and 0.6 kg/ capita/day in Indian cities and annual increase in MSW generation (volume) is estimated as 1.33 % per capita [4].
Of the total waste generated, less than half of the waste are collected. Worldwide, over two thirds of human waste are released into the
environment with little or no treatment, resulting in a deterioration of the urban environment in the form of air, water, and land
pollution that pose risks to human health and the environment [5].
MSWM has received less attention from policymakers and academics than that paid to other urban environmental problems, such as
air pollution abatement and wastewater treatment. Nevertheless, the improper handling and disposal of solid waste constitutes a
serious problem: it contributes to the high morbidity and mortality rates in many cities. Some have emphasized the involvement and
role of a number of government stakeholders like Ministry of Environment and Forest (MoEF), Ministry of Urban Development
(MoUD), Ministry of agriculture, Ministry of New and Renewable Energy and Ministry of Non-Conventional Energy Sources
(MNES) in MSWM [6]. Besides, the involvement of formal and informal sector could help MSWM [7].
This paper examines the conditions of the current MSWM trends in India and analyzes and suggests the opportunities that exist in
improving the management of MSW in many Indian cities.
International Journal of Engineering Research and General Science Volume 3, Issue 3, May-June, 2015 ISSN 2091-2730
529 www.ijergs.org
II. MSW CHARACTERIZATION
Municipal solid waste (MSW) is waste that comes from homes, businesses, and schools. Municipal solid waste does not include
construction waste, industrial waste, or sewage waste.
MSW classification
By Material -what the waste is made of. Waste may be plastic, paper, metal, rubber, food waste, or yard waste. A plastic toy and a
plastic yogurt carton would be in the same materials category because they are both made of plastic.
By Product - what the waste was used for originally. The waste may be an old potato chip bag, a worn-out shoe, or a broken toy.
A plastic beverage container and an aluminum beverage container would be in the same product category because they are both
used as container.
Knowledge of the sources and types of waste in an area is required in order to design and operate appropriate solid waste management
systems (Table-1).
Table-1: Sources and Types of MSW
Source Typical waste generators Types of solid wastes
Residential Single and multifamily dwellings Food wastes, paper, cardboard,
plastics, textiles, leather, yard
wastes, wood,
glass, metals, ashes, special wastes
(e.g., bulky items, consumer
electronics,
white goods, batteries, oil, tires),
and household hazardous wastes
Industrial Light and heavy manufacturing,
fabrication, construction sites,
power and chemical plants
Housekeeping wastes, packaging,
food wastes, construction and
demolition materials, hazardous
wastes, ashes, special wastes
Commercial Stores, hotels, restaurants, markets,
office buildings, etc.
Paper, cardboard, plastics, wood,
food wastes, glass, metals, special
wastes, hazardous wastes
Institutional Schools, hospitals, prisons,
government centers
Paper, cardboard, plastics, wood,
food wastes, glass, metals, special
wastes, hazardous wastes
Construction and demolition New construction sites, road repair,
renovation sites, demolition of
buildings
Wood, steel, concrete, dirt, etc.
Municipal services Street cleaning, landscaping, parks,
beaches, other recreational areas,
water and wastewater treatment
plants
Street sweepings; landscape and
tree trimmings; general wastes from
parks, beaches, and other
recreational areas; sludge
Process Heavy and light manufacturing,
refineries, chemical plants, power
plants, mineral extraction and
processing
Industrial process wastes, scrap
materials, off-specification
products, slag, tailings

International Journal of Engineering Research and General Science Volume 3, Issue 3, May-June, 2015 ISSN 2091-2730
530 www.ijergs.org
As is shown in the above table, MSW includes wastes generated from residential, commercial, industrial, institutional, construction,
demolition, process, and municipal services. However, this definition varies greatly among waste studies, and some sources are
commonly excluded, such as industrial, construction and demolition, and municipal services. Most often only residential waste is
referred to as MSW [8].
2.1 Waste Generation Rates
Waste generation rates are affected by socioeconomic development, degree of industrialization, and climate. Generally, the greater the
economic prosperity and the higher percentage of urban population, the greater the amount of MSW produced. Fig-1 gives MSW
generation rates in some of the selected Indian cities.
Source: CPCB, GOI (2004-2005) [9]
Fig-1: Waste generation (kg/day) per capita in selected cities
During the year 2004-05, CPCB through NEERI, conducted survey in 59 Indian cities and estimated 39,031 tons per day MSW
generation in these 59 cities. In the year 2010-11 in these same 59 cities, a survey was conducted by the Central Institute of Plastics
Engineering and technology (CIPET) at the instance of CPCB. The report has recorded a MSW generation of 50,592 tons per day.
These results show that generation of MSW has increased by 77.1% from 2005 to 2011 in cities [10].
A very little information about rural waste generation rates is available; however, one can assume that rural populations will generate
less waste because these areas have lower per capita incomes. Urbanization and rising incomes, which lead to more use of resources
and therefore more waste, are the two most important trends that factor into rising waste generation rates. Fig-2 exemplifies this trend.
Individuals living in Indian urban areas use nearly twice as many resources per capita than those living in a rural setting because they
consume and generate more solid waste.
2.2 MSW Composition
The composition of municipal solid waste varies widely within countries, and between different seasons of the year. It is influenced by
external factors, such as geographical location, the population’s standard of living, energy source, and weather. Table-2 presents the
current MSW compositions for some of the Indian cities.
0.19
0.58
0.67
0.25
0.57
0.45 0.51
0.4 0.39 0.43
0.37
0.57
0.39
0.58 0.57
0.45
0
0.1
0.2
0.3
0.4
0.5
0.6
0.7
0.8
Waste Generation Rate (kg/c/day)

International Journal of Engineering Research and General Science Volume 3, Issue 3, May-June, 2015 ISSN 2091-2730
531 www.ijergs.org
Table-2: The composition of MSW in some of the selected Indian cities (% by weight)
Major
Cities
Paper Metal Glass Textiles Plastics*
Ash and
dust
Organic Others**
Chennai 5.90 0.70 - 7.07 - 16.35 56.24 13.74
Delhi 5.88 0.59 0.31 3.56 1.46 22.95 57.71 7.52
Kolkata 0.14 0.66 0.24 0.28 1.54 33.58 46.58 16.98
Bangalore 1.50 0.10 0.20 3.10 0.90 12.00 75.00 7.20
Ahmedabad 5.15 0.80 0.93 4.08 0.69 29.01 48.95 10.39
Mumbai 3.20 0.13 0.52 3.26 - 15.45 59.37 18.07
Source: Planning Commission on Urban Solid Waste Management in India”, GOI (1995) [11]
*includes rubber and leather
**includes bones, stones and woody matter
2.3 Recent Trends in MSWM in India
MSW quantities are inextricably linked to economic activity and resource consumption. If the lagging non-OECD (Organization for
Economic Co-operation and Development) countries are able to transition to a sustainable higher growth path, the global poverty ratio
will fall from about 21 percent in 2005 to less than 2.5 percent in 2050 [12]. As the economy prospers, the overall MSW generation
rates will dramatically increase.
The importance of proper solid waste management is one of the prime functions of the civic body, as insanitary management of solid
wastes is a cause of much discomfort. Since waste management is a fundamental requirement for public health. Article 48-A of the
Indian Constitution establishes the responsibility of the state to manage these wastes properly. [13-15]
About 0.1 million tonnes of municipal solid waste is generated in India every day. That is approximately 36.5 million tonnes
annually.
Per capita waste generation in major Indian cities ranges from 0.2 Kg to 0.6 Kg.
Difference in per capita waste generation between lower and higher income groups range between 180 to 800 gm per day.
The urban local bodies spend approximately Rs.500 to Rs.1500 per tonne on solid waste for collection, transportation, treatment
and disposal. About 60-70% of this amount is spent on collection, 20-30% on transportation and less than 5% on final disposal.
Calorific value of Indian solid waste is between 600 and 800 Kcal/Kg and the density of waste is between 330 and 560 Kg/m3.
Out of the total municipal waste collected, on an average 94% is dumped on land and 5% is composted.
Between 2000 and 2025 the waste composition of Indian garbage will undergo the following changes:
o Organic Waste will go up from 40 percent to 60 percent
o Plastic will rise from 4% to 6%
o Metal will escalate from 1% to 4%
o Glass will increase from 2% to 3%
o Paper will climb from 5% to 15%
o Others (ash, sand, grit) will decrease from 47% to 12%
III. ENVIRONMENTAL AND HEALTH IMPACTS OF IMPROPER MSWM
Improper MSWM causes all types of pollution, whether be it air, soil, or water. It does not end here. Their impacts on economy,
environment and society are mentioned in Table-3.

International Journal of Engineering Research and General Science Volume 3, Issue 3, May-June, 2015 ISSN 2091-2730
532 www.ijergs.org
Table-3: Economic, Environment and Social impacts of MSWM
Economic impacts Environment impacts Social impacts
Function of the internal market
Investment costs
Operating costs
Administrative burdens
Public authorities
Property rights innovation and
research
Economic effects on
consumers and households
Economic effects on industry
and business
Climate
Energy
Air quality
Biodiversity, flora, fauna, and
landscapes
Water quality and resources
Soil quality or resources
Land use
Renewable or non-renewable
resources
Environmental consequences
of firms and consumers
Likelihood or scale of
environmental risks
Animal welfare
Social inclusion and protection
of particular groups
Non-discrimination
Individuals, private and family
life, personal data
Governance, participation,
good administration, access to
justice, media, and ethics
Public health and safety
Security
Access to and effects on social
protection, health, and
educational systems
Culture
People know that poor sanitation affects their health, and nowhere is this link more apparent than in developing countries like India.
MSW that is not properly managed, especially excreta and other liquid and solid waste from households and the community, are a
serious health hazard and lead to the spread of infectious diseases. Unattended waste lying around attracts flies, rats, and other
creatures that in turn spread disease.
Table-4: Occupational hazards associated with waste handling
Infections
Chronic diseases
Accidents
Skin and blood infections
resulting from direct contact
with waste, and from infected
wounds.
Eye and respiratory infections
resulting from exposure to
infected dust, especially during
landfill operations.
Different diseases that results
from the bites of animals
feeding on the waste.
Intestinal infections that are
transmitted by flies feeding on
the waste.
Incineration operators are at
risk of chronic respiratory
diseases, including cancers
resulting from exposure to dust
and hazardous compounds.
Bone and muscle disorders
resulting from the handling of
heavy containers.
Infecting wounds resulting
from contact with sharp
objects.
Poisoning and chemical burns
resulting from contact with
small amounts of hazardous
chemical waste mixed with
general waste.
Burns and other injuries
resulting from occupational
accidents at waste disposal
sites or from methane gas
explosion at landfill sites.
International Journal of Engineering Research and General Science Volume 3, Issue 3, May-June, 2015 ISSN 2091-2730
533 www.ijergs.org
IV. FUNCTIONAL ELEMENTS OF MSWM
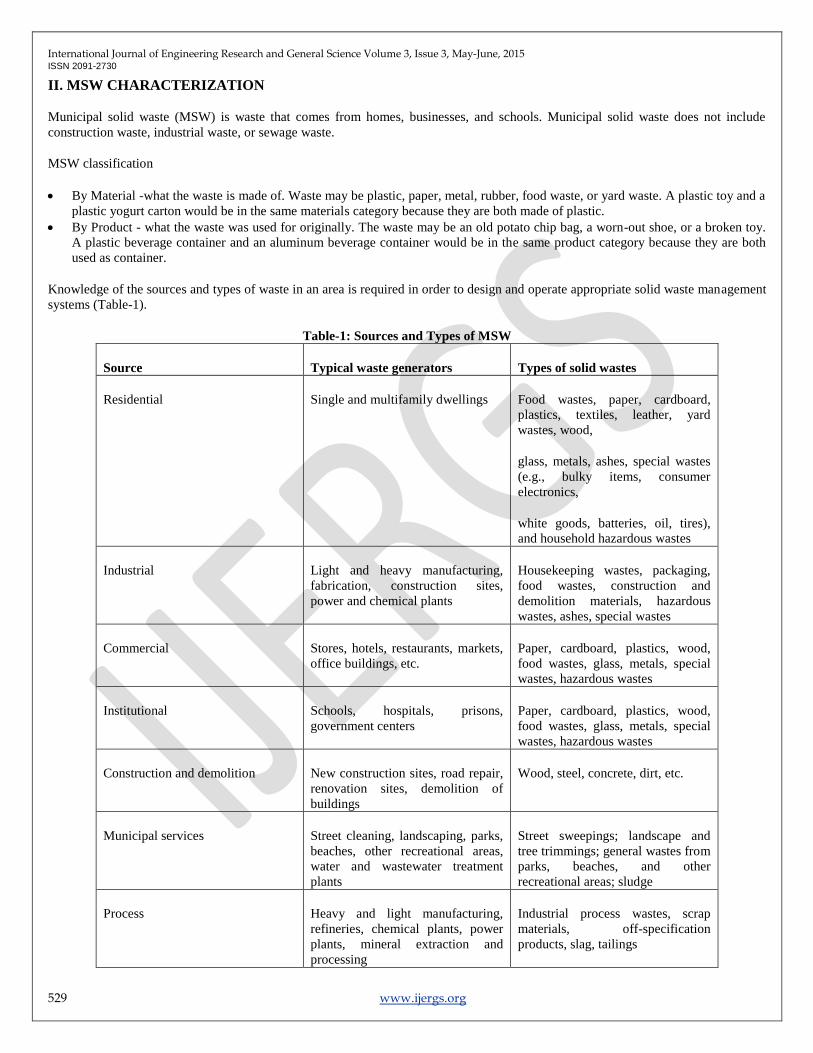
To implement proper MSWM, various aspects have to be considered such as waste generation, storage and collection, processing,
transfer and transport, and disposal and disposal options. Fig-2, shows the interrelationship between the functional elements in
MSWM.
Fig-2: The interrelationship between the functional elements in MSWM
4.1 Waste Generation and Its Storage
Storage of MSW at the source is substantially lacking in most of the urban areas [16]. Municipal Solid Waste is commonly stored in
circular concrete open bins in India. There have hardly been any studies conducted on the most suitable type of storage bin for the
Indian waste. The waste should be preferably stored in closed bins and for not more than 24 hours, as the Indian waste has high
organic content and is highly putrescible [17].
4.2 Waste Collection
The collection of MSW is the responsibility of corporations/municipalities. The waste collection methods that are mainly adopted in
India are given in Table-5 with their key features.
Table-5: Key Points Concerning Main Collection Systems
System Description Advantages Disadvantages
Community Bins Users bring their garbage
to community bins that
are placed at fixed points
in a neighborhood or
locality. MSW is picked
up by the municipality, or
its designate, according to
a set schedule.
Low capital costs Loading the waste into
trucks is slow and
unhygienic. Waste is
scattered around the
collection point. Adjacent
residents and shopkeepers
protest about the smell
and appearance.

International Journal of Engineering Research and General Science Volume 3, Issue 3, May-June, 2015 ISSN 2091-2730
534 www.ijergs.org
House-to-House Waste collector knocks on
each door or rings
doorbell and waits for
waste to be brought out
by resident.
Convenient for resident.
Little waste on street.
Residents must be
available to hand waste
over. Not suitable for
apartment buildings
because of the amount of
walking required.
Curbside Pick-Up Waste is left outside
property in a container
and picked up by passing
vehicle, or swept up and
collected by sweeper.
Convenient. No
permanent public storage.
Waste that is left out may
be scattered by wind,
animals, children or waste
pickers.
If collection service is
delayed, waste may not be
collected or some time,
causing considerable
nuisance.
Block Collection Collector sounds horn or
rings bell and waits at
specified locations for
residents to bring waste to
the collection vehicle.
Economical. Less waste
on streets. No permanent
container or storage to
cause complaints.
If all family members are
out when collector comes,
waste must be left outside
for collection. It may be
scattered by wind,
animals and waste
pickers.
Community Bins has been the most commonly adopted method in India [7]. Efforts to organize house-to-house collection method are
just starting in many cities such as Delhi, Mumbai, Bangalore, Madras and Hyderabad with the help of NGOs. A case study conducted
on door-to-door collection through RWAs and NGOs in Ahmedabad met with success. Ahmedabad has a population of 4 million and
its average rate of waste generation is 2,096 metric tonnes per day. The city estimated that 3,900 sanitary workers would be required
for ensuring door-to-door collection. So the municipal corporation sought for applications from RWAs and NGOs. The entire city is
now covered in door-to-door collection after less than six months of concerted effort [18]. The same system has been adopted in
Chennai [19]. From these studies, it has been observed that the door to collection method has improved the efficiency of collection of
segregated waste.
Many studies on urban environment have revealed that MSW collection efficiency is a function of two major factors: manpower
availability and transport capacity [20]. The collection efficiency ranges between 70 to 90% in major cities and states, where private
contractors and NGOs are employed for the collection and transportation of MSW whereas in several smaller cities the collection
efficiency is below 50% [21].
On the basis of the available data, it is estimated that the nine major metropolitan centers in India are presently producing 23,000
tonnes of solid waste per day. As per recent estimates Bangalore generates about 3,600 tonnes per day and Table-6 provides
comparative details about garbage generated and cleared in nine major Indian cities [22].
Table-6: Urban Waste situation in some major Indian cities [23]
Major Cities Garbage Generated (tonnes/day) Garbage Cleared (tonnes/day)
Mumbai 5800 5000
Kolkata 3500 3150
Chennai 2675 2140
Delhi 3880 2420
Bangalore 2130 1800
International Journal of Engineering Research and General Science Volume 3, Issue 3, May-June, 2015 ISSN 2091-2730
535 www.ijergs.org
Lucknow 1500 1000
Patna 1000 300
Surat 1250 1000
Ahmedabad 1500 1200
4.3 Transfer & Transportation of MSW
The MSW collected in pushcarts from lanes is transferred to a truck at a meeting point called a synchronization point [24]. The most
common method for transfer in most of the areas is manual transfer from community bin to trucks by 2 to 3 workers [14]. In
Ahmedabad, door-to-door collection method is adopted [18]. Here Waste collector knocks on each door or rings doorbell and waits for
waste to be brought out by resident [25].
After the collection, the truck arrives at the designated point at a specified time and place. The waste is transported to the disposal site
by means of a large capacity tipper truck, and in a few wards by a small capacity tipper truck or dumper placers. The truck is covered
with a mesh and a polythene sheet to prevent scattering [26].
Collection and transportation activities constitute approximately 80–95% of the total budget of MSWM; hence, it forms a key
component in determining the economics of the entire MSWM system [27].
4.4 MSW Disposal and Treatment Process
Waste treatment techniques seek to transform the waste into a form that is more manageable, reduce the volume or reduce the toxicity
of the waste thus making the waste easier to dispose of. Treatment methods are selected based on the composition, quantity, and form
of the waste material. Some waste treatment methods being used today include subjecting the waste to extremely high temperatures,
dumping on land or land filling and use of biological processes to treat the waste [25].
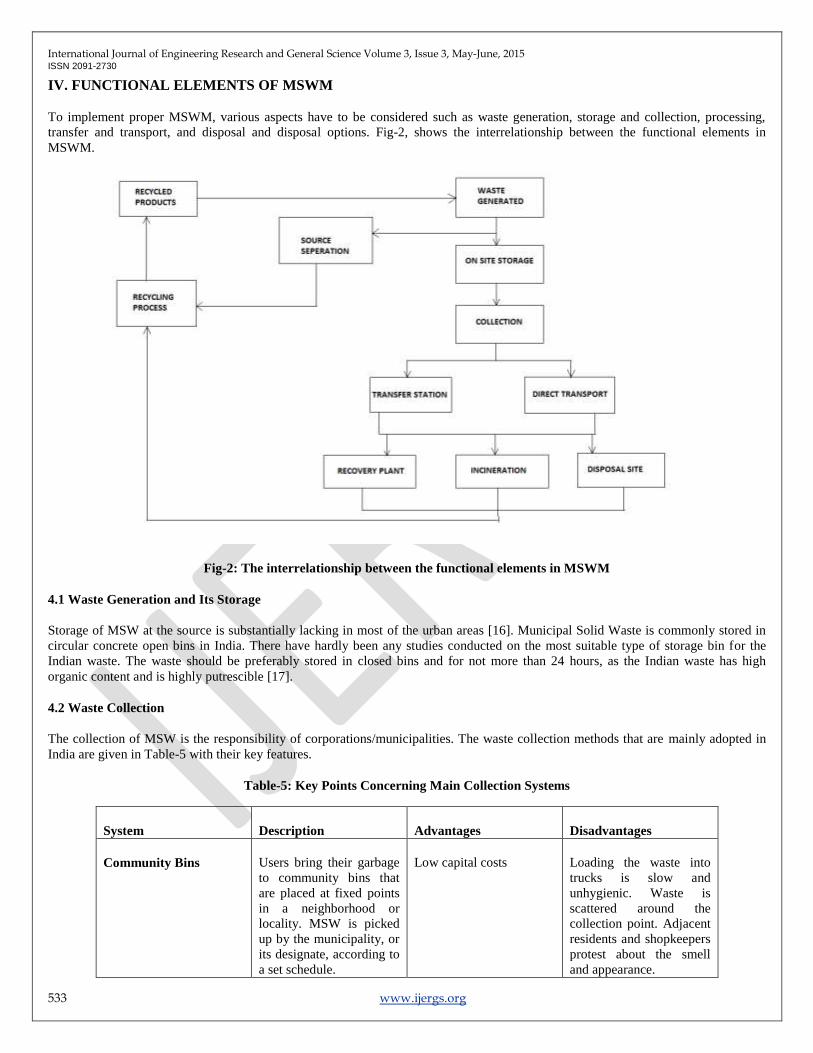
The waste management sector follows a generally accepted hierarchy. The hierarchy started as the ‘three Rs’ — reduce, reuse, recycle
— but now a fourth R is frequently added — recovery. The hierarchy responds to financial, environmental, social and management
considerations. The hierarchy also encourages minimization of GHG emissions [28]. The waste hierarchy is shown in Fig-3.
Fig-3: A hierarchy of solid waste management
Landfill
Compost/incinerate with heat recovery
Recycle Materials
Reuse
Reduce the amount of waste
I
NC
REA
SE IN
PR
EFER
AB
ILIT
Y

International Journal of Engineering Research and General Science Volume 3, Issue 3, May-June, 2015 ISSN 2091-2730
536 www.ijergs.org
The general principle of this hierarchy is to move the waste management down the hierarchy recycle, reuse and reduce. They are then
followed by incineration and landfill, or other disposal options
4.4.1 Landfilling
A landfill is an area of land onto or into which waste is deposited. The aim is to avoid any contact between the waste and the
surrounding environment, particularly the groundwater. More than 90% of MSW generated in India is directly disposed of on open
land in an unsatisfactory manner, giving rise to serious environmental degradation, and numerous health and aesthetic hazards [29,
30]. These methods are not in accordance with the practices of sanitary landfilling. The pollution of groundwater, though largely
unassessed, is definitely a threat posed by the dumping of wastes. Such dumping activity in many coastal towns has led to heavy
metals rapidly leaching into the coastal waters [31].
In larger towns or cities like Delhi, the availability of land for waste disposal is very limited [31]. However, now landfilling is the
most preferred method of disposal of solid wastes as it is an effective and low cost method of disposal [32] and, it appears that
landfilling would continue to be the most widely adopted practice in India in the coming few years, during which certain
improvements will have to be made to ensure the sanitary landfilling and not merely dumping of waste [33]. Sanitary landfill is a fully
engineered disposal option, which avoids harmful effects of uncontrolled dumping by spreading, compacting and covering the
wasteland that has been carefully engineered before use. Through proper site selection, preparation and management, operators can
minimize the effects of leachates (polluted water which flows from a landfill) and gas production both in the present and in the future.
In this process the waste is disposed and is covered with a layer of soil. The compact layer of soil restricts continued access to the
waste by insects, rodents and other animals. It also isolates the refuse, minimizing the amount of surface water entering into and gas
escaping from the waste [34].
4.4.2 Composting
Composting is a firm of recycling of MSW. The composting of waste can help decrease the volume of waste to 50-85% that must be
sent to a landfill or combustor, thereby reducing disposal costs. At the same time, composting yields a valuable product that can be
used by farmers, landscapers, horticulturists, government agencies, and property owners as a soil amendment or mulch. The compost
product improves the condition of soil reduces erosion, and help suppress plant diseases [35].
This is a popular technique in Europe and Asia, where intense farming creates a demand for the compost [36].
Table-7: Different Classes of Population
Population Class No of Cities
>10,00,000 and above (metro only) 35
>1,00,000 and above Class I 393
50,000-99,999 Class II 401
20,000-49,999 Class III 1115
10,000-19,999 Class IV 1344
5,000-9,999 Class V 888
>5,000 Class VI 191
Unclassified 10
4377
Source: CPCB, GOI (2004-2005) [37]
In Class II, Class III and Class IV cities (shown in Table-) an urban agricultural set up exists and functions, where there is optimal use
of municipal solid waste. The farmers buy the organic waste from the municipality at very low costs and use it as manure. There are

International Journal of Engineering Research and General Science Volume 3, Issue 3, May-June, 2015 ISSN 2091-2730
537 www.ijergs.org
also companies that have taken over the responsibility segregating, decontaminating and composting MSW. This high quality compost
is then sold to the farmers at a very high cost compared to the raw MSW. It has been observed that the farmers prefer the raw MSW to
the processed high quality compost, because the latter is too expensive [24].
In 1974, GOI introduced modified scheme to revive MSW composting, particularly in cities with a population over 0.3 million. As far
as large-scale composting is concerned, many mechanical compost plants with capacities ranging from 150 to 300 t/day were set up in
the cities of Bangalore, Baroda, Mumbai, Calcutta, Delhi, Jaipur and Kanpur during 1975–1980 under the central scheme of MSW
disposal. The composting was done successfully for many years up to 1980, but after that the compost from MSW was not used for
soil enrichment due to many problems. Now, about 9% of MSW is treated by composting [7].
Few large-scale composting plants around India are running successfully. For e.g. composting plant in Hyderabad run by AP
technology development and promotion center (intake of 200MT/day, composting plant in Vijaywada by Exel industries (intake of
125 MT/day), composting plant in Bangalore by Karnataka Compost Development Authority (KCDC)(intake of 300MT/day) and
composting plant in Bangalore by Terra Firma Biotechnologies (100MT capacity). All these compost plants have a high demand for
their products and want to increase their processing capacity to meet the huge demand. The awareness for organic manure is
increasing rapidly in India that will in turn increase the demand for the manure produced from MSW [24].
4.4.3 Incineration
Incineration is an efficient way to reduce the waste volume and demand for landfill space. Incineration plants can be located close to
the center of gravity of waste generation, thus reducing the cost of waste transportation. Using the ash from MSW incinerators for
environmentally appropriate construction not only provides a low cost aggregate but further reduces the need for landfill capacity.
However, Municipal solid waste (MSW) incineration plants tend to be among the most expensive solid waste management options,
and they require highly skilled personnel and careful maintenance. For these reasons, incineration tends to be a good choice only when
other, simpler, and less expensive choices are not available [38].
Table-8: Municipal solid waste composition
Major cities Compostables
(%)
Recyclables
(%)
C/N Ratio HCV*
(Kcal/Kg)
Moisture
(%)
Imphal 60.00 18.51 22.34 3766 40
Jammu 51.51 21.08 26.79 1782 40
Kochi 57.34 19.36 18.22 591 50
Ranchi 51.49 9.86 20.23 1060 49
Coimbatore 50.06 15.52 45.83 2381 54
Amritsar 65.02 13.94 30.69 1836 61
Agra 46.38 15.79 21.56 520 28
Bhopal 52.44 22.33 21.58 1421 43
Jaipur 45.50 12.10 43.29 834 21
Kanpur 47.52 11.93 27.64 1571 46
Ahmedabad 40.81 11.65 29.64 1180 32
Hyderabad 54.20 21.60 25.90 1969 46
Bangalore 51.84 22.43 35.12 2386 55

International Journal of Engineering Research and General Science Volume 3, Issue 3, May-June, 2015 ISSN 2091-2730
538 www.ijergs.org
Kolkata 50.56 11.48 31.81 1201 46
Delhi 54.42 15.52 34.87 1802 49
Greater
Mumbai
62.44 16.66 39.04 1786 54
Source: CPCB, GOI (2004-2005) [9]
In India the incineration is a poor option as the waste consists mainly high organic material (40–60%) and high inert content (30–50%)
also low calorific value content (800–1100 kcal/kg), high moisture content (40–60%) in MSW and the high costs of setting up and
running the plants [39]. however Small incinerators, in many cities in India, are being used for burning hospital waste [40].
4.4.4 Re-Use and Recycle of MSW
Re-use consists of the recovery of items to be used again, perhaps after some cleaning and refurbishing. Re-using materials and
products saves energy and water, reduces pollution, and lessens society’s consumption of natural resources compared with the use of
single-application products and materials [1].
After the re-use of materials and products, recycling comes next in the integrated waste management hierarchy [1]. Recycling is the
reprocessing of discarded materials into new useful product. The process of reusing of cans can save money. Recycling of paper will
reduce of cutting of tress. Reuse of metals will reduce the mining activities. In India about 40-80% of plastic waste is recycled
compared to 10-15% in the developed nations of the world. However the recovery rate of paper was 14% of the total paper
consumption in 1991, while the global recovery rate was higher at 37% [34].
V. REGULATORY & LEGAL FRAMEWORK FOR MSWM IN INDIA
In September 2000, the Ministry of Environment and Forests issued the Municipal Solid Waste (Management and Handling) Rules
2000 under the Environment Protection Act 1986. The 2000 Rules lay down the steps to be taken by all municipal authorities to
ensure management of solid waste according to best practice. Municipal authorities must meet the deadlines laid down in Schedule I
of the rules and must follow the compliance criteria and procedure laid down in Schedule II. The deadline for implementing Schedule
I of 2000 rules has already passed and the compliance is far from effective. Some cities and towns have not even started implementing
measures that could lead to compliance with the rules (Table-9) [18].
Table-9: The Four Steps of Schedule I of the 2000 Rules
Steps Completion date
1. Set up waste processing and disposal facilities December 2003 or earlier
2. Monitor the performance of processing and disposal
facilities
Once every 6 months
3. Improve existing landfill sites as per provision of the
rules
December 2002 or earlier
4. Identify landfill sites for future use and make sites
ready for operation
December 2002 or earlier
Source: ministry of environment and forests 2000 [41]
The status of the 2000 Rules is shown as percentage of compliance in Fig-4.

International Journal of Engineering Research and General Science Volume 3, Issue 3, May-June, 2015 ISSN 2091-2730
539 www.ijergs.org
Source: Asnani (2004a) [42]
Fig-4: Compliance with the 2000 Rules
Some more rules, regulations and acts in India that are applicable regarding the management of MSW are explained below:
1) The Water (Prevention and Control of Pollution) Act, 1974 (amended 1988)
Under the provisions of this act, it is necessary that
a) for the establishment of a sanitary landfill site and compost plant consent from the approval of the concerned state pollution control
board (SPCB) is essential, and
b) the leachate emitted from either a sanitary landfill site or a compost plant should cause no water pollution.
2) The Water (Prevention and Control of Pollution) Cess Act, 1977 (amended 1992, 2003)
Under its provision regarding MSWM, there would be levying and collection of cess on water consumed for the purpose of either
sanitary land filling, composting or anaerobic digesters.
3) The Air (Prevention and Control of Pollution) Act, 1981 (amended 1987)
Under this act, the aspects to be considered regarding MSWM is the need for obtaining consent from the State Pollution Control Board
(SPCB) for establishment of processing plants and disposal sites and the pollution caused by incineration plants, compost plants and
landfill sites must be kept under its purview.
4) The Environmental (Protection) Act, 1986 (amended 1991)
Before starting any project in an area whether be it landfill site, composts plant or anaerobic digesters, an Environment Impact
Assessment (EIA) report should be submitted first to the concerned government officials. Purportedly it is done to check any
avoidable environmental disasters.
5) Plastic Waste (Management and Handling) Rules, 2011
The aspects in these rules regarding MSWM that have to be considered are that the Municipality would be responsible for engaging
agencies or groups working in solid waste management and ensuring that open burning of plastic waste is not permitted.
VI. CONCLUSION AND DISCUSSION
It can be very safely conclude that MSWM system in India is unsatisfactory. Although the economic condition of our country is poor,
we have to handle the problem for the benefits of the whole public. To tackle the problems with maximum possible effectiveness, the
41
33 38
72
29
52
9 1.4 0
10
20
30
40
50
60
70
80
PER
CEN
TAG
E O
F C
OM
PLI
AN
CE
(%)

International Journal of Engineering Research and General Science Volume 3, Issue 3, May-June, 2015 ISSN 2091-2730
540 www.ijergs.org
country should develop area-specific solutions to their problems in the management of MSW. Most importantly we cannot ignore the
fact that the country is progressing towards developing sound institutions and proactive policies regarding MSW. The way forward is
to build on the strengths and work on the weaknesses of the current system. This analysis suggests a number of priority actions to
move towards an increasingly integrated and sustainable MSWM system in India:
During segregation of MSW, the collection of organic waste, which comprises 60% wt. of MSW, for either composting or
anaerobic digestion should be encouraged
Increasing recycling rates and maximizing diversion of waste from landfill disposal, by introducing effective schemes to integrate
both NGOs and the formal and local sectors into MSWM practices and to raise public awareness on the importance of recycling.
Focusing on waste reduction and recovery.
Integrating all stakeholders, and encouraging full community participation in the planning and implementation of MSWM
practices.
Developing an improved data collection and management system by the concerned authorities, so that future planning is based on
sound data.
Regular activities such as clean-up of the neighborhoods, schools, parks and roadsides can be effective in changing the
‘‘NIMBY’’ attitudes even among the poor communities.
Drawing sponsors from Ministry of Environment and Forests (MoEF), Ministry of New and Renewable Energy (MNRE),
Ministry of Health, NGOs and various private organizations.
ACKNOWLEDGEMENT
The authors are thankful to all the faculty members of the Department of Environmental Science and Engineering, Indian School of
Mines Dhanbad for guiding us and going with us all along during the entire course of the project. Especially, we would like to thank
Dr Alok Sinha and Dr Vipin Kumar Singh of the above mentioned department, without whose guidance the project could not have
been completed.
REFERENCES:
[1] Medina, M., 2010. Solid Wastes, Poverty and the Environment in Developing Country Cities: Challenges and Opportunities.
Working Paper No. 2010/23. ISBN 978-92-9230-258-0.
[2] Singh, G., 2014. Urbanization Trend and Pattern in India: Census 2011 and Beyond. Accessed from www.urbanecology.in on
05/05/2015. (URL: http://urbanecology.in/2014/10/10/urbanisation-trend-and-pattern-in-india-census-2011-and-beyond/).
[3] Johannesburg Summit, 2002. World Summit on Sustainable Development, 26 AUGUST–4 SEPTEMBER 2002. (URL:
http://www.un.org/jsummit/html/brochure/brochure12.pdf).
[4] Pattnaik, S., Reddy, M.V., 2010. Assessment of municipal solid waste management in Puducherry (Pondicherry), India. Resources,
Conservation and Recycling 54(2010) 512–520.
[5] Suez Lyonnaise des Eaux, 1998. Alternative Solutions for Water Supply and Sanitation in Areas with Limited Financial
Resources. Nanterre: Suez Lyonnaise des Eaux.
[6] Joseph, K., Rajendiran, S., Senthilnathan, R., Rakesh, M., 2012. Integrated approach to solid waste management in Chennai: An
Indian metro city. J Mater Cycles Waste Manag (2012) 14:75–84.
[7] Sharholy, M., Ahmad, K., Mahmood, G., Trivedi, R.C., 2008. Municipal solid waste management in Indian cities - A review.
Waste Management 28 (2008) 459–467.
[8] What a Waste: Solid Waste Management in Asia, 1999. Urban Development Sector Unit East Asia and Pacific Region.
[9] Accessed from CPCB Website on 08/05/2015. (URL: http://cpcb.nic.in/wast/municipalwast/Waste_generation_Composition.pdf).
[10] Bhat, J. A., Choudhary, R. Challenges of Urbanisation in India: A Review of Solid Waste Management.

International Journal of Engineering Research and General Science Volume 3, Issue 3, May-June, 2015 ISSN 2091-2730
541 www.ijergs.org
[11] GOI, 1995. Urban Solid Waste Management in India: Report of High Power Committee, Planning Commission and Government
of India, Delhi.
[12] Hillebrand, E., 2009. Poverty, growth, and inequality over the next 50 years. FAO Expert Meeting on How to feed the World in
2050.
[13] Central Pollution Control Board (CPCB), 2000. Status of Municipal Solid Waste: Generation Collection Treatment and Disposal
in Class I cities. The Ministry of Urban Development of India.
[14] The Expert Committee, 2000. Manual on Municipal Solid Waste Management (first edition). The Ministry of Urban
Development of India.
[15] Agarwal, R. 2001. Urban waste: Status, trends and interventions. Personal Communication with Dr. A. K. Tripathy. The Ministry
of Non-conventional Energy Sources of India.
[16] Bandyopadhyay, S. Smart Meters for Accounting Smart Solid Waste Management for Smart Cities in India.
[17] Kumar, R., 2012. Waste Management and Clean Mechanism Development. Accessed from www.booksie.com on 07/05/2015.
(URL: http://www.booksie.com/other/article/rohit_kumar/waste-management-and-clean-development-machanism).
[18] Zhu, D., Asnani, P.U., Zurbrugg, C., Anapolsky, S., Mani, S. Improving Municipal Solid Waste Management in India: A
Sourcebook for Policymakers and Practitioners. ISBN: 978-0-8213-7361-3.
[19] IPE, 2004. Study of Management of Solid Waste in Indian Cities. Twelfth Finance Commission, Government of India.
[20] Kothari, R., Kumar, V., Panwar, N.L., Tyagi, V.V. Sustainable Bioenergy Production. ISBN-13: 978-1-4665-0552-0.
[21] Patil, A., 2011. Waste Management: Various Aspects in city of Pune, India. PLEA 2011 – 27th Conference on Passive and Low
Energy Architecture, Belgium. ISBN: 978-2-87463-276-1.
[22] Gerlagh, R., Beukering, P.V., Verma, M, Yadav, P.P., Pandey, P., 1999. Integrated Modelling of Solid Waste in India.
[23] Accessed from (URL: http://wgbis.ces.iisc.ernet.in/energy/SWMTR/content2.html).
[24] Ramachandra, T.V., Bachamanda, S., 2007. Environmental audit of Municipal Solid Waste Management. Int. J. Environmental
Technology and Management, Vol. 7, Nos. 3/4, 2007, pp 369-391.
[25] Solid waste management. Accessed from www.cyen.org on 07/05/2015. (URL:
http://www.cyen.org/innovaeditor/assets/Solid%20waste%20management.pdf).
[26] Madhav, R., 2010. Untapped Potential: Securing livelihoods dependant on ‘Waste’: A Review of Law and Policy in India. (URL:
http://wiego.org/sites/wiego.org/files/resources/files/wp_final_report.pdf).
[27] Chatri, A.K., Aziz, A., 2012. Public Private Partnerships in Municipal Solid Waste Management: Potential and Strategies.
[28] Hoornweg, D., Bhada-Tata, P., 2012. What a Waste: A Global Review of Solid Waste Management.
[29] Das, D., Srinivasu, M., Bandyopadhyay, M., 1998. Solid state acidification of vegetable waste. Ind. J. Environ. Health, 40 (4):
333-342.
[30] Ambulkar, A. R., Shekdar, A. V., 2004. Prospects of biomethanation technology in the Indian context: a pragmatic approach.
Resources, Conservation and Recycling 40, Issue 2, 111-128.
International Journal of Engineering Research and General Science Volume 3, Issue 3, May-June, 2015 ISSN 2091-2730
542 www.ijergs.org
[31] Kaushal, R.K., Varghese, G.K., Chabukdhara, M., 2012. Municipal Solid Waste Management in India-Current State and Future
Challenges: A Review. Rajendra Kumar Kaushal et al. / International Journal of Engineering Science and Technology (IJEST).
[32] Nissim, I., Shohat, T., Inbar, Y., 2005. From dumping to sanitary landfills – solid waste management in Israel. Waste
Management 25, Issue 3, 323-327.
[33] Ramteke, D.S. Reclamation & Remediation of Solid Waste through Bio-chemical process. ISBN: 978-90-481-3677-3 (HB).
[34] Rajput, R., Prasad, G., Chopra, A.K., 2009. Scenario of solid waste management in present Indian context. Caspian J. Env. Sci.
2009, Vol. 7 No.1 pp. 45-53.
[35] Composting of Yard Trimmings and Municipal Solid Waste, 1994. U.S. Environmental Protection Agency Office of Solid Waste
and Emergency Response.
[36] Schneider, W. J., 1970. Hydrologic Implications of Solid-Waste Disposal. U.S. Geological Survey Circular 601-F.
[37] Accessed from CPCB Website on 08/05/2015. (URL: http://cpcb.nic.in/Local_Bodies.php).
[38] Decision Makers’ Guide to Municipal Solid Waste Incineration, 1999. The World Bank Washington, D.C.
[39] Kansal, A., 2002. Solid waste management strategies for India. Indian Journal of Environmental Protection 22 (4), 444–448.
[40] Lal, A.K., 1996. Environmental status of Delhi. Indian Journal of Environmental Protection 16 (1), 1–11.
[41] Government of India, 2000. The Municipal Solid Wastes (Management and Handling) Rules, 2000. Ministry of Environment and
Forests of India.
[42] Asnani, P. U. 2004a. Status of Compliance of Municipal Solid Waste (Management and Handling) Rules 2000 in 127 Class 1
Cities in India as on 1-4-04. Paper presented at the National Training Programme on Design, Construction, and Operation of Sanitary
Landfills, jointly organized by the Government of India, the Central Pollution Control Board, the United States–Asia Environmental
Program, and the Water and Sanitation Programme of the World Bank, at Panaji, Goa, India
Recommended


![International Journal of Engineering Research and General ...pnrsolution.org/Datacenter/Vol3/Issue1/25.pdf · ... [15] were proposed for MIMO-OFDM systems. ... modulation to improve](https://img.pdfslide.us/doc/110x75/5aafe75a7f8b9adb688e37fd/international-journal-of-engineering-research-and-general-15-were-proposed.jpg)