Embed Size (px)
Citation preview

Journal of Knowledge Management, Economics
and Information Technology


Journal of Knowledge Management, Economics
and Information Technology
v
Volume III, Issue 3 June, 2013
www.scientificpapers.org
Copyright © 2013 by Scientific Papers and individual contributors. All rights reserved. Scientific Papers holds the exclusive copyright of all the contents of this journal. In accordance with the international regulations, no part of this journal may be reproduced or transmitted by any media or publishing organs (including various websites) without the written permission of the copyright holder. Otherwise, any conduct would be considered as the violation of the copyright. The contents of this journal are available for any citation, however, all the citations should be clearly indicated with the title of this journal, serial number and the name of the author.
Edited and printed by Scientific Papers @ 2013.
Editorial Board: Mariana IOVIŢU, Adrian GHENCEA, Claudiu POPA
ISSN 2247-‐7756
ISSN 2247-7756
Scientific Board Members Prof. Mariana IOVIŢU, PhD. – Academy of Economic Studies, Romania
Prof. Florina BRAN, PhD. – Academy of Economic Studies, Romania
Prof. Emeritus Maurice YOLLES, PhD. – Liverpool John Moores University, U.K.
Prof. Nicolae MIHĂIŢĂ, PhD. – Academy of Economic Studies, Romania
Prof. Mircea COŞEA, PhD. – Academy of Economic Studies, Romania
Prof. Edward J. LUSK, PhD. – State University of New York, U.S.A.
Prof. Vasile IŞAN, PhD. – Alexandru Ioan Cuza University, Romania
Prof. Gheorghe OPRESCU, PhD. – Politehnica University, Romania
Prof. Jeno BEKE, PhD. – University of Pecs, Hungary
Prof. Magdalena PLATIS, PhD. – University of Bucharest, Romania
Prof. Viorel CORNESCU, PhD. – University of Bucharest, Romania
Prof. Elsadig Musa AHMED, PhD. – Multimedia University, Malacca, Malaysia
Prof. Dan POPESCU, PhD. – Lucian Blaga University of Sibiu, Romania
Prof. Alexandru JIVAN, PhD. – West University of Timişoara, Romania
Prof. Ion LUNGU, PhD. – Academy of Economic Studies, Romania
Prof. Gheorghe MUREŞAN, PhD. – USAMV of Cluj Napoca, Romania
Prof. Agatha POPESCU, PhD. – USAMV of Bucharest, Romania
Prof. Radu SESTRAŞ, PhD. – USAMV of Cluj Napoca, Romania
Senior Lecturer Sylvia TRUMAN, PhD. – European Business School London, U.K.
Prof. Victor PLOAE, PhD. – Ovidius University of Constanţa, Romania
Prof. Mariana NICOLAE, PhD. – Academy of Economic Studies, Romania
Prof. Maria MUREȘAN, PhD. – Academy of Economic Studies, Romania
Prof. Anca DODESCU, PhD. – University of Oradea, Romania
Senior Lecturer Eugen MIHĂIŢĂ, PhD. – University of Derby, U.K.
Spec. Yun Li, PhD. -‐ Standard & Poor’s Quant Group New York, U.S.A.
Prof. Immo GIEGER, PhD. -‐ Wilhelmschule Peine, Germany
Assistant Board Members Prof. Mioara UDRICĂ, PhD. – Titu Maiorescu University, Romania
Conf. Silvia MĂRGINEAN, PhD. – Lucian Blaga University of Sibiu, Romania
Conf. Ioana Pop COHUŢ, PhD. – University of Oradea, Romania
Conf. Florin VĂDUVA, PhD. – Titu Maiorescu University, Romania
Conf. Ioana DUCA, PhD. – Titu Maiorescu University, Romania
Conf. Teodora VĂTUIU, PhD. – Titu Maiorescu University, Romania
Conf. Ildiko IOAN, PhD. – Academy of Economic Studies, Romania
Conf. Carmen RĂDULESCU, PhD. – Academy of Economic Studies, Romania
Lecturer Rodica GHERGHINA, PhD. – Academy of Economic Studies, Romania
Lecturer Anca Mirela POSTOLE, PhD. – Titu Maiorescu University, Romania
Lecturer Anisia POPESCU, PhD. – Academy of Economic Studies, Romania
Lecturer Mihaela ILIESCU, PhD. – Nicolae Titulescu University, Romania
Lecturer Marilena CIOBĂNAŞU, PhD. – Titu Maiorescu University, Romania
Ec. Cristina POPA, PhD. – Academy of Economic Studies, Romania
v
Technical Team
Assist. Dana SIMION – Titu Maiorescu University, Romania
Assist. Oana-‐Simona HUDEA – University of Bucharest, Romania
Ec. Simona BUŞOI – Academy of Economic Studies, Romania
Spec. Violeta GĂUCAN – Titu Maiorescu University, Romania
Spec. Daniela PÎRVU – Titu Maiorescu University, Romania
Table of contents Forew0rd
Edward J. LUSK, Christine T. KOVNER, Chuo-‐Hsuan LEE, Nellie SELANDER
The Technical Underpinnings and Extended
What-‐If Analyses of the Decision Support Systems
Programmed for the IOM 80/20 Nursing Initiative 1
Alen BADAL
Organizational Knowledge Management
Movement Strategies 27
Diana TĂNASE, Adrian TĂNASE, Florin FRANŢ
Impact of the Influential Factors of Economic
Competitiveness upon Romania’s West Region Firms 32
Yolanda Ramírez CÓRCOLES, Ángel Tejada PONCE, Jean VANDERDONCKT
How to Respond to Information Needs of University
Stakeholders: Proposal of Indicators for Reporting
on Intellectual Capital 58
Aleksander ARISTOVNIK
Relative Efficiency of Education Expenditures
in Eastern Europe: A Non-‐Parametric Approach 86
Traian CALOTA
Features of Accounting and Tax Treatments Applicable to
Intangible Assets of the Research and Development Activities
Nature in the Spirit of National Regulations 98
Almas HESHMATI, Firas H. AL-‐HAMMADANY, Ashraf BANY-‐MOHAMMED
Analysis of Internet Usage Intensity in Iraq:
An Ordered Logit Model 119
Shirin SHAFIEIYOUN, Akbar Moazen SAFAEI
Enhancing Knowledge Sharing Among Higher Education
Students through Digital Game 139
Hedia MAAMRI, Abdelfattah TRIKI
Distributors’ Knowledge Sharing Competency (DKSC):
Scale Generation and Development Process 158
Mirela Anca POSTOLE
Comparative Analysis of the Value Added Tax Evolution 183
Najia SAQIB
Impact of Development and Efficiency of Financial Sector
on Economic Growth: Empirical Evidence from
Developing Countries 192
David Han-‐Min WANG, Quang Linh HUYNH
Mediating Role of Knowledge Management in Effect of
Management Accounting Practices on Firm Performance 206
Aleksandar KEŠELJEVIĆ
Understanding of Knowledge from Economist’s Perspective 229
Traian CALOTA, Alin-‐Eliodor TĂNASE
Improving the Numbers of Financial Statements 242
Akbar Moazen SAFAEI, Shirin SHAFIEIYOUN
Enhancing Learning within the 3-‐D
Virtual Learning Environment 259

v

Foreword
The actuality of the last period highlights the comeback, with urgency, of the problem on energy and its place within the national and European concerns. The economic reality reminds us, with perseverance, that the resources are exhaustible, a man must face the challenges of the moment and future aspirations, as sustainable economic growth. The fact that the European and global economy indicates still the effects of economic crisis, leads the policy-‐makers to wonder on formulating new objectives that focus on the output of renewable energy.
Economic growth without consumption of raw materials and energy is impossible. Only that, within the current global context, Europe’s energy source diversification is associated with the development of a complementary measure package for insuring the security of the supply to households and companies. This aspect correlates with the setting of a certain price level and production, with accessible and competitive costs, in a sustainable manner.
The diversification of energy supply of Europe is subject to the indigenous energy sources development. In order to reduce the E.U. energy dependency to certain production-‐distribution giant corporations that monopolize, hamper competition and manipulate prices, the E.U. policy focuses on a better understanding of the European concept of sovereignty of a state competing with neighboring states. A revolutionary measure in this sense is the Energy Labeling Directive before the end of 2014, in accordance with the technological developments.
Relying on imports to cover demand for consumption is a measure revalued in the context of adjusting the energy intensive sectors. The imbalance between consumption and available resources is reviewed by reassessing the energy potential of each country. It is a feature of the economic system dynamics.
The approach is however, this time, inherently linked to the studies regarding green energy and resource regeneration. The major changes that

follow will determine great amplitudes compared to the currently existing balance, with effects in various proportions for ecosystem population.
Is it the beginning of a new phase, which corresponds to a new vision over the integrative economic-‐ecological system?
Professor Mariana Ioviţu, Ph.D.


Scientific Papers (www.scientificpapers.org) Journal of Knowledge Management, Economics and Information Technology
1
Vol. III, Issue 3 June 2013
The Technical Underpinnings and Extended What-If Analyses of the Decision Support Systems Programmed for the IOM 80/20 Nursing Initiative
Authors: Edward J. Lusk, Professor of Accounting, The State University of New York (SUNY) at Plattsburgh, School of Business and Economics: Plattsburgh, NY, USA and Emeritus, Department of Statistics The Wharton School, University of Pennsylvania, Philadelphia, PA, USA, [email protected], [email protected], Christine T. Kovner, Professor of Nursing, New York University, College of Nursing New York, NY, USA, [email protected], Chuo-‐Hsuan Lee, The State University of New York (SUNY) at Plattsburgh, School of Business and Economics: Plattsburgh, NY, USA, [email protected], Carina Katigbak, New York University College of Nursing, New York, NY, USA, [email protected], Nellie Selander, Consultant: New York University College of Nursing, New York, NY, USA, [email protected]
One of the goals of the Institute of Medicine’s (IOM) initiative: Analysing the Cost of Alternative Strategies Related to Nursing Education is to re-‐organize the nursing workforce in the United States so that after a relatively brief time, ten years or so, eighty per cent of the nursing workforce will consist of nurses with a Bachelor of Science in Nursing degree while, then by definition, the remaining twenty per cent will be Associate Degree &Diploma nurses. [The 80/20 Initiative].To aid health planners to create the information to develop the policies needed to effect The 80/20 Initiative Kovner, Lee, Lusk, Katigbak & Selander (2013) developed two Decision Support Systems [DSS]: The SWAP:
1
The Technical Underpinnings and Extended what-‐if Analyses of the Decision Support Systems Programmed for the IOM 80/20 Nursing Initiative
2
Vol. III, Issue 3 June 2013
DSS and the Dynamic Change: DSS. In this companion communication, we elaborate on the construal overview presented by Kovner et al. (2013). Specifically, we: (1) present the technical details of The SWAP and The Dynamic Change DSSs, (2) prove that the SWAP benchmark is the least expenditure alternative, and (3) offer extended “What-‐If” analysis enrichments useful in summarizing the voluminous decision information that could be generated by these DSSs. Presenting these critical technical details on the functionality of these DSSs will create the synergistic transparency needed to encourage the use of these DSSs by health planners. Keywords: Extended What-‐If Elaborations; Swapping; Dynamic Change
Acknowledgments:
This project was enabled by the generous support of The Robert Wood Johnson Foundation: Grant: [RWJ: 4466(2011), Principal Investigator: Dr.Kovner: [email protected]. We thank the number of nursing professions who provided valuable pilot-‐test feedback, in particular New York State Board of Nursing Executive Secretary, Barbara Zittel, PhD, RN, New Mexico Center for Nursing Excellence Executive Director, Pat Boyle, MSN, RN and University of New Mexico College of Nursing Professor and Executive Dean, Jean Giddens, PhD, RN, FAAN.
Introduction: The Point of Departure of the Study
The powerful computing technology in the modern world has facilitated the creation and application of Decision Support Systems (DSS). The spectrum served by the contemporary DSS is extensive. At one end, it may simply represent data links that provide summaries of data streams with General User Interfaces (GUI) support linked to SAS™, Excel™, or Word™ display platforms. At the other end of the same spectrum, it might actually refer to complicated integrated interactive networked GUIs that generate expert systems information to be considered by the DM. An example of the latter is the remarkable IBM™ Jeopardy™ “Contestant” Watson who soundly defeated Ken Jennings and Brad Rutter, the two most successful Jeopardy champions of all time, in a live head-‐to-‐head two-‐ game match where the prize for
The Technical Underpinnings and Extended what-‐if Analyses of the Decision Support Systems Programmed for the IOM 80/20 Nursing Initiative
3
Vol. III, Issue 3 June 2013
winning was $1,000,000 (Borenstein and Robertson, 2011).In the simple gaming world, the Tick-‐Tack-‐Toe DSS engineered by Bell Labs and installed in the 1950s at the Museum of Science & Industry in Chicago, Illinois USA retired undefeated after entertaining hopeful school children for decades. DSS have won world chess championships; Deep Blue, again of IBM, in 1997 dispatched a disgruntled Kasparov, the reigning world chess champion for 15 straight years (seeJayanti, 2003). This is an impressive record given that computers started life as simple “2 + 2” calculators circa 1947.
In a DSS context, a What-‐If analysis is the re-‐parameterization of key or sensitive variables so as to re-‐generate the DSS information aloud put. A What-‐If analysis is an important aspect of using the DSS in arriving at a final decision. It allows DMsto engage in “sensitivity analysis”; that is, consider various “alternative” parameterizations and the results that they may produce for decision making.
Kovner, Lee, Lusk, Katigbak & Selander (2013) developed DSSs and used What-‐If analyses to help health planners explore the impact of their various anticipated options to arrive at an acceptable way to strive for the IOM 80/20 Initiative. The Institute of Medicine’s (IOM) Committee on The Future of Nursing to: “increase the proportion of nurses with a baccalaureate degree to 80% by 2020” to arrive, after a planning horizon of 10 years, at a workforce of eighty percent registered nurses (RNs) with a Bachelor’s Degree in Nursing (BSN) and twenty percent with an Associate Degree or a Diploma certification (AD-‐D). [The 80/20 Initiative]
The conceptual overview of these DSS as presented by Kovner et al. (2013) necessarily addressed the general concepts used in the DSS montage. To complete the expression of these DSS, we offer in this companion paper the technical underpinnings of these DSS. We feel that to understand the technical dimensions of these DSS is critical to promoting their use by health planners. This is another way of saying that the devil is in the details—i.e., a rich understanding of the detailed nature of a DSS is a necessary condition to their use. This is the point of departure of our paper.
In the following pages we will: 1) Present and discuss, as an operational context for the technical
presentation, the two DSS, which were developed to help health care workforce planners evaluate the expenditures required to achieve The 80/20 Initiative.
The Technical Underpinnings and Extended what-‐if Analyses of the Decision Support Systems Programmed for the IOM 80/20 Nursing Initiative
4
Vol. III, Issue 3 June 2013
2) Justify benchmarking in this operational context and offer a novel approach to benchmarking using an assumption of total RN workforce stasis and direct trading (e.g., swapping AD-‐D RNs to create the additional BSN-‐prepared RNs needed in the workforce) which would require: (1) enrolling AD-‐D prepared RNs in BSN programs and ensuring that they graduate, and/or (2) shrink the AD-‐D workforce and increase initial enrollments in BSN programs.
3) Demonstrate the DSS functionality and show mathematically, that swapping requires the fewest number of conversions—AD-‐D to BSN RNs. Therefore, the Swap number will serve as a good benchmark to evaluate proposals made by the DM to achieve The 80/20 Initiative.
4) Offer a What-‐If context for the DSS analysis, and extend the What-‐If analyses to a best-‐average-‐worst case scenario calibration, where the expectation model is used to form a synthesis of these analyses.
General Context of the 80/20 Robert Wood Johnson Foundation IOM Funding Initiative
The following question is raised by The 80/20 Initiative: Is The 80/20 Initiative feasible and, if so, what are the expenditure
consequences of achieving such a dramatic reorganization of the RN workforce?
To generate such information and to provide DMs with sufficient
flexibility to test various What-‐If assumptions, we created a DSS, composed off our principal worksheet modules. Each worksheet is organized around the concept of decomposition—i.e., where DMs indicate the various important elements of the information set for the particular worksheet. Then, the DM enters the elemental or decomposed information, which is then aggregated and transferred to the next worksheet. For a rich discussion of decomposition see: Lee & Anderson (2001), MacGregor (2001), Kester, Kirschner & van Merrienboer (2005), and Adya, Lusk & Belhadjali (2009). Consider now these four Excel™ worksheets and their elements as described in detail by the Dynamic Change and SWAP DSS manuals offered by Kovner, Katigbak and Selander (2013a,b).
The Technical Underpinnings and Extended what-‐if Analyses of the Decision Support Systems Programmed for the IOM 80/20 Nursing Initiative
5
Vol. III, Issue 3 June 2013
• Worksheet I: Baseline Workforce Information. To start the process of developing information the DM at a particular location context estimates he number of BSN and AD-‐D RNs currently in the nursing workforce. The DSS then calculates the number of BSN and AD-‐D nurses in these workforces and transfers this information to the next worksheet.
• Worksheet II: Required Number of BSN RNs Needed over What Would Occur Normally—based upon historical projections. This is the most critical worksheet in the DSS. However, there are two different concepts under which this required number of BSN is developed. The first, as introduced above, is the SWAP of AD-‐D to increase the number of BSN RNs; essentially this is a conversion of AD-‐D RNs to BSN through the Nursing Education System [NES]. This swapping is relatively simple and does not require extensive parameterization by the DM. The second DSS, the more usual context, is where the numbers of AD-‐D and BSN RNs will be changing over the planning horizon. We call this the Dynamic Change: DSS in contrast to the SWAP: DSS. The SWAP: DSS serves as a benchmark; it assumes that (I ) there will be stasis with respect to the size of the total nursing workforce, and (ii) the increase in the number of BSN needed to satisfy The 80/20 Initiative occurs as a 1-‐to-‐1 reduction of the number of AD-‐D nurses. In contrast, the Dynamic Change: DSS relaxes the SWAP assumptions and allows for changes in the BSN and AD-‐D workforces, and so in the total nursing workforce.
• Worksheet III: Feasibility. Given the number of BSN that need to be produced by the NES to achieve The 80/20 Initiative, either under the SWAP or the Dynamic Change contexts, this worksheet module assesses the systemic feasibility of adding this required number of BSN. This assessment requires the DM to use the data from Worksheet II to estimate the following elements:
a) The number of BSN RNs that currently graduate from select types of nursing education programs in the location context that the DM is analyzing, and
b) The possible increase in such BSN RNs graduates given assessments of the NES resources in the location context.
The Technical Underpinnings and Extended what-‐if Analyses of the Decision Support Systems Programmed for the IOM 80/20 Nursing Initiative
6
Vol. III, Issue 3 June 2013
• Worksheet IV: Expenditure Consequence of the 80/20 Policy. In the practical context within which this Dynamic Change: DSS will be used, the focus is on the price to be charged—i.e., the expenditure needed to achieve The 80/20 Initiative. This expenditure basis may also be viewed as the cost/resource commitment agencies must make, which have the intention to create the individual policies necessary to realize The 80/20 Initiative. Given this final determination of the number of BSN RNs needed, as developed in the previous Feasibility section of the DSS, the practical expenditure expectation of achieving the ratio of BSN to AD-‐DRNs can then be computed. Thereafter, the DM will select the feasible and reasonable number of BSN RNs expected for the purpose of estimating the resources needed to achieve this number of BSN RNs at the end of the planning horizon. This will be the final computational stage of either the SWAP: DSS or the Dynamic Change: DSS.
Stasis Benchmarking: Finding a Reasonable Basis of Comparison for the Dynamic Change: DSS
Given the four sequential building blocks of the Dynamic Change: DSS, the next issue to be addressed is selecting a benchmark for the expenditure needed to achieve The 80/20 Initiative using the Dynamic Change: DSS. The “benchmarking issue” is that while it is true that the DM estimates will eventually culminate in a final expenditure of achieving The 80/20 Initiative hat expenditure will not have an “obvious” relative comparison because the expenditure consequence computation is the unique expression of a particular DM who is projecting to the end of the planning horizon. In contrast, it is almost exclusively the case that reports from government agencies such as: US Department of Health and Human Services [DHHS], Social Security Administration [SSA], Organization for Economic Co-‐operation and Development [OECD], or The World Health Organization [WHO] which are usually summary of the historical past and not future projections, and so, are not likely to be reasonable benchmarks to projections from the workforce information created by the four components of the Dynamic Change DSS. For this reason, to develop such a focused and meaningful expenditure comparison, we propose using the expenditures
The Technical Underpinnings and Extended what-‐if Analyses of the Decision Support Systems Programmed for the IOM 80/20 Nursing Initiative
7
Vol. III, Issue 3 June 2013
developed under the SWAP context by the same DM who is now evaluating the Dynamic Change DSS as the benchmark of the expenditures projected by the Dynamic Change’s. Additionally, as we shall prove subsequently, the SWAP conversion will always be less than the number of BSN RNs needed under the assumptions of the Dynamic Change: DSS and therefore provides a focused and meaningful relative benchmark given their unique parameterization of a particular DM. Next we will present, in detail, the logistical organization of the detailed information in these two DSS.
Dynamic Change Projections and SWAP-‐Stasis Benchmarking: The Underlying Details
All of the feasibility and expenditure information is developed from the progenitor calculations of the worksheet module: Required Number of BSN RNs Needed over What Would Occur Normally. Assuming that the total RN workforce at the baseline year is:
A+B
Where: A and B respectively represent the numbers of AD-‐D and
BSN RNs licensed to practice in the regional workforce at the baseline year, At the end of the planning horizon the numbers are
projected/estimated/assumed to be: Eq 1: SWAP: Context A ̂+ B ̂=A+B Eq 2: Dynamic Change: Context A ̃+ B ̃
Where : B ̂=B+ ∆B_SWAP, A ̂=A-‐∆B_SWAP; therefore A ̂+ B ̂=A+B.
And for Eq 2 we have B ̃=B+∆B_DC, (A) ̃=A+∆A_DC, :∆B_SWAP, ∆A_DC, ∆B_D Care the changes in the number of AD-‐D and BSN for the respective SWAP and Dynamic Change DSS occurring over the planning horizon, :further, ∆B_ SWAP , ∆A_DC , ∆B_D Care likely to be in the related practical intervals: [-‐B to (2 x B)]and [-‐A to (2 x A)].This just means that (i) the reduction in the workforce cannot be equal to or greater than the workforce size at the baseline and (ii) the size of the workforce is not likely to double over the planning horizon; it should be noted that the DSS will accept any
The Technical Underpinnings and Extended what-‐if Analyses of the Decision Support Systems Programmed for the IOM 80/20 Nursing Initiative
8
Vol. III, Issue 3 June 2013
reasonable parameterization which produces expected values of the change in A or B. we will be working in this usual context for all the illustrations and demonstrations following. These changes may lead to the following ratios at the end of the planning period:
Eq 3 SWAP BSN Ratio: !
!!!= 0.8− 𝛿
Eq 4 Dynamic Change BSN Ratio: !
!! != 0.8− 𝛿
Where: δ is in the open unit interval: 0 <δ< 1. This means that the projection at the end of the planning horizon is expected to result in a shortfall of the numbers of BSN-‐RNs needed to achieve the 80/20 policy goal. The shortfall is, of course, the only condition of interest in the DSS context because if the final ratios at least satisfy the 80/20 policy goal, then no DM actions would be warranted. The shortfall is noted as δ and is in decimal rather than percentage notation. For example, if δ were to be .25 this would mean that the number of BSN as a ratio to the size of the workforces was .55 and so there was a shortfall of 25% of reaching the 80/20 policy goal.
If Eq 3 and 4 are used and there is a positive δ, this means that there will be a shortfall in both the SWAP and Dynamic Change contexts. Implication: B_ s^ε must be added to the number of BSN in the workforce for the SWAP context, and B_ DC^ε must be added to the BSN workforce in the Dynamic Change context during the planning period to satisfy the policy goal. These relationships script out as follows:
Eq 5 Policy Achieving State: SWAP !!!!!
[!!!]= 0.80
Eq 6 Policy Achieving State: Dynamic Change !! !!"!
[!! !!"! ]!!]
= 0.80
The respective solution values of B_ s^ε and B_ DC^ε is: Eq 7 𝐵!! = 𝛿× 𝐵 + 𝐴 Eq 8 𝐵!"! = 4𝐴 − 𝐵 In order to demonstrate the correctness of the above theoretical solutions in Eq. 7 and Eq. 8, it would be value able to give two examples taken from pilot information for the two DSS.
The Technical Underpinnings and Extended what-‐if Analyses of the Decision Support Systems Programmed for the IOM 80/20 Nursing Initiative
9
Vol. III, Issue 3 June 2013
Relative Numbers under Stasis and Dynamic Change
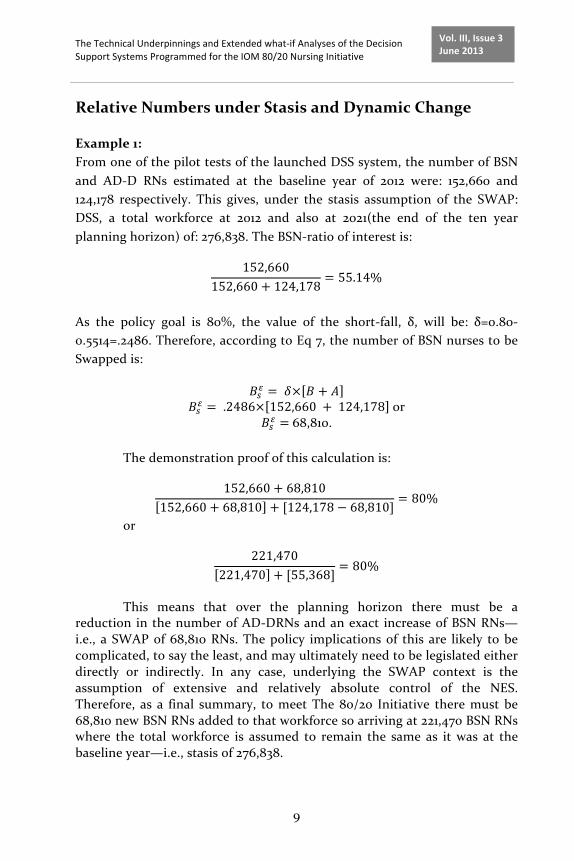
Example 1: From one of the pilot tests of the launched DSS system, the number of BSN and AD-‐D RNs estimated at the baseline year of 2012 were: 152,660 and 124,178 respectively. This gives, under the stasis assumption of the SWAP: DSS, a total workforce at 2012 and also at 2021(the end of the ten year planning horizon) of: 276,838. The BSN-‐ratio of interest is:
152,660152,660 + 124,178
= 55.14%
As the policy goal is 80%, the value of the short-‐fall, δ, will be: δ=0.80-‐0.5514=.2486. Therefore, according to Eq 7, the number of BSN nurses to be Swapped is:
𝐵!! = 𝛿× 𝐵 + 𝐴 𝐵!! = .2486× 152,660 + 124,178 or
𝐵!! = 68,810.
The demonstration proof of this calculation is:
152,660 + 68,810152,660 + 68,810 + [124,178 − 68,810]
= 80%
or
221,470221,470 + [55,368]
= 80%
This means that over the planning horizon there must be a
reduction in the number of AD-‐DRNs and an exact increase of BSN RNs—i.e., a SWAP of 68,810 RNs. The policy implications of this are likely to be complicated, to say the least, and may ultimately need to be legislated either directly or indirectly. In any case, underlying the SWAP context is the assumption of extensive and relatively absolute control of the NES. Therefore, as a final summary, to meet The 80/20 Initiative there must be 68,810 new BSN RNs added to that workforce so arriving at 221,470 BSN RNs where the total workforce is assumed to remain the same as it was at the baseline year—i.e., stasis of 276,838.
The Technical Underpinnings and Extended what-‐if Analyses of the Decision Support Systems Programmed for the IOM 80/20 Nursing Initiative
10
Vol. III, Issue 3 June 2013
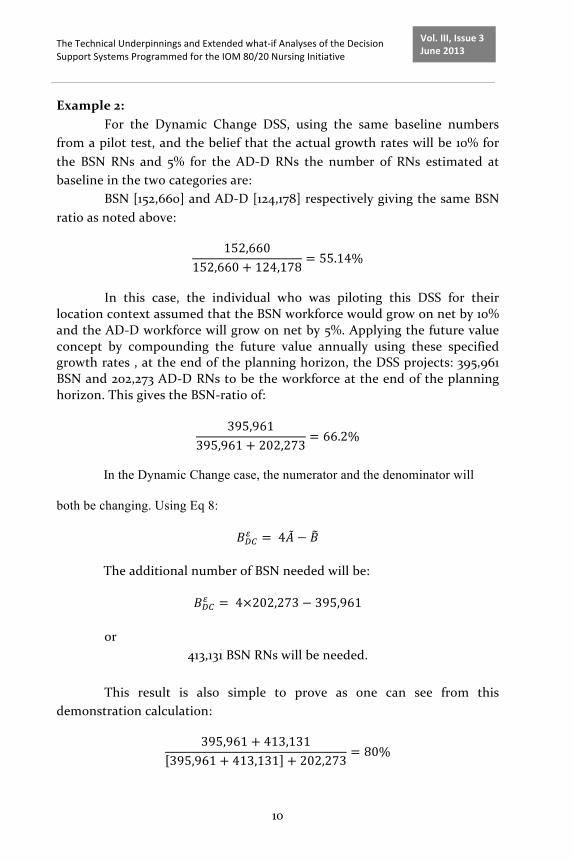
Example 2: For the Dynamic Change DSS, using the same baseline numbers
from a pilot test, and the belief that the actual growth rates will be 10% for the BSN RNs and 5% for the AD-‐D RNs the number of RNs estimated at baseline in the two categories are:
BSN [152,660] and AD-‐D [124,178] respectively giving the same BSN ratio as noted above:
152,660152,660 + 124,178
= 55.14%
In this case, the individual who was piloting this DSS for their
location context assumed that the BSN workforce would grow on net by 10% and the AD-‐D workforce will grow on net by 5%. Applying the future value concept by compounding the future value annually using these specified growth rates , at the end of the planning horizon, the DSS projects: 395,961 BSN and 202,273 AD-‐D RNs to be the workforce at the end of the planning horizon. This gives the BSN-‐ratio of:
395,961
395,961 + 202,273= 66.2%
In the Dynamic Change case, the numerator and the denominator will
both be changing. Using Eq 8:
𝐵!"! = 4𝐴 − 𝐵
The additional number of BSN needed will be:
𝐵!"! = 4×202,273 − 395,961
or 413,131 BSN RNs will be needed.
This result is also simple to prove as one can see from this
demonstration calculation:
395,961 + 413,131395,961 + 413,131 + 202,273
= 80%

The Technical Underpinnings and Extended what-‐if Analyses of the Decision Support Systems Programmed for the IOM 80/20 Nursing Initiative
11
Vol. III, Issue 3 June 2013
This result means that assuming the projections are accurate, the number of new BSN that must be added, in addition to the projected incremental increase, is 413,131! This number of new BSN (i.e., 413,131) needed under the Dynamic Change DSS is as six times as the 68,810 of new BNS needed under the stasis assumptions of SWAP DSS.
Of course, one may suppose, as the total force under the SWAP assumptions was held constant and the relative workforce numbers under the dynamic change perhaps were increasing it is to be expected that the SWAP would be lower. In order to establish this supposition one needs to prove that under the SWAP assumptions, the number of BSN RNs needed is always lower in the practical context of the nursing workforce.
Swapping: The Minimal Logical Benchmark
We are interested in determining the magnitude of the relationship between the numbers of nurses holding a BSN needed to satisfy the 80/20 policy goal under the two different contexts: The SWAP and The Dynamic Change, as defined above. It is of interest to determine if the number of BSN RNs needed to be added by the NES under the SWAP assumptions is always lower than that under the Dynamic Change assumptions. The SWAP results will serve as an excellent benchmark for the expenditure required to achieve the policy goal under the assumptions of the Dynamic Change context. To test for the minimum number relationship under the two contexts consider the following initial or projected and final context specific state profiles:
Swap Context:
Eq9 Projected end-‐state !!!!
= 0.8 − 𝛿 Eq 10 Desired end-‐state !!∆!
!!∆! !(!!∆!)= !!∆!
!!!= 0.8
Dynamic Change Context:
Eq11 Projected end-‐state !!!!
= 0.8 − 𝛿 Eq12 Desired end-‐state !! ∆!∗
!!∆!∗ ! (!!(∆!!!)= 0.8
The Technical Underpinnings and Extended what-‐if Analyses of the Decision Support Systems Programmed for the IOM 80/20 Nursing Initiative
12
Vol. III, Issue 3 June 2013
Where : δ represents the general shortfall in achieving the policy goal and is the same for both the SWAP and Dynamic Change contexts at the baseline time when Eq 9 Eq11; δ is therefore:0<δ<1. : ∆Band〖∆B〗^*represent the number of BSN added to the workforce that results in achieving the policy goal in the SWAP and the Dynamic Change contexts respectively. i.e., these numbers of BSN drive the respective short falls, δ, to zero. : The policy goal will be noted as: γ/(1-‐γ). For the IOM initiative, γ is the label reserved for the desired percentage of BSN in the total workforce at the end of the planning period, specifically: γ= 80% ; so, then, (1-‐γ) is the label for the percentage of AD-‐Diploma nurses in the total workforce.
To test whether the SWAP or the Dynamic Change has the minimum number of BSN needed to satisfy the γ/(1-‐γ) Policy Goal we opted for a simple minimal directional test as the numbers of BSN and AD-‐D are discrete integers. Therefore, given this election, we used, for the Dynamic Change context, as the change in A: one more AD-‐D than is the reduction under the SWAP context; this is noted in Eq12 as: (A-‐(∆B-‐1). Simply, if Eq 12 used ∆Bas the reduction in AD-‐Diploma nurses, then Eq 12 would be identically Eq 10 and the numbers of BSN needed would be the same in both contexts. This is another way of saying that this is the point of departure for the test of interest—i.e., the point at where the SWAP and Dynamic Change are identical. We then move off this point of equilibrium identity in the Dynamic Change context by the smallest increment possible i.e., one AD-‐Diploma nurses more than in the SWAP context.
Given, the above, the question of interest is: What is the magnitude relationship between the numbers of BSN in the two differences contexts?
Examination of the magnitude relationships between the SWAP and the Dynamic Change Contexts
If one solves Equations: Eq 9 and Eq 10 for the change in the BSN,∆B, needed to achieve the policy goal, that is, to increase the number of BSN to the point where the ratio of BSN in the workforce is 80% for which, therefore, δ=0, then the following will be the result:
For the SWAP context: ∆B= δ× [B+A].

The Technical Underpinnings and Extended what-‐if Analyses of the Decision Support Systems Programmed for the IOM 80/20 Nursing Initiative
13
Vol. III, Issue 3 June 2013
For the Dynamic Change context, if one subtracts Equation Eq 11 from Eq 12 to solve for the change in the BSN,∆B^*, needed to achieve the policy goal in the Dynamic Change context we find: Eq12 less Eq11 gives: Eq13 (1 − 𝛾)∆𝐵∗ = (1 − 𝛾)∆𝐵 + 𝛾
We can reform Eq13 as: Eq14 ∆𝐵∗ = ∆𝐵 + 𝛾/(1 − 𝛾)
Therefore, it is immediate that ∆𝐵∗ > ∆𝐵 as: !!!!
> 0.
Therefore, as one moves off the point of equilibrium where Eq9 Eq 11 by the minimal increase in the number of AD-‐Diploma nurses (i.e., 1) at the end of the planning horizon in the SWAP context, the number of BSN needed in the Dynamic Change context is always greater than it would be in the SWAP context. This is what the equations indicate—in particular Eq14.
It may be instructive to illustrate the relationships presented in Eq 14 with a simple example. To do so we must relax the strict stasis and SWAP trade-‐off assumptions of the SWAP context so as to make a comparison with the Dynamic Change context. Specifically, we will allow the total workforce to grow by only an increment in the BSN workforce with no reduction in the AD-‐Diploma workforce. This modification in the SWAP context will be necessary as there is no way to directly compare the two contexts as they are by definition incompatible—i.e., the SWAP context precludes the Dynamic Change context.
Preamble to the illustration we will first compute the number of BSN needed to achieve the exact 80% policy goal in the Dynamic Change context starting from the SWAP results and then search starting at one additional BSN in the modified SWAP context to arrive at the exact ratio of 80%.
Illustrative Computations for the Context of the Minimum SWAP Proof
Using the pilot test information as noted above, at baseline, we find the ratio of BSN to be:
152,660152,660 + 124,178
= 55.14%
The Technical Underpinnings and Extended what-‐if Analyses of the Decision Support Systems Programmed for the IOM 80/20 Nursing Initiative
14
Vol. III, Issue 3 June 2013
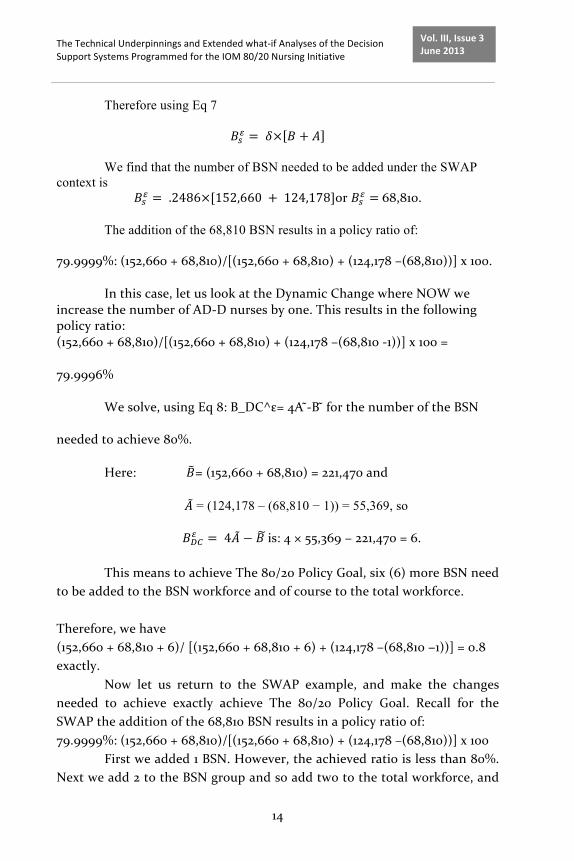
Therefore using Eq 7
𝐵!! = 𝛿× 𝐵 + 𝐴
We find that the number of BSN needed to be added under the SWAP context is
𝐵!! = .2486×[152,660 + 124,178]or 𝐵!! = 68,810.
The addition of the 68,810 BSN results in a policy ratio of:
79.9999%: (152,660 + 68,810)/[(152,660 + 68,810) + (124,178 –(68,810))] x 100.
In this case, let us look at the Dynamic Change where NOW we increase the number of AD-‐D nurses by one. This results in the following policy ratio: (152,660 + 68,810)/[(152,660 + 68,810) + (124,178 –(68,810 -‐1))] x 100 =
79.9996%
We solve, using Eq 8: B_DC^ε= 4A -̃‐B ̃ for the number of the BSN
needed to achieve 80%.
Here: 𝐵= (152,660 + 68,810) = 221,470 and
𝐴 = (124,178 – (68,810 − 1)) = 55,369, so
𝐵!"! = 4𝐴 − 𝐵 is: 4 × 55,369 − 221,470 = 6.
This means to achieve The 80/20 Policy Goal, six (6) more BSN need to be added to the BSN workforce and of course to the total workforce. Therefore, we have (152,660 + 68,810 + 6)/ [(152,660 + 68,810 + 6) + (124,178 –(68,810 −1))] = 0.8 exactly.
Now let us return to the SWAP example, and make the changes needed to achieve exactly achieve The 80/20 Policy Goal. Recall for the SWAP the addition of the 68,810 BSN results in a policy ratio of: 79.9999%: (152,660 + 68,810)/[(152,660 + 68,810) + (124,178 –(68,810))] x 100
First we added 1 BSN. However, the achieved ratio is less than 80%. Next we add 2 to the BSN group and so add two to the total workforce, and
The Technical Underpinnings and Extended what-‐if Analyses of the Decision Support Systems Programmed for the IOM 80/20 Nursing Initiative
15
Vol. III, Issue 3 June 2013
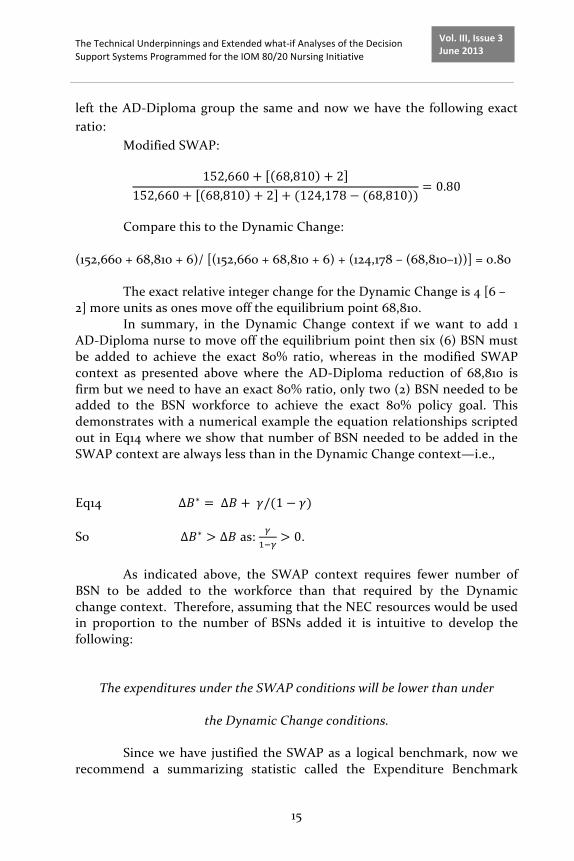
left the AD-‐Diploma group the same and now we have the following exact ratio:
Modified SWAP:
152,660 + 68,810 + 2152,660 + 68,810 + 2 + (124,178 − (68,810))
= 0.80
Compare this to the Dynamic Change:
(152,660 + 68,810 + 6)/ [(152,660 + 68,810 + 6) + (124,178 – (68,810–1))] = 0.80
The exact relative integer change for the Dynamic Change is 4 [6 – 2] more units as ones move off the equilibrium point 68,810.
In summary, in the Dynamic Change context if we want to add 1 AD-‐Diploma nurse to move off the equilibrium point then six (6) BSN must be added to achieve the exact 80% ratio, whereas in the modified SWAP context as presented above where the AD-‐Diploma reduction of 68,810 is firm but we need to have an exact 80% ratio, only two (2) BSN needed to be added to the BSN workforce to achieve the exact 80% policy goal. This demonstrates with a numerical example the equation relationships scripted out in Eq14 where we show that number of BSN needed to be added in the SWAP context are always less than in the Dynamic Change context—i.e.,
Eq14 ∆𝐵∗ = ∆𝐵 + 𝛾/(1 − 𝛾)
So ∆𝐵∗ > ∆𝐵 as: !!!!
> 0.
As indicated above, the SWAP context requires fewer number of BSN to be added to the workforce than that required by the Dynamic change context. Therefore, assuming that the NEC resources would be used in proportion to the number of BSNs added it is intuitive to develop the following:
The expenditures under the SWAP conditions will be lower than under
the Dynamic Change conditions.
Since we have justified the SWAP as a logical benchmark, now we recommend a summarizing statistic called the Expenditure Benchmark
The Technical Underpinnings and Extended what-‐if Analyses of the Decision Support Systems Programmed for the IOM 80/20 Nursing Initiative
16
Vol. III, Issue 3 June 2013
(EBM) as a tool to explore the impact of the 80/20 initiative on expenditures of the NES.
The EBM: A Ratio of Effort to Benefit
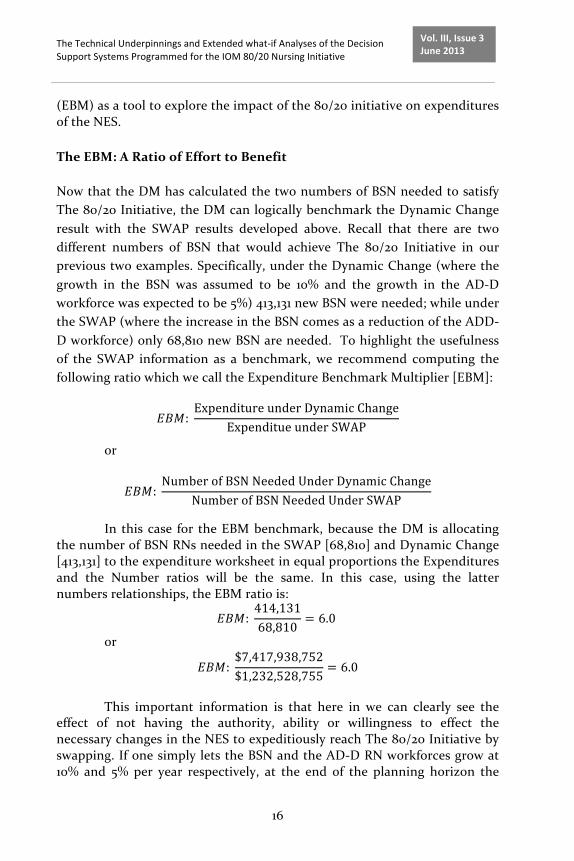
Now that the DM has calculated the two numbers of BSN needed to satisfy The 80/20 Initiative, the DM can logically benchmark the Dynamic Change result with the SWAP results developed above. Recall that there are two different numbers of BSN that would achieve The 80/20 Initiative in our previous two examples. Specifically, under the Dynamic Change (where the growth in the BSN was assumed to be 10% and the growth in the AD-‐D workforce was expected to be 5%) 413,131 new BSN were needed; while under the SWAP (where the increase in the BSN comes as a reduction of the ADD-‐D workforce) only 68,810 new BSN are needed. To highlight the usefulness of the SWAP information as a benchmark, we recommend computing the following ratio which we call the Expenditure Benchmark Multiplier [EBM]:
𝐸𝐵𝑀: Expenditure under Dynamic Change
Expenditue under SWAP
or
𝐸𝐵𝑀: Number of BSN Needed Under Dynamic Change
Number of BSN Needed Under SWAP
In this case for the EBM benchmark, because the DM is allocating the number of BSN RNs needed in the SWAP [68,810] and Dynamic Change [413,131] to the expenditure worksheet in equal proportions the Expenditures and the Number ratios will be the same. In this case, using the latter numbers relationships, the EBM ratio is:
𝐸𝐵𝑀: 414,13168,810
= 6.0
or
𝐸𝐵𝑀: $7,417,938,752$1,232,528,755
= 6.0
This important information is that here in we can clearly see the
effect of not having the authority, ability or willingness to effect the necessary changes in the NES to expeditiously reach The 80/20 Initiative by swapping. If one simply lets the BSN and the AD-‐D RN workforces grow at 10% and 5% per year respectively, at the end of the planning horizon the

The Technical Underpinnings and Extended what-‐if Analyses of the Decision Support Systems Programmed for the IOM 80/20 Nursing Initiative
17
Vol. III, Issue 3 June 2013
number of BSN needed to reach the policy goal will require expenditures about 6 times the expenditure under the control assumptions of the SWAP. Here we are using the relative numbers under the SWAP and the Dynamic Change contexts rather than the expenditures under each context as the expenditures are a constant multiplier for each context. As a result, the DM has now collected two critical pieces of information: The Dynamic Change: DSS output is that the expected expenditures of 7.4 Billion will be needed to realize The 80/20 Initiative, The Expenditure multiplier for not controlling the NES is about six times the SWAP expenditures of$1.2 Billion. With this EBM ratio information we recommend that the DM conduct What-‐if analyses to develop alternative BSN scenarios and then “price” them. Let us now offer a few illustrative examples of What-‐If analysis and then extend this concept to re-‐coding the what-‐if concept as: Best, Average/Usual and Worst Case scenarios. What-‐If Alternatives: Converging to a Possible Reality
What-‐If Analyses. For the case under consideration, re-‐calibrating the DSS is necessary as the number of BSN needed may require such a high level of expenditure that it is not political feasible. In this case, the DM is searching for a redistribution of the needed numbers of BSN nurses in order to bring the expected expenditures down into the politically feasible range. For example, given the current Fiscal Cliff expected eventualities [see WSJ (2013)], the DM may believe that the projected expenditures of $7.4 Billion, as illustrated above cannot possibility be funded considering that governments are unable to fully fund education budgets. In this case, the DM recognizing that on-‐line programs require the lowest expenditure of resources, could allocate all of the students to on-‐line programs to save resources in order to possibly achieve The 80/20 Initiative. In this case, the EBM will remain the same BUT the total expenditure will change. Therefore, the DM will create a What If expenditure that hopefully will be sufficiently low to satisfy the political scrutiny of the needed expenditure.
For example assuming that all the BSN under the two different contexts are generated from On-‐Line programs as the What-‐If analysis then the relative changes are presented in Table1 following:
The Technical Underpinnings and Extended what-‐if Analyses of the Decision Support Systems Programmed for the IOM 80/20 Nursing Initiative
18
Vol. III, Issue 3 June 2013
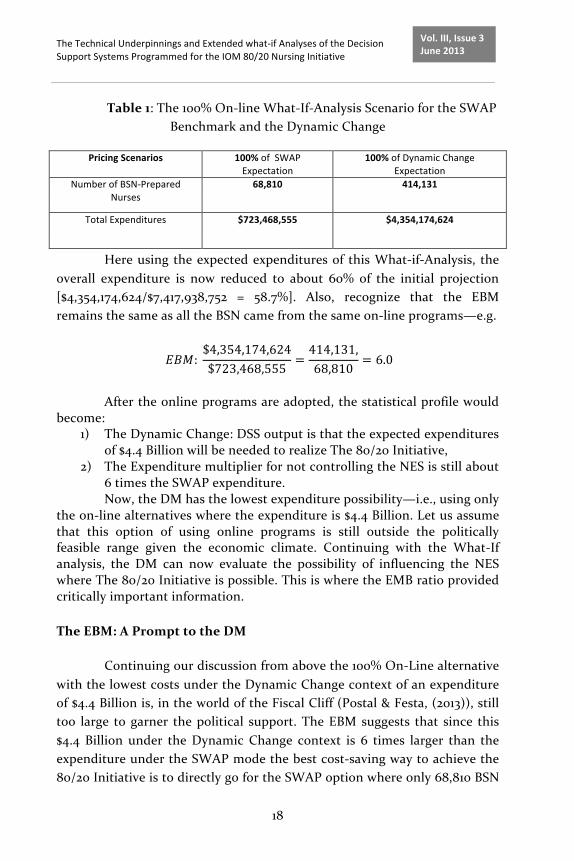
Table 1: The 100% On-‐line What-‐If-‐Analysis Scenario for the SWAP Benchmark and the Dynamic Change
Pricing Scenarios 100% of SWAP Expectation
100% of Dynamic Change Expectation
Number of BSN-‐Prepared Nurses
68,810 414,131
Total Expenditures $723,468,555 $4,354,174,624
Here using the expected expenditures of this What-‐if-‐Analysis, the overall expenditure is now reduced to about 60% of the initial projection [$4,354,174,624/$7,417,938,752 = 58.7%]. Also, recognize that the EBM remains the same as all the BSN came from the same on-‐line programs—e.g.
𝐸𝐵𝑀: $4,354,174,624$723,468,555
=414,131,68,810
= 6.0
After the online programs are adopted, the statistical profile would
become: 1) The Dynamic Change: DSS output is that the expected expenditures
of $4.4 Billion will be needed to realize The 80/20 Initiative, 2) The Expenditure multiplier for not controlling the NES is still about
6 times the SWAP expenditure. Now, the DM has the lowest expenditure possibility—i.e., using only
the on-‐line alternatives where the expenditure is $4.4 Billion. Let us assume that this option of using online programs is still outside the politically feasible range given the economic climate. Continuing with the What-‐If analysis, the DM can now evaluate the possibility of influencing the NES where The 80/20 Initiative is possible. This is where the EMB ratio provided critically important information.
The EBM: A Prompt to the DM
Continuing our discussion from above the 100% On-‐Line alternative with the lowest costs under the Dynamic Change context of an expenditure of $4.4 Billion is, in the world of the Fiscal Cliff (Postal & Festa, (2013)), still too large to garner the political support. The EBM suggests that since this $4.4 Billion under the Dynamic Change context is 6 times larger than the expenditure under the SWAP mode the best cost-‐saving way to achieve the 80/20 Initiative is to directly go for the SWAP option where only 68,810 BSN

The Technical Underpinnings and Extended what-‐if Analyses of the Decision Support Systems Programmed for the IOM 80/20 Nursing Initiative
19
Vol. III, Issue 3 June 2013
would be needed. Although the SWAP option is a theoretically lowest-‐cost option, to swap AD-‐D to BSN on a one-‐on-‐one ratio would require a strong level of control of the NES that is unlikely to be possible. Despite the difficulty to pursue a SWAP option with the most cost-‐saving, there may be a “compromise” solution. This is where the “prompt” nature of the EBM comes into play. For example, let us assume that according to the estimate of the DM a budget of $1.7 Billion or about40% of the Dynamic Change expenditure is most likely to be politically feasible. Now prompted by the EBM that indicates that $1.7Billion is less than 6 times of the SWAP expenditure of 724 Million[$1.7Billion/724Million= 2.4 times], the DM understands that 1.7 billion is a limited resource and would take action to calculate the total number of BSN that an expenditure of $1.7 Billion can help the NES to create. In this case, using only the On-‐Line programs as parameterized from the pilot test where the total average cost per BSN over the four year program including related costs is $10,514the DM find that 1.7 Billion could produce 161,689BSN nurses [$1.7 Billion/$10,514]. At this point, the DM realizes, through the EBM prompting, that there may be an alternative solution located in the spectrum between the SWAP and the Dynamic Change options, which is a “Blend” of the Dynamic Change option in which the agency has no control of the NES and SWAP option which requires a total control of the NEC. This alternative solution may offer a way to strike a political feasible expenditure that would support the IOM 80/20 initiative.
Given the information provided in Example 1, there are152,660 BSN and 124,178 AD-‐D nurses available at the baseline year. Instead of adding 161,689 BSN by spending 1.7 billion dollars through 100% On-‐Line Programs the DM may investigate the possibility to add only a portion of the 161,689 BSN to the baseline figure of BSN and, simultaneously, reduce a portion of the number of AD-‐D nurses from its baseline figure.
Assume that the percentage of the 161,689 BSN to be added is α, and the percentage of the AD-‐D nurses to be reduced is also α. Then, the DM may solve for α in the following Prompt-‐relationship:
Eq 15 80% = (152,660 + α [161,689]) / [(152,660 + α [161,689]) + [(1 − α) ×
[124,178]]]
The Technical Underpinnings and Extended what-‐if Analyses of the Decision Support Systems Programmed for the IOM 80/20 Nursing Initiative
20
Vol. III, Issue 3 June 2013
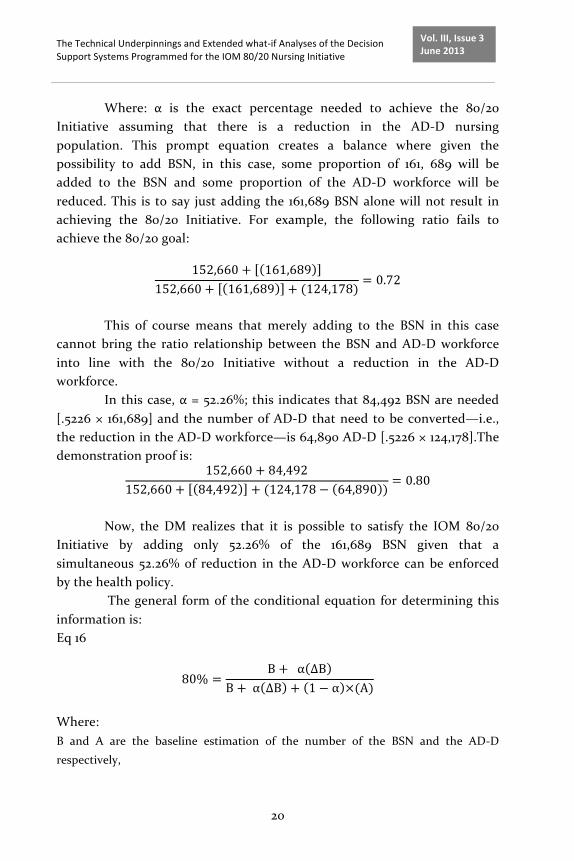
Where: α is the exact percentage needed to achieve the 80/20 Initiative assuming that there is a reduction in the AD-‐D nursing population. This prompt equation creates a balance where given the possibility to add BSN, in this case, some proportion of 161, 689 will be added to the BSN and some proportion of the AD-‐D workforce will be reduced. This is to say just adding the 161,689 BSN alone will not result in achieving the 80/20 Initiative. For example, the following ratio fails to achieve the 80/20 goal:
152,660 + 161,689152,660 + 161,689 + (124,178)
= 0.72
This of course means that merely adding to the BSN in this case
cannot bring the ratio relationship between the BSN and AD-‐D workforce into line with the 80/20 Initiative without a reduction in the AD-‐D workforce.
In this case, α = 52.26%; this indicates that 84,492 BSN are needed [.5226 × 161,689] and the number of AD-‐D that need to be converted—i.e., the reduction in the AD-‐D workforce—is 64,890 AD-‐D [.5226 × 124,178].The demonstration proof is:
152,660 + 84,492152,660 + 84,492 + (124,178 − 64,890 )
= 0.80
Now, the DM realizes that it is possible to satisfy the IOM 80/20
Initiative by adding only 52.26% of the 161,689 BSN given that a simultaneous 52.26% of reduction in the AD-‐D workforce can be enforced by the health policy.
The general form of the conditional equation for determining this information is: Eq 16
80% =B + α ∆B
B + α ∆B + 1 − α ×(A)
Where: B and A are the baseline estimation of the number of the BSN and the AD-‐D
respectively,
The Technical Underpinnings and Extended what-‐if Analyses of the Decision Support Systems Programmed for the IOM 80/20 Nursing Initiative
21
Vol. III, Issue 3 June 2013
: ∆ B is possible number of BSN that could be added given the estimated political reality of a particular expenditure. For example, the $53.5 Million in the example
presented above. : α represents the percentage of ∆B that are needed to be added to the BSN workforce from the baseline number, B, and simultaneously that the number of AD-‐
D at baseline, A, is reduce to (1 -‐ α) × A. If the baseline ratio < 80% then it is immediate that 0 < α < 1.
In this case then, the DM learns that the actual resources needed to
train 84,492 (i.e., 52.26% of 161,689) BSN will be: 0.888Billion = 52.26% × [161,689] × $10,514
Instead of using 1.7 Billion for creating 161,689 BSNs via online programs, the DM now could spend only 0.888 billion for adding 84,492 BSNs, resulting in a saving of 0.812Billion= [$1.7 Billion -‐ $0.888Billion]. This savings of 0.812 Billion can be used to supplement the conversion cost to reduce the AD-‐D workforce IF it is needed. Let us now consider the scenario context variations. This is the final aspect of the What-‐If context.
The Best-‐Average/Usual-‐Worst Case Scenarios: Focusing the What-‐If Scenarios
According to Christenson (2006), experience teaches that What-‐If analyses can lack focus and this lack of focus creates volumes of output that overwhelms the DM and results in limited use of What-‐If analyses. One way to assure that this valuable idea of What-‐If modeling through the DSS does not fall into disuse due to information overload, is to create ONLY three DSS What-‐If versions and, of course, their respective SWAP benchmarks. Using a simple illustrative example, we wish to indicate how this Best-‐Average-‐Worse [BAW] Model generates important Range information and how this Range can be used by the DM in a focused way.
BAW Terminology. The term “Best Case” means whatever creates the relative lowest expenditure. For example, the Best Case in the Dynamic Change: DSS could be zero growth in the AD-‐DRN workforce and 10% growth in the BSN RN workforce. Or, when it comes to tuition expenditures, they will only grow by 0.5%, or, perhaps, expenditures for some program
The Technical Underpinnings and Extended what-‐if Analyses of the Decision Support Systems Programmed for the IOM 80/20 Nursing Initiative
22
Vol. III, Issue 3 June 2013
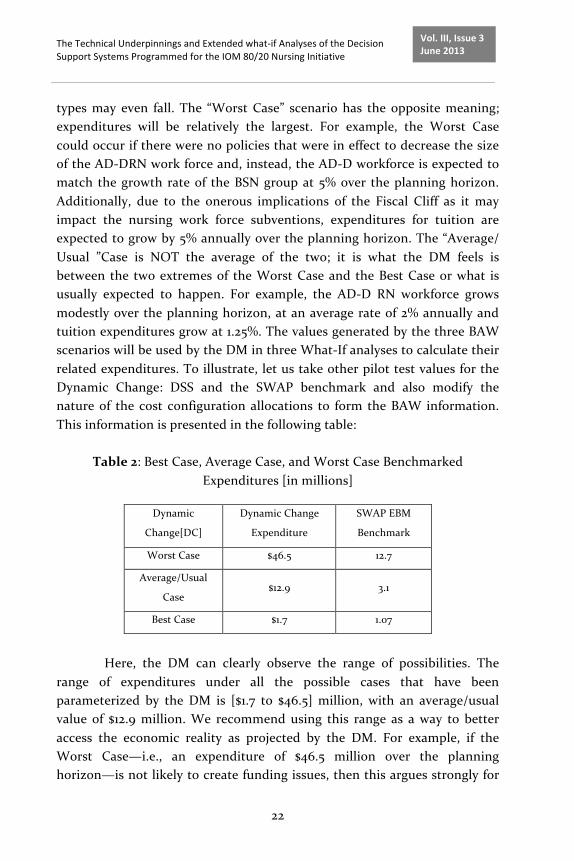
types may even fall. The “Worst Case” scenario has the opposite meaning; expenditures will be relatively the largest. For example, the Worst Case could occur if there were no policies that were in effect to decrease the size of the AD-‐DRN work force and, instead, the AD-‐D workforce is expected to match the growth rate of the BSN group at 5% over the planning horizon. Additionally, due to the onerous implications of the Fiscal Cliff as it may impact the nursing work force subventions, expenditures for tuition are expected to grow by 5% annually over the planning horizon. The “Average/ Usual ”Case is NOT the average of the two; it is what the DM feels is between the two extremes of the Worst Case and the Best Case or what is usually expected to happen. For example, the AD-‐D RN workforce grows modestly over the planning horizon, at an average rate of 2% annually and tuition expenditures grow at 1.25%. The values generated by the three BAW scenarios will be used by the DM in three What-‐If analyses to calculate their related expenditures. To illustrate, let us take other pilot test values for the Dynamic Change: DSS and the SWAP benchmark and also modify the nature of the cost configuration allocations to form the BAW information. This information is presented in the following table:
Table 2: Best Case, Average Case, and Worst Case Benchmarked
Expenditures [in millions]
Dynamic
Change[DC]
Dynamic Change
Expenditure
SWAP EBM
Benchmark
Worst Case $46.5 12.7
Average/Usual
Case $12.9 3.1
Best Case $1.7 1.07
Here, the DM can clearly observe the range of possibilities. The
range of expenditures under all the possible cases that have been parameterized by the DM is [$1.7 to $46.5] million, with an average/usual value of $12.9 million. We recommend using this range as a way to better access the economic reality as projected by the DM. For example, if the Worst Case—i.e., an expenditure of $46.5 million over the planning horizon—is not likely to create funding issues, then this argues strongly for
The Technical Underpinnings and Extended what-‐if Analyses of the Decision Support Systems Programmed for the IOM 80/20 Nursing Initiative
23
Vol. III, Issue 3 June 2013
moving forward with the advanced planning to add the required numbers of BSN so as to realize the 80/20 Policy Initiative. The other situation, of course, is that perhaps the Best Case—i.e., an expenditure $1.7 million—is not possible to fund. In this case, there needs to be consideration given to re-‐designing the specifications of the project using the EBM prompt idea discussed above; this means not more What-‐If analyses but a re-‐definition of the goals of the project—e.g., a less ambitious blending where the goal falls within the politically feasible Expenditure Range. Of course, this is the exact reason that the What-‐if-‐Analysis is inextricably linked to the BAW analysis; in our experience, going back to the policy drawing board and re-‐designing the project goals often happens. The final extension of the What-‐If analysis is to use the three What-‐If scenarios and collapse them down to one value. We recommend in this regard the simple and most useful Expectation Model.
Expectation Model Synthesis: The Final Profiling Statistic
A final important decision making input that is recommended is to collapse BAW Range of possible expenditures to a single number. The usual and recommended way to do this is to use the concept of expectation [Rancan (2013)]. In this modeling context the DM indicates the percentage of time or expectation for each of the states: The Worst Case, The Average/Usual Case and the Best Case. This means that the DM will form the convex combination of these three performance statistics to get an overall expectation; this is another way of saying that given all the myriad numbers of dynamic effects considered by the DM—e.g., the circumstances of the global economy and in particular the Fiscal Cliff that is likely to affect the US Health Care Delivery System [HCDS] for decades to come [Postal & Festa (2013) and Bush (2012)]the DM estimates that the Worst Case could happen 27% of the time and that the Best Case could be the eventuality 38% of the time and so the Average Case will likely happen 35% of the time: [1-‐[27% + 38%]]. Applying these percentages to the BAW Range information in Table 2 we find the expectation to be:
Eq17 𝐸 𝐵𝐴𝑊 = $17.7: $46.5 𝑥 .27 + $12.9 𝑥 .35 + [$1.7 𝑥 .38]

The Technical Underpinnings and Extended what-‐if Analyses of the Decision Support Systems Programmed for the IOM 80/20 Nursing Initiative
24
Vol. III, Issue 3 June 2013
In similar fashion, the expectation of the Swap Ratio Benchmark will be: 4.9. The critical meaning of this expectation information is that the expectation of the BAW is a practical reality of the expenditure, as weighted by the DM. The Expectation is just as its label indicates—what the DM can expect given myriad dynamic effects. The Expectation can also be sees as what is the “best-‐bet” as to the actual expenditures in a dynamic and complicated world.
Conclusions
We have examined the technical inner workings of the two DSS, The Dynamic Change: DSS and a focused benchmark, the SWAP: DSS that were developed to assist heath planners in evaluating scenario alternatives regarding the ambitious project: The Robert Wood Johnson Foundation: Grant: [RWJ: 4466(2011)]in support of the Institute of Medicine’s [IOM] Committee on The Future of Nursing recommendation: “Increase the relative proportion of nurses with a baccalaureate degree to 80% by 2020”. Kovner, Lee, Lusk, Katigbak & Selander (2013).In addition, we demonstrated the What-‐If analysis concept and the EBM prompting useful in generating the various choice alternatives usually available to the DM in forming a policy package that is feasible and politically fundable. Finally, we noted that often the What-‐If concepts if not carefully focused can produce an overwhelming volume of information and the information overload negates the positives aspects of the What-‐If concept. In this regard we offered the Best, Average/Usual, and Worst Case as three What-‐If options. Further, these three BAW scenarios can be reduced to a single statistic using the Expectation Model.
The above information and the suggestions made to facilitate the utilization of these DSSs were here presented in detail so that the technical information will be transparently available in the case that other researchers will wish to modify these DSS. In this sense this is an important companion paper to the overview presented by Kovner, Lee, Lusk, Katigbak & Selander (2013). Simply put BOTH presentations are needed to realize the benefits of these DSS.
As a note of caution, a massive amount of information may be generated by the DM using these DSSs. It will be tempting to prepare many DSS What-‐if-‐Analyses and reports including all the information generated;
The Technical Underpinnings and Extended what-‐if Analyses of the Decision Support Systems Programmed for the IOM 80/20 Nursing Initiative
25
Vol. III, Issue 3 June 2013
this is en vogue as Transparency. Transparency is, of course, a good thing; however, too much information is just as bad as insufficient disclosure. A compromise, which we like to call the “pine-‐tree-‐ approach” is to adopt a reporting modality developed decades ago by many consulting organizations. In the pine-‐tree-‐ approach, one starts with a carefully crafted Executive Summary of approximately 150 words. That is, words only! An Executive Brief should follow this. It should be four or five pages in length, built around the summary performance statistics, including numbers, figures, and/or tables. This executive brief usually includes a one-‐page Technical Appendix explaining technical details that add to understanding of the Executive Brief. The Executive Brief can be followed by a White Paper where all the same information in the Executive Summary and Executive Brief are presented with full details. For example, we have seen White Papers which were internal communications on consulting engagements of 200 to 300 pages where 75% of the White Paper was Appendices. Therein lays the name the pine-‐tree-‐ approach; as one move down from the top of the pine tree, there are more and more branches extending out in all directions. We find the pine-‐tree-‐approach serves brevity without compromising transparency.
References
[1] Adya, M., Lusk, E. J., & Belhadjali, M. (2009). Decomposition as a Complex-‐skill Acquisition Strategy in Management Education: A Case Study in Business Forecasting. Decision Sciences Journal of Innovative Education 7:9-‐36.
[2] Borenstein, S & Robertson, J. (2011). IBM ‘Watson’ Wins Jeopardy: Computer Beats Ken Kennings, Brad Rutter, AP: On-‐Line: http://www.huffingtonpost.com/2011/02/17/ibm-‐watson-‐jeopardy-‐wins_n_824382.html
[3] Bush, H. (2012). Caring for the Costliest. Hospitals & Health Networks86: 24-‐29.
[4] Christensen, M. (2006). Avoiding Common Dashboard Pitfalls.DM Review 11: 28-‐43.
[5] Jayanti, V. (2003). Game Over: Kasparov and the Machine, DVD Documentary: Alliance Atlantis & National Film Board of Canada.
The Technical Underpinnings and Extended what-‐if Analyses of the Decision Support Systems Programmed for the IOM 80/20 Nursing Initiative
26
Vol. III, Issue 3 June 2013
[6] Kester, L., Kirschner, P. A., & van Merrienboer, J. J. G. (2005). The Management of Complex Skill Overload During Complex Cognitive Skill Acquisition by Means of Computer Simulated Problem Solving. British Journal of Educational Psychology 75:71-‐85.
[7] Kovner, C., Katigbak, C., & Selander, N. (2013a). Manual for SWAP: Decision Support System. Download-‐Access: Request: Dr. Kovner: [[email protected]]
[8] Kovner, C., Katigbak, C., & Selander, N. (2013b). Manual for Dynamic Change: Decision Support System. Download-‐Access: Request: Dr. Kovner: [[email protected]]
[9] Lee, F. J., & Anderson, J. R. (2001). Does Learning a Complex Task Have to be Complex?
[10] A Study in Learning Decomposition. Cognitive Psychology 42:267-‐316. [11] MacGregor, D. G. (2001). Decomposition for Judgmental Forecasting
and Estimation. [12] In JS Armstrong (Ed.), Principles of forecasting: A Handbook for
Researchers and Practitioners, 107-‐123, Norwell, MA, Kluwer Academic Publishers.
[13] Postal, A. & Festa, E. (2013) Battle Plans. National Underwriter Life & Health: http://search.proquest.com/docview/1266329845?accountid=14707Copyright
[14] WSJ: (2013) Death Tax Made More Deadly, Wall Street Journal, Eastern edition [New York, N.Y] 16 Apr.
[15] Rancan, A. (2013). Modigliani's and Simon's Early Contributions to Uncertainty (1952-‐61).History of Political Economy 45:1-‐33.

Scientific Papers (www.scientificpapers.org) Journal of Knowledge Management, Economics and Information Technology
27
Vol. III, Issue 3 June 2013
Organizational Knowledge Management Movement Strategies
Author: Alen Badal, Modesto, California, [email protected]
Organizational behaviour is often dependent on the strategic movement of internal knowledge for success. Organizational knowledge management methodologies require the involvement of stakeholders. In large organizations, involved stakeholders shall be selected by the entire membership. Key involvement roles and considerations should be offered to/involve the ‘least likely to participate’. Suck stakeholders often possess the most influential power to move the stakeholders; if not, they demonstrate a true commitment to involve all in the movement of knowledge. The purpose of this article is to discuss organizational involvement strategies for the optimal movement or organizational knowledge management. Keywords: organizational behaviour; knowledge management; strategic management; organizational communication.
Introduction An effective characteristic of organizations is their ability to move knowledge that is both vertically and horizontally aligned, understood, supported, implemented and assessed. Too often organizations expend both human and monetary resources on ensuring effective communication strategies are in place and received by the stakeholders within organizations. The process of managing knowledge is both an art and a science. Conventional methodologies of managing human intellect and contributions, once appropriate manners are in place, shall not be predicated on face-‐to-‐face, micromanaging techniques often in practice. The
2
Organizational Knowledge Management Movement Strategies
28
Vol. III, Issue 3 June 2013
key is to set up an environment where stakeholders freely produce and willingly will share how much ‘they love their job’! Such unsolicited validations ensure allegiance, follow-‐thru, and ultimately, if not immediately, the steps towards desired organizational outcomes. The environment is productively predictable with respect to organizational behaviour, work responsibilities, etc. The salient factor which remains unclear is how to specifically manage and move knowledge, organizationally? The aim of this article is to outline processes and procedures intended to serve as a benchmark for organizations interested in effectively implementing not only knowledge management principles and practices, but also dispersing it organization-‐wide. All too often leadership may benefit from a rotation back to associate levels to phenomenological experience roles, duties, and procedures, etc. They are in place to lead. Perhaps leadership should start by serving ‘undercover’ akin the award-‐winning show (broadcasted on an international basis) by Stephan Lambert, entitled “Undercover Boss”. There is no single best way for leadership to understand the underpinnings without ‘living the job’. It is not enough to have promoted up to leadership and it’s done; we must recycle our visions of the business on a regular basis by way of direct involvement as a stakeholder (non-‐leadership role).
Leadership must understand how messages/knowledge is heard and perceived. All too often knowledge is disseminated from a top-‐down basis, without a true understanding as to how it’s perceived and accepted. Regardless, the timing, pace, amount, and depth of knowledge requires benchmarks, control, and justification.
Knowledge Management
Knowledge management within the context of this article is defined as the communication of written and/or oral material intended to inform, conform, structure, etc. a movement of information from one to another. The salient goal of leadership, given an effective approach to the movement of knowledge, shall be to ensure all stakeholders are each respective leaders within the organization. Once a degree of information ownership is received by stakeholders in a meaningful, logical manner, there is a higher likelihood of implementation. The process also ‘models’ an appropriate and optimal manner to communicate, organizationally.
Organizational Knowledge Management Movement Strategies
29
Vol. III, Issue 3 June 2013
Movement Strategies
It is not enough to communicate the knowledge today. Sample knowledge can be, but not limited to, staff / faculty meeting content, memorandums, etc. What’s the value of knowledge if it’s not received and implemented? How can we be sure each stakeholder has had input in the creation and distribution of knowledge; hence, ‘walking the talk’? The movement objective should be to effectively management the timing, content, presentation, and amount, etc. of knowledge.
A Scenario
An organization has spent much time in developing a core set of strategies and objectives that it will implement. Such strategies, etc. have been compiled with the input of a sample of stakeholders ranging from perhaps the Board of Directors, shareholders, CEO, Executive Cabinet, line managers, leaders, and associates. However, when delivering the knowledge, its contents have lacked the acceptance and follow-‐thru by some stakeholders. In such a case, what may be the reasoning behind the lack of follow-‐thru when leadership was involved? Could it have been due to the lack of the entire organization being represented in the decision-‐making/contribution phases? It only takes one person to feel ‘left-‐out’ to potentially sabotage the reception of information. How can leadership ensure members are involved in each of the phases? The process should involve cross-‐sectional involvement of stakeholders. When all cannot be involved, it is advisable that elected membership coupled with the least likely to be involved, but sabotage, be included on an invitation basis. The selection/involvement process should be made public with no hidden agendas.
Measurement of Knowledge Implementation
What percent of organizational knowledge is handled by which level? Does management or associates work most with the knowledge? What level of involvement has all the different organizational stakeholders have had in the birthing of knowledge? Today, it’s not enough to communicate knowledge
Organizational Knowledge Management Movement Strategies
30
Vol. III, Issue 3 June 2013
without ensuring a complete understanding and buy-‐in of what’s being distributed. How much value does anything have if we’ve not embraced it? What level of accountability can an organization expect from its stakeholders whom have not been in direct involvement with the creation and dissemination of knowledge? It becomes easier with the buy-‐in of knowledge, where the ‘good news’ just can’t seem to be spread fast enough? While not politically or perhaps organizationally correct, witnessing knowledge distributed via a meeting and/or memorandum is not enough. How can an organization involve its entire stakeholders in the creation and distribution of knowledge? The following should be considered: 1. Involve representation from each respective department. 2. Ensure representatives specifically communicate outcomes with the rest of the line staff (each and every one). 3. Be sure to promote the process and specific involvement of the creation of knowledge with all. For example, celebrate and communicate the achievements, organizationally. This process ensures that literally all are involved and most importantly, seeing the contributions of knowledge fitting the paradigm. This process would solidify to all how and where each individual’s contributions of knowledge were considered or lack of (reasoning provided as much as possible). 4. Within organizations there are leaders and followers. Also, there are those that have the great potential to be leaders, given they’re shown their strategic contributions of knowledge are not only valued and fitted/implemented. It’s a sharing game in organizations, such as it’s in a personal relationship within a household. How valued would one person feel if s/he’s ideas always take a back seat and/or brushed-‐off? True-‐shared decision-‐making strategies involving all must not only be considered, but advertised, religiously implemented and outcomes/process assessments communicated, organizationally. 5. Lastly, ensure the knowledge is tied to organizational goals, measureable, and attainable. Ensure benchmarks are in place and devised and implemented by the stakeholders, akin the process of involving the stakeholders in the creation of knowledge.

Organizational Knowledge Management Movement Strategies
31
Vol. III, Issue 3 June 2013
Expected Outcomes
An involved organization holds itself (and each respective stakeholder) responsible for the creation, distribution, and metrics of organizational knowledge. It’s leadership’s responsibility to essentially create an inverted, triangular structure within the organization, involving each associate. The outcomes will not only be embraced by the leaders and followers, but those that are not usually classified as leaders or followers. Does your organization have associates that are not usually leading or following? These are people that find themselves doing their job, but lacking true involvement and buy-‐in with the transformation of knowledge. Aiming to involve such associates will show them they’re being valued and each of their recommendations is considered. Involving the popular or political vote within organizational knowledge management is counterproductive.
References
[1] Bhatt, G. D. (2002). Management strategies for individual knowledge and organizational knowledge. Journal of Knowledge Management, 6 (1), 31
[2] Enrique, C. C., Patrocinio, Z. S. & Pertusa, O. E. (2007). Organizational structure features supporting knowledge management processes. Journal of knowledge management, 11 (4), 45-‐57
[3] Ionescu, L. (2008, September). Organizational behavior and knowledge management processes. Economic Management and Financial Markets, 3 (3), 52-‐56
[4] Rai, R. K. (2011). Knowledge management and organizational culture: a theoretical integrative framework. Journal of Knowledge Management, 15 (5), 779-‐801
[5] Wang, K., Chiang, C., & Tung, C.M. (2012, July). Integrating human resource management and knowledge management: From the viewpoint of core employees and organizational performance. International Journal of
Organizational Innovation (Online), 5 (1), 109-‐137
Scientific Papers (www.scientificpapers.org) Journal of Knowledge Management, Economics and Information Technology
32
Vol. III, Issue 3 June 2013
Impact of the Influential Factors of Economic Competitiveness upon Romania’s West Region Firms
Authors: Diana Tănase, Department of Business Engineering, Faculty of Engineering and Management, Eftimie Murgu University of Reşiţa, Romania, [email protected], Adrian Tănase, Department of Economics, Faculty of Economics, Eftimie Murgu University of Reşiţa, [email protected], Florin Franţ, Department Max Weber, Faculty of Administrative Sciences, Eftimie Murgu University of Reşiţa, Romania, [email protected]
In today’s context, marked by globalization and increasingly wide recognition of interdependencies, competitiveness has become an essential condition for market success. Starting from these considerations, the authors of the present paper intend to forward a research survey related to the impact of the influential factors of economic competitiveness on the firms operating in Romania’s West Region, research using a direct study method to grasp the firm managers' perceptions regarding competitiveness factors of influence. The paper ends by presenting several proposals regarding the identification of measures for the economic competitiveness growth, both micro-‐ and macro-‐economic. Consequently the paper approaches a subject of current interest, which stirs the preoccupation of specialists, governments, mass media and, last but not least, the interest of entrepreneurs, irrespective of their domain of activity. Keywords: competitiveness; productiveness; firms; Romania
3

Impact of the Influential Factors of Economic Competitiveness upon Romania’s West Region Firms
33
Vol. III, Issue 3 June 2013
Introduction
The issue of economic competitiveness has constantly been on the public agenda these past years. Competitiveness is a complex concept, intensely debated today by economists and politicians throughout the world, by the press and even by mere citizens.
The first approaches of the competitiveness concept belong to the representatives of the classical school, Adam Smith (1723 -‐ 1790) and David Ricardo (1772 -‐ 1823) – theoreticians of issues such as international trade, formation of external prices or international labor division. [1], [2] Several decades later, in the mid-‐19th century, Marxist economists granted an increased attention to the influence of social-‐political environment upon the economic development. Obviously, the concept of competitiveness is further developed by other authors such as J. M. Keynes, Francois Perroux, Robert Solow, Joseph Schumpeter, Peter Drucker, Paul Michael Romer, Robert Lucas, Jr., Michael Porter, Nicholas Negroponte etc. [3]
Although the concept of competitiveness is the result of many studies elaborated along hundreds of years, conducted by numerous economists, the definition of competitiveness still remains a controversial matter.
Generically, the concept of competitiveness expresses the capacity of firms, economies or regions to remain in the domestic and external competition and to obtain some economic advantages from it, as competitiveness is the driving force underlying economic efficiency and progress.
The World Economic Forum [4] defines competitiveness as being the set of policies, institutions and factors that determine a country’s level of productiveness.
Consequently, competitiveness means productiveness understood as added value, achieved on the basis of a unit of production factor used. It has a dynamic character, and novelties play the part of accelerators for the activity of enterprises, which are forced to abandon inertia and stimulate innovation. [5]
On the other hand, competitiveness may be regarded as the ability of enterprises or countries to design, manufacture and sell goods and services with a series of characteristics (related to prices and to other elements), which make them much more attractive for customers than the goods offered by the other competitors [6]; in other words, competitiveness refers to the set of conditions a merchandise must fulfill in order to ensure
Impact of the Influential Factors of Economic Competitiveness upon Romania’s West Region Firms
34
Vol. III, Issue 3 June 2013
its penetration, maintenance and position strengthening on a certain market, in a climate of competition with other similar products.” [7]
Synthesizing the two aforementioned definitions, we may say that in general we understand by competitiveness the ability of an economic entity to overcome “the competition partners” in a certain time horizon as regards the common goals.
Determined mainly as ratio of productiveness against factor costs, price-‐based competitiveness is reached especially by the advantages of scale economies, while quality-‐based competitiveness is reached especially by means of niches and product differentiation [8]
Regarded nationally, competitiveness refers to the capacity of a state to create, produce and distribute products and services to the international trade, the gains earned falling within the category of own resources; in other works, competitiveness is the capacity of nations to pass the test of international free market, while increasing real national revenues in the process. [9]
From the previous definitions it is understood that, due to the competition’s accenting on the international level, the role played by national economies becomes increasingly important, as competitiveness means the capacity of an economy to produce goods and to provide services able to respond to international competition, in the conditions of a real increase of the internal revenue. And a nation is competitive if the regions it comprises are competitive in their turn.
In this context, regional competitiveness, one of the preoccupations of the EU 2020 Strategy, has become in these past decades one of the most frequently debated topic and the most frequently used key concept in the regional socio-‐economic analysis. Regional competitiveness represents the capacity to produce goods and services that satisfy the requirements of the domestic and external market, with the maintenance of a high and sustainable level of economic and social development. [10]
Regarded from a simpler perspective, regional competitiveness may be defined as being the success registered by regions in the competition among them. [11]
On the other hand, Michael Storper [12] describes regional competitiveness as being “the capacity of a region to attract and retain firms

Impact of the Influential Factors of Economic Competitiveness upon Romania’s West Region Firms
35
Vol. III, Issue 3 June 2013
that have a stable or growing market share in a certain activity, and also the maintenance of stable or increasing living standards for those involved in it.” Consequently we may affirm that regional competitiveness can be defined as the optimum development capacity of a region, as integrated part of national economy, in accordance with the principles of sustainable development, able to ensure the possibility of reaching a high living standard for its inhabitants.
The main economic-‐social coordinates of the West Region
Established on October 28th 1998 and including, from the administrative viewpoint, the counties Arad, Caraş-‐Severin, Hunedoara and Timiş, the West Development Region is one of Romania’s eight development regions. The development regions are constituted according to Law no.315/2004; they are not administrative-‐territorial units and are not legal persons. They were formed “in order to ensure the frame for the elaboration, implementation and assessment of regional development policies.” [13]
The West Region is part of the Fourth Macro region (together with South-‐West Region Oltenia), as well as part of the DKMT Euro region ( Danube – Criş – Mureş – Tisa), which comprises the four counties of the West Region, four counties in Hungary and the autonomous region Vojvodina in Serbia.
The West Region has a surface of 32,034 km2 and represents 13.4% of the country’s surface. In this region, the county with the largest surface is Timiş (8697 km2, 27.15% of the region’s area), followed by Caraş-‐Severin (8520 km2, 26.60% of the region’s surface). The smallest county when it comes to surface in the West Region is Hunedoara (7063 km2, representing 22,05% of the West Region). Arad county has a surface of 7754 km2, which represents 24.20% of the region area.
As for the administrative organization of the territory, the West Region had, on December 31st 2011, 42 towns (of which 12 cities), 281 communes and 1327 villages. The Hunedoara county contains the most numerous towns (14, of which 7 cities), the less numerous communes (55) and the most numerous villages (457). The lowest number of towns is encountered in Caraş-‐Severin (8, of which 2 cities); in the same county there are 69 communes and 287 villages. Arad and Timiş counties have the same number of towns – 10 (1 city in Arad and 2 in Timiş). Moreover, there are 68
Impact of the Influential Factors of Economic Competitiveness upon Romania’s West Region Firms
36
Vol. III, Issue 3 June 2013
communes and 270 villages in Arad, whereas Timiş has 89 communes and 313 villages. [14]
On July 1st 2011, the population of the West Region numbered 1,910,469 people (Timiş – 679,848, Hunedoara – 457,932, Arad – 454,073, Caraş-‐Severin – 318,616). [14]
The discrepancies among the West Region counties are apparent not only when it comes to the number of the population and the administrative organization of the territory, but especially as regards the number of companies operating in these counties.
Thus, of the total 51,508 firms in the West Region, almost half are in Timiş county (23,497 firms) and about a quarter in Arad county (12,184 firms). There are 10,366 enterprises in Hunedoara county, whereas Caraş-‐Severin has only 5,461 firms.
Both in the whole region and in the case of each county, the most numerous firms operate in wholesale and retail commerce and vehicles and motorcycles repair (19,518 firms in the West Region).
A small number of companies deal in the manufacture and supply of electric and heat energy or gases, hot water and air conditioned (49 firms in the region), as well as in extractive industry (175 firms in the region) and private education (organization in the region). [13]
General presentation of the research
As we lack sufficient statistic or representative information for formulating any conclusions regarding the impact of the influential factors of economic competitiveness upon the West Region firms, we conducted, for this purpose, a direct survey research applied to the firms operating in the region.
The research was conducted in the autumn of 2012, relying on a programme comprising the following elements:
• definition of the research purpose; • elaboration of the research objectives and hypotheses; • estimation of the value of information acquired from the research; • selection of the sources of information; • selection of the modalities of data collection and systematization; • collection of information; • processing of information;
Impact of the Influential Factors of Economic Competitiveness upon Romania’s West Region Firms
37
Vol. III, Issue 3 June 2013
• analysis and interpretation of information; • elaboration of conclusions.
For detailing the previously discussed aspects, we resorted to methods of direct study of the extent to which the influential factors of competitiveness determine the success of firms on the market, methods that are grounded on collecting information directly from the managers of the enterprises.
These direct methods may be classified according to several criteria, the most important being the following [15]:
a) According to the nature of the collected information, we distinguish between:
• qualitative studies; • quantitative studies. b) According to the manner of the investigation deployment, the direct
studies exhibit the following modalities of realization [16]: • occasional inquiry; • panels of consumers, enterprises etc.
Thus, in view of studying different aspects related to the determining factors of a certain process, we may resort both to qualitative research and quantitative research. The qualitative research methods are generally used for exploring a phenomenon or a process, a less known issue etc., and consist in the collection and analysis of the elements allowing the explanation of the opinions and behaviors of those involved in the studied issues [15].
Since the mid-‐20th century, the problems related to qualitative research have been approached in relation with the quantitative research that had already acquired a wide recognition, as a result of its successful use in the most diverse fields.” [17]. By means of qualitative research methods researchers will identify certain critical aspects, starting points in the analysis of complex phenomena.
If in the case of qualitative research (exploratory research) we aim at understanding the phenomenon under study, in the case of the quantitative approach – descriptive or causal research – the objective of the research is the quantification of data and generalization of results to the entire statistic community studied. [17]
Impact of the Influential Factors of Economic Competitiveness upon Romania’s West Region Firms
38
Vol. III, Issue 3 June 2013
In this context, as the documentary or qualitative studies are not always sufficient for the full comprehension of the studied issues (the results obtained are in fact mere hypotheses), the validation of the information formulated by means of these techniques will be made by quantitative researches. Thus, the quantitative techniques can reveal the relations and perhaps the existing (mis) balances between the models constituting a statistic model. The information of this kind is useful in the efforts of reorienting social-‐economic macro-‐strategies in the field of the production of goods and services, from the sphere of the import-‐export policies, price policies, policies related to population’s incomes, in the design of certain (micro, macro) strategies on the markets of diverse goods and services etc.
In the case of the present research, considering the research objective, we considered it opportune to conduct a quantitative study, whereas the choice of the investigation modality was that of an occasional inquiry.
Constituting the sample – selecting the sampling method
The most important feature of the samples used in researches is representativeness [17], because the “unrepresentative samples can lead to erroneous results and at any rate do not offer the possibility of generalization.” [18]
In view of obtaining a sample constituting a representative entity we would make prior decisions related to the correct definition of the studied community, determination of the polling basis, selection of an adequate sampling method etc.
Furthermore, we should also consider other important aspects representativeness [17]:
• the observation units must be clearly defined, distinct, but similar as regards their characteristics and present only once in the sample structure;
• the observation units should be selected objectively and systematically, ensuring the avoidance of errors, influences or distortions.
There are two large categories of sampling methods [17]: a) Probabilistic sampling methods – they rely on the principle
according to which each element of the studied statistic community

Impact of the Influential Factors of Economic Competitiveness upon Romania’s West Region Firms
39
Vol. III, Issue 3 June 2013
has a determinable, equal and non-‐null probability to be selected as observation unit representativeness.
b) The empirical sampling methods – are used when the researcher has information allowing him to estimate the selection probability of the components of the studied community and of their inclusion into the sample representativeness. Thus, these methods rely on a rational choice of the observation
units and must respect rules referring either to the features of the studied statistic community, or the place and moment of the inquiry.
The most frequently used un-‐probabilistic sampling methods are [15]:
• the method of quotas; • the method of itinerary.
When selecting the sampling methods we must take into account the following factors [15]:
• sampling cost (the probabilistic methods are more expensive than the empirical ones);
• existence and availability of a polling basis, i.e. the “list” of all elements that compose the investigated community;
• the possibility to identify the units from the polling basis, i.e. the persons, groups of persons, companies etc. Considering all these aspects, we considered it adequate to use the
quotas method as sampling method. The principle of this method – the most frequently used
probabilistic sampling method – consists in the building of a reduced model of the studied population, according to their known features [15].
In other words, “the sample must comprise all its elements in the same proportion as the elements of the general community they come from”. [18]
Consequently, this type of sampling implies the necessity to possess certain statistic data related to the investigated community (in this case we used data regarding the number and structure of enterprises in the West Region, using as source the Territorial Statistics 2010, material elaborated by the National Statistics Institute [13]). In this context, the construction of the sample requires the completion of two stages [15]:
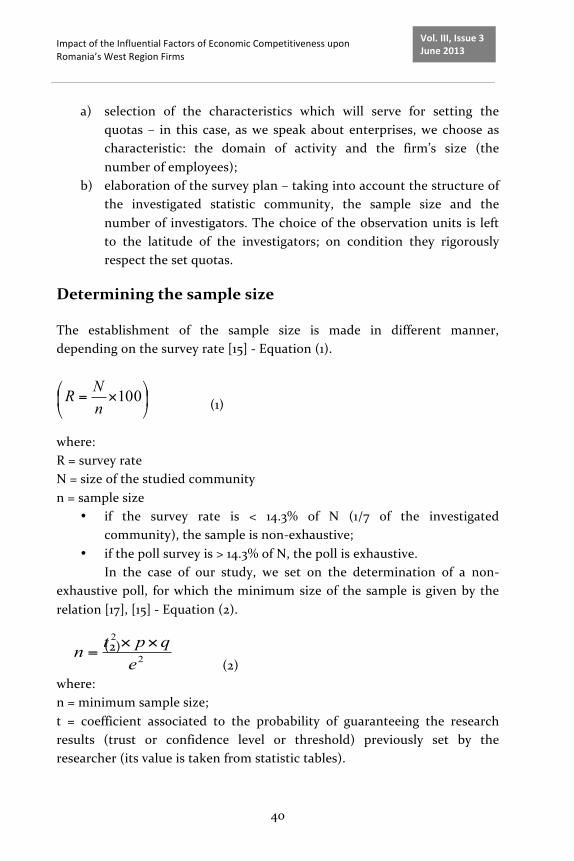
Impact of the Influential Factors of Economic Competitiveness upon Romania’s West Region Firms
40
Vol. III, Issue 3 June 2013
a) selection of the characteristics which will serve for setting the quotas – in this case, as we speak about enterprises, we choose as characteristic: the domain of activity and the firm’s size (the number of employees);
b) elaboration of the survey plan – taking into account the structure of the investigated statistic community, the sample size and the number of investigators. The choice of the observation units is left to the latitude of the investigators; on condition they rigorously respect the set quotas.
Determining the sample size
The establishment of the sample size is made in different manner, depending on the survey rate [15] -‐ Equation (1). (1) where: R = survey rate N = size of the studied community n = sample size
• if the survey rate is < 14.3% of N (1/7 of the investigated community), the sample is non-‐exhaustive;
• if the poll survey is > 14.3% of N, the poll is exhaustive. In the case of our study, we set on the determination of a non-‐
exhaustive poll, for which the minimum size of the sample is given by the relation [17], [15] -‐ Equation (2).
(2)
(2) where: n = minimum sample size; t = coefficient associated to the probability of guaranteeing the research results (trust or confidence level or threshold) previously set by the researcher (its value is taken from statistic tables).
2
2
eqptn ××
=
100⎟⎠
⎞⎜⎝
⎛ ×=nNR
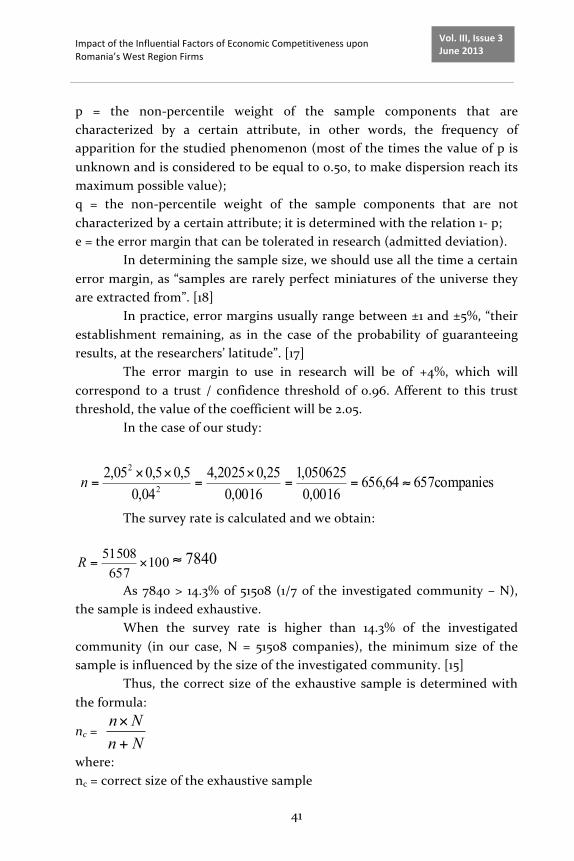
Impact of the Influential Factors of Economic Competitiveness upon Romania’s West Region Firms
41
Vol. III, Issue 3 June 2013
p = the non-‐percentile weight of the sample components that are characterized by a certain attribute, in other words, the frequency of apparition for the studied phenomenon (most of the times the value of p is unknown and is considered to be equal to 0.50, to make dispersion reach its maximum possible value); q = the non-‐percentile weight of the sample components that are not characterized by a certain attribute; it is determined with the relation 1-‐ p; e = the error margin that can be tolerated in research (admitted deviation).
In determining the sample size, we should use all the time a certain error margin, as “samples are rarely perfect miniatures of the universe they are extracted from”. [18]
In practice, error margins usually range between ±1 and ±5%, “their establishment remaining, as in the case of the probability of guaranteeing results, at the researchers’ latitude”. [17]
The error margin to use in research will be of +4%, which will correspond to a trust / confidence threshold of 0.96. Afferent to this trust threshold, the value of the coefficient will be 2.05.
In the case of our study:
The survey rate is calculated and we obtain:
10065751508
×=R 7840≈
As 7840 > 14.3% of 51508 (1/7 of the investigated community – N), the sample is indeed exhaustive.
When the survey rate is higher than 14.3% of the investigated community (in our case, N = 51508 companies), the minimum size of the sample is influenced by the size of the investigated community. [15]
Thus, the correct size of the exhaustive sample is determined with the formula:
nc = NnNn
+×
where: nc = correct size of the exhaustive sample
companies65764,6560016,0050625,1
0016,025,02025,4
04,05,05,005,2
2
2
≈==×
=××
=n
Impact of the Influential Factors of Economic Competitiveness upon Romania’s West Region Firms
42
Vol. III, Issue 3 June 2013
n = sample size calculated with the specific formula (n = t2 p q / e2) N = size of the investigated community
In the case of the present research,
nc = 5150865751508657
+× =
5216533840756 = 648.73 649≈ firms
Presentation of the sample subjected to the research
In the case of the present research, the main criteria in selecting the observation units were the following:
I. Firm’s domain of activity -‐ 4 levels; • industry • constructions • commerce; repair of motor vehicles and motorcycles • other services
II. Firm’s size (according to the number of employees) -‐ 4 levels: • micro-‐enterprise (0-‐9 employees) • small enterprise (10-‐49 employees) • medium enterprise (50-‐249 employees) • big enterprise (250 employees and more)
Additional details: In the category “other services” we included: production and supply
of electrical and heat energy, gases, hot water and air conditioned; water supply, husbandry, waste management, field decontamination activities; transport and storage; hotels and restaurant; information and telecommunications; real estate transactions; scientific and technical professional activities; activities of administrative and support services; activities of education, health and social assistance (only units organised as companies); activities of show business, cultural and recreational; other activities and services.
The observation units are not comprised in the sample randomly, but on the basis of a certain selection procedure, enabling the statistic inference from the values characteristic to the sample to those valid for the entire investigated community. [19]
In order to ensure the sample representativeness, we chose, from among the sampling methods, the method of quotas, the quotas being
Impact of the Influential Factors of Economic Competitiveness upon Romania’s West Region Firms
43
Vol. III, Issue 3 June 2013
calculated based on the data taken from the Territorial Statistics 2010, elaborated by the National Statistics Institute of Romania. [13]
Thus, the questionnaire was applied to the managers of a number of firms from all four counties, as follows: Arad (153 firms), Caraş-‐Severin (69 firms), Hunedoara (131 firms) and Timiş (296 firms).
Interpretation of the study results Way in which subjects perceive the institutional environment in Romania
Remark: When assessing the institutional environment we must keep in mind the observance of the right of ownership (including the intellectual one), ethics and corruption, confidence in politicians, traffic of influence, government efficiency, security of individuals and society, ethical behavior of firms etc. Of all the questioned subjects, 39.14% (29.87% from industry, 43.05% from constructions, 26.94% from commerce and 52.55% from other services) declare that the Romanian institutional environment is extremely inefficient, this idea being preponderantly encountered among the mangers of medium enterprises (42.86%).
On the other hand, only 0.62% considers that the institutional environment in our country is very efficient. We should also mention that 29.89% of the interviewed subjects think that the institutional environment is undergoing a process of deterioration, 16.95% consider that, although on a low level, a certain improvement of the institutional environment is apparent, whereas 13.40% declare that the institutional environment is less efficient.
Respondents’ perception about the degree of infrastructure development in our country
Remark: The aspects taken into account are energy and telephone infrastructure and especially transport infrastructure: quality of roads, railways, naval-‐maritime and air transport infrastructure.
Almost three quarters of the interviewed persons – 73.04% (76.62% in industry, 75.00% in constructions, 70.61% in commerce and 73.72% in other services) – consider that our country’s infrastructure is insufficiently

Impact of the Influential Factors of Economic Competitiveness upon Romania’s West Region Firms
44
Vol. III, Issue 3 June 2013
developed, both in dimensions and as regards quality, and the managers of big companies are the ones who preponderantly think that. The lowest percentages (1.85%) were recorded among those who think that infrastructure is at a very high level (0% in industry, 0% in constructions, 3.27% in commerce and 1.57% in the case of other services). The rest of 25.11% of those interviewed consider that infrastructure in Romania has reached a medium level of development.
Way in which subjects perceive the macroeconomic environment in Romania
Remark: We must refer to inflation, interest rates’ gap, governmental budget balance, governmental debt etc.
Most respondents (54.70%) reckon that the macroeconomic environment in Romania exhibits fluctuations and generates a rather reduced level of investments (57.14% from industry, 54, 17% from constructions, 54.29% from commerce and 54.51% from other services), this perception being spread especially among the managers of big enterprises (66.67%).
On the other hand, only 1.23% considers that the macroeconomic environment in our country is stable, favoring thus the incorporation and development of companies.
Furthermore, we should underline that very many respondents (44.07%) claim that the macroeconomic environment in Romania is unstable and does not encourage investments.
Extent to which the exchange rate influences the activity of the companies
More than half of the people questioned – 53.47% (industry 57.14%, constructions 69,45%, commerce 46.94% and other services 54,12%) declare that the fluctuations of the exchange rate does not influence the activity of their company, in most cases their explanation being that as long as the payment to the suppliers is made in lei, and on the other hand the income earned from the merchandise sales are also in Romanian currency, the fluctuations of the exchange rate do not influence the activity of the firm directly.
Impact of the Influential Factors of Economic Competitiveness upon Romania’s West Region Firms
45
Vol. III, Issue 3 June 2013
The lowest percentages – 12.48% (15.58% in industry, 11.11% in constructions, 7.75% in commerce and 16.47% in other services) were recorded among those who declared that the activity of the firm is advantaged by the appreciation of the main hard currencies (euros, dollars etc.), this situation being encountered especially in the case of big companies that have also an external sales market, as well as in the case of other enterprises which, even if they operate on the domestic market, generally express the results of their activity in the European currency.
We must point out that rather many respondents (34.05%) claim that the activity of the firm they manage is advantaged by the appreciation of the national currency, the main explanation being that the prices they have to pay to suppliers are, in some cases, expressed in euros, and consequently an appreciation of the latter means higher costs for them.
Respondents’ perception related to the quality of health services in Romania
Most of the persons questioned (53.77%) consider that the health services in Romania are unsatisfactory and way below the European Union level (58, 44% from industry, 52.78% from constructions, 53.88% from commerce and 52.55% from other services), and this opinion is shared especially by the managers of big companies.
Extremely few (1.08%) are those who declare that health services in our country correspond to the quality standards (0% in industry, 1.39% in constructions, 2.04% in commerce and 0.39% in the case of other services), Moreover, we must remark that 45.15% of the subjects think that health services provided in Romania are in general insufficient and of poor quality.
Subjects’ perception about the extent to which education and professional training influence a firm’s competitiveness
Most of the interviewed subjects (57.32%) affirm that the training of the employees is crucial for a firm’s success (61.04% in industry, 59.72% in constructions, 52.65% in commerce and 60.00% in the case of other services), and we find this opinion especially among the mangers of big companies.
Impact of the Influential Factors of Economic Competitiveness upon Romania’s West Region Firms
46
Vol. III, Issue 3 June 2013
On the other hand, only 2.31% consider that in general the personnel qualification is less important for the growth of a firm’s efficiency (3.90% in industry, 5.56% in constructions, 3.27% in commerce and 0% in the case of other services).
Furthermore, we remark the relatively high percentage (40.37%) of those who declare that, in their opinion, education and professional training are important, but not decisive for a firm’s success on the market.
Way in which respondents perceive the level of academic training offered by the Romanian educational system
The majority of the people questioned (58.86%) consider that the level of university training provided by the Romanian educational system is high from the theoretic viewpoint, but insufficient from the practical perspective (59.74% in industry, 55.56% in constructions, 57.95% in commerce and 60.39% in other services), the highest percentages being recorded in this respect in the case of the answers given by the managers of big enterprises (66.67%), and medium enterprises (64.29%).
Very few subjects (3.54%) declare that in general the knowledge acquired by the graduates meet the labor market requirements (6.49% in industry, 2.78% in constructions, 3.27% in commerce and 3.14% in the case of other services).
Moreover, we must underline that more than one third of the respondents (37.60%) consider that the university training provided by the Romanian educational system is poor and does not meet the requirements formulated by companies.
Respondents’ perceptions related to the level of taxes and fees incurred to Romanian firms
Very many (88.13%) claim that taxation is extremely high in Romania and does not encourage the implementation of entrepreneurial activities (88.31% in industry, 87.50% in constructions, 87.76% in commerce and 88.63% in the case of other services). The highest percentages were recorded, in this respect, among those who manage micro-‐enterprises (90.56%).
At the opposite pole, with only 1.39% (0% in industry, 0% in constructions, 1.22% in commerce and 2.35% in the case of other services),

Impact of the Influential Factors of Economic Competitiveness upon Romania’s West Region Firms
47
Vol. III, Issue 3 June 2013
we find the subjects who consider that the level of fees and taxes incurred to Romanian firms is lower than in most EU member states, the smallest number of answers in this category belonging to those managing micro-‐enterprises and also big companies.
On the other hand, only 10.48% of the interviewed subjects think than in Romania taxation is situated at a moderate level.
Way in which Romania’s labor market is characterized
Most of the questioned subjects (61.32%) consider that Romania’s labor market is less flexible, the employee-‐employer relations are not based on co-‐operation and mutual respect, and the rigidity of employment is rather high (59.74% in industry, 58.33% in constructions, 56.33% in commerce and 67.45% in the case of other services), and this is especially the perception of managers of big and medium companies. A much smaller number (14.95%) affirm that Romania’s labor market is flexible, based on a good co-‐operation relation between employers and employees, with hiring and firing practices in accordance with the ethical principles (16.88% in industry, 15.28% in constructions, 18.37% in commerce and 10.98% in other services), the lowest percentages being found among managers of big and medium companies.
We have to observe that approximately a quarter of the respondents (23.73%) consider that Romania’s labor market is rigid, with authoritative relations dominating the work place and with a low flexibility in setting the wages.
Extent to which financial services influence a firm’s competitiveness
Remark: We had in mind transparency and confidence in the banking system, easiness to obtain credits, efficiency of the capital market). Almost half of the interviewed persons – 49.62% -‐ (54.55% from industry, 52.78% from constructions, 51.02% from commerce and 45.88% from other services) claim that financial services are crucial for a firm’s success and those who think that are preponderantly the managers of micro-‐enterprises (50.18%).
On the other hand, only 2.31% of the respondents (0% from industry, 2, 78% from constructions, 2.86% from commerce and 2.35% from other services) consider that financial services are less important in a firm’s
Impact of the Influential Factors of Economic Competitiveness upon Romania’s West Region Firms
48
Vol. III, Issue 3 June 2013
success; the fewest respondents related to this aspect belong to those who manage micro-‐enterprises and even more to managers of big companies.
Moreover, we remark that a very high percentage (48.07%) is represented by those who consider that financial services are important, but not decisive for a firm’s competitiveness.
Subjects’ opinion about the conditions of bank crediting
57.78% of the total sample (63.64% from industry, 55.56% from constructions, 57.14% from commerce and 57.26% from other services) consider that both the manner of crediting and the level of interests to the loans granted do not meet the enterprises’ requirements, the highest percentage being represented by the micro-‐companies managers (60.49%).
On the opposite pole, the lowest percentages were represented by those who declare that financial institutions offer advantageous crediting conditions to firms – 2.62% (2.60% in industry, 1.39% in constructions, 3.27% in commerce and 2.35% in other services), the lowest percentage being encountered among big companies, but also micro-‐enterprises (1.75%).
We mention that 39.60% of the subjects declare that access to credits is hindered by numerous regulations, but the loans obtained are relatively advantageous.
Subjects’ perception regarding the extent to which the market size influences firms’ competitiveness
Most subjects, 48.84% (45.45% from industry, 50.00% from constructions, 46.12% form commerce and 52.16% from other services) consider that the firms' development degree largely depends on the market dimension. According to the firms' size, the highest percentage is registered in the case of big enterprises (66.67%).
On the other hand, the lowest percentage, 2.47% (0% in industry, 1.39% in constructions, 2.45% in commerce and 3.53% in other services) is represented by those who declare that the market size does not influence enterprises' competitiveness, the lowest percentages being recorded in the case of big companies and micro-‐enterprises (1.92%).
Impact of the Influential Factors of Economic Competitiveness upon Romania’s West Region Firms
49
Vol. III, Issue 3 June 2013
We should underline the fact that 48.69% of the respondents consider that firm’s competitiveness depends only in a certain degree on the firm's opening towards different markets.
Company’s sales market
Almost half of the persons questioned, 47.61% (24.68% from industry, 30.56% from constructions, 52.65% from commerce and 54.51% from other services) declare that their sales market from the activity of the firm they manage is the local market, and in this respect the highest percentages were exhibited by micro-‐enterprises.
A little over one percent, 1.69% (6.49% in industry, 0% in constructions, 0% in commerce and 2.35% in other services) deal only on external markets and the lowest percentage is represented by micro-‐enterprises and big companies.
It is important to mention that 29.28% of the companies carry on their activity on the county market, 14.02% on the regional market, 5.40 % on the national market and only 2.00%, on the domestic and external markets.
Extent to which companies resort to import-‐export
The majority of the respondents, 83.37% (71.43% in industry, 88.89% in constructions, 90.20% in commerce and 79.61% in other services) declare that the firm they manage needs action only on the domestic market (does not need imports and / or exports), the highest percentage in this respect being recorded in the case of micro-‐enterprises (88.99%).
On the other hand, only a few of the people interviewed claim that the deployment of the activity of their companies require exports of economic goods ((2.93%), the lowest number being represented by big companies and micro-‐enterprises (0.87%). It should be mentioned that 10.01% of the analyzed companies import economic goods and only 3.39% of them import and export economic goods.

Impact of the Influential Factors of Economic Competitiveness upon Romania’s West Region Firms
50
Vol. III, Issue 3 June 2013
Subjects’ perception regarding the competition in their field of activity
63.33% of the entire sample (55.84% from industry, 62.50% form constructions, 71.02% from commerce and 58.43% from other services) consider that competition is very strong, especially from the part of Romanian firms, the highest percentage being represented by micro-‐enterprises (66.78%).
The lowest percentage was recorded among those who consider that competition is weak (3.08%), i.e. especially big and medium companies. It is to note that 21.11% of the subjects consider that competition is moderate and only 12.48% consider that competition is strong, especially from the part of foreign companies.
Subjects’ perception regarding the contribution of information and communication technology to the increase of firms’ competitiveness
Remark: In the analysis of the ICT market we shall take into account especially the use of computers and Internet services in the firms’ activity.
Almost half of the respondents, 48.07% (41.56% in industry, 47.22% in constructions, 54.70% in commerce and 43.92% in other services) think that the market of information and communication technologies is well developed, but the degree of these technologies’ use in economy is reduced, the highest weight being recorded in the case of big companies.
At the opposite pole, 22.34% of the sample (25.97% from industry, 26.39% from constructions, 19.18% from commerce and 23.14% from other services) consider that the ICT market is well developed and brings its contribution to the economic development, the least answers being registered among big firms and micro-‐enterprises (21.15%).
We must point out that a little under one third (29.59%) of the subjects claim that the market of information and communication technology is insufficiently developed, compared to most EU member states.

Impact of the Influential Factors of Economic Competitiveness upon Romania’s West Region Firms
51
Vol. III, Issue 3 June 2013
Extent to which Romanian firms make appeal to complex and modern business processes
Remark: Complex and modern business processes refer to the use of professional management, willingness to delegate authority, application of marketing and computerized techniques (especially online transactions), manufacture of unique and sophisticated products etc.
Most subjects, 49.15% (54.55% in industry, 51.39% in constructions, 43.53% in commerce and 49.41% in other services) affirm that, although the importance of modern business methods is well known, Romanian firms rarely resort to them, because of high costs and insufficient information in the field. According to the size of the enterprises, the highest percentages were registered in the case of big companies and micro-‐enterprises (50.00%).
On the other hand, only 15.72% of the sample (16.88% in industry, 19.44% in constructions, 18.78% in commerce and 11.37% in other services) declare that Romanian companies are very receptive to modern business methods, the lowest percentages being recorded for big companies and micro-‐enterprises (13.99%).Moreover, we must remark that a little over one third (35.13%) of the respondents think that Romanian firms are in general conservative and prefer traditional business methods.
Subjects’ perception related to the quality of goods and services provided by the suppliers with whom they collaborate
Almost half of the subjects, 49.62% (53.25% from industry, 59.72% from constructions, 52.24% from commerce and 43.14% from other services) consider that the goods and services provided by the suppliers with whom they co-‐operate are of very good quality, and this opinion is shared especially by the managers of big companies (66.67%).
Only 3.85% of the people interviewed affirm that the goods and services from the collaborator suppliers are of poor quality, opinion encountered especially among the managers of medium and big enterprises (0%).
A rather high percentage of the sample (46.53%) considers that the suppliers with whom they collaborate offer them goods and services of medium quality.
Impact of the Influential Factors of Economic Competitiveness upon Romania’s West Region Firms
52
Vol. III, Issue 3 June 2013
Scope of the activity of suppliers with whom the firms collaborate
One third of the respondents, 33.44% (25.97% from industry, 34.72% from constructions, 37.55% from commerce and 31.37% from other services) declare that the suppliers with whom they collaborate are suppliers operating nationally, and this assertion is encountered preponderantly among the managers of small enterprises (46.67%).
There are few companies collaborating only with foreign suppliers, i.e. 3.69% (2.60% in industry, 2.78% in constructions, 2.86% in commerce and 5.10 % in other services), aspect encountered especially in the case of big companies and micro-‐enterprises (2.80%).
High percentages were also represented by those who collaborate with local suppliers (23.27%), those who co-‐operate with suppliers who operate regionally (29.43%), and lower percentages were represented by those who collaborate with suppliers operating both nationally and internationally (10.17%).
Subjects’ perception regarding the role of innovation in the activity of Romanian entrepreneurs
Remark: We take into account the firms' capacity of innovation, their expenditure for research and development, collaboration between universities and enterprises in the field of research and development, public acquisitions of advanced technology products, quality of the scientific research institutions.
A little over half of the interviewed subjects, 53.93% (55.84% from industry, 56.95% from constructions, 59.18% from commerce and 47.45% from other services) affirm that Romanian entrepreneurs are aware of the importance of innovation, but rarely resort to it, the highest percentages of this answer being represented by medium firms (57.14%) and big companies (100%).
At the opposite pole we find those who claim that innovation is very much present in the activity of Romanian entrepreneurs – 12.02% (15.59% from industry, 9.72% from constructions, 9.80% from commerce, 13.73% from other services). As for the firm’s size, the lowest percentages were recorded among big companies.
Impact of the Influential Factors of Economic Competitiveness upon Romania’s West Region Firms
53
Vol. III, Issue 3 June 2013
Approximately one third (34.05%) of the subjects declare that Romanian firms very rarely resort to innovation, and make appeal to imitation instead.
Conclusions
Representing the extent to which, in free market conditions, a nation is capable of producing goods and services that can be successfully launched on international markets, contributing thus to the growth of its citizens’ living standard, competitiveness is a challenge that applies not only in the case of nations, but also to each of the stakeholders of national economies.
Competitiveness is generated micro-‐economically, and sustainable prosperity is created by companies. Consequently, the quality of the business environment is a fundamental factor, but it is supported and consolidated on the macroeconomic level, competitiveness being expressed at the same time by a country’s capacity to maintain, at least in the medium run, high rates of economic growth and employment, all these resulting, in the long run, in the growth of population’s wellbeing.
Indeed, as M. Manoilescu [20] puts it “competitiveness of firms, as well as of nations, is reflected in the living standards, attraction of foreign investments, productiveness growth, added value; in a global competition, you may live on strawberries picking or software output, but it is obvious that you live better from software development.”
Under the circumstances brought about by Romania’s integration into the European Union, the issue of increasing firms’ competitiveness must become a priority for Romania’s economy, which supposes the elaboration and application of clear strategies, both on the micro-‐ and macroeconomic levels.
After having conducted this research, we remark that most firm managers in Romania’s West Region consider that the institutional environment in our country is inefficient, the infrastructure is insufficiently developed both in size and quality, the macroeconomic environment exhibits fluctuations and generates a lower level of investments, the health services are unsatisfactory and way below the European Union standards.
Furthermore, most managers of the companies operating in Romania’s West Region are aware that the employee’s training is crucial for the success of a firm and consider that the level of academic training
Impact of the Influential Factors of Economic Competitiveness upon Romania’s West Region Firms
54
Vol. III, Issue 3 June 2013
provided by the Romanian educational system is high in the theoretic section but insufficient when it comes to practice.
Furthermore, it is considered that in Romania taxation is very high and does not encourage the operation of entrepreneurial activities, the labor market is less flexible, the relations between employers and employees are not based on co-‐operation and mutual respect, the rigidity of employment is rather high.
Moreover, most managers of the firms from Romania's West Region claim that the financial services are very important for a firm’s success, but in most cases both the manner of crediting and the level of interest to the loans granted do not satisfy the enterprises’ requirements and needs. It is considered that in Romania the market of information and communication technology is well developed, but the degree of these technologies’ use in economy is still rather low. On the other hand, most managers affirm that Romanian entrepreneurs are aware of the importance of innovation, but rarely resort to it.
Consequently, the main problems generally challenging Romanian firms are access to financing, poor infrastructure, excessive bureaucracy, high taxation rates, fiscal regulations, political instability, restrictive regulations related to labor force, inadequate education of labor force, poverty of health system etc.
In this context, we must identify efficient modalities to increase economic competitiveness both on the firm’s level and on the regional and national level.
The growth of the capacity to absorb European funds, by writing viable projects, will trigger positive effects both on the micro-‐ and macro-‐economic levels, as these funds are the premise for the realization of a viable infrastructure, and for the revival of some domains by technical refurbishment, environment investments etc.
On the other hand, the motivation of choosing direct foreign investments, as promoters of competitiveness, is related to their capacity to influence convergence of revenues, of productiveness and eventually of economic competitiveness throughout the country. In this respect, we may forward the following aspects regarding direct foreign investments:
Impact of the Influential Factors of Economic Competitiveness upon Romania’s West Region Firms
55
Vol. III, Issue 3 June 2013
• they have the capacity to increase the capital stock of economy, productiveness and revenues of the regions where the investments have been implemented;
• they determine the increase of the employment rate, as a result of the new investments;
• they represent an access way to new technologies (if a technology transfer is intended between the mother country and the host country), with direct effect upon national economy; Consequently, the role played by direct foreign investments in an
economy is extremely important, as they become “the most important means for attracting intangible resources, such as technology, know-‐how, expertise, managerial experience.” [21]
Moreover, besides attracting European funds and direct foreign investment, we should keep in mind a series of further goals:
• improvement of legislation and regulations in the domain of entrepreneurial activities;
• development of a basis for entrepreneurial and innovative businesses by investments in products with high added value;
• establishment of economic-‐financial measures able to allow investments in conditions of efficiency;
• building close connections between research-‐development activities, their application in economy and promotion of innovative sectors based on research activity;
• attracting and valuing the competence of specialists in different branches of economy;
• enhancement of management quality, both in the private and in the public sectors;
• large-‐scale use of ICT technologies; • elimination of deficiencies existing in industrial activities which use
obsolete technologies affecting the environment and consuming a lot of energy;
• increasing the efficiency and sustainable development of the energetic system, as factor of competitiveness. Future policies should also lay the stress on the development of
infrastructure, as an essential condition for the competitiveness growth, on the development of public-‐private partnership for the valuing of research-‐
Impact of the Influential Factors of Economic Competitiveness upon Romania’s West Region Firms
56
Vol. III, Issue 3 June 2013
development-‐innovation activities, on ensuring an optimum rate of structural funds absorption, on the development of human resources by lifelong education, on the stimulation of professional education, technical and high education in science and technology, on the development of the research-‐development-‐innovation sector by stimulating fiscal measures, but also by a good co-‐ordination of sector and horizontal policies.
Furthermore, following the studies conducted, it is obvious that there are opportunities for the growth of Romania’s economic competitiveness. Thus, by ensuring a very stable environment from the economic viewpoint, by attracting direct foreign investments, by absorbing European funds, by developing infrastructure and especially the transport elements, by improving the research-‐development-‐innovation activities, by enhancing management quality both in the private and in the public sectors, by increasing the interest for a series of domains with potential – such as tourism, for instance -‐ we will succeed in finding the true key to future development.
References
[1] A. Smith, Avuţia naţiunilor. Cercetare asupra naturii şi cauzelor ei / The wealth of nations. On its nature and causes, vol. I and II, Romanian
Academy Press, Bucharest, 1965. [2] D. Ricardo, Opere alese / Selected works, vol. I, Romanian Academy Press,
Bucharest, 1959.
[3] D. Tănase, Probleme ale competitivităţii economiei Româneşti / Issues of Romanian economy competitiveness, Mirton Publishing House, Timişoara, 2012.
[4] World Economic Forum, The Global Competitiveness Report 2012-‐2013. [5] I. Băbăiţă, I. Imbrescu and A. Anghelina, De la avantajul comparativ la
teoria avantajului competitiv / From the comparative advantage to the theory
of the competitive advantage, Studia Universitatis, Economics series, West University “Vasile Goldiş” of Arad, 2007, part II, pp. 10-‐15.
[6] M. Porter, The Competitive Advantage of Nations, The Free Press, New York,
1990. [7] G. Marin and A. Puiu (coord.), Dicţionar de relaţii economice internaţionale
/ Dictionary of international economic relations, Encyclopaedic Press,
Bucharest, 2000.
Impact of the Influential Factors of Economic Competitiveness upon Romania’s West Region Firms
57
Vol. III, Issue 3 June 2013
[8] V. Cojanu, M. Bîrsan, M. Unguru, Competitivitatea economiei româneşti: ajustări necesare atingerii obiectivelor Agendei Lisabona / Competitiveness of Romanian economy: adjustments necessary for reaching the Lisbon Agenda
objectives, European Institute of Romania, Bucharest, 2007. [9] B. R. Scott and G. C. Lodge, US Competitiveness in World Economy, Harvard
Business School Press, Boston, USA, 1985.
[10] D. Antanescu and I. Dumitrescu, Zonele cu potenţial de dezvoltare economică: vectori ai creşterii competitivităţii economice / Areas with potential for economic development: vectors of economic competitiveness
growth, Economic Library Collection, Centre for economic information and documentation, Romanian Academy, 2007, pp. 67-‐69.
[11] M. Kitson, R. Martin and P. Tyler, Regional Competitiveness: An Elusive yet
Key Concept?, Journal of the Regional Studies Association, Regional Studies, Vol. 38.9, 2004, pp. 991–999.
[12] M. Storper, The new argonauts: regional advantage in a global economy
AnnaLee Saxenian, Journal of Economic Geography, 2007, pp.113-‐117. [13] National Statistics Institute, Territorial Statistics 2010, Bucharest, România. [14] National Statistics Institute, Romania’s Statistic Yearbook 2012, Bucharest.
[15] C. Dobre, C Negruţ and M. Venczel, M, Marketing, Amphora Publishing House, 1995.
[16] ] C. Florescu (coord.), Marketing, Marketer Publishing House, Academic
Groups of Marketing and Management, Bucharest, 1992. [17] I. Cătoiu (co-‐ordinator), Cercetări de marketing / Marketing researches,
Uranus Publishing House, Bucharest, 2009.
[18] M.C. Demetrescu, Marketing, Europa Nova Publishing House, Lugoj, 1991. [19] A. Novak, Sondajul de opinie / The Survey, Oscar Print Publishing House,
Bucharest, 1998.
[20] M. Manoilescu, Forţele naţionale productive şi comerţul exterior. Teoria protecţionismului şi a schimbului internaţional / Productive national forces and foreign trade. Theory of protectionism and international exchange,
Scientific and Encyclopaedic Press, Bucharest, 1986. [21] A. Iancu, Real Convergence And Integration, Romanian Journal of Economic
de Forecasting, Volume 9 Issue 1 /2008, pp. 56-‐62.
Scientific Papers (www.scientificpapers.org) Journal of Knowledge Management, Economics and Information Technology
58
Vol. III, Issue 3 June 2013
How to Respond to Information Needs of University Stakeholders: Proposal of Indicators for Reporting on Intellectual Capital
Authors: Yolanda Ramírez Córcoles1, Ángel Tejada Ponce1, Jean Vanderdonckt2; 1Faculty of Management and Economy, University of Castilla la Mancha, Spain; 2Institut d’administation et de gestion, Universitié Catholique of Louvain, Belgium; [email protected]
The purpose of this paper is to know the opinion of the university stakeholders regarding the importance they give to completing the information from university financial statements with information relating to these institutions’ intellectual capital. To this end, a questionnaire was designed and sent to every member of the Social Councils of Spanish public universities. The results of our empirical study allow us to recommend extending the limits of universities’ annual accounts so as to include the information on different intangible elements demanded by the different stakeholders. Finally, the study’s results served as basis to develop a battery of indicators which allows these intangible elements to be measured.
Keywords: university stakeholders; intellectual capital
Introduction
There is a growing interest in applying an intellectual capital approach in universities, since knowledge is the main output and input of these institutions (Leitner and Warden, 2004; Sánchez et al., 2009; Brătianu, 2009; Rafiee et al., 2010). Universities produce knowledge, either through technical and scientific research (the results of investigation, publications, etc.) or
4

How to Respond to Information Needs of University Stakeholders: Proposal of Indicators for Reporting on Intellectual Capital
59
Vol. III, Issue 3 June 2013
through teaching (students trained and productive relationships with their stakeholders). Their most valuable resources also include their teachers, researchers, administration and service staff, university governors and students, with all their organizational relationships and routines (Warden, 2003; Leitner, 2004; Ramírez et al., 2007). The higher education institutions are, therefore, an ideal framework for the application of the ideas related to intellectual capital theory.
Furthermore, necessities like the increasing stakeholder demand for greater transparency, the increasing competition between universities and firms, and greater autonomy, push universities towards the adoption of new reporting systems which should necessarily incorporate intangibles (Sánchez et al., 2009).
This paper focuses on the importance of reporting on intellectual capital for Spanish universities and the information needs of university stakeholders.
Numerous papers and books have come to the conclusion that our traditional accounting systems do not suffice for today’s organizations, whose value creation often depends more on intellectual capital type resources rather than monetary or physical resources (Burgman et al., 2007). However, the information provided by public universities focuses on ensuring financial control of the organization without paying attention to the needs of other groups of interest (Martín, 2006). In this sense, Gray (2006) considers that the information supplied in traditional financial reports is not enough. He highlights the need to establish more extensive communication and accounting mechanisms which take into account the needs of the different groups of interest. Coy et al. (2001) recommend extending the limits of US universities’ annual accounts and defend a new paradigm for the annual accounts which provides more wide-‐ranging information on teaching and research. They favor the inclusion of effort indicators and achievements, with more attention being paid to the social responsibility of institutions of higher education.
Consequently, the current socio-‐economic climate creates the need for universities’ financial statements provide all the relevant information on their activities and the key factors of their success “their intangible resources”.
In this study we will show the opinion which exists among the university stakeholders regarding the need to complete the content of the

How to Respond to Information Needs of University Stakeholders: Proposal of Indicators for Reporting on Intellectual Capital
60
Vol. III, Issue 3 June 2013
current university financial statements by providing non-‐financial information on intellectual capital. Based on this empirical study, we define a battery of indicators for reporting on intellectual capital in universities.
The paper is structured as follows: in section 2, we explore the concept of intellectual capital in higher education institutions and we review the existing literature on the presentation of information on intellectual capital in these institutions. In section 3, we define the scope of the empirical study conducted and the methodology used. Then, we present the results obtained. According to this, our proposal of indicators for reporting on intellectual capital in universities is presented. Final conclusions are drawn in Section 4.
Intellectual Capital in Higher Education Institutions
Specifically, when referred to a university, the term intellectual capital is used to cover all the institution’s non-‐tangible or non-‐physical assets, including processes, capacity for innovation, patents, the tacit knowledge of its members and their abilities, talents and skills, the recognition of society, its network of collaborators and contacts, etc. The intellectual capital is the collection of intangibles which “allows an organization to transfer a collection of material, financial and human resources into a system capable of creating value for the stakeholders” (European Commission, 2006, p. 4).
The components of a university’s intellectual capital have been categorized in diverse ways, although undoubtedly, the tripartite classification is the most widely accepted in specialized literature (Leitner, 2004; Ramírez et al., 2007; Cañibano and Sánchez, 2008; Sánchez et al., 2009; Bezhani, 2010; Bodnár et al., 2010; Casanueva and Gallego, 2010; Secundo et al., 2010). Intellectual capital is represented as being formed by the following three basic and closely interrelated components:
• Human Capital: it is the sum of the explicit and tacit knowledge of the university staff (teachers, researchers, managers, administration and service staff), acquired through formal and non-‐formal education and refresher processes included in their activities.
• Structural Capital: it is the explicit knowledge relating to the internal processes of dissemination, communication and management of the scientific and technical knowledge at the university. Structural capital may be divided into:
How to Respond to Information Needs of University Stakeholders: Proposal of Indicators for Reporting on Intellectual Capital
61
Vol. III, Issue 3 June 2013
• Organizational Capital: this refers to the operational environment derived from the interaction between research, management and organization processes, organizational routines, corporate culture and values, internal procedures, quality and scope of the information system, etc.
• Technological Capital: this refers to the technological resources available at the university, such as bibliographical and documentary resources, archives, technical developments, patents, licenses, software, databases, etc.
• Relational Capital: this refers to the extensive collection of economic, political and institutional relations developed and upheld between the university and its non-‐academic partners: enterprises, non-‐profit organizations, local government and society in general. It also includes the perception that others have of the university: its image, appeal, reliability, etc.
Current accounting regulations restrict the recognition of intangibles. Only acquired intangible assets may be reflected in an organization’s balance sheet (Cañibano et al., 2008). For this reason, there are numerous international regulatory bodies, agencies and academic institutions that aware of the difficulty of incorporating intellectual capital into the balance, tend to recommend the development and presentation of the so-‐called Intellectual Capital Reports. Intellectual capital reports contain a set of indicators that contribute to improving the quality of accounting information in organizations. In this line, at Spanish level, the Commission of Accounting Experts of Ministry of Economy (ICAC, 2002) recommends the voluntary drafting and publication of a report on intellectual capital by following the guidelines of the Meritum Project (Cañibano et al., 2002), consisting of three parts: a vision of the company, a summary of intangible resources and activities and a system of indicators.
Taking these considerations into account, we believe that complementary non-‐financial information is the most appropriate form to supply information on universities’ non-‐tangible elements, so as to avoid the inclusion of accounting criteria which could endanger the quality and reliability of the financial information. In our opinion, an improvement in university accounting systems would be achieved by the drafting and presentation of a new report complementary to the current financial
How to Respond to Information Needs of University Stakeholders: Proposal of Indicators for Reporting on Intellectual Capital
62
Vol. III, Issue 3 June 2013
statements –the Intellectual Capital Report-‐. A set of indicators would show the information most demanded by different stakeholders regarding the institution’s intangible resources.
One of the most interesting experiences in the presentation of information on intellectual capital is that of Austria’s public universities, which are obliged to present Intellectual Capital Reports (known as Wissensbilanz). The Austrian University Law of 2002 (Federal Ministry of Education, Science and Culture of Austria, 2002), in article 13, established the obligation and the general framework for developing this intellectual capital report. According to UG2002 (section 13, subsection 6), the IC report will include, at least, the following elements: a) the university’s activities, its social and voluntary objectives and its strategies; b) the intellectual capital, divided into human, structural and relational capital; c) the processes presented in the performance contract, including outputs and impacts. The first intellectual capital report should have been published in 2005. However, the ministerial order (Federal Ministry of Education, Science and Culture of Austria, 2006) relating to the detailed structure of the university intellectual capital report. The way to present the information and the indicators to be compulsorily included was not published until 15 February 2006. So, Austrian universities have only really been obliged to publish an intellectual capital report every 30 April since 2007.
Another interesting study is the case of the Poznan University of Economics, in Poland, where Fazlagic (2005) presents an intellectual capital report based on the methodology proposed by the Danish Ministry of Science, Technology and Innovation (2000), in which intellectual capital is presented in the form of resources, activities and results; and the proposal of the Korean non-‐profit research organization ETRI (Electronics and Telecommunications Research Institute), which in early 2001 developed an effective management tool and established a knowledge management system. And, since 2004 ETRI publishes intellectual capital reports annually (ETRI, 2005).
On the other hand, the Observatory of European Universities (OEU) proposed the presentation of an intellectual capital report called the ICU Report (Sánchez et al., 2006), specifically designed for universities and research centers, with the aim of improving transparency and aiding the homogenous dissemination of the indicators of intellectual capital. The proposed ICU report consists of three fundamental sections which describe
How to Respond to Information Needs of University Stakeholders: Proposal of Indicators for Reporting on Intellectual Capital
63
Vol. III, Issue 3 June 2013
the logical movement from internal strategy (design of the vision and objectives of an institution) and management towards a system of indicators (OEU, 2006, p. 211): (a) vision of the institution; (b) intangible resources and activities; (c) system of metrics.
Despite these experiences, at a national level neither accounting bodies nor government agencies have established regulations, standards or norms for preparing intellectual capital reports which involve the existence of a strict, agreed, and theoretical framework standardizing the data to be presented.
Empirical Study
The generalised concern regarding the need to guarantee the information transparency of universities led us to consider the need to include information on intellectual capital in universities’ annual reports. To this end the decision was taken to seek out the opinion of the university stakeholders regarding the importance they give to completing the information from university financial statements with information relating to these institutions’ intellectual capital. A questionnaire was designed and sent to every member of the Social Councils of Spanish public universities.
Research Objectives
The two fundamental objectives of the empirical study are: • Objective I: To determine the extent to which different university
stakeholders are demanding information relating to the intellectual capital of Spanish public universities in order to make the right decisions, identifying which intangible resources are the most relevant for publication.
• Objective II: To propose a battery of indicators for reporting on intellectual capital in Spanish universities.
Methodology and Data Collection
In order to achieve the previously mentioned objectives, in mid-‐May 2010 an online questionnaire requesting the opinion of the members of the Social
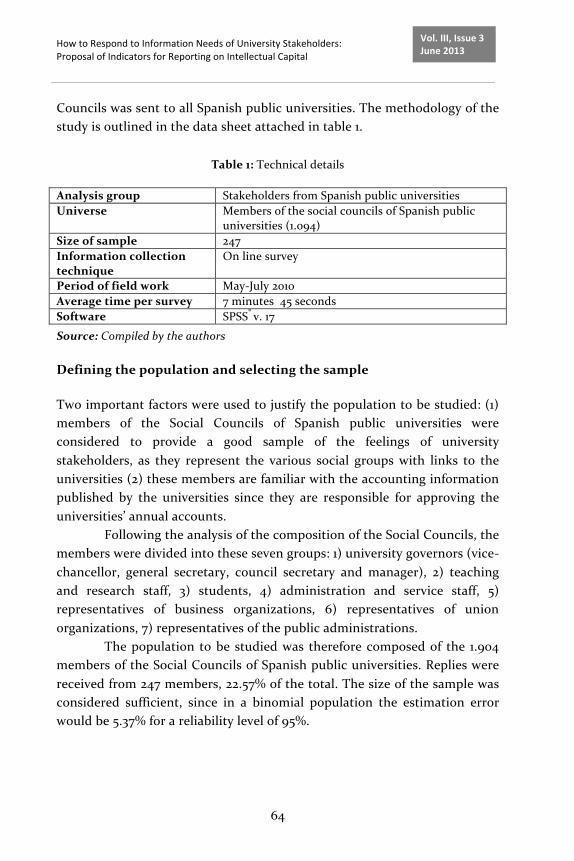
How to Respond to Information Needs of University Stakeholders: Proposal of Indicators for Reporting on Intellectual Capital
64
Vol. III, Issue 3 June 2013
Councils was sent to all Spanish public universities. The methodology of the study is outlined in the data sheet attached in table 1.
Table 1: Technical details
Analysis group Stakeholders from Spanish public universities Universe Members of the social councils of Spanish public
universities (1.094) Size of sample 247 Information collection technique
On line survey
Period of field work May-‐July 2010 Average time per survey 7 minutes 45 seconds Software SPSS® v. 17
Source: Compiled by the authors
Defining the population and selecting the sample
Two important factors were used to justify the population to be studied: (1) members of the Social Councils of Spanish public universities were considered to provide a good sample of the feelings of university stakeholders, as they represent the various social groups with links to the universities (2) these members are familiar with the accounting information published by the universities since they are responsible for approving the universities’ annual accounts.
Following the analysis of the composition of the Social Councils, the members were divided into these seven groups: 1) university governors (vice-‐chancellor, general secretary, council secretary and manager), 2) teaching and research staff, 3) students, 4) administration and service staff, 5) representatives of business organizations, 6) representatives of union organizations, 7) representatives of the public administrations.
The population to be studied was therefore composed of the 1.904 members of the Social Councils of Spanish public universities. Replies were received from 247 members, 22.57% of the total. The size of the sample was considered sufficient, since in a binomial population the estimation error would be 5.37% for a reliability level of 95%.
How to Respond to Information Needs of University Stakeholders: Proposal of Indicators for Reporting on Intellectual Capital
65
Vol. III, Issue 3 June 2013
Information collection and treatment
The information was collected via an online survey. An email was sent to the members of the Spanish university Social Councils requesting the members to take part in our research.
The questionnaire consists of closed dichotomous questions combined with Likert scales, designed to learn the opinion of university stakeholders on the importance of Spanish public universities publishing information on their intellectual capital. A list of intangible elements relating to human capital, structural capital, and relational capital is included so as to ascertain to what degree it is relevant to publish this information. Specifically, based on the Intellectus Model (Bueno-‐CIC, 2003), we proposed 32 intangible elements according to the characteristics of the higher education institutions, in order to establish their relevance for disclosing. Twelve were related to human capital (concerning the abilities and skills of the people belonging to the institutions), fourteen were related to structural capital (referring to how the institution is structured and how it works), and sixteen were related to relational capital (the institution’s relations with students and the outside world).
A descriptive analysis of the replies was conducted according to the characteristics of each of the questions.
Analysis of the Results of the Empirical Study
There now follows a consideration of the principal results obtained through the empirical study for each of the objectives previously established.
Objective 1: The importance given by university stakeholders to the presentation of information on intellectual capital
A high percentage, 89.1%, of those surveyed in our study showed great interest in Spanish public universities presenting information on intellectual capital. They felt that publishing this information would make the content of the current university financial statements more relevant. Only 4.9% of those surveyed consider that publishing information on intellectual capital increases the ambiguity and the lack of relevance of the information included in the current accounting statements.

How to Respond to Information Needs of University Stakeholders: Proposal of Indicators for Reporting on Intellectual Capital
66
Vol. III, Issue 3 June 2013
By user groups it was found that practically all the users – public administrations (89,4%), students (100%), business organisations (86,2%), teaching and research staff (95,5%), university governors (97,4%), administration and services staff (66,7%) and union organisations (76,5%)-‐ consider that the presentation of information on universities’ intellectual capital increases the relevance of the information contained in the current financial statements.
Then, in order to identify the intangible elements about which university stakeholders consider it relevant or very relevant to publish information, we set as a requirement that these elements had to reach a mean value or a median equal or higher than 4 points in combination with a minimum 25 of 4 points and a minimum 75 percentile of 5 points. In short, the intention is that most of the distribution of values is concentrated in high scores close to 5 points.
Table 2 shows the frequencies obtained in the empirical study (mean, median, standard deviation, and percentile 25 and 75) to the different intangible elements (grouped in three categories of intellectual capital).
Table 2: Frequency analysis in the human capital block (*)
Intangible Asset Mean Median Mode Standard deviation
Range Percen-‐tile 25
Percen-‐tile 75
Typology of university staff (historical data of growth or decrease in staff, age structure of staff, contractual conditions, etc.)
3.66 4 4 0.76 3 3 4
Academic and professional qualifications of teaching and research staff (% of doctors, % civil servants, etc.)
4.52 5 5 0.60 3 4 5
Mobility of teachers and researchers (% of teachers on fellowships, etc.)
4.54 5 5 0.68 3 4 5
Scientific productivity (books, articles published, etc.)
4.08 4 4 0.87 3 4 5
Professional qualifications of administration and service staff
3.68 4 4 0.99 4 3 4
Mobility of graduates 4.30 4 5 0.73 3 4 5
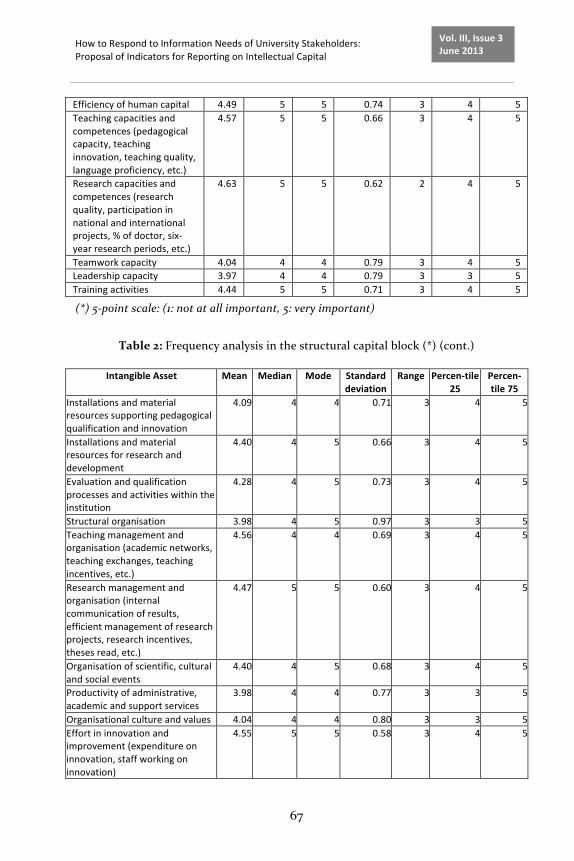
How to Respond to Information Needs of University Stakeholders: Proposal of Indicators for Reporting on Intellectual Capital
67
Vol. III, Issue 3 June 2013
Efficiency of human capital 4.49 5 5 0.74 3 4 5 Teaching capacities and competences (pedagogical capacity, teaching innovation, teaching quality, language proficiency, etc.)
4.57 5 5 0.66 3 4 5
Research capacities and competences (research quality, participation in national and international projects, % of doctor, six-‐year research periods, etc.)
4.63 5 5 0.62 2 4 5
Teamwork capacity 4.04 4 4 0.79 3 4 5 Leadership capacity 3.97 4 4 0.79 3 3 5 Training activities 4.44 5 5 0.71 3 4 5
(*) 5-‐point scale: (1: not at all important, 5: very important)
Table 2: Frequency analysis in the structural capital block (*) (cont.)
Intangible Asset Mean Median Mode Standard deviation
Range Percen-‐tile 25
Percen-‐tile 75
Installations and material resources supporting pedagogical qualification and innovation
4.09 4 4 0.71 3 4 5
Installations and material resources for research and development
4.40 4 5 0.66 3 4 5
Evaluation and qualification processes and activities within the institution
4.28 4 5 0.73 3 4 5
Structural organisation 3.98 4 5 0.97 3 3 5 Teaching management and organisation (academic networks, teaching exchanges, teaching incentives, etc.)
4.56 4 4 0.69 3 4 5
Research management and organisation (internal communication of results, efficient management of research projects, research incentives, theses read, etc.)
4.47 5 5 0.60 3 4 5
Organisation of scientific, cultural and social events
4.40 4 5 0.68 3 4 5
Productivity of administrative, academic and support services
3.98 4 4 0.77 3 3 5
Organisational culture and values 4.04 4 4 0.80 3 3 5 Effort in innovation and improvement (expenditure on innovation, staff working on innovation)
4.55 5 5 0.58 3 4 5
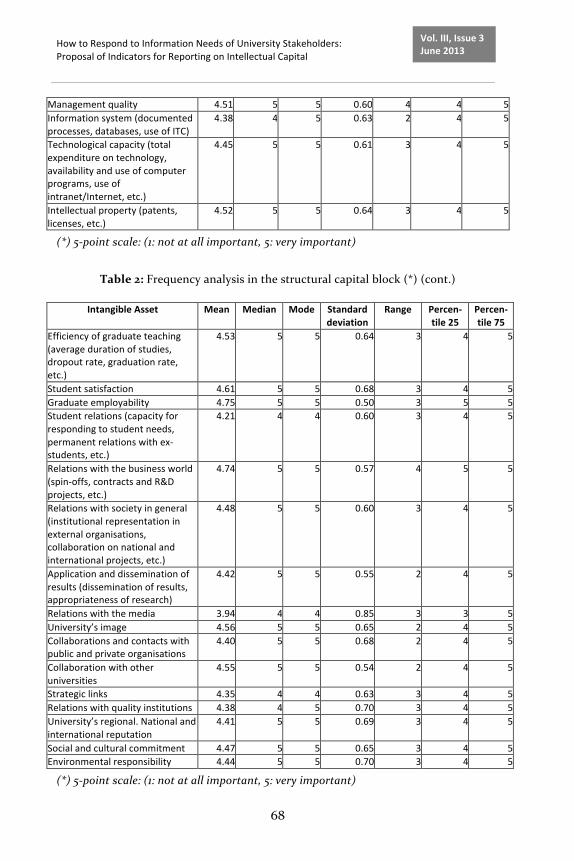
How to Respond to Information Needs of University Stakeholders: Proposal of Indicators for Reporting on Intellectual Capital
68
Vol. III, Issue 3 June 2013
Management quality 4.51 5 5 0.60 4 4 5 Information system (documented processes, databases, use of ITC)
4.38 4 5 0.63 2 4 5
Technological capacity (total expenditure on technology, availability and use of computer programs, use of intranet/Internet, etc.)
4.45 5 5 0.61 3 4 5
Intellectual property (patents, licenses, etc.)
4.52 5 5 0.64 3 4 5
(*) 5-‐point scale: (1: not at all important, 5: very important)
Table 2: Frequency analysis in the structural capital block (*) (cont.)
Intangible Asset Mean Median Mode Standard deviation
Range Percen-‐tile 25
Percen-‐tile 75
Efficiency of graduate teaching (average duration of studies, dropout rate, graduation rate, etc.)
4.53 5 5 0.64 3 4 5
Student satisfaction 4.61 5 5 0.68 3 4 5 Graduate employability 4.75 5 5 0.50 3 5 5 Student relations (capacity for responding to student needs, permanent relations with ex-‐students, etc.)
4.21 4 4 0.60 3 4 5
Relations with the business world (spin-‐offs, contracts and R&D projects, etc.)
4.74 5 5 0.57 4 5 5
Relations with society in general (institutional representation in external organisations, collaboration on national and international projects, etc.)
4.48 5 5 0.60 3 4 5
Application and dissemination of results (dissemination of results, appropriateness of research)
4.42 5 5 0.55 2 4 5
Relations with the media 3.94 4 4 0.85 3 3 5 University’s image 4.56 5 5 0.65 2 4 5 Collaborations and contacts with public and private organisations
4.40 5 5 0.68 2 4 5
Collaboration with other universities
4.55 5 5 0.54 2 4 5
Strategic links 4.35 4 4 0.63 3 4 5 Relations with quality institutions 4.38 4 5 0.70 3 4 5 University’s regional. National and international reputation
4.41 5 5 0.69 3 4 5
Social and cultural commitment 4.47 5 5 0.65 3 4 5 Environmental responsibility 4.44 5 5 0.70 3 4 5
(*) 5-‐point scale: (1: not at all important, 5: very important)
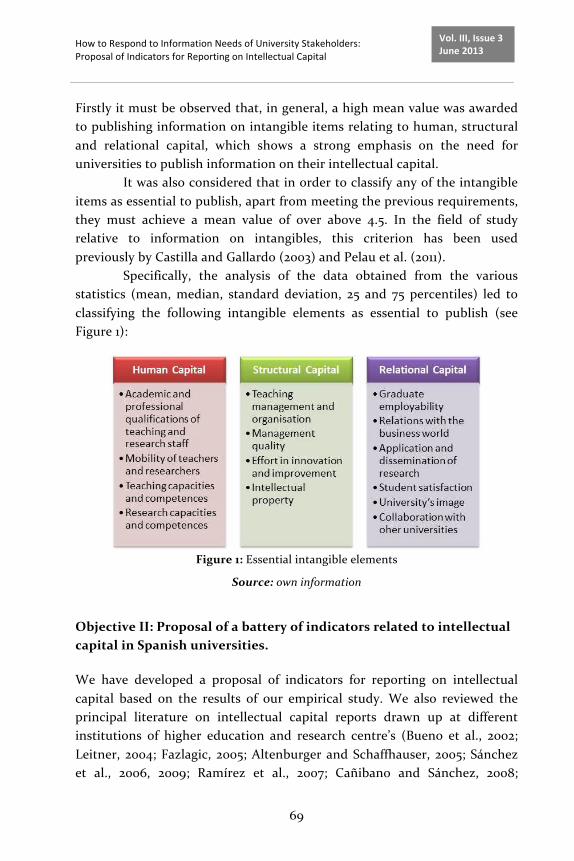
How to Respond to Information Needs of University Stakeholders: Proposal of Indicators for Reporting on Intellectual Capital
69
Vol. III, Issue 3 June 2013
Firstly it must be observed that, in general, a high mean value was awarded to publishing information on intangible items relating to human, structural and relational capital, which shows a strong emphasis on the need for universities to publish information on their intellectual capital.
It was also considered that in order to classify any of the intangible items as essential to publish, apart from meeting the previous requirements, they must achieve a mean value of over above 4.5. In the field of study relative to information on intangibles, this criterion has been used previously by Castilla and Gallardo (2003) and Pelau et al. (2011).
Specifically, the analysis of the data obtained from the various statistics (mean, median, standard deviation, 25 and 75 percentiles) led to classifying the following intangible elements as essential to publish (see Figure 1):
Figure 1: Essential intangible elements
Source: own information
Objective II: Proposal of a battery of indicators related to intellectual capital in Spanish universities.
We have developed a proposal of indicators for reporting on intellectual capital based on the results of our empirical study. We also reviewed the principal literature on intellectual capital reports drawn up at different institutions of higher education and research centre’s (Bueno et al., 2002; Leitner, 2004; Fazlagic, 2005; Altenburger and Schaffhauser, 2005; Sánchez et al., 2006, 2009; Ramírez et al., 2007; Cañibano and Sánchez, 2008;

How to Respond to Information Needs of University Stakeholders: Proposal of Indicators for Reporting on Intellectual Capital
70
Vol. III, Issue 3 June 2013
Schaffhauser, 2009; Bezhani, 2010; Bodnár et al., 2010; Silvestri y Veltri, 2011; etc.), and also we took into account various studies which bring together tables of indicators designed by different universities (Malyshko, 2008; Sánchez and Rivera, 2009; Jones et al., 2009; González and Rodríguez, 2010; Nava and Mercado, 2011).
Using this information and the results obtained from our empirical study we are now able to identify the key aspects that need to be included in a presentation of intellectual capital information by Spanish universities in order to satisfy the needs of stakeholders.
Table 3 shows our proposal of battery of basic or general indicators which will align all the intangible elements which it is “essential” to make public.
Table 3: Proposed indicators for reporting intellectual capital in universities
Intangible elements Indicators Human Capital Academic and professional qualifications of staff
% of doctors among teaching and research staff % of qualified teachers
Teaching capacities and competences Total teaching and research staff / students Number of participants in training programs Number of hours dedicated to teacher training
Mobility of teachers and researchers % of teachers with fellowships at other universities Research capacities and competences Rate of participation in research projects
Proportion of six-‐year research periods Production of doctoral thesis Number of scientific publications
Structural Capital Teaching management and organization
% of classes with less than 50 students Rate first cycle credits in English Library places
Management quality Quality certificates awarded Effort in innovation R&D expenditure
Number of R&D projects under development Intellectual property Generation of patents
Scientific production RELATIONAL CAPITAL Graduate employability Employment rate
Time until first employment Efficiency of graduate teaching Drop-‐out rate
Efficiency rate Graduation rate Performance rate
Student satisfaction Graduate satisfaction with studies (surveys) % of pre-‐enrolled students in first option in relation to total number of places on offer
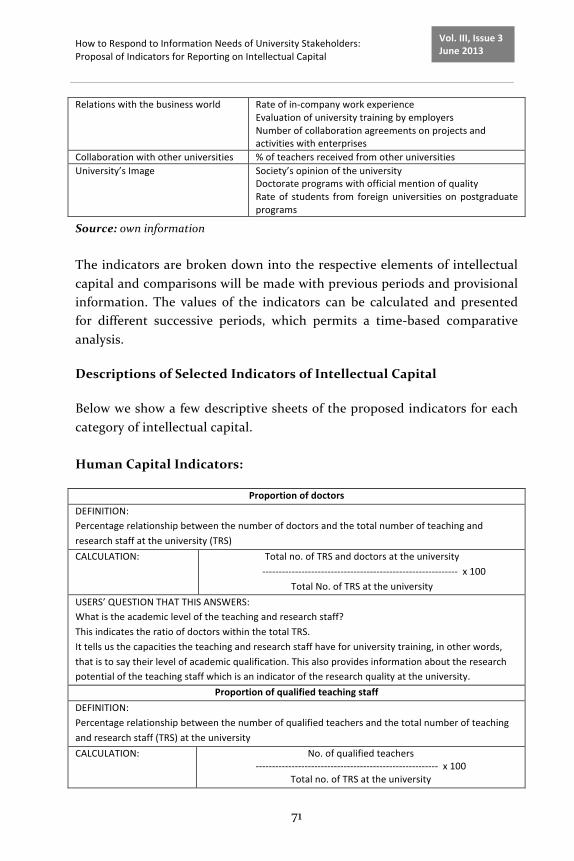
How to Respond to Information Needs of University Stakeholders: Proposal of Indicators for Reporting on Intellectual Capital
71
Vol. III, Issue 3 June 2013
Relations with the business world Rate of in-‐company work experience Evaluation of university training by employers Number of collaboration agreements on projects and activities with enterprises
Collaboration with other universities % of teachers received from other universities University’s Image Society’s opinion of the university
Doctorate programs with official mention of quality Rate of students from foreign universities on postgraduate programs
Source: own information The indicators are broken down into the respective elements of intellectual capital and comparisons will be made with previous periods and provisional information. The values of the indicators can be calculated and presented for different successive periods, which permits a time-‐based comparative analysis.
Descriptions of Selected Indicators of Intellectual Capital
Below we show a few descriptive sheets of the proposed indicators for each category of intellectual capital. Human Capital Indicators:
Proportion of doctors DEFINITION: Percentage relationship between the number of doctors and the total number of teaching and research staff at the university (TRS) CALCULATION: Total no. of TRS and doctors at the university
-‐-‐-‐-‐-‐-‐-‐-‐-‐-‐-‐-‐-‐-‐-‐-‐-‐-‐-‐-‐-‐-‐-‐-‐-‐-‐-‐-‐-‐-‐-‐-‐-‐-‐-‐-‐-‐-‐-‐-‐-‐-‐-‐-‐-‐-‐-‐-‐-‐-‐-‐-‐-‐-‐-‐-‐-‐-‐-‐-‐ x 100 Total No. of TRS at the university
USERS’ QUESTION THAT THIS ANSWERS: What is the academic level of the teaching and research staff? This indicates the ratio of doctors within the total TRS. It tells us the capacities the teaching and research staff have for university training, in other words, that is to say their level of academic qualification. This also provides information about the research potential of the teaching staff which is an indicator of the research quality at the university.
Proportion of qualified teaching staff DEFINITION: Percentage relationship between the number of qualified teachers and the total number of teaching and research staff (TRS) at the university CALCULATION: No. of qualified teachers
-‐-‐-‐-‐-‐-‐-‐-‐-‐-‐-‐-‐-‐-‐-‐-‐-‐-‐-‐-‐-‐-‐-‐-‐-‐-‐-‐-‐-‐-‐-‐-‐-‐-‐-‐-‐-‐-‐-‐-‐-‐-‐-‐-‐-‐-‐-‐-‐-‐-‐-‐-‐-‐-‐-‐-‐ x 100 Total no. of TRS at the university

How to Respond to Information Needs of University Stakeholders: Proposal of Indicators for Reporting on Intellectual Capital
72
Vol. III, Issue 3 June 2013
USERS’ QUESTION THAT THIS ANSWERS: What is the stability level of the university teaching and research staff? This is a clear sign of staff stability, and consequently of teaching and research functions. It reflects the university’s stability policy for teaching staff and the level of TRS qualifications.
Teaching and research staff-‐student ratio DEFINITION: Relationship between the total number of teaching and research staff (TRS) at the university and the total number of students. CALCULATION:
No. of TRS at the university (FTE) -‐-‐-‐-‐-‐-‐-‐-‐-‐-‐-‐-‐-‐-‐-‐-‐-‐-‐-‐-‐-‐-‐-‐-‐-‐-‐-‐-‐-‐-‐-‐-‐-‐-‐-‐-‐-‐-‐-‐-‐-‐-‐-‐-‐-‐-‐-‐-‐-‐-‐
Total No. of students (FTE) USERS’ QUESTION THAT THIS ANSWERS: What level of support or intensity of help do the students receive from the teachers? This is without doubt an important ratio since it shows the amount of scientifically-‐oriented human resources available for teaching activities. This indicator tells us the proportion of students per teacher, which gives an idea of the level of massification at a university.
Participants in training programmes DEFINITION: Number of participants in training programmes either in or outside the university CALCULATION:
Number of teaching and research staff participating in training programmes
USERS’ QUESTION THAT THIS ANSWERS: What is the training level of university staff? This indicator tells us about the willingness of the university staff to take part in training activities (teaching, technology, etc.). It provides us with information about the importance teachers give to continuous training. This indicator also provides students with information about the level of specialisation of the teaching staff at the university.
Hours dedicated to teacher training DEFINITION: Number of hours of teaching and research staff dedicate to teacher training activities CALCULATION:
No. of hours TRS dedicate to training -‐-‐-‐-‐-‐-‐-‐-‐-‐-‐-‐-‐-‐-‐-‐-‐-‐-‐-‐-‐-‐-‐-‐-‐-‐-‐-‐-‐-‐-‐-‐-‐-‐-‐-‐-‐-‐-‐-‐-‐-‐-‐-‐-‐-‐-‐-‐-‐-‐-‐-‐-‐-‐-‐-‐-‐-‐-‐-‐-‐-‐-‐-‐-‐-‐-‐-‐-‐-‐-‐-‐-‐-‐-‐-‐-‐-‐-‐-‐-‐-‐-‐-‐ x 100
Total no. of TRS daily working hours USERS’ QUESTION THAT THIS ANSWERS: How much effort do teaching staff make to deliver quality teaching? This gives us information about the quality and the commitment of teaching staff in teacher training activities. It measures the effort made by teaching and research staff in lifelong learning of teaching skills.
Percentage of teachers who hold/have held fellowships at other universities DEFINITION: Percentage relationship between the number of teachers who hold/have held fellowships at other universities (national or international) and the total number of teaching and research staff (TRS) at the university CALCULATION:
No. of TRS who hold/have held fellowships at other universities -‐-‐-‐-‐-‐-‐-‐-‐-‐-‐-‐-‐-‐-‐-‐-‐-‐-‐-‐-‐-‐-‐-‐-‐-‐-‐-‐-‐-‐-‐-‐-‐-‐-‐-‐-‐-‐-‐-‐-‐-‐-‐-‐-‐-‐-‐-‐-‐-‐-‐-‐-‐-‐-‐-‐-‐-‐-‐-‐-‐-‐-‐-‐-‐-‐-‐ x 100
Total no. of TRS at the university
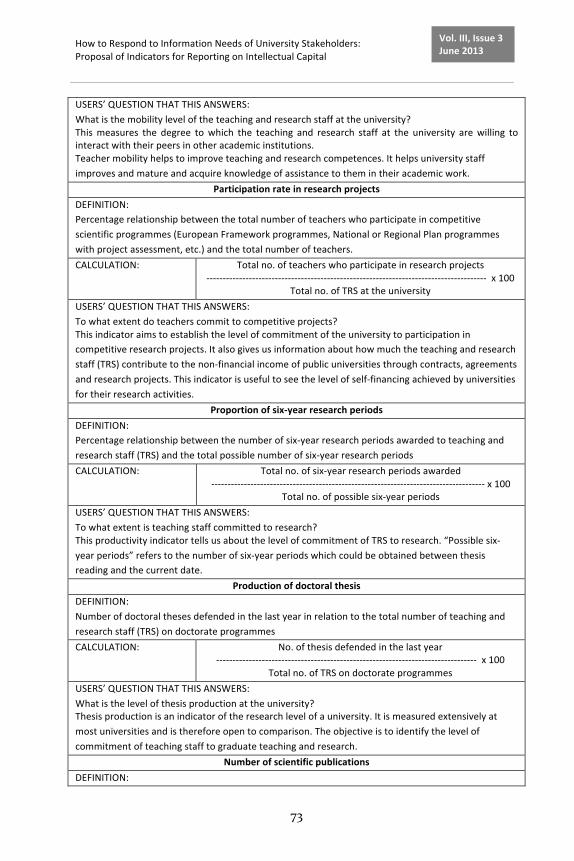
How to Respond to Information Needs of University Stakeholders: Proposal of Indicators for Reporting on Intellectual Capital
73
Vol. III, Issue 3 June 2013
USERS’ QUESTION THAT THIS ANSWERS: What is the mobility level of the teaching and research staff at the university? This measures the degree to which the teaching and research staff at the university are willing to interact with their peers in other academic institutions. Teacher mobility helps to improve teaching and research competences. It helps university staff improves and mature and acquire knowledge of assistance to them in their academic work.
Participation rate in research projects DEFINITION: Percentage relationship between the total number of teachers who participate in competitive scientific programmes (European Framework programmes, National or Regional Plan programmes with project assessment, etc.) and the total number of teachers. CALCULATION:
Total no. of teachers who participate in research projects -‐-‐-‐-‐-‐-‐-‐-‐-‐-‐-‐-‐-‐-‐-‐-‐-‐-‐-‐-‐-‐-‐-‐-‐-‐-‐-‐-‐-‐-‐-‐-‐-‐-‐-‐-‐-‐-‐-‐-‐-‐-‐-‐-‐-‐-‐-‐-‐-‐-‐-‐-‐-‐-‐-‐-‐-‐-‐-‐-‐-‐-‐-‐-‐-‐-‐-‐-‐-‐-‐-‐-‐-‐-‐-‐-‐-‐-‐-‐-‐-‐-‐-‐-‐-‐-‐ x 100
Total no. of TRS at the university USERS’ QUESTION THAT THIS ANSWERS: To what extent do teachers commit to competitive projects? This indicator aims to establish the level of commitment of the university to participation in competitive research projects. It also gives us information about how much the teaching and research staff (TRS) contribute to the non-‐financial income of public universities through contracts, agreements and research projects. This indicator is useful to see the level of self-‐financing achieved by universities for their research activities.
Proportion of six-‐year research periods DEFINITION: Percentage relationship between the number of six-‐year research periods awarded to teaching and research staff (TRS) and the total possible number of six-‐year research periods CALCULATION:
Total no. of six-‐year research periods awarded -‐-‐-‐-‐-‐-‐-‐-‐-‐-‐-‐-‐-‐-‐-‐-‐-‐-‐-‐-‐-‐-‐-‐-‐-‐-‐-‐-‐-‐-‐-‐-‐-‐-‐-‐-‐-‐-‐-‐-‐-‐-‐-‐-‐-‐-‐-‐-‐-‐-‐-‐-‐-‐-‐-‐-‐-‐-‐-‐-‐-‐-‐-‐-‐-‐-‐-‐-‐-‐-‐-‐-‐-‐-‐-‐-‐-‐-‐-‐-‐-‐-‐-‐-‐ x 100
Total no. of possible six-‐year periods USERS’ QUESTION THAT THIS ANSWERS: To what extent is teaching staff committed to research? This productivity indicator tells us about the level of commitment of TRS to research. “Possible six-‐year periods” refers to the number of six-‐year periods which could be obtained between thesis reading and the current date.
Production of doctoral thesis DEFINITION: Number of doctoral theses defended in the last year in relation to the total number of teaching and research staff (TRS) on doctorate programmes CALCULATION:
No. of thesis defended in the last year -‐-‐-‐-‐-‐-‐-‐-‐-‐-‐-‐-‐-‐-‐-‐-‐-‐-‐-‐-‐-‐-‐-‐-‐-‐-‐-‐-‐-‐-‐-‐-‐-‐-‐-‐-‐-‐-‐-‐-‐-‐-‐-‐-‐-‐-‐-‐-‐-‐-‐-‐-‐-‐-‐-‐-‐-‐-‐-‐-‐-‐-‐-‐-‐-‐-‐-‐-‐-‐-‐-‐-‐-‐-‐-‐-‐-‐-‐-‐-‐ x 100
Total no. of TRS on doctorate programmes USERS’ QUESTION THAT THIS ANSWERS: What is the level of thesis production at the university? Thesis production is an indicator of the research level of a university. It is measured extensively at most universities and is therefore open to comparison. The objective is to identify the level of commitment of teaching staff to graduate teaching and research.
Number of scientific publications DEFINITION:
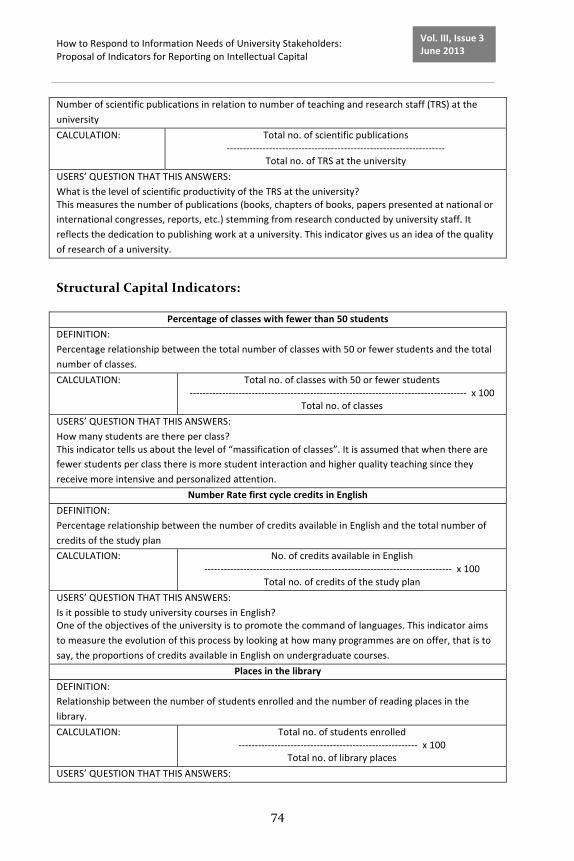
How to Respond to Information Needs of University Stakeholders: Proposal of Indicators for Reporting on Intellectual Capital
74
Vol. III, Issue 3 June 2013
Number of scientific publications in relation to number of teaching and research staff (TRS) at the university CALCULATION:
Total no. of scientific publications -‐-‐-‐-‐-‐-‐-‐-‐-‐-‐-‐-‐-‐-‐-‐-‐-‐-‐-‐-‐-‐-‐-‐-‐-‐-‐-‐-‐-‐-‐-‐-‐-‐-‐-‐-‐-‐-‐-‐-‐-‐-‐-‐-‐-‐-‐-‐-‐-‐-‐-‐-‐-‐-‐-‐-‐-‐-‐-‐-‐-‐-‐-‐-‐-‐-‐-‐
Total no. of TRS at the university USERS’ QUESTION THAT THIS ANSWERS: What is the level of scientific productivity of the TRS at the university? This measures the number of publications (books, chapters of books, papers presented at national or international congresses, reports, etc.) stemming from research conducted by university staff. It reflects the dedication to publishing work at a university. This indicator gives us an idea of the quality of research of a university.
Structural Capital Indicators:
Percentage of classes with fewer than 50 students DEFINITION: Percentage relationship between the total number of classes with 50 or fewer students and the total number of classes. CALCULATION:
Total no. of classes with 50 or fewer students -‐-‐-‐-‐-‐-‐-‐-‐-‐-‐-‐-‐-‐-‐-‐-‐-‐-‐-‐-‐-‐-‐-‐-‐-‐-‐-‐-‐-‐-‐-‐-‐-‐-‐-‐-‐-‐-‐-‐-‐-‐-‐-‐-‐-‐-‐-‐-‐-‐-‐-‐-‐-‐-‐-‐-‐-‐-‐-‐-‐-‐-‐-‐-‐-‐-‐-‐-‐-‐-‐-‐-‐-‐-‐-‐-‐-‐-‐-‐-‐-‐-‐-‐-‐-‐ x 100
Total no. of classes USERS’ QUESTION THAT THIS ANSWERS: How many students are there per class? This indicator tells us about the level of “massification of classes”. It is assumed that when there are fewer students per class there is more student interaction and higher quality teaching since they receive more intensive and personalized attention.
Number Rate first cycle credits in English DEFINITION: Percentage relationship between the number of credits available in English and the total number of credits of the study plan CALCULATION:
No. of credits available in English -‐-‐-‐-‐-‐-‐-‐-‐-‐-‐-‐-‐-‐-‐-‐-‐-‐-‐-‐-‐-‐-‐-‐-‐-‐-‐-‐-‐-‐-‐-‐-‐-‐-‐-‐-‐-‐-‐-‐-‐-‐-‐-‐-‐-‐-‐-‐-‐-‐-‐-‐-‐-‐-‐-‐-‐-‐-‐-‐-‐-‐-‐-‐-‐-‐-‐-‐-‐-‐-‐-‐-‐-‐-‐-‐-‐ x 100
Total no. of credits of the study plan USERS’ QUESTION THAT THIS ANSWERS: Is it possible to study university courses in English? One of the objectives of the university is to promote the command of languages. This indicator aims to measure the evolution of this process by looking at how many programmes are on offer, that is to say, the proportions of credits available in English on undergraduate courses.
Places in the library DEFINITION: Relationship between the number of students enrolled and the number of reading places in the library. CALCULATION:
Total no. of students enrolled -‐-‐-‐-‐-‐-‐-‐-‐-‐-‐-‐-‐-‐-‐-‐-‐-‐-‐-‐-‐-‐-‐-‐-‐-‐-‐-‐-‐-‐-‐-‐-‐-‐-‐-‐-‐-‐-‐-‐-‐-‐-‐-‐-‐-‐-‐-‐-‐-‐-‐-‐-‐-‐-‐-‐ x 100
Total no. of library places USERS’ QUESTION THAT THIS ANSWERS:
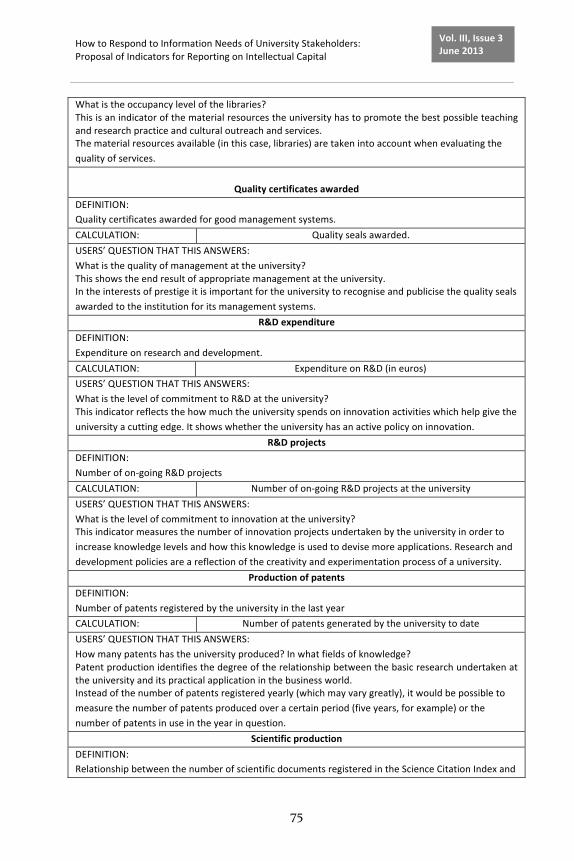
How to Respond to Information Needs of University Stakeholders: Proposal of Indicators for Reporting on Intellectual Capital
75
Vol. III, Issue 3 June 2013
What is the occupancy level of the libraries? This is an indicator of the material resources the university has to promote the best possible teaching and research practice and cultural outreach and services. The material resources available (in this case, libraries) are taken into account when evaluating the quality of services.
Quality certificates awarded
DEFINITION: Quality certificates awarded for good management systems. CALCULATION: Quality seals awarded. USERS’ QUESTION THAT THIS ANSWERS: What is the quality of management at the university? This shows the end result of appropriate management at the university. In the interests of prestige it is important for the university to recognise and publicise the quality seals awarded to the institution for its management systems.
R&D expenditure DEFINITION: Expenditure on research and development. CALCULATION: Expenditure on R&D (in euros) USERS’ QUESTION THAT THIS ANSWERS: What is the level of commitment to R&D at the university? This indicator reflects the how much the university spends on innovation activities which help give the university a cutting edge. It shows whether the university has an active policy on innovation.
R&D projects DEFINITION: Number of on-‐going R&D projects CALCULATION: Number of on-‐going R&D projects at the university USERS’ QUESTION THAT THIS ANSWERS: What is the level of commitment to innovation at the university? This indicator measures the number of innovation projects undertaken by the university in order to increase knowledge levels and how this knowledge is used to devise more applications. Research and development policies are a reflection of the creativity and experimentation process of a university.
Production of patents DEFINITION: Number of patents registered by the university in the last year CALCULATION: Number of patents generated by the university to date USERS’ QUESTION THAT THIS ANSWERS: How many patents has the university produced? In what fields of knowledge? Patent production identifies the degree of the relationship between the basic research undertaken at the university and its practical application in the business world. Instead of the number of patents registered yearly (which may vary greatly), it would be possible to measure the number of patents produced over a certain period (five years, for example) or the number of patents in use in the year in question.
Scientific production DEFINITION: Relationship between the number of scientific documents registered in the Science Citation Index and
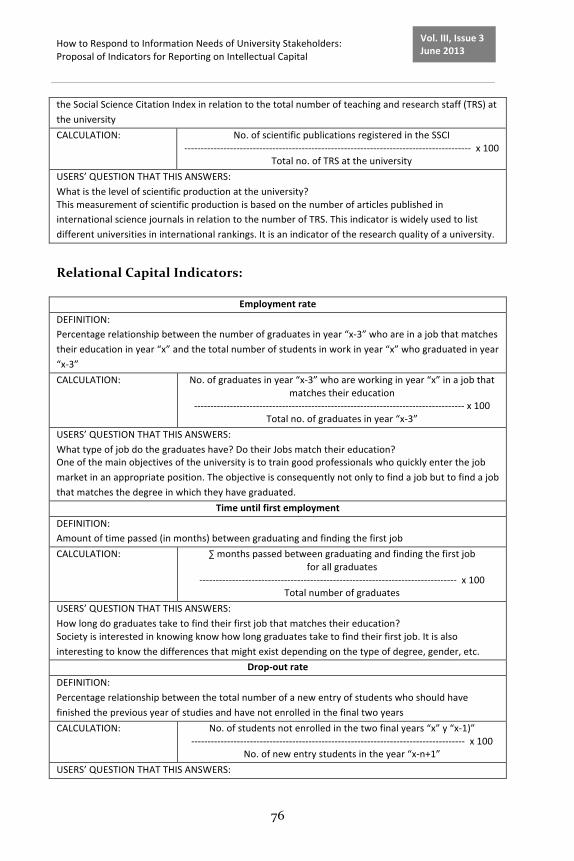
How to Respond to Information Needs of University Stakeholders: Proposal of Indicators for Reporting on Intellectual Capital
76
Vol. III, Issue 3 June 2013
the Social Science Citation Index in relation to the total number of teaching and research staff (TRS) at the university CALCULATION:
No. of scientific publications registered in the SSCI -‐-‐-‐-‐-‐-‐-‐-‐-‐-‐-‐-‐-‐-‐-‐-‐-‐-‐-‐-‐-‐-‐-‐-‐-‐-‐-‐-‐-‐-‐-‐-‐-‐-‐-‐-‐-‐-‐-‐-‐-‐-‐-‐-‐-‐-‐-‐-‐-‐-‐-‐-‐-‐-‐-‐-‐-‐-‐-‐-‐-‐-‐-‐-‐-‐-‐-‐-‐-‐-‐-‐-‐-‐-‐-‐-‐-‐-‐-‐-‐-‐-‐-‐-‐-‐-‐-‐-‐ x 100
Total no. of TRS at the university USERS’ QUESTION THAT THIS ANSWERS: What is the level of scientific production at the university? This measurement of scientific production is based on the number of articles published in international science journals in relation to the number of TRS. This indicator is widely used to list different universities in international rankings. It is an indicator of the research quality of a university.
Relational Capital Indicators:
Employment rate DEFINITION: Percentage relationship between the number of graduates in year “x-‐3” who are in a job that matches their education in year “x” and the total number of students in work in year “x” who graduated in year “x-‐3” CALCULATION:
No. of graduates in year “x-‐3” who are working in year “x” in a job that matches their education
-‐-‐-‐-‐-‐-‐-‐-‐-‐-‐-‐-‐-‐-‐-‐-‐-‐-‐-‐-‐-‐-‐-‐-‐-‐-‐-‐-‐-‐-‐-‐-‐-‐-‐-‐-‐-‐-‐-‐-‐-‐-‐-‐-‐-‐-‐-‐-‐-‐-‐-‐-‐-‐-‐-‐-‐-‐-‐-‐-‐-‐-‐-‐-‐-‐-‐-‐-‐-‐-‐-‐-‐-‐-‐-‐-‐-‐-‐-‐-‐-‐-‐-‐ x 100 Total no. of graduates in year “x-‐3”
USERS’ QUESTION THAT THIS ANSWERS: What type of job do the graduates have? Do their Jobs match their education? One of the main objectives of the university is to train good professionals who quickly enter the job market in an appropriate position. The objective is consequently not only to find a job but to find a job that matches the degree in which they have graduated.
Time until first employment DEFINITION: Amount of time passed (in months) between graduating and finding the first job CALCULATION:
∑ months passed between graduating and finding the first job for all graduates
-‐-‐-‐-‐-‐-‐-‐-‐-‐-‐-‐-‐-‐-‐-‐-‐-‐-‐-‐-‐-‐-‐-‐-‐-‐-‐-‐-‐-‐-‐-‐-‐-‐-‐-‐-‐-‐-‐-‐-‐-‐-‐-‐-‐-‐-‐-‐-‐-‐-‐-‐-‐-‐-‐-‐-‐-‐-‐-‐-‐-‐-‐-‐-‐-‐-‐-‐-‐-‐-‐-‐-‐-‐-‐-‐-‐-‐-‐-‐ x 100 Total number of graduates
USERS’ QUESTION THAT THIS ANSWERS: How long do graduates take to find their first job that matches their education? Society is interested in knowing know how long graduates take to find their first job. It is also interesting to know the differences that might exist depending on the type of degree, gender, etc.
Drop-‐out rate DEFINITION: Percentage relationship between the total number of a new entry of students who should have finished the previous year of studies and have not enrolled in the final two years CALCULATION:
No. of students not enrolled in the two final years “x” y “x-‐1)” -‐-‐-‐-‐-‐-‐-‐-‐-‐-‐-‐-‐-‐-‐-‐-‐-‐-‐-‐-‐-‐-‐-‐-‐-‐-‐-‐-‐-‐-‐-‐-‐-‐-‐-‐-‐-‐-‐-‐-‐-‐-‐-‐-‐-‐-‐-‐-‐-‐-‐-‐-‐-‐-‐-‐-‐-‐-‐-‐-‐-‐-‐-‐-‐-‐-‐-‐-‐-‐-‐-‐-‐-‐-‐-‐-‐-‐-‐-‐-‐-‐-‐-‐-‐ x 100
No. of new entry students in the year “x-‐n+1” USERS’ QUESTION THAT THIS ANSWERS:
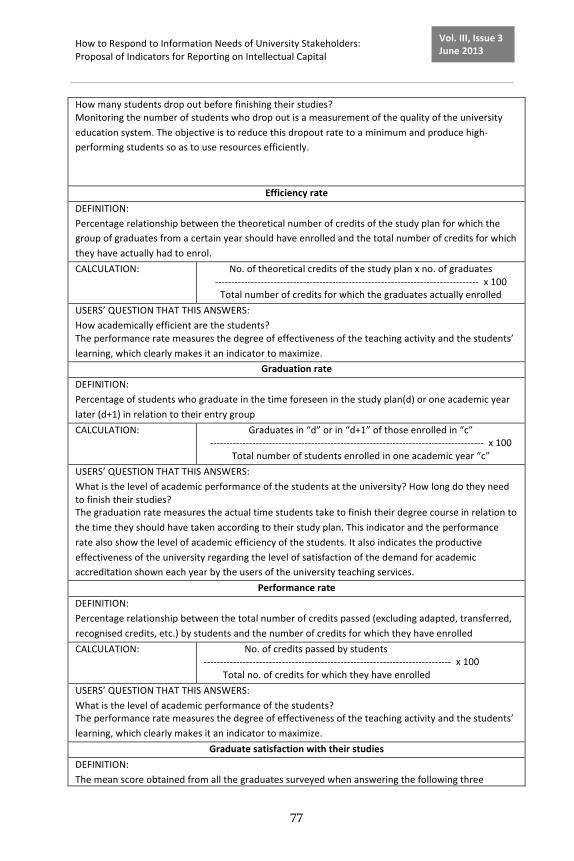
How to Respond to Information Needs of University Stakeholders: Proposal of Indicators for Reporting on Intellectual Capital
77
Vol. III, Issue 3 June 2013
How many students drop out before finishing their studies? Monitoring the number of students who drop out is a measurement of the quality of the university education system. The objective is to reduce this dropout rate to a minimum and produce high-‐performing students so as to use resources efficiently.
Efficiency rate DEFINITION: Percentage relationship between the theoretical number of credits of the study plan for which the group of graduates from a certain year should have enrolled and the total number of credits for which they have actually had to enrol. CALCULATION:
No. of theoretical credits of the study plan x no. of graduates -‐-‐-‐-‐-‐-‐-‐-‐-‐-‐-‐-‐-‐-‐-‐-‐-‐-‐-‐-‐-‐-‐-‐-‐-‐-‐-‐-‐-‐-‐-‐-‐-‐-‐-‐-‐-‐-‐-‐-‐-‐-‐-‐-‐-‐-‐-‐-‐-‐-‐-‐-‐-‐-‐-‐-‐-‐-‐-‐-‐-‐-‐-‐-‐-‐-‐-‐-‐-‐-‐-‐-‐-‐-‐-‐-‐-‐-‐-‐-‐-‐ x 100 Total number of credits for which the graduates actually enrolled
USERS’ QUESTION THAT THIS ANSWERS: How academically efficient are the students? The performance rate measures the degree of effectiveness of the teaching activity and the students’ learning, which clearly makes it an indicator to maximize.
Graduation rate DEFINITION: Percentage of students who graduate in the time foreseen in the study plan(d) or one academic year later (d+1) in relation to their entry group CALCULATION:
Graduates in “d” or in “d+1” of those enrolled in “c” -‐-‐-‐-‐-‐-‐-‐-‐-‐-‐-‐-‐-‐-‐-‐-‐-‐-‐-‐-‐-‐-‐-‐-‐-‐-‐-‐-‐-‐-‐-‐-‐-‐-‐-‐-‐-‐-‐-‐-‐-‐-‐-‐-‐-‐-‐-‐-‐-‐-‐-‐-‐-‐-‐-‐-‐-‐-‐-‐-‐-‐-‐-‐-‐-‐-‐-‐-‐-‐-‐-‐-‐-‐-‐-‐-‐-‐-‐-‐-‐-‐-‐-‐-‐ x 100
Total number of students enrolled in one academic year “c” USERS’ QUESTION THAT THIS ANSWERS: What is the level of academic performance of the students at the university? How long do they need to finish their studies? The graduation rate measures the actual time students take to finish their degree course in relation to the time they should have taken according to their study plan. This indicator and the performance rate also show the level of academic efficiency of the students. It also indicates the productive effectiveness of the university regarding the level of satisfaction of the demand for academic accreditation shown each year by the users of the university teaching services.
Performance rate DEFINITION: Percentage relationship between the total number of credits passed (excluding adapted, transferred, recognised credits, etc.) by students and the number of credits for which they have enrolled CALCULATION:
No. of credits passed by students -‐-‐-‐-‐-‐-‐-‐-‐-‐-‐-‐-‐-‐-‐-‐-‐-‐-‐-‐-‐-‐-‐-‐-‐-‐-‐-‐-‐-‐-‐-‐-‐-‐-‐-‐-‐-‐-‐-‐-‐-‐-‐-‐-‐-‐-‐-‐-‐-‐-‐-‐-‐-‐-‐-‐-‐-‐-‐-‐-‐-‐-‐-‐-‐-‐-‐-‐-‐-‐-‐-‐-‐-‐-‐-‐-‐ x 100 Total no. of credits for which they have enrolled
USERS’ QUESTION THAT THIS ANSWERS: What is the level of academic performance of the students? The performance rate measures the degree of effectiveness of the teaching activity and the students’ learning, which clearly makes it an indicator to maximize.
Graduate satisfaction with their studies DEFINITION: The mean score obtained from all the graduates surveyed when answering the following three
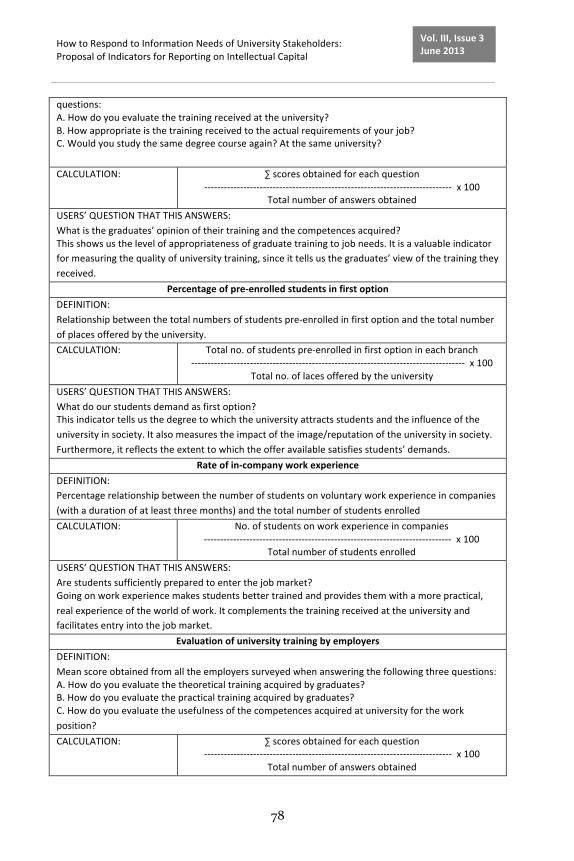
How to Respond to Information Needs of University Stakeholders: Proposal of Indicators for Reporting on Intellectual Capital
78
Vol. III, Issue 3 June 2013
questions: A. How do you evaluate the training received at the university? B. How appropriate is the training received to the actual requirements of your job? C. Would you study the same degree course again? At the same university? CALCULATION:
∑ scores obtained for each question -‐-‐-‐-‐-‐-‐-‐-‐-‐-‐-‐-‐-‐-‐-‐-‐-‐-‐-‐-‐-‐-‐-‐-‐-‐-‐-‐-‐-‐-‐-‐-‐-‐-‐-‐-‐-‐-‐-‐-‐-‐-‐-‐-‐-‐-‐-‐-‐-‐-‐-‐-‐-‐-‐-‐-‐-‐-‐-‐-‐-‐-‐-‐-‐-‐-‐-‐-‐-‐-‐-‐-‐-‐-‐-‐-‐ x 100
Total number of answers obtained USERS’ QUESTION THAT THIS ANSWERS: What is the graduates’ opinion of their training and the competences acquired? This shows us the level of appropriateness of graduate training to job needs. It is a valuable indicator for measuring the quality of university training, since it tells us the graduates’ view of the training they received.
Percentage of pre-‐enrolled students in first option DEFINITION: Relationship between the total numbers of students pre-‐enrolled in first option and the total number of places offered by the university. CALCULATION:
Total no. of students pre-‐enrolled in first option in each branch -‐-‐-‐-‐-‐-‐-‐-‐-‐-‐-‐-‐-‐-‐-‐-‐-‐-‐-‐-‐-‐-‐-‐-‐-‐-‐-‐-‐-‐-‐-‐-‐-‐-‐-‐-‐-‐-‐-‐-‐-‐-‐-‐-‐-‐-‐-‐-‐-‐-‐-‐-‐-‐-‐-‐-‐-‐-‐-‐-‐-‐-‐-‐-‐-‐-‐-‐-‐-‐-‐-‐-‐-‐-‐-‐-‐-‐-‐-‐-‐-‐-‐-‐-‐ x 100
Total no. of laces offered by the university USERS’ QUESTION THAT THIS ANSWERS: What do our students demand as first option? This indicator tells us the degree to which the university attracts students and the influence of the university in society. It also measures the impact of the image/reputation of the university in society. Furthermore, it reflects the extent to which the offer available satisfies students’ demands.
Rate of in-‐company work experience DEFINITION: Percentage relationship between the number of students on voluntary work experience in companies (with a duration of at least three months) and the total number of students enrolled CALCULATION:
No. of students on work experience in companies -‐-‐-‐-‐-‐-‐-‐-‐-‐-‐-‐-‐-‐-‐-‐-‐-‐-‐-‐-‐-‐-‐-‐-‐-‐-‐-‐-‐-‐-‐-‐-‐-‐-‐-‐-‐-‐-‐-‐-‐-‐-‐-‐-‐-‐-‐-‐-‐-‐-‐-‐-‐-‐-‐-‐-‐-‐-‐-‐-‐-‐-‐-‐-‐-‐-‐-‐-‐-‐-‐-‐-‐-‐-‐-‐-‐ x 100
Total number of students enrolled USERS’ QUESTION THAT THIS ANSWERS: Are students sufficiently prepared to enter the job market? Going on work experience makes students better trained and provides them with a more practical, real experience of the world of work. It complements the training received at the university and facilitates entry into the job market.
Evaluation of university training by employers DEFINITION: Mean score obtained from all the employers surveyed when answering the following three questions: A. How do you evaluate the theoretical training acquired by graduates? B. How do you evaluate the practical training acquired by graduates? C. How do you evaluate the usefulness of the competences acquired at university for the work position? CALCULATION:
∑ scores obtained for each question -‐-‐-‐-‐-‐-‐-‐-‐-‐-‐-‐-‐-‐-‐-‐-‐-‐-‐-‐-‐-‐-‐-‐-‐-‐-‐-‐-‐-‐-‐-‐-‐-‐-‐-‐-‐-‐-‐-‐-‐-‐-‐-‐-‐-‐-‐-‐-‐-‐-‐-‐-‐-‐-‐-‐-‐-‐-‐-‐-‐-‐-‐-‐-‐-‐-‐-‐-‐-‐-‐-‐-‐-‐-‐-‐-‐ x 100
Total number of answers obtained
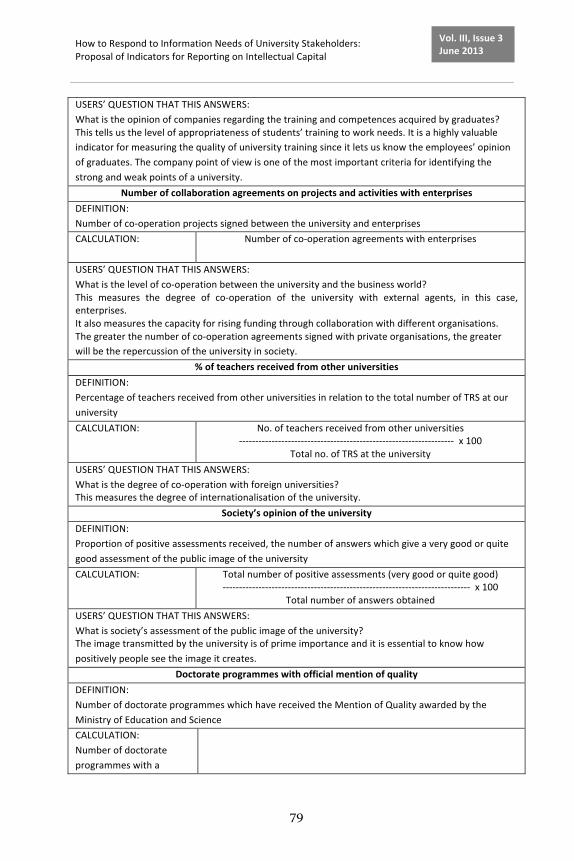
How to Respond to Information Needs of University Stakeholders: Proposal of Indicators for Reporting on Intellectual Capital
79
Vol. III, Issue 3 June 2013
USERS’ QUESTION THAT THIS ANSWERS: What is the opinion of companies regarding the training and competences acquired by graduates? This tells us the level of appropriateness of students’ training to work needs. It is a highly valuable indicator for measuring the quality of university training since it lets us know the employees’ opinion of graduates. The company point of view is one of the most important criteria for identifying the strong and weak points of a university.
Number of collaboration agreements on projects and activities with enterprises DEFINITION: Number of co-‐operation projects signed between the university and enterprises CALCULATION:
Number of co-‐operation agreements with enterprises
USERS’ QUESTION THAT THIS ANSWERS: What is the level of co-‐operation between the university and the business world? This measures the degree of co-‐operation of the university with external agents, in this case, enterprises. It also measures the capacity for rising funding through collaboration with different organisations. The greater the number of co-‐operation agreements signed with private organisations, the greater will be the repercussion of the university in society.
% of teachers received from other universities DEFINITION: Percentage of teachers received from other universities in relation to the total number of TRS at our university CALCULATION:
No. of teachers received from other universities -‐-‐-‐-‐-‐-‐-‐-‐-‐-‐-‐-‐-‐-‐-‐-‐-‐-‐-‐-‐-‐-‐-‐-‐-‐-‐-‐-‐-‐-‐-‐-‐-‐-‐-‐-‐-‐-‐-‐-‐-‐-‐-‐-‐-‐-‐-‐-‐-‐-‐-‐-‐-‐-‐-‐-‐-‐-‐-‐-‐-‐-‐-‐-‐-‐-‐ x 100
Total no. of TRS at the university USERS’ QUESTION THAT THIS ANSWERS: What is the degree of co-‐operation with foreign universities? This measures the degree of internationalisation of the university.
Society’s opinion of the university DEFINITION: Proportion of positive assessments received, the number of answers which give a very good or quite good assessment of the public image of the university CALCULATION:
Total number of positive assessments (very good or quite good) -‐-‐-‐-‐-‐-‐-‐-‐-‐-‐-‐-‐-‐-‐-‐-‐-‐-‐-‐-‐-‐-‐-‐-‐-‐-‐-‐-‐-‐-‐-‐-‐-‐-‐-‐-‐-‐-‐-‐-‐-‐-‐-‐-‐-‐-‐-‐-‐-‐-‐-‐-‐-‐-‐-‐-‐-‐-‐-‐-‐-‐-‐-‐-‐-‐-‐-‐-‐-‐-‐-‐-‐-‐-‐-‐-‐ x 100
Total number of answers obtained USERS’ QUESTION THAT THIS ANSWERS: What is society’s assessment of the public image of the university? The image transmitted by the university is of prime importance and it is essential to know how positively people see the image it creates.
Doctorate programmes with official mention of quality DEFINITION: Number of doctorate programmes which have received the Mention of Quality awarded by the Ministry of Education and Science CALCULATION: Number of doctorate programmes with a
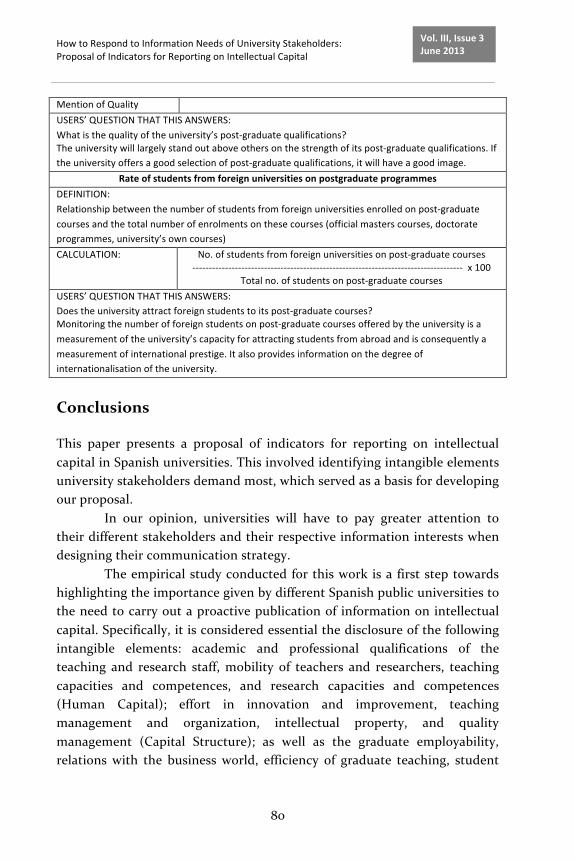
How to Respond to Information Needs of University Stakeholders: Proposal of Indicators for Reporting on Intellectual Capital
80
Vol. III, Issue 3 June 2013
Mention of Quality USERS’ QUESTION THAT THIS ANSWERS: What is the quality of the university’s post-‐graduate qualifications? The university will largely stand out above others on the strength of its post-‐graduate qualifications. If the university offers a good selection of post-‐graduate qualifications, it will have a good image.
Rate of students from foreign universities on postgraduate programmes DEFINITION: Relationship between the number of students from foreign universities enrolled on post-‐graduate courses and the total number of enrolments on these courses (official masters courses, doctorate programmes, university’s own courses) CALCULATION:
No. of students from foreign universities on post-‐graduate courses -‐-‐-‐-‐-‐-‐-‐-‐-‐-‐-‐-‐-‐-‐-‐-‐-‐-‐-‐-‐-‐-‐-‐-‐-‐-‐-‐-‐-‐-‐-‐-‐-‐-‐-‐-‐-‐-‐-‐-‐-‐-‐-‐-‐-‐-‐-‐-‐-‐-‐-‐-‐-‐-‐-‐-‐-‐-‐-‐-‐-‐-‐-‐-‐-‐-‐-‐-‐-‐-‐-‐-‐-‐-‐-‐-‐-‐-‐-‐-‐-‐-‐-‐ x 100
Total no. of students on post-‐graduate courses USERS’ QUESTION THAT THIS ANSWERS: Does the university attract foreign students to its post-‐graduate courses? Monitoring the number of foreign students on post-‐graduate courses offered by the university is a measurement of the university’s capacity for attracting students from abroad and is consequently a measurement of international prestige. It also provides information on the degree of internationalisation of the university.
Conclusions
This paper presents a proposal of indicators for reporting on intellectual capital in Spanish universities. This involved identifying intangible elements university stakeholders demand most, which served as a basis for developing our proposal.
In our opinion, universities will have to pay greater attention to their different stakeholders and their respective information interests when designing their communication strategy.
The empirical study conducted for this work is a first step towards highlighting the importance given by different Spanish public universities to the need to carry out a proactive publication of information on intellectual capital. Specifically, it is considered essential the disclosure of the following intangible elements: academic and professional qualifications of the teaching and research staff, mobility of teachers and researchers, teaching capacities and competences, and research capacities and competences (Human Capital); effort in innovation and improvement, teaching management and organization, intellectual property, and quality management (Capital Structure); as well as the graduate employability, relations with the business world, efficiency of graduate teaching, student
How to Respond to Information Needs of University Stakeholders: Proposal of Indicators for Reporting on Intellectual Capital
81
Vol. III, Issue 3 June 2013
satisfaction, the university’s image and collaboration with other universities (Relational Capital).
Based on these results, we develop our proposal of indicators for reporting on intellectual capital in universities.
We believe that complementary non-‐financial information is the most appropriate form to supply information on universities’ intangible elements, so as to avoid the inclusion of accounting criteria which could endanger the quality and reliability of the financial information. In our opinion, an improvement in university accounting systems would be achieved by the drafting and presentation of a new report complementary to the current financial statements –the Intellectual Capital Report-‐. A set of indicators would show the information most demanded by different stakeholders regarding the institution’s intangible elements. It would be a healthy exercise in transparency for these institutions to facilitate access for their users to a variety of information which is relevant to their decision making.
References
[1] Altenburger, O.A. and Schaffhauser, Z.M. (2005): “Intellectual capital reports for universities – a trial intellectual report at the University of
Vienna”, paper presented at the 1st Workshop on Visualizing, Measuring and Managing Intangibles and Intellectual Capital, 18-‐20 October, Ferrara, Italy.
[2] Bezhani, I. (2010): “Intellectual capital reporting at UK universities”, Journal
of Intellectual Capital, Vol. 11, No. 2, pp. 179-‐207. [3] Bodnár, V., Harangozó, T., Tirnitz, T., Révész, E. and Kováts, G. (2010):
“Managing intellectual capital in Hungarian Universities – the case of
Corvinus University of Budapest” in proceedings of the 2nd European Conference on Intellectual Capital in Lisbon, Portugal, 2010, pp. 89-‐126.
[4] Brătianu, C. (2009): “The intellectual capital of universities”, Annals of the
University of Ljubljana, 30 June-‐1 July, Ljubljana. [5] Bueno, E., Morcillo, P. and Rodríguez, J. (2002): “Intellectual capital and
scientific production of the Madrid Research Centres”, paper presented at
the Conference the Transparent Enterprise. The Value of Intangibles, 25-‐26 November 2002, Madrid, Spain, available at: www.iade.org/files/transparent1.pdf (accessed 15 December 2012)
[6] Bueno, E.-‐Centro de Investigación sobre la Sociedad del Conocimiento (CIC) (2003): Modelo Intellectus: medición y gestión del capital intelectual.
How to Respond to Information Needs of University Stakeholders: Proposal of Indicators for Reporting on Intellectual Capital
82
Vol. III, Issue 3 June 2013
Documentos Intellectus nº 5, Centro de Investigación sobre la Sociedad del Conocimiento, Madrid.
[7] Burgman, R., Roos, G., Boldt, L. and Pike, S. (2007): “Information needs of internal and external stakeholders and how to respond: Reporting on operations and intellectual capital”, International Journal of Accounting,
Auditing and Performance Evaluation, Vol. 4, No. 4-‐5, pp. 529-‐546. [8] Cañibano, L. and Sánchez, P. (2008): “Intellectual Capital Management and
Reporting in Universities and Research Institutions”, Estudios de Economía
Aplicada, Vol. 26, No. 2, pp. 7-‐26. [9] Cañibano, L., Sánchez, P., García-‐Ayuso, M. and Chaminade, C. (Ed.)
(2002): Directrices para la Gestión y Difusión de Información sobre
Intangibles. Informe de Capital Intelectual. Proyecto Meritum, Vodafone Fundación, Madrid.
[10] Cañibano, L., Gisbert, A., García-‐Meca, E. and García-‐Osma, B. (2008): Los
intangibles en la regulación contable, Documento AECA & Instituto Análisis Intangibles, Madrid.
[11] Casanueva, C. and Gallego, A. (2010): “Social capital and individual
innovativeness in university research networks”, Innovation: Management, Policy & Practice, Vol. 12, No. 1, pp. 105-‐117.
[12] Castilla, F. and Gallardo, D. (2003): “Comunicación voluntaria de
información sobre intangibles. Evidencias empíricas para el caso andaluz”, Investigaciones Europeas de Dirección y Economía de la Empresa, Vol. 9, No. 2, pp. 13-‐28.
[13] Coy, D., Tower, G. and Dixon, K. (2001): “Public accountability: A new paradigm for college and university annual reports”, Critical Perspective on Accounting, Vol. 12, pp. 1-‐31.
[14] Electronics and Telecommunications Research Institute (ETRI) (2005): “Intellectual Capital Report”, available at: www.etri.er.kr (accessed 20 January 2013)
[15] European University of Association (EUA) (2006): The rise of knowledge regions: emerging opportunities and challenges for universities, European University Association, Brussels, available at: http://www.eua.be (accessed
12 January 2013) [16] Fazlagic, A. (2005): “Measuring the intellectual capital of a University”,
paper presented at the Conference on Trends in the Management of Human
Resources in Higher Education, Paris, OECD, available at:
How to Respond to Information Needs of University Stakeholders: Proposal of Indicators for Reporting on Intellectual Capital
83
Vol. III, Issue 3 June 2013
http://www.oecd.org/dataoecd/56/16/35322785.pdf (accessed 5 February 2013)
[17] Federal Ministry of Education, Science and Culture of Austria (2002): University Organization and Studies Act – University Act 2002 -‐, Nº 120/2002, available at: http://www.bmbwk.gv.at (accessed 18 December
2012) [18] Federal Ministry of Education, Science and Culture of Austria (2006):
Verordnung ueber die Wiessenbilanz (Wissensbilanz-‐Verordnung-‐WBV),
BGB1, II Nr.63/2006, available at: http://www.bmbwk.gv.at/universiteeten/recht/gesetze/wbv/wbv.xml (accessed 18 December 2012)
[19] González, J.J. and Rodríguez, M.T. (2010): “Modelos de capital intelectual y sus indicadores en la universidad pública”, Cuadernos de Administración, Vol. 43, pp. 113-‐128.
[20] Gray, R.H. (2006): “Social, environmental and sustainability reporting and organizational value creation? Whose value? Whose creation?”, Accounting, Auditing and Accountability Journal, Vol. 19, No. 6, pp. 793-‐819.
[21] Instituto de Contabilidad y Auditoría de Cuentas (ICAC) (2002): Informe sobre la situación actual de la contabilidad en España y líneas básicas para abordar su reforma (Libro Blanco para la reforma de la contabilidad en
España), ICAC, Madrid. [22] Jones, N., Meadow, C. and Sicilia, M.A. (2009): “Measuring intellectual
capital in higher education”, Journal of Information & Knowledge
Management, Vol. 8, No. 2, pp. 113-‐136. [23] Leitner, K.H. (2004): “Intellectual Capital reporting for universities:
conceptual background and application for Austrian Universities”, Research
Evaluation, Vol. 13, No. 2, pp. 129-‐140. [24] Leitner, K.H. and Warden, C. (2004): “Managing and reporting knowledge-‐
based resources and processes in research organisations: specifics, lesson
and perspectives”, Management Accounting Research, Vol. 15, pp. 33-‐51. [25] Malyshko, A.V. (2008): “About European format of indices system for
measurement of intellectual capital value of a regional science center”,
Actual Problems of Economics, No. 11, pp. 162-‐172. [26] Martín, E. (2006): “La rendición de cuentas en las universidades públicas
españolas: un análisis de la información revelada en los estados
financieros”, Presupuesto y Gasto Público, Vol. 43, pp. 39-‐62.
How to Respond to Information Needs of University Stakeholders: Proposal of Indicators for Reporting on Intellectual Capital
84
Vol. III, Issue 3 June 2013
[27] Nava, R.M. and Mercado, P. (2011): “An analysis of the trajectory of intellectual capital in a Mexican public university”, Revista electrónica de
investigación educativa, Vol. 13, No. 2, pp. 166-‐187. [28] Observatory of European of University (OEU) (2006): Methodological
Guide, Final Report of the Observatory of the European University, PRIME
Project, available at: www.prime-‐noe.org (accessed 18 December 2012) [29] Pelau, C.; Bena, I.; Vladoi, A.D.; Dabija, D.C. and Fufezan, M. (2011): “The
quality of knowledge flows and its impact in the intellectual capital
development of a university”, in proceedings of the 3rd European Conference on Intellectual Capital in Cyprus, 2011, Academic Publishing International Limited, Cyprus, pp. 322-‐327.
[30] Rafiee, M., Mosavi, M. and Amirzadeh, R. (2010): “Formulating and elaborating a model for the recognition of intellectual capital in Iranian universities”, World Applied Sciences Journal, Vol. 10, No. 1, pp. 23-‐28.
[31] Ramírez, Y., Lorduy, C. and Rojas, J.A. (2007): “Intellectual capital management in Spanish Universities”, Journal of Intellectual Capital, Vol. 8, No. 4, pp. 732-‐748.
[32] Sánchez, J.M. and Rivera, S.C. (2009): “A model for measuring research capacity using an intellectual capital-‐based approach in a colombian higher education instittutions”, Innovar, Especial en Educación, pp. 179-‐197.
[33] Sánchez, P., Elena, S. and Castrillo, R. (2006): “The Intellectual Capital Report of Universities. Guidelines for disclosing IC information”, in Observatory of the European University (Ed.), PRIME-‐OEU Methodological
Guide, pp. 223-‐251. [34] Sánchez, P., Elena, S. and Castrillo, R. (2009):”Intellectual capital dynamics
in universities: a reporting model”, Journal of Intellectual Capital, Vol. 10,
No. 2, pp. 307-‐324. [35] Schaffhauser, M. (2009): “Intellectual capital reporting for Austrian
Universities – a trilling work in progress” paper presented at the EIASM
Workshop on the Process of Reform the University, 24-‐26 May, Siena, Italy. [36] Secundo, G., Margheritam, A., Elia, G. and Passiante, G. (2010): “Intangible
assets in higher education and research: mission, performance or both?”,
Journal of Intellectual Capital, Vol. 11, No. 2, pp. 140-‐157. [37] Silvestri, A. and Veltri, S. (2011): “The intellectual capital report within
universities: comparing experiences”, Economic Science Series, Vol. 20, No.
2, pp. 618-‐624.

How to Respond to Information Needs of University Stakeholders: Proposal of Indicators for Reporting on Intellectual Capital
85
Vol. III, Issue 3 June 2013
[38] Warden, C. (2003): “Managing and Reporting Intellectual Capital: New Strategic Challenges for HEROs”, IP Helpdesk Bulletin, Vol. 8, available at:
http://www.ipr-‐helpdesk.org/newsletter/8/pdf/EN/N08_EN.pdf (accessed 7 December 2012).
Scientific Papers (www.scientificpapers.org) Journal of Knowledge Management, Economics and Information Technology
86
Vol. III, Issue 3 June 2013
Relative Efficiency of Education Expenditures in Eastern Europe: A Non-Parametric Approach
Author: Aleksander Aristovnik, University of Ljubljana, Faculty of Administration, Slovenia, [email protected]‐lj.si
The article attempts to measure relative efficiency in utilizing public education expenditures in the new EU member states in comparison to the selected EU (plus Croatia) and OECD countries. As resources allocated to education are significantly limited, a special emphasis should be given to their efficient use regarding the institutional and legal constraints. By applying non-‐parametric methodology, i.e. Data Envelopment Analysis (DEA), a relative efficiency is defined as the deviation from the efficiency frontier which represents the maximum output/outcome attainable from each input level. An analysis of (output-‐oriented) efficiency measures shows that among the new EU member states Hungary, Estonia and Slovenia seem to be good benchmark countries in the field of primary, secondary and tertiary education, respectively. The empirical results also suggest that, in general, new EU member states show relatively high efficiency in tertiary education efficiency measures. Keywords: public expenditure; education; technical efficiency; DEA; Eastern Europe; EU; OECD
Introduction
An essential feature of knowledge is that it requires human capital (educated persons) for both its production and its application. Indeed, long-‐term economic growth of the economy rests with its capacity to increase
5

Relative Efficiency of Education Expenditures in Eastern Europe: A Non-‐parametric Approach
87
Vol. III, Issue 3 June 2013
productivity through rapid technological progress. Therefore, the national system of education is the quintessential tool for the creation and application of knowledge. However, as most of the countries are faced with increasing demands on their limited (public) resources, there is an increasing pressure to improve resource allocation and utilisation. Accordingly, policy makers in a number of countries became increasingly concerned with measuring efficiency. With education expenditures comprising a relatively important amount of national income, the interest in examining whether such expenditures are cost-‐effective has increased, recently.
The article joins the efforts of other scholars in investigating education efficiency by applying a non-‐parametric methodology. Hence, the purpose of the article is to review some previous researches on the efficiency measurement of public education sector as well as some conceptual and methodological issues of non-‐parametric approach. Most importantly, Data Envelopment Analysis (DEA) technique is presented and then applied to the wide range of the EU and OECD countries, including Eastern European (EE) countries 1 , to evaluate technical efficiency of the selected sector. The importance of examining public sector expenditure efficiency is particularly pronounced for emerging market economies where public resources are normally insufficient. When services are publicly provided, performance measurement becomes an inevitable management tool because when inefficiency continues, the constituents of that inefficient unit suffer. The government needs benchmarking tools to provide incentives to good performing sectors and to induce inefficient sectors to perform better. However, the focus of the article is not on how to cut (public) expenditures, but rather more on investigating potential reserves to increase the value for money of public spending, i.e. how to make the most of limited public (and private) resources2.
The article is organized as follows. In the next section we present a brief literature review of measuring public education expenditure efficiency. Section 3 shows a theoretical background of non-‐parametric methodologies
1 In this paper, the group of Eastern Europe (EE) consists of Bulgaria, Cyprus, Czech R., Estonia, Hungary, Latvia, Lithuania, Poland, Romania, Slovakia and Slovenia. 2 Note, however, that it is not only public expenditure but also tax regulatory policies that affect the efficiency of the public sector. While expenditure is a relatively good proxy of the tax burden, we ignore the composition of tax revenue and other characteristics of tax system.
Relative Efficiency of Education Expenditures in Eastern Europe: A Non-‐parametric Approach
88
Vol. III, Issue 3 June 2013
with special focus on Data Envelopment Analysis (DEA) and the specifications of the models. Section 4 outlines the results of the non-‐parametric efficiency analysis of education sector. The final section provides concluding remarks.
A brief literature review
Previous studies on the performance and efficiency of the public sector (at national level) that applied non-‐parametric methods find significant divergence of efficiency across countries. Studies include notably Fakin and Crombrugghe [1] for the public sector, Gupta and Verhoeven [2] for education and health in Africa, Clements [3] for education in Europe, St. Aubyn [4] for education spending in the OECD, Afonso et al. [5], [6] for public sector performance expenditure in the OECD and in emerging markets, Afonso and St. Aubyn [7], [8], [9] for efficiency in providing health and education in OECD countries. De Borger and Kerstens [10], and Afonso and Fernandes [11] find evidence of spending inefficiencies for the local government sector. Additionally, Afonso et al. [12] assess the efficiency of public spending in redistributing income. Most studies apply the Data Envelopment Analysis (DEA) method while Afonso and St. Aubyn [8] undertook a two-‐step DEA/Tobit analysis, in the context of a cross-‐country analysis of secondary education efficiency.
Other authors (e.g. Mandl et al. [13]; Jafarov and Gunnarsson [14]) have tried to improve on the work by Afonso et al. [5]. The country-‐clusters resulted are very similar. Southern European countries present low general and educational performance, the EE countries show low general performance but high educational one, and the Northern European and Anglo-‐Saxon countries with high scores in both items (although the differences among countries in the educational performance are high; e.g. Luxembourg with a high macroeconomic score but fairly poor results for the effectiveness of its education system). Additionally, a number of studies examine technical efficiency in education (see also Castano and Cabanda [15]; Grosskopf and Mourtray [16]; Johnes [17], [18]; Johnes and Johnes [19]; Ng and Li [20]; Cherchye et al. [21]).
Relative Efficiency of Education Expenditures in Eastern Europe: A Non-‐parametric Approach
89
Vol. III, Issue 3 June 2013
Non-‐parametric methodology for assessing efficiency in public sector
A common approach to measure efficiency is based on the concept of efficiency frontier (productivity possibility frontier). There are multiple techniques to calculate or estimate the shape of the efficiency frontier. Most investigations aimed at measuring efficiency are based either on parametric or non-‐parametric methods. The main difference between the parametric and the non-‐parametric approach is that parametric frontier functions require the ex-‐ante definition of the functional form of the efficiency frontier. While a parametric approach assumes a specific functional form for the relationship between input and output, a non-‐parametric approach constructs an efficiency frontier using input/output data for the whole sample following a mathematical programming method 3 . A calculated frontier provides a benchmark by which the efficiency performance can be judged. This technique is therefore primary data-‐driven. Among the different non-‐parametric methods the Free Disposal Hull (FDH) technique imposes the fewest restrictions4. It follows a stepwise approach to construct the efficiency frontier. Along this production possibility frontier one can observe the highest possible level of output/outcome for a given level of input. Conversely, it is possible to determine the lowest level of input necessary to attain a given level of output/outcome. This allows identifying inefficient producers both in terms of input efficiency and in terms of output/outcome efficiency (Afonso et al. [5]).
An alternative non-‐parametric technique that has recently started to be commonly applied to (public) expenditure analysis is Data Envelopment Analysis (DEA)5. DEA is a non-‐parametric frontier estimation methodology originally introduced by Charnes, Cooper, and Rhodes in 1978 that compares functionally similar entities described by a common set of multiple numerical attributes. DEA classifies the entities into “efficient” or “performers” versus “inefficient” or “non-‐performers.” According to DEA framework, the inefficiencies are the degrees of deviance from the frontier. Input inefficiencies show the degree to which inputs must be reduced for
3 For an overview of non-‐parametric techniques see Simar and Wilson [22] 4 FDH analysis was first proposed by Deprins et al. [23] 5 DEA analysis, originating from Farrell’s [24] seminal work was originally developed and applied to firms that convert inputs into outputs (see Coelli et al. [25] for a number of applications).
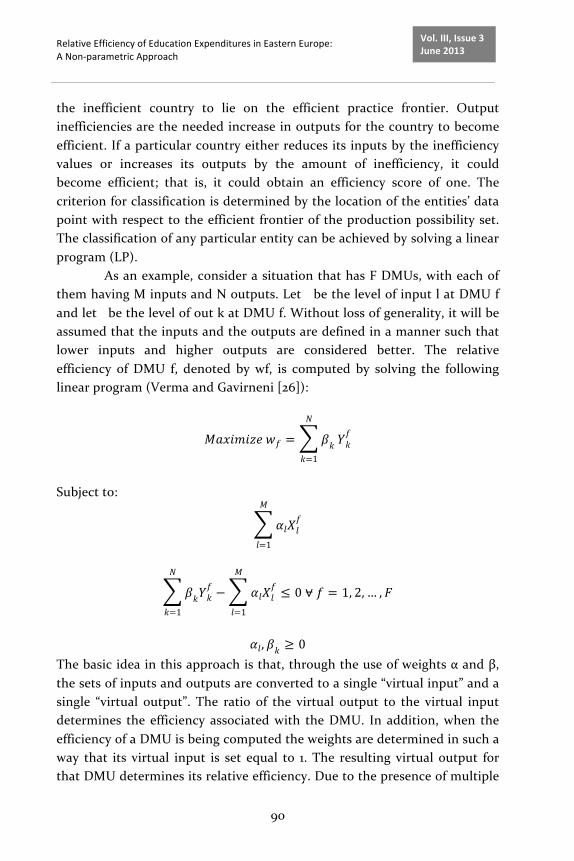
Relative Efficiency of Education Expenditures in Eastern Europe: A Non-‐parametric Approach
90
Vol. III, Issue 3 June 2013
the inefficient country to lie on the efficient practice frontier. Output inefficiencies are the needed increase in outputs for the country to become efficient. If a particular country either reduces its inputs by the inefficiency values or increases its outputs by the amount of inefficiency, it could become efficient; that is, it could obtain an efficiency score of one. The criterion for classification is determined by the location of the entities’ data point with respect to the efficient frontier of the production possibility set. The classification of any particular entity can be achieved by solving a linear program (LP).
As an example, consider a situation that has F DMUs, with each of them having M inputs and N outputs. Let be the level of input l at DMU f and let be the level of out k at DMU f. Without loss of generality, it will be assumed that the inputs and the outputs are defined in a manner such that lower inputs and higher outputs are considered better. The relative efficiency of DMU f, denoted by wf, is computed by solving the following linear program (Verma and Gavirneni [26]):
𝑀𝑎𝑥𝑖𝑚𝑖𝑧𝑒 𝑤𝑓 = 𝛽𝑘
𝑁
𝑘=1
𝑌𝑘𝑓
Subject to:
𝛼𝑙𝑋𝑙𝑓
𝑀
𝑙=1
𝛽𝑘𝑌𝑘𝑓 − 𝛼𝑙𝑋𝑙
𝑓𝑀
𝑙=1
𝑁
𝑘=1
≤ 0 ⩝ 𝑓 = 1, 2,… , 𝐹
𝛼𝑙, 𝛽𝑘 ≥ 0
The basic idea in this approach is that, through the use of weights α and β, the sets of inputs and outputs are converted to a single “virtual input” and a single “virtual output”. The ratio of the virtual output to the virtual input determines the efficiency associated with the DMU. In addition, when the efficiency of a DMU is being computed the weights are determined in such a way that its virtual input is set equal to 1. The resulting virtual output for that DMU determines its relative efficiency. Due to the presence of multiple
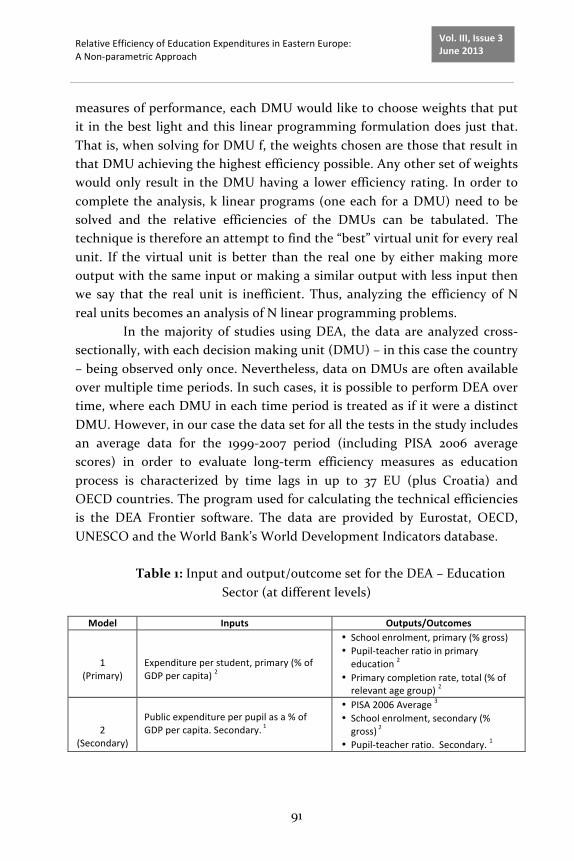
Relative Efficiency of Education Expenditures in Eastern Europe: A Non-‐parametric Approach
91
Vol. III, Issue 3 June 2013
measures of performance, each DMU would like to choose weights that put it in the best light and this linear programming formulation does just that. That is, when solving for DMU f, the weights chosen are those that result in that DMU achieving the highest efficiency possible. Any other set of weights would only result in the DMU having a lower efficiency rating. In order to complete the analysis, k linear programs (one each for a DMU) need to be solved and the relative efficiencies of the DMUs can be tabulated. The technique is therefore an attempt to find the “best” virtual unit for every real unit. If the virtual unit is better than the real one by either making more output with the same input or making a similar output with less input then we say that the real unit is inefficient. Thus, analyzing the efficiency of N real units becomes an analysis of N linear programming problems.
In the majority of studies using DEA, the data are analyzed cross-‐sectionally, with each decision making unit (DMU) – in this case the country – being observed only once. Nevertheless, data on DMUs are often available over multiple time periods. In such cases, it is possible to perform DEA over time, where each DMU in each time period is treated as if it were a distinct DMU. However, in our case the data set for all the tests in the study includes an average data for the 1999-‐2007 period (including PISA 2006 average scores) in order to evaluate long-‐term efficiency measures as education process is characterized by time lags in up to 37 EU (plus Croatia) and OECD countries. The program used for calculating the technical efficiencies is the DEA Frontier software. The data are provided by Eurostat, OECD, UNESCO and the World Bank’s World Development Indicators database.
Table 1: Input and output/outcome set for the DEA – Education
Sector (at different levels)
Model Inputs Outputs/Outcomes
1
(Primary)
Expenditure per student, primary (% of GDP per capita) 2
• School enrolment, primary (% gross) • Pupil-‐teacher ratio in primary education 2
• Primary completion rate, total (% of relevant age group) 2
2
(Secondary)
Public expenditure per pupil as a % of GDP per capita. Secondary. 1
• PISA 2006 Average 3 • School enrolment, secondary (% gross) 2
• Pupil-‐teacher ratio. Secondary. 1
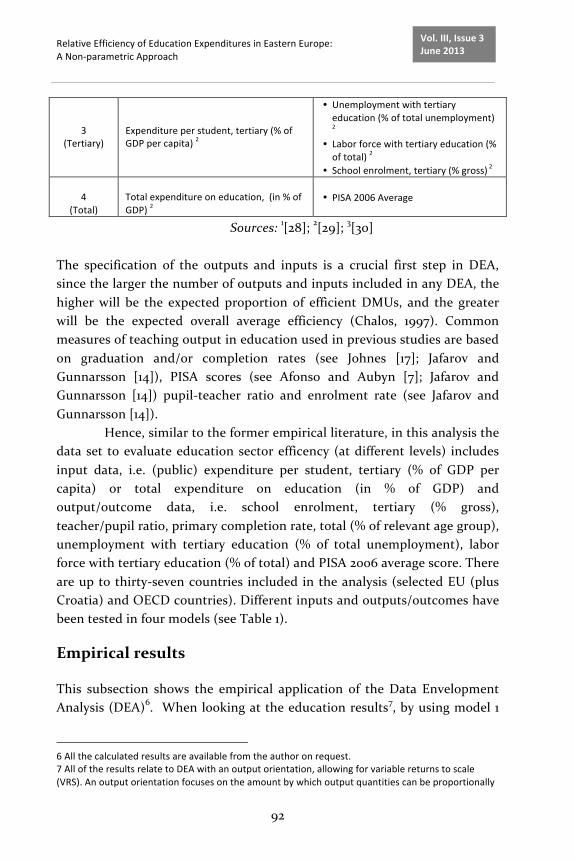
Relative Efficiency of Education Expenditures in Eastern Europe: A Non-‐parametric Approach
92
Vol. III, Issue 3 June 2013
3
(Tertiary)
Expenditure per student, tertiary (% of GDP per capita) 2
• Unemployment with tertiary education (% of total unemployment) 2
• Labor force with tertiary education (% of total) 2
• School enrolment, tertiary (% gross) 2 4
(Total)
Total expenditure on education, (in % of GDP) 2
• PISA 2006 Average
Sources: 1[28]; 2[29]; 3[30] The specification of the outputs and inputs is a crucial first step in DEA, since the larger the number of outputs and inputs included in any DEA, the higher will be the expected proportion of efficient DMUs, and the greater will be the expected overall average efficiency (Chalos, 1997). Common measures of teaching output in education used in previous studies are based on graduation and/or completion rates (see Johnes [17]; Jafarov and Gunnarsson [14]), PISA scores (see Afonso and Aubyn [7]; Jafarov and Gunnarsson [14]) pupil-‐teacher ratio and enrolment rate (see Jafarov and Gunnarsson [14]).
Hence, similar to the former empirical literature, in this analysis the data set to evaluate education sector efficency (at different levels) includes input data, i.e. (public) expenditure per student, tertiary (% of GDP per capita) or total expenditure on education (in % of GDP) and output/outcome data, i.e. school enrolment, tertiary (% gross), teacher/pupil ratio, primary completion rate, total (% of relevant age group), unemployment with tertiary education (% of total unemployment), labor force with tertiary education (% of total) and PISA 2006 average score. There are up to thirty-‐seven countries included in the analysis (selected EU (plus Croatia) and OECD countries). Different inputs and outputs/outcomes have been tested in four models (see Table 1).
Empirical results
This subsection shows the empirical application of the Data Envelopment Analysis (DEA)6. When looking at the education results7, by using model 1
6 All the calculated results are available from the author on request. 7 All of the results relate to DEA with an output orientation, allowing for variable returns to scale (VRS). An output orientation focuses on the amount by which output quantities can be proportionally
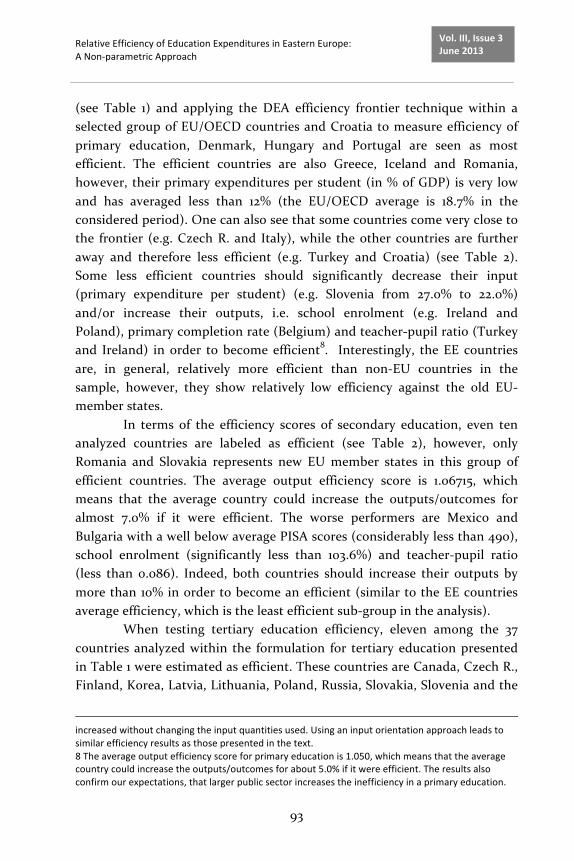
Relative Efficiency of Education Expenditures in Eastern Europe: A Non-‐parametric Approach
93
Vol. III, Issue 3 June 2013
(see Table 1) and applying the DEA efficiency frontier technique within a selected group of EU/OECD countries and Croatia to measure efficiency of primary education, Denmark, Hungary and Portugal are seen as most efficient. The efficient countries are also Greece, Iceland and Romania, however, their primary expenditures per student (in % of GDP) is very low and has averaged less than 12% (the EU/OECD average is 18.7% in the considered period). One can also see that some countries come very close to the frontier (e.g. Czech R. and Italy), while the other countries are further away and therefore less efficient (e.g. Turkey and Croatia) (see Table 2). Some less efficient countries should significantly decrease their input (primary expenditure per student) (e.g. Slovenia from 27.0% to 22.0%) and/or increase their outputs, i.e. school enrolment (e.g. Ireland and Poland), primary completion rate (Belgium) and teacher-‐pupil ratio (Turkey and Ireland) in order to become efficient8. Interestingly, the EE countries are, in general, relatively more efficient than non-‐EU countries in the sample, however, they show relatively low efficiency against the old EU-‐member states.
In terms of the efficiency scores of secondary education, even ten analyzed countries are labeled as efficient (see Table 2), however, only Romania and Slovakia represents new EU member states in this group of efficient countries. The average output efficiency score is 1.06715, which means that the average country could increase the outputs/outcomes for almost 7.0% if it were efficient. The worse performers are Mexico and Bulgaria with a well below average PISA scores (considerably less than 490), school enrolment (significantly less than 103.6%) and teacher-‐pupil ratio (less than 0.086). Indeed, both countries should increase their outputs by more than 10% in order to become an efficient (similar to the EE countries average efficiency, which is the least efficient sub-‐group in the analysis).
When testing tertiary education efficiency, eleven among the 37 countries analyzed within the formulation for tertiary education presented in Table 1 were estimated as efficient. These countries are Canada, Czech R., Finland, Korea, Latvia, Lithuania, Poland, Russia, Slovakia, Slovenia and the
increased without changing the input quantities used. Using an input orientation approach leads to similar efficiency results as those presented in the text. 8 The average output efficiency score for primary education is 1.050, which means that the average country could increase the outputs/outcomes for about 5.0% if it were efficient. The results also confirm our expectations, that larger public sector increases the inefficiency in a primary education.
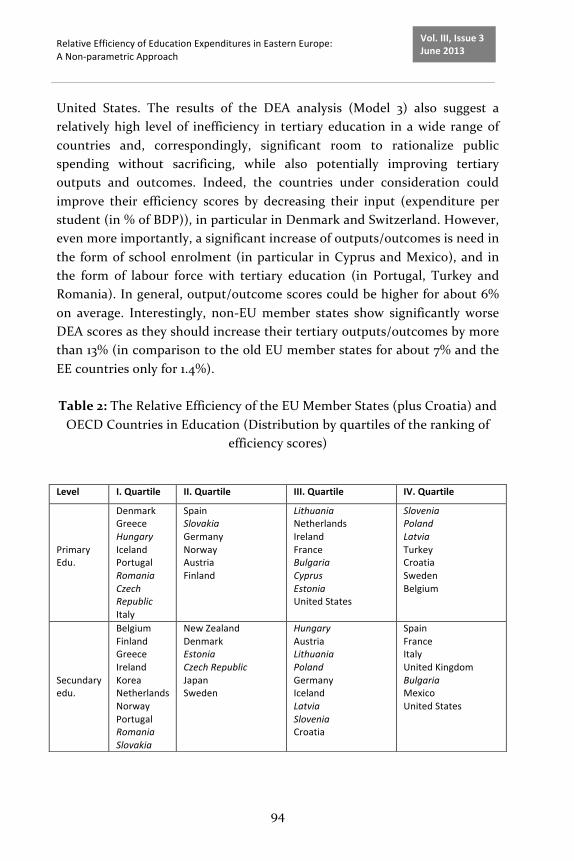
Relative Efficiency of Education Expenditures in Eastern Europe: A Non-‐parametric Approach
94
Vol. III, Issue 3 June 2013
United States. The results of the DEA analysis (Model 3) also suggest a relatively high level of inefficiency in tertiary education in a wide range of countries and, correspondingly, significant room to rationalize public spending without sacrificing, while also potentially improving tertiary outputs and outcomes. Indeed, the countries under consideration could improve their efficiency scores by decreasing their input (expenditure per student (in % of BDP)), in particular in Denmark and Switzerland. However, even more importantly, a significant increase of outputs/outcomes is need in the form of school enrolment (in particular in Cyprus and Mexico), and in the form of labour force with tertiary education (in Portugal, Turkey and Romania). In general, output/outcome scores could be higher for about 6% on average. Interestingly, non-‐EU member states show significantly worse DEA scores as they should increase their tertiary outputs/outcomes by more than 13% (in comparison to the old EU member states for about 7% and the EE countries only for 1.4%).
Table 2: The Relative Efficiency of the EU Member States (plus Croatia) and OECD Countries in Education (Distribution by quartiles of the ranking of
efficiency scores)
Level I. Quartile II. Quartile III. Quartile IV. Quartile
Primary Edu.
Denmark Greece Hungary Iceland Portugal Romania Czech Republic Italy
Spain Slovakia Germany Norway Austria Finland
Lithuania Netherlands Ireland France Bulgaria Cyprus Estonia United States
Slovenia Poland Latvia Turkey Croatia Sweden Belgium
Secundary edu.
Belgium Finland Greece Ireland Korea Netherlands Norway Portugal Romania Slovakia
New Zealand Denmark Estonia Czech Republic Japan Sweden
Hungary Austria Lithuania Poland Germany Iceland Latvia Slovenia Croatia
Spain France Italy United Kingdom Bulgaria Mexico United States
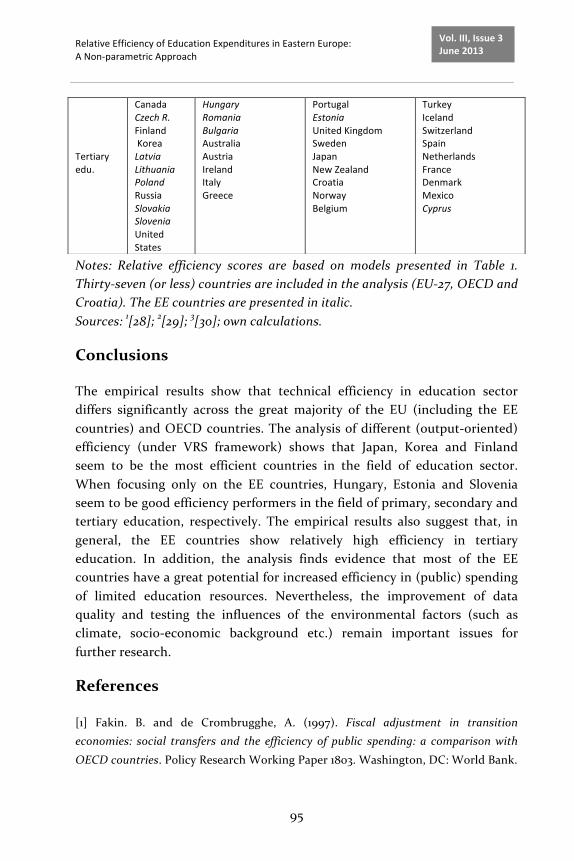
Relative Efficiency of Education Expenditures in Eastern Europe: A Non-‐parametric Approach
95
Vol. III, Issue 3 June 2013
Notes: Relative efficiency scores are based on models presented in Table 1. Thirty-‐seven (or less) countries are included in the analysis (EU-‐27, OECD and Croatia). The EE countries are presented in italic. Sources: 1[28]; 2[29]; 3[30]; own calculations.
Conclusions
The empirical results show that technical efficiency in education sector differs significantly across the great majority of the EU (including the EE countries) and OECD countries. The analysis of different (output-‐oriented) efficiency (under VRS framework) shows that Japan, Korea and Finland seem to be the most efficient countries in the field of education sector. When focusing only on the EE countries, Hungary, Estonia and Slovenia seem to be good efficiency performers in the field of primary, secondary and tertiary education, respectively. The empirical results also suggest that, in general, the EE countries show relatively high efficiency in tertiary education. In addition, the analysis finds evidence that most of the EE countries have a great potential for increased efficiency in (public) spending of limited education resources. Nevertheless, the improvement of data quality and testing the influences of the environmental factors (such as climate, socio-‐economic background etc.) remain important issues for further research.
References
[1] Fakin. B. and de Crombrugghe, A. (1997). Fiscal adjustment in transition economies: social transfers and the efficiency of public spending: a comparison with
OECD countries. Policy Research Working Paper 1803. Washington, DC: World Bank.
Tertiary edu.
Canada Czech R. Finland Korea Latvia Lithuania Poland Russia Slovakia Slovenia United States
Hungary Romania Bulgaria Australia Austria Ireland Italy Greece
Portugal Estonia United Kingdom Sweden Japan New Zealand Croatia Norway Belgium
Turkey Iceland Switzerland Spain Netherlands France Denmark Mexico Cyprus
Relative Efficiency of Education Expenditures in Eastern Europe: A Non-‐parametric Approach
96
Vol. III, Issue 3 June 2013
[2] Gupta, S. and Verhoeven, M. (2001). The efficiency of government expenditure Experiences from Africa. Journal of Policy Modelling, 23, 433-‐467.
[3] Clements, B. (2002). How Efficient is Education Spending in Europe? European Review of Economics and Finance, 1, 3-‐26. [4] St. Aubyn, M. (2003). Evaluating Efficiency in the Portuguese Education Sector.
Economia, 26, 25-‐51. [5] Afonso, A., Schuknecht L. and Tanzi, V. (2005). Public Sector Efficiency: An International Comparison. Public Choice, 123 (3-‐4), 321-‐347.
[6] Afonso, A., Schuknecht L. and V. Tanzi (2006). Public Sector Efficiency: Evidence for New EU Member States and Emerging Markets, European Central Bank, Working Paper Series 581, European Central Bank: Frankfurt.
[7] Afonso, A. and St. Aubyn (2005). Non-‐parametric Approaches to Education and Health Efficiency in OECD Countries. Journal of Applied Economics, 8 (2), 227-‐246. [8] Afonso, A. and St. Aubyn (2006a). Cross-‐country Efficiency of Secondary
Education Provision: a Semi-‐parametric Analysis with Non-‐discretionary Inputs. Economic Modelling, 23 (3), 476-‐491. [9] Afonso, A. and St. Aubyn (2006b). Relative Efficiency of Health Provision: a DEA
Approach with Non-‐discretionary Inputs. ISEG-‐UTL, Department of Economics Working Paper nº 33/2006/DE/UECE. [10] De Borger, B. and Kerstens, K. (1996). Cost efficiency of Belgian local
governments: A comparative analysis of FDH, DEA, and econometric approaches. Regional Science and Urban Economics, 26, 145-‐170. [11] Afonso, A. and Fernandes, S. (2008). Assessing and Explaining the Relative
Efficiency of Local Government (October 01, 2008). Journal of Socio-‐Economics, Vol. 37, No. 5, pp. 1946-‐1979. [12] Afonso, A., Schuknecht L. and V. Tanzi (2008). Income distribution determinants
and public spending efficiency. Working Paper Series 861, European Central Bank: Frankfurt. [13] Mandl, U., Dierx A. and F. Ilzkovitz (2008). The effectiveness and efficiency of
public spending. European Commission, Economic Papers 31, Februar. [14] Jafarov, E. and Gunnarsson, V. (2008). Government Spending on Health Care and Education in Croatia: Efficiency and Reform Options; International Monetary Fund;
IMF Working Paper; WP/08/136. [15] Castano MC, Cabanda E (2007). Performance evaluation of the efficiency of Philippine Private Higher Educational Institutions: application of frontier approaches.
Int Trans Oper Res, 14, 431-‐444.
Relative Efficiency of Education Expenditures in Eastern Europe: A Non-‐parametric Approach
97
Vol. III, Issue 3 June 2013
[16] Grosskopf, S. and Mourtray, C. (2001). Evaluating performance in Chicago public high schools in the wake of decentralization. Econ. Educ. Rev., 20:1–14.
[17] Johnes, J. (1996). Performance assessment in higher education in Britain. Eur. J. Oper. Res., 89:18-‐33. [18] Johnes, J. (2006). Data envelopment analysis and its application to the
measurement of efficiency in higher education. Economics of Education Review, 25 (3), 273-‐288. [19] Johnes, J. and Johnes, G. (1995). Research funding and performance in U.K.
university departments of economics: a frontier analysis. Econ Educ Rev, 14:301-‐314. [20] Ng YC, Li, SK (2000). Measuring the research performance of Chinese higher education institutions: an application of data envelopment analysis. Educ Econ, 8:2-‐
139. [21] Cherchye, L., De Witte, K., Ooghe E. and I. Nicaise (2010). Efficiency and equity in private and public education: nonparametric comparison. European Journal of
Operational Research, 202 (2), 563-‐573. [22] Simar, L. and P. Wilson (2003). Efficiency analysis: the statistical approach, lecture notes.
[23] Deprins, D., Simar L. and Tulkens, H. (1984). Measuring labor-‐efficiency in post offices; in: Marchand, M.; Pestieau, P. and Tulkens, H. (Eds.), The performance of public enterprises: concepts and measurement. Amsterdam: North-‐Holland.
[24] Farrell, M. (1957). The Measurement of Productive Efficiency. Journal of the Royal Statistical Society Series A (General), 120 (3), 253-‐281. [25] Coelli T., Rao, D. and Battese, G. (2002). An Introduction to Efficiency and
Productivity Analysis. 6th edition, Massachusetts, Kluwer Academic Publishers. [26] Verma, A. and Gavirneni, S. (2006). Measuring police efficiency in India: an application of data envelopment analysis. Policing: An International Journal of Police
Strategies & Management, 29(1), pp. 125-‐145 [27] Chalos, P. (1997). An Examination of Budgetary Inefficiency in Education Using Data Envelopment Analysis. Financial Accountability & Management, 13 (1), 55–69.
[28] UNESCO: Data Centre, Montreal: UNESCO Institute for Statistics, On-‐line. 2011. [29] World Bank: World Development Indicators, On-‐line, 2011. [30] OECD: Statistics Data Base, Paris, On-‐line, 2011.

Features of Accounting and Tax Treatments Applicable to Intangible Assets of the Research and Development Activities Nature in the Spirit of National Regulations
98
Vol. III, Issue 3 June 2013
Features of Accounting and Tax Treatments
Applicable to Intangible Assets of the
Research and Development Activities Nature
in the Spirit of National Regulations
Author: Traian Calota, Faculty of Economic Sciences, University
Titu Maiorescu Bucharest, Senior Expert Infofisc, Romania,
The XXIst
century shows, among others, a special feature aiming at
acceleration at a growing speed of the developments of new technologies.
Thus, in the context of a fierce competition, great intellectual and financial
efforts are made for the research and development of high technologies.
Therefore, both at microeconomic and macroeconomic level, it is frequently
brought into attention the problem of a correct approach in terms of legal
provisions of the accounting and tax treatments for expenses incurred for this
purpose. Also, there is a growing need for improvement of the related legal
framework, so that research and development should contribute to the
economic growth.
Keywords: research-development; accounting treatments; eligible expenses;
accounting performance; tax treatments; tax incentives.
JEL CLASSIFICATION: H32 – Firm; K34 - Tax Law; M41 – Accounting; M48 -
Government Policy and Regulation.
Introduction
In Romania, intangible assets are regulated by Order no. 3055/2009 of the
Minister of Public Finance, which in section 72 first paragraph of Annex 1
6
Features of Accounting and Tax Treatments Applicable to Intangible Assets of the Research and Development Activities Nature in the Spirit of National Regulations
99
Vol. III, Issue 3 June 2013
states that an intangible asset is an identifiable, non-monetary, immaterial
asset, being held for use in the production or supply of goods or services, in
order to be rented to third parties or for administrative purposes. Also, in
section 72 second paragraph of the same order, it is established that an
intangible asset meets the criteria to be identifiable when it is separable, i.e.
it may be separated or divided from the entity and sold, transferred,
authorized, rented or exchanged, either individually or along with an
adequate contract, an identifiable asset or an identifiable debt. Furthermore,
this criterion is met in case such intangible asset arises from contractual or
other legal nature rights, whether those rights are transferable or separable
from the entity or from other rights and obligations.
Recognition of these assets in the balance sheet is made under
certain conditions. Thus, according to section 73 first paragraph of Annex 1
of Order 3055/2009, an intangible asset should be recorded in the balance
sheet if it is expected to generate economic benefits to the entity and its cost
can be measured reliably.
Intangible assets also include development expenses, but they are,
in fact, determined by applying the findings of research activities which, in
turn, involve making expenses recorded only in the profit and loss account.
Therefore, we can say that the binominal research-development is a tool of
internal intangible assets generation. Jefrrey A. Cohen shares the same
opinion, stating that “such research and development expenses have been
subject to numerous academic efforts." The same author also states that
"there is a significant impact on cost- benefit ratios when research-
development expenses incurred are adjusted to the value of capital shares"
(Cohen, 2008, pp. 66). Other authors (Gherghina, 2006; Văduva, Gherghina,
Duca, 2009) show, in their research, the importance of increasing research-
development expenses, in order to use them for the development of the
company.
Below, we show the application to these expenses, of accounting
and tax treatments, showing certain features that must be in the attention of
those who manage them.
(I) The specific character of the accounting treatment
applicable to research-development expenses
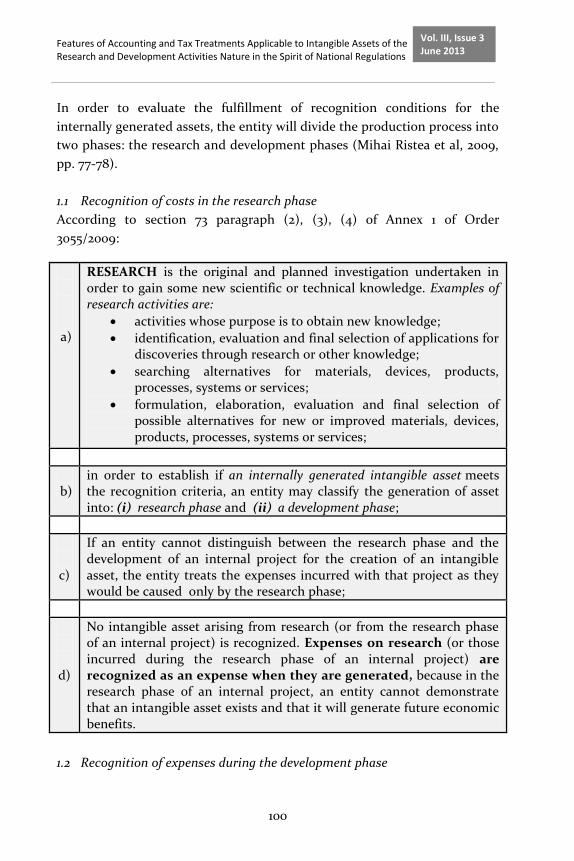
Features of Accounting and Tax Treatments Applicable to Intangible Assets of the Research and Development Activities Nature in the Spirit of National Regulations
100
Vol. III, Issue 3 June 2013
In order to evaluate the fulfillment of recognition conditions for the
internally generated assets, the entity will divide the production process into
two phases: the research and development phases (Mihai Ristea et al, 2009,
pp. 77-78).
1.1 Recognition of costs in the research phase
According to section 73 paragraph (2), (3), (4) of Annex 1 of Order
3055/2009:
a)
RESEARCH is the original and planned investigation undertaken in order to gain some new scientific or technical knowledge. Examples of research activities are:
activities whose purpose is to obtain new knowledge;
identification, evaluation and final selection of applications for discoveries through research or other knowledge;
searching alternatives for materials, devices, products, processes, systems or services;
formulation, elaboration, evaluation and final selection of possible alternatives for new or improved materials, devices, products, processes, systems or services;
b)
in order to establish if an internally generated intangible asset meets the recognition criteria, an entity may classify the generation of asset into: (i) research phase and (ii) a development phase;
c)
If an entity cannot distinguish between the research phase and the development of an internal project for the creation of an intangible asset, the entity treats the expenses incurred with that project as they would be caused only by the research phase;
d)
No intangible asset arising from research (or from the research phase of an internal project) is recognized. Expenses on research (or those incurred during the research phase of an internal project) are recognized as an expense when they are generated, because in the research phase of an internal project, an entity cannot demonstrate that an intangible asset exists and that it will generate future economic benefits.
1.2 Recognition of expenses during the development phase
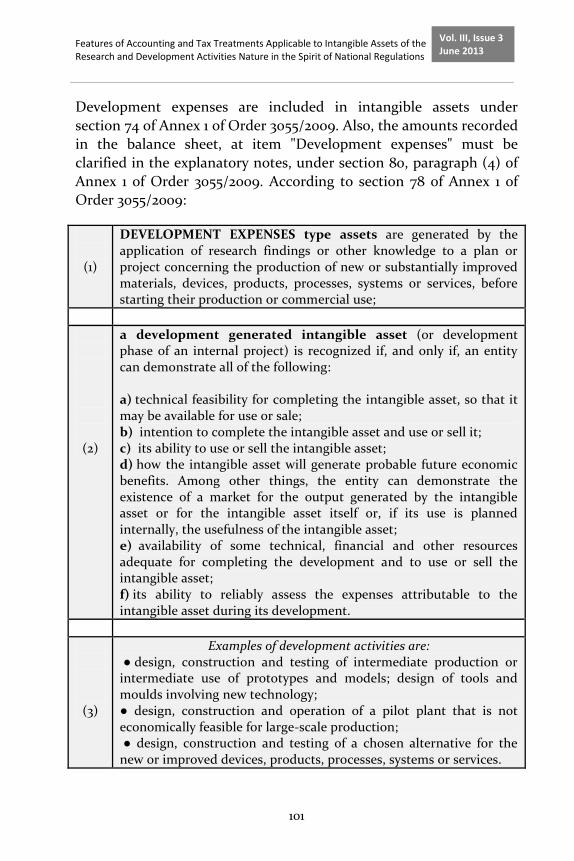
Features of Accounting and Tax Treatments Applicable to Intangible Assets of the Research and Development Activities Nature in the Spirit of National Regulations
101
Vol. III, Issue 3 June 2013
Development expenses are included in intangible assets under
section 74 of Annex 1 of Order 3055/2009. Also, the amounts recorded
in the balance sheet, at item "Development expenses" must be
clarified in the explanatory notes, under section 80, paragraph (4) of
Annex 1 of Order 3055/2009. According to section 78 of Annex 1 of
Order 3055/2009:
(1)
DEVELOPMENT EXPENSES type assets are generated by the application of research findings or other knowledge to a plan or project concerning the production of new or substantially improved materials, devices, products, processes, systems or services, before starting their production or commercial use;
(2)
a development generated intangible asset (or development phase of an internal project) is recognized if, and only if, an entity can demonstrate all of the following: a) technical feasibility for completing the intangible asset, so that it may be available for use or sale; b) intention to complete the intangible asset and use or sell it; c) its ability to use or sell the intangible asset; d) how the intangible asset will generate probable future economic benefits. Among other things, the entity can demonstrate the existence of a market for the output generated by the intangible asset or for the intangible asset itself or, if its use is planned internally, the usefulness of the intangible asset; e) availability of some technical, financial and other resources adequate for completing the development and to use or sell the intangible asset; f) its ability to reliably assess the expenses attributable to the intangible asset during its development.
(3)
Examples of development activities are: ● design, construction and testing of intermediate production or intermediate use of prototypes and models; design of tools and moulds involving new technology; ● design, construction and operation of a pilot plant that is not economically feasible for large-scale production; ● design, construction and testing of a chosen alternative for the new or improved devices, products, processes, systems or services.
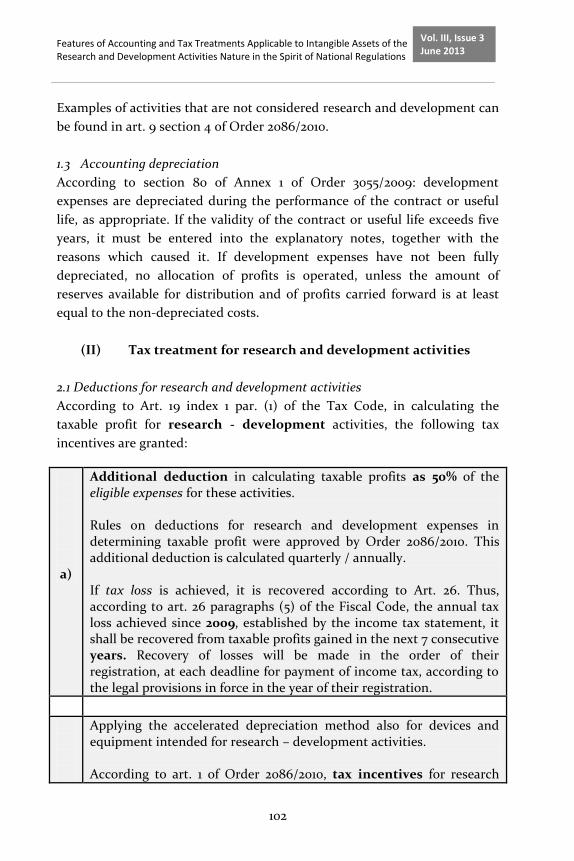
Features of Accounting and Tax Treatments Applicable to Intangible Assets of the Research and Development Activities Nature in the Spirit of National Regulations
102
Vol. III, Issue 3 June 2013
Examples of activities that are not considered research and development can
be found in art. 9 section 4 of Order 2086/2010.
1.3 Accounting depreciation
According to section 80 of Annex 1 of Order 3055/2009: development
expenses are depreciated during the performance of the contract or useful
life, as appropriate. If the validity of the contract or useful life exceeds five
years, it must be entered into the explanatory notes, together with the
reasons which caused it. If development expenses have not been fully
depreciated, no allocation of profits is operated, unless the amount of
reserves available for distribution and of profits carried forward is at least
equal to the non-depreciated costs.
(II) Tax treatment for research and development activities
2.1 Deductions for research and development activities
According to Art. 19 index 1 par. (1) of the Tax Code, in calculating the
taxable profit for research - development activities, the following tax
incentives are granted:
a)
Additional deduction in calculating taxable profits as 50% of the eligible expenses for these activities. Rules on deductions for research and development expenses in determining taxable profit were approved by Order 2086/2010. This additional deduction is calculated quarterly / annually. If tax loss is achieved, it is recovered according to Art. 26. Thus, according to art. 26 paragraphs (5) of the Fiscal Code, the annual tax loss achieved since 2009, established by the income tax statement, it shall be recovered from taxable profits gained in the next 7 consecutive years. Recovery of losses will be made in the order of their registration, at each deadline for payment of income tax, according to the legal provisions in force in the year of their registration.
Applying the accelerated depreciation method also for devices and equipment intended for research – development activities. According to art. 1 of Order 2086/2010, tax incentives for research
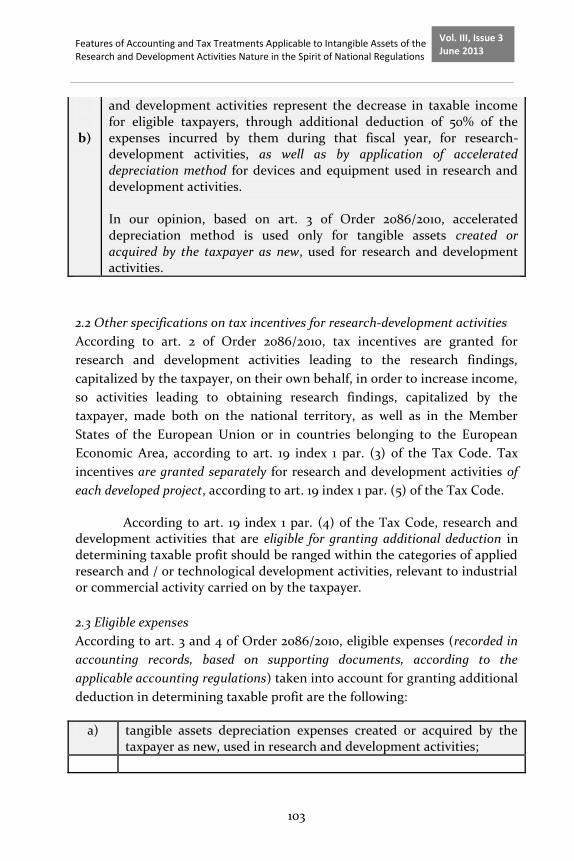
Features of Accounting and Tax Treatments Applicable to Intangible Assets of the Research and Development Activities Nature in the Spirit of National Regulations
103
Vol. III, Issue 3 June 2013
b)
and development activities represent the decrease in taxable income for eligible taxpayers, through additional deduction of 50% of the expenses incurred by them during that fiscal year, for research- development activities, as well as by application of accelerated depreciation method for devices and equipment used in research and development activities. In our opinion, based on art. 3 of Order 2086/2010, accelerated depreciation method is used only for tangible assets created or acquired by the taxpayer as new, used for research and development activities.
2.2 Other specifications on tax incentives for research-development activities
According to art. 2 of Order 2086/2010, tax incentives are granted for
research and development activities leading to the research findings,
capitalized by the taxpayer, on their own behalf, in order to increase income,
so activities leading to obtaining research findings, capitalized by the
taxpayer, made both on the national territory, as well as in the Member
States of the European Union or in countries belonging to the European
Economic Area, according to art. 19 index 1 par. (3) of the Tax Code. Tax
incentives are granted separately for research and development activities of
each developed project, according to art. 19 index 1 par. (5) of the Tax Code.
According to art. 19 index 1 par. (4) of the Tax Code, research and development activities that are eligible for granting additional deduction in determining taxable profit should be ranged within the categories of applied research and / or technological development activities, relevant to industrial or commercial activity carried on by the taxpayer.
2.3 Eligible expenses
According to art. 3 and 4 of Order 2086/2010, eligible expenses (recorded in
accounting records, based on supporting documents, according to the
applicable accounting regulations) taken into account for granting additional
deduction in determining taxable profit are the following:
a) tangible assets depreciation expenses created or acquired by the taxpayer as new, used in research and development activities;
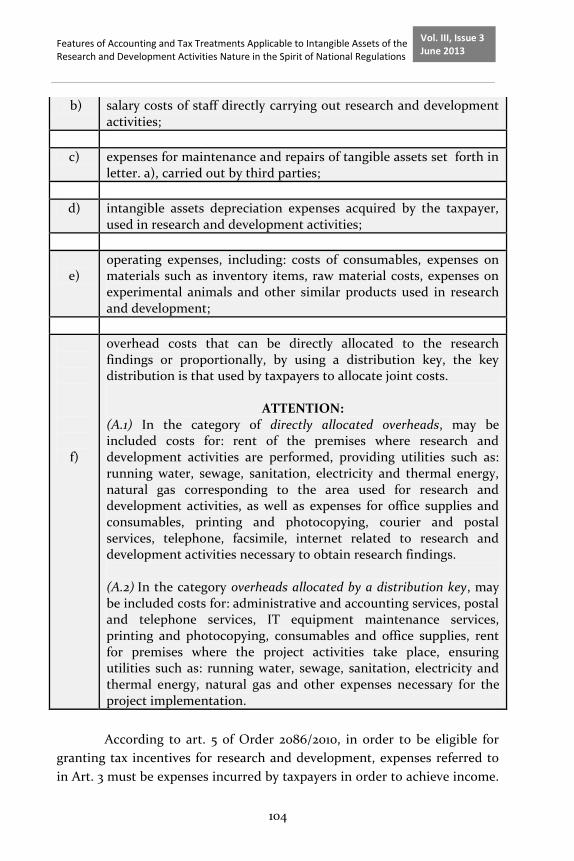
Features of Accounting and Tax Treatments Applicable to Intangible Assets of the Research and Development Activities Nature in the Spirit of National Regulations
104
Vol. III, Issue 3 June 2013
b) salary costs of staff directly carrying out research and development activities;
c) expenses for maintenance and repairs of tangible assets set forth in letter. a), carried out by third parties;
d) intangible assets depreciation expenses acquired by the taxpayer, used in research and development activities;
e)
operating expenses, including: costs of consumables, expenses on materials such as inventory items, raw material costs, expenses on experimental animals and other similar products used in research and development;
f)
overhead costs that can be directly allocated to the research findings or proportionally, by using a distribution key, the key distribution is that used by taxpayers to allocate joint costs.
ATTENTION:
(A.1) In the category of directly allocated overheads, may be included costs for: rent of the premises where research and development activities are performed, providing utilities such as: running water, sewage, sanitation, electricity and thermal energy, natural gas corresponding to the area used for research and development activities, as well as expenses for office supplies and consumables, printing and photocopying, courier and postal services, telephone, facsimile, internet related to research and development activities necessary to obtain research findings. (A.2) In the category overheads allocated by a distribution key, may be included costs for: administrative and accounting services, postal and telephone services, IT equipment maintenance services, printing and photocopying, consumables and office supplies, rent for premises where the project activities take place, ensuring utilities such as: running water, sewage, sanitation, electricity and thermal energy, natural gas and other expenses necessary for the project implementation.
According to art. 5 of Order 2086/2010, in order to be eligible for
granting tax incentives for research and development, expenses referred to
in Art. 3 must be expenses incurred by taxpayers in order to achieve income.
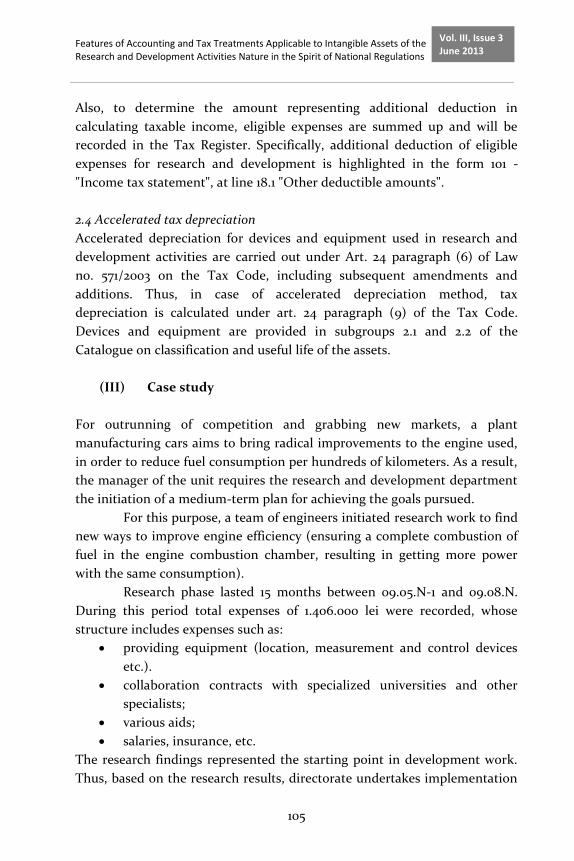
Features of Accounting and Tax Treatments Applicable to Intangible Assets of the Research and Development Activities Nature in the Spirit of National Regulations
105
Vol. III, Issue 3 June 2013
Also, to determine the amount representing additional deduction in
calculating taxable income, eligible expenses are summed up and will be
recorded in the Tax Register. Specifically, additional deduction of eligible
expenses for research and development is highlighted in the form 101 -
"Income tax statement", at line 18.1 "Other deductible amounts".
2.4 Accelerated tax depreciation
Accelerated depreciation for devices and equipment used in research and
development activities are carried out under Art. 24 paragraph (6) of Law
no. 571/2003 on the Tax Code, including subsequent amendments and
additions. Thus, in case of accelerated depreciation method, tax
depreciation is calculated under art. 24 paragraph (9) of the Tax Code.
Devices and equipment are provided in subgroups 2.1 and 2.2 of the
Catalogue on classification and useful life of the assets.
(III) Case study
For outrunning of competition and grabbing new markets, a plant
manufacturing cars aims to bring radical improvements to the engine used,
in order to reduce fuel consumption per hundreds of kilometers. As a result,
the manager of the unit requires the research and development department
the initiation of a medium-term plan for achieving the goals pursued.
For this purpose, a team of engineers initiated research work to find
new ways to improve engine efficiency (ensuring a complete combustion of
fuel in the engine combustion chamber, resulting in getting more power
with the same consumption).
Research phase lasted 15 months between 09.05.N-1 and 09.08.N.
During this period total expenses of 1.406.000 lei were recorded, whose
structure includes expenses such as:
providing equipment (location, measurement and control devices
etc.).
collaboration contracts with specialized universities and other
specialists;
various aids;
salaries, insurance, etc.
The research findings represented the starting point in development work.
Thus, based on the research results, directorate undertakes implementation
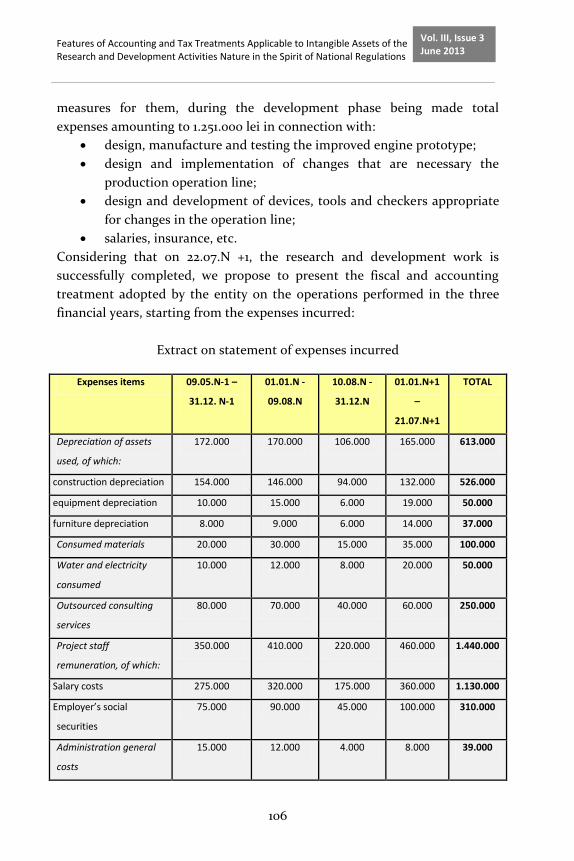
Features of Accounting and Tax Treatments Applicable to Intangible Assets of the Research and Development Activities Nature in the Spirit of National Regulations
106
Vol. III, Issue 3 June 2013
measures for them, during the development phase being made total
expenses amounting to 1.251.000 lei in connection with:
design, manufacture and testing the improved engine prototype;
design and implementation of changes that are necessary the
production operation line;
design and development of devices, tools and checkers appropriate
for changes in the operation line;
salaries, insurance, etc.
Considering that on 22.07.N +1, the research and development work is
successfully completed, we propose to present the fiscal and accounting
treatment adopted by the entity on the operations performed in the three
financial years, starting from the expenses incurred:
Extract on statement of expenses incurred
Expenses items 09.05.N-1 –
31.12. N-1
01.01.N -
09.08.N
10.08.N -
31.12.N
01.01.N+1
–
21.07.N+1
TOTAL
Depreciation of assets
used, of which:
172.000 170.000 106.000 165.000 613.000
- construction depreciation 154.000 146.000 94.000 132.000 526.000
- equipment depreciation 10.000 15.000 6.000 19.000 50.000
- furniture depreciation 8.000 9.000 6.000 14.000 37.000
Consumed materials 20.000 30.000 15.000 35.000 100.000
Water and electricity
consumed
10.000 12.000 8.000 20.000 50.000
Outsourced consulting
services
80.000 70.000 40.000 60.000 250.000
Project staff
remuneration, of which:
350.000 410.000 220.000 460.000 1.440.000
- Salary costs 275.000 320.000 175.000 360.000 1.130.000
- Employer’s social
securities
75.000 90.000 45.000 100.000 310.000
Administration general
costs
15.000 12.000 4.000 8.000 39.000
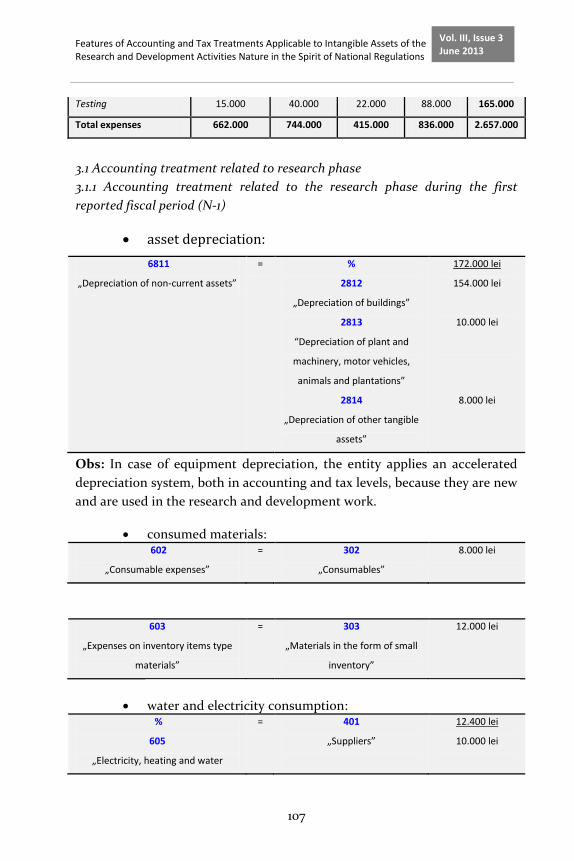
Features of Accounting and Tax Treatments Applicable to Intangible Assets of the Research and Development Activities Nature in the Spirit of National Regulations
107
Vol. III, Issue 3 June 2013
Testing 15.000 40.000 22.000 88.000 165.000
Total expenses 662.000 744.000 415.000 836.000 2.657.000
3.1 Accounting treatment related to research phase
3.1.1 Accounting treatment related to the research phase during the first
reported fiscal period (N-1)
asset depreciation:
6811
„Depreciation of non-current assets”
= %
2812
„Depreciation of buildings”
2813
“Depreciation of plant and
machinery, motor vehicles,
animals and plantations”
2814
„Depreciation of other tangible
assets”
172.000 lei
154.000 lei
10.000 lei
8.000 lei
Obs: In case of equipment depreciation, the entity applies an accelerated
depreciation system, both in accounting and tax levels, because they are new
and are used in the research and development work.
consumed materials: 602
„Consumable expenses”
= 302
„Consumables”
8.000 lei
603
„Expenses on inventory items type
materials”
= 303
„Materials in the form of small
inventory”
12.000 lei
water and electricity consumption:
%
605
„Electricity, heating and water
= 401
„Suppliers”
12.400 lei
10.000 lei
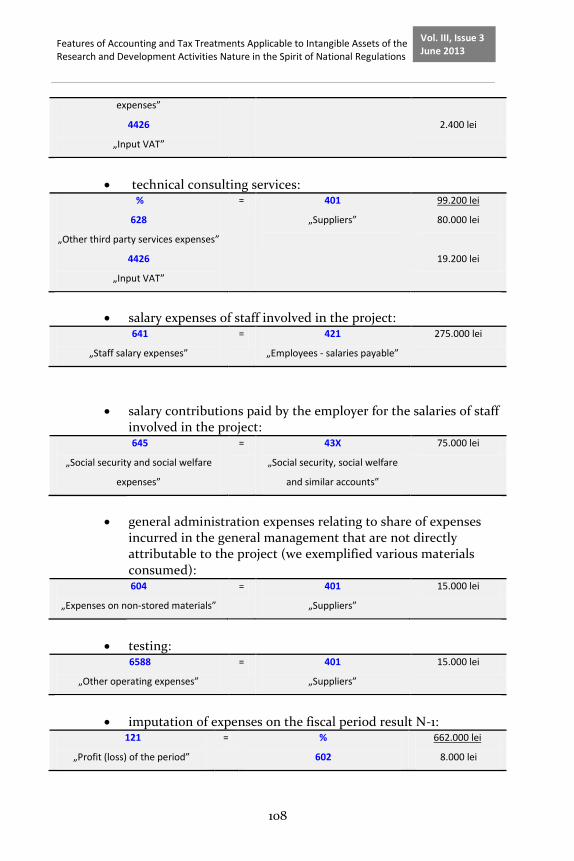
Features of Accounting and Tax Treatments Applicable to Intangible Assets of the Research and Development Activities Nature in the Spirit of National Regulations
108
Vol. III, Issue 3 June 2013
expenses”
4426
„Input VAT”
2.400 lei
technical consulting services:
%
628
„Other third party services expenses”
4426
„Input VAT”
= 401
„Suppliers”
99.200 lei
80.000 lei
19.200 lei
salary expenses of staff involved in the project: 641
„Staff salary expenses”
= 421
„Employees - salaries payable”
275.000 lei
salary contributions paid by the employer for the salaries of staff involved in the project: 645
„Social security and social welfare
expenses”
= 43X
„Social security, social welfare
and similar accounts”
75.000 lei
general administration expenses relating to share of expenses incurred in the general management that are not directly attributable to the project (we exemplified various materials consumed): 604
„Expenses on non-stored materials”
= 401
„Suppliers”
15.000 lei
testing:
6588
„Other operating expenses”
= 401
„Suppliers”
15.000 lei
imputation of expenses on the fiscal period result N-1:
121
„Profit (loss) of the period”
= %
602
662.000 lei
8.000 lei
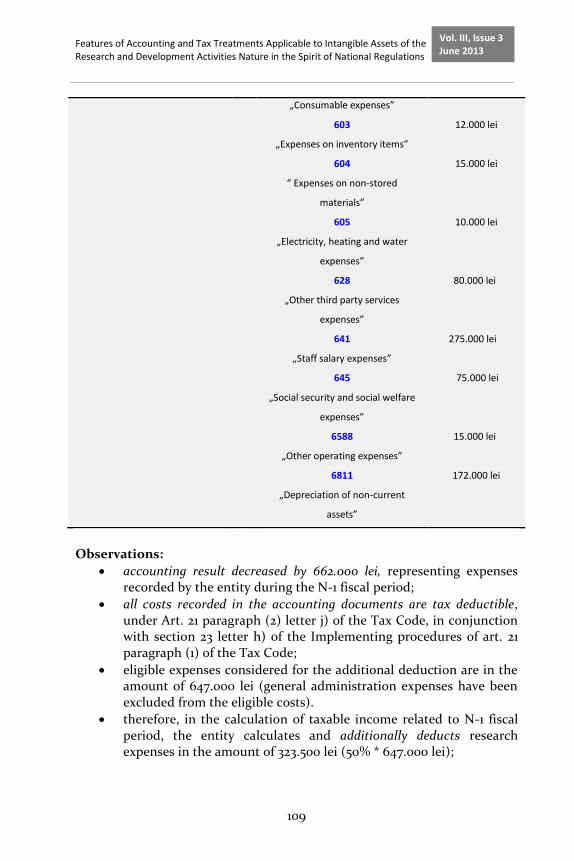
Features of Accounting and Tax Treatments Applicable to Intangible Assets of the Research and Development Activities Nature in the Spirit of National Regulations
109
Vol. III, Issue 3 June 2013
„Consumable expenses”
603
„Expenses on inventory items”
604
“ Expenses on non-stored
materials”
605
„Electricity, heating and water
expenses”
628
„Other third party services
expenses”
641
„Staff salary expenses”
645
„Social security and social welfare
expenses”
6588
„Other operating expenses”
6811
„Depreciation of non-current
assets”
12.000 lei
15.000 lei
10.000 lei
80.000 lei
275.000 lei
75.000 lei
15.000 lei
172.000 lei
Observations:
accounting result decreased by 662.000 lei, representing expenses recorded by the entity during the N-1 fiscal period;
all costs recorded in the accounting documents are tax deductible, under Art. 21 paragraph (2) letter j) of the Tax Code, in conjunction with section 23 letter h) of the Implementing procedures of art. 21 paragraph (1) of the Tax Code;
eligible expenses considered for the additional deduction are in the amount of 647.000 lei (general administration expenses have been excluded from the eligible costs).
therefore, in the calculation of taxable income related to N-1 fiscal period, the entity calculates and additionally deducts research expenses in the amount of 323.500 lei (50% * 647.000 lei);
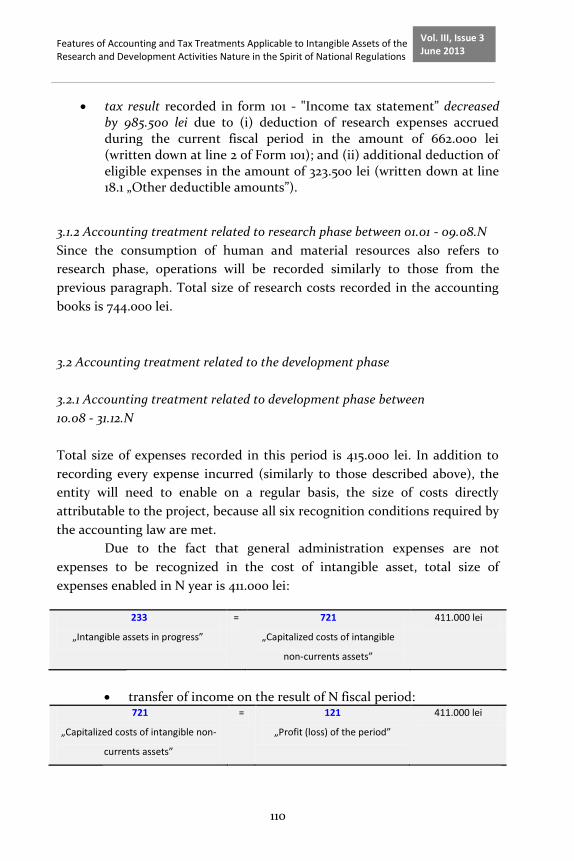
Features of Accounting and Tax Treatments Applicable to Intangible Assets of the Research and Development Activities Nature in the Spirit of National Regulations
110
Vol. III, Issue 3 June 2013
tax result recorded in form 101 - "Income tax statement” decreased by 985.500 lei due to (i) deduction of research expenses accrued during the current fiscal period in the amount of 662.000 lei (written down at line 2 of Form 101); and (ii) additional deduction of eligible expenses in the amount of 323.500 lei (written down at line 18.1 „Other deductible amounts”).
3.1.2 Accounting treatment related to research phase between 01.01 - 09.08.N
Since the consumption of human and material resources also refers to
research phase, operations will be recorded similarly to those from the
previous paragraph. Total size of research costs recorded in the accounting
books is 744.000 lei.
3.2 Accounting treatment related to the development phase
3.2.1 Accounting treatment related to development phase between
10.08 - 31.12.N
Total size of expenses recorded in this period is 415.000 lei. In addition to
recording every expense incurred (similarly to those described above), the
entity will need to enable on a regular basis, the size of costs directly
attributable to the project, because all six recognition conditions required by
the accounting law are met.
Due to the fact that general administration expenses are not
expenses to be recognized in the cost of intangible asset, total size of
expenses enabled in N year is 411.000 lei:
233
„Intangible assets in progress”
= 721
„Capitalized costs of intangible
non-currents assets”
411.000 lei
transfer of income on the result of N fiscal period:
721
„Capitalized costs of intangible non-
currents assets”
= 121
„Profit (loss) of the period”
411.000 lei

Features of Accounting and Tax Treatments Applicable to Intangible Assets of the Research and Development Activities Nature in the Spirit of National Regulations
111
Vol. III, Issue 3 June 2013
imputation of expenses on N fiscal period result (744.000 lei during 01.01-09.08 N and 415.000 lei between 10.08 – 31.12. N):
121
„Profit (loss) of the period”
= 6xx
„Expense accounts”
1.159.000 lei
Observations:
in the balance sheet shall be recorded the intangible asset in progress, amounting to 411.000 lei;
accounting result decreased by 748.000 lei, representing the difference between expenses recorded by the entity during the N fiscal period and income recognized as a result of capitalization of expenses during the development phase;
all costs recorded in the accounting documents are tax deductible, under Art. 21 paragraph (2) letter j) of the Tax Code, in conjunction with section 23 letter h) of the Implementing procedures of art. 21 paragraph (1) of the Tax Code;
eligible expenses considered for the additional deduction are in the amount of 1.143.000 lei (1.159.000 lei minus 16.000 lei representing general administration expenses). Therefore, in the calculation of taxable income related to N fiscal period, the entity calculates and additionally deducts research expenses in the amount of 571.500 lei (50% * 1.143.000 lei);
tax result recorded in form 101 - "Income tax statement” decreased by 1.319.500 lei due to the following:
(i) taxation of income recorded occasioned by capitalization of
expenses in the research phase for 411.000 lei (written down at line 1 of
Form 101);
(ii) deduction of research and development expenses accrued during
the current fiscal period in the amount of 1.159.000 lei (written down at
line 2 of Form 101);
(iii) additional deduction of eligible expenses in the amount of 571.500
lei (written down at line 18.1 "Other deductible amounts").
3.2.2 Accounting treatment related to the development phase between
01.01 - 20.07.N 1
Total size of expenses recorded during this period is 836.000 lei, according
to their nature, similarly to those entered during the research phase.
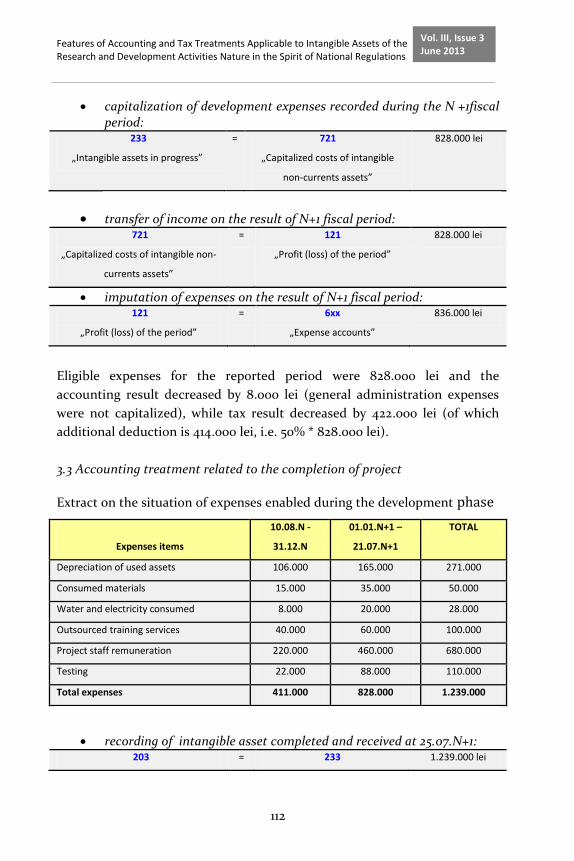
Features of Accounting and Tax Treatments Applicable to Intangible Assets of the Research and Development Activities Nature in the Spirit of National Regulations
112
Vol. III, Issue 3 June 2013
capitalization of development expenses recorded during the N +1fiscal period:
233
„Intangible assets in progress”
= 721
„Capitalized costs of intangible
non-currents assets”
828.000 lei
transfer of income on the result of N+1 fiscal period:
721
„Capitalized costs of intangible non-
currents assets”
= 121
„Profit (loss) of the period”
828.000 lei
imputation of expenses on the result of N+1 fiscal period: 121
„Profit (loss) of the period”
= 6xx
„Expense accounts”
836.000 lei
Eligible expenses for the reported period were 828.000 lei and the
accounting result decreased by 8.000 lei (general administration expenses
were not capitalized), while tax result decreased by 422.000 lei (of which
additional deduction is 414.000 lei, i.e. 50% * 828.000 lei).
3.3 Accounting treatment related to the completion of project
Extract on the situation of expenses enabled during the development phase
Expenses items
10.08.N -
31.12.N
01.01.N+1 –
21.07.N+1
TOTAL
Depreciation of used assets 106.000 165.000 271.000
Consumed materials 15.000 35.000 50.000
Water and electricity consumed 8.000 20.000 28.000
Outsourced training services 40.000 60.000 100.000
Project staff remuneration 220.000 460.000 680.000
Testing 22.000 88.000 110.000
Total expenses 411.000 828.000 1.239.000
recording of intangible asset completed and received at 25.07.N+1: 203 = 233 1.239.000 lei
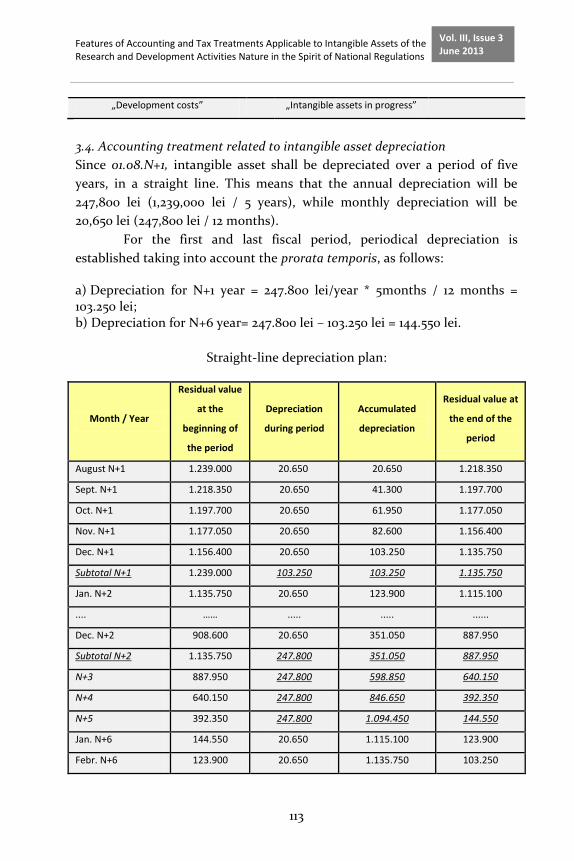
Features of Accounting and Tax Treatments Applicable to Intangible Assets of the Research and Development Activities Nature in the Spirit of National Regulations
113
Vol. III, Issue 3 June 2013
„Development costs” „Intangible assets in progress”
3.4. Accounting treatment related to intangible asset depreciation
Since 01.08.N+1, intangible asset shall be depreciated over a period of five
years, in a straight line. This means that the annual depreciation will be
247,800 lei (1,239,000 lei / 5 years), while monthly depreciation will be
20,650 lei (247,800 lei / 12 months).
For the first and last fiscal period, periodical depreciation is
established taking into account the prorata temporis, as follows:
a) Depreciation for N+1 year = 247.800 lei/year * 5months / 12 months = 103.250 lei; b) Depreciation for N+6 year= 247.800 lei – 103.250 lei = 144.550 lei.
Straight-line depreciation plan:
Month / Year
Residual value
at the
beginning of
the period
Depreciation
during period
Accumulated
depreciation
Residual value at
the end of the
period
August N+1 1.239.000 20.650 20.650 1.218.350
Sept. N+1 1.218.350 20.650 41.300 1.197.700
Oct. N+1 1.197.700 20.650 61.950 1.177.050
Nov. N+1 1.177.050 20.650 82.600 1.156.400
Dec. N+1 1.156.400 20.650 103.250 1.135.750
Subtotal N+1 1.239.000 103.250 103.250 1.135.750
Jan. N+2 1.135.750 20.650 123.900 1.115.100
.... …… ..... ..... ......
Dec. N+2 908.600 20.650 351.050 887.950
Subtotal N+2 1.135.750 247.800 351.050 887.950
N+3 887.950 247.800 598.850 640.150
N+4 640.150 247.800 846.650 392.350
N+5 392.350 247.800 1.094.450 144.550
Jan. N+6 144.550 20.650 1.115.100 123.900
Febr. N+6 123.900 20.650 1.135.750 103.250
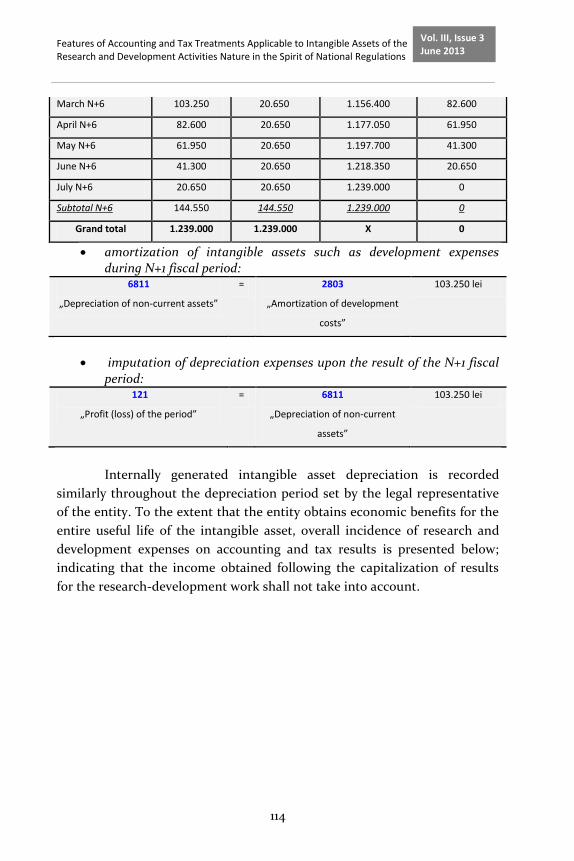
Features of Accounting and Tax Treatments Applicable to Intangible Assets of the Research and Development Activities Nature in the Spirit of National Regulations
114
Vol. III, Issue 3 June 2013
March N+6 103.250 20.650 1.156.400 82.600
April N+6 82.600 20.650 1.177.050 61.950
May N+6 61.950 20.650 1.197.700 41.300
June N+6 41.300 20.650 1.218.350 20.650
July N+6 20.650 20.650 1.239.000 0
Subtotal N+6 144.550 144.550 1.239.000 0
Grand total 1.239.000 1.239.000 X 0
amortization of intangible assets such as development expenses during N+1 fiscal period:
6811
„Depreciation of non-current assets”
= 2803
„Amortization of development
costs”
103.250 lei
imputation of depreciation expenses upon the result of the N+1 fiscal period:
121
„Profit (loss) of the period”
= 6811
„Depreciation of non-current
assets”
103.250 lei
Internally generated intangible asset depreciation is recorded
similarly throughout the depreciation period set by the legal representative
of the entity. To the extent that the entity obtains economic benefits for the
entire useful life of the intangible asset, overall incidence of research and
development expenses on accounting and tax results is presented below;
indicating that the income obtained following the capitalization of results
for the research-development work shall not take into account.
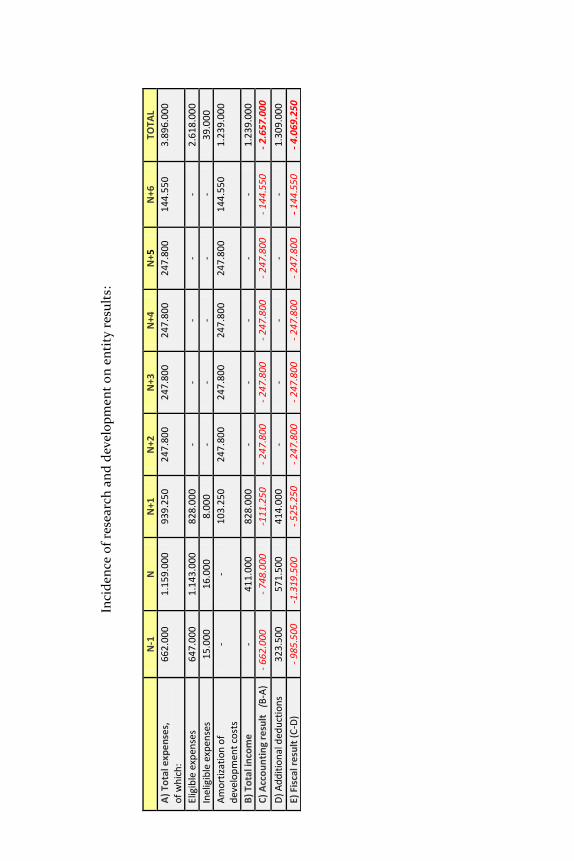
Inci
den
ce o
f re
sear
ch a
nd
dev
elo
pm
ent
on
en
tity
res
ult
s:
N
-1
N
N+1
N
+2
N+3
N
+4
N+5
N
+6
TOTA
L
A)
Tota
l exp
en
ses,
o
f w
hic
h:
66
2.0
00
1.1
59
.00
0 9
39
.25
0 2
47
.80
0 2
47
.80
0 2
47
.80
0 2
47
.80
0 1
44
.55
0 3
.89
6.0
00
Elig
ible
exp
ense
s 6
47
.00
0 1
.14
3.0
00
82
8.0
00
- -
- -
- 2
.61
8.0
00
Inel
igib
le e
xpen
ses
15
.00
0 1
6.0
00
8.0
00
- -
- -
- 3
9.0
00
Am
ort
izat
ion
of
dev
elo
pm
ent
cost
s -
- 1
03
.25
0 2
47
.80
0 2
47
.80
0 2
47
.80
0 2
47
.80
0 1
44
.55
0 1
.23
9.0
00
B)
Tota
l in
com
e -
41
1.0
00
82
8.0
00
- -
- -
- 1
.23
9.0
00
C)
Acc
ou
nti
ng
resu
lt
(B-A
) -
66
2.0
00
- 7
48
.00
0 -1
11
.25
0 -
24
7.8
00
- 2
47
.80
0 -
24
7.8
00
- 2
47
.80
0 -
14
4.5
50
- 2
.657
.00
0
D)
Ad
dit
ion
al d
edu
ctio
ns
32
3.5
00
57
1.5
00
41
4.0
00
- -
- -
- 1
.30
9.0
00
E) F
isca
l re
sult
(C
-D)
- 9
85
.50
0 -1
.319
.50
0 -
52
5.2
50
- 2
47
.80
0 -
24
7.8
00
- 2
47
.80
0 -
24
7.8
00
- 1
44
.55
0 -
4.0
69.2
50

Features of Accounting and Tax Treatments Applicable to Intangible Assets of the Research and Development Activities Nature in the Spirit of National Regulations
116
Vol. III, Issue 3 June 2013
Conclusions
Impact of research-development costs incurred between 09.05.N-1 - 21.07.N +1 (2.657.000 lei) on accounting result occurs throughout the period between the program initiation date and the date when intangible asset is fully depreciated (09.05 N-1 - 31.07.N +6). This is natural, considering that of the amount of 2.657.000 lei (amount spent for research-development work) entity capitalized 1.239.000 lei (amount spent on development), which was recognized on account of an intangible asset during N +1 period and was recovered on account of depreciation by 31.07.N+ 6.
Tax incentives are used to allow deduction of more than 100% of research and development expenses. In our example, it may be observed how additional deduction of 50% of eligible expenses is applied throughout the period of making research-development expenses (N-1, N and N +1 fiscal periods), because we considered that al throughout this period, tax law allowed an additional deduction of 50% and the entity can demonstrate at any time that all eligible expenses have been incurred for its business purpose, in compliance with all conditions imposed by the legislators. Therefore, in our example, at every 100 lei eligible expenses for research and development, entity reduces additional its tax result by 50 lei (1.309.000 lei/2.618.000, generally). (IV) Current limits and options for future
In a competitive market, survival on such market is often closely related to research and development work. Thus, to obtain a competitive advantage, entities are required (i) to streamline the production process by introducing new technologies and processes in order to reduce the cost of already existing goods and services and / or (ii) to market new products and services. It is therefore imperative to stimulate entities to engage themselves in research and development activities. However, tax incentives currently used in Romania are applicable only to income tax paying entities, regardless of size or type of organization, which has several obvious limitations such as:
granting a modest additional deduction only for calculation of taxable income;
constraint of entities in purchasing / production of new equipment and devices for each research-development project, with an impact on treasury;
inexistence of some fiscal stimulus actions for newly created entities experiencing losses in the first years of activity.
Features of Accounting and Tax Treatments Applicable to Intangible Assets of the Research and Development Activities Nature in the Spirit of National Regulations
117
Vol. III, Issue 3 June 2013
We appreciate that, for the substantial enhancement of the contribution of research and development activities to an increase in the performance of entities and, consequently, in the economic growth, a thorough national analysis is required on the opportunity that fiscal incentives also cover the following issues:
income tax reimbursement;
tax credits for research and development; and
unlimited / more than 7 years reporting of tax loss;
providing additional deductions for tangible / intangible assets used in research and development work, regardless of the date of acquisition / production and regardless of the number of research-development projects in which they are used, to encourage both large corporations and especially SMEs, which stimulate entrepreneurial initiative and thus ensure an economic growth in the national economy;
exemption from salary taxes for staff involved in research and development work.
References
[1] Gherghina, R., Quality and performance - important requirements in university scientific research, International Conference "Very close to integration- opportunities and threats", held by University of Craiova – Drobeta- Turnu Severin University Center, article published in Volume II of the Conference, 2006, pp. 690-693;
[2] Cohen, A. J., Intangible assets. Evaluation and economic benefits, Editura Irecson, Bucharest, 2008;
[3] Ristea, M., Dumitru, C., Manea, L., Irimescu, A., Nichita, M., Asset amortization and depreciation accounting, Editura Tribuna Economica, Bucharest, 2009;
[4] Văduva, F., Gherghina, R., Duca, I., Analysis of the Research and Development Sector to Generate a Competitive Advantage on a national level, Management and Marketing magazine, vol.4, no 2, 2009, pp157-164;
[5] Order no. 2086/2010 for approving Regulations on deductions for research-development expenses when establishing taxable profit;
[6] Order no. 3055/2009 for approving accounting regulations compliant with the European directives, including subsequent amendments and additions;
[7] Law no. 571/2003 on the Tax Code, including subsequent amendments and additions;

Features of Accounting and Tax Treatments Applicable to Intangible Assets of the Research and Development Activities Nature in the Spirit of National Regulations
118
Vol. III, Issue 3 June 2013
[8] Government Resolution no. 44 of January the 2nd
, 2004 for approving the methodological guidelines of enforcing Law no. 571/2003 on the Tax Code, including subsequent amendments and additions.
Scientific Papers (www.scientificpapers.org) Journal of Knowledge Management, Economics and Information Technology
119
Vol. III, Issue 3 June 2013
Analysis of Internet Usage Intensity in Iraq: An Ordered Logit Model
Authors: Almas Heshmati1, Department of Economics, K526, Sogang University, 35 Baekbeom-‐ro (Sinsu-‐dong) Mapu-‐go, Seoul 121-‐742 Korea, E-‐mail: [email protected], [email protected]; Firas H. Al-‐Hammadany, Ministry of Foreign Ministry, Director of Information Technology Department, Baghdad, Iraq, E-‐mail: [email protected]; Ashraf Bany-‐Mohammed, CIS Department, College of IT, Middle East University, Amman, Jordan, E-‐mail: [email protected]
Intensity of Internet use is significantly influenced by government policies, people’s levels of income, education, employment and general development and economic conditions. Iraq has very low Internet usage levels compared to the region and the world. This study uses an ordered logit model to analyse the intensity of Internet use in Iraq. The results showed that economic reasons (internet cost and income level) were key cause for low level usage intensity rates. About 68% of the population revealed that Internet access at homes is costly. Thus, it is no wonder that Internet cafés is the most commonly used mode of Internet use followed by broadband and dial-‐up connections. Iraq has to develop proper strategies to enhance the rate of Internet use in the country. These strategies need to focus on decreasing internet access prices, increasing awareness about the importance of the technology and internet education in schools and universities. Keywords: ordered logit; internet technology; internet usage; determinants
1 Correspondent author
7
Analysis of Internet Usage Intensity in Iraq: An Ordered Logit Model
120
Vol. III, Issue 3 June 2013
Introduction
The effect of Information and Communication Technology (ICT) on output growth and economic development has been huge (Schreyer 2000), both in advanced and developing nations. The wide spread of ICT technologies has increased in the last 2 decades opening windows of opportunities to gain new knowledge and explore new business opportunities (Cawsey et al. 2003). Among the many ICT technologies, internet occupies the prime place (Ulutas and Islier, 2010). Internet user’s today gain huge advantage as Internet services reveals on a daily basis new services to the market. In fact, the world has witnessed tremendous change with the advent of the internet technology (Zamozski et al., 2009). Countries’ where internet technology and usage intensity was developed early, technological and economic development has been achieved at a faster rate indicating the proportional relation between the Internet and economic development (Yen, 2010).
Internet diffusion and usage intensity in Iraq have been always influenced by wars and lack of political willingness which lead to very low diffusion rates and usage intensity. Even in 2008, only 10 % of the Iraq population had access to the Internet. Moreover, among those who had internet access, usage intensity is low. This paper seeks to analyse the significant factors affecting the Internet usage intensity. At the same time, the paper aims to connect empirical results of this work to the practical use of policy makers through solid policy analysis and recommendations. This contribution will certainly facilitate the analysis of any of such issues in the future and help us to understand the most effective way to tackle such issues. In doing so, different socioeconomic and demographic factors were investigated using an ordered logit regression technique. The results of this work provide a basic and comprehensive understanding of the current states in Iraq and a foundation for other scholars for further analysis.
Remainder of this paper in organized as following, next section present theoretical foundation and framework. Section 3 provides data description and hypothesis whereas section 4 present methodology, model specification and estimation. Section 5 offers results and analysis while Section 6 provides discussion and policy implication. Finally section 7 concludes this work.

Analysis of Internet Usage Intensity in Iraq: An Ordered Logit Model
121
Vol. III, Issue 3 June 2013
Previous Research and Theoretical Framework
This section review different literature on Internet usage intensity which provides the base on which the framework of this work have been developed.
Positive Influence of Internet Usage Intensity
Internet diffusion and usage can have significant positive effects on the development of many economic activities in the country. The diffusion of Internet has resulted in new effective ways for communication (Valentine and Holloway 2001; Keng and Ting 2009), novel business models, and improved global business operations (Larson and Pepper 2006). Wang and Tadisina (2007) stressed the role of ICT technology utilization and business process redesign to save time and reduce costs. Moreover, Internet has opened new frontiers for research and innovations in medicine, physics and energy (Cuijpers et al., 2008). In addition, global trade and business collaboration has increased and grow significantly through e-‐commerce activities in the last decade (Castaneda et al. 2007; and Turban, 2008).
In summary, numerous scholars have established the positive role of Internet in all sectors of the modern economies and societies emphasizing the importance of increased usage intensity and adoption of internet technologies in all sectors by all people (Martinez-‐Torres et al. 2010; Barrero et al. 2010; Keng and Ting, 2009; and Yu et al., 2008). Lee and Heshmati (2006) studied global diffusion of internet. In Heshmati and Peng (2010) the issues of information and communication technologies policies and practices are discussed. Al-‐Mutavakkil et al. (2009) compute infrastructure indices to rank countries by their level of connectivity and services utilization. Xu et al. (2010) investigate how information technology infrastructure capabilities are related to information technology project success from a development team perspective.
Negative Influence of Internet intensity Though Internet access would promote access to information, technology upgrading and development, it may also result in some unwanted consequences (Alberta, 2005; Tarpley, 2001). These include issues of

Analysis of Internet Usage Intensity in Iraq: An Ordered Logit Model
122
Vol. III, Issue 3 June 2013
addiction, waste of time, crime and abuse. Lu and Wang (2008) confirmed that Internet intensity use may raise addiction to online entertainment programs such as casinos and games. Rideout et al. (2003) and Roberts et al. (2004) found that Internet intensity among children might be reflected through spending an average of over one hour each day in recreational Internet use. NCES (2003), and Quigley and Blashki, (2003) also reported the possibility of attachment to online pornography and sexual programs via the Internet especially in case of teenagers (Subrahmanyam et al., 2001; STI, 2001). In comparison with the positive effects of Internet intensity, the negative effects are marginal and may be neglected (especially in case of mature people) since they can be controlled by either technology solutions, government regulations (Sang et al., 2009) and/or self-‐conscience. Research Framework
Selwyn (2003) stated that the academic understanding of people who are not using or little using Internet (i.e. low Internet intensity) is very weak. He further emphasized that Internet intensity has to be studied by developing a deep conceptual understanding of new technologies.
Many scholars and reports have developed different models for understanding Internet access and intensity determinants in different parts of the globe. Gender, age, income, education and cost (Hoffman et al., 2000) were among the most cited and studied attributers in such studies (Akman and Mishra, 2010). NTIA (2002) for instance highlights the correlations of household income, the level of education, race, and age with internet access. Hills and Argyle (2003) found that gender and age significantly influenced patterns of use, but there were remarkably few significant associations with individual differences in personality when gender and age were controlled for. As well, Taylor et al. (2003) found that Internet usage may entail different distributions based on gender, age and income groups. Same and more was reported by Chaudhuri et al. (2005) were they found that socio-‐economic factors such as age, gender, race, residence, employment, and education influence households’ decision for basic Internet access.
Another work by Goldfarb and Prince (2008) investigated internet adoption vs. internet usage and found that that high-‐income, educated people were more likely to adopt the internet whereas low-‐income, less-‐

Analysis of Internet Usage Intensity in Iraq: An Ordered Logit Model
123
Vol. III, Issue 3 June 2013
educated people spend more time online. Erevelles et al. (2003) examined the underlying processes involving consumer satisfaction and switching patterns among internet service providers using different satisfaction models. The results indicate that the satisfaction levels of the consumers are generally relatively low.
Based on previous literature and in examining the Iraqi’s case, this work developed following theoretical model presented in Figure 1 to examine the contribution of: gender, age, location of residence, educational levels, employment type, and cost of use on Internet usage intensity in Iraq.
Figure 1: Factors affecting Internet intensity in its utilization in Iraq
Data and Research Hypothesis
This section presents the origin of our data, how it has been collected and how it has been used.
Data
The data used in this work was extracted from a survey on Internet status conducted by the Ministry of Foreign Affairs and Ministry of Communication in Iraq during April 2009. A sum of 15,834 observations was collected of which 9,429 were male and 6,405 female. The data was collected throughout the five regions of the Iraq (i.e. Baghdad the capital city, Middle Euphrates region, Southern, Region of north-‐central and finally Region of south-‐central). The survey data was collected through responses from a random sample of citizens in different ages, gender and level of education. Table 1 show the frequency and distribution of age, gender, education,
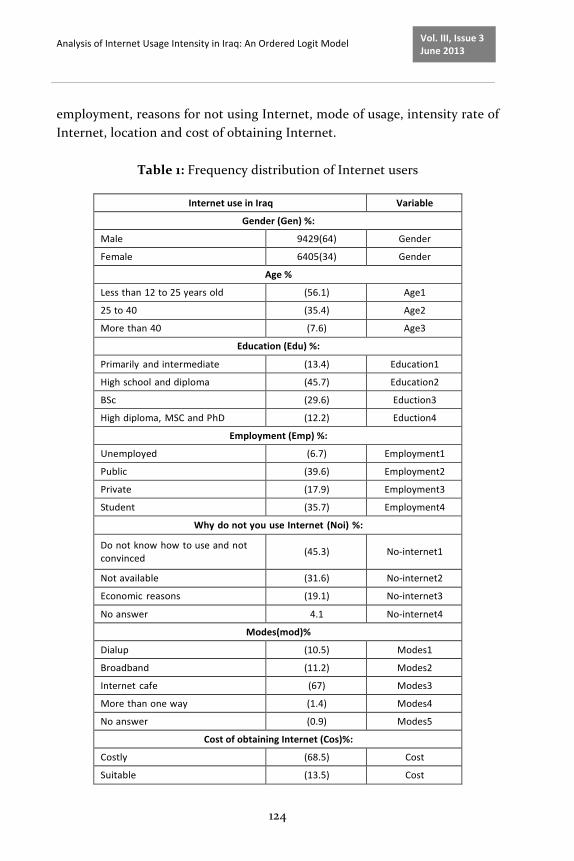
Analysis of Internet Usage Intensity in Iraq: An Ordered Logit Model
124
Vol. III, Issue 3 June 2013
employment, reasons for not using Internet, mode of usage, intensity rate of Internet, location and cost of obtaining Internet.
Table 1: Frequency distribution of Internet users
Internet use in Iraq Variable
Gender (Gen) %:
Male 9429(64) Gender
Female 6405(34) Gender
Age %
Less than 12 to 25 years old (56.1) Age1
25 to 40 (35.4) Age2
More than 40 (7.6) Age3
Education (Edu) %:
Primarily and intermediate (13.4) Education1
High school and diploma (45.7) Education2
BSc (29.6) Eduction3
High diploma, MSC and PhD (12.2) Eduction4
Employment (Emp) %:
Unemployed (6.7) Employment1
Public (39.6) Employment2
Private (17.9) Employment3
Student (35.7) Employment4
Why do not you use Internet (Noi) %:
Do not know how to use and not convinced
(45.3) No-‐internet1
Not available (31.6) No-‐internet2
Economic reasons (19.1) No-‐internet3
No answer 4.1 No-‐internet4
Modes(mod)%
Dialup (10.5) Modes1
Broadband (11.2) Modes2
Internet cafe (67) Modes3
More than one way (1.4) Modes4
No answer (0.9) Modes5
Cost of obtaining Internet (Cos)%:
Costly (68.5) Cost
Suitable (13.5) Cost
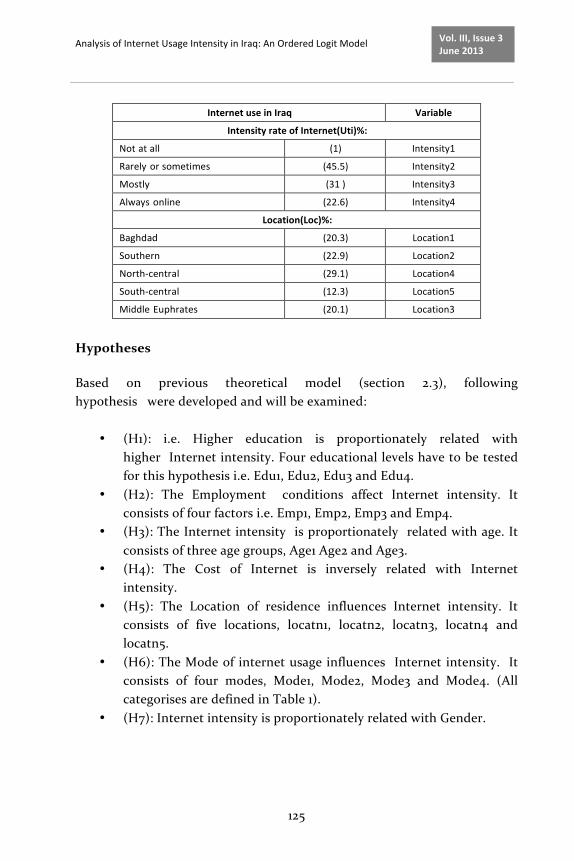
Analysis of Internet Usage Intensity in Iraq: An Ordered Logit Model
125
Vol. III, Issue 3 June 2013
Internet use in Iraq Variable
Intensity rate of Internet(Uti)%:
Not at all (1) Intensity1
Rarely or sometimes (45.5) Intensity2
Mostly (31 ) Intensity3
Always online (22.6) Intensity4
Location(Loc)%:
Baghdad (20.3) Location1
Southern (22.9) Location2
North-‐central (29.1) Location4
South-‐central (12.3) Location5
Middle Euphrates (20.1) Location3
Hypotheses
Based on previous theoretical model (section 2.3), following hypothesis were developed and will be examined:
• (H1): i.e. Higher education is proportionately related with higher Internet intensity. Four educational levels have to be tested for this hypothesis i.e. Edu1, Edu2, Edu3 and Edu4.
• (H2): The Employment conditions affect Internet intensity. It consists of four factors i.e. Emp1, Emp2, Emp3 and Emp4.
• (H3): The Internet intensity is proportionately related with age. It consists of three age groups, Age1 Age2 and Age3.
• (H4): The Cost of Internet is inversely related with Internet intensity.
• (H5): The Location of residence influences Internet intensity. It consists of five locations, locatn1, locatn2, locatn3, locatn4 and locatn5.
• (H6): The Mode of internet usage influences Internet intensity. It consists of four modes, Mode1, Mode2, Mode3 and Mode4. (All categorises are defined in Table 1).
• (H7): Internet intensity is proportionately related with Gender.
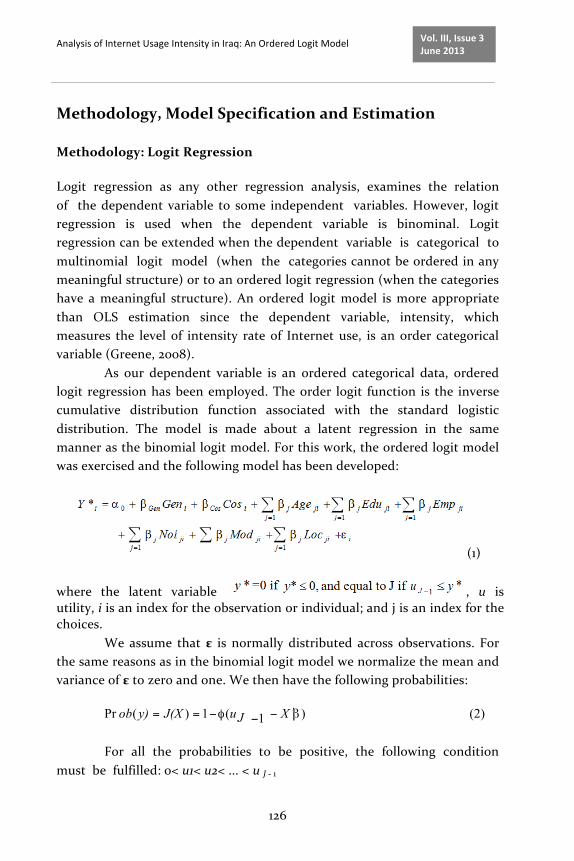
Analysis of Internet Usage Intensity in Iraq: An Ordered Logit Model
126
Vol. III, Issue 3 June 2013
Methodology, Model Specification and Estimation Methodology: Logit Regression
Logit regression as any other regression analysis, examines the relation of the dependent variable to some independent variables. However, logit regression is used when the dependent variable is binominal. Logit regression can be extended when the dependent variable is categorical to multinomial logit model (when the categories cannot be ordered in any meaningful structure) or to an ordered logit regression (when the categories have a meaningful structure). An ordered logit model is more appropriate than OLS estimation since the dependent variable, intensity, which measures the level of intensity rate of Internet use, is an order categorical variable (Greene, 2008).
As our dependent variable is an ordered categorical data, ordered logit regression has been employed. The order logit function is the inverse cumulative distribution function associated with the standard logistic distribution. The model is made about a latent regression in the same manner as the binomial logit model. For this work, the ordered logit model was exercised and the following model has been developed:
(1)
where the latent variable , u is utility, i is an index for the observation or individual; and j is an index for the choices.
We assume that ε is normally distributed across observations. For the same reasons as in the binomial logit model we normalize the mean and variance of ε to zero and one. We then have the following probabilities:
Pr ob( y) = J(X ) = 1 − φ (u J −1 − X ʹ′β ) (2)
For all the probabilities to be positive, the following condition must be fulfilled: 0< u1< u2< ... < u J -‐ 1
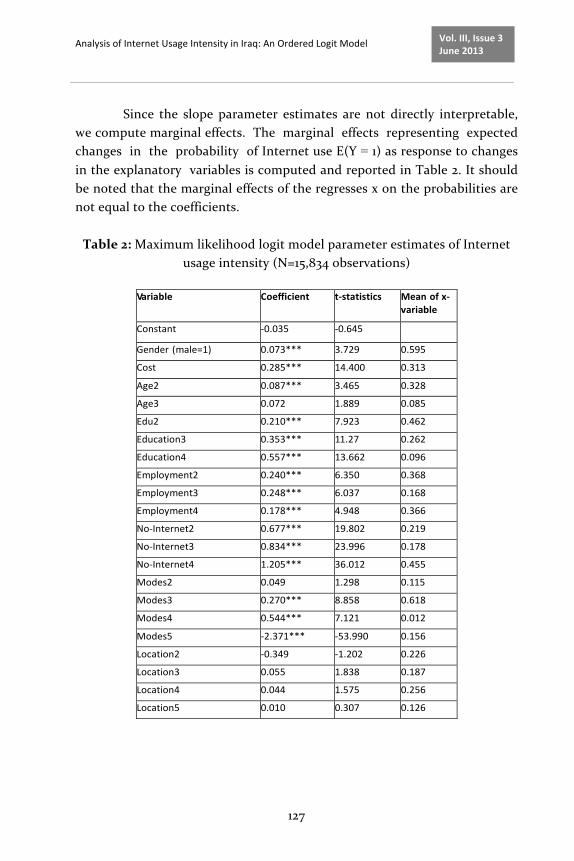
Analysis of Internet Usage Intensity in Iraq: An Ordered Logit Model
127
Vol. III, Issue 3 June 2013
Since the slope parameter estimates are not directly interpretable, we compute marginal effects. The marginal effects representing expected changes in the probability of Internet use E(Y = 1) as response to changes in the explanatory variables is computed and reported in Table 2. It should be noted that the marginal effects of the regresses x on the probabilities are not equal to the coefficients. Table 2: Maximum likelihood logit model parameter estimates of Internet
usage intensity (N=15,834 observations)
Variable Coefficient t-‐statistics Mean of x-‐variable
Constant -‐0.035 -‐0.645
Gender (male=1) 0.073*** 3.729 0.595
Cost 0.285*** 14.400 0.313
Age2 0.087*** 3.465 0.328
Age3 0.072 1.889 0.085
Edu2 0.210*** 7.923 0.462
Education3 0.353*** 11.27 0.262
Education4 0.557*** 13.662 0.096
Employment2 0.240*** 6.350 0.368
Employment3 0.248*** 6.037 0.168
Employment4 0.178*** 4.948 0.366
No-‐Internet2 0.677*** 19.802 0.219
No-‐Internet3 0.834*** 23.996 0.178
No-‐Internet4 1.205*** 36.012 0.455
Modes2 0.049 1.298 0.115
Modes3 0.270*** 8.858 0.618
Modes4 0.544*** 7.121 0.012
Modes5 -‐2.371*** -‐53.990 0.156
Location2 -‐0.349 -‐1.202 0.226
Location3 0.055 1.838 0.187
Location4 0.044 1.575 0.256
Location5 0.010 0.307 0.126

Analysis of Internet Usage Intensity in Iraq: An Ordered Logit Model
128
Vol. III, Issue 3 June 2013
RHO2(ρ)= 0.255
LR3 10710.26
Critical value X2(nn, p=0.05)=32.67
***Denotes statistical significance at the 1% level (two-‐sided test)
**Denotes statistical significance at the 5%level (two-‐sided test)
Results and Analysis Empirical findings
As can be noted, ordered logit model uses a maximum likelihood method to accurately estimate the empirical model (Greene, 2008). Due to the use of maximum likelihood techniques, R-‐square measure cannot be used to measure the significance of the model fit. In such, chi-‐square test can better measure the significant of the model fit. According to the result illustrated in the Table 2, the model with the highest RHO (ρ=255) indicates a best fitted with data (McFadden, 1974). Furthermore, the LR test value (LR=10,710.26) exceeds it’s the critical value (CV=32.67) at the 5% level of significance. The test result indicates that the effect of the model specification is statistically significant (Greene, 2008). In more detail, the calculated LR value in this model was larger than the critical value in 5% level of significance, which indicates that the null hypothesis (the model with only intercept) is rejected and the explanatory variables used in the model are all jointly significant.
Table 2 represents the results of the coefficient and t-‐statistics under ordered logit model, sixteen out of the twenty one explanatory variables are found to be statistically significant at the 5% level. Only Age 3 (Age More than 40), Modes 2 (Broadband), Location 2 (Middle Euphrates region), Location 3 (Southern Iraq), Location 4 (Region of north-‐central) and Location 5 (Region of south-‐central) are insignificant.
2 RHO = 1 -‐ (LL1/LL0), where here LL1= Unrestricted log likelihood and LL0 = Restricted log likelihood
function
3 LR = 2 (LL1 -‐ LL0) where LL1 = Unrestricted log likelihood and LL0 = Restricted log likelihood function
Analysis of Internet Usage Intensity in Iraq: An Ordered Logit Model
129
Vol. III, Issue 3 June 2013
The results of the empirical model are ranked according to the size of the marginal effects associated with each of the factor variable presented in Table 3. Since the factors are standardized to have a mean of zero and variance of one, the marginal effect indicate how one unit change in the factor impact the probability of intensity rate of Internet use. The marginal effect describes the relative relation and effect of each level of independent variable in relation with dependent variable.
When the probability=1 (not at all) or probability=2 (Rarely or sometimes), the marginal effect indicate that the No-‐Internet 4, followed by No-‐Internet 3 and No-‐ Internet 2 have the largest negative effect on Internet intensity rate. For Education factors, Education 4 followed by Education 3 followed by Education 2, the marginal effect indicates that the three education variables have second largest negative effect (when the probability equal 1 or 2). In case of Employment, Employment 3 and Employment 4, marginal effect indicates that they have negative lower effect. Similarly, the marginal effect for Internet mode, Mode 4 followed by Mode 3 recorded negative effect. Age 3 has negative marginal effect. Gender (male) has negative marginal effect than female. Cost variable has negative marginal effect.
When probability=3 (Mostly) or probability=4 (Always online),the marginal effect indicate that the educations categorize and employment type have the largest effect and the amount of this effect increase positively with increasing of level of educations, for employment type the higher effect is for Employment 2 (public sector). The type of Internet connections (mode) the marginal effect indicate that the mode 3 (Internet Cafe) have the largest effect among the fifth type of modes, the gender (male) have higher probability (marginal effect) than female when the probability equal 3 or 4 while Gender (male) have lower probability (marginal effect) than female when the probability equal 1 or 2. The cost factor has positive effect when the Probability is mostly or always on line.
In general term, results indicate that key reason for low internet usage intensity is due to “not knowing how to use” followed by “economic (cost) reasons”.

Analysis of Internet Usage Intensity in Iraq: An Ordered Logit Model
130
Vol. III, Issue 3 June 2013
Table 3: Marginal effects obtained from estimation of logit model for Internet usage intensity
Variable Probability1 Not at all
Probability2 Rarely or sometimes
Probability3 Mostly
Probability4 Always online
Constant 0.0066 0.0055 -‐0.0069 -‐0.0051
Gender (male=1) -‐0.0135 -‐0.0113 0.0142 0.0106
Cost -‐0.0526 -‐0.0437 0.0554 0.0410
Age 25 to 40 -‐0.0526 -‐0.0437 0.0554 0.0410
Age More than 40 -‐0.0162 -‐0.0134 0.0170 0.0126
Education2 -‐0.0389 -‐0.0323 0.0409 0.0303
Education3 -‐0.0652 -‐0.0542 0.0686 0.0508
Education4 -‐0.1027 -‐0.0854 0.1080 0.0801
Employment2 -‐0.0444 -‐0.0369 0.0467 0.0346
Employment3 -‐0.0458 -‐0.0380 0.0481 0.0357
Employment4 -‐0.0329 -‐0.0274 0.0346 0.0257
No-‐Internet2 -‐0.1249 -‐0.1038 0.1314 0.0974
No-‐Internet3 -‐0.1537 -‐0.1278 0.1617 0.1198
No-‐Internet4 -‐0.2222 -‐0.1847 0.2337 0.1732
Modes2 -‐0.0091 -‐0.0075 0.0095 0.0071
Modes3 -‐0.0499 -‐0.0415 0.0525 0.0389
Modes4 -‐0.1004 -‐0.0835 0.1056 0.0783
Modes5 0.4371 0.3633 -‐0.4597 -‐0.3407
Location2 0.0064 0.0054 -‐0.0068 -‐0.0050
Location3 -‐0.0102 -‐0.0085 0.0107 0.0079
Location4 -‐0.0081 -‐0.0068 0.0085 0.0063
Location5 -‐0.0019 -‐0.0016 0.0020 0.0015
Now if we go back to the hypotheses presented in section 3 and analyze them based on estimation results, following assessment can held: H1: Higher education is proportionately related with higher Internet intensity. (Illiteracy plays significant effect in Internet intensity).
Yes. At higher probabilities, Edu4 has higher significance to Internet intensity. H2: Employment conditions affect Internet intensity.
Analysis of Internet Usage Intensity in Iraq: An Ordered Logit Model
131
Vol. III, Issue 3 June 2013
Yes. The employment levels affected the Internet intensity significantly. H3: Internet intensity is proportionately related with age.
No. We couldn’t find enough evidence to say support this hypothesis as only age groups of 25-‐40 years have recorded higher Internet intensity. H4: Cost is inversely related with Internet intensity.
Yes. The higher cost has reduced the Internet intensity and use. (Economic reasons play significant effect in Internet intensity). H5: Location influences Internet intensity in Iraq.
No. we couldn’t find any indication of significance. Location can be said to have insignificant effect on Internet intensity in Iraq. H6: Internet Access Mode influences Internet intensity.
Yes. The Internet café has higher Internet use and intensity than home broadband access of Internet in Iraq. We say that availability of rich ICT infrastructure plays significant effect in Internet intensity. H7: Internet intensity is proportionately related with Gender.
Yes: There is gender divide in terms of intensity (Higher Intensity for male).
Heteroscedasticity The heteroscedasticity issue is important, because many micro-‐economic data are thought to have heteroscedasticity, which implies that the mean function cannot be estimated correctly unless the variance function is estimated at the same time. However in use of micro data it is often common to expect that different groups of users are different in behavior. These differences imply to expect different behavioral responses and the need to account for heteroscedasticity. The test is accounted for in Verbeek (2004, p. 200). Assume that the variance of the error term depends on an exogenous variable, zi , written as:
(3) v (ε i / xi ) = h (ziʹ′θ)., where h (0) is a non-‐zero constant. If the value of θ is not equal to zero, the variable zi will have an impact on v (ε i / xi ) and this is the case of

Analysis of Internet Usage Intensity in Iraq: An Ordered Logit Model
132
Vol. III, Issue 3 June 2013
heteroscedasticity. If the value of θ is equal to zero, the variable zi will have no impact on v (ε i / xi ) and the case of homoscedasticity will prevail. This issue is statistically testable.
In accounting for heteroscedasticity, it is possible to investigate whether heteroscedasticity of known or unknown form. In this case we investigate base on assumption of known form and function of specific consumer characteristics. The estimation results assuming heteroscedasticity of known form and multiplicative are presented in Table 4. The form of heteroscedasticity is as follows:
(4) The LR test value for order logit model with heteroscedasticity
(LR=103.54) exceeds the critical value (CV=12.59) at the 5% level of significance 4 and for 6 degrees of freedom. The test result for H0: homoscedasticity ( H0 : θ = 0 ) indicates that the effect of the model specification is statistically significant (Greene, 2008) suggesting presence of heteroscedasticity. The results for heteroscedasticity test of the order logit model presented in Table 4, shows that education category groups of high school and diploma (second group), B.Sc. (third group), and high diploma, M.Sc. and Ph.D. (fourth group) are all negative in relation with the lower level of education as reference group and statistically significant factors that define the model of Intensity in using Internet in Iraq. The same can be noticed in the category of employment type for public sector (Employment 2), private sector (Employment 3) and even students (Employment4) where the results are negative for Employment 2 and Employment 3 and positive for Employment 4 and all are statistically insignificant for Internet Intensity usage in Iraq.
The logistic regressions coefficient for Education 2, Education 3 and Education 4 are equal to 0.186, 0.203 and 0.134, the interpretation of that are decreasing the conditional variance by exp(-‐0.186)2, exp(-‐0.203)2 and exp(-‐0.134)2 consecutively. The Employment 2 and Employment 3 variables are lowering the conditional variance by exp(-‐0.036)2 and exp(-‐0.076)2 but Employment 4 increase the conditional variance by exp(0.035) but as shown 4 LR=2(LL1-‐LL0) where LL1=Unrestricted log likelihood, and LL0 = Restricted log likelihood functions imposing H0 : θ = 0

Analysis of Internet Usage Intensity in Iraq: An Ordered Logit Model
133
Vol. III, Issue 3 June 2013
in Table 4 the t-‐test for employment 4 is insignificant. The heteroscedasticity test revels that the model under homoscedasticity is misspecified and the more educated person has less variation in Internet use (Intensity) than the less educated ones. Also the public, and privet employed have less variation than unemployed and the students.
Table 4: Variance function
Variables x Definition Coefficient t-‐statistic Mean of x
Education2 High school and diploma -‐0.186*** -‐6.748 0.462
Education3 BSc -‐0.203*** -‐6.536 0.262
Education4 High diploma, MSC and PhD -‐0.134*** -‐3.151 0.096
Employment2 Public -‐0.036 -‐0.982 0.368
Employment3 Private -‐0.076 -‐1.846 0.168
Employment4 Student 0.035 0.980 0.366
***Denotes statistical significance at the 1% level
Discussion and Policy Implication
In general term, Internet usage intensity in Iraq is influenced by gender, age, education level, employment and cost of service. However, these factors have different level of influence on internet usage intensity. People with age of 25-‐40 years registered higher Internet usage intensity compared to those with more than 40 years old. As well, public service employment registered higher Internet intensity due to higher Internet access opportunities in government departments compared to others. For location, location 3, location 4 and location 5 recorded very low internet usage intensity (which may be due to the poor socio-‐economic development and lower income levels in these regions).
The cost of Internet can be said to be the most encumber force on Internet usage intensity especially if we know that the level of income of major population of Iraq is low. Remarkably, this was reported much earlier in Ghattas (2002) when the monopoly was controlling Internet sector in Iraq. More seriously, Internet intensity of broadband modes was found to be low. As broadband represent the future of internet, Iraqi government have to create initiatives and policies that contribute to increased broadband diffusion in Iraq. The marginal effects of the independent
Analysis of Internet Usage Intensity in Iraq: An Ordered Logit Model
134
Vol. III, Issue 3 June 2013
variables studied under ordered logit model revealed the same. The results of the ordered logit model suggest that when intensity=3 (Mostly) or intensity=4 (Always online), the education level, employment type and Mode3 (Internet Cafe) have significant positive effect on Internet use intensity in Iraq.
However, the use of internet café’s can be very different among different genders. Based on our knowledge of Iraqi culture, social factors such as the family structure, customs and traditions may in some cases act as hindrances especially for females. Moreover, some elders in the Iraqi society would not encourage Internet connections at homes as they believe it would be highly difficult to control internet usage by their children.
We believe there is a need for a concrete framework to increase internet usage intensity in Iraq. This should include awareness actions, policies for promoting installing country-‐wide advanced broadband infrastructure, stratigies for attracting foreign direct investments in ICT and Internet technology areas, inclusion of internet education in educational curriculum, and direct government incentive to lower internet access and use costs.
Conclusions
Iraq has very low internet usage rates relative to other nations in the world. To understand the aspects influencing internet usage rates in Iraq, this study developed a theoretical model and examined key factor affecting internet usage in the country. As in many other countries, Internet usage rates is influenced by several key factors such as age, education, employment, people’s level of income. However, unlike other countries, these factors and more cultural and economical factors shape the internet usage rates in Iraq. For instance, Internet café is the most commonly used mode of Internet use. Yet, cultural factors hinder the equality to access internet cafes based on gender (were male have more access to such café’s). Moreover, broadband access at homes it still very costly for most Iraqi’s. As well, regional unbalance in terms of internet promotion is creating a notable digital divide. As Iraq has just started their development in the new era, Iraq government have to create proper policy plans and tools to address these issues and increase internet usage rates which will be very critical for the country development.
Analysis of Internet Usage Intensity in Iraq: An Ordered Logit Model
135
Vol. III, Issue 3 June 2013
References
[1] Akman, I. and Mishra, A. (2010). Gender, age and income differences in internet usage among employees in organizations. Computers in Human
Behavior 26, 482–490. [2] Al-‐Mutavkkil A, Heshmati, A. and Hwang J.S. (2009), Development of
Telecommunication and Broadcasting Infrastructure Indices at the Global
Level, Telecommunication Policy 33, 176-‐179. [3] Barrero, F., Toral, S., Vargas, M., Cortes, F. and Milla, J.M. (2010). Internet
Research. 20(2), 1066-‐2243.
[4] Cawsey, A. Dewar, R. and Culwin, F. (2003), Internet Technology and E-‐Commerce (Grassroots). Palgrave McMillan publication. P:256 ISBN-‐10: 0333989996.
[5] Castaneda, J.A., Frías, D.M. and Rodríguez, M.A. (2007). The influence of the Internet on destination satisfaction. Internet Research 17(4), 402-‐420.
[6] Chaudhuri, A. Flamm, K.S. Horrigan, J. (2005). An analysis of the
determinants of internet access. Telecommunications Policy 29, 731–755. [7] Cuijpers P., Boluijt P. and van Straten A. (2008), Screening of depression
in adolescents through the Internet: sensitivity and specificity of two
screening questionnaires, European Child Adolescence Psychiatry 17(1), 32-‐38.
[8] Erevelles S., Srinivasan S. and Rangel S. (2003). Consumer Satisfaction for
Internet Service Providers: An Analysis of Underlying Processes. Information Technology and Management 4, 69–89.
[9] Heshmati, A. and Peng, S. (2010), Ed., Information and Communication
Technology Policies and Practices, Nova Science Publishers. [10] Hills, P. and Argyle, M. (2003). Uses of the Internet and their
relationships with individual differences in personality. Computers in
Human Behavior 19, 59–70. [11] Hoffman D.L., Novak T., Schlosser A. (2000). The evolution of the digital
divide: how gaps in internet access may impact electronic commerce.
J Computer-‐Mediated Commun, 5(3), http://jcmc.indiana.edu/vol5/issue3/ hoffman.html
[12] Ghattas, K. (2002). Surfing the net in Iraq. BBC News online dated 1st May.
Available at http://news.bbc.co.uk/2/hi/middle_east/1959481.stm.
Analysis of Internet Usage Intensity in Iraq: An Ordered Logit Model
136
Vol. III, Issue 3 June 2013
[13] Goldfarb and Prince (2008). Internet adoption and usage patterns are different: Implications for the digital divide. Information Economics and Policy 20, 2–15.
[14] Government of Alberta (2005). Restructuring and government efficiency: Business Plan 2005-‐08. Alberta Super Net Research Alliance, Retrieved September 23, 2005, from http://www.albertasupernet.ca/the+project/
news/default.htm. [15] Greene, W. (2008). Econometric Analysis. Prentice Hall, 6th Edition. [16] Keng, C.J. and Ting, H.Y. (2009). The acceptance of blogs: using a
customer experiential value perspective. Internet Research 19(5), 479-‐495. [17] Larson, G.L. and Pepper, G.S. (2006). Overcoming Information
Communication Technology Problems in a Post-‐Acquisition Organization.
Organizational Dynamics 35(2), 160-‐169. [18] Lee, M. and Heshmati, A. (2006), A Dynamic Flexible Partial-‐Adjustment
Model of International Diffusion of the Internet, The RATIO Institute,
working paper, available at http://www.ratio.se/pdf/wp/ah.pdf. [19] Lu, H. and Wang, S. (2008). The role of Internet addiction in online game
loyalty: an exploratory study. Internet Research, 18(5), 499-‐519.
[20] Martinez-‐Torres, M.R., Toral, S.L., Barrero, F. and Cortés, F. (2010). The role of Internet in the development of future software projects. Internet Research 20(1), 72-‐86.
[21] McFadden, D.L. (1974). Conditional Logit Analysis of Qualitative Choice Analysis, in Frontiers in Econometrics. Ed. P. Zarembka, 105–142. New York: Academic Press.
[22] NITA (2002). A nation online: How Americans are expanding their use of the internet. National Telecommunications and Information Administration Report. Washington D.C.: US Department of Commerce;
2002. http://www.ntia.doc.gov/ntiahome/dn/anationonline2.pdf. [23] NCES (2003). Computer and Internet use by children and adolescents in
2001. National Center for Educational Statistics, Statistical analysis report.
Jessup, MD: U. S. Department of Education. Retrieved June 10, 2005, from http://nces.ed.gov/pubsearch/pubsinfo.asp?pubid=2004014.
[24] Quigley, M., and Blashki, K. (2003). Beyond the boundaries of the sacred
garden: Children and the Internet. Educational Technology Review 11, 70-‐77.

Analysis of Internet Usage Intensity in Iraq: An Ordered Logit Model
137
Vol. III, Issue 3 June 2013
[25] Rideout, V.J., Vandewater, E.A., and Wartella, E.A. (2003). Zero to six: Electronic media in the lives of infants, toddlers and preschoolers. Menlo Park, CA: The Henry J. Kaiser Family Foundation. Available online at
http://www.kaisernetwork.org/health_cast/uploaded_files/102803_kff_kids_report.pdf.
[26] Roberts, D.F., Foehr, U.G., and Rideout, V. (2004). Generation M: Media in
the lives of 8–18 year olds. Menlo Park, CA: The Henry J. Kaiser Family Foundation/http://www.kff.org/entmedia/loader.cfm?url=/commonspot/security/getfile.cfmand PageID=51809.
[27] Sang, S., Lee, J. and Lee, J. (2009). E-‐government adoption in ASEAN: the case of Cambodia. Internet Research 19(5), 517-‐534.
[28] Schreyer, P. (2000).The Contribution of Information and Communication
Technology to Output Growth: A Study of the G7 Countries. OECD Science, Technology and Industry Working Papers, 2000/2, OECD Publishing. doi:10.1787/151634666253
[29] Selwyn, N. (2003). Apart from technology: understanding people’s non-‐use of information and communication technologies in everyday life. Technology in Society 25(1), 199-‐116.
[30] STI (2001). E-‐rate and filtering: A review of the Children’s Internet Protection Act. Hearning before the Subcommittee on Telecommunications and the Internet serial No. 107-‐33. Washington, DC:
U.S. Government Printing Office. Available online at http://republicans.energycommerce.house.gov/107/action/107-‐33.pdf
[31] Subrahmanyam, K. Kraut, R., Greenfield, P., and Gross, E. (2001). New
forms of electronic media: The impact of interactive games and Internet on cognition, socialization, and behavior. In D. G. Singer and J. L. Singer (Eds.), Handbook of Children and the Media, 73-‐99.
[32] Tarpley, T. (2001). Children, the Internet, and other new technologies. In D. G. Singer and J. L. Singer (Eds.), Handbook of Children and the Media, Sage publication, Thousand Oaks, California, USA, 547-‐556.
[33] Taylor, W.J., Zhu, G., Dekkers J. and Marshall S. (2003). Socio-‐economic factors affecting home Internet usage patterns in Central Queensland. Informing Science Journal 6, 233–246.
[34] Turban, E., King, D., Lee, J. and D. Viehland (2001). Electronic Commerce: a Managerial Perspective. Pearson Prentice-‐Hall, USA.
Analysis of Internet Usage Intensity in Iraq: An Ordered Logit Model
138
Vol. III, Issue 3 June 2013
[35] Valentine, G. and Holloway, S.L. (2001). A window on the wider world? Rural children's use of information and communication technologies. Journal of Rural Studies 17(4), 383-‐394.
[36] Verbeek, M. (2004). A Guide to Modern Econometrics. 2nd ed., John Wiley and Sons Ltd.
[37] Ulutas, B. and Islier, A. (2010). Novel Attribute Based Dynamic Content
Area Layout UforU Internet Newspapers. Internet Research 20(2), 1066-‐2243.
[38] Xu, X., Zhang, W. and Barkhi R. (2010). T Infrastructure capabilities and IT
project success: a development team perspective. Information Technology and Management 11, 123-‐142.
[39] Yen, Y. (2010). Can perceived risk affect the relationship of switching
cost and customer loyalty in e-‐commerce?. Internet Research 20(2), 1066-‐2243.
[40] Yu, H., Paek, H.J. and Bae, B. (2008). Cross-‐cultural comparison of
interactivity and advertising appeals on antismoking web sites in the United States and South Korea. Internet Research 18(5), 454-‐456.
[41] Wang, T.W. and Tadisina, S.K. (2007). Simulating Internet -‐based
collaboration: A cost-‐ benefit case study using a multi-‐agent model. Decision Support Systems 43(2), 645-‐662.
[42] Zamozski, W. Walkowiak, T. Adamiec, R. and Ali, A. (2009). New
approach to e-‐ lecturing. International Journal of Internet Technology and Secured Transactions 1(3-‐4), 272-‐284.

Scientific Papers (www.scientificpapers.org) Journal of Knowledge Management, Economics and Information Technology
139
Vol. III, Issue 3 June 2013
Enhancing Knowledge Sharing Among Higher Education Students through Digital Game
Authors: Shirin Shafieiyoun, Faculty of Built Environment, University of Malaya, Kuala Lumpur, Malaysia, [email protected], Akbar Moazen Safaei, Advanced Informatics School, University of Technology Malaysia, Kuala Lumpur, Malaysia, [email protected]
Knowledge is valuable assets of organizations. One of the effective ways of creating new knowledge is highlighting knowledge sharing process among people. In this study the researcher tries to investigate the solutions for knowledge sharing problem in the classroom context. We have two objectives. One is to examine whether participants’ decision-‐making process in knowledge sharing behaviour through digital game depend on their colleagues’ knowledge sharing behaviours. The second is to examine the perceived payoff of sharing knowledge and specify if it can be characterized through the game theory. The descriptive study was carried out among 30 students from KLMU College in Malaysia. The result indicated the students’ decision making to share their knowledge was dependent to peers knowledge sharing behaviours. In addition, the perceived payoff of sharing knowledge between the students could be characterized by an assurance game. Finally, the paper provides some implication for lecturers or managers who want to provide effective knowledge sharing in their classrooms or organizations. Keywords: Knowledge Sharing; Game Theory
Introduction
8
Enhancing Knowledge Sharing Among Higher Education Students through Digital Game
140
Vol. III, Issue 3 June 2013
Knowledge sharing has been recognized as the most important area in knowledge management and also is recognized the most important process for knowledge management (Halawi L., 2008) and according to Apostolou (2009) knowledge sharing has an essential effect on knowledge management outcomes. Increasing knowledge sharing among people has a positive effect on organization performance, but unfortunately, people do not share their knowledge under all conditions. They have enough reason that they do not share their knowledge as much as the organization would like them to share (Cho, Li & Su, 2007).
Several best practices have been exposed in methodical knowledge sharing phenomenon. According to Chua (2003) many questions about the sharing of knowledge, still have not been answered. As example; why some motivations are plans to promote effective knowledge sharing in some of organization, but they were not successful in others? Why do people share their knowledge passionately even they belong to the same organization? When is a person likely to share the knowledge? Therefore, the general knowledge sharing problem in many organizations is that employees with knowledge are unwilling to share their knowledge and existing knowledge is not being efficiently distributed through organizations.
The knowledge sharing problem is equally important for a knowledge based institutions, for example in the university landscape where the knowledge creation, dissemination and application is embedded in the institution, knowledge sharing among students is essential. In order to solve knowledge sharing problems, Bent (2007) mentioned knowledge is personal and for solving knowledge sharing problem should concentrate on individual behaviour in place of technology. Hendrix (2007) generate a knowledge sharing environment that concentrate on behaviour and education rather than just concentrate on technology, needed by staff and good performance. However, there are still gaps in recognizing when and why knowledge sharing happens. Therefore, this study investigates to advance findings on knowledge sharing by implementation a descriptive study that employs a game theoretical framework. There are two research objectives in our study. The first objective is to examine whether participants’ decision-‐making process in knowledge sharing behaviour through digital game depend on their colleagues’ knowledge sharing behaviours. The second objective is to examine the perceived payoff of
Enhancing Knowledge Sharing Among Higher Education Students through Digital Game
141
Vol. III, Issue 3 June 2013
sharing knowledge and specify if it can be characterized through the game theory. Objectives of this study have implication for lecturers on how encourage the students to share their knowledge in the classroom context. This study is structured as follows. Firstly, it argues the related literature on knowledge sharing and game theories. Following that a descriptive study was carried out to examine two propositions of this study. Then analysis the data that emerged from the study. Finally this paper presents the result and discusses some implication for lecturers or managers who want to provide effective knowledge sharing in their classrooms or organizations.
Literature Review Knowledge Sharing
Some of the researchers have explored about the differences between knowledge and information. The former specified information as interpreted data via analysis, relationship and précis, and later specified Knowledge as meaningful information which is validated and enriched through experiment, values, beliefs and intuitions (Davenport & Prusak, 1999).
The previous studies categorized knowledge, knowledge to explicit and tacit. Polyani (1969) identified explicit knowledge as the knowledge that is organized, formal and codified into records for example libraries and databases (Cited in Nonaka 1994). Choi and Lee (2003) identified tacit knowledge as informal knowledge that is implanted in mental processes, is gained through work practices and experience, and it can be transferred by perceiving and implementing it. Some researchers defined knowledge sharing as the procedure by which persons jointly and repeatedly emend a thought, a belief or an offer in the view of experience. During the sharing process the initial idea might be increasingly changed or progressively refused (West & Meyer, 1997; Rogers, 1986). Knowledge sharing could be occurring through face to face communication (Dixon, 2000), synchronous or non-‐synchronous communication with a digital knowledge storehouse (Lynne, 2001).
The basic goal is to employ existing knowledge to develop the group’s efficiency (Alavi & Leidner, 1999; Salisbury, 2003). In the other words, each person shares what they learned and knew to those who have like to understand their knowledge and that knowledge is useful for them.
Enhancing Knowledge Sharing Among Higher Education Students through Digital Game
142
Vol. III, Issue 3 June 2013
The sharing procedure involves collecting, categorizing and communicating knowledge from one person to another (Van den Hooff & De Ridder, 2004). Since the sharing procedure includes other than collecting information and data, commonly, the value of knowledge increased while it is shared. Therefore, if controlled correctly, knowledge sharing could significantly enhance job-‐quality and decision-‐ making ability, problem-‐solving effectiveness as well as proficiency that will help the organization (Yang, 2007).
Szulanski (1995) specified some impediments that hamper knowledge sharing like, dependability of source, motivation to share their knowledge, and ability to learn. According to these impediments, Sai and Sheng (2006) stated that individuals are unwilling to share their knowledge except there are obvious benefits for them. It is important to explicate individual knowledge sharing behaviour, to break down these impediments. Particularly, knowledge sharing is deeply social inherently; the knowledge sharing behaviour is affected by social elements such as care and trust. While social elements occurs through a mutual relationship between two persons who share and receive the knowledge then, knowledge sharing procedure only can be continued through reciprocal action (Chua, 2003).
Social Exchange Theory and Knowledge Sharing The social exchange theory (Blau, 1964) examined individual’s knowledge sharing behavior by using theoretical base. This theory mentioned that each person adjust their interactions with others based on personal interest and examination of profits and costs that they have gained during the interaction. Molm (2001) claimed that people try to increase their benefits and reduce their cost during interaction with others. According to Gouldner (1960) these profits not to be touchable while individuals participate in an interaction with the supposition of interchange, In such transactions, people support each other with the hope of obtaining desired profits in future, such as achievement required resource throughout social reciprocity. Individuals try to make social interactions with others through sharing their knowledge to gain the maximum recourses. Davenport and Pruask (1998) examined the knowledge sharing behavior and summarized perceived advantages that might adjust such behavior. These advantages consist of the future of mutual relations, job security, position, and promotional prospects.
Enhancing Knowledge Sharing Among Higher Education Students through Digital Game
143
Vol. III, Issue 3 June 2013
Caberera (2005) claimed that knowledge sharing absolutely affected when a person supposes to gain some benefits in future through reciprocation. Previous researches revealed the elements which connected to social exchange theory can describe knowledge sharing behavior between people successfully.
Some of these elements are interpersonal interaction, personal cognition, and organizational contexts. For instance, Kankanhalli et al. (2005) highlighted that one of the most important factors that promotes employees to provide knowledge to digital knowledge repositories is an individual’s perceived advantage. Ma and Agarwal (2007) claimed that quantity of knowledge that individuals share to virtual Communities relied on the degree of satisfactions that they obtain from other people of the community. Chiu et al. (2006) examined the impact of interpersonal elements like the norm of reciprocity, trust, and social interaction on knowledge sharing on virtual Communities. Lee and Kim (2006) researched about the effect of the organizational context on knowledge sharing. By considering the theory this study considers an individual knowledge sharing behavior depended on the knowledge sharing behavior of others. Therefore the first hypothesis is proposed:
H1: an individuals’ decision-‐making process in knowledge sharing behavior through digital game depend on their colleagues’ knowledge sharing behaviors. Game Theories
When sharing of knowledge is considered as a result of decision that controlled by the perceived payoff, it has a several particular characteristics which also exist in the framework of strategic games. At the beginning, the people that involve in knowledge sharing are generally identified inside a framework, in an organization. Additionally the process of sharing knowledge includes two or more people. In the same way, in strategic games needs two or more participants that play together. Secondly, in the domain of knowledge sharing, each person has to choose between two decisions, either to share or not to share the knowledge. At the same way, many strategic games contain a series of reciprocally selected strategies that players should choose one of them. Finally; the decision for an individual to

Enhancing Knowledge Sharing Among Higher Education Students through Digital Game
144
Vol. III, Issue 3 June 2013
share or not share the knowledge is depending upon the action which produces a more payoff (Chua, 2003).
Every player has a goal to choose a strategy that gained the highest payoff. Because of this reason, it is suitable to use game theory for the examination of knowledge sharing. According to Aumann (1987), game theory is a field of applied mathematics utilized as a unified field theory describes the logical parts of social sense, involving human and non-‐human players, for example; plants, animals, and computers.
The games will be used to stimulate real-‐life conditions usually involve five elements (Ho, Hsu & Oh, 2009): 1. A person who plays a game or make a decision 2. Strategies that is accessible for every player 3. Rules that control the behavior of players 4. Each player gain payoffs for each probable outcome
The outcome is an effect of special choices made by players from existing points. In strategic games, it’s supposed that every player choose a strategy to gain the highest payoff. A dominant strategy performs better than other strategies without the consideration of the selections taken by other players. In a two-‐person game every player can select one of two reciprocally selected strategies; it means to participate or to shirk. Therefore there are four possible decisions that are created from two players. If suppose that the game is systematic, then the payoff for every player is similar when both of them participate or shirk. The payoff matrix of a two-‐person game is shown in Table 1, it is dependent on the payoff values i.e. a, b, c and d, a game can be categorized into one of three models are called, prisoners' dilemma, chicken and assurance (Dixit & Skeath, 1999; Chua, 2003).
Table 1: Payoff Matrix (Chua, 2003)
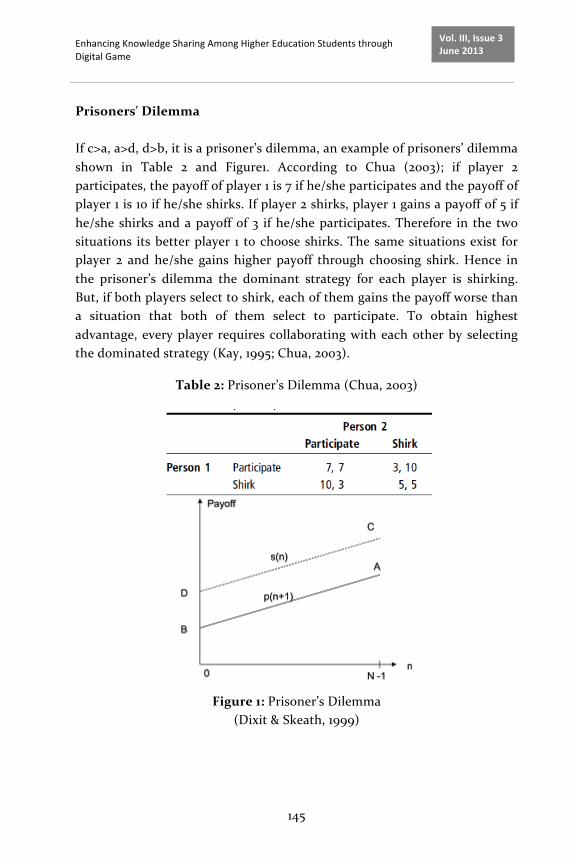
Enhancing Knowledge Sharing Among Higher Education Students through Digital Game
145
Vol. III, Issue 3 June 2013
Prisoners' Dilemma If c>a, a>d, d>b, it is a prisoner’s dilemma, an example of prisoners’ dilemma shown in Table 2 and Figure1. According to Chua (2003); if player 2 participates, the payoff of player 1 is 7 if he/she participates and the payoff of player 1 is 10 if he/she shirks. If player 2 shirks, player 1 gains a payoff of 5 if he/she shirks and a payoff of 3 if he/she participates. Therefore in the two situations its better player 1 to choose shirks. The same situations exist for player 2 and he/she gains higher payoff through choosing shirk. Hence in the prisoner’s dilemma the dominant strategy for each player is shirking. But, if both players select to shirk, each of them gains the payoff worse than a situation that both of them select to participate. To obtain highest advantage, every player requires collaborating with each other by selecting the dominated strategy (Kay, 1995; Chua, 2003).
Table 2: Prisoner’s Dilemma (Chua, 2003)
Figure 1: Prisoner’s Dilemma
(Dixit & Skeath, 1999)
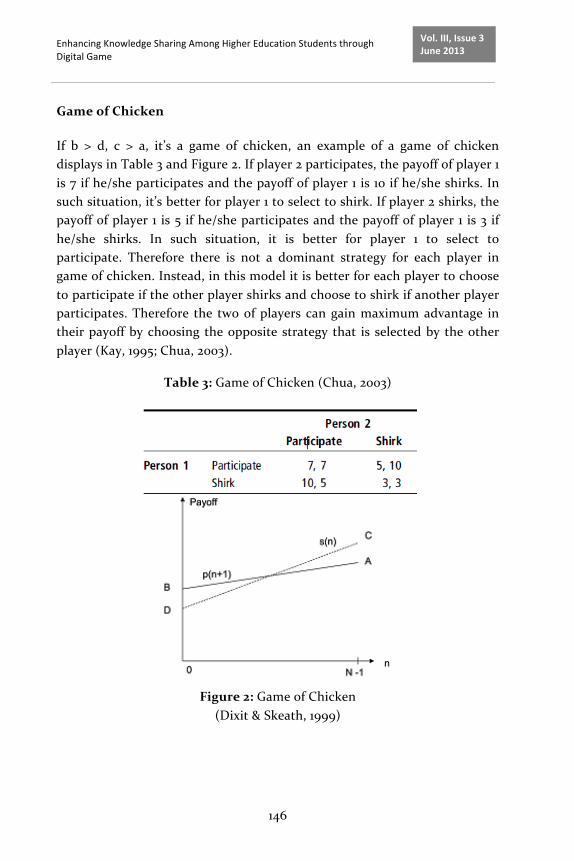
Enhancing Knowledge Sharing Among Higher Education Students through Digital Game
146
Vol. III, Issue 3 June 2013
Game of Chicken
If b > d, c > a, it’s a game of chicken, an example of a game of chicken displays in Table 3 and Figure 2. If player 2 participates, the payoff of player 1 is 7 if he/she participates and the payoff of player 1 is 10 if he/she shirks. In such situation, it’s better for player 1 to select to shirk. If player 2 shirks, the payoff of player 1 is 5 if he/she participates and the payoff of player 1 is 3 if he/she shirks. In such situation, it is better for player 1 to select to participate. Therefore there is not a dominant strategy for each player in game of chicken. Instead, in this model it is better for each player to choose to participate if the other player shirks and choose to shirk if another player participates. Therefore the two of players can gain maximum advantage in their payoff by choosing the opposite strategy that is selected by the other player (Kay, 1995; Chua, 2003).
Table 3: Game of Chicken (Chua, 2003)
Figure 2: Game of Chicken
(Dixit & Skeath, 1999)
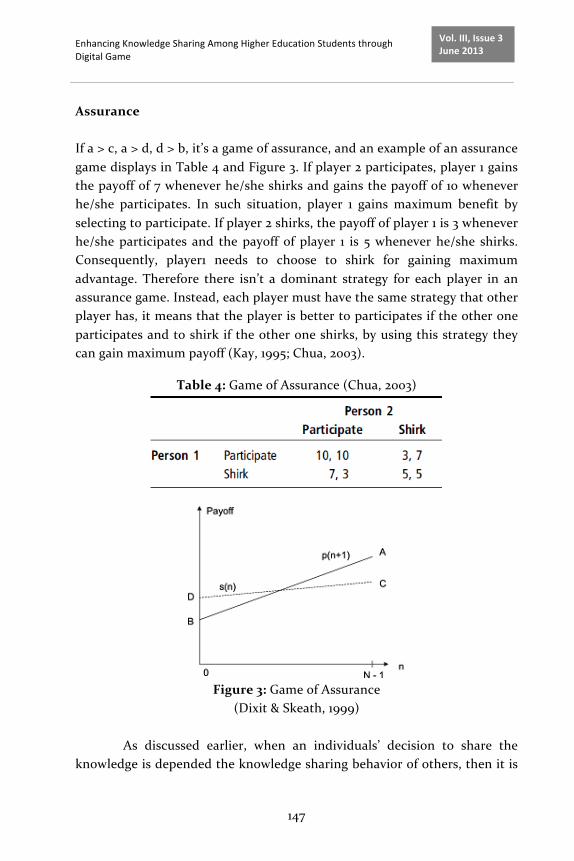
Enhancing Knowledge Sharing Among Higher Education Students through Digital Game
147
Vol. III, Issue 3 June 2013
Assurance If a > c, a > d, d > b, it’s a game of assurance, and an example of an assurance game displays in Table 4 and Figure 3. If player 2 participates, player 1 gains the payoff of 7 whenever he/she shirks and gains the payoff of 10 whenever he/she participates. In such situation, player 1 gains maximum benefit by selecting to participate. If player 2 shirks, the payoff of player 1 is 3 whenever he/she participates and the payoff of player 1 is 5 whenever he/she shirks. Consequently, player1 needs to choose to shirk for gaining maximum advantage. Therefore there isn’t a dominant strategy for each player in an assurance game. Instead, each player must have the same strategy that other player has, it means that the player is better to participates if the other one participates and to shirk if the other one shirks, by using this strategy they can gain maximum payoff (Kay, 1995; Chua, 2003).
Table 4: Game of Assurance (Chua, 2003)
Figure 3: Game of Assurance
(Dixit & Skeath, 1999)
As discussed earlier, when an individuals’ decision to share the knowledge is depended the knowledge sharing behavior of others, then it is

Enhancing Knowledge Sharing Among Higher Education Students through Digital Game
148
Vol. III, Issue 3 June 2013
match with the structure of a strategic game. Therefore the second hypothesis is proposed:
H2: The individual perceived payoff of sharing knowledge can be characterized by two-‐person game in game theory.
Methodology The descriptive study was used for this research through online survey is classified the research as a quantitative study. In this study the participants were students from two classes of KLMU College based in Malaysia to attend in educational games in Second Life as a digital game. For the purpose of this research each of two players has been placed in one group in the game. The participants could play the game in twice a week according to their classroom timetable.
Second Life is three dimensional (3-‐D) and full immersive application based on internet completely built and owned by its residents in virtual world. Second life provides synchronous and asynchronous virtual tools. Technically, the questionnaire is divided into two main divisions: Section A: Demographic information: The first division of the survey contains the questions as regards the general information about students and they are prompted for their personal characteristic. The four characteristic of students were identified includes: (1) Gender; (2) Educational level; (3) Age; and (4) Computer skill of participants Section B: Describes the knowledge sharing practice. The second division contains twenty questions about knowledge sharing behavior of students during playing the digital game. The five items considered to measure knowledge sharing behavior of students during playing the digital game: 1. Level of understanding about the topic of the game 2. Efficiency in doing the tasks 3. Self-‐esteem 4. Sense of recognition by peer 5. Effect of knowledge sharing of peer on decision making of students to share their knowledge
This division of questionnaire compromised four divisions within which these five items are presented. The four level of knowledge sharing practice of the respondents are D1, D2, D3, and D4. The aim was to calculate

Enhancing Knowledge Sharing Among Higher Education Students through Digital Game
149
Vol. III, Issue 3 June 2013
the students' perceived knowledge sharing in dissimilar situations and these divisions have been concluded: (D1) the researcher assumed that both of player and his/her peer share the knowledge during playing the game, (D2) the researcher assumed that the player shares the knowledge but his/her peer does not share the knowledge during playing the game, (D3) the researcher assumed that the player does not share the knowledge but his/her peer shares the knowledge during playing the game, (D4) the researcher assumed that neither player nor his/her peer share the knowledge during playing the game. These situations are illustrated in Table 5.
Table 5: Four Situations in Knowledge Sharing
Data Collection and Analysis
The survey tool was managed by an online questionnaire. The online survey tool was developed on My3Q website. The period that survey got distributed was May 14 to May 28, 2012. Invitation emails having a hyperlink to the online questionnaire were sent to a sample of 34 students. A reminder mail was sent to the respondents after one week again. But as the statistic shows, only 30 participants went through online questionnaire during the survey time. Characteristics of participants are shown in Table 6. After that, Table 7 shows Cronbach’s Alpha, standard deviation and mean scores gained from four situations in the survey.
The researcher calculated the reliability test since it provides validity. Using the data file and calculating the reliability test, Cronbach’s Alpha for the four situations are shown in Table 7. Several researchers like Cooper and Schindler (2006), and Iacobucci and Duhachek (2003) asserted that, as a rule of thumb, a reliability test should be 0.7 or above. For testing H1 and H2, it was suitable to employ ANOVA and T-‐Test. By applying ANNOVA test, D1, D2, D3 and D4 were gained to have different variances (p < 0.05). It indicates that in different situation the student’s perceived payoff
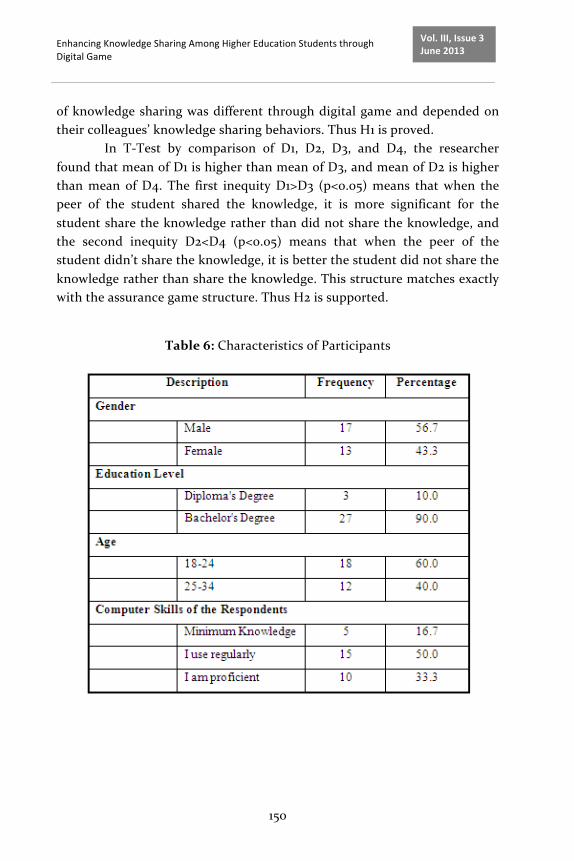
Enhancing Knowledge Sharing Among Higher Education Students through Digital Game
150
Vol. III, Issue 3 June 2013
of knowledge sharing was different through digital game and depended on their colleagues’ knowledge sharing behaviors. Thus H1 is proved.
In T-‐Test by comparison of D1, D2, D3, and D4, the researcher found that mean of D1 is higher than mean of D3, and mean of D2 is higher than mean of D4. The first inequity D1>D3 (p<0.05) means that when the peer of the student shared the knowledge, it is more significant for the student share the knowledge rather than did not share the knowledge, and the second inequity D2<D4 (p<0.05) means that when the peer of the student didn’t share the knowledge, it is better the student did not share the knowledge rather than share the knowledge. This structure matches exactly with the assurance game structure. Thus H2 is supported.
Table 6: Characteristics of Participants

Enhancing Knowledge Sharing Among Higher Education Students through Digital Game
151
Vol. III, Issue 3 June 2013
Table 7: Descriptive Statistics and Cronbach’s Alpha of Four Situations
Discussions
Firstly, because of D1, D2, D3 and D4 were gained to have different variances; it means that a student’s perceived payoff of knowledge sharing was different through digital game and depended on their colleagues’ knowledge sharing behavior s. The concept of payoff represents all of willingness and interests of students to share their knowledge while their peers share their knowledge. Therefore, the proof of H1 means that a student’s decision-‐making to share the knowledge is affected by the knowledge sharing behavior of his/her peer. Secondly, as it is shown, the most significant division is D1, followed by D3, D4, and D2. This statistic shows D1 has the highest score of mean in knowledge sharing behavior when both of the players shared their knowledge during playing game and they got most satisfaction in this situation. By comparing D1 and D4, the finding specified that both of the players desired to share their knowledge during playing the game rather than not to share their knowledge. By comparing D2 and D3, the findings specified that the player was satisfied when his/her peer shared the knowledge during playing the game and this situation had some positive effect on knowledge sharing behaviors of students.
Finally, (D1>D3) means that when the peer of the student shared the knowledge, it is more significant for the student share the knowledge rather than did not share the knowledge, and (D2<D4) means that when the peer of the student didn’t share the knowledge, it is better the student did not share the knowledge rather than share the knowledge. This structure matches exactly with the assurance game structure. Thus H2 is proved.
Enhancing Knowledge Sharing Among Higher Education Students through Digital Game
152
Vol. III, Issue 3 June 2013
Conclusions
The lack of knowledge sharing is one of the most important problems in knowledge management area. To solve this problem, this research tried to use a game theatrical framework for students who played digital game in the classroom context. The descriptive research was done among students in a higher education institute and the concept of knowledge sharing was limited to interaction of students during playing the digital game. This research showed that use of digital game in the classroom context was a successful way for enhancing knowledge sharing among students and it presented a digital game supported effective knowledge sharing between students. By analyzing the data in this research, it was proved; firstly an individual’s decision to share the knowledge was dependent on the knowledge sharing behavior of his/her peer. Secondly, the perceived payoff of sharing knowledge between two students can be characterized by assurance game. This view helps to describe for what reasons some incentives are successful in some organizations but be unsuccessful in other organizations. This study showed by using the digital game and providing suitable environment, it is possible to promote students to share their knowledge and increase the interaction between them. The results of this study have the following implications for managers and lecturers who want to enhance knowledge sharing among their students and their employees. It is necessary for them to recognize the concerns of their students and employee then provide a particular intervention to improve knowledge sharing process.
Appendix Survey
Demographic Information 1-‐Your gender (1) Male (2) Female 2-‐Your Education Level (1) Diploma's Degree (2) Bachelor's Degree (3) Master's Degree (4) PhD degree 3-‐Your Age

Enhancing Knowledge Sharing Among Higher Education Students through Digital Game
153
Vol. III, Issue 3 June 2013
(1) 18-‐24 (2) 25-‐34 (3) 35-‐44 (4) 55 > 4-‐Your Computer Skill (1) No Knowledge (2) Minimum Knowledge (3) I use regularly (4) I am proficient Knowledge Sharing Practice Division 1: Assuming that BOTH you and your per share the knowledge during playing the game. 5-‐How do you think this situation will affect your level of understanding about the topic of the game? (1) Lose a lot (2) Lose some (3) Neutral (4) Gain some (5) Gain a lot 6-‐How do you think this situation will affect your self-‐esteem? (1) Lose a lot (2) Lose some (3) Neutral (4) Gain some (5) Gain a lot 7-‐How do you think this situation will affect your sense of recognition by your peer? (1) Lose a lot (2) Lose some (3) Neutral (4) Gain some (5) Gain a lot 8-‐How do you think this situation will affect your efficiency in doing your tasks? (1) A lot of negative affect (2) some negative affect (3) Neutral (4) some positive affect (5) A lot of positive affect 9-‐How do you think the level of knowledge sharing of your peer affect your decision to share your knowledge? (1) A lot of negative affect (2) Some negative affect (3) Neutral (4) Some positive affect (5) A lot of positive affect Division 2: Assuming that you share the knowledge during playing the game but your peer DOSE NOT. 10-‐How do you think this situation will affect your level of understanding about the topic of the game? (1) Lose a lot (2) Lose some (3) Neutral (4) Gain some (5) Gain a lot 11-‐How do you think this situation will affect your self-‐esteem? (1) Lose a lot (2) Lose some (3) Neutral (4) Gain some (5) Gain a lot 12-‐How do you think this situation will affect your sense of recognition by your peer? (1) Lose a lot (2) Lose some (3) Neutral (4) Gain some (5) Gain a lot

Enhancing Knowledge Sharing Among Higher Education Students through Digital Game
154
Vol. III, Issue 3 June 2013
13-‐How do you think this situation will affect your efficiency in doing your tasks? (1) A lot of negative affect (2) Some negative affect (3) Neutral (4) some positive affect (5) A lot of positive affect 14-‐How do you think the level of knowledge sharing of your peer affect your decision to share your knowledge? (1) A lot of negative affect (2) some negative affect (3) Neutral (4) Some positive affect (5) A lot of positive affect Division 3: Assuming that your peer shares the knowledge during playing the game but you DO NOT 15-‐How do you think this situation will affect your level of understanding about the topic of the game? (1) Lose a lot (2) Lose some (3) Neutral (4) Gain some (5) Gain a lot 16-‐How do you think this situation will affect your self-‐esteem? (1) Lose a lot (2) Lose some (3) Neutral (4) Gain some (5) Gain a lot 17-‐How do you think this situation will affect your sense of recognition by your peer? (1) Lose a lot (2) Lose some (3) Neutral (4) Gain some (5) Gain a lot 18-‐How do you think this situation will affect your efficiency in doing your tasks? (1) A lot of negative affect (2) Some negative affect (3) Neutral (4) Some positive affect (5) A lot of positive affect 19-‐How do you think the level of knowledge sharing of your peer affect your decision to share your knowledge? (1) A lot of negative affect (2) Some negative affect (3) Neutral (4) Some positive affect (5) A lot of positive affect Division 4: Assuming that NEITHER you nor your peer share the knowledge during playing the game. 20-‐How do you think this situation will affect your level of understanding about the topic of the game? (1) Lose a lot (2) Lose some (3) Neutral (4) Gain some (5) Gain a lot 21-‐How do you think this situation will affect your self-‐esteem?
Enhancing Knowledge Sharing Among Higher Education Students through Digital Game
155
Vol. III, Issue 3 June 2013
(1) Lose a lot (2) Lose some (3) Neutral (4) Gain some (5) Gain a lot 22-‐How do you think this situation will affect your sense of recognition by your peer? (1) Lose a lot (2) Lose some (3) Neutral (4) Gain some (5) Gain a lot 23-‐How do you think this situation will affect your efficiency in doing your tasks? (1) A lot of negative affect (2) Some negative affect (3) Neutral (4) Some positive affect (5) A lot of positive affect 24-‐How do you think the level of knowledge sharing of your peer affect your decision to share your knowledge? (1) A Lot of negative affect (2) Some negative affect (3) Neutral (4) Some positive affect (5) A lot of positive affect
References
[1] Halawi, L., McCarthy, R. & Aronson, J. (2008). An empirical investigation of knowledge management systems success. Journal of Computer Information Systems, 48 (2), 121-‐36.
[2] Apostolou, D., Mentzas, G., & Abecker, A. (2009). Managing knowledge at multiple organizational levels using faceted ontology. Journal of Computer Information Systems, 49(2), 32-‐50.
[3] Cho, N., Li, G. Z., & Su, C. Z. (2007). An empirical study on the effect of individual factors on knowledge sharing by knowledge type. Journal of Global Business and Technology, 3(2), 1-‐15.
[4] Chua, A. (2003). Knowledge Sharing: A Game People Play. Aslib Proceedings, 55(3), 117-‐129.
[5] Bent, S. (2007). Understanding your knowledge profile. Knowledge Management Review, 10(2), 24-‐7.
[6] Hendrix, D. (2007). Focusing on behavior and learning at Shell. Knowledge Management Review, 10(3), 8-‐13.
[7] Davenport, T. & Prusak, L. (1999). Working Knowledge. Boston, MA: Harvard Business School Press.
[8] Polanyi, M. (1958). Personal Knowledge: "Towards a Post-‐Critical Philosophy. University of Chicago Press, Chicago
Enhancing Knowledge Sharing Among Higher Education Students through Digital Game
156
Vol. III, Issue 3 June 2013
[9] Nonaka, I. (1994). A dynamic theory of organizational knowledge creation. Organization Science, 5(1), 14-‐37.
[10] Choi, B. & Lee, B. (2003). An empirical investigation of KM styles and their effect on corporate performance. Information and Management, 40(5), 403-‐417.
[11] West, P. & Meyer, G.D. (1997). Communicated knowledge as a learning foundation. International Journal of Organizational Analysis, 5(1), 25-‐58.
[12] Rogers, E.M. (1986). Communication Technology: The New Media in Society. New York, NY: Free Press.
[13] Dixon, N.M. (2000). Common Knowledge: How Companies Thrive by Sharing What They Know? Boston, MA: Harvard Business School Press.
[14] Lynne, M.M. (2001). Toward a theory of knowledge reuse: types of knowledge reuse situations and factors in reuse success. Journal of Management Information Systems, 18(1), 57-‐93.
[15] Alavi, M., & Leidner, D.E. (1999). Knowledge Management Systems: Issues, Challenges, and Benefits. Communications of Association of Information Systems, 1(7), 1-‐37.
[16] Salisbury, M. W. (2003). Putting theory into practice to build knowledge management systems. Journal of Knowledge Management, 7(2), 128-‐141.
[17] Van den Hooff, B., & De Ridder, J. A. (2004). Knowledge Sharing in Context: The influence of organizational commitment, communication climate and CMC use on knowledge sharing. Journal of Knowledge Management, 8(6), 117-‐130.
[18] Yang, J. (2007). The Impact of Knowledge Sharing on Organizational Learning and Effectiveness. Journal of Knowledge Management, 11(2), 83-‐90.
[19] Szulanski, G. (1995). Unpacking stickiness: an empirical investigation of the barriers to transfer best practice inside the firm. Academy of Management Journal, 38, 437-‐41.
[20] Sai, H.K., &Sheng, G. (2006). Attitude toward knowledge sharing behavior. The Journal of Computer Information System, 46(2), 45-‐51.
[21] Blau, P. (1964). Exchange and Power in Social Life Wiley, New York.
Enhancing Knowledge Sharing Among Higher Education Students through Digital Game
157
Vol. III, Issue 3 June 2013
[22] Molm, L.D. (2001). Theories of social exchange and exchange networks. In G. Ritzer & B. Smart (Eds.). Sage, London, 260-‐272.
[23] Gouldner, A.W. (1960). The Norm of Reciprocity: A Preliminary Statement. American Sociological Review, 25(2), 161-‐178.
[24] Cabrera, E. F., & Cabrera, A. (2005). Fostering knowledge sharing through people management practices. International Journal of Human Resource Management, 16, 720−735.
[25] Kankanhalli, A., Tan, B.C.Y., & Wei, K.K. (2005). Contributing knowledge to electronic knowledge repositories: an empirical investigation. MIS Quarterly, 29(1), 113-‐143.
[26] Ma, M., & Agarwal, R. (2007). Through a Glass Darkly: Information Technology Design, Identity Verification, and Knowledge Contribution in Online Communities. Information Systems Research, 18(1), 42 -‐ 67.
[27] Chiu, C.M., Hsu, M.H., & Wang, E.T.G. (2006). Understanding Knowledge Sharing in Virtual Communities: An Integration of Social Capital and Social Cognitive Theories. Decision Support Systems, 42(3), 1872-‐ 1888.
[28] Lee, J.H., Kim, Y.G., & Kim, M.Y. (2006). Effects of managerial drivers and climate maturity on knowledge management performance: empirical validation. Information resources management Journal, 19(3), 48-‐60.
[29] Aumann, R. (1987). Game theory. The New Palgrave: A Dictionary of Economics, 2, 460-‐82.
[30] Ho, C. T. B., Hsu, S. F., & Oh, K. (2009). Knowledge sharing: game and reasoned action perspectives. Industrial management & data systems, 109, 1211-‐1230.
[31] Dixit, A., & Skeath, S. (1999). Games of Strategy. WW Norton and Company, New York, NY.
[32] Kay, J. (1995). Foundations of Corporate Success. Oxford University Press, New York, NY.
[33] Cooper, D. R., & Schindler, P. S. (2006). Business research methods (9 Ed.). New York: McGraw-‐Hill Irwin.
[34] Iacobucci, D., & Duhachek, A. (2003). Advancing Alpha: Measuring Reliability with Confidence. Journal of Consumer Psychology, 13 (4), 478-‐487.
Scientific Papers (www.scientificpapers.org) Journal of Knowledge Management, Economics and Information Technology
158
Vol. III, Issue 3 June 2013
Distributors’ Knowledge Sharing Competency (DKSC): Scale Generation and Development Process
Authors: Hedia Maamri, Institut Supérieur de Gestion (ISG), University of Tunis, Tunis, [email protected], Abdelfattah Triki, Institut Supérieur de Gestion of Tunis University,Tunis
Purpose – The present paper aims to generate and validate a measurement scale of the distributor knowledge sharing competency (DKSC). Design/methodology/approach: -‐ A pool of 50 items were generated on the basis of in-‐depth interviews with managers and was analysed using the ‘‘Sphinx’’ software. -‐ Exploratory Factor Analysis is performed in order to purify the scale measurement (09 items are retained). -‐ Confirmatory Factor Analysis is performed in order to assess the reliability and validity of measure (07 items are retained). Findings – A pool of 07 items is proposed for the eventual measurement of the DKSC. Practical implications a valid and reliable measure of DKSC has been developed illustrating a knowledge-‐based innovation capability measurement. The measurement scale was found to be unidirectional that confirm an interconnection between the two facets of the construct; the firm’s capability and distributors’ competency. It proposes an integrative comprehension of various notions that provide a more holistic picture of Knowledge-‐based capability. The proposed DKSC scale is believed to provide managers with the opportunity to regularly monitor their distributor’s relationship and its innovative capability.
9
Distributors’ knowledge sharing competency (DKSC): scale generation and development process
159
Vol. III, Issue 3 June 2013
Keywords: Distributor’s knowledge; Knowledge management; Innovativeness; Measurement scale
Introduction
Firms are going beyond operational efficiency and are being structured to pursue higher order goals such as understanding new market dynamics, discovering competitors’ arrangements to provide greater customer value, and achieve long-‐term competitiveness (Eisenhardt and Schoonhoven 1996). So, hanging and encouraging knowledge sharing process is become a critical imperative in marketing channels interactions.
In fact, relationships within the distribution channel must be mentioned. They are generated by redefining the channel structure, the relations between the different channel members, the processes that link the distribution network, the information and knowledge management system that communicates the whole network, , as well as generating collective knowledge for developing continued improvement of innovation processes and market information.
Along the value-‐added chain (Porter, 1985), goods and services move from supplier to firm to distributor to consumer and are carried through two distinctive types of marketing channels: communication channels, and distribution channels, and distribution channels; 1) Distribution channel which mean "a mechanism through which a product or service can be selected, purchased/ordered, and received by a segment of the firm's customers." In other words, it consists on the transactional activities related to the physical exchange of products and services between buyers and sellers, (Peterson et al, 1997) and (2) communication channels which enable the flow of various types of information between buyers and sellers.
Accordingly, for the former type of exchange (distribution channels), the manufacturers’ distributors’ relationship is based on transactional exchanges associated with production and sales In this context, communications technology play a critical role to help distributors as well as manufacturers to gather and monitor their business transactions. Communications technology enables distributors to store data relating to
Distributors’ knowledge sharing competency (DKSC): scale generation and development process
160
Vol. III, Issue 3 June 2013
transactional activities systematically and in real time; e.g. the use of EDI or largest program ECR enables performing the routine transactions between trading partners and developing closer relationships between distributors and suppliers (Kurt Salmon Associates, 1993).
However, communication channels which are based on relational exchanges can be associated with the partnering role of distributors. In this context, the distributor needs to have a sophisticated knowledge about the firm’s strengths and weaknesses and opportunities and threats. This knowledge is needed to identify opportunities and approaches for creating value.
Distributors can be considered as a partner and as a knowledge provider to the firm. His closeness to the final customers as well as the competitors allowed him to acquire competence to collect, interpret then transfer more accurate and reliable knowledge that once assimilated, transformed and exploited by the firm can enhance its innovativeness. Distributors’ knowledge sharing competency (DKSC) is considered as a new concept that translates the organizational capability to encourage, explore, and use distributors’ competency to share his market knowledge so as to arise and improve innovativeness.
The DKSC is an integrative concept that draws from various conceptualizations such as supply chain management, knowledge-‐based view, dynamic capability and the absorptive capacity. Indeed, with the technology transfer and innovation research, scholars have identified a number of variables that can affect a successful knowledge-‐sharing notably the source’s knowledge-‐sharing competency, the recipient’s learning mind-‐set and capability (Yeung et al, 1999), the relationship between the source and the recipient (Hansen, 1999) and the broader environment in which the sharing occurs (Cummings, 2003).
This study underlines the centrality sales chain management networks to firm’s innovativeness (section I), and develop a measurement scale reliable and valid applying Churchill paradigm (section II).
Literature review
Sharing knowledge with distributors has as primary objective “transaction cost economics” (TCE); in other terms, the minimization of ‘‘the total cost of transportation, warehousing, inventory, order processing and information
Distributors’ knowledge sharing competency (DKSC): scale generation and development process
161
Vol. III, Issue 3 June 2013
systems’’ (Stock and Lambert, 1987). Progressively, firms are orienting their attention to coordinate activities across the sales chain to create value for customers (Anderson et al., 1997). In fact, the nature of information exchanged between sale chain partners has evolved from limited information sharing to sharing of rich knowledge that can anticipate opportunities and prevent firms from threats.
One of the classical examples of this shared operation is the partnership between Procter & Gamble P&G and Wal-‐Mart. In fact, Wal-‐Mart does more than just distribute Procter & Gamble's goods. It has a customer database that contains around 43 tera-‐bytes of data and shares daily sales information and works with P&G in product warehousing and replenishment. Thus, the firm proposes more competitive goods that respond to consumers’ preferences (Shaw et al, 2001). Channel members must be taken into account when developing conceptual frameworks, deciding on settings for empirical studies, and interpreting empirical results. The sharing of channel members’ intelligence can be thought of as information on the marketplace processed and retained by channel members that could potentially collect information about customer’s needs, competitive tactics and strategies, market trends and developments of new products, technological advances, and the business environment in general. Moreover, distributors have great communication with their suppliers, alternative suppliers, competitors, trade associations, and so forth (Siguaw et al 1998). Thus, distributors are more knowledgeable about their industry, which results in a greater knowledge and a broader basis of comparison with their suppliers (Anderson and Narus 1984; Thibaut and Kelley 1959). This knowledge base of distributors with external benchmarks enables firms to compare their market orientation with alternative suppliers and to reduce their decision making uncertainty (Huber, 1990).
As a result, engaging in a dialogue with diverse and evolving distribution channels will place a high premium on organizational flexibility. In fact, as business models are revised and new challenges and opportunities emerge, the organization will constantly have to reconfigure strategies and to be more innovative. Thus, the firm with global sales chain partnerships has the possibility to access the marketing knowledge, standards of knowledge interchange, and sharing of applications that become critical success factors to gain competitive advantage.

Distributors’ knowledge sharing competency (DKSC): scale generation and development process
162
Vol. III, Issue 3 June 2013
Sales chain network and open innovation
It is generally assumed that inter-‐firm networks foster the condition for innovation by allowing information sharing and knowledge transfer. It represents a fast means of gaining access to knowledge that cannot be produced internally. Hence, distributors that have evolved in close relationship with the firm can process and create intricate webs of information. Consequently, they may be involved in bringing new knowledge, differing logics and novel combinations of information that are critical to innovation ideas (Freeman, 1991).
Different network positions represent different opportunities for an individual firm to access. Centrally located firms with access to a greater variety of activities are better able to locate themselves in knowledge rich positions. This access to knowledge allows the assumption that firms which are more centrally located will have greater access to knowledge and thus, yielding greater probability of innovation. A firm occupying a more central position in an interwoven network is likely to accelerate the rate of innovation.
So, we have proposed DKSC as a new concept that is not apprehended as a stock or a set of useful and organized information as advocated by some authors (Liu et al, 2009; Frazier 2009) but it translates the organizational capability to encourage, explore, and use distributors’ competency to share his market knowledge so as to arise and improve innovativeness. Two main dimensions are believed to encompass the DKSC: distributors’ competency and firm’s capability. Each of these two dimensions has a knowledge component attached to it.
Distributor’ competency involves individual’s ability to perform a specific task in this case sharing valuable and accurate knowledge, using his know how and based on his skills, experiences and his best practice (Vincen, 2008).
Firm’s capability dimension pertains to the faculty or process that a firm improves to create and to change us routines, services, products, and even markets over time. It require organization’s capability to acquire assimilate, absorb, manage and integrate new information with old knowledge in order to construct new knowledge that can lead to enhance its innovativeness.
Distributors’ knowledge sharing competency (DKSC): scale generation and development process
163
Vol. III, Issue 3 June 2013
Methodology
DKSC is a new construct that has not measured previously. In order to propose a measurement scale, we have applied the paradigm of Churchill, (1979) for scale generation and development.
1. Exploratory qualitative study: First we have undertaken an exploratory qualitative study using in-‐
depth interviews. The objective of this exploratory study is to understand to what extent and under what circumstances the organization’s capability to effectively manage distribution knowledge can lead to improve and enhance innovativeness. The sample was composed of Tunisian organizations from different activity sectors as shown in Appendix.1. In-‐depth interviews were carried out with marketing managers, new product managers, R&D managers, and Development Manager using tape recordings and writing field notes. The interview’s questions are drawn from the DKSC dimensions as shown in Appendix.2
Interviewees’ verbatim were reviewed and transcribed into a computer file then coded and analyzed using data analysis software in order to generate a pool of items for eventual DKSC measurement. The software used is Sphinx; it offers several ways to navigate (or surf) the text, identify themes and dimensions of analysis. Also, it provides a range of tools for the codification of text which can be treated.
On the basis of in-‐depth interviews and the extant literature, a pool of 50 items is derived in coherence with the definitions of the construct dimensions for eventual DKSC measurement.
2. Exploratory factor analysis for DKSC scale purification: The purpose here is to show the factor structure of the DKSC scale
that actually emerges from empirical data. To do so, an exploratory factor analysis is performed in order to purify the developed scale and to examine its psychometric properties.
The aim of this section is to optimize the measurement scale of the new construct DKSC by reducing their number by preserving internal consistency, reliability and without lowering their predictive value. Items are evaluated using principal components analysis and assessing factor loadings corrected item-‐to-‐total correlations, and Alpha coefficient. Kaiser–Meyer–Olkin (KMO) tests of sampling adequacy are used to determine the appropriateness of the data for factor analysis.
Distributors’ knowledge sharing competency (DKSC): scale generation and development process
164
Vol. III, Issue 3 June 2013
Hence, a pilot study is administrated to a convenience sample of 50 firms; in fact, DKSC is proposed to be applied to organization evaluation. It is believed to provide managers with the opportunity to be close to their distributors to regularly monitor their innovative capability. So, we addressed and asked directly the managers such as marketing manager, new product managers and R&D managers.
The responding managers are contacted at their workplace or by e-‐mail with a request to participate in a preliminary survey for research purposes, and to complete and return the attached electronic document that contained the questionnaire that integrate the list of DKSC items.
a) Appropriateness of exploratory factor analysis:
Exploratory Factor analysis is a statistical method used to uncover the underlying structure of a relatively large set of variables. It identifies representative variables from a much larger set of variables for use in subsequent multivariate analysis. In other words, it consists on reducing the number of the original scale by preserving the nature and character in order to simplify the subsequent multivariate analysis (Hair et al, 1998).
Factor analysis is considered to be applied to our data set for tow raisons. First, the visual inspection reveals a substantial number of correlations greater than .30 which is an indication that factor analysis is appropriate (Hair et al., 1998). Factor analysis is concerned with the homogeneity of items. A pattern of low correlations indicates a heterogeneous set of items (Stewart, 1981, p. 57). Second, Kaiser, Meyer and Olkin have developed the "measure of sampling adequacy" (MSA) test, which has become the standard test procedure for the factor analysis. The Kaiser-‐Meyer-‐Olkin measure of sampling adequacy tests whether or not the partial correlations among variables are small.
The MSA criterion indicates the degree to which the variables are related, and it thus helps in evaluating if using a factor analysis makes sense. The index ranges from 0 to 1 and can be interpreted with the following calibration: .90+ marvelous; .80+ meritorious; .70+ middling; .60+ mediocre; 50+ miserable; below .50 unacceptable.
After having obtained the correlation matrix, it is time to decide which type of analysis to use factor analysis or principal component analysis. PCA is used when the research purpose is data reduction. Factors, properly called components, reflect the common variance of variables plus the unique
Distributors’ knowledge sharing competency (DKSC): scale generation and development process
165
Vol. III, Issue 3 June 2013
variance. That is, manifest variables may be conceptualized as reflecting a combination of total variance explained by the components, plus error variance not explained by the components. Components seek to reproduce the total variable variance as well as the correlations, That is, PCA accounts for the total variance of the variables. While PFA, is used when the research purpose is causal modeling. PFA seeks the least number of factors which can account for the common variance shared by a set of variables (Schwarz, 2011). Based on that, we have adopted principal component analysis.
Furthermore, according to Field, (2000) three criteria deciding the number of factor to extract:
• Kaiser’s eigenvalue-‐greater-‐than-‐one: Retain only those factors with an eigenvalue larger than 1 (Guttman-‐Kaiser rule);
• The scree-‐test criterion: involves the visual exploration of a graphical representation of the eigenvalues. In this method, the eigenvalues are presented in descending order and linked with a line. The point at which the curve first begins to straighten out is considered to indicate the maximum number of factors to extract.
• Percentage of variance criterion: Keep the factors which, in total, account for about 70-‐80% of the variance. In our case; according to many applications we accept to retain factors that explain at least 50% of the total variance.
The first iteration reveals 14 axes verifying Eigen values greater than
1 with their relative explanatory power as expressed by their Eigen values. As it is shown in the table 8.1 the one factor solution is deemed appropriate. Many of the original items have high loadings with the first factor and some with another factor, but without meaningful consistency. Moreover, the first tend to be a general factor with almost every item loading significantly, and it accounts for the largest amount of variance (24,856%) across the three data sets. The second and subsequent factors are then based on the residual amount of variance and show lower values. This allows us to think a priori to the unidimensionality of the construct.
Following iteration 1, inspection of the anti-‐image correlation matrix showed that all items satisfied this criterion (MSA>0.5) except items (12, 13, 17, 19, 25, 30 and 33).
Also Items (1), (2), (6), (7), (9), (20), (36), (37), (39), (41), (43) and (49) were eliminated because they were correlated simultaneously to factor 1
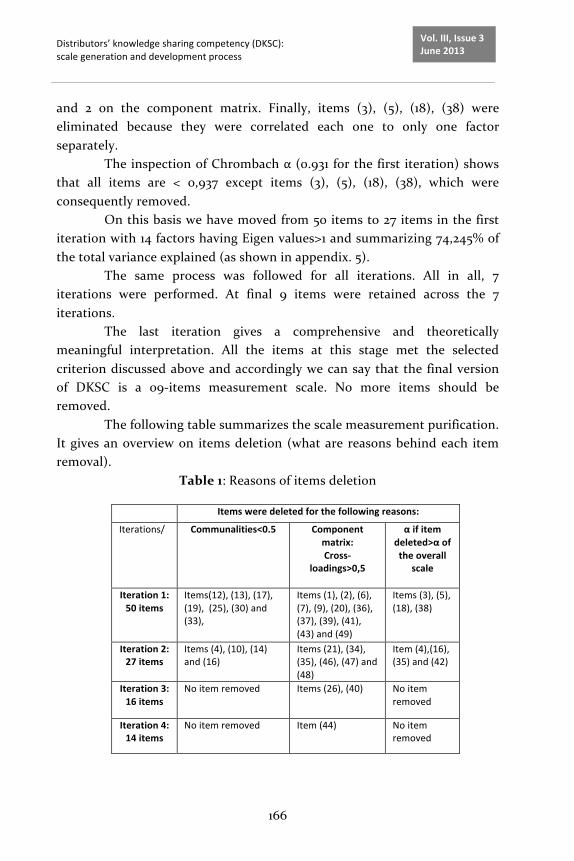
Distributors’ knowledge sharing competency (DKSC): scale generation and development process
166
Vol. III, Issue 3 June 2013
and 2 on the component matrix. Finally, items (3), (5), (18), (38) were eliminated because they were correlated each one to only one factor separately.
The inspection of Chrombach α (0.931 for the first iteration) shows that all items are < 0,937 except items (3), (5), (18), (38), which were consequently removed.
On this basis we have moved from 50 items to 27 items in the first iteration with 14 factors having Eigen values>1 and summarizing 74,245% of the total variance explained (as shown in appendix. 5).
The same process was followed for all iterations. All in all, 7 iterations were performed. At final 9 items were retained across the 7 iterations.
The last iteration gives a comprehensive and theoretically meaningful interpretation. All the items at this stage met the selected criterion discussed above and accordingly we can say that the final version of DKSC is a 09-‐items measurement scale. No more items should be removed.
The following table summarizes the scale measurement purification. It gives an overview on items deletion (what are reasons behind each item removal).
Table 1: Reasons of items deletion
Items were deleted for the following reasons:
Iterations/ Communalities<0.5 Component matrix: Cross-‐
loadings>0,5
α if item deleted>α of the overall
scale
Iteration 1: 50 items
Items(12), (13), (17), (19), (25), (30) and (33),
Items (1), (2), (6), (7), (9), (20), (36), (37), (39), (41), (43) and (49)
Items (3), (5), (18), (38)
Iteration 2: 27 items
Items (4), (10), (14) and (16)
Items (21), (34), (35), (46), (47) and (48)
Item (4),(16), (35) and (42)
Iteration 3: 16 items
No item removed Items (26), (40) No item removed
Iteration 4: 14 items
No item removed Item (44) No item removed

Distributors’ knowledge sharing competency (DKSC): scale generation and development process
167
Vol. III, Issue 3 June 2013
Iteration 5: 13 items
Item (8) No item removed Item (27)
Iteration 6: 11 items
Items (50) and (29) No item removed No item removed
Iteration 7: 9 items
No item removed No item removed No item removed
Finally, the Bartlett’s Test of Sphericity, a statistical test for the
presence of correlations among the variables, reveals also if the application of factor analysis to data sets is both unwarranted and misleading or not. Principal Components Analysis requires that the Bartlett’s Test of Sphericity is below the level of significance. As shown in table 8.4, this condition is also satisfied as p<0.001.
The following table summarizes the exploratory analysis factor coefficient regarding 7th iteration.
Table 2: Summary of the EAF regarding 7th iteration
Iteration
s
α
coefficien
t
KM
O
Bartlett Test of
Sphericity
Numbe
r of
axis
having
Eingen
value>
1
% of
cumulate
d
variance
% of
variance
recapitulate
d by the
first axis
Approx
. Chi-‐
quare
df Sig.
Iteration
7
.876 .766 196.07
4
3
6
.00
0
2 62.282 50.586
According to the above, we can admit that the data given by the 7th
iterations are appropriate as all criterions are satisfied. The 09 items retained seem to be a relevant tool for measurement of the distributor’s knowledge sharing competency without lowering its predictive value.
b) Deriving factors:
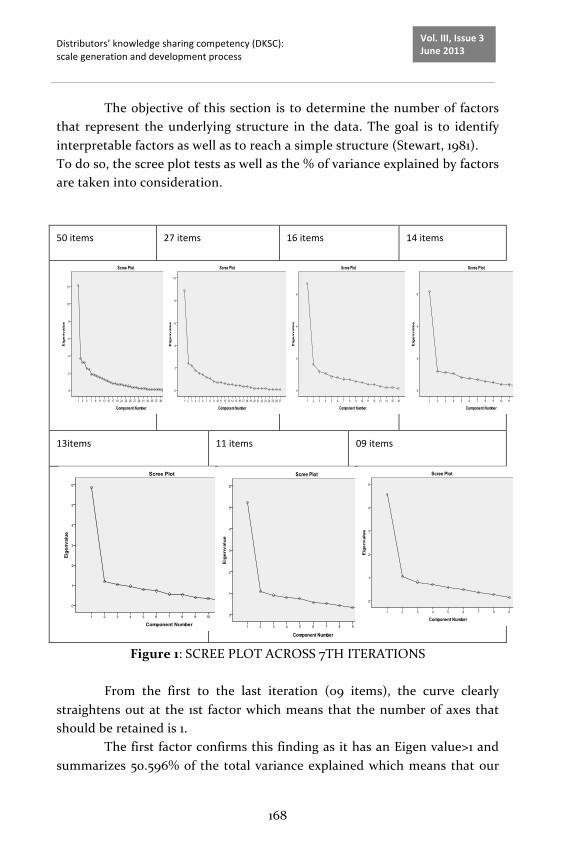
Distributors’ knowledge sharing competency (DKSC): scale generation and development process
168
Vol. III, Issue 3 June 2013
The objective of this section is to determine the number of factors that represent the underlying structure in the data. The goal is to identify interpretable factors as well as to reach a simple structure (Stewart, 1981). To do so, the scree plot tests as well as the % of variance explained by factors are taken into consideration.
50 items 27 items 16 items 14 items
13items 11 items 09 items
Figure 1: SCREE PLOT ACROSS 7TH ITERATIONS
From the first to the last iteration (09 items), the curve clearly straightens out at the 1st factor which means that the number of axes that should be retained is 1.
The first factor confirms this finding as it has an Eigen value>1 and summarizes 50.596% of the total variance explained which means that our

Distributors’ knowledge sharing competency (DKSC): scale generation and development process
169
Vol. III, Issue 3 June 2013
DKSC scale tends to be unidirectional. This result confirms the theoretical underpinning of the construct. The following component matrix summarizes this result.
Table 3: Retained items features
Communalities for the 09-‐items scale across the three data sets are
provided in table 3. All communalities were greater than 0.50. Hence, loadings are considered good.
Kaiser–Meyer–Olkin tests of sampling adequacy and Bartlett tests of sphericity indicated that the data were appropriate for factor analysis. The final version of the DKSC includes 09 items.
The retained items for DKSC measurement are the following:
DISTRIBUTORS4 KNOWLEDGE SHARING COMPETENCY (DKSC ) DKSC1-‐ Distributors have the competency to ask relevant questions and to
listen to customers.
DKSC2-‐ We can rely on distributors to detect customers’ needs in terms of
functions, forms, price, promotions, services, and credit/terms in order to
fine-‐tune the marketing mix.
DKSC3-‐ Distributors provide us with information about eventual
opportunities and threats.
DKSC4-‐ We draw upon distributors’ suggestions to launch new
products/services.
Retained items after EFA KMO α α if item deleted
communalities Factor loading
DKSC scale measurement (09 items)
Item11
0,766
0,876
.862 .611 .714 Item 15 .935.859 .594 .744 Item 22 .933.861 .611 .736 Item 23 .934.867 .636 .654 Item 24 .934.869 .537 .644 Item 28 .933.863 .665 .702
Item 31 .932.856 .609 .769 Item 32 .933.864 .609 .696 Item 45 .934.859 .733 .733
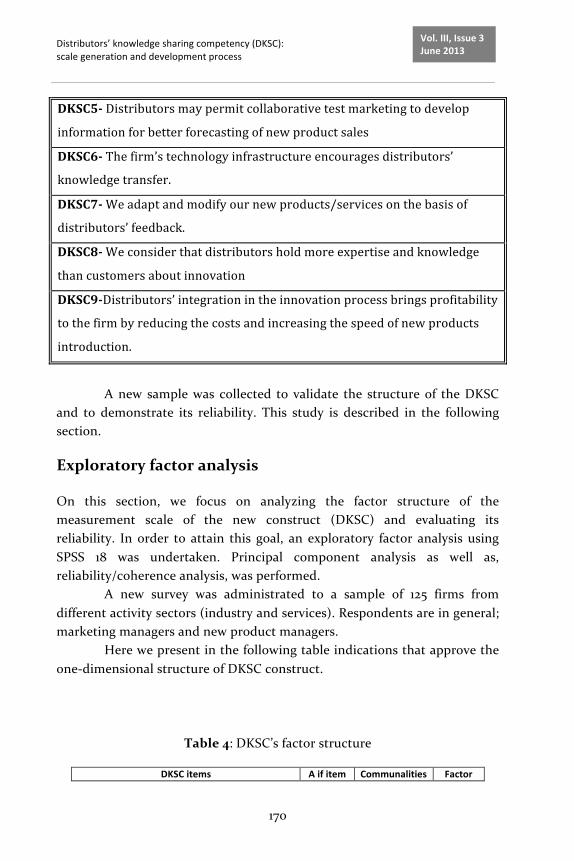
Distributors’ knowledge sharing competency (DKSC): scale generation and development process
170
Vol. III, Issue 3 June 2013
DKSC5-‐ Distributors may permit collaborative test marketing to develop
information for better forecasting of new product sales
DKSC6-‐ The firm’s technology infrastructure encourages distributors’
knowledge transfer.
DKSC7-‐ We adapt and modify our new products/services on the basis of
distributors’ feedback.
DKSC8-‐ We consider that distributors hold more expertise and knowledge
than customers about innovation
DKSC9-‐Distributors’ integration in the innovation process brings profitability
to the firm by reducing the costs and increasing the speed of new products
introduction.
A new sample was collected to validate the structure of the DKSC
and to demonstrate its reliability. This study is described in the following section.
Exploratory factor analysis
On this section, we focus on analyzing the factor structure of the measurement scale of the new construct (DKSC) and evaluating its reliability. In order to attain this goal, an exploratory factor analysis using SPSS 18 was undertaken. Principal component analysis as well as, reliability/coherence analysis, was performed.
A new survey was administrated to a sample of 125 firms from different activity sectors (industry and services). Respondents are in general; marketing managers and new product managers.
Here we present in the following table indications that approve the one-‐dimensional structure of DKSC construct.
Table 4: DKSC’s factor structure
DKSC items Α if item Communalities Factor
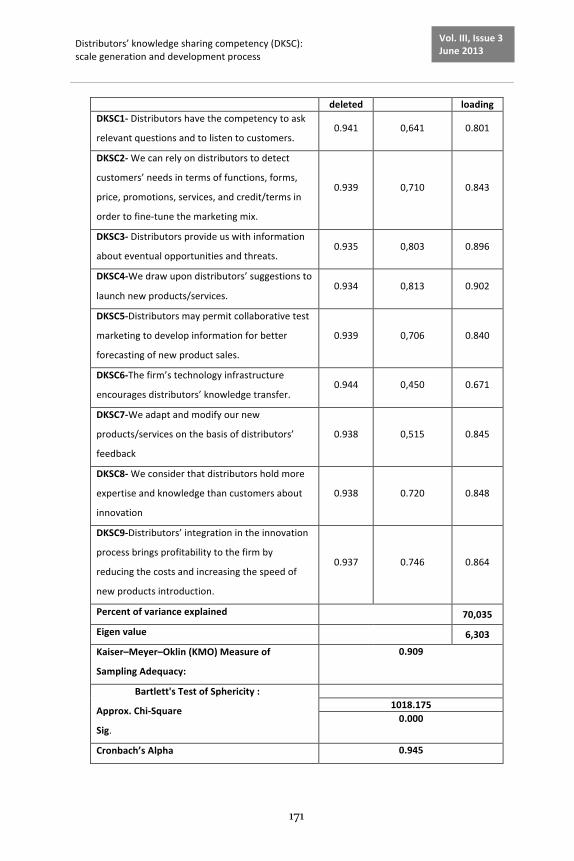
Distributors’ knowledge sharing competency (DKSC): scale generation and development process
171
Vol. III, Issue 3 June 2013
deleted loading DKSC1-‐ Distributors have the competency to ask
relevant questions and to listen to customers. 0.941 0,641 0.801
DKSC2-‐ We can rely on distributors to detect
customers’ needs in terms of functions, forms,
price, promotions, services, and credit/terms in
order to fine-‐tune the marketing mix.
0.939 0,710 0.843
DKSC3-‐ Distributors provide us with information
about eventual opportunities and threats. 0.935 0,803 0.896
DKSC4-‐We draw upon distributors’ suggestions to
launch new products/services. 0.934 0,813 0.902
DKSC5-‐Distributors may permit collaborative test
marketing to develop information for better
forecasting of new product sales.
0.939 0,706 0.840
DKSC6-‐The firm’s technology infrastructure
encourages distributors’ knowledge transfer. 0.944 0,450 0.671
DKSC7-‐We adapt and modify our new
products/services on the basis of distributors’
feedback
0.938 0,515 0.845
DKSC8-‐ We consider that distributors hold more
expertise and knowledge than customers about
innovation
0.938 0.720 0.848
DKSC9-‐Distributors’ integration in the innovation
process brings profitability to the firm by
reducing the costs and increasing the speed of
new products introduction.
0.937 0.746 0.864
Percent of variance explained 70,035
Eigen value 6,303
Kaiser–Meyer–Oklin (KMO) Measure of
Sampling Adequacy:
0.909
Bartlett's Test of Sphericity :
Approx. Chi-‐Square
Sig.
1018.175 0.000
Cronbach’s Alpha 0.945

Distributors’ knowledge sharing competency (DKSC): scale generation and development process
172
Vol. III, Issue 3 June 2013
Assessing reliability and validity of DKSC
The previous section of assessing scales reliabilities is exploratory and needs to be confirmed. So, Confirmatory Factor Analysis is performed in order to assess the degree to which the specified indicators for each construct did indeed measure the intended construct. CFA is used to evaluate the degree of fit between the actual or observed input on the covariance or the correlation matrix, with the one predicted from the researcher-‐defined model. Unidimensionality is demonstrated when the indicators of a construct have acceptable fit on a single-‐factor (Hair et al., 1998, p.611)
The initial model reveals a bad fit. The χ² (27) = 185.69 (P<0.001) and the χ² /ddl ratio falls outside of the 2-‐5 range. The RMSEA value is above the 0, 08 levels that is indicative of acceptable fit. The GFI value does not reach the 0, 9 levels required to indicate good fit. The incremental fit indices of the DKSC measurement model such as AGFI, NFI, are inferior to 0, 9 which is indicative of inadequate fit.
As all the items have high loading less than 1.00 and as there aren’t negative error variances or insignificant error variances, the specification process is assisted by the inspection of standardized residuals and modification indices to identify items that cause unacceptable fit. We delete items that have high standardized residuals in absolute value.
The problem of misspecification seems, to be caused particularly by the item DKSC1 that has standardized residuals with the item DKSC2 being greater than 2.58 and which if an error covariance is specified would contribute to better model fit represents the expected drop in. setting the error covariance between the two items give an unacceptable model fit (χ² (26) = 129.3 (P<0.001); AGFI =0.805; AGFI=0.662).
Model specification based on removing the DKSC1 is undertaken. The model fit still not acceptable. It is possible one further specification adding an error covariance between DKSC2 and DKSC3 as suggested by modification indices and removing DKSC6 that have low factor loading (0.53) and high standardized residuals can improved the model fit (see table 5).
Table.5: Fit measures of the DKSC construct
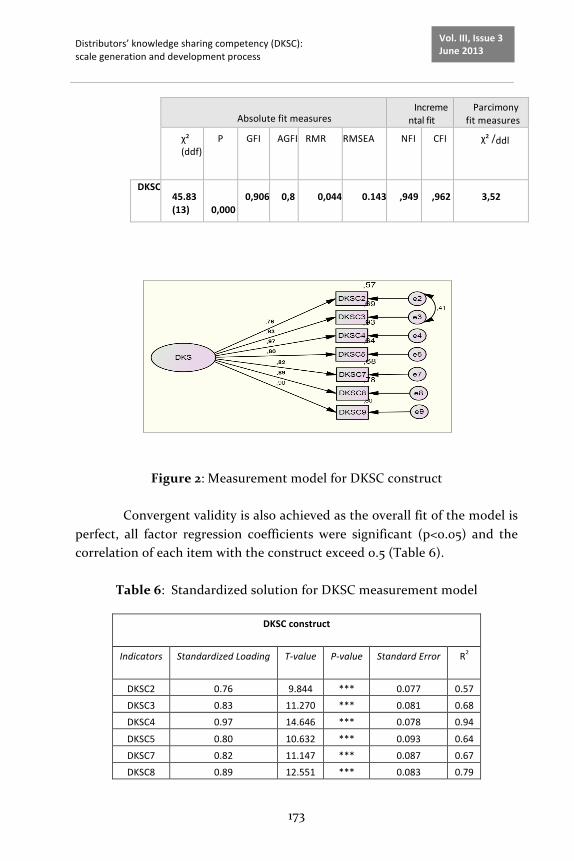
Distributors’ knowledge sharing competency (DKSC): scale generation and development process
173
Vol. III, Issue 3 June 2013
Absolute fit measures
Incremental fit
measures
Parcimony fit measures
χ² (ddf)
P GFI AGFI RMR RMSEA NFI CFI χ² /ddl
DKSC 45.83 (13)
0,000
0,906
0,8
0,044
0.143
,949
,962
3,52
Figure 2: Measurement model for DKSC construct
Convergent validity is also achieved as the overall fit of the model is
perfect, all factor regression coefficients were significant (p<0.05) and the correlation of each item with the construct exceed 0.5 (Table 6).
Table 6: Standardized solution for DKSC measurement model
DKSC construct
Indicators Standardized Loading T-‐value P-‐value
Standard Error R2
DKSC2 0.76 9.844 *** 0.077 0.57 DKSC3 0.83 11.270 *** 0.081 0.68 DKSC4 0.97 14.646 *** 0.078 0.94
DKSC5 0.80 10.632 *** 0.093 0.64 DKSC7 0.82 11.147 *** 0.087 0.67 DKSC8 0.89 12.551 *** 0.083 0.79

Distributors’ knowledge sharing competency (DKSC): scale generation and development process
174
Vol. III, Issue 3 June 2013
DKSC9 0.90 12.809 *** 0.083 0.81 The composite reliability=0.87 The variance-‐extracted = 0.5
The composite reliability: (0,76+0,83+0,97+0,80+0,82+0,89+0,9)2/[(0,76+0,83+0,97+0,80+0,82+0,89+0,9)2+(0,57+0,69+0,93+0.64+0,68+0,78+0,80)]= 0.87.
The variance-‐extracted: (0,762+0,832+0,972+0,802+0,822+0,892+0,92)/[(0,762+0,832+0,972+0,802+0,822+0,892+0,92)+(0,57+0,69+0,93+0.64+0,68+0,78+0,80) ]= 0.5
Conclusions
The present research conceptualizes firm’s innovativeness capability in which distributor’s knowledge competency is embedded in. it provides a theory for modeling the relationships between firm’s innovativeness and distributors’ knowledge management. By apprehending that distributors may be considered as a strategic actor to help and enhance firms on their opening to innovativeness, a new construct labeled Distributors Knowledge Sharing Competency (DKSC) is proposed; it is believed to enrich our understanding of innovation management.
Various methodologies were utilized and several intermediate steps were taken for scale generation and development process. As first step in-‐depth interviews were used. Verbatim analyses were performed using Sphinx software. On the basis of in-‐depth interviews and on previous literature, a 5 items scale was proposed as a tool for DKSC measurement.
In the second step, a preliminary survey was conducted to purify the 50 items scale and to examine their psychometric properties. Then, we have conducted an exploratory factor analysis was conducted on a convenience sample of 50 firms. Principal Axis Factoring (PAF) and reliability analyses were used for DKSC operationalization. The results have shown that DKSC is a unidirectional measurement scale. As a result of EFA, 9 items were retained. At final and after the confirmatory factor analysis 7 items were retained for the DKC measurement scale.
By deploying a DKSC, the firm acknowledges the importance of their distributors in developing an advanced market orientation. Second, by

Distributors’ knowledge sharing competency (DKSC): scale generation and development process
175
Vol. III, Issue 3 June 2013
exploit the two dimensions of the DKSC the firm could develop an organizational capacity concerning how does employees act on distributors’ knowledge in order to enhance its innovativeness.
Managers should think more about (1) how to encourage and extract knowledge from their distributors specially knowing that the latter has a knowledge potential about both customers and competitors (via socialization, market studies, distributors rapport, meeting, in-‐depth interviews . . .), and (2) how to deploy this knowledge to innovativeness ends. In other words, how to acquire, assimilate, transform and exploit knowledge provided by distributors to enhance and improve firm’s innovativeness.
The scale measurement that we have proposed could be considered, for organizations, as a tool that could guide managers in their innovations projects. It is intended to help them in their decision making regarding new product development projects and to evaluate to which degree their organization is endowed with this capability and how it could be deployed to ensure performance. We suggest that, to succeed in these projects, the organizations should move from passive to active involvement of their stakeholders focusing, in this case, on their distributors’ knowledge as an intellectual capital engine of innovation performance.
Appendices: Appendix 1: Sample characteristics
Organization’s activity sector
Interviewee function
Interviews: time spent
Number of organizations
Food industry FI 1 FI2 FI3
Marketing manager Marketing manager Development Manager
1 h 30 min 55 min 35min 3
Pharmaceutical industry PhI 1 PhI 2
R&D manager R&D manager
2h 1h40 min 2
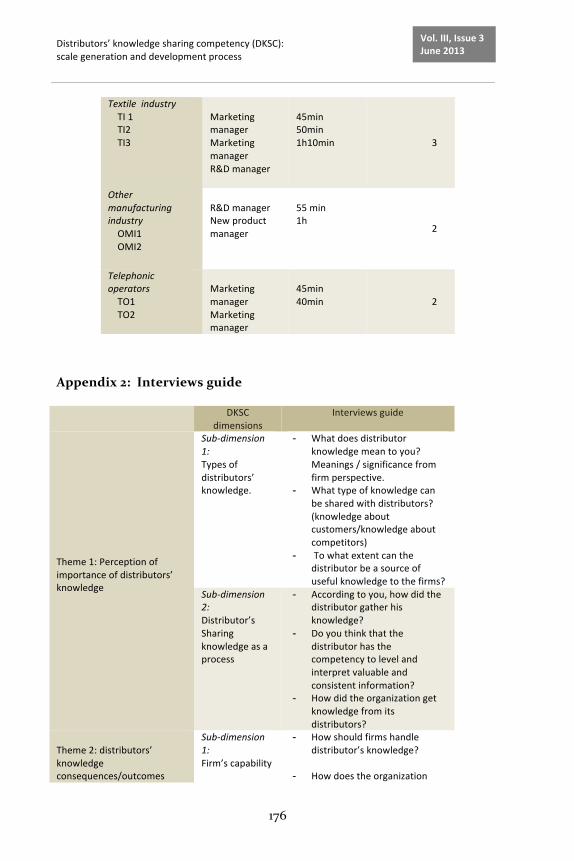
Distributors’ knowledge sharing competency (DKSC): scale generation and development process
176
Vol. III, Issue 3 June 2013
Textile industry TI 1 TI2 TI3
Marketing manager Marketing manager R&D manager
45min 50min 1h10min 3
Other manufacturing industry OMI1 OMI2
R&D manager New product manager
55 min 1h
2
Telephonic operators TO1 TO2
Marketing manager Marketing manager
45min 40min
2
Appendix 2: Interviews guide
DKSC dimensions
Interviews guide
Theme 1: Perception of importance of distributors’ knowledge
Sub-‐dimension 1: Types of distributors’ knowledge.
- What does distributor knowledge mean to you? Meanings / significance from firm perspective.
- What type of knowledge can be shared with distributors? (knowledge about customers/knowledge about competitors)
- To what extent can the distributor be a source of useful knowledge to the firms?
Sub-‐dimension 2: Distributor’s Sharing knowledge as a process
- According to you, how did the distributor gather his knowledge?
- Do you think that the distributor has the competency to level and interpret valuable and consistent information?
- How did the organization get knowledge from its distributors?
Theme 2: distributors’ knowledge consequences/outcomes
Sub-‐dimension 1: Firm’s capability
- How should firms handle distributor’s knowledge?
- How does the organization
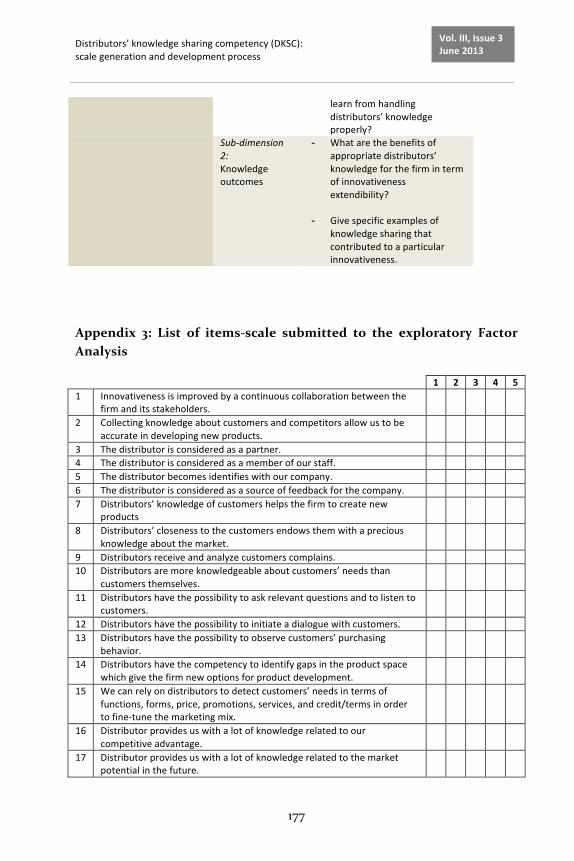
Distributors’ knowledge sharing competency (DKSC): scale generation and development process
177
Vol. III, Issue 3 June 2013
learn from handling distributors’ knowledge properly?
Sub-‐dimension 2: Knowledge outcomes
- What are the benefits of appropriate distributors’ knowledge for the firm in term of innovativeness extendibility?
- Give specific examples of
knowledge sharing that contributed to a particular innovativeness.
Appendix 3: List of items-‐scale submitted to the exploratory Factor Analysis
1 2 3 4 5 1 Innovativeness is improved by a continuous collaboration between the
firm and its stakeholders.
2 Collecting knowledge about customers and competitors allow us to be accurate in developing new products.
3 The distributor is considered as a partner. 4 The distributor is considered as a member of our staff. 5 The distributor becomes identifies with our company. 6 The distributor is considered as a source of feedback for the company. 7 Distributors’ knowledge of customers helps the firm to create new
products
8 Distributors’ closeness to the customers endows them with a precious knowledge about the market.
9 Distributors receive and analyze customers complains. 10 Distributors are more knowledgeable about customers’ needs than
customers themselves.
11 Distributors have the possibility to ask relevant questions and to listen to customers.
12 Distributors have the possibility to initiate a dialogue with customers. 13 Distributors have the possibility to observe customers’ purchasing
behavior.
14 Distributors have the competency to identify gaps in the product space which give the firm new options for product development.
15 We can rely on distributors to detect customers’ needs in terms of functions, forms, price, promotions, services, and credit/terms in order to fine-‐tune the marketing mix.
16 Distributor provides us with a lot of knowledge related to our competitive advantage.
17 Distributor provides us with a lot of knowledge related to the market potential in the future.
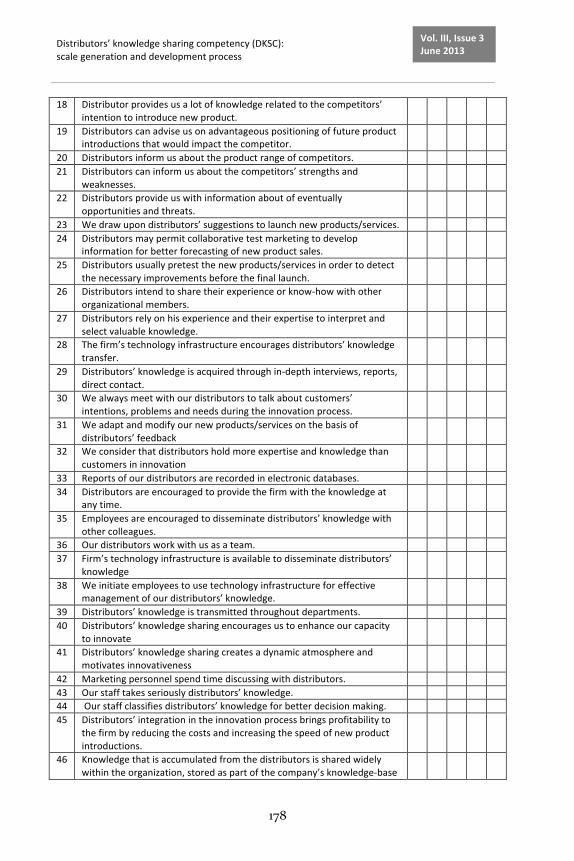
Distributors’ knowledge sharing competency (DKSC): scale generation and development process
178
Vol. III, Issue 3 June 2013
18 Distributor provides us a lot of knowledge related to the competitors’ intention to introduce new product.
19 Distributors can advise us on advantageous positioning of future product introductions that would impact the competitor.
20 Distributors inform us about the product range of competitors. 21 Distributors can inform us about the competitors’ strengths and
weaknesses.
22 Distributors provide us with information about of eventually opportunities and threats.
23 We draw upon distributors’ suggestions to launch new products/services. 24 Distributors may permit collaborative test marketing to develop
information for better forecasting of new product sales.
25 Distributors usually pretest the new products/services in order to detect the necessary improvements before the final launch.
26 Distributors intend to share their experience or know-‐how with other organizational members.
27 Distributors rely on his experience and their expertise to interpret and select valuable knowledge.
28 The firm’s technology infrastructure encourages distributors’ knowledge transfer.
29 Distributors’ knowledge is acquired through in-‐depth interviews, reports, direct contact.
30 We always meet with our distributors to talk about customers’ intentions, problems and needs during the innovation process.
31 We adapt and modify our new products/services on the basis of distributors’ feedback
32 We consider that distributors hold more expertise and knowledge than customers in innovation
33 Reports of our distributors are recorded in electronic databases. 34 Distributors are encouraged to provide the firm with the knowledge at
any time.
35 Employees are encouraged to disseminate distributors’ knowledge with other colleagues.
36 Our distributors work with us as a team. 37 Firm’s technology infrastructure is available to disseminate distributors’
knowledge
38 We initiate employees to use technology infrastructure for effective management of our distributors’ knowledge.
39 Distributors’ knowledge is transmitted throughout departments. 40 Distributors’ knowledge sharing encourages us to enhance our capacity
to innovate
41 Distributors’ knowledge sharing creates a dynamic atmosphere and motivates innovativeness
42 Marketing personnel spend time discussing with distributors. 43 Our staff takes seriously distributors’ knowledge. 44 Our staff classifies distributors’ knowledge for better decision making. 45 Distributors’ integration in the innovation process brings profitability to
the firm by reducing the costs and increasing the speed of new product introductions.
46 Knowledge that is accumulated from the distributors is shared widely within the organization, stored as part of the company’s knowledge-‐base
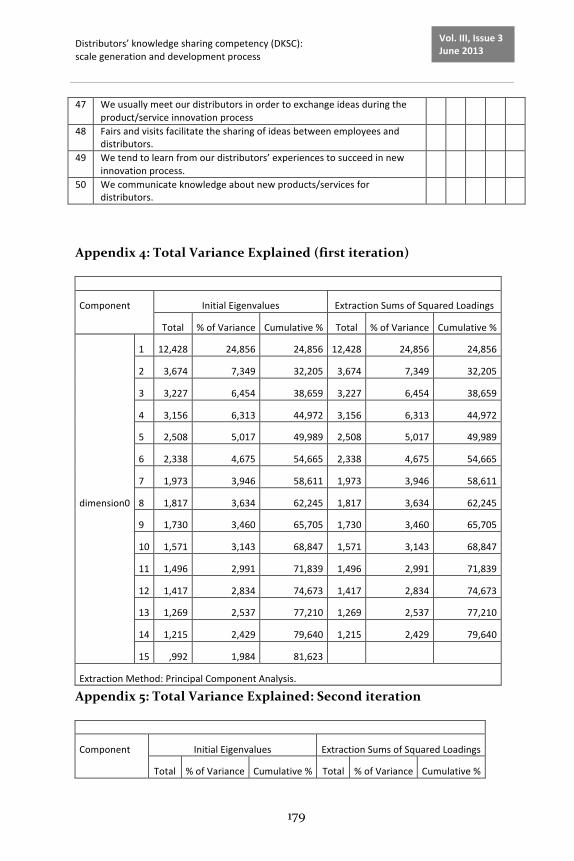
Distributors’ knowledge sharing competency (DKSC): scale generation and development process
179
Vol. III, Issue 3 June 2013
47 We usually meet our distributors in order to exchange ideas during the product/service innovation process
48 Fairs and visits facilitate the sharing of ideas between employees and distributors.
49 We tend to learn from our distributors’ experiences to succeed in new innovation process.
50 We communicate knowledge about new products/services for distributors.
Appendix 4: Total Variance Explained (first iteration)
Component Initial Eigenvalues Extraction Sums of Squared Loadings
Total % of Variance Cumulative % Total % of Variance Cumulative %
dimension0
1 12,428 24,856 24,856 12,428 24,856 24,856
2 3,674 7,349 32,205 3,674 7,349 32,205
3 3,227 6,454 38,659 3,227 6,454 38,659
4 3,156 6,313 44,972 3,156 6,313 44,972
5 2,508 5,017 49,989 2,508 5,017 49,989
6 2,338 4,675 54,665 2,338 4,675 54,665
7 1,973 3,946 58,611 1,973 3,946 58,611
8 1,817 3,634 62,245 1,817 3,634 62,245
9 1,730 3,460 65,705 1,730 3,460 65,705
10 1,571 3,143 68,847 1,571 3,143 68,847
11 1,496 2,991 71,839 1,496 2,991 71,839
12 1,417 2,834 74,673 1,417 2,834 74,673
13 1,269 2,537 77,210 1,269 2,537 77,210
14 1,215 2,429 79,640 1,215 2,429 79,640
15 ,992 1,984 81,623
Extraction Method: Principal Component Analysis.
Appendix 5: Total Variance Explained: Second iteration
Component Initial Eigenvalues Extraction Sums of Squared Loadings
Total % of Variance Cumulative % Total % of Variance Cumulative %
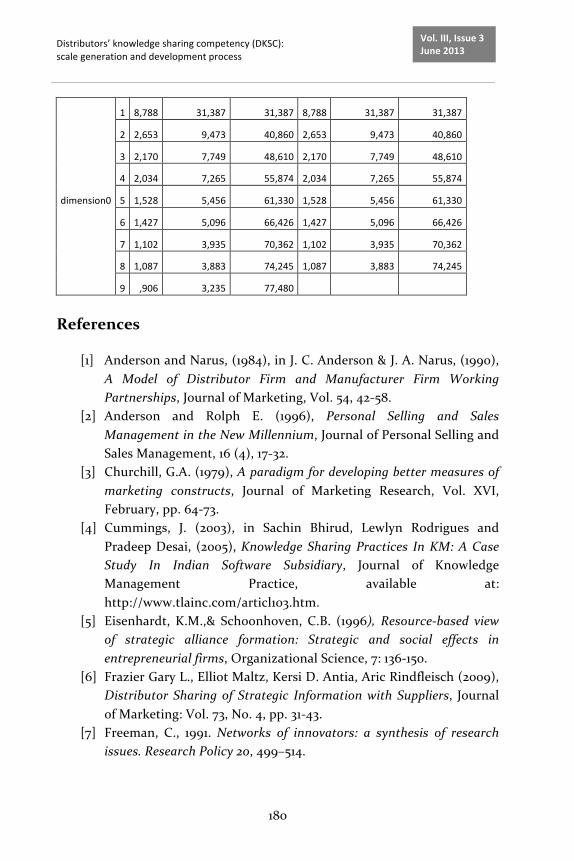
Distributors’ knowledge sharing competency (DKSC): scale generation and development process
180
Vol. III, Issue 3 June 2013
dimension0
1 8,788 31,387 31,387 8,788 31,387 31,387
2 2,653 9,473 40,860 2,653 9,473 40,860
3 2,170 7,749 48,610 2,170 7,749 48,610
4 2,034 7,265 55,874 2,034 7,265 55,874
5 1,528 5,456 61,330 1,528 5,456 61,330
6 1,427 5,096 66,426 1,427 5,096 66,426
7 1,102 3,935 70,362 1,102 3,935 70,362
8 1,087 3,883 74,245 1,087 3,883 74,245
9 ,906 3,235 77,480
References
[1] Anderson and Narus, (1984), in J. C. Anderson & J. A. Narus, (1990), A Model of Distributor Firm and Manufacturer Firm Working Partnerships, Journal of Marketing, Vol. 54, 42-‐58.
[2] Anderson and Rolph E. (1996), Personal Selling and Sales Management in the New Millennium, Journal of Personal Selling and Sales Management, 16 (4), 17-‐32.
[3] Churchill, G.A. (1979), A paradigm for developing better measures of marketing constructs, Journal of Marketing Research, Vol. XVI, February, pp. 64-‐73.
[4] Cummings, J. (2003), in Sachin Bhirud, Lewlyn Rodrigues and Pradeep Desai, (2005), Knowledge Sharing Practices In KM: A Case Study In Indian Software Subsidiary, Journal of Knowledge Management Practice, available at: http://www.tlainc.com/articl103.htm.
[5] Eisenhardt, K.M.,& Schoonhoven, C.B. (1996), Resource-‐based view of strategic alliance formation: Strategic and social effects in entrepreneurial firms, Organizational Science, 7: 136-‐150.
[6] Frazier Gary L., Elliot Maltz, Kersi D. Antia, Aric Rindfleisch (2009), Distributor Sharing of Strategic Information with Suppliers, Journal of Marketing: Vol. 73, No. 4, pp. 31-‐43.
[7] Freeman, C., 1991. Networks of innovators: a synthesis of research issues. Research Policy 20, 499–514.

Distributors’ knowledge sharing competency (DKSC): scale generation and development process
181
Vol. III, Issue 3 June 2013
[8] Hair J. F. Jr., Anderson R. E., Tatham R. L., Black W. C. (1998), Multivariate Data Analysis, 5th Edition. Prentice-‐Hall, Upper Saddle River, NJ 1998, p. 730.
[9] Hansen, M.T. (1999) The Search-‐Transfer Problem: the Role of Weak Ties in Sharing Knowledge across Organizational Subunits, Administrative Science Quarterly, 44, 82-‐111.
[10] Huber G.P., (1990), A theory of the effects of advanced information technologies on organizational design, intelligence, and decision making, Academy of management review, Vol. 15, No. 1. pp. 47-‐71.
[11] Huber, G. P. (1991). Organizational learning: The contributing processes and the literature Organization Science, 2(1), 88-‐115.
[12] Kurt Salmon Associates Inc., 1993, Efficient Consumer Response: Enhancing Consumer Value in the Grocery Industry, Food Marketing Institute, Washington, DC.
[13] Peterson R.A., Balasubramanian S., (1997), Exploring the implications of the Internet for consumer marketing, Journal of the Academy of Marketing Science, Vol. 25, N°.4.
[14] Shaw M. J., Subramaniam C., Tan G.W., Welge M.E., (2001), Knowledge management and data mining for marketing, Decision Support Systems, 31, 127–137.
[15] Shaw, Robert (2001), In Lowe G. F., (2006), Customer Differentiation and Interaction for Innovation: Two CRM Challenges for PSB, available at: http://ripeat.org/wpcontent/uploads/2010/03/Lowe.pdf.
[16] Siguaw, J.A., Simpson P.M. and Baker, T.L. (1998), Effects of supplier market orientation on distributor market orientation and the channel relationship: the distributor perspective, Journal of Marketing, Vol. 62, July, pp. 99-‐111.
[17] Stewart D. W. (1981), The Application and Misapplication of Factor Analysis in Marketing Research, Journal of Marketing Research, vol. 18, February, pp. 151-‐162.
[18] Stewart, D. W., Frazier, G. L., & Martin, I. (1996). Integrated channel management: Mergingthe communication and distribution functions of the firm. In E. Thorson, & J. More (Eds.), Integrated communication: Synergy of persuasive voices (pp.185-‐215). Mahwah, NJ: Lawrence Erlbaum Associates.
Distributors’ knowledge sharing competency (DKSC): scale generation and development process
182
Vol. III, Issue 3 June 2013
[19] Thibaut and Kelley, (1959), in J. C. Anderson & J. A. Narus, (1990), A Model of Distributor Firm and Manufacturer Firm Working Partnerships, Journal of Marketing, Vol. 54, 42-‐58.
[20] Yeung, A. K., Ulrich, D. O., Nason, S. W. and von Glinow, M. A. (1999). Organizational learning capability, New York: Oxford University Press.
[21] Yi Liu, Yuan Li, Jiaqi Xue (2009), Transfer of market knowledge in a channel relationship: Impacts of attitudinal commitment and satisfaction, Industrial Marketing Management.
[22] Stock, J. R. and Lambert D. M., (1987), Strategic Logistics Management, Irwin, Homewood, IL.
Scientific Papers (www.scientificpapers.org) Journal of Knowledge Management, Economics and Information Technology
183
Vol. III, Issue 3 June 2013
Comparative Analysis of the Value Added Tax Evolution
Author: Mirela Anca Postole, University Titu Maiorescu Bucharest, Faculty of Economic Sciences, Romania, [email protected]
The impact of indirect taxes is analysed in the study of evolution, especially the VAT for the economic activity of the company studied. During the reporting period, namely January 2009 – December 2011 the supporting documents were checked which records on VAT deductible and collected were based on, in compliance with legal norms and principles of financial accounting. Also the data processed were the basis for an analysis to compare the evolution of VAT. VAT shall be paid for the entire activity of the company. Keywords: receivable VAT; VAT collected; deductible VAT; VAT payable; VAT return JEL CLASSIFICATION: B21, H21, H25, H26.
Receivable VAT
In a company, any VAT deduction is made based on the VAT record deductible and VAT collected from the Purchases and Sales Log. Based on data collected in these logs on monthly basis, business entities are required to fill in and submit to their territorial tax office the VAT return, indicating the VAT collected and the taxable amount, VAT deductible and the taxable amount, VAT payable or VAT return, if applicable.
10

Comparative Analysis of the Value Added Tax Evolution
184
Vol. III, Issue 3 June 2013
After chronological and systematic recording of all accounting operations, at the end of the financial year, the VAT adjustment shall be recorded in the accounting books.
The Value Added Tax shall be adjusted with the difference between the deductible VAT recorded in the Purchases Log and the VAT collected recorded in the Sale Log.
The Value Added Tax return on the level of the company taken as an example for the analysis shall include:
• The deductible tax amount for the right to deduct in the tax reporting period;
• The amount of tax collected whose chargeability arises in the fiscal reporting period and, where applicable, the tax amount collected which was not entered in the deduction for the fiscal period in when the chargeability of tax occurred and other information provided in the template established by the Ministry of Public Finance.
• Data entered incorrectly in a tax return statement can be corrected by a subsequent fiscal period and shall be entered in the rows for regularization.
• The tax return is submitted to tax authorities for each fiscal year until the 25th day of the month following the month in which that fiscal period ends.
Comparison of deductible VAT and VAT collected during 2009 – 2011
Source: Own processing
Year 2009 VAT collected VAT deductible Jan-‐Mar 14099 11559 Apr-‐Jun 20702 15966 Jul-‐Sept 16006 13189 Oct-‐Dec 26449 19324
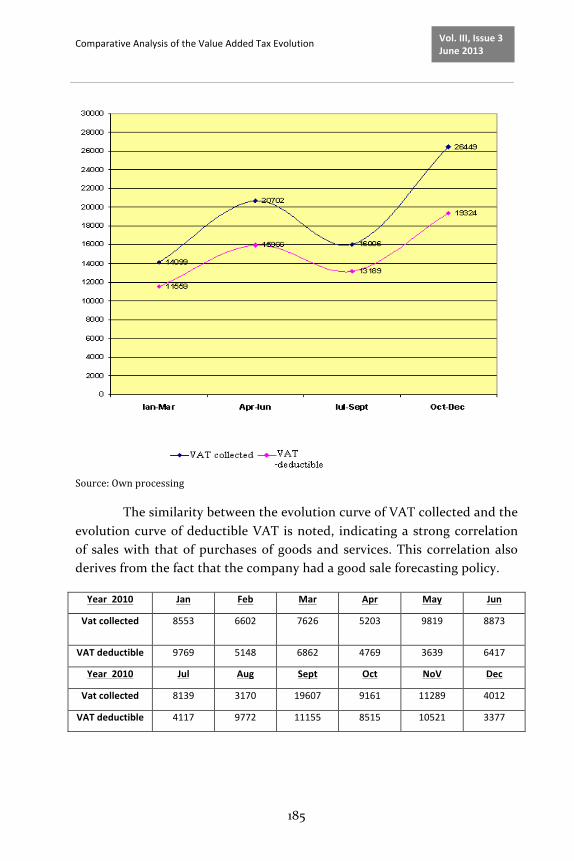
Comparative Analysis of the Value Added Tax Evolution
185
Vol. III, Issue 3 June 2013
Source: Own processing
The similarity between the evolution curve of VAT collected and the evolution curve of deductible VAT is noted, indicating a strong correlation of sales with that of purchases of goods and services. This correlation also derives from the fact that the company had a good sale forecasting policy.
Year 2010 Jan Feb Mar Apr May Jun
Vat collected 8553 6602 7626 5203 9819 8873
VAT deductible 9769 5148 6862 4769 3639 6417
Year 2010 Jul Aug Sept Oct NoV Dec
Vat collected 8139 3170 19607 9161 11289 4012
VAT deductible 4117 9772 11155 8515 10521 3377
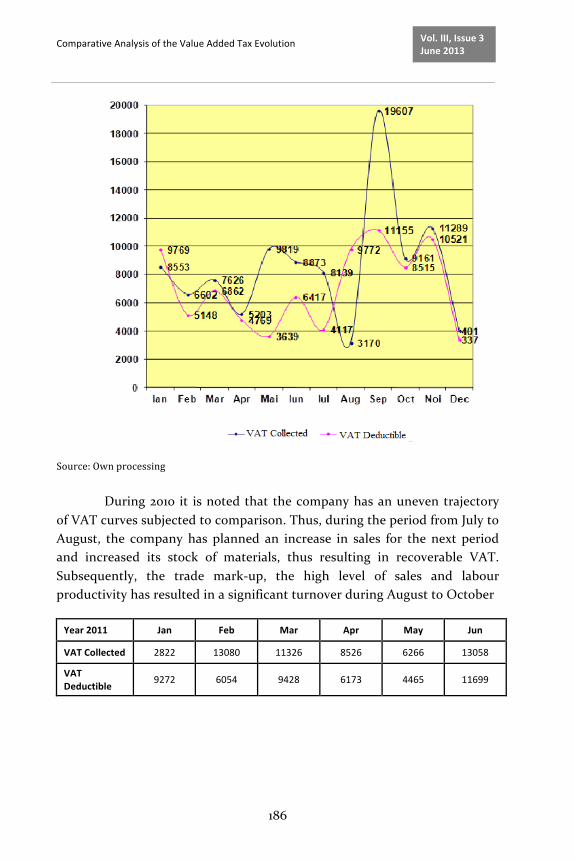
Comparative Analysis of the Value Added Tax Evolution
186
Vol. III, Issue 3 June 2013
Source: Own processing During 2010 it is noted that the company has an uneven trajectory of VAT curves subjected to comparison. Thus, during the period from July to August, the company has planned an increase in sales for the next period and increased its stock of materials, thus resulting in recoverable VAT. Subsequently, the trade mark-‐up, the high level of sales and labour productivity has resulted in a significant turnover during August to October
Year 2011 Jan Feb Mar Apr May Jun
VAT Collected 2822 13080 11326 8526 6266 13058
VAT Deductible
9272 6054 9428 6173 4465 11699
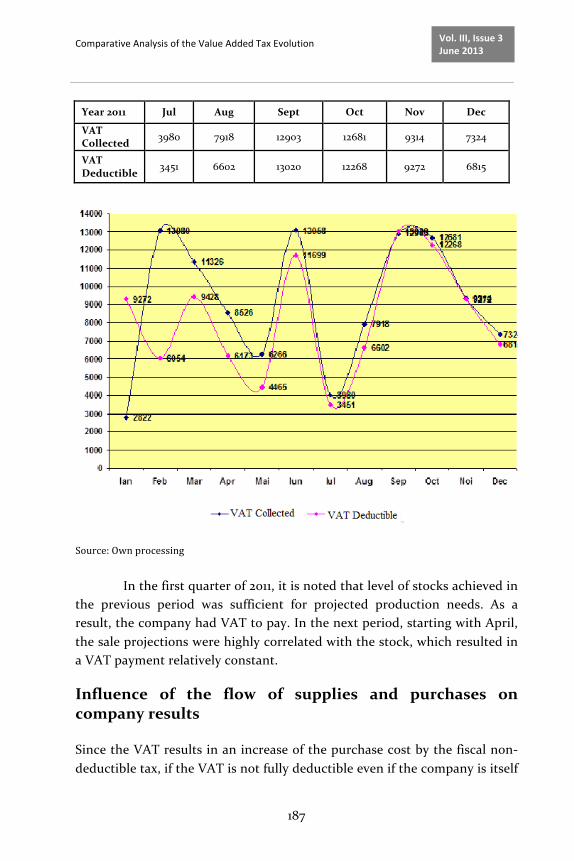
Comparative Analysis of the Value Added Tax Evolution
187
Vol. III, Issue 3 June 2013
Year 2011 Jul Aug Sept Oct Nov Dec
VAT Collected 3980 7918 12903 12681 9314 7324
VAT Deductible 3451 6602 13020 12268 9272 6815
Source: Own processing In the first quarter of 2011, it is noted that level of stocks achieved in
the previous period was sufficient for projected production needs. As a result, the company had VAT to pay. In the next period, starting with April, the sale projections were highly correlated with the stock, which resulted in a VAT payment relatively constant.
Influence of the flow of supplies and purchases on company results
Since the VAT results in an increase of the purchase cost by the fiscal non-‐deductible tax, if the VAT is not fully deductible even if the company is itself
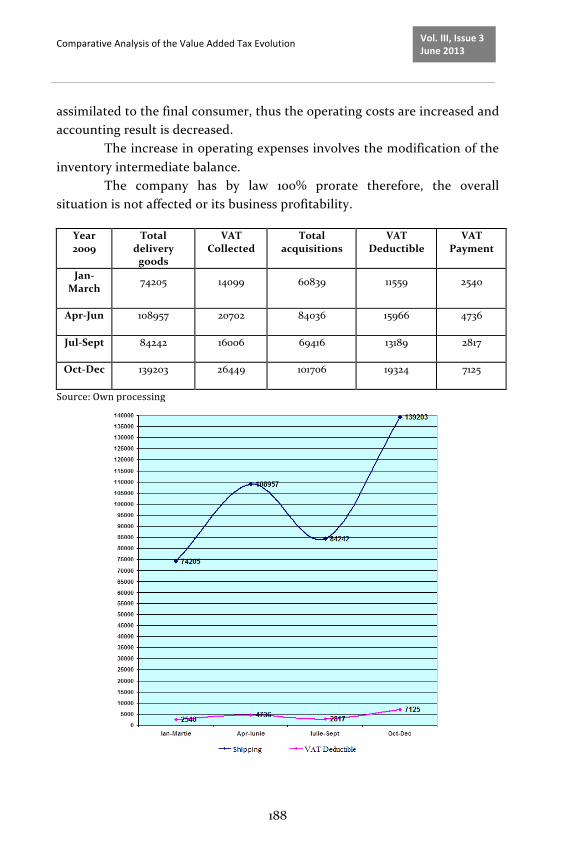
Comparative Analysis of the Value Added Tax Evolution
188
Vol. III, Issue 3 June 2013
assimilated to the final consumer, thus the operating costs are increased and accounting result is decreased.
The increase in operating expenses involves the modification of the inventory intermediate balance.
The company has by law 100% prorate therefore, the overall situation is not affected or its business profitability.
Year 2009
Total delivery goods
VAT Collected
Total acquisitions
VAT Deductible
VAT Payment
Jan-‐March 74205 14099 60839 11559 2540
Apr-‐Jun 108957 20702 84036 15966 4736
Jul-‐Sept 84242 16006 69416 13189 2817
Oct-‐Dec 139203 26449 101706 19324 7125
Source: Own processing
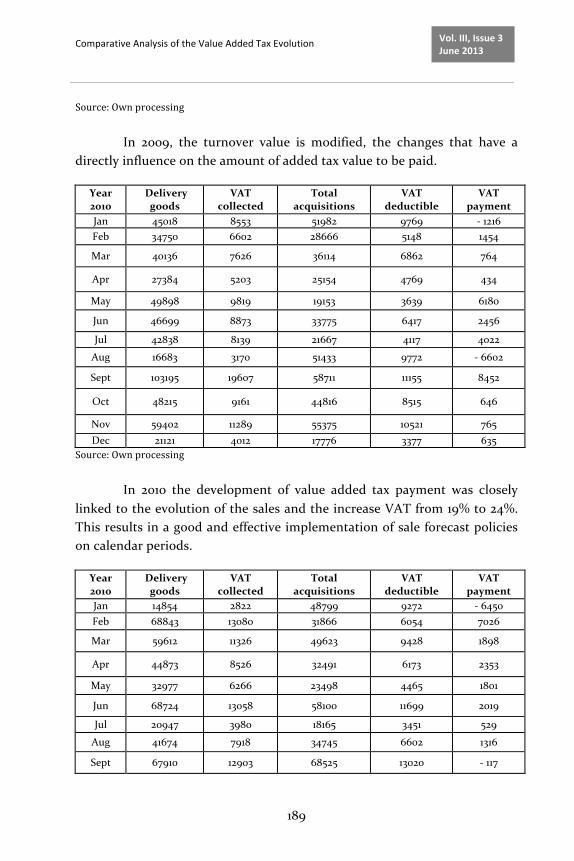
Comparative Analysis of the Value Added Tax Evolution
189
Vol. III, Issue 3 June 2013
Source: Own processing In 2009, the turnover value is modified, the changes that have a
directly influence on the amount of added tax value to be paid.
Year 2010
Delivery goods
VAT collected
Total acquisitions
VAT deductible
VAT payment
Jan 45018 8553 51982 9769 -‐ 1216 Feb 34750 6602 28666 5148 1454
Mar 40136 7626 36114 6862 764
Apr 27384 5203 25154 4769 434
May 49898 9819 19153 3639 6180
Jun 46699 8873 33775 6417 2456
Jul 42838 8139 21667 4117 4022
Aug 16683 3170 51433 9772 -‐ 6602
Sept 103195 19607 58711 11155 8452
Oct 48215 9161 44816 8515 646
Nov 59402 11289 55375 10521 765 Dec 21121 4012 17776 3377 635
Source: Own processing
In 2010 the development of value added tax payment was closely linked to the evolution of the sales and the increase VAT from 19% to 24%. This results in a good and effective implementation of sale forecast policies on calendar periods.
Year 2010
Delivery goods
VAT collected
Total acquisitions
VAT deductible
VAT payment
Jan 14854 2822 48799 9272 -‐ 6450 Feb 68843 13080 31866 6054 7026
Mar 59612 11326 49623 9428 1898
Apr 44873 8526 32491 6173 2353
May 32977 6266 23498 4465 1801
Jun 68724 13058 58100 11699 2019
Jul 20947 3980 18165 3451 529
Aug 41674 7918 34745 6602 1316
Sept 67910 12903 68525 13020 -‐ 117
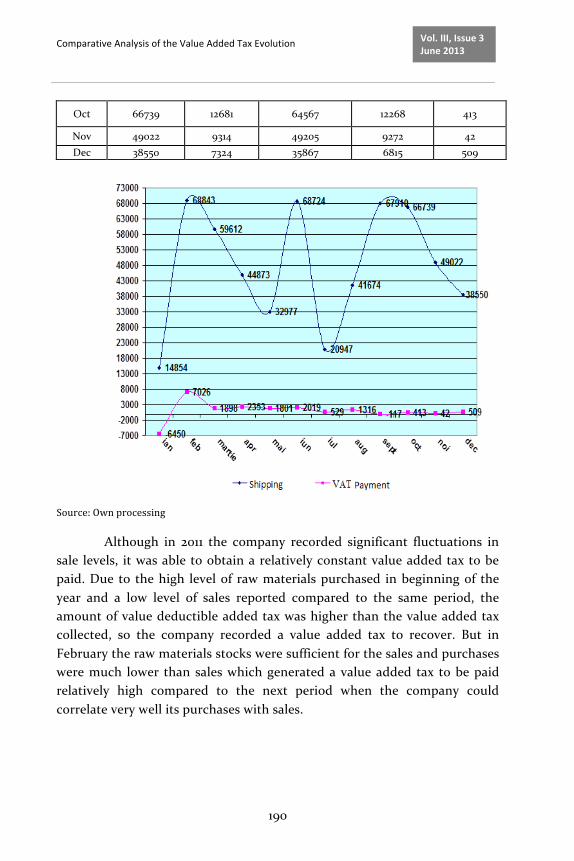
Comparative Analysis of the Value Added Tax Evolution
190
Vol. III, Issue 3 June 2013
Oct 66739 12681 64567 12268 413
Nov 49022 9314 49205 9272 42 Dec 38550 7324 35867 6815 509
Source: Own processing
Although in 2011 the company recorded significant fluctuations in sale levels, it was able to obtain a relatively constant value added tax to be paid. Due to the high level of raw materials purchased in beginning of the year and a low level of sales reported compared to the same period, the amount of value deductible added tax was higher than the value added tax collected, so the company recorded a value added tax to recover. But in February the raw materials stocks were sufficient for the sales and purchases were much lower than sales which generated a value added tax to be paid relatively high compared to the next period when the company could correlate very well its purchases with sales.
Comparative Analysis of the Value Added Tax Evolution
191
Vol. III, Issue 3 June 2013
Conclusions
In this study we addressed the issue of indirect taxes -‐ especially value added tax from the company’s perspective emphasizing the influence of this tax on profitability and business results, on the economic and financial situation and cash flows, liquidity and solvency of the company and the influence of the operating costs incurred by the value added tax on business results of the company.
In this study we addressed the issue of indirect taxes -‐ especially value added tax from the company’s perspective emphasizing the influence of this tax on profitability and business results, on the economic and financial situation and cash flows, liquidity and solvency of the company and the influence of the operating costs incurred by the value added tax on business results of the company. The company as VAT payer supports and understands the importance of value added share for the state budget, the VAT having a considerable share in its value.
The company proposes to revise the VAT considering that it is necessary to find a solution to replace VAT, provided that the new tax will not cause an increase in payments done by the companies or citizens and that any change to the provisions on force on VAT should substantially reduce the risk of fraud, to exclude new risks and above all not to generate excessive bureaucracy for companies and authorities.
References
[1] Condor I., Cristea S., Drept fiscal, Vol. II, Fundaţiei România de Mâine Publishing House, Bucharest, 2007
[2] Cristea S., Comentarii la Codul de procedură fiscală, Dareco Publishing House, Bucharest, 2007
[3] Georgescu M.A., Administrarea finanţelor publice şi a bugetului, Second Edition, ProUniversitaria Publishing House, Bucharest, 2009
[4] Găină A.M., Drept fiscal şi procedură fiscală, Universul Juridic Publishing House, Bucharest, 2009
[5] Niculeasa M.I., Summa fiscalis. Tratat de drept fiscal și financiar public, Universul Juridic Publishing House, Bucharest, 2011
[6] Şaguna Dan Drosu, Tofan Mihaela, Drept financiar şi fiscal european, C.H.Beck Publishing House, Bucharest, 2010
Scientific Papers (www.scientificpapers.org) Journal of Knowledge Management, Economics and Information Technology
192
Vol. III, Issue 3 June 2013
Impact of Development and Efficiency of Financial Sector on Economic Growth: Empirical Evidence from Developing Countries
Author: Najia SAQIB, Assistant Professor, Business Administration Department, Prince Sultan University Riyadh, Kingdom of Saudi Arabia, [email protected] and [email protected]
This paper analyses the impact of development and efficiency of financial sector on economic growth of a group of selected developing countries using a cross-‐country data averaged over the period 2005-‐2009. The results show that the impact of financial sector efficiency on economic growth is significantly positive for developing countries. For a sample of 50 developing countries the effect of financial sector development and financial sector efficiency is positive and highly significant. The sensitivity analysis also shows that the relationship remain positive and significant no matter what combination of the omitted variables are used in the basic model. Thus, our findings support the core idea that development and efficiency of financial sector stimulates economic growth. Keywords: Financial Development; Financial Efficiency; Economic Growth; Comparative Studies of Countries JEL Classification: E44; F43; N20, O57
Introduction
For the last few decades, the relationship between financial depth and economic growth has received serious attention in the literature. The
11

Impact of Development and Efficiency of Financial Sector on Economic Growth: Empirical Evidence from Developing Countries
193
Vol. III, Issue 3 June 2013
theoretical and empirical studies although substantially advanced in this area but they did not lead to a general consensus on the appearance and direction of the relationship. Thus, the issue still attracts researchers to advance the knowledge in this area.
From a fundamental economic point of view, the growth of financial markets can be attributed to the existence of market frictions that exists in the form of transaction and information costs. Financial intermediaries also play a role in reducing the costs that are associated with savings and investment decisions. Finally, financial markets are expected to contribute to an efficient allocation of available resources that can positively affect economic growth. Acemoglu and Zilibotti, (1997) conclude that financial depth mobilizes and pools savings. It thereby not only fosters capital accumulation but also contributes to a better resource allocation in the economy. This is achieved through economies of scale and overcoming investment indivisibilities.
Greenwood and Smith (1997) develop a model wherein financial markets promote specialization and reduce transaction costs, which lead to productivity gains that translate into higher growth. Financial institutions also reduce liquidity risk as they allow the transformation of liquid financial assets (that are desirable by the savers) into long-‐term capital investments. Furthermore financial markets modernize information costs on investment opportunities and thus improve the allocation of capital.
Shleifer and Vishny (1996) confirmed that financial intermediaries that function efficiently improve the monitoring of investment activities and enhance corporate governance. Owing to the existence of market frictions such as high transactions costs and information asymmetries, diffused shareholders may be prevented from exercising adequate control over the managers of the firms. The problem of corporate governance can be ameliorated by smooth functioning of financial arrangements. In general, the above mechanisms suggest that financial development should have a significant positive effect on economic growth as it fosters capital accumulation and leads to productivity gains thanks to a better allocation of resources 1 . Through the expansion and sophistication of financial institutions, the amount and quality of the supply of financial services increases, and this in turn promotes economic growth. However, the view
1 n the literature, this direction of causality is often referred to as the “supply-‐leading hypothesis”.
Impact of Development and Efficiency of Financial Sector on Economic Growth: Empirical Evidence from Developing Countries
194
Vol. III, Issue 3 June 2013
that financial development is a key determinant of economic growth has been challenged from different angles throughout the past few decades.
First, it was pointed out that, from a theoretical perspective, improvements in resource allocation would not necessarily lead to higher economic growth. In fact, under certain conditions, higher returns on savings that result from financial sector development can reduce savings rates to such an extent that overall growth slows2. Similarly, if development of the financial sector lowers the liquidity constraints of individuals, the overall savings rate may decline, leading to weaker economic growth (see Jappelli and Pagano, 1994). Secondly, a number of economists support the so-‐called “demand-‐following hypothesis” (see, Ireland, 1994). According to this hypothesis, causality between the two phenomena runs the other way, namely from economic growth to financial development: in the process of a growing economy, individuals demand more and better financial services, which then fosters financial development. A third group of economic researchers deny a quantitatively important causal relation between financial development and economic growth. Instead, they regard them as largely independent phenomena. According to this view, financial development may help to predict economic growth as financial markets develop in anticipation of economic activity. However, finance is not regarded as a fundamental cause of economic growth. Finally, as highlighted by, among others, Greenwood and Smith (1997), causality between the two variables might run in both directions. That is, financial development and economic growth may mutually cause each other3.
Based on the review of above theoretical debate, this paper addresses research question: whether financial sector developments and financial sector efficiency promotes economic growth or retards it.? To answer this question, we use two different indicators of financial sector development and one indicator of financial sector efficiency to test the relationship for a sample of 50 developing countries for a data averaged over the period 2005-‐2009. To check the robustness of the results a simple sensitivity analysis is also performed.
2 The overall impact of higher returns on the savings rate depends on the relative strength of the implied income and substitution effects that work in different directions 3 This is known as “stage of development hypothesis”. Supply-‐leading financial development is a key determinant of real economic growth in the early stages of development, whereas at later stages financial development mainly follows real growth.
Impact of Development and Efficiency of Financial Sector on Economic Growth: Empirical Evidence from Developing Countries
195
Vol. III, Issue 3 June 2013
The remainder of the paper is organized as follows. Section II discusses the previous empirical studies on the subject. Section III describes our simple model and discusses the estimation results. Section IV presents sensitivity analyses and section V gives conclusion and policy implications.
Empirical Literature
A large number of empirical studies have tried to assess the qualitative and quantitative impact of financial development on economic growth by using different types of econometric approaches and a variety of indicators to measure financial development. In a seminal study, King and Levine (1993b) analyzed cross-‐country data for 80 countries over the period 1960-‐1989. They use four different indicators to measure financial development4. Controlling for other variables that affect long-‐run growth, they found that different financial indicators were strongly and robustly correlated with economic growth. They also showed that the initial level of financial depth was a good predictor of subsequent rates of economic growth even after controlling for other growth-‐enhancing factors.
Levine and Zervos (1998) extend the empirical analyses by studying the empirical relationship between several measures of stock market development, banking development and long run economic growth. They found that both the initial level of stock market liquidity (measured by the turnover ratio5 ) and the initial level of banking development (measured by bank credit to the private sector as a ratio of GDP) were robustly correlated with future economic growth. They concluded that financial development and economic growth have strong positive link and that financial factors are an integral part of the growth process.
Later, Levine, Loayza, and Beck (2000) estimate a generalized method of moments (GMM) equation with panel data. Concerning the measurement of financial development, they introduced the new indicator “private credit”, which is defined as the value of credits by financial intermediaries to the private sector divided by GDP. Financial
4 These indicators were (i) the ratio of liquid liabilities to GDP; (ii) ratio of deposit money bank assets to total assets; (iii) the ratio of non financial private sector credit to total credit; and (iv) ratio of claims on the non financial private sector to GDP. 5 Turnover ratio was measured as value of the trades of domestic shares on domestic exchange divided by the value of listed domestic share.
Impact of Development and Efficiency of Financial Sector on Economic Growth: Empirical Evidence from Developing Countries
196
Vol. III, Issue 3 June 2013
intermediaries comprise both deposit money banks and other financial institutions. Levine, Loayza, and Beck (2000) found evidence of a strong link between financial development and economic growth. Their results indicated that the evolution of private credit had a particularly large impact on the growth performance in their sample.
Xu (2000) use a multivariate vector autoregressive approach to examine the effects of permanent financial development on domestic investment and output in 41 countries between 1960 and 1993. The results showed that financial development is important to GDP growth and that domestic investment is an important channel through which financial development affects economic growth. Furthermore, many countries were able to turn the short-‐term negative effects to long term positive effects, and all these results were robust.
In a recent study Rioja and Valev (2004) investigate the channels through which financial development influence economic growth in a panel of 74 countries during 1961-‐1995. They found that finance has a strong positive influence on productivity growth primarily in more developed countries. In less developed countries, the effect of finance on output growth occurs primarily through capital accumulation. In addition to cross-‐country and panel studies, a substantial amount of literature has employed time-‐series techniques to investigate the finance-‐growth relationship. Using basically Granger-‐type causality tests and vector autoregressive procedures, the majority of these studies provide support for the hypothesis that causality runs from financial development to growth.
Rousseau and Wachtel (1998) conduct a time-‐series tests of financial development and growth for five countries using a measure of financial development that includes the assets of both banks and non-‐banks. They concluded that the dominant direction of causality runs from financial development to economic growth. Khan et al. (2005) test the relationship between financial development and economic growth for Pakistan over the period 1971–2004, using Autoregressive Distributed Lag (ARDL) technique. The results of the study showed that in the long-‐run financial depth and real interest rate exert positive impact on economic growth. However, the relationship between growth and financial development is though positive but remained insignificant in the short-‐run. They concluded that growth is an outcome of financial development.
Impact of Development and Efficiency of Financial Sector on Economic Growth: Empirical Evidence from Developing Countries
197
Vol. III, Issue 3 June 2013
Recently, Waheed and Younus (2009) analyze the long run relationship between financial development and growth in Pakistan using a time series data for the period 1971-‐2006. They concluded that there exist a long run robust relationship between financial development and economic growth in the country.
Overall, recent empirical evidence from cross-‐country, panel and time-‐series studies suggests that financial development is an important determinant of economic growth. However, the impact may be nonlinear. This could be especially true in countries with very low institutional quality, where financial deepening may not translate into higher economic growth.
Model and Results
Thus, based on the theoretical discussion, empirical studies, data availability and the need to conserve degrees of freedom, only three variables are chosen for our basic model to explain the variation in per capita income. The basic equation is:
Y = β0 + β1X+ β2H + β3FD + εt Where Y represent economic growth. We have followed standard
practice (Roubini and Sala-‐i-‐Martin 1992, and King and Levine 1993a, b) to use real GDP per capita GDP as an indicator for economic growth. X is a set of variables always included in the regression. In our model we include ratio of gross fixed capital formation to GDP as a proxy for physical capital (IGDP). H is a subset of variables identified by the literature as potentially important explanatory variables for growth. Here we use combined primary, secondary and tertiary gross enrolment ratio (ENRL) as a proxy for human capital. FD denotes variables of interest and εt denotes the error term.
Several indicators of financial development have been proposed in the literature. Of course, different indicators will proxy different aspects of the relationship between the financial development and economic performance. The most frequently used conventional proxy to measure the degree of financial sectors development is the ratio of a less liquid monetary asset, normally M2 or M3, to the level of nominal GDP. Therefore, the first proxy of the degree of financial deepening is the ratio of the stock of broad money (M2) to GDP (M2GDP). This indicator is used, for example, by King and Levine (1993b), Darrat (1999), Nashashibi et al. (2001). Throughout the

Impact of Development and Efficiency of Financial Sector on Economic Growth: Empirical Evidence from Developing Countries
198
Vol. III, Issue 3 June 2013
process of development, the ratio M2GDP has a tendency to rise as access to banking and alternative instruments of store of value (investment and savings) spread. Therefore, an increase in this variable signifies a larger financial sector. However, as markets mature, the ratio M2/GDP tends to decline as other financial instruments not included in M2 are developed and become increasingly available.
Recent theoretical and empirical research has demonstrated that an effective mobilization of domestic savings and an efficient allocation of resources depend on the extent to which the private sector can obtain loans. It is argued that loans extended to the private sector promote investment and productivity growth to a much greater extent than do credits to the public sector. An increase in the ratio of private credit to GDP (PCGDP) can be interpreted as a sign of more financial services and thus as an improvement in financial intermediation. The recent empirical literature on the role of financial intermediation in economic development has highlighted the suitability of this indicator to measure the level of financial sector development (see, for example, De Gregorio and Guidotti (1995); Demetriades and Hussein (1996); Levine and Zervos (1998); and Beck and Levine (2004)). In addition, as De Gregorio and Guidotti (1995) argued, private credit has an obvious advantage over measures of monetary aggregates such as M1, M2, and M3 since it more precisely represents the actual quantity of funds directed to the private sector. Thus, our second measure of financial sector development is the ratio of private credit to GDP (PCGDP).
The level of interest rates affect people’s behavior by affecting economic decisions with regard to how much people are willing to save, and how much businesses are willing to invest. An informative indicator of a banking system’s success in intermediating funds between savers and investors is the spread between deposit and lending rates (De Nicolo et al. 2003). Thus spread (SPRD) can be used as an indicator of the efficiency of the financial sector. We expect a negative sign of this coefficient in our model, because a fall in the value of this indicator represents an increase in efficiency and may results higher economic growth.
Hence, in this study we include two indicators namely M2GDP and PCGDP as a measure of financial sector development and one indicator SPRD as a measure of financial sector efficiency to proxy FD variable in our
Impact of Development and Efficiency of Financial Sector on Economic Growth: Empirical Evidence from Developing Countries
199
Vol. III, Issue 3 June 2013
model. We perform the analysis a cross-‐section of fifty developing countries. The data that have been used in this analysis are annual covering the period from 2005-‐2009. This is the latest period up to which all data are available in complete form. The data come from the World Bank’s World Development Indicators database. The selection of countries is based on data availability on all variables from this source.
Countries are grouped into three groups: lower, lower-‐middle and upper-‐middle depending on the relative ranking of their income per capita in the middle of the sample period6. We use several income groups since much of the policy literature discusses country difference in terms of developing countries 7 . For further motivation, Table 1 reports macroeconomic and financial indicators for the sub-‐samples of countries, which we later use in the econometric analysis. Table 1 shows that output growth was substantially slower in low-‐income countries: 5.61 % in lower-‐income, 4.58% in lower middle-‐income and 4.39% in upper middle-‐income. Investment to GDP ratio accounts is 16.45 % in lower-‐income, 22.08% in lower middle-‐income and 22.03% in upper middle-‐income countries.
This difference prompts us to examine whether finance has different channels for influencing economic growth at various levels of development. Table 1 report the average values of the two financial sector development variables (M2 to GDP and Private Credit to GDP ratio) in the three income groups. We also analyze the financial sector efficiency variable (Spread), which has high percentage in lower-‐income groups. This indicates that if we reduce spread (that is, increase the efficiency of the financial sector), it may have positive effect on economic growth of low income countries. The data shows that the human capital level (Enrolment) is lower in low-‐income countries.
6 According to the income classification by World Bank, Economies are divided among income groups according to 2006 gross national income (GNI) per capita, calculated using the World Bank Atlas method. The groups are: low income, $1,025 or less; lower middle income, $1,026 -‐ $4,035 and upper middle income, $4,036 -‐ $12,475. 7 Low-‐income and middle-‐income economies are sometimes referred to as developing economies. The use of the term is convenient; it is not intended to imply that all economies in the group are experiencing similar development or that other economies have reached a preferred or final stage of development.
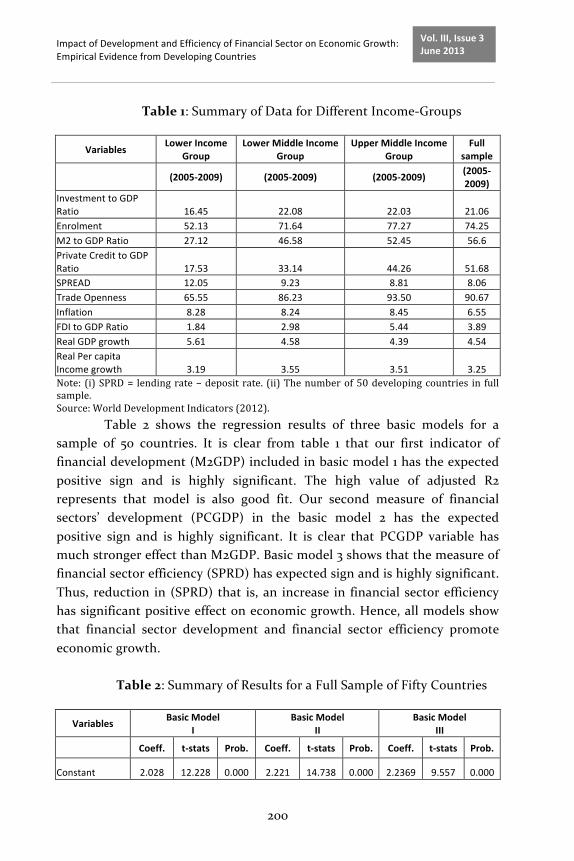
Impact of Development and Efficiency of Financial Sector on Economic Growth: Empirical Evidence from Developing Countries
200
Vol. III, Issue 3 June 2013
Table 1: Summary of Data for Different Income-‐Groups
Variables Lower Income
Group Lower Middle Income
Group Upper Middle Income
Group Full
sample
(2005-‐2009) (2005-‐2009) (2005-‐2009) (2005-‐
2009) Investment to GDP Ratio 16.45 22.08 22.03 21.06 Enrolment 52.13 71.64 77.27 74.25 M2 to GDP Ratio 27.12 46.58 52.45 56.6 Private Credit to GDP Ratio 17.53 33.14 44.26 51.68 SPREAD 12.05 9.23 8.81 8.06 Trade Openness 65.55 86.23 93.50 90.67 Inflation 8.28 8.24 8.45 6.55 FDI to GDP Ratio 1.84 2.98 5.44 3.89 Real GDP growth 5.61 4.58 4.39 4.54 Real Per capita Income growth 3.19 3.55 3.51 3.25 Note: (i) SPRD = lending rate – deposit rate. (ii) The number of 50 developing countries in full sample. Source: World Development Indicators (2012).
Table 2 shows the regression results of three basic models for a sample of 50 countries. It is clear from table 1 that our first indicator of financial development (M2GDP) included in basic model 1 has the expected positive sign and is highly significant. The high value of adjusted R2 represents that model is also good fit. Our second measure of financial sectors’ development (PCGDP) in the basic model 2 has the expected positive sign and is highly significant. It is clear that PCGDP variable has much stronger effect than M2GDP. Basic model 3 shows that the measure of financial sector efficiency (SPRD) has expected sign and is highly significant. Thus, reduction in (SPRD) that is, an increase in financial sector efficiency has significant positive effect on economic growth. Hence, all models show that financial sector development and financial sector efficiency promote economic growth.
Table 2: Summary of Results for a Full Sample of Fifty Countries
Variables Basic Model I
Basic Model II
Basic Model III
Coeff. t-‐stats Prob. Coeff. t-‐stats Prob. Coeff. t-‐stats Prob.
Constant 2.028 12.228 0.000 2.221 14.738 0.000 2.2369 9.557 0.000

Impact of Development and Efficiency of Financial Sector on Economic Growth: Empirical Evidence from Developing Countries
201
Vol. III, Issue 3 June 2013
IGDP 0.014 2.913 0.00 0.014 3.322 0.001 0.015 2.798 0.007
ENRL 0.017 9.376 0.000 0.014 8.094 0.000 0.019 8.230 0.000
M2GDP 0.002 3.934 0.002 -‐-‐-‐-‐-‐-‐ -‐-‐-‐-‐-‐-‐ -‐-‐-‐-‐-‐-‐ -‐-‐-‐-‐-‐-‐ -‐-‐-‐-‐-‐-‐ -‐-‐-‐-‐-‐-‐
PCGDP -‐-‐-‐-‐-‐-‐ -‐-‐-‐-‐-‐-‐-‐ -‐-‐-‐-‐-‐-‐ 0.003 5.548 0.000 -‐-‐-‐-‐-‐-‐-‐ -‐-‐-‐-‐-‐-‐-‐ -‐-‐-‐-‐-‐-‐-‐
SPRD -‐-‐-‐-‐-‐-‐-‐ -‐-‐-‐-‐-‐-‐ -‐-‐-‐-‐-‐-‐-‐ -‐-‐-‐-‐-‐-‐ -‐-‐-‐-‐-‐-‐ -‐-‐-‐-‐-‐-‐ -‐0.021 -‐4.042 0.000
Adjusted-‐R2 0.678 -‐-‐-‐-‐-‐-‐-‐ -‐-‐-‐-‐-‐-‐ 0.678 -‐-‐-‐-‐-‐-‐-‐ -‐-‐-‐-‐-‐-‐-‐ 0.577 -‐-‐-‐-‐-‐-‐-‐ -‐-‐-‐-‐-‐-‐-‐
DW Stat 2.132 -‐-‐-‐-‐-‐-‐ -‐-‐-‐-‐-‐-‐-‐ 2.132 -‐-‐-‐-‐-‐-‐ -‐-‐-‐-‐-‐-‐ 2.355 -‐-‐-‐-‐-‐-‐ -‐-‐-‐-‐-‐-‐-‐
F-‐Statistics 69.088 -‐-‐-‐-‐-‐-‐-‐ 0.000 69.088 -‐-‐-‐-‐-‐-‐-‐ 0.000 36.141 -‐-‐-‐-‐-‐-‐-‐ 0.000 Note: (i) SPRD = lending rate – deposit rate. (ii) The number of countries is 50 in basic model I & II and 35 in basic model III. Source: Author estimation.
Hence, all model models show that financial sector development
and financial sector efficiency promote economic growth of the selected developing countries.
Sensitivity Analysis
Since many factors are associated with economic growth, the empirical results on the relationship between one factor and economic growth is not always robust. Therefore, it is necessary to examine the robustness of the results reported in section 3. The question of how much confidence could be placed on the conclusions was addressed by Levine and Renelt (1992) that use a modified version of the Extreme Bond Analysis (EBA) originally developed by Leamer (1985). A slightly modified version of EBA approach is used, hereby, considering the following model8.
Where ‘Y’ is the real GDP per capita, ‘I’ is a set of variables that are
commonly included in the regression, ‘M’ is the variable of particular interest and ‘Z’ is a set of variables chosen from a pool of variables and t is the white noise error term. In our case, ‘I’ or basic variable is the ratio of investment to GDP (IGDP)9 ), the ‘M’ variable is the variable of interest,
8 The EBA involves varying the Z variable to determine whether the coefficient on the focus variable, M is consistently significant and of the same sign when right hand side variables change. 9 Levine & Renalt (1992) and Temple (1999) have included this variable in their regression
ttttt ZMIY ξββββ ++++= 3210
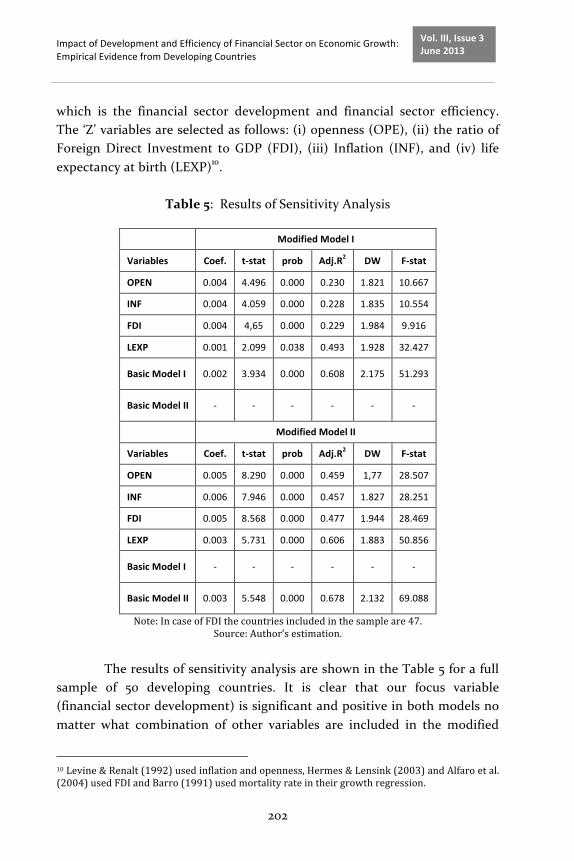
Impact of Development and Efficiency of Financial Sector on Economic Growth: Empirical Evidence from Developing Countries
202
Vol. III, Issue 3 June 2013
which is the financial sector development and financial sector efficiency. The ‘Z’ variables are selected as follows: (i) openness (OPE), (ii) the ratio of Foreign Direct Investment to GDP (FDI), (iii) Inflation (INF), and (iv) life expectancy at birth (LEXP)10.
Table 5: Results of Sensitivity Analysis
Modified Model I
Variables Coef. t-‐stat prob Adj.R2 DW F-‐stat
OPEN 0.004 4.496 0.000 0.230 1.821 10.667
INF 0.004 4.059 0.000 0.228 1.835 10.554
FDI 0.004 4,65 0.000 0.229 1.984 9.916
LEXP 0.001 2.099 0.038 0.493 1.928 32.427
Basic Model I 0.002 3.934 0.000 0.608 2.175 51.293
Basic Model II -‐ -‐ -‐ -‐ -‐ -‐
Modified Model II
Variables Coef. t-‐stat prob Adj.R2 DW F-‐stat
OPEN 0.005 8.290 0.000 0.459 1,77 28.507
INF 0.006 7.946 0.000 0.457 1.827 28.251
FDI 0.005 8.568 0.000 0.477 1.944 28.469
LEXP 0.003 5.731 0.000 0.606 1.883 50.856
Basic Model I -‐ -‐ -‐ -‐ -‐ -‐
Basic Model II 0.003 5.548 0.000 0.678 2.132 69.088
Note: In case of FDI the countries included in the sample are 47. Source: Author’s estimation.
The results of sensitivity analysis are shown in the Table 5 for a full
sample of 50 developing countries. It is clear that our focus variable (financial sector development) is significant and positive in both models no matter what combination of other variables are included in the modified
10 Levine & Renalt (1992) used inflation and openness, Hermes & Lensink (2003) and Alfaro et al. (2004) used FDI and Barro (1991) used mortality rate in their growth regression.
Impact of Development and Efficiency of Financial Sector on Economic Growth: Empirical Evidence from Developing Countries
203
Vol. III, Issue 3 June 2013
models. Thus, it is confirmed that financial sector development has robust positive effect on economic growth of the developing countries.
Conclusions
This paper offers a broad analysis of the effect of development and efficiency of financial sector on economic growth for a large cross section of countries. We also did the same analysis for a group of developing countries. The evidence presented in this paper provides strong and robust support to the view that financial sector development is crucial for economic growth and the efficiency of the financial sector is potentially important for the long term growth performance of the developing countries. Given this positive relation, the importance of financial sector development should not be underestimated and has to be one of the main strategies to achieve sustainable economic growth in the long term. Building sound and stable financial sectors requires; liberalization of the financial system, adoption of the internationally acceptable codes and standards, strengthening of prudential regulation and supervision and training of the staff to manage and regulate these institutions.
References
[1] Acemoglu, D., Zilibotti, F., “Was Prometheus Unbound by Chance? Risk, Diversification, and Growth”, Journal of Political Economy, Vol. 105, No 4, 1997, pp.709-‐51.
[2] Alfaro, L., Chanda, A, Kalemli-‐Ozcan, S., Sayek, S., “FDI and Economic Growth, the Role of Local Financial Markets”, Journal of International Economics, Vol. 64, 2004, pp.89-‐112.
[3] Barro, R. J., “Growth in a Cross Section of Countries”, Quarterly Journal of Economics, Vol. 106, No 2, 1991, pp.407-‐43.
[4] Beck, T., Levine, R., “Stock Markets, Banks, and Growth: Panel Evidence”, Journal of Banking & Finance, Vol. 28, 2004, pp.423-‐42.
[5] De Gregorio, J., Guidotti, P. E., “Financial Development and Economic Growth”, World Development, Vol. 23, No 3, 1995, pp.433-‐38.
Impact of Development and Efficiency of Financial Sector on Economic Growth: Empirical Evidence from Developing Countries
204
Vol. III, Issue 3 June 2013
[6] De Nicolo G., Geadah, S., Rozhkor, D., “Poorly Developed Financial Systems in the CIS-‐7 Countries may Jeopardize their Sustained Growth”, Finance and Development, 2003, pp.42-‐45.
[7] Demetriades, P. O., Hussein, K. A., “Does Financial Development cause Economic Growth? Time-‐series Evidence from 16 Countries”, Journal of Development Economics, Vol. 51, 1996, pp.387-‐411.
[8] Greenwood, J., Smith, B., “Financial Markets in Development, and the Development of Financial Markets”, Journal of Economic Dynamics and Control, Vol. 21, 1997, pp.145-‐81.
[9] Hermes, N., Lensink, R., “Foreign Direct Investment, Financial Development and Economic Growth”, Journal of Development Studies, Vol. 40, No 1, 2003, pp.142-‐63.
[10] Ireland, P. N., “Money and Growth: An Alternative Approach”, American Economic Review, Vol. 84, No 1, 1994, pp.47-‐65.
[11] Jappelli, T., Pagano, M., “Saving, Growth and Liquidity Constraints”, Quarterly Journal of Economics, Vol. 109, No 1, 1994, pp.83-‐109.
[12] King, R. G., Levine, R., “Finance, Entrepreneurship, and Growth: Theory and Evidence”, Journal of Monetary Economics, Vol. 32, No 3, 1993a, pp. 513-‐42.
[13] King, R. G., Levine, R., “Finance and Growth: Schumpeter Might Be Right”, Quarterly Journal of Economics, Vol. 108, No 3, 1993b, pp.717-‐737.
[14] Khan, M. A., Qayyum, A., Sheikh, S. A., “Financial Development and Economic Growth: the Case of Pakistan”, Pakistan Development Review, Vol. 44, No 4, 2005, pp.819-‐37.
[15] Leamer, E. E., “Sensitivity Analysis Would Help”, American Economic Review, Vol. 75, No 3, 1985, pp.308-‐13.
[16] R., Renelt, D., “Sensitivity Analysis of Cross-‐Country Growth Regressions”, American Economic Review, Vol. 82, No 4, 1992, pp.942-‐63.
[17] Levine, R., Zervos, S., “Stock Markets, Banks, and Economic growth”, American Economic Review, Vol. 88, No. 3, 1998, pp.537-‐58.
[18] Levine, R., Loayza, N., Beck, T., “Financial Intermediation and Growth: Causality and Causes”, Journal of Monetary Economics, Vol. 46, 2000, pp.31-‐77.
Impact of Development and Efficiency of Financial Sector on Economic Growth: Empirical Evidence from Developing Countries
205
Vol. III, Issue 3 June 2013
[19] Rioja, F., Valev, N., “Finance and the Sources of Growth at Various Stages of Economic Development”, Economic Inquiry, Vol. 42, No 1, 2004, pp. 127-‐140.
[20] Roubini, N., Sala-‐i-‐Martin, X., “Financial Repression and Economic Growth”, Journal of Development Economics, Vol. 39, 1992, pp.5-‐30.
[21] Rousseau, P. L., Wachtel, P., “Financial Intermediation and Economic Performance: Historical Evidence from Five Industrialized Countries”, Journal of Money, Credit and Banking, Vol. 30, No 4, 1998, pp.657-‐78.
[22] Shleifer, A., Vishny, R. W., “Survey of Corporate Governance, National Bureau of Economic Research”, NBER Working Paper 5554. 1996.
[23] Temple, J., “The New Growth Evidence”, Journal of Economic Literature, Vol. 37, No 1, 1999, pp.112-‐56.
[24] Waheed, A., Najia, Y., “Financial Development and Economic Growth: Empirical Evidence from Pakistan”, Asian Economic Review, Vol. 51, No 1, 2009, pp.33-‐42.
[25] World Bank, World Development Indicators. Washington D.C. The World Bank, 2008.
[26] Xu, Z., “Financial Development, Investment, and Economic Growth”, Economic Inquiry, Vol. 38, 2000, pp.331-‐44.

Scientific Papers (www.scientificpapers.org) Journal of Knowledge Management, Economics and Information Technology
206
Vol. III, Issue 3 June 2013
Mediating Role of Knowledge Management in Effect of Management Accounting Practices on Firm Performance
Authors: David Han-‐Min Wang, Department of Accounting, Feng Chia University, Taichung, Taiwan, [email protected], Quang Linh Huynh, PhD Program in Business, Feng Chia University, Taichung, Taiwan and Faculty of Economics, Laws and Foreign Languages, Tra Vinh University, Tra Vinh, Vietnam, [email protected]
While adopting knowledge management can improve firm performance, it is determined by implementing level of management accounting practices. Furthermore, it plays mediating role in the relationship between implementing management accounting practices and firm performance. This paper employs path analysis to investigate causal relationships among the variables. Then it uses procedures suggested by Sobel (1982) to examine the mediation of adopting knowledge management. Moreover, this paper utilizes techniques modified from analytic hierarchy process introduced by Saaty (1980) to rank contributing levels of adopting knowledge management and implementing management accounting practices to improved firm performance. The findings offer evidence on relationships among the variables as well as mediating role of adopting knowledge management in effect of implementing management accounting practices on firm performance. This paper also reveals that adopting knowledge management is more important to improved firm performance than implementing management accounting practices. This paper is useful to management researchers as well as business managers.
Keywords: Adoption of knowledge management; Implementation of management accounting practice; Firm performance
12
Mediating Role of Knowledge Management in Effect of Management Accounting Practices on Firm Performance
207
Vol. III, Issue 3 June 2013
Introduction
Knowledge management is one of the determinants for the success of firms. It can help firms establish long-‐term internal strengths and maintain competitive advantages in the dynamically changing external environments. In the first decade of the 21st century, the business communities begin to take interest in knowledge management. Consequently, it becomes a hot topic in management research. Firms that consistently control and integrate knowledge into business activities to achieve their objectives can attain superior success (Teece 1998; Droge et al. 2003). Darroch (2005) suggests that knowledge management offers a coordinating mechanism to transform resources into competences. Adopting and performing knowledge management allows firms to enjoy enhanced performance (Hsu et al. 2007; Chen and Huang 2009).
Management accounting practices play an important role in offering timely and exact important information to managers. Hence, they can make better decisions on business, which helps their firms achieve superior advantages over competitors. Prior research (Tayles et al. 2002; Novas et al. 2012) confirms that implementing management accounting practices in business leads to the higher adoption of knowledge management. Moreover, the implementation of management accounting information is regarded as the determinant of improved firm performance (Wang and Huynh 2012). The effects of adopting knowledge management and implementing management accounting practices on firm performance have been investigated in separate models. Therefore, we find it necessary to combine the adoption of knowledge management and the implementation of management accounting practices into a joint model of firm performance and examine their casual relationships.
More importantly, based on the research on the mediation by Baron and Kenny (1986), we infer that the adoption of knowledge management plays an important role in interfering with the effect of implementing management accounting practices on firm performance. Nevertheless, to the best of our knowledge, no research has explored the mediating role of adopting knowledge management in the effect of implementing management accounting practices on firm performance. It is necessary to investigate this mediating role of adopting knowledge management. Furthermore, the evidence on the relative influencing levels of the adoption
Mediating Role of Knowledge Management in Effect of Management Accounting Practices on Firm Performance
208
Vol. III, Issue 3 June 2013
of knowledge management in comparison with the implementation of management accounting practices on firm performance is important to business managers in their decisions on performing knowledge management and management accounting practices in business. However, it seems that no studies ranked these relative influencing levels. We find it essential to compare the effecting degrees to which adopting knowledge management and implementing management accounting practices contribute to improved firm performance.
This paper applies a path analysis to examine simultaneously the causal relationships among adopting knowledge management, implementing management accounting practices and firm performance. It then uses a technique suggested by Sobel (1982) to investigate the mediating role that the adoption of knowledge management plays in the effect of implementing management accounting practices on firm performance. Finally, this paper utilizes a method modified from the analytic hierarchy process introduced by Saaty (1980) to rank the relative importance levels that adopting knowledge management and implementing management accounting practices contribute to improved firm performance.
To the literature, the findings provide evidence on the mediating influence of adopting knowledge management on the link between implementing management accounting practices and firm performance as well as evidence on the relative importance that adopting knowledge management in comparison with implementing management accounting practices contribute to improved firm performance.
To business managers, the research is useful by providing them with better understanding of the affecting levels of adopting knowledge management compared to implementing management accounting practices on improved firm performance and how the relationship between implementing management accounting practices and firm performance is intervened by the adoption level of knowledge management in business. As a result, they can make better decisions on the choice and use of knowledge management as well as management accounting practices in their business, which will bring about the best possible performance.
The rest of the paper will be constructed as follows. The hypothesis development will be discussed in the next section, followed by the research

Mediating Role of Knowledge Management in Effect of Management Accounting Practices on Firm Performance
209
Vol. III, Issue 3 June 2013
design. The subsequent section describes the findings. Some summaries are offered in the conclusions.
Hypothesis Development Knowledge Management and Management Accounting
It is given that the management of knowledge will help a firm create long-‐term competitive advantages, which results in business success in the dynamically changing environment. Knowledge management is referred to as a firm’s capability that guides its employees to work together to generate, capture, share, and leverage their collective knowledge to enhance their performance (Lakshman 2007). It is also defined as the extent to which firms are contented with the adoption levels of their knowledge management resulting in different levels of knowledge sharing and knowledge application (Gold et al. 2001; Lin and Lee 2005). This definition of knowledge management is employed for this paper.
Traditional management accounting practices, such as traditional budgeting, cost volume profit analysis, and variance analysis, which focus on concerns internal to the firm and are financially oriented, are no more considered as a supportive means to provide sufficient information for planning and management in the current ever-‐changing business environment by many researchers (Kaplan 1983; Lucas 1997). In order to gain the competitive advantages, firms should also relate their control tools to more advanced management systems, such as activity based costing, total quality management and balanced scorecard, which combine both financial and non-‐financial information, in meeting customers’ individual requirements (Lucas 1997). Following these perspectives, we define the adoption level of management accounting practices for the current paper as the degree to which a firm chooses and implements the management accounting practices composed of both the above-‐mentioned traditional and advanced techniques for managing business.
Management accounting practices are reported to influence the adoption level of intellectual capital (Tayles et al, 2002; Novas et al. 2012). When having investigated the relationship between the level of intellectual capital management and the implementation of accounting management practices, Tayles et al. (2002) ascertain that the implementation of
Mediating Role of Knowledge Management in Effect of Management Accounting Practices on Firm Performance
210
Vol. III, Issue 3 June 2013
accounting management practices supports the management of intellectual capital. Likewise, the research by Novas et al. (2012), on the relationship between management accounting practices and intellectual capital, discusses the role that management accounting practices play in the development of intellectual capital, and reveal that management accounting practices place statistically positive effect on the level of investment in intellectual capital. In addition, intellectual capital is regarded as “useful knowledge” (Klein and Prusak 1994). Hence, the relationship between management accounting and knowledge management can be considered as similar to the connection between management accounting and intellectual capital. Based on the premise of extant research, a proposition that there is a relationship between the level of knowledge management adoption and the implementation of management accounting practices can be arrived at as the following hypothesis.
H1: the adoption of knowledge management is positively related to the implementation of management accounting practices
Firm Performance
Firm performance is defined as the actual accumulated results of all activities of a firm having achieved its goals. Within a firm there are often two primary outcomes analyzed, which are financial performance and non-‐financial performance. While non-‐financial performance is assessed on the items of innovativeness, quality, and customer satisfaction (Hudson et al., 2001; Kaplan and Norton, 2007); financial performance is measured on the items of return on asset and on equity (Droge et al., 2003). Both the dimensions of financial performance and non-‐financial performance are used as “firm performance” for this paper.
It is reported that the adoption of knowledge management offers more value to a firm’s overall performance as well as helps the firm become productive, more efficient, and more innovative (Gold et al., 2001). Droge et al. (2003) and McKeen et al. (2006) suggest that the adoption of knowledge management in business will bring about improved performance in business. They confirm that firm performance is influenced by the adoption of knowledge management in two main ways. Firstly, knowledge management can help create knowledge, which can contribute to improved firm performance. Secondly, knowledge management can directly make

Mediating Role of Knowledge Management in Effect of Management Accounting Practices on Firm Performance
211
Vol. III, Issue 3 June 2013
improvements in firm performance. While the adoption of knowledge management is emphasized to relate to firm performance (Hsu et al. 2007), it plays a critical role in improving firm performance (Chen and Huang 2009). Relying on the above discussions, we conjecture the following hypothesis.
H2: adopting knowledge management in business will result in improved firm performance
Management accounting practices are aimed to facilitate decision-‐making by collecting, processing and communicating information that assists managers to plan, organize, manage and assess business processes, firm strategy as well as firm performance. In a research on management accounting, Ajibolade et al. (2010) determined a positive relationship between the implementation of management accounting practices and firm performance. In addition, Wang and Huynh (2012) claim that the higher use of management accounting information will help managers to enhance their business performance. Furthermore, Williams and Seaman 2002 also provide evidence on the role of accounting information practices in enhancing firm performance. Based on the previous findings, we come to a hypothesis below.
H3: implementing management accounting practices will enhance firm performance
Mediating Effect of Knowledge Management Adoption
Relationships between variables are often more complicated than a simple bivariate relationship between an explanatory variable and an explained variable. The relationship between an independent variable and a dependent variable is often modified by the addition of a third variable in the research model. Baron and Kenny (1986) suggest a method to consider the third variable effect on the association between the independent variable and the dependent variable. In order to determine whether the mediating influence exists, they claim that it is necessary to establish three conditions. First, an independent variable significantly predicts a dependent variable. Second, the independent variable significantly also determines a third variable. Third, the third variable, in turn, explains the dependent variable. If the three conditions are satisfied, then it can be suggested that the third or intermediate variable interferes with the relationship between the
Mediating Role of Knowledge Management in Effect of Management Accounting Practices on Firm Performance
212
Vol. III, Issue 3 June 2013
independent variable and the dependent variable. Furthermore, to investigate the mediating effect, Sobel (1982) proposes a procedure to examine the statistical significance for the indirect effect of the intermediate or mediating variable by testing the null hypothesis that states the indirect effect of the mediating variable on the relationship between the independent variable and the dependent variable is not occurred. As above discussed, it is hypothesized that the implementation of management accounting practices improves firm performance (H3). In addition, the adoption of knowledge management is posited as being positively related to the implementation of management accounting practices (H1), while the adoption of knowledge management is considered as a determinant of improved firm performance (H2). Grounded on the arguments by Baron and Kenny (1986), these hypotheses allow us to arrive at the hypothesis as follows.
H4: the adoption of knowledge management mediates the relationship between the implementation of management accounting practices and firm performance
Based on the above discussed literature review, the four hypotheses are reached for this paper, which suggests a research model as presented in Fig. 1. The research model demonstrates the relationships among the three variables that are the implementation of management accounting practices, the adoption of knowledge management and firm performance. Each of the three variables and their analytical procedures are explained in more detail in the next parts.
Research Design Data Collection
The data used for this paper was gathered from a sample of the 705 Vietnamese firms listed publicly in the two only Vietnamese Stock Exchanges, in which 397 are listed on Ha Noi Stock Exchange and the other 308 on Ho Chi Minh Stock Exchange. The initial solicitations requested responses from key informants with experience in knowledge management and management accounting. The questionnaire was completed with a manager involved in knowledge management and management accounting for each targeted firm. We sent questionnaires to 475 firms by email and in
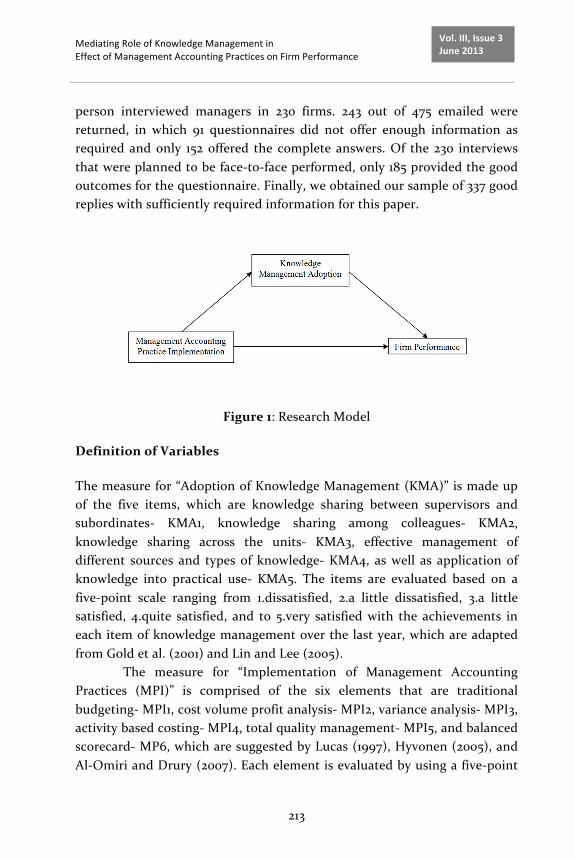
Mediating Role of Knowledge Management in Effect of Management Accounting Practices on Firm Performance
213
Vol. III, Issue 3 June 2013
person interviewed managers in 230 firms. 243 out of 475 emailed were returned, in which 91 questionnaires did not offer enough information as required and only 152 offered the complete answers. Of the 230 interviews that were planned to be face-‐to-‐face performed, only 185 provided the good outcomes for the questionnaire. Finally, we obtained our sample of 337 good replies with sufficiently required information for this paper.
Figure 1: Research Model
Definition of Variables
The measure for “Adoption of Knowledge Management (KMA)” is made up of the five items, which are knowledge sharing between supervisors and subordinates-‐ KMA1, knowledge sharing among colleagues-‐ KMA2, knowledge sharing across the units-‐ KMA3, effective management of different sources and types of knowledge-‐ KMA4, as well as application of knowledge into practical use-‐ KMA5. The items are evaluated based on a five-‐point scale ranging from 1.dissatisfied, 2.a little dissatisfied, 3.a little satisfied, 4.quite satisfied, and to 5.very satisfied with the achievements in each item of knowledge management over the last year, which are adapted from Gold et al. (2001) and Lin and Lee (2005).
The measure for “Implementation of Management Accounting Practices (MPI)” is comprised of the six elements that are traditional budgeting-‐ MPI1, cost volume profit analysis-‐ MPI2, variance analysis-‐ MPI3, activity based costing-‐ MPI4, total quality management-‐ MPI5, and balanced scorecard-‐ MP6, which are suggested by Lucas (1997), Hyvonen (2005), and Al-‐Omiri and Drury (2007). Each element is evaluated by using a five-‐point

Mediating Role of Knowledge Management in Effect of Management Accounting Practices on Firm Performance
214
Vol. III, Issue 3 June 2013
scale ranging from 1.never considering, 2.decided not to introduce, 3.favored to introduce, 4.intended to introduce, to 5.under implementation of that element, adapted from Cinquini et al. (2008).
The measure for “Firm Performance (FPF)” is based on both financial performance and non-‐financial performance. For the financial performance proxy, we use the two items that are return on asset-‐ FPF1 and return on equity-‐ FPF2, which are modified from Droge et al. (2003). For the non-‐financial performance proxy, we employ the three items, namely innovativeness-‐ FPF3, quality in products or services-‐ FPF4, and customer satisfaction-‐ FPF5, which are adapted from Hudson et al. (2001), and Kaplan and Norton (2007). The items are assessed by using a five-‐point scale from no growth, a little growth, average growth, fast growth to very fast growth. The items of our sample firms’ performance were compared to the average of the industry during the last year.
Analytical Procedures
Before the investigation of our hypotheses, a reliability analysis approach is performed to test the properties of measurement scales and the items that make up the scales. Nunnally (1978) proposed the reliability analysis to assess the degree to which multiple measures of the same scale are consistent with one another. The correlations between individual elements within the construct are provided. The scale will produce consistent and reliable results, if the correlations are high. Then, a factor analysis is carried out to evaluate the construct validity. Hair et al. (2009) introduce the factor analysis method and suggest that items should be strongly correlated with their own factors to attain internal consistency. Moreover, the correlations among the main factors are examined to check the problem of multicollinearity. Subsequently, a path analysis is utilized to investigate the casual relationships among the implementation of management accounting practices, the adoption of knowledge management and firm performance. The procedures suggested by Sobel (1982) are applied to test the mediating effect of the adoption of knowledge management on the casual relationship between the implementation of management accounting practices and firm performance. Lastly, a method modified from the analytic hierarchy process introduced by Saaty (1980) is conducted to rank the relative effects of the
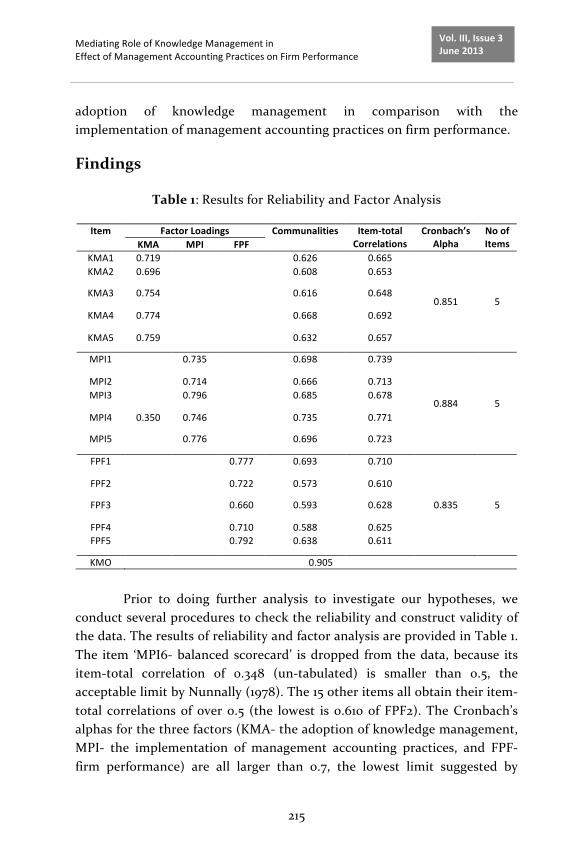
Mediating Role of Knowledge Management in Effect of Management Accounting Practices on Firm Performance
215
Vol. III, Issue 3 June 2013
adoption of knowledge management in comparison with the implementation of management accounting practices on firm performance.
Findings
Table 1: Results for Reliability and Factor Analysis
Item Factor Loadings Communalities Item-‐total Correlations
Cronbach’s Alpha
No of Items KMA MPI FPF
KMA1 0.719 0.626 0.665
0.851 5
KMA2 0.696 0.608 0.653
KMA3 0.754 0.616 0.648
KMA4 0.774 0.668 0.692
KMA5 0.759 0.632 0.657
MPI1 0.735 0.698 0.739
0.884 5
MPI2 0.714 0.666 0.713 MPI3 0.796 0.685 0.678
MPI4 0.350 0.746 0.735 0.771
MPI5 0.776 0.696 0.723
FPF1 0.777 0.693 0.710
0.835 5
FPF2 0.722 0.573 0.610
FPF3 0.660 0.593 0.628
FPF4 0.710 0.588 0.625 FPF5 0.792 0.638 0.611
KMO 0.905
Prior to doing further analysis to investigate our hypotheses, we
conduct several procedures to check the reliability and construct validity of the data. The results of reliability and factor analysis are provided in Table 1. The item ‘MPI6-‐ balanced scorecard’ is dropped from the data, because its item-‐total correlation of 0.348 (un-‐tabulated) is smaller than 0.5, the acceptable limit by Nunnally (1978). The 15 other items all obtain their item-‐total correlations of over 0.5 (the lowest is 0.610 of FPF2). The Cronbach’s alphas for the three factors (KMA-‐ the adoption of knowledge management, MPI-‐ the implementation of management accounting practices, and FPF-‐ firm performance) are all larger than 0.7, the lowest limit suggested by
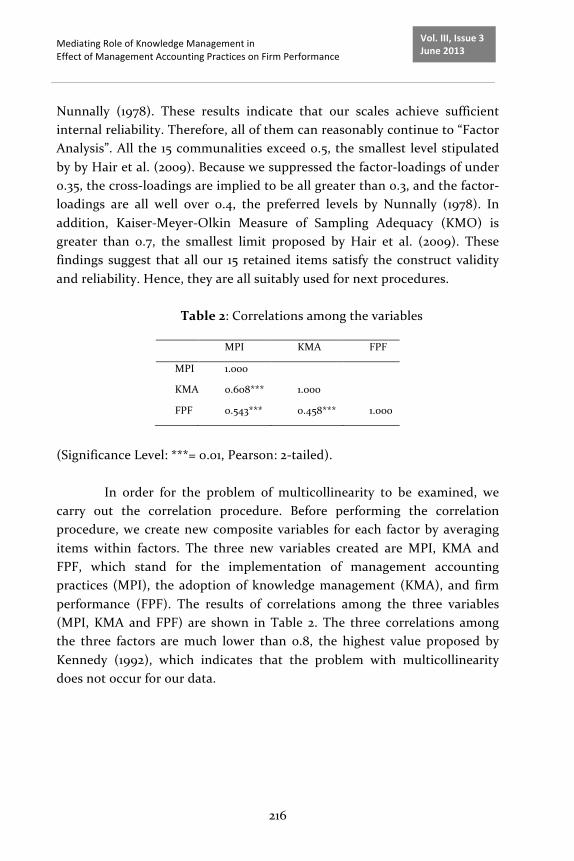
Mediating Role of Knowledge Management in Effect of Management Accounting Practices on Firm Performance
216
Vol. III, Issue 3 June 2013
Nunnally (1978). These results indicate that our scales achieve sufficient internal reliability. Therefore, all of them can reasonably continue to “Factor Analysis”. All the 15 communalities exceed 0.5, the smallest level stipulated by by Hair et al. (2009). Because we suppressed the factor-‐loadings of under 0.35, the cross-‐loadings are implied to be all greater than 0.3, and the factor-‐loadings are all well over 0.4, the preferred levels by Nunnally (1978). In addition, Kaiser-‐Meyer-‐Olkin Measure of Sampling Adequacy (KMO) is greater than 0.7, the smallest limit proposed by Hair et al. (2009). These findings suggest that all our 15 retained items satisfy the construct validity and reliability. Hence, they are all suitably used for next procedures.
Table 2: Correlations among the variables
MPI KMA FPF
MPI 1.000
KMA 0.608*** 1.000
FPF 0.543*** 0.458*** 1.000
(Significance Level: ***= 0.01, Pearson: 2-‐tailed).
In order for the problem of multicollinearity to be examined, we
carry out the correlation procedure. Before performing the correlation procedure, we create new composite variables for each factor by averaging items within factors. The three new variables created are MPI, KMA and FPF, which stand for the implementation of management accounting practices (MPI), the adoption of knowledge management (KMA), and firm performance (FPF). The results of correlations among the three variables (MPI, KMA and FPF) are shown in Table 2. The three correlations among the three factors are much lower than 0.8, the highest value proposed by Kennedy (1992), which indicates that the problem with multicollinearity does not occur for our data.
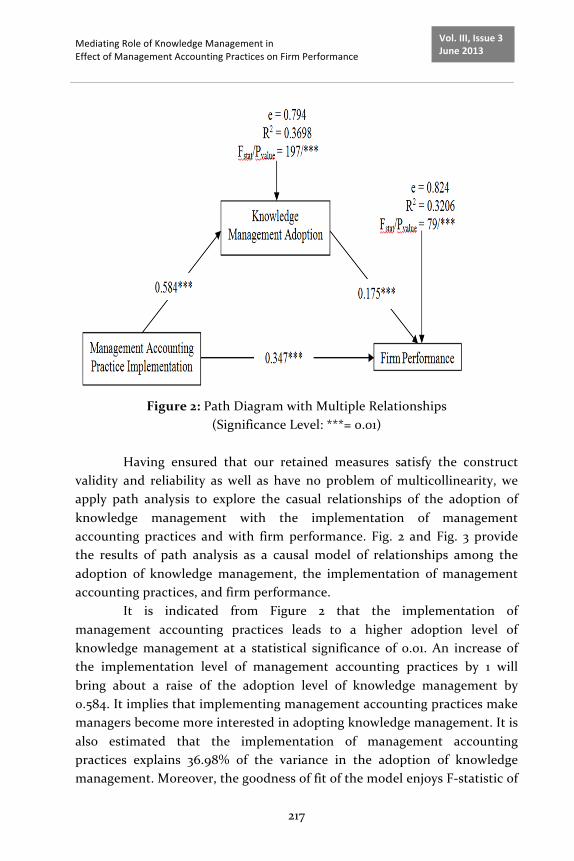
Mediating Role of Knowledge Management in Effect of Management Accounting Practices on Firm Performance
217
Vol. III, Issue 3 June 2013
Figure 2: Path Diagram with Multiple Relationships
(Significance Level: ***= 0.01)
Having ensured that our retained measures satisfy the construct validity and reliability as well as have no problem of multicollinearity, we apply path analysis to explore the casual relationships of the adoption of knowledge management with the implementation of management accounting practices and with firm performance. Fig. 2 and Fig. 3 provide the results of path analysis as a causal model of relationships among the adoption of knowledge management, the implementation of management accounting practices, and firm performance.
It is indicated from Figure 2 that the implementation of management accounting practices leads to a higher adoption level of knowledge management at a statistical significance of 0.01. An increase of the implementation level of management accounting practices by 1 will bring about a raise of the adoption level of knowledge management by 0.584. It implies that implementing management accounting practices make managers become more interested in adopting knowledge management. It is also estimated that the implementation of management accounting practices explains 36.98% of the variance in the adoption of knowledge management. Moreover, the goodness of fit of the model enjoys F-‐statistic of

Mediating Role of Knowledge Management in Effect of Management Accounting Practices on Firm Performance
218
Vol. III, Issue 3 June 2013
197 at the significance of 0.01. These findings support our hypothesis 1 that the adoption of knowledge management is positively related to the implementation of management accounting practices.
Figure 3: Path Diagram with a Simple Relationship
(Significance Level: ***= 0.01)
In regard to the effects on firm performance, the adoption of knowledge management and the implementation of management accounting practices both statistically affect firm performance at the significance of 0.01 with the coefficients of 0.175 and 0.347 respectively. In order words, when the adoption of knowledge management or the implementation of management accounting practices goes up by 1, firm performance will increase by 0.175 or 0.347 respectively. Hence, the implementation of management accounting practices improves more firm performance than the adoption of knowledge management. It is also shown that the adoption of knowledge management and the implementation of management accounting practices explain 32.06% of the variation in firm performance. Furthermore, the model achieves the goodness of fit with F-‐statistic of 79 at the significance of 0.01. In short, these results offer evidence to support our hypotheses 2 and 3 that the adoption of knowledge management and the implementation of management accounting practices both result in improved firm performance.
The path analysis also demonstrates the direct and indirect effects of the implementation of management accounting practices on firm performance. In addition to the direct influence on firm performance, in which the implementation of management accounting practices puts a statistical impact on firm performance at the 0.01 significance level with the estimate of 0.347, the implementation of management accounting practices
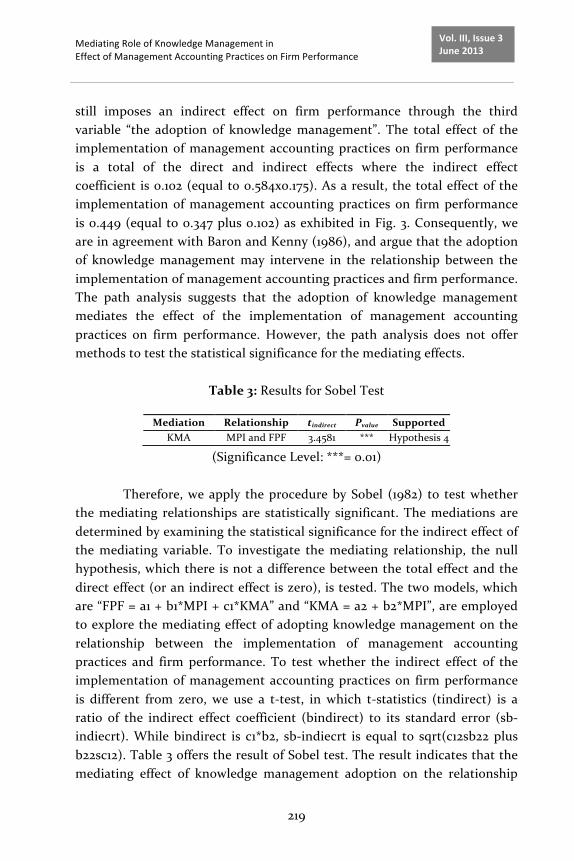
Mediating Role of Knowledge Management in Effect of Management Accounting Practices on Firm Performance
219
Vol. III, Issue 3 June 2013
still imposes an indirect effect on firm performance through the third variable “the adoption of knowledge management”. The total effect of the implementation of management accounting practices on firm performance is a total of the direct and indirect effects where the indirect effect coefficient is 0.102 (equal to 0.584x0.175). As a result, the total effect of the implementation of management accounting practices on firm performance is 0.449 (equal to 0.347 plus 0.102) as exhibited in Fig. 3. Consequently, we are in agreement with Baron and Kenny (1986), and argue that the adoption of knowledge management may intervene in the relationship between the implementation of management accounting practices and firm performance. The path analysis suggests that the adoption of knowledge management mediates the effect of the implementation of management accounting practices on firm performance. However, the path analysis does not offer methods to test the statistical significance for the mediating effects.
Table 3: Results for Sobel Test
Mediation Relationship tindirect Pvalue Supported KMA MPI and FPF 3.4581 *** Hypothesis 4
(Significance Level: ***= 0.01)
Therefore, we apply the procedure by Sobel (1982) to test whether the mediating relationships are statistically significant. The mediations are determined by examining the statistical significance for the indirect effect of the mediating variable. To investigate the mediating relationship, the null hypothesis, which there is not a difference between the total effect and the direct effect (or an indirect effect is zero), is tested. The two models, which are “FPF = a1 + b1*MPI + c1*KMA” and “KMA = a2 + b2*MPI”, are employed to explore the mediating effect of adopting knowledge management on the relationship between the implementation of management accounting practices and firm performance. To test whether the indirect effect of the implementation of management accounting practices on firm performance is different from zero, we use a t-‐test, in which t-‐statistics (tindirect) is a ratio of the indirect effect coefficient (bindirect) to its standard error (sb-‐indiecrt). While bindirect is c1*b2, sb-‐indiecrt is equal to sqrt(c12sb22 plus b22sc12). Table 3 offers the result of Sobel test. The result indicates that the mediating effect of knowledge management adoption on the relationship
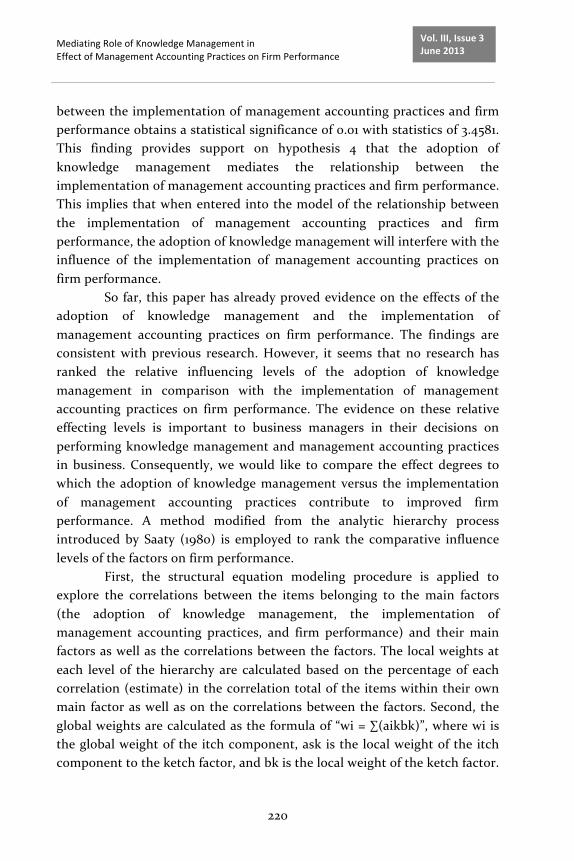
Mediating Role of Knowledge Management in Effect of Management Accounting Practices on Firm Performance
220
Vol. III, Issue 3 June 2013
between the implementation of management accounting practices and firm performance obtains a statistical significance of 0.01 with statistics of 3.4581. This finding provides support on hypothesis 4 that the adoption of knowledge management mediates the relationship between the implementation of management accounting practices and firm performance. This implies that when entered into the model of the relationship between the implementation of management accounting practices and firm performance, the adoption of knowledge management will interfere with the influence of the implementation of management accounting practices on firm performance.
So far, this paper has already proved evidence on the effects of the adoption of knowledge management and the implementation of management accounting practices on firm performance. The findings are consistent with previous research. However, it seems that no research has ranked the relative influencing levels of the adoption of knowledge management in comparison with the implementation of management accounting practices on firm performance. The evidence on these relative effecting levels is important to business managers in their decisions on performing knowledge management and management accounting practices in business. Consequently, we would like to compare the effect degrees to which the adoption of knowledge management versus the implementation of management accounting practices contribute to improved firm performance. A method modified from the analytic hierarchy process introduced by Saaty (1980) is employed to rank the comparative influence levels of the factors on firm performance.
First, the structural equation modeling procedure is applied to explore the correlations between the items belonging to the main factors (the adoption of knowledge management, the implementation of management accounting practices, and firm performance) and their main factors as well as the correlations between the factors. The local weights at each level of the hierarchy are calculated based on the percentage of each correlation (estimate) in the correlation total of the items within their own main factor as well as on the correlations between the factors. Second, the global weights are calculated as the formula of “wi = ∑(aikbk)”, where wi is the global weight of the itch component, ask is the local weight of the itch component to the ketch factor, and bk is the local weight of the ketch factor.

Mediating Role of Knowledge Management in Effect of Management Accounting Practices on Firm Performance
221
Vol. III, Issue 3 June 2013
The procedure yields the results as displayed in Fig. 4 and Tables 4 to 6. Fig. 4 demonstrates the casual relationships of the adoption of knowledge management and the implementation of management accounting practices with firm performance as well as the correlations between items and their own factors.
Figure 4: SEM Diagram Table 4 indicates that Χ2/df falls in the range of 2 – 3, the acceptable
level suggested by Koufaris and Hampton-‐sosa (2002). GFI, IFI, TLI, and CFI are all more than 0.9, the proposed limit by Hair et al. (2009). Root Mean Square Error of Approximation (RMSEA) is 0.072 less than the 0.07 cut-‐off (Hair et al., 2009). These results suggest that the model obtains the good fit to the data.
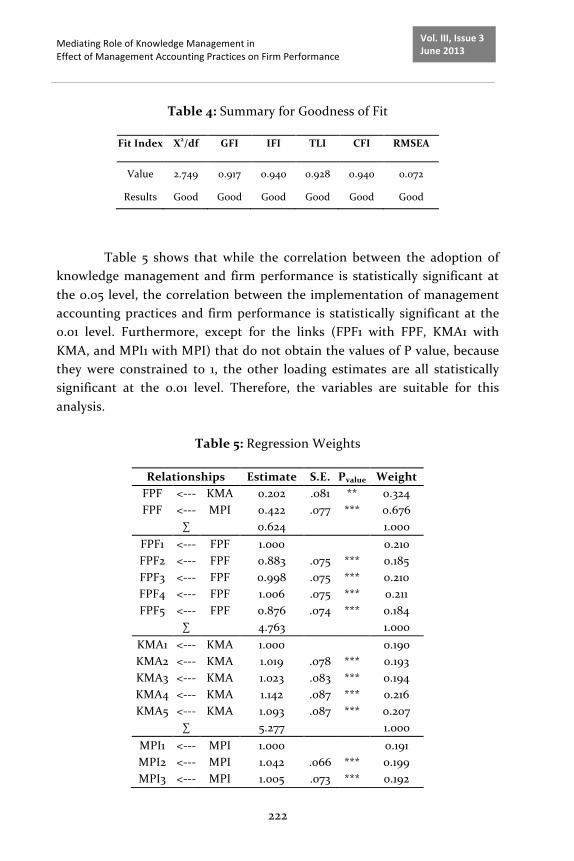
Mediating Role of Knowledge Management in Effect of Management Accounting Practices on Firm Performance
222
Vol. III, Issue 3 June 2013
Table 4: Summary for Goodness of Fit
Fit Index Χ2/df GFI IFI TLI CFI RMSEA
Value 2.749 0.917 0.940 0.928 0.940 0.072
Results Good Good Good Good Good Good
Table 5 shows that while the correlation between the adoption of
knowledge management and firm performance is statistically significant at the 0.05 level, the correlation between the implementation of management accounting practices and firm performance is statistically significant at the 0.01 level. Furthermore, except for the links (FPF1 with FPF, KMA1 with KMA, and MPI1 with MPI) that do not obtain the values of P value, because they were constrained to 1, the other loading estimates are all statistically significant at the 0.01 level. Therefore, the variables are suitable for this analysis.
Table 5: Regression Weights
Relationships Estimate S.E. Pvalue Weight FPF <-‐-‐-‐ KMA 0.202 .081 ** 0.324 FPF <-‐-‐-‐ MPI 0.422 .077 *** 0.676
∑ 0.624 1.000 FPF1 <-‐-‐-‐ FPF 1.000 0.210 FPF2 <-‐-‐-‐ FPF 0.883 .075 *** 0.185 FPF3 <-‐-‐-‐ FPF 0.998 .075 *** 0.210 FPF4 <-‐-‐-‐ FPF 1.006 .075 *** 0.211 FPF5 <-‐-‐-‐ FPF 0.876 .074 *** 0.184
∑ 4.763
1.000 KMA1 <-‐-‐-‐ KMA 1.000 0.190 KMA2 <-‐-‐-‐ KMA 1.019 .078 *** 0.193 KMA3 <-‐-‐-‐ KMA 1.023 .083 *** 0.194 KMA4 <-‐-‐-‐ KMA 1.142 .087 *** 0.216 KMA5 <-‐-‐-‐ KMA 1.093 .087 *** 0.207
∑ 5.277 1.000 MPI1 <-‐-‐-‐ MPI 1.000 0.191 MPI2 <-‐-‐-‐ MPI 1.042 .066 *** 0.199 MPI3 <-‐-‐-‐ MPI 1.005 .073 *** 0.192
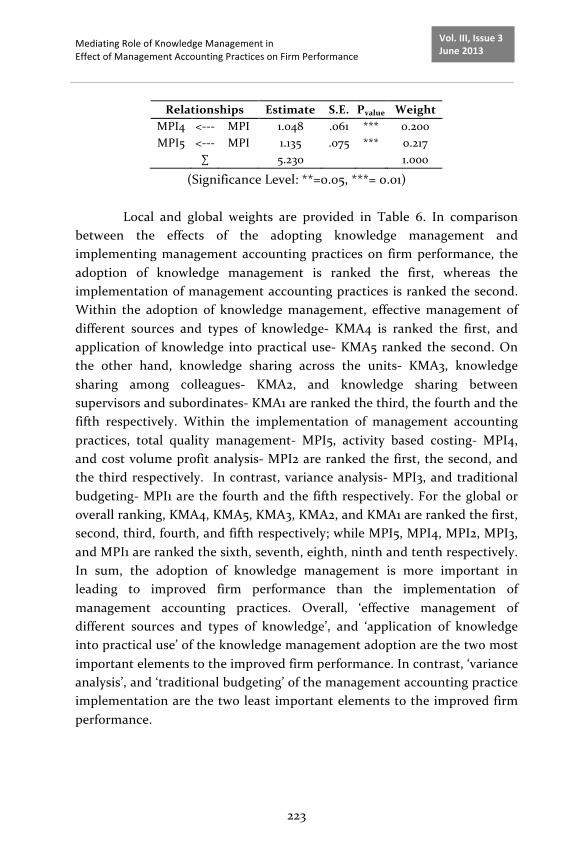
Mediating Role of Knowledge Management in Effect of Management Accounting Practices on Firm Performance
223
Vol. III, Issue 3 June 2013
Relationships Estimate S.E. Pvalue Weight MPI4 <-‐-‐-‐ MPI 1.048 .061 *** 0.200 MPI5 <-‐-‐-‐ MPI 1.135 .075 *** 0.217
∑ 5.230 1.000
(Significance Level: **=0.05, ***= 0.01)
Local and global weights are provided in Table 6. In comparison between the effects of the adopting knowledge management and implementing management accounting practices on firm performance, the adoption of knowledge management is ranked the first, whereas the implementation of management accounting practices is ranked the second. Within the adoption of knowledge management, effective management of different sources and types of knowledge-‐ KMA4 is ranked the first, and application of knowledge into practical use-‐ KMA5 ranked the second. On the other hand, knowledge sharing across the units-‐ KMA3, knowledge sharing among colleagues-‐ KMA2, and knowledge sharing between supervisors and subordinates-‐ KMA1 are ranked the third, the fourth and the fifth respectively. Within the implementation of management accounting practices, total quality management-‐ MPI5, activity based costing-‐ MPI4, and cost volume profit analysis-‐ MPI2 are ranked the first, the second, and the third respectively. In contrast, variance analysis-‐ MPI3, and traditional budgeting-‐ MPI1 are the fourth and the fifth respectively. For the global or overall ranking, KMA4, KMA5, KMA3, KMA2, and KMA1 are ranked the first, second, third, fourth, and fifth respectively; while MPI5, MPI4, MPI2, MPI3, and MPI1 are ranked the sixth, seventh, eighth, ninth and tenth respectively. In sum, the adoption of knowledge management is more important in leading to improved firm performance than the implementation of management accounting practices. Overall, ‘effective management of different sources and types of knowledge’, and ‘application of knowledge into practical use’ of the knowledge management adoption are the two most important elements to the improved firm performance. In contrast, ‘variance analysis’, and ‘traditional budgeting’ of the management accounting practice implementation are the two least important elements to the improved firm performance.

Mediating Role of Knowledge Management in Effect of Management Accounting Practices on Firm Performance
224
Vol. III, Issue 3 June 2013
Table 6: Local & global weights and ranks of levels 1 and 2
Explained Variable
Explanatory Variable
Local Weights
Local Rank
Items Local Weights
Local Rank
Global Weights
Overall Rank
Firm
Perform
ance
Management Accounting Practice
Implementation
0.324 2
MPI1 0.191 5 0.0619 10 MPI2 0.199 3 0.0645 8 MPI3 0.192 4 0.0622 9 MPI4 0.200 2 0.0648 7 MPI5 0.217 1 0.0703 6
Knowledge Management Adoption
0.676 1
KMA1 0.190 5 0.1284 5 KMA2 0.193 4 0.1305 4 KMA3 0.194 3 0.1311 3 KMA4 0.216 1 0.1460 1 KMA5 0.207 2 0.1399 2
Conclusions
The importance that the adoption of knowledge management and the implementation of management accounting practices contribute to improved firm performance has been investigated in prior studies. They have explored relationships in separate research models. We combine the adoption of knowledge management with the implementation of management accounting practices to form a joint research model of firm performance. This paper employs a path analysis procedure to investigate the causal relationships among the adoption of knowledge management, the implementation of management accounting practices and firm performance. Furthermore, grounded on the arguments by Baron and Kenny (1986), we can posit that the adoption of knowledge management intervene in the effect of the implementation of management accounting practices on firm performance. Nonetheless, no research has examined this intervenient effect. We find it necessary to explore this mediating relationship. Hence, we utilize a analysis technique suggested by Sobel (1982) to test the statistical significance for the mediating effect. In addition, the contributing levels that the factors make to improved firm performance are necessarily explored. We apply a method modified from the analytic hierarchy process proposed by Saaty (1980) to rank the relative importance levels that the adoption of knowledge management versus the implementation of management accounting practices contribute to improved firm performance.

Mediating Role of Knowledge Management in Effect of Management Accounting Practices on Firm Performance
225
Vol. III, Issue 3 June 2013
This paper finds out that implementing management accounting practices make managers become more interested in adopting knowledge management and thereby they more likely adopt knowledge management in their business. In addition, implementing management accounting practices and adopting knowledge management both result in enhanced firm performance. The results also reveal that when included into the research model of the influence of management accounting practice implementation on firm performance, adopting knowledge management will intervene in the impact of the implementation of management accounting practices on firm performance, in which it reduces this impact. This paper offers evidence that adopting knowledge management is more important in contributing to enhanced firm performance than implementing management accounting practices. ‘Effective management of different sources and types of knowledge’, and ‘application of knowledge into practical use’ of the knowledge management adoption are the most important elements; whereas, ‘variance analysis’, and ‘traditional budgeting’ of the management accounting practice implementation are the least important elements to improved firm performance.
This paper contributes to the literature by providing evidence on the mediating influence of adopting knowledge management on the relationship between implementing management accounting practices and firm performance. It also offers evidence on the relative importance between adopting knowledge management and implementing management accounting practices in leading to improved firm performance. The findings will help firm managers to get better understanding of the relationships among the adoption of knowledge management, the implementation of management accounting practices and firm performance. Therefore, they can make better decisions on implementing knowledge management as well as management accounting practices in business, so that their firms will attain the best possible performance.
References
[1] Ajibolade S. O., Arowomole S. S. A. and Ojikutu R. K., 2010. Management accounting systems, perceived environmental uncertainty and companies’ performance in Nigeria. International Journal of Academic Research, 2(1), 195-‐201
Mediating Role of Knowledge Management in Effect of Management Accounting Practices on Firm Performance
226
Vol. III, Issue 3 June 2013
[2] Al-‐Omiri M. and Drury. C., 2007. A Survey of factors influencing the choice of product costing systems in UK organizations. Management Accounting Research, 18(4), 399-‐424.
[3] Baron R. M. and Kenny. D. A., 1986. The moderator-‐mediator variable distinction in social psychological research: Conceptual, strategic, and statistical considerations. Journal of Personality and Social Psychology, 51, 1173–1182
[4] M., and A. Bhimani. 1994. Management Accounting: Pathways to Progress. Chartered Institute of Management Accountants, London, England
[5] Chen C. J. and Huang. J. W., 2007. How organizational climate and structure affect knowledge management: The social interaction perspective. International Journal of Information Management, 27, 104–118.
[6] Cinquini L., Collini P., Marelli A. and Tenucci A., 2008. An exploration of the factors affecting the diffusion of Advanced Costing techniques: a comparative analysis of two surveys (1996-‐2005). 31st Annual Congress of the European Accounting Association, Campus of Erasmus University, Rotterdam, Nederland
[7] Darroch J., 2005. Knowledge management, innovation and firm performance. Journal of Knowledge Management, 9(3), 101 – 115
[8] Droge C., Claycomb C. and Germain. R., 2003. Does knowledge mediate the effect of context on performance? Some initial evidence. Decision Sciences, 34(3), 541–568
[9] Gold A. H., Malhotra A. and Segars. A. H., 2001. Knowledge management: An organizational capabilities perspective. Journal of Management Information System, 18(1), 185–214
[10] Hair J. F., Black W. C., Babin B.J., Anderson R. E. and Tatham R. L., 2009. Multivariate Data Analysis, Ed. New Jersey: Pearson Prentice Hall, USA
[11] Hsu R. C., Lawson D. and Liang. T. P., 2007. Factors affecting knowledge management adoption of Taiwan small and medium-‐sized enterprises. International Journal of Management and Enterprise Development, 4(1), 30–51
Mediating Role of Knowledge Management in Effect of Management Accounting Practices on Firm Performance
227
Vol. III, Issue 3 June 2013
[12] Hudson M., Smart A. and Bourne M., 2001. Theory and practice in SME performance measurement systems. International Journal of Operations & Production Management, 21(8), 1096 – 1115
[13] Hyvonen J., 2005. Adoption and benefits of management accounting systems: Evidence from Finland and Australia. Advances in International Accounting, 18, 97–120
[14] Kaplan R. S., 1983. Measuring manufacturing performance: a new challenge for managerial accounting research. The Accounting Review, 58 (4): 686-‐705
[15] Kaplan R. S. and Norton D. P., 2007. Using the balanced scorecard as a strategic management system. Harvard Business Review, July-‐August, 150–161
[16] Kennedy P. 1992. A Guide to Econometrics, 3rd ed. MIT Press, Cambridge, MA, USA
[17] Klein D.A. and Prusak. L., 1994. Characterizing intellectual capital. Working Paper, Centre for Business Innovation, Ernst and Young, London, England
[18] Koufaris M. and Hampton-‐sosa. W., 2002. Customer Trust Online: Examining the Role of the Experience with the Web Site. Information Systems Journal, 5, 1-‐22
[19] Lakshman C., 2007. Organizational Knowledge Leadership: A Grounded Theory Approach. Leadership and Organization Development Journal, 28(1), 51-‐75
[20] Lin H. F. and Lee. G. G., 2005. Impact of organizational learning and knowledge management factors on e-‐business adoption. Management Decision, 43(2), 171–188
[21] Lucas M., 1997. Standard costing and its role in today’s manufacturing environment. Management Accounting, 75 (4): 32-‐35
[22] McKeen J. D., Zack M. H. and Singh S., 2006. Knowledge management and organizational performance: An exploratory survey. In Proceedings of the 39th Hawaii International Conference on Systems Sciences, USA
[23] Novas J. C., Sousa A. and Alves M. C., 2012. On the Relations between Management Accounting Systems and Intellectual Capital: Evidence for Portuguese Companies. CEFAGE-‐UE, Working Paper 2012/13, Portugal
Mediating Role of Knowledge Management in Effect of Management Accounting Practices on Firm Performance
228
Vol. III, Issue 3 June 2013
[24] Nunnally J. C., 1978. Psychometric Theory. New York: McGraw-‐Hill, USA
[25] Saaty T.L., 1980. The Analytic Hierarchy Process. New York, McGraw-‐Hill, USA
[26] Sobel M. E., 1982. Asymptotic confidence intervals for indirect effects in structural equation models. Sociological Methodology, 13, 290–312
[27] Tayles M., Bramley A., Adshead N. and Farr. J., 2002. Dealing with the management of intellectual capital: the potential role of strategic management accounting. Accounting, Auditing and Accountability Journal, 15(2), 251-‐67
[28] Teece D. J., 1998. Capturing value from knowledge assets: The new economy, markets for know-‐how, and intangible assets. California Management Review, 40(3), 55–79
[29] Wang D. HM. and Huynh. Q. L., 2013. Effects of Environmental Uncertainty on Computerized Accounting System Adoption and Firm Performance. International Journal of Humanities and Applied Sciences, 2(1), 13-‐21
[30] J. J., and Seaman A. E., 2002. Management accounting systems change and departmental performance: the influence of managerial information and task uncertainty. Management Accounting Research, 13: 419–445
Scientific Papers (www.scientificpapers.org) Journal of Knowledge Management, Economics and Information Technology
229
Vol. III, Issue 3 June 2013
Understanding of Knowledge from Economist’s Perspective
Author: Kešeljević Aleksandar, Faculty of Economics, University of Ljubljana, Slovenia, [email protected]‐lj.si
Author’s approach to knowledge is based on the system of upgrading between knowledge as information, cognitive process, capital and a value. Knowledge cannot exist without it’s subject to whom the capacity of cognition is ascribed. Cognitive capacity is bounded due to imperfect information and the limits of the human mind and is becoming with individual's inclusion into the society socially contingent. Primarily knowledge represents an investment into an individual who can only through social capital fully employ the human capital acquired for oneself. Through organizational routines and practices individual knowledge is also increasingly spilling over to other users of knowledge causing organization to become an important carrier of knowledge. Organizations are therefore devoting more attention to systematic knowledge management as a tool for boosting intellectual capital which represents understanding of knowledge as capital in its full meaning. Knowledge as capital cannot be fully understood without a more profound grasp of freedom through which knowledge becomes a value. Keywords: knowledge; information; cognition; human capital; social capital; intellectual capital; freedom
Introduction
Fundamental shift has been occurring today from the economy based on physical resources to the one based on intangible ones. Already in the nineties of the previous century, the value of dematerialized assets exceeded
13
Understanding of Knowledge from Economist’s Perspective
230
Vol. III, Issue 3 June 2013
that of the materialized ones. Traditionally, the yardstick for business performance of an organization was revenues or profit; however Fortune magazine changed the ranking criteria for its list of top 500 US companies by employing a new concept called Market Value Added. By this measure, traditional American companies, such as General Motors, ranked at the bottom of the list, while companies like Intel, Microsoft, and others, emerged at the top. Analyses showed that in these companies the market value strongly exceeded the book value, which was the result of a new value called intellectual capital. In its background arises the problem of knowledge as one of the main resources and sources of competitive advantage (Nahapiet, Ghoshal, 2000; Choo, Bontis, 2001; Edvinsson, 2002).
Knowledge is becoming today an increasingly important factor of production. This is not to say that traditional factors of production are vanishing; their importance is merely becoming secondary. However, knowledge is paradoxically the least understood of all productive factors since knowledge terms(e.g. knowledge economy, intellectual capital) may be subject to certain ambiguity and since individual authors mainly defined knowledge from the aspect of scientific communities to which they belong. Thus, no single definition of knowledge exists today, and there are numerous theories to explain it and many classifications.
In the paper anew understanding of knowledge through four knowledge dimensions, which have been together only partly foreshadowed in the discussion so far, is presented (1). Through the system of upgrading the hierarchical relations between four knowledge categories will be presented in order to better capture the nature of knowledge (2).
Literature review
A profound understanding of knowledge requires a considerable scope, or breadth, of analysis. Knowledge appears as the subject of various studies, and one can hardly find an area where knowledge or terms and concepts closely related to it are not mentioned. Today, no single definition of knowledge exists, and there are numerous theories to explain it and many classifications. This is a result of the fact, that knowledge may be subject to certain ambiguity and that individual authors mainly defined knowledge from the aspect of scientific communities to which they belong.

Understanding of Knowledge from Economist’s Perspective
231
Vol. III, Issue 3 June 2013
For example, economic scientific discipline understands knowledge in relation to human capital (Schultz, 1961; Becker, 1964; Mincer, 1958) and information (Stigler, 1961; Hirshleifer, 1973) at the level of microeconomics, while at the level of macroeconomics in relation mostly to technology factors that appear in the background of the growth theory (Solow, 1956; Romer, 1994)1 .Psychology explores internal cognitive processes through which knowledge is acquired (Rahe, 2009) and pointing out that the cognitive capacity of the human mind is relatively small compared to the scale of problems that individuals face (Neisser, 1967; Simon, 1955).Sociology points out that, due to the increasing embeddedness of the individual into the society, different knowledge processes(e.g. transfer) are becoming more sociologically contingent (Shihao et al., 2010; Tsai, Lee, 2006; Granovetter, 1985; Etzioni, 1990). Business theories point out the problem of categorization of various types of knowledge2 (Kimmerle et al., 2010; Hecker, 2012; Lam, 2000; Nonaka, Takeuchi, 1995; Nahapiet, Ghoshal, 2000)in order to generate, through knowledge management within the framework of intellectual capital theory, a better business performance (Hsu, Wang, 2012; Moon, Kym, 2006; Youndt, Snell, 2004; Cheng et al., 2010). Understanding of knowledge through particular scientific communities obviously leads to partial analyses of knowledge. For example, orthodox economic theory devotes attention only to particular knowledge dimensions (e.g. information, human capital).
Any deeper study of knowledge as a cognitive process is entirely impossible, since ‘homo economics’ with unlimited cognitive capacity simply has no cognitive characteristics.
Overview also shows that in the literature the hierarchical concept prevails, known as the DIKW Hierarchy, the Wisdom Hierarchy, the Knowledge Hierarchy, the Information Hierarchy, and the Knowledge Pyramid. All these approaches take as their point of departure the structural
1 Such understanding of knowledge within the economic scientific community is supported by the Machlup trilogy (1980, 1982, 1984), which is considered one of the most complete classifications of knowledge in economics. 2 jhgjkghjkhijkhkjkh2006; Youndt, Snell, 2004; Cheng et al., 2010). Understanding of knowledge through particular scientific communities obviously leads to partial analyses of knowledge. For example, orthodox economic theory devotes attention only to particular knowledge dimensions (e.g. information, human capital). 2006; Youndt, Snell, 2004; Cheng et al., 2010). Understanding of knowledge through particular scientific communities obviously leads to partial analyses of knowledge. For example, orthodox economic theory devotes attention only to particular knowledge dimensions (e.g. information, human capital).

Understanding of Knowledge from Economist’s Perspective
232
Vol. III, Issue 3 June 2013
and/or functional relationship between data, information, knowledge, and wisdom. For example, DIKW model points out hierarchy involving all four elements (Rowley, 2007; Ackoff, 1989; Adler 1970); however not all versions reference to all four (earlier versions not including data, later version omitting wisdom). An approach based on hierarchical relationships between data, information and knowledge (Henry, 1974; Boulding, 1955) is also very common. Literature review indicates that there is no consensus regarding the knowledge elements used in the hierarchy (Frické, 2008; Rowley, 2007). However, there is consensus regarding the type of relationship between them, as knowledge can be mainly depicted as a pyramid, with data and information at its base and knowledge (and wisdom) at its apex.
I believe that the main deficiency with the dominant hierarchy approach is that certain elements essential for an understanding of knowledge are missing. Therefore, in our knowledge model, some new elements will be included (e.g. cognitive process, capital, values) and some will be omitted (e.g. wisdom). These knowledge dimensions have been together only partly foreshadowed in the discussion so far. Through the system of upgrading, we will show the hierarchical relationships between four different knowledge categories (information, cognitive process, capital, values) with the largest component at the bottom (knowledge as information) and narrowing up to the top (knowledge as a value) in order to better understand the nature of knowledge as one of the key resources and sources of the competitive advantage.
Knowledge as information and cognitive process
Data is understood as symbols, signs, facts or observations, which are unorganized and therefore have no meaning without context and interpretation. Information is defined as organized or structured data, means relevance for a specific purpose, and is therefore useful and relevant. Synonymous understanding of knowledge and information is quite common, especially in economics, since the availability of information is important in individual decision-‐making (Ponikvar et al., 2009; Došenović, Tajnikar, 2008) and in establishing their equilibrium. Economics of information underscores that we shall invest into acquiring information the amount of time at which marginal utility equals marginal costs of additional knowledge thus acquired.
Understanding of Knowledge from Economist’s Perspective
233
Vol. III, Issue 3 June 2013
However, knowledge should not be equated with information, because knowledge is a set of experiences where information is classified into patterns of thought through cognitive processes. It means that knowledge, through cognitive processes, involves a capacity to interpret information (Dosi, 1998). Understanding of cognitive process is important as knowledge cannot exist without its subject to whom the capacity of cognition is ascribed. Cognitive processes are basically related to the individual. Thinking and learning are of particular importance for understanding of knowledge as a cognitive process (Pečjak, 1975). Simon (1955; 1959) links these two aspects with the question of 'what is rational'. Knowledge as a cognitive process can therefore be apprehended through the prism of rationality. Becker (1976) defines rationality as an approach wherein individual agents maximize their utility by choosing among alternatives in accordance with their preferences. Understanding of knowledge as a cognitive process can be illustrated through two pairs of concepts:
a) Unbounded rationality means that individuals have due to perfect information and unlimited cognitive capacity, no problems comparing and choosing among the alternatives. However, due to the immense complexity of the real world, the human mind is hardly capable of performing it in a rational manner, as rational capacity is bounded (Simon, 1979). Instead of maximization, Simon (1955) puts forward the process of choosing the first possibility in which the desired level of utility is exceeded, although the domain of alternatives has not been exhausted.
b) Universal rationality means that socio-‐cultural factors are having no
effect on choice and decision-‐making, regardless of the time and space in which an individual is located. However, many authors argue that due to the increasing embeddedness of the individual into the society, cognitive processes are becoming more socially embedded. Granovetter (1985) andSen (1977) call attention to the fact that inclusion of an individual into the society creates relations which have an impact on the cognitive processes. Therefore, we may only speak of socially contingent rationality since an individual is not merely a 'homo economics', but also a social being.
Understanding of Knowledge from Economist’s Perspective
234
Vol. III, Issue 3 June 2013
Arguments cited above point to the fact that human cognitive capacity is bounded due to imperfect information and the limits of the human mind. With individual's inclusion into the society, knowledge as a cognitive process is becoming increasingly socially contingent and progressively less individual.
Knowledge as capital
Knowledge obviously requires a carrier, or agent, in which it is to a certain extent institutionalized, and by which this knowledge is used in the market and exchanged for other entitlements.
Knowledge is produced to be sold in the market, and thus it becomes a part of the market mechanism of supply and demand which defines its price.
As it is ascribed certain market value knowledge can be characterize as capital, since it brings economic effects to its owners.
Primarily knowledge represents an investment into an individual who is giving up a part of his or her income during education3 , , trading it for higher income in the future. Neoclassical theory of human capital at the end of 1950s gave new importance to the investment aspect of knowledge, and the value of knowledge as human capital was defined for the first time. Individuals in case of strictly defined ownership rights appropriate the majority of the benefit derived from the investment into knowledge. Human capital theory underlines that knowledge is basically a personalized process related mostly to the individual.
However, the individual can never appropriate the entire knowledge because some is necessarily dispersed and not given completely to anyone. Through relations (social capital) knowledge is increasingly spilling over to other users of knowledge, and thus it is becoming a public commodity; hence it is often materialized in machinery, technology and teamwork. In organizations knowledge often becomes embedded not only in documents and repositories but also in organizational routines, practices and norms. As a result, organization can be also an important carrier of knowledge, besides
3 Obadic and Aristovnik (2011) point out the importance of higher education system in the human capital formation. The results show that high public expenditure per student could have resulted in a higher rate of higher education school enrolment and a greater rate of labor force with a higher education.
Understanding of Knowledge from Economist’s Perspective
235
Vol. III, Issue 3 June 2013
the individual. Organizational learning, intelligent organization, organizational routines and collective brains are notions in the literature that point to a conception of the organization as an agent of knowledge. Contemporary organizations are realizing that organizational knowledge is an important factor of business performance and competitiveness in the market, and consequently devote increasingly more attention to systematic management of recognized knowledge at the organizational level.
From a business-‐economics aspect, appreciation of relations through social capital in organizations is of major importance. Firstly, emphasis on the word 'capital' indicates that the value component of relations is expressed, and that this component may become through organizational knowledge an important source of competitive advantage. Secondly, failure to properly grasp the notion of social capital will prevent any adequate understanding of knowledge. Knowledge is namely not a conventional commodity, as it is never lost upon sale of purchase; each transaction only increases it, leading to increasing returns. Sawyer (1978) finds that falling returns of human capital are a result of the separation of the individual from the environment, as the individual is bounded in the capacity to employ his or her knowledge efficiently. To properly understand the increasing returns of knowledge, the broader social inclusion of an individual should be grasped. It is only through relations that an individual can fully employ the knowledge as human capital acquired primarily for oneself.
The key inadequacy of such a socio-‐economic approach is the immeasurability of the knowledge externalities, which is why understanding of knowledge in the framework of human and social capital should be upgraded through intellectual capital and knowledge management. Knowledge management must ensure that various types of knowledge are translated into entrepreneurial action, with the maximum possible permanent effect. Especially important is the identification, categorization and exploitation of various types of knowledge in order to generate through knowledge management a better business performance. Knowledge has been usually defined through particular pairs that express the opposite poles of the methods of acquiring, creating, and transferring knowledge. Through more efficient management and use, knowledge management is also becoming a tool for boosting intellectual capital. The soundness of upgrading our understanding of knowledge in terms of human capital with

Understanding of Knowledge from Economist’s Perspective
236
Vol. III, Issue 3 June 2013
intellectual capital through knowledge management is further corroborated by the fact that most definitions of intellectual capital also emphasize the importance of social capital. Roos et al., (1997) divide intellectual capital into human, organizational, and relational-‐consumer capital. Onge (1996) proposes a classification into human, consumer, and structural capital. Edvinsson (2002) and Edvinsson and Malone (1997) divide intellectual capital into human and structural capital. Highlighting relational capital (Roos) and structural capital (Onge, Edvinson and Malone) certainly points to an understanding of social capital. Cohabitation of human and social capital and its upgrading with intellectual capital therefore enables understanding of knowledge as capital in its full meaning.
Knowledge as a value
Knowledge as intellectual capital can only be fully understood with a more profound grasp of freedom. Market valuation of knowledge as a capital is strongly related to freedom that opens up the questions of alternatives and the utility to the user. The understanding of human and social capital, as two essential parts of intellectual, heavily depends on freedom. For a deeper illustration of the co-‐dependence between knowledge as intellectual capital and freedom, Berlin's (1992) idea of positive and negative freedom can be applied. The field of negative freedom is one in which person can act without any impediments; hence, the individual is free insofar as no other individual or institution restricts his actions. Positive freedom involves the issue of control over an individual; hence, it is employed by the proponents of stronger government. Negative freedom requires a certain absence of restrictions, while positive requires their presence.
At an organizational level, negative freedom is related to the understanding of formation of human capital through entrepreneurial creativity and education; positive freedom, on the other hand, is associated with the quality of the organizational environment (social capital) in which knowledge is socially contingent. Freedom is important for the entrepreneurial spirit and creativity of individuals. Conditions should be established that are conducive to their development, as creative individuals will only be able to reach their full knowledge potential (human capital) in a free environment. However, an individual's freedom is bounded by organizational routines and norms. The more an individual is integrated
Understanding of Knowledge from Economist’s Perspective
237
Vol. III, Issue 3 June 2013
into the organization, the stronger influence will be on his knowledge processes (e.g. cognitivity, transfer). Thus, we are moving from the field of negative freedom into the field of positive one. On one side (negative) freedom is leading to higher creativity at the entrepreneurial level forming human capital and on the other side (positive) freedom is associated with the quality of the organizational environment in which knowledge processes are embedded. Obviously knowledge as capital cannot be fully understood without a freedom through which knowledge becomes a value.
Conclusions
I believe that we need new lenses in order to better capture the importance of knowledge as one of the key resources and sources of the competitive advantage. Literature review indicates that particular authors only devote attention to particular knowledge dimensions which have been together only partly foreshadowed in the discussion so far. I firmly believe that the main deficiency with the dominant approach is, that certain knowledge elements essential for an understanding of knowledge are missing.
Our understanding of knowledge is based on the system of upgrading between four knowledge categories with the largest component on the bottom (knowledge as information) and narrowing up (knowledge as a value) at the top. It can be depicted as a pyramid with knowledge as information at its base and knowledge as a value at its apex.
Knowledge should not be solely equated with information produced by rational combination of data, because knowledge is a set of experiences where information is classified into patterns of thought through cognitive processes. Knowledge cannot be comprehended without a deeper understanding of cognitive process as knowledge cannot exist without its subject to whom the capacity of cognition is ascribed. Cognitive capacity is bounded due to the limits of the human mind and because of the individual's inclusion into the society increasingly socially contingent and progressively less individual. Individuals are the main carriers of knowledge since cognitive processes are basically related to the individual.
Individual knowledge careers can through the system of property rights enter the market where knowledge becomes a capital. If knowledge is sold in the market it becomes a part of the market mechanism of supply and demand which defines its price; thus it brings economic effects to its

Understanding of Knowledge from Economist’s Perspective
238
Vol. III, Issue 3 June 2013
owners. In case of strictly defined ownership rights, an individual to whom the capacity of cognition is ascribed appropriates the majority of the benefit derived from his investment into human capital. Social capital enables the individual to fully employ the knowledge (human capital) acquired primarily for oneself, and on the other hand through relations knowledge is increasingly spilling over to other users of knowledge in organization, and thus it is becoming a public commodity. Cohabitation of human and social capital and its upgrading with intellectual capital, with knowledge management as a tool for boosting it, enables understanding of knowledge as capital in its full meaning.
Market valuation of knowledge as capital is strongly related to freedom since freedom opens up the questions of alternatives and utility to the user. The understanding of formation of human capital through entrepreneurial creativity and education can be fully understood only by a profound grasp of (negative) freedom. On the other side (positive) freedom is associated with the quality of the organizational environment in which knowledge is embedded. Knowledge as capital simply cannot be fully understood or conceived of without a more profound grasp of freedom through which knowledge becomes a value.
References
[1] Ackoff, R., “From Data to Wisdom”, Journal of Applied Systems Analysis, Vol.16, 1989, pp. 3–9.
[2] Becker, G., (1961), The Economic Approach to Human Behaviour, Chicago, Chicago University Press.
[3] Berlin, I., (1992), Dvakonceptasvobode, In: Zborniksodobniliberalizem, Ljubljana, Krt, pp. 69-‐90.
[4] Boulding, K., “Notes on the Information Concept”, Exploration, Vol6, 1955, pp. 103–112.
[5] Cheng,MY., Lin, JY., Hsiao, TY., Lin, TW., “Invested resources, competitive intellectual capital and corporate performance”, Journal of Intellelectual Capital, Vol. 11, Issue, 4, 2010, pp. 433-‐450.
[6] Choo, CW., Bontis, N., (2002), The strategic management of intellectual capital and organizational knowledge, Oxford University Press, New York.
Understanding of Knowledge from Economist’s Perspective
239
Vol. III, Issue 3 June 2013
[7] Dosi, G., (1998),The Contribution of Economic Theory to the Understanding of a Knowledge Based Economy, In: The Economic Impact of Knowledge, Neef D (ed), Boston, Buttenworth Heinemann, pp. 123-‐129.
[8] Došenović, P., Tajnikar , M. ,“Value added of health economics for health personnel”, Med. glas. Ljek. Komore Zeničko-‐dobojskog Kantona, Vol. 5, Issues, 1, pp. 65-‐72.
[9] Edvinsson, L., Malone, M., (1997), Intellectual capital, New York,HarperBusiness.
[10] Edvinsson, L., (2002), Corporate Longitude, Stockholm,Bookhouse. [11] Etzioni, A., (1990), The Moral Dimension: Towards a New
Economics, New York,The Free press. [12] Frické, M., “The Knowledge Pyramid: A Critique of the DIKW
Hierarchy”, Journal of Information Svience, Vol. 35, Issue 2, 2008, pp. 131-‐142.
[13] Granovetter, M. , “Economic Action and Social Structure: The Problem of Embeddedness”, American Journal of Sociology, Vol. 91, 1985, pp.481-‐510.
[14] Hecker, A., “Knowledge Beyond the Individual? Making Sense of a Notion of Collective Knowledge in Organization”, Organization Science, Vol. 33, 2012, pp. 423-‐445.
[15] Henry, N.L., “Knowledge management: Anew concern for public administration”, Public Administration Review,Vol. 34, Issue 3, 1974, pp. 189-‐196.
[16] Hirshleifer, J.,“Where are We in the Theory of Information”, The American Economic Review, Vol. 63, Issue 2, 1973, pp. 1-‐39.
[17] Hsu, L.C., Wang, CH., “Clarifying the Efeect of Intellectual capital on Performance: The Mediating Role of Dynamic Capability”, British Journal of Management, Vol. 23, Issue 2,2012, pp. 179-‐205.
[18] Jones, P., Jordan, J., “Assesing Your Company’s Knowledge Management Style”, Longe Range Planning, Vol. 30, 1997, pp.392-‐398.
[19] Kimmerle, J., Cress, U., Held, C., “The interplay between individual and collective knowledge: Technologies for organisational learning and knowledge building”, Knowledge Management Research and Practice, Vol. 8, 2010, pp. 33-‐44.
[20] Kuhn, T., (1998),Strukturaznanstvenihrevolucij, Ljubljana,Krtina.
Understanding of Knowledge from Economist’s Perspective
240
Vol. III, Issue 3 June 2013
[21] Lam, A., “Tacit Knowledge, Organizational Learning and Societal Institutions: An Integrated Framework”, Organization Studies, Vol. 21, Issue 3, 2000, pp. 487-‐513.
[22] Machlup, F., (1980), Knowledge: Its Creation, Distribution and Economic significance: Knowledge and Knowledge Production, Volume I., Princeton, Princeton University Press.
[23] Machlup, F., (1982), Knowledge: Its Creation, Distribution and Economic Significance: The Branches of Learning, Volume II. Princeton, Princeton University Press.
[24] Machlup, F., (1984), Knowledge: Its Creation, Distribution and Economic Significance: The Economics of Information and Human Capital, Volume III, Princeton, Princeton University Press.
[25] Mincer, J, “Investment in Human Capital and Personal Income Distribution”, The Journal of Political Economy, Vol. 66, Issue, 4, 1958, pp. 281-‐302.
[26] Moon, JY., Kym, GH., ”A Model for the Value of Intellectual Capital”, Canadian Journal of Administrative Science, Vol. 23, Issue 3, 2006, pp.253-‐269.
[27] Nahapiet, J., Ghoshal, S., (2000), Social Capital, Intellectual Capital and the Organizational Advantage,In: Knowledge and Social Capital: Foundations and Applications,Lesser, E., (ed),Boston, Butterworth, pp. 119-‐157.
[28] Neisser, U., 1967, Cognitive psychology, New York, NY, Meredith. [29] Nonaka, I, Takeuchi, H., (1995), The Knowledge Creating Company,
New York, Oxford University Press. [30] Obadic, A., Aristovnik, A. ,“Relative efficiency of higher education in
Croatia and Slovenia: an international comparison”, Amfiteatru economic, Vol.13, Issue 30, 2011, pp. 362-‐376.
[31] Onge,HS.,“Tacit Knowledge, the Key to the Strategic Alignment of Intellectual Capital”, Strategy review,Vol. March-‐April, 1996, pp. 10-‐14.
[32] Pečjak, V., (1975),Psihologijaspoznavanja, Ljubljana,DržavnazaložbaSlovenija.
[33] Ponikvar, N., Tajnikar, M., Pušnik, K., “Performance ratios for managerial decision-‐making in a growing firm”, Journal of Business Economics and Management, Vol. 10, Issue 2, 2009, pp. 109-‐120.
Understanding of Knowledge from Economist’s Perspective
241
Vol. III, Issue 3 June 2013
[34] Rahe, M., “Subjectivity and cognition in knowledge management”, Journal of Knowledge Management, Vol13, Issue 3, pp. 102-‐117.
[35] Romer, P. ,“The Origins of Endogenus Growth”, Journal of Economic Perspectives, Vol8, Issue 1, 1994, pp. 3-‐22.
[36] Roos, J., Ross, G., Dragonetti, NC., Edvinsson, L., (1997),Intellectual Capital, London, MacMillan Press.
[37] Rowley, J., “The wisdom hierarchy: representation of the DIKW hierarchy”,Journal of Information Science, Vol. 33, Issue 2, 2007, pp.163-‐180.
[38] Sawyer, D., “Social Roles and Economic Firms: The Sociology of Human Capital”, American Journal of Sociology, Vol. 83, Issue 5, 1978, pp.1259-‐1270.
[39] Schultz, WT., “Investment in Human Capital”, The American Economic Review, Vol. 51, Issue, 1, 1961, pp. 1-‐17.
[40] Sen, A., “Rational Fools: A Critique of the Behavioral Foundations of Economic Theory”, Philosophy and Public Affairs, Vol. 6, Issue 4, 1977, pp.317-‐344.
[41] Simon, AH., “A Behavioral Model of Rational Choice”, Quaterly Journal of Economics.Vol. 69, Issue 1, 1955, pp. 99-‐118.
[42] Simon, AH. ,“Theories of Decision Making in Economics and Behavioral Science”, The American Economic Review, Vol. 49, Issue 3, 1959, pp. 253-‐283.
[43] Simon, AH., “Rational Decision Making in Business Organizations”, The American Economic Review, Vol. 69, Issue 4, 1979, pp. 493-‐513.
[44] Shihao, Z., Siu, F., Wang, M., “Effects of social tie content on knowledge transfer”, Journal of Knowledge Management, Vol. 14, Issue 3, 2010, pp. 449-‐463.
[45] Solow, MR., “A Contribution to the Theory of the Economic Growth”, Quarterly Journal of Economics, Vol. 70, Issue 11, 1956, pp. 65-‐94.
[46] Stigler, G., “The Economics of Information”, Journal of Political Economy, Vol. 69, 1961, 213-‐225.
[47] Tsai, SD., Lee, CF., “The problem of Embeddedness: Knowledge Transfer, Coordination and Reuse in Information Systems”, Organization Studies, Vol. 27, Issue 9, 2006, pp. 1289-‐1317.
[48] Youndt, M., Snell, S., “Intelectual Capital Profiles: An Examination of Investments and Profiles”, Journal of Management Studies, Vol. 41 Issue 2, 2004, pp. 335-‐361.
Scientific Papers (www.scientificpapers.org) Journal of Knowledge Management, Economics and Information Technology
242
Vol. III, Issue 3 June 2013
Improving the Numbers of Financial Statements
Authors: Traian Calota, Faculty of Economic Sciences, University Titu Maiorescu Bucharest, Senior Expert Infofisc, Romania, [email protected], Alin-‐Eliodor Tănase, CFO, Everet România Distribution, Romania, [email protected]
Improving the numbers of financial statements can be achieved by several metods such as: recording the revenue too soon, recording bogus revenue, shifting the current expense to a futer or a earlier period, failing to record liabilities or shifting the cureent revenue to a later periods. As beeing science, technology or language of communication the accounting should reflect economic reality of transactions. Legal regulations, knowledge, creativity, management, and innovation spirit are all factors that are applied in practice and these factors contribute to economic reality through science of the reporting or 'financial position and performance tuning (creative accounting).
Keywords: financial statements; fair value; cost of period; cost of acquired intangible asset; preferential dividends; return of goods; trade discounts JEL: H32 – Firm; M41 – Accounting; M16 -‐ International Business Administration
Introduction
Our study intends to highlight the mechanisms of the reasoning to interpret accounting and / or fiscal of financial transactions and economic events.
14
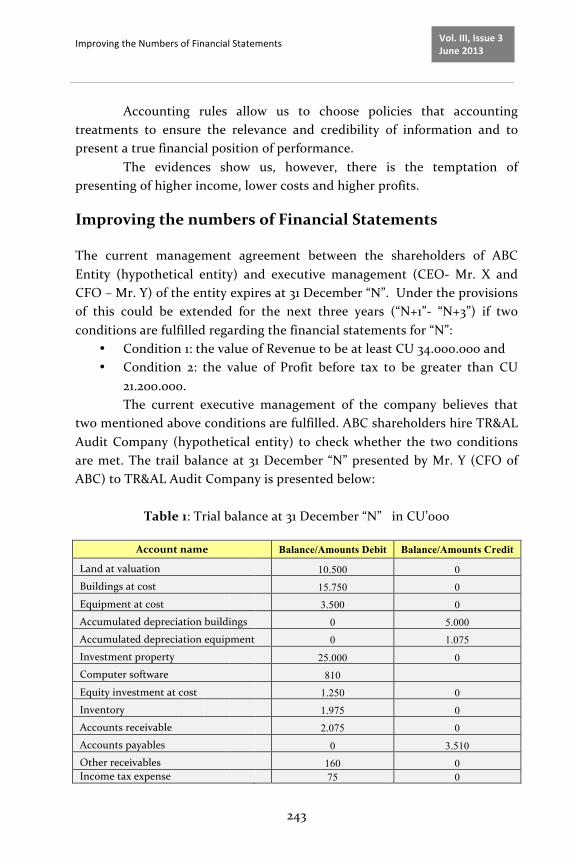
Improving the Numbers of Financial Statements
243
Vol. III, Issue 3 June 2013
Accounting rules allow us to choose policies that accounting treatments to ensure the relevance and credibility of information and to present a true financial position of performance.
The evidences show us, however, there is the temptation of presenting of higher income, lower costs and higher profits.
Improving the numbers of Financial Statements
The current management agreement between the shareholders of ABC Entity (hypothetical entity) and executive management (CEO-‐ Mr. X and CFO – Mr. Y) of the entity expires at 31 December “N”. Under the provisions of this could be extended for the next three years (“N+1”-‐ “N+3”) if two conditions are fulfilled regarding the financial statements for “N”:
• Condition 1: the value of Revenue to be at least CU 34.000.000 and • Condition 2: the value of Profit before tax to be greater than CU
21.200.000. The current executive management of the company believes that
two mentioned above conditions are fulfilled. ABC shareholders hire TR&AL Audit Company (hypothetical entity) to check whether the two conditions are met. The trail balance at 31 December “N” presented by Mr. Y (CFO of ABC) to TR&AL Audit Company is presented below:
Table 1: Trial balance at 31 December “N” in CU’000
Account name Balance/Amounts Debit Balance/Amounts Credit
Land at valuation 10.500 0 Buildings at cost 15.750 0 Equipment at cost 3.500 0 Accumulated depreciation buildings
0 5.000
Accumulated depreciation equipment 0 1.075 Investment property 25.000 0 Computer software 810 Equity investment at cost 1.250 0 Inventory
1.975 0
Accounts receivable 2.075 0 Accounts payables 0 3.510 Other receivables 160 0 Income tax expense 75 0

Improving the Numbers of Financial Statements
244
Vol. III, Issue 3 June 2013
Tax liabilities 0 30 Debenture (redeemable “N+7”) 0 2.500 Revenue 0 36.500 Cost of goods sold 12.482 0 Cost of rendered services 1.275 Wages and salaries 225 0 Administrative expenses 180 0 Selling and distribution expenses 485 0 Operating expenses 350 0 Allowance for doubtful debts 0 175 Cash in hand and bank 1.490,51 0 Warranties 0 50 Interest expense 62,49 0 Interest income 0 200 Preference nonredeemable share capital 0 750 Ordinary share capital 0 25.000 Revaluation reserve 0 1.725
Retained earnings 01/01/ “N”
0 1,130
TOTAL 77.645 77.645
It can be note that is fulfilled the conditions, imposed by shareholders, according to the mounts from the above trial balance as follow:
• Condition 1: the value of Revenue is CU 36.500.000 and • Condition 2: the value of Profit before tax is CU 21.640.510 (CU
36.700.000 total incomes less CU 15.059.490 total expenses (except income tax expense)). TR&AL
Audit has examined all significant transactions made by ABC during “N”. Some of them must be reviewed and restated according to TR&AL Audit. These transactions are the following:
Transaction 1: Revaluation of investment property
State of facts: ABC Entity owns a building classified as investment property for which it is applied the fair value model. So, the value of investment property at 31 December “N-‐1” is CU 24.000.000. The investment property was revaluated at 31 December “N” by an independent assessor. The new fair value is CU 25.000.000 and the positive difference from revaluation is CU

Improving the Numbers of Financial Statements
245
Vol. III, Issue 3 June 2013
1.000.000. The gain from revaluation has been recorded by the ABC and it was included in the amount of revenue from ordinary activities.
TR&AL’s Opinion: If an entity chooses to apply the fair value model (IAS 40, Investment property, article 35) for the evaluation of its investment property than any gain or loss arising from changes in fair value shall be recognized in profit or loss of the period in which the change in fair value occurs. In other words „a gain or loss arise from changes in fair value of property investment must be included in Statement of Comprehensive Income” (Hennie van Greuning, 2009, page. 211).
Proposed adjustment: It can be noticed that the entity recognized the gain in profit or loss but classified incorrectly at position "Revenue". The gain must be included at position “other gains”. So, the amount of Revenue must be reduced and simultaneously the amount of “other gains” must be increased by CU 1.000.000 (see below Note 1 for point III).
Transaction 2: Transfer of the risks and rewards in sale of goods transactions
State of facts: ABC Entity has recorded revenue from sale of goods and costs connected to this transaction:
• according to the commercial agreement between ABC Entity and Samurai Entity (hypothetical entity) from Japan, ABC Entity had to deliver the goods at the selling price of CU 400.000; delivery condition (INCOTERMS 2010) FOB – Tokyo destination seaport;
• carrying value of the goods sold is CU 300.000; • goods were handed over to the carrier and the ship was loaded on
26 December “N”; and • goods is expected to reach the destination at the end of March
“N+1”.
TR&AL’s Opinion: Goods delivered – under FOB destination seaport -‐ whether they are in transit should be included in ABC’s inventory until the seller delivers them to the Japanese buyer at the destination agreed seaport. Only from this moment all significant risks and rewards arising from ownership of property were transferred to the buyer. ABC Entity owns all risks (e.g. risk of loss, damage) concerning the delivered goods until it delivers the goods to the buyer at the destination seaport. According to the
Improving the Numbers of Financial Statements
246
Vol. III, Issue 3 June 2013
paragraph 16 from IAS 18 „Revenue” it specifies that if an entity retains significant risks of ownership, the transaction is not a sale and revenue is not recognized.
Proposed adjustment: ABC recognized incorrectly the proceeds from goods delivery as revenue and recorded incorrectly the carrying amounts of delivered goods as cost of sale. We propose reversal of the records (see below Note 2 for point III).
Transaction 3: Return of goods at the discretion of the buyer
State of facts: ABC recorded as sale of goods the following transaction: • according to the commercial agreement between ABC Entity and
DEF Entity (hypothetical entity), ABC Entity had to deliver the goods at the selling price of CU 1.000.000; delivery condition (INCOTERMS 2010) EXW – ABC warehouse address
• commercial mark – up for this transaction is 25% • buyer has the right to return the goods at his sole discretion without
any reason within 3 months. TR&AL’s Opinion: According to the paragraph 16 from IAS 18
„Revenue” it specifies that an entity retains the risks and rewards of ownership of delivered goods when the buyer has the right to rescind the purchase for a reason specified in the sales contract, or at the buyer’s sole discretion without any reason, and the entity is uncertain about the probability of return.
Proposed adjustment: Due to the fact that this transaction is not, in fact, a sale than ABC has to cancel the recognized revenue and expenses with the cost of inventory. (see below Note 3 for point III).
Transaction 4: Recognition of fee income
State of facts: ABC signed two agreements at 01 January “N” with two hotels. According to the signed agreements ABC had to sell tourism programs provided by the hotels according to the following conditions:
• the prices for the tourism programs are established by the hotels • the fee of ABC is 15% of the value of each sold tourism program
Improving the Numbers of Financial Statements
247
Vol. III, Issue 3 June 2013
• the amounts collected by ABC on behalf of the hotels are paid-‐ after ABC has retained the fee -‐ within 5 days of collection day but no later than the end of month ABC Entity sold during “N” tourism programs in the amount of CU
1.500.000. For each program sold the ABC Entity records at the moment of sale the entire program’s amount as income (revenue). The amounts (collected amounts less retained fee) paid by ABC are recognized at the moment of payment as an expense (cost of rendered services).
TR&AL’s Opinion: In our opinion, ABC hasn’t altered the size of the operating profit but the value of revenue has been incorrectly increased at the level of tourism program’s prices and the value of expenses has been incorrectly increased at the level of the amounts paid to the hotels. "IAS 18 stipulates that, when an entity is acting in the capacity of an agent, its gross inflows of cash or other economic benefits include amounts collected on behalf of the principal and which do not result in increases in equity for the entity. Since amounts collected on behalf of the principal are not revenue, the reporting entity’s revenue should only be the amount of the commissions it receives. To report the gross amounts collected as revenue in such circumstances would exaggerate and greatly distort the scope or scale of the entity’s actual operations" (Barry J. Epstein and Eva K. Jermakowicz, 2010, page 284).
Proposed adjustment: ABC Entity has to reduce the value of income in order to be presented only the amount of the fee earned by ABC from the hotels. Also ABC has to cancel the amounts included in the cost of rendered services. The additional (excess) amount which has been included by the ABC in revenue and also in cost of rendered services is CU 1.275.000 (Below Note 4 for point III).
Transaction 5: Depreciation of equity instruments
State of facts: According to ABC’s accounting policy any change in the value of equity instruments is recognized through profit and loss. The market value of the equity instruments is CU 1.250.000 at 01 January “N” and it is presented in the above trial balance. The market value of the equity instruments at 31 December “N” is 10% lower than the value of the beginning of the year.
Improving the Numbers of Financial Statements
248
Vol. III, Issue 3 June 2013
TR&AL’s Opinion: We consider that ABC has not applied its own policies related with impairment of financial investments.
Proposed adjustment: ABC has to record a decrease of equity instruments ‘value by recognizing an expense. The expense amount is CU 125.000. (See below Note 5 from point III).
Transaction 6: Trade discounts received for purchased goods
State of facts: ABC recorded at 16 December “N” a commercial discount granted by a supplier as a reduction of cost of goods sold. The value of the commercial discounts is CU 200.000. This commercial discount was granted for purchases of goods named “X” during “N”. At 31 December “N” ABC has 35% from the “N” purchases of “X” goods included in inventory.
The value of cost of goods sold has been incorrectly diminished with the entire value of the discounts granted by the supplier. The value of cost of goods should be reduced only by CU 130.000 [200.000*(100%-‐35%)].The difference of CU 70.000 should to reduce the value of inventory which has not been sold because „trade discounts and rebates are deducted when arriving at the cost of purchase of inventory”( Abbas Ali Mirza et al,2008, page 28).
Proposed adjustment: ABC must record an increase of cost of goods sold and – in the same time-‐ a decrease of inventory’s value by CU 70.000. (See below Note 6 from point III).
Transaction 7: Cost of period versus capitalized costs of intangible asset
State of facts: During last quarter of “N” ABC entity purchased and implemented new computer software. ABC has signed a contract with an entity which is specialized in market research in order to identify the software producers. Entity must provide the ABC a research which set out the advantages and disadvantages of various software programs that could be purchased by ABC. The cost of the market research was CU 52.000. Based on the research report ABC Entity decides to buy the software from BSW (hypothetical entity). The acquisition and implementation of the new software were done in two stages as follow:
Improving the Numbers of Financial Statements
249
Vol. III, Issue 3 June 2013
• Stage 1 – BSW has carried a review and an update of IT (hardware and software) network of ABC in order to determine if existing hardware is adequate for new software; the cost of this operation was CU 77.000;
• Stage 2 – Effective implementation process, which was completed at 20 December “N”, had a price of CU 600.000;
• Stage 3 – Training period for the employees had CU 11.000 price. • Also ABC has signed a contract with a legal adviser entity which
perfected contract between ABC and BSW. Costs charged by legal adviser entity were CU 10.000. All mentioned above costs involved in purchasing of the new software were CU 810.000 um and they we completely capitalized and recognized as intangible assets. TR&AL’s Opinion: ABC Entity should not capitalize the all costs as
follow:
Cost description Capitalization (Yes/No)
Cost value
Expenses of year
Amount capitalized
Market research NO 52.000 52.000 -‐
IT network review and up date YES 77.000 -‐ 77.000
Effective implementation YES 660.000 -‐ 660.000
Training period NO 11.000 11.000 -‐
Legal services NO 10.000 10.000 -‐
Total costs 810.000 73.000 737.000
“Examples of costs that are not included in the production cost
(Ristea M. et. al, 2009, page 150-‐151): • selling expenses, administrative and general overhead, unless the
expenditure can be directly attributed to preparing the asset for use; • identified inefficiencies and initial operating losses incurred before
the asset achieves planned performance; • training of staff who is handle the asset”
Proposed adjustment: ABC must increase the costs of the period and – in the same time-‐ to decrease the value of intangible asset by CU 73.000 (See below Note 7 from point III).
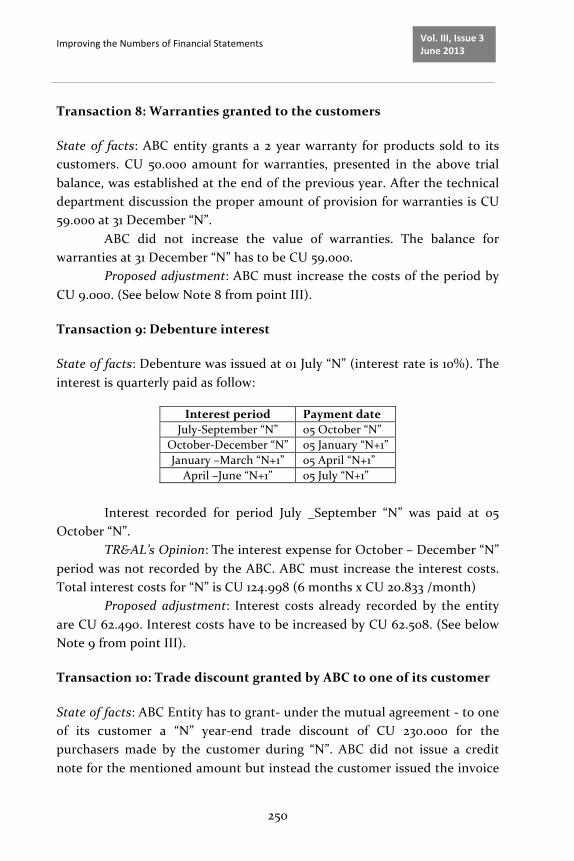
Improving the Numbers of Financial Statements
250
Vol. III, Issue 3 June 2013
Transaction 8: Warranties granted to the customers
State of facts: ABC entity grants a 2 year warranty for products sold to its customers. CU 50.000 amount for warranties, presented in the above trial balance, was established at the end of the previous year. After the technical department discussion the proper amount of provision for warranties is CU 59.000 at 31 December “N”.
ABC did not increase the value of warranties. The balance for warranties at 31 December “N” has to be CU 59.000.
Proposed adjustment: ABC must increase the costs of the period by CU 9.000. (See below Note 8 from point III).
Transaction 9: Debenture interest
State of facts: Debenture was issued at 01 July “N” (interest rate is 10%). The interest is quarterly paid as follow:
Interest period Payment date July-‐September “N” 05 October “N”
October-‐December “N” 05 January “N+1” January –March “N+1” 05 April “N+1”
April –June “N+1” 05 July “N+1”
Interest recorded for period July _September “N” was paid at 05
October “N”. TR&AL’s Opinion: The interest expense for October – December “N”
period was not recorded by the ABC. ABC must increase the interest costs. Total interest costs for “N” is CU 124.998 (6 months x CU 20.833 /month)
Proposed adjustment: Interest costs already recorded by the entity are CU 62.490. Interest costs have to be increased by CU 62.508. (See below Note 9 from point III).
Transaction 10: Trade discount granted by ABC to one of its customer
State of facts: ABC Entity has to grant-‐ under the mutual agreement -‐ to one of its customer a “N” year-‐end trade discount of CU 230.000 for the purchasers made by the customer during “N”. ABC did not issue a credit note for the mentioned amount but instead the customer issued the invoice
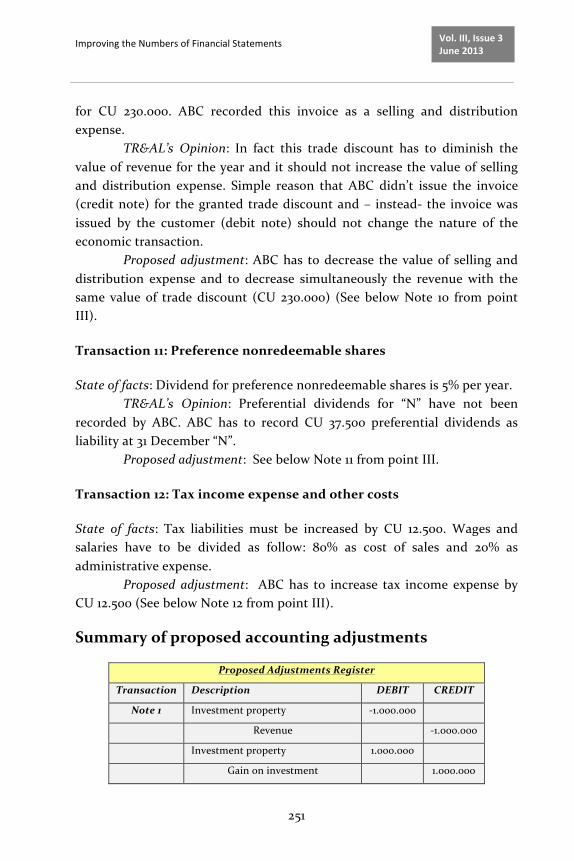
Improving the Numbers of Financial Statements
251
Vol. III, Issue 3 June 2013
for CU 230.000. ABC recorded this invoice as a selling and distribution expense.
TR&AL’s Opinion: In fact this trade discount has to diminish the value of revenue for the year and it should not increase the value of selling and distribution expense. Simple reason that ABC didn’t issue the invoice (credit note) for the granted trade discount and – instead-‐ the invoice was issued by the customer (debit note) should not change the nature of the economic transaction.
Proposed adjustment: ABC has to decrease the value of selling and distribution expense and to decrease simultaneously the revenue with the same value of trade discount (CU 230.000) (See below Note 10 from point III).
Transaction 11: Preference nonredeemable shares
State of facts: Dividend for preference nonredeemable shares is 5% per year. TR&AL’s Opinion: Preferential dividends for “N” have not been
recorded by ABC. ABC has to record CU 37.500 preferential dividends as liability at 31 December “N”.
Proposed adjustment: See below Note 11 from point III.
Transaction 12: Tax income expense and other costs
State of facts: Tax liabilities must be increased by CU 12.500. Wages and salaries have to be divided as follow: 80% as cost of sales and 20% as administrative expense.
Proposed adjustment: ABC has to increase tax income expense by CU 12.500 (See below Note 12 from point III).
Summary of proposed accounting adjustments
Proposed Adjustments Register
Transaction Description DEBIT CREDIT
Note 1 Investment property -‐1.000.000
Revenue
-‐1.000.000
Investment property 1.000.000
Gain on investment
1.000.000

Improving the Numbers of Financial Statements
252
Vol. III, Issue 3 June 2013
Note 2 Accounts receivables -‐400.000
Revenue
-‐400.000
Cost of goods sold -‐300.000
Inventory
-‐300.000
Note 3 Accounts receivables -‐1.000.000
Revenue
-‐1.000.000
Cost of goods sold -‐800.000
Inventory
-‐800.000
Note 4 Cost of sales-‐ services -‐1.275.000
Revenue
-‐1.275.000
Note 5 Loss on holding equity instruments 125.000
Equity investment
125.000
Note 6 Cost of goods sold 70.000
Accounts payables
70.000
Inventory -‐70.000
Accounts payables
-‐70.000
Note 7 Selling and distribution expenses 73.000
Computer software
73.000
Note 8 Operating expense (Cost of sale) 9.000
Warranties
9.000
Note 9 Interest expense 62.508
Accrued interest
62.508
Note 10 Revenue 230.000
Selling and distribution expenses
230.000
Note 11 Retained earnings 37.500
Preference dividend payable
37.500
Note 12 Income tax 12.500
Tax liabilities
12.500
TOTAL -‐3.225.492 -‐3.225.492
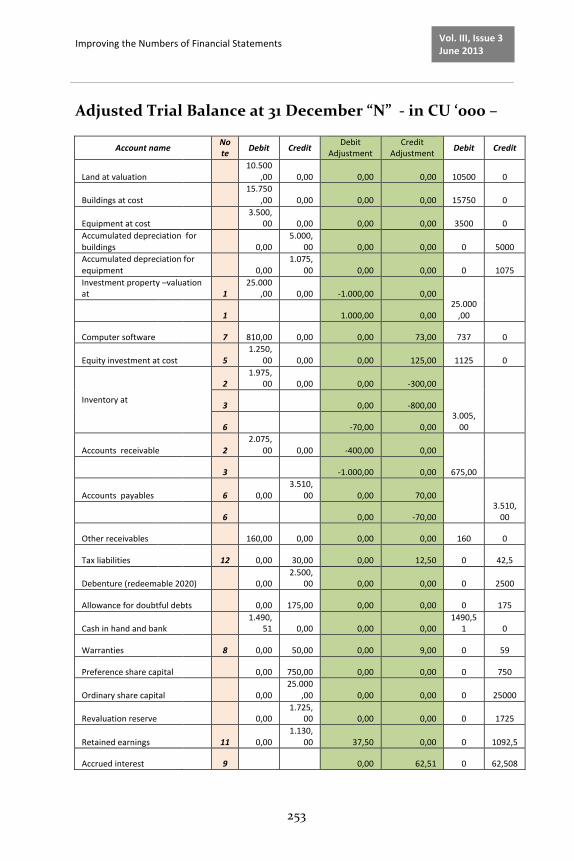
Improving the Numbers of Financial Statements
253
Vol. III, Issue 3 June 2013
Adjusted Trial Balance at 31 December “N” -‐ in CU ‘000 –
Account name Note Debit Credit Debit
Adjustment Credit
Adjustment Debit Credit
Land at valuation 10.500
,00 0,00 0,00 0,00 10500 0
Buildings at cost 15.750
,00 0,00 0,00 0,00 15750 0
Equipment at cost 3.500,
00 0,00 0,00 0,00 3500 0 Accumulated depreciation for buildings 0,00
5.000,00 0,00 0,00 0 5000
Accumulated depreciation for equipment 0,00
1.075,00 0,00 0,00 0 1075
Investment property –valuation at 1
25.000,00 0,00 -‐1.000,00 0,00
25.000,00 1 1.000,00 0,00
Computer software 7 810,00 0,00 0,00 73,00 737 0
Equity investment at cost 5 1.250,
00 0,00 0,00 125,00 1125 0
Inventory at
2 1.975,
00 0,00 0,00 -‐300,00
3.005,00
3 0,00 -‐800,00
6 -‐70,00 0,00
Accounts receivable 2 2.075,
00 0,00 -‐400,00 0,00
675,00 3 -‐1.000,00 0,00
Accounts payables 6 0,00 3.510,
00 0,00 70,00
3.510,00 6 0,00 -‐70,00
Other receivables 160,00 0,00 0,00 0,00 160 0
Tax liabilities 12 0,00 30,00 0,00 12,50 0 42,5
Debenture (redeemable 2020) 0,00 2.500,
00 0,00 0,00 0 2500
Allowance for doubtful debts 0,00 175,00 0,00 0,00 0 175
Cash in hand and bank 1.490,
51 0,00 0,00 0,00 1490,5
1 0
Warranties 8 0,00 50,00 0,00 9,00 0 59
Preference share capital 0,00 750,00 0,00 0,00 0 750
Ordinary share capital 0,00 25.000
,00 0,00 0,00 0 25000
Revaluation reserve 0,00 1.725,
00 0,00 0,00 0 1725
Retained earnings 11 0,00 1.130,
00 37,50 0,00 0 1092,5
Accrued interest 9 0,00 62,51 0 62,508
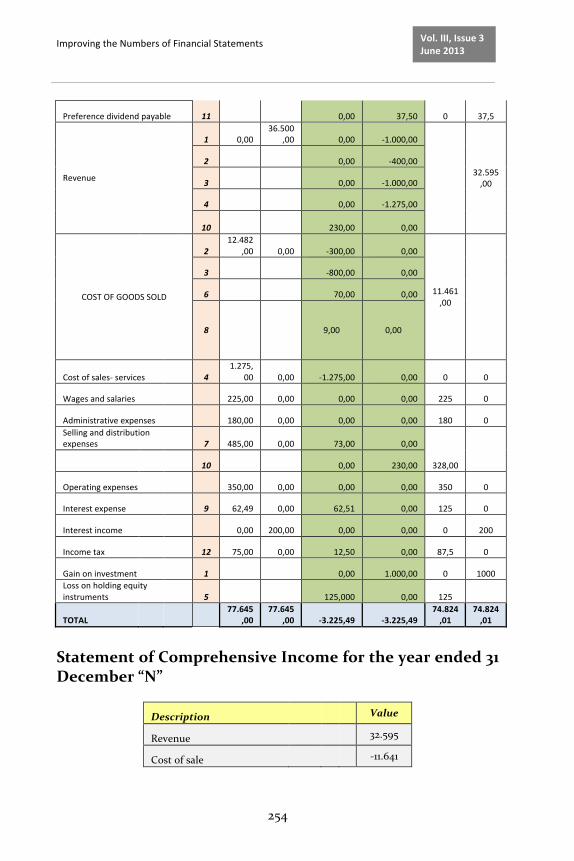
Improving the Numbers of Financial Statements
254
Vol. III, Issue 3 June 2013
Preference dividend payable 11 0,00 37,50 0 37,5
Revenue
1 0,00 36.500
,00 0,00 -‐1.000,00
32.595,00
2 0,00 -‐400,00
3 0,00 -‐1.000,00
4 0,00 -‐1.275,00
10 230,00 0,00
COST OF GOODS SOLD
2 12.482
,00 0,00 -‐300,00 0,00
11.461,00
3 -‐800,00 0,00
6 70,00 0,00
8
9,00 0,00
Cost of sales-‐ services 4 1.275,
00 0,00 -‐1.275,00 0,00 0 0
Wages and salaries 225,00 0,00 0,00 0,00 225 0
Administrative expenses 180,00 0,00 0,00 0,00 180 0 Selling and distribution expenses 7 485,00 0,00 73,00 0,00
328,00 10 0,00 230,00
Operating expenses 350,00 0,00 0,00 0,00 350 0
Interest expense 9 62,49 0,00 62,51 0,00 125 0
Interest income 0,00 200,00 0,00 0,00 0 200
Income tax 12 75,00 0,00 12,50 0,00 87,5 0
Gain on investment 1 0,00 1.000,00 0 1000 Loss on holding equity instruments 5 125,000 0,00 125
TOTAL 77.645
,00 77.645
,00 -‐3.225,49 -‐3.225,49 74.824,01
74.824,01
Statement of Comprehensive Income for the year ended 31 December “N”
Description
Value
Revenue 32.595
Cost of sale -‐11.641
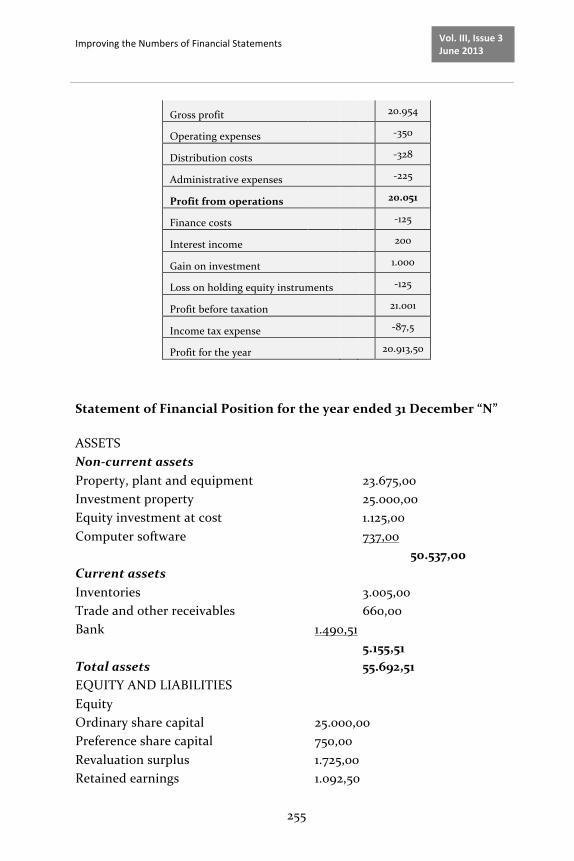
Improving the Numbers of Financial Statements
255
Vol. III, Issue 3 June 2013
Gross profit 20.954
Operating expenses -‐350
Distribution costs -‐328
Administrative expenses -‐225
Profit from operations 20.051
Finance costs -‐125
Interest income 200
Gain on investment 1.000
Loss on holding equity instruments
-‐125
Profit before taxation 21.001
Income tax expense -‐87,5
Profit for the year 20.913,50
Statement of Financial Position for the year ended 31 December “N”
ASSETS Non-‐current assets Property, plant and equipment 23.675,00 Investment property 25.000,00 Equity investment at cost 1.125,00 Computer software 737,00 50.537,00 Current assets Inventories 3.005,00 Trade and other receivables 660,00 Bank 1.490,51 5.155,51 Total assets 55.692,51 EQUITY AND LIABILITIES Equity Ordinary share capital 25.000,00 Preference share capital 750,00 Revaluation surplus 1.725,00 Retained earnings 1.092,50
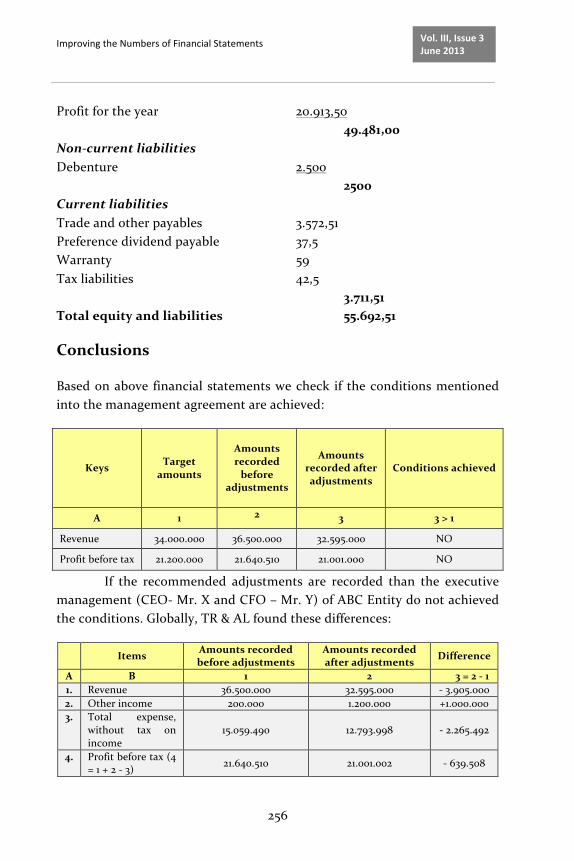
Improving the Numbers of Financial Statements
256
Vol. III, Issue 3 June 2013
Profit for the year 20.913,50 49.481,00 Non-‐current liabilities Debenture 2.500 2500 Current liabilities Trade and other payables 3.572,51 Preference dividend payable 37,5 Warranty 59 Tax liabilities 42,5 3.711,51 Total equity and liabilities 55.692,51
Conclusions
Based on above financial statements we check if the conditions mentioned into the management agreement are achieved:
Keys Target amounts
Amounts recorded before
adjustments
Amounts recorded after adjustments
Conditions achieved
A 1 2 3 3 > 1
Revenue 34.000.000 36.500.000 32.595.000 NO
Profit before tax 21.200.000 21.640.510 21.001.000 NO
If the recommended adjustments are recorded than the executive management (CEO-‐ Mr. X and CFO – Mr. Y) of ABC Entity do not achieved the conditions. Globally, TR & AL found these differences:
Items Amounts recorded before adjustments
Amounts recorded after adjustments Difference
A B 1 2 3 = 2 -‐ 1 1. Revenue 36.500.000 32.595.000 -‐ 3.905.000 2. Other income 200.000 1.200.000 +1.000.000 3. Total expense,
without tax on income
15.059.490 12.793.998 -‐ 2.265.492
4. Profit before tax (4 = 1 + 2 -‐ 3) 21.640.510 21.001.002 -‐ 639.508
Improving the Numbers of Financial Statements
257
Vol. III, Issue 3 June 2013
• revenue has been decreased by CU 3.905.000 (CU 32.595.000 less CU 36.500.000 ), because of:
§ decreasing the revenue by CU 1.000.000 after reclassification of current income from the revaluation;
§ decreasing the revenue by CU 400.000 regarding the goods delivered under FOB destination seaport;
§ decreasing the revenue by CU 1.000.000 because of return clause;
§ decreasing the revenue by CU 1.275.000 by limiting the revenue at the level of fee income earned by the entity from tourism packages sold;
§ decreasing the revenue by CU 230.000 as a result of trade discounts to customers;
• expenses has been decreased by CU 2.265.492, because of: § decreasing by CU 1.100.000 by cancelling cost generated by
delivered goods under FOB condition and delivered goods with a return clause;
§ decreasing by CU 1.275.000 – the costs of tourism packages; § decreasing of selling and distribution costs by CU 230.000
as a result of reclassification of trade discounts; § increasing by CU 70.000 as a result of restating of trade
discounts for the unsold goods at the end of the year; § increasing by CU 73.000 as a result of reclassification of
costs regarding the intangible assets (software); § increasing of warranties by CU 9.000; § increasing the expense by CU 125.000 due to the
recognition of a decrease of market value of held equity instruments
§ increasing by CU 62.508 regarding interest expense for debenture.
• profit before tax has been decreased by CU 639.508 (CU 21.001.002 less CU 21.640.510 ), because of:
§ changes in current revenue structure (-‐ CU 3.905.000); § changes in other income (+ CU 1.000.000 ); § changes in expense structure (-‐CU 2.265.492).
Improving the Numbers of Financial Statements
258
Vol. III, Issue 3 June 2013
References
[1] Hennie van Greuning, International Financial Reporting Standards A Practical guide, Edition V, Editura Irecson, Bucharest, 2009;
[2] Barry J. Epstein, Eva K. Jermakowicz, Interpretation and Application of International Financial Reporting Standards, 2010, Published by John Wiley & Sons, Inc., Hoboken, New Jersey;
[3] Abbas Ali Mirza, Magnus Orrell and Graham J. Holt, Wiley IFRS: Practical Implementation Guide and Workbook, 3rd Edition, 2011, Published by John Wiley & Sons, Inc., Hoboken, New Jersey;
[4] Ristea, M., Dumitru, C., Manea, L., Irimescu, A., Nichita, M., Contabilitatea amortizarii si deprecierii activelor, Editura Tribuna Economica, Bucuresti, 2009.

Scientific Papers (www.scientificpapers.org) Journal of Knowledge Management, Economics and Information Technology
259
Vol. III, Issue 3 June 2013
Enhancing Learning within the 3-D Virtual Learning Environment
Authors: Akbar Moazen Safaei, Advanced Informatics School, University of Technology Malaysia, Kuala Lumpur, Malaysia, [email protected], Shirin Shafieiyoun, Faculty of Built Environment, University of Malaya, Kuala Lumpur, Malaysia, [email protected]
Today’s using of virtual learning environments becomes more remarkable in education. The potential of virtual learning environments has frequently been related to the expansion of sense of social presence which is obtained from students and educators. This study investigated the effectiveness of social presence within virtual learning environments and analysed the impact of social presence on increasing learning satisfaction within virtual learning environments. Second Life, as an example of virtual learning environments considered as a learning medium to examine the feeling of social presence in students’ learning activities which adopted for this study. First objective is to identify the importance of social presence to increase learning satisfaction, and second is to examine students’ perception of social presence in virtual learning environments. The descriptive study was conducted among 40 students participated to the virtual course in Second Life. The result indicated social presence is an essential part of learning in virtual learning environments in meeting students' learning satisfaction. It was also discovered that perceiving high feeling of social presence is affected by different specifications of virtual learning environments. In conclusion this study presents the finding and discusses some implication for lecturers, online course designers, and researchers are increasingly investigating the use of virtual environments for online learning.
15

Enhancing Learning within the 3-‐D Virtual Learning Environment
260
Vol. III, Issue 3 June 2013
Keywords: Online Learning, Virtual Learning Environment, Social Presence, Second Life
Introduction
Recently, investigation on virtual learning environments has been extensively discussed. Virtual worlds offer a stimulating and new environment to improve learning for students to generate further interactive learning experience. Virtual learning environments have been provided as an adaptable and independently learning environment for students (Richardson & Swan, 2003; Smith et al, 2009). Using of virtual learning environments is not limited to well-‐structured knowledge spaces, but people need the specification to become more remarkable as effective learning environment in virtual learning environments. The investigations express that feeling of social presence through learning within virtual environments is the most essential factor in learning satisfaction outcomes (Richardson & Swan, 2003).
Social presence is specified as realized psychological intimacy which is formed in part by verbal and non-‐verbal cues (Bailenson et al., 2005). Biocca (2001) defined social presence as the awareness of the existence of others that is attained through a sense of participation with them. In other words, social presence is the significant factor that shapes the quality of learning in learners, and also it can control the opportunities of collaborative learning. However, the majority of investigations in this field cannot satisfy the above conditions and cannot support instructors and designers in achieving the desired goals.
More study is required to recognize how virtual learning environments facilitate learning and show specifications by considering the ways in which virtual attributes affect learning satisfaction in students. For this reason this study is doing more investigation on the relation between social presence and students’ satisfaction in learning outcomes that are currently engaged in virtual learning environment, and consequently it will achieve more accurate findings on the above goal. There are two research objectives in this study; the first objective is to identify the importance of social presence to increase learning satisfaction within virtual learning

Enhancing Learning within the 3-‐D Virtual Learning Environment
261
Vol. III, Issue 3 June 2013
environments and the second objective is to examine students’ perception of social presence in virtual learning environments. Second Life, as an example of virtual learning environments produced by Linden Lab Company in 2003 and permits participants to interact with other members synchronously online (Second Life, 2010). In this study Second Life considered as a learning medium to examine the feeling of social presence in students’ learning activities, which are adopted for this study.
This study is planned as follows. Firstly, it discusses the relevant literature on perception of social presence in virtual learning environments. Subsequent a descriptive study was conducted to examine two objectives presented in this study. The following analyzing the data derived from case study. In conclusion this study presents the finding and discusses some implication for lecturers, online course designers, and researchers are increasingly investigating the use of virtual environments for online learning.
Literature Review
This study has reported that 3-‐D virtual learning environments can be successfully used for learning tasks if they are conducted by pedagogy (Dalgarno & Lee, 2010). The literature review highlighted characteristics of virtual learning environments including social interaction and social presence in virtual learning environments. This chapter also confirmed the main theoretical structure that supports this study.
Virtual Learning Environments
All findings from the examinations of the effects of virtual learning environments on education are significant to the latest emerging virtual learning environments and they can provide a useful direction as well as instructions for education on virtual learning environments. According to Samah, Carolyn and Leslie (2009); virtual learning environments have appeared as an innovative communication medium and characterized as a computer generated in 3-‐D (three dimensional) and multiuser interfaces that students have feeling on other members as being there and experience a sense of social presence in that environment.

Enhancing Learning within the 3-‐D Virtual Learning Environment
262
Vol. III, Issue 3 June 2013
Mclellan (2004) represented that virtual learning environments can be considered as a simulation of an educational class with computer-‐controlled and multisensory communication technologies. Zhang (2009) stated that virtual learning environments are combined systems of networked online devices and sources which facilitate, and make achievable different courses by on-‐campus or distance education for students and it is similar to the real environments by interactions between avatars and virtual tools.
For the concept of collaborative learning in virtual learning environments; Hedberg and Brudvik (2008) stated that collaborative virtual learning environment is the most important kinds of virtual learning environments which enable learners to perform tasks jointly rather than just communicate. Collaborative learning plans engage tasks and activities that involve helpful interdependence between learners; this means that, in effective virtual learning environments it is necessary that all participants attempt to be invaluable for the achievement of the goals and each member have a positive contribution in his or her task responsibilities.
Second Life as a significant virtual learning environment is a 3-‐D and full immersive program based on internet and entirely built and owned by its residents in virtual world (Second Life, 2010). Learning in this style of education is new and it is an uncharted territory for many instructors and students. Samah, Carolyn, and Leslie (2009) defined Second Life as a 3-‐D internet-‐based and multi-‐user virtual environment, which can be considered as an effective collaborative virtual learning environment. Many education centers and institutions have created a combined learning plan in Second Life with large achievements in learning. Warburton (2009) represented the learning capability of Second Life and indicated that virtual worlds have strong visual effects, they are well interactive, offer students a sense of presence, and social presence, and provide a possibility for immersion in simulation. Young (2009) specified the possibilities of expanding learning schemes in 3-‐D mediums such as Second Life to improve socializing and social presence between members. Findings described Second Life facilitated learners’ socialization and collaboration.

Enhancing Learning within the 3-‐D Virtual Learning Environment
263
Vol. III, Issue 3 June 2013
Social Presence
Social presence is the perception of others in the same environment. Short et al. (1976) highlighted that a high amount of perceived social presence can facilitate learners engage in interaction. Short argued that “the ability to support transfer information about facial expressions, attitude, looking direction, clothing and non-‐verbal oral indicates, all give to the social presence of communication element in a medium” (p. 65). Garrison et al. (2003), and Hall, Herrington (2010) believed that structure of learning environment requires a feeling of social presence between the learners, on the other hand learning in medium depends to social presence. They defined social presence as a key factor of effective virtual learning environment, which can be considered as a grade of quality of the virtual learning environment in which the person is perceived as a real person. Richardson and Swan (2003) explained that those learners who have high overall sense of social presence in virtual learning environments also scored high in sense of learning and sense of satisfaction with the instructor. Tu and McIsaac (2002) examined social presence and interaction inside online learning environments. This issue focused on the relation between social presence and participants’ interaction and they used a combination techniques approach. Their study identified social presence confidently affected online interaction.
The interaction between instructor and students also has a significant role in perceiving social presence in virtual learning environments. Whiteman (2002) and Wood (2009) expressed that social presence has been displayed to create a sense of community by enhancing interaction between instructors and students, and students, whereas providing group togetherness. Social presence in virtual learning environments is connected with sense of insertion, warmth, and management. Instructor presence behaviors such as feedback and response to student’s actions enhance the sense of social presence since they help to reduce the psychological blanks in medium environments (Liu, Gomez & Yen, 2009; Hall & Herrington, 2010). Findings by Witt et al. (2004) represented there is an important relationship between instructor presence and students’ learning satisfaction, they identified instructor presence is a unique construct in combined verbal and nonverbal behaviors in positive learning outcomes.
Enhancing Learning within the 3-‐D Virtual Learning Environment
264
Vol. III, Issue 3 June 2013
Social Presence Theory
There are few theories in learning process and how learning happens which seek to answer the challenges in learning. The important theory, which plays a significant role in creating sense of social presence in medium environment, is Social Presence Theory. Social presence theory is defined by Short et al., Williams, and Christie in 1976. They defined this theory as “the degree of salience of the other person in the interaction and the consequent salience of the interpersonal relationships” (p. 64). This theory specified social presence as a serious aspect of mediums; it played an important role in generating a sense of community and creating educational efficiency in mediums (Richardson & Swan, 2003). Short, Williams, and Christie also expressed that social presence refers to the quality of the medium which determines the quality of interaction and communication in medium (Hall & Herrington, 2010). According to Short et al. theory, the key factor of social presence that causes a high feeling in social presence and identifies the structure of successful learning in an effective medium environment is immediacy (Short, Williams & Christie 1976; Swan, 2002; Hall & Herrington, 2010). This theory specifies that a fundamental section of any given communication medium is its rank of social presence.
Many researchers have used immediacy factor to evaluate social presence. The meaning of immediacy refers to the sense of closeness to people proofed by communication behaviors (Weiner & Mehrabian, 1968; Cheryl C. J., 2009). Pelowski et al. (2005) and Cheryl (2009) proposed that instructor and students’ interaction increase immediacy behaviors, which are significant in social presence through mediums. Immediacy behaviors control social presence in virtual learning environments, Whitten and Larose (2000) represented that learner immediacy behaviors make a sense of connectedness to people in learning environment. Schwartzman (2007) reported that the need of face-‐to-‐face communication in the non-‐synchronous mediums such as text-‐based online environments limits communication immediacy (Cheryl, 2009). In face to face communication, immediacy behaviors is related to physical distance between two communicators and it gives them the feeling of being physically close, whereas intimacy behaviors are verbal behaviors of self-‐disclosure to maintain a sense of equilibrium (Rettie, 2003; Hall & Herrington, 2010). Swan (2002) showed that in virtual learning environments the feeling of

Enhancing Learning within the 3-‐D Virtual Learning Environment
265
Vol. III, Issue 3 June 2013
“being with others” has an effective outcome on the conversation and increases immediacy and subsequently increases social presence. Hall and Herrington (2010) reported that by increasing immediacy and intimacy behaviors in virtual learning environments, the quality of learning will increase. They argued in different mediums students may possibly perceive different volumes of immediacy and intimacy; but in effective virtual learning environments students must perceive the sufficient volume of immediacy and intimacy to make warmness and create a sense of belonging to that environment.
Anderson and Garrison (2003), and Nicholas et al. (2010) represented that for having a secure and supportive learning environment, immediacy plays an essential role since it decreases individual risk and enhances adoption in learners. Anderson and Garrison break up the structure of social presence into three important groups, which are expressive of social presence inside online collaborative learning environments: Open communication, affective responses and consistent responses.
Methodology
Although using of online learning environments becomes more remarkable in education but there is little empirical finding to support learning in online learning environment. The potential of virtual learning environments has frequently been related to the expansion of sense of social presence, which is obtained from students and instructors. The purpose of this study was to investigate the development of student perception of learning and to analyze the impact of social presence on increasing learning satisfaction within virtual learning environments.
The following research propositions were examined: P1: Overall perceived social presence is related to overall students’
social comfort in expressing feelings with other participants within virtual course.
P2: Overall perceived social presence is related to overall assistance in group work activities with other participants within virtual course.
P3: Overall student perceptions of satisfaction with instructor are related to student’s perceived social presence within virtual course.
Enhancing Learning within the 3-‐D Virtual Learning Environment
266
Vol. III, Issue 3 June 2013
P4: The high level of student’s perceived learning is related to highest level of perceived social presence in virtual course activities.
In this study; a course selected from English learning course launched by Language-‐lab in Second Life, which conducted among students (n=40) from KLMU College in Malaysia and attempted to analyze the level of social presence perceived by students who participated in this course activity. The course was intended for pre-‐advanced level students and took place twice a week on Wednesdays and Saturdays from 12.00 am – 1.30 pm (7.00 pm GMT) for 80 minutes each for a total of three credit-‐hours in advanced level of English course.
Doing a survey through online questionnaire was the main data collection instrument in this study to gather responses from respondents and it was supported by five-‐point Likert scale with ranging from 1 (strongly disagree) to 5 (strongly agree). The questions asked in the questionnaire gave the specificity and scope, which were necessary in quantitative research.
The questionnaire structured on five sections: • Section (1) is demography part and it was considered as supporting
data. • Section (2) is background and general experiences of participants in
using Second Life as a suitable and effective tool in education. • Section (3) is about social comfort and sensing affect during virtual
course. • Section (4) is about assistance in group work activities with other
participants in virtual course. • Section (5) is about instructor presence related to social presence in
virtual course.
Research Design
In this study, a correlation design was employed. The variables addressed in this study were; student’ social comfort, student’ assistance in group work activities, student’ satisfaction with the instructor and student’ feeling of learning satisfaction. This study classified as a quantitative study. The descriptive study was used to present a general consideration of significance of social presence on students’ perception of learning within virtual learning

Enhancing Learning within the 3-‐D Virtual Learning Environment
267
Vol. III, Issue 3 June 2013
environment. The quantitative data collected through a survey by used an online questionnaire.
Data Collection and Analysis
Doing a survey through online questionnaire was main data collection instrument in this study. The questionnaire constructed based on social presence scale distributed from March 10 to March 25 of 2012. The survey was delivered to the respondents by offering it to the students at the end of the course and also through invitation email having a hyperlink to the questionnaire. A reminder e-‐mail also sent to the respondents after one week time. Meanwhile, this study involved 40 students participated in virtual course but only 30 (18 male and 12 female) respondents went through until week 2 of the survey. The quantitative data was gained from the survey was analyzed using descriptive statistics. Using statistical software’s SPSS, results were analyzed and tables and graphs was produced.
Table 1: Demographic Data of the Respondents
Description Frequency Percentage Gender
Male 18 60
Female 12 40 Education Level
Undergraduate 17 56.67
postgraduate 13 43.33 Age
18-‐24 18 60.0
25-‐34 12 40.0 English Proficiency
Basic 1 3.33
Good 16 53.44
Fluent 13 43.33
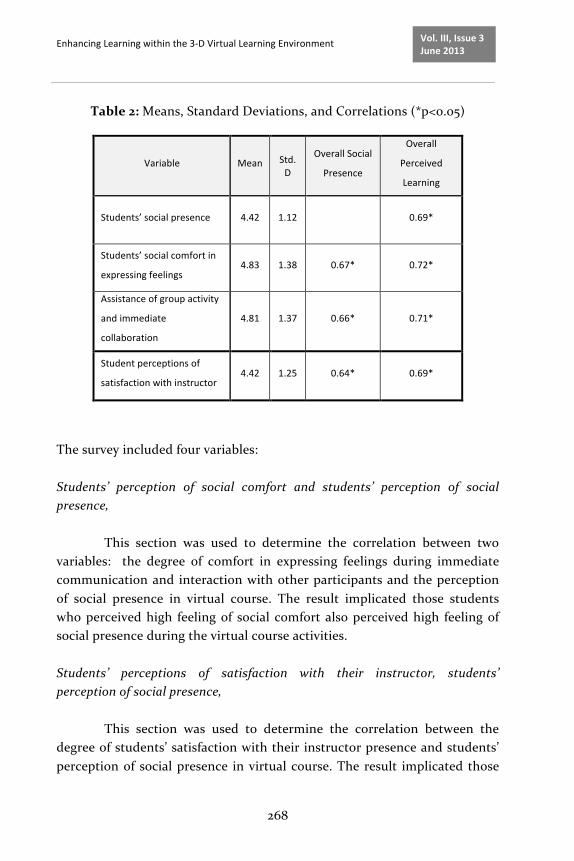
Enhancing Learning within the 3-‐D Virtual Learning Environment
268
Vol. III, Issue 3 June 2013
Table 2: Means, Standard Deviations, and Correlations (*p<0.05)
Variable Mean Std. D
Overall Social
Presence
Overall
Perceived
Learning
Students’ social presence 4.42 1.12 0.69*
Students’ social comfort in
expressing feelings 4.83 1.38 0.67* 0.72*
Assistance of group activity
and immediate
collaboration
4.81 1.37 0.66* 0.71*
Student perceptions of
satisfaction with instructor 4.42 1.25 0.64* 0.69*
The survey included four variables: Students’ perception of social comfort and students’ perception of social presence,
This section was used to determine the correlation between two variables: the degree of comfort in expressing feelings during immediate communication and interaction with other participants and the perception of social presence in virtual course. The result implicated those students who perceived high feeling of social comfort also perceived high feeling of social presence during the virtual course activities. Students’ perceptions of satisfaction with their instructor, students’ perception of social presence,
This section was used to determine the correlation between the degree of students’ satisfaction with their instructor presence and students’ perception of social presence in virtual course. The result implicated those
Enhancing Learning within the 3-‐D Virtual Learning Environment
269
Vol. III, Issue 3 June 2013
students who were most satisfied with their instructor presence in immediate interaction and communication also perceived high feeling of social presence during the virtual course activities. Student assistance in group work activities, Student perception of social presence,
This section was used to determine the correlation between students’ perception of social presence and students’ assistance in group work activities within virtual course activities. The result implicated those students who perceived high level of satisfaction through collaborations and assistance in group work activities also they perceived high level of social presence in virtual course. Student perception of social presence, student feeling of learning satisfaction,
This section was used to determine the correlation between two variables; students’ perception of social presence and students’ feeling of learning satisfaction in virtual course activities. The result implicated those students who perceived high feeling of social presence also perceived they learned more in Second Life.
Discussion
According to the findings of this study the following propositions were discussed:
P1: Overall perceived social presence is related to overall students’
social comfort in expressing feelings with other participants within virtual course.
The data analysis shows that students’ participation in virtual course activities influenced their sense of social presence during experiencing advanced feelings of social comfort and sensing affect. The significant correlation (0.67) clearly specified a relationship between social comfort and social presence and it supports the hypothesized relationship between them, as well as it supports overall perceived learning within virtual course.

Enhancing Learning within the 3-‐D Virtual Learning Environment
270
Vol. III, Issue 3 June 2013
The relevant literature from Weiner and Mehrabian (1968) and Cheryl (2009) specified social comfort and sense of closeness to people proofed by communication behaviors as an immediacy plays an essential role in increasing feeling of social presence in medium. The correlation analysis (0.72) yielded between social presence and overall perceived learning confirms that high perception of social presence figure out high overall perceived learning within virtual course activities in Second Life.
P2: Overall perceived social presence is related to overall assistance
in group work activities with other participants within virtual course. The data analysis shows that students’ assistance in group work
activities with other participants influenced their sense of social presence within virtual course. The correlation finding (0.67) specified that students with high overall assistance in group work activities also had high overall social presence scores and it proves the hypothesized relationship between them, as well as it supports overall perceived learning within virtual course. The correlation analysis (0.71) yielded between social presence and overall perceived learning confirms that high perception of social presence figure out high degree of student’s perceived learning within virtual course activities in Second Life.
P3: Overall student perceptions of satisfaction with instructor are
related to student’s perceived social presence within virtual course. The correlation analysis (0.64) specified the relationship between
student perceptions of satisfaction with instructor and sense of social presence. The analysis specifies students who perceived high feeling of social presence also were extremely satisfied with course instructor. The analysis proves the hypothesized relationship between student perceptions of satisfaction with instructor and sense of social presence, as well as it supports overall perceived learning within virtual course with correlation of 0.69 obtained between social presence and overall perceived learning.
According to the findings and the relevant literature; those students who perceived instructor immediacy behaviors also perceived high feeling of social presence within the virtual course; Moore et al. (1996) illustrated a significant correlation between instructor immediacy behaviors and students. Perceiving more frequent immediacy behaviors in verbal and
Enhancing Learning within the 3-‐D Virtual Learning Environment
271
Vol. III, Issue 3 June 2013
nonverbal forms were likely to provide higher score to the overall quality of learning for students and instructors. The key factor of social presence that causes a high feeling in social presence and identifies the structure of successful learning in an effective medium environment is immediacy (Short et al., 2002; Hall & Herrington, 2010). Gorham and Zakahi (1990) stated there is a significant relationship between immediacy behaviors of students and instructors and of student learning outcomes. All these findings indicated overall student’s perceived satisfaction with instructor are related to students’ perceived social presence within virtual course.
P4: The high level of student’s perceived learning is related to highest level of perceived social presence in virtual course activities.
The correlation analysis with score of 0.69 clearly specified the relationship between students’ social presence and student’s perceived learning. This finding determines students with high feeling of social presence also had high level of satisfaction in perceived learning. In other words social presence is a significant predictor of learning satisfaction. Also according to relevant literature from Boverie et al. (1997) and Zhang (2009) examined the role of social presence as significant factor in online education. Their findings showed that, social presence were a significant predictor of satisfaction in online learning. According to Short et al. social presence causes high feeling of social presence and identifies the structure of successful learning in an effective medium environment (Short et al., 1976; Hall & Herrington, 2010).
Conclusions
The potential of online learning environments has frequently been related to the expansion of sense of social presence which is obtained from students and instructors in the course. This study tried to examine the impact of social presence on increasing learning satisfaction in virtual learning environments. The descriptive study was conducted among students in a higher education institute through a virtual course in Second Life and by analyzing the data in this research, it was indicated that social presence is a vital element affecting students’ learning satisfactions in virtual learning environment and revealed some important specifications such as feeling of social comfort, student satisfaction with the instructor and immediate

Enhancing Learning within the 3-‐D Virtual Learning Environment
272
Vol. III, Issue 3 June 2013
interactions among participants increased immediacy behaviors which are significant factor in social presence and increased high feeling of social presence within virtual course. In conclusion this study presented some findings and discusses some implication for lecturers, online course designers, and researchers are increasingly investigating the use of virtual course in online learning.
Appendix Online Survey
Rate according to: 1 – Strongly Disagree 2 – Disagree 3 – Neutral 4 – Agree 5 – Strongly Agree
Second Life as a Educational Tool
I find Second Life to be an effective learning tool. 1 2 3 4 5
I find it difficult to learn in Second Life. 1 2 3 4 5
I would like to use Second Life again in other courses. 1 2 3 4 5
If there are no marks given, I would still use Second Life to learn. 1 2 3 4 5
I learn much more in Second Life compared to traditional classroom. 1 2 3 4 5
I find no difference learning in Second Life as with traditional methods.
1 2 3 4 5
I would recommend Second Life as learning tool to my juniors and friends.
1 2 3 4 5
Second Life made learning more interactive. 1 2 3 4 5
DEMOGRAPHIC 1. Gender: Male/Female
2. Year of study: Undergraduate/Postgraduate
3. Nationality : ______________________________
4. Age : _____________________
5. Is English your native language? YES/NO
a. If it is not, how would you rate your proficiency in English? Basic/Good/ Fluent
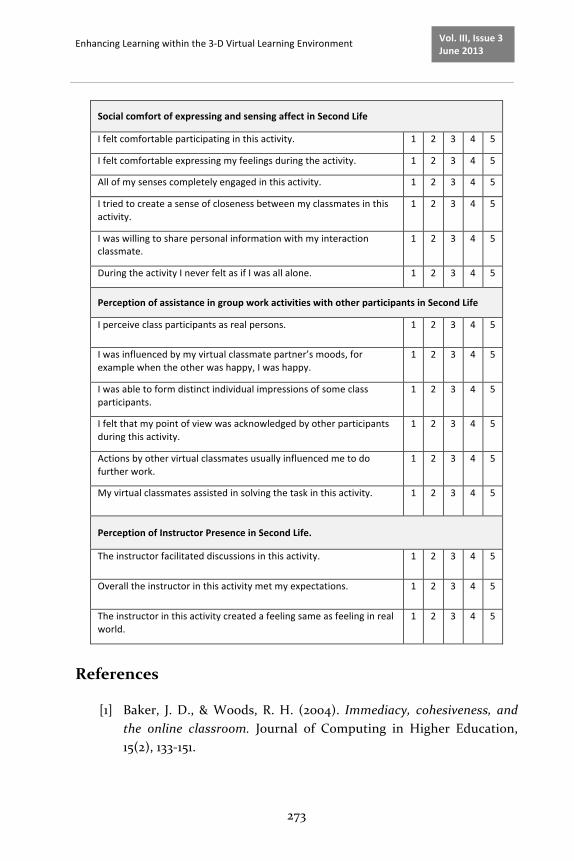
Enhancing Learning within the 3-‐D Virtual Learning Environment
273
Vol. III, Issue 3 June 2013
Social comfort of expressing and sensing affect in Second Life
I felt comfortable participating in this activity. 1 2 3 4 5
I felt comfortable expressing my feelings during the activity. 1 2 3 4 5
All of my senses completely engaged in this activity. 1 2 3 4 5
I tried to create a sense of closeness between my classmates in this activity.
1 2 3 4 5
I was willing to share personal information with my interaction classmate.
1 2 3 4 5
During the activity I never felt as if I was all alone. 1 2 3 4 5
Perception of assistance in group work activities with other participants in Second Life
I perceive class participants as real persons. 1 2 3 4 5
I was influenced by my virtual classmate partner’s moods, for example when the other was happy, I was happy.
1 2 3 4 5
I was able to form distinct individual impressions of some class participants.
1 2 3 4 5
I felt that my point of view was acknowledged by other participants during this activity.
1 2 3 4 5
Actions by other virtual classmates usually influenced me to do further work.
1 2 3 4 5
My virtual classmates assisted in solving the task in this activity. 1 2 3 4 5
Perception of Instructor Presence in Second Life.
The instructor facilitated discussions in this activity. 1 2 3 4 5
Overall the instructor in this activity met my expectations. 1 2 3 4 5
The instructor in this activity created a feeling same as feeling in real world.
1 2 3 4 5
References
[1] Baker, J. D., & Woods, R. H. (2004). Immediacy, cohesiveness, and the online classroom. Journal of Computing in Higher Education, 15(2), 133-‐151.

Enhancing Learning within the 3-‐D Virtual Learning Environment
274
Vol. III, Issue 3 June 2013
[2] Boverie, P., Nagel, L., McGee, M. & Garcia, S. (1997). Learning styles, emotional intelligence and social presence as predictors of distance education student satisfaction.
[3] Cheryl, C. J. (2009). Social presence in the asynchronous online learning environment. PhD dissertation, University of Phoenix.
[4] Dalgarno, B., & Mark, J. W. (2009). What are the learning affordances of 3-‐D virtual environments? British Journal of Educational Technology, 41(1), 10-‐32.
[5] Falloon, G. (2010). Using avatars and virtual environments in learning: What do they have to offer? British Journal of Educational Technology, 41(1), 108-‐122.
[6] Garrison, R., Anderson, T., & Archer W. (2003). A Theory of Critical Inquiry in Online Distance education. In Moore, M & Anderson, W (Eds.), Handbook of Distance Education (pp. 113-‐127). Mahwah, NJ: Lawrence Erlbaum Associates, Inc.
[7] Gorham, J. & Zakahi, W.R. (1990). A comparison of teacher and student perceptions of immediacy and learning: Monitoring process and product. Communication Education, 39, 354-‐368.
[8] Hostetter, C., & Busch, M. (2006). Measuring up online: The relationship between social presence and student learning satisfaction. Journal of Scholarship of Teaching and Learning, 6(2), 1-‐12.
[9] Hedberg, J. G. & Brudvik, O. C. (2008). Supporting dialogic literacy through mashing and modding of places and spaces. Theory into Practice, 47(2), 138–149.
[10] Livingstone, D., Kemp, J., & Edgar, E. (2008). From multi-‐user virtual environment to 3-‐D virtual learning environment. Association for Learning Technology Journal, 16(3), 139-‐150.
[11] McLellan, H. (2005). Virtual Realities. In D.H. Jonassen (Ed.), Handbook of research on educational communications and technology. Lawrence Erlbaum, New Jersey.
[12] Mehrabian, A. (1969). Some referents and measures of nonverbal behavior. Behavior Research Methods and Instrumentation, 1(6), 205-‐207.

Enhancing Learning within the 3-‐D Virtual Learning Environment
275
Vol. III, Issue 3 June 2013
[13] Moore, A., Masterson, J.T., Christophel, D.M., & Shea, K.A. (1996). College teacher immediacy and student ratings of instruction. Communication Education, 45, 29-‐39.
[14] Nicholas, M., & Omale, Ed.D. (2010). Exploring the use of 3-‐D multi-‐user virtual environments for online problem-‐based learning. PhD dissertation, Northern Illinois University.
[15] Rettie, R. (2003). Connectedness, awareness and social presence. Paper presented at the 6th International Presence Workshop, Aalborg University, Aalborg, Denmark.
[16] Richardson, J., & Swan, K. (2003). Examining social presence in online courses in relation to students' perceived learning and satisfaction, Journal of Asynchronous Learning Networks, 7(1), 68-‐88.
[17] Swan, K. (2002). Immediacy, social presence and asynchronous discussion. American Journal of instance Education, 16 (3), 131-‐ 150.
[18] Smith, M., Zane, & Berge, L. (2009). Social Learning Theory in Second Life [Electronic Version]. MERLOT Journal of Online Learning and Teaching, 5(2). Retrieved 9 May 2011, from http://jolt.merlot.org/vol5no2/berge_0609.htm
[19] Samah, M., Carolyn, R., Leslie, B. (2009). How the Use of Second Life Affects E-‐Learners’ Perceptions of Social Interaction in Online Courses? University of Louisville, Louisville, United States.
[20] Wood, L. (2009). An experimental study of instructor immediacy in the Wimba virtual classroom. PhD dissertation, University of San Diego.
[21] Warburton, S. (2009). Second Life in higher education: Assessing the potential for and the barriers to deploying virtual worlds in learning and teaching. British Journal of Educational Technology, 40(3), 414-‐426.
[22] Young, J. R. (2000). Virtual reality on a desktop hailed as new tool in distance education. The Chronicle of Higher Education. Retrieved 01 May 2011, from http://chronicle.com/free/v47/i06/06a04301.htm
[23] Zhang, C. (2009). Understanding the Impact of Virtual World Environment on Social and Cognitive processes in Learning. Ph.D. dissertation, University of Nebraska, United States.

Journal of Knowledge Management, Economics and Information Technology is dedicated to promote and publish original articles in areas such as knowledge management, economics and information technology, aim to reduce the gap between research and practice.
The Journal contributes to the development of theory and practice of knowledge management, economics and information technology. Accepts academic papers, case studies, articles that contribute to current research areas mentioned.
Journal of Knowledge Management, Economics and Information Technology is an Open-‐Access Journal. There are several advantages of open-‐access publishing, including increased visibility globally and, therefore, increased chance of your work reaching potential readers and users.
Participants are expected to submit papers (research papers, review papers, Ph.D. research in progress, case studies), which have not been publicly presented or published before.
The organizers hope that the contributors will provide a valuable overview of the current trends in academic research within a larger context of the global impact on society, economy and information technology.
v
Publication Information: Journal of Knowledge Management, Economics and Information Technology is published six yearly issues in hard copy (ISSN 2247-‐7756) and online (ISSN 2069-‐5934) by Scientific Papers. Abstracted / Indexed in: DOAJ – Directory of Open Access Journals RePEc – Research Papers in Economics EBSCO Publishing Ulrich’s Periodicals Directory Index Copernicus International The Open Access Digital Library Open J-‐Gate The Journal’s editors invite you to submit original research papers, interested academics and practitioners. You can submit your papers by email to [email protected]. Submission guidelines and important infos are available at http://www.scientificpapers.org Issue acquisition: You can buy a hardcopy item for 28,80 Euro (including delivery). Orders at [email protected]. For any inquiries for the Journal of Knowledge Management, Economics and Information Technology, please write at [email protected] or visit http://www.scientificpapers.org
v


![Journalof ! Knowledge!Management,!Economics! and ...framework [environment] – are not natural at all, nor as effects nor in terms of routes followed, methods used. As a result, the](https://img.pdfslide.us/doc/110x75/5e7f7517368e7a26136ae399/journalof-knowledgemanagementeconomics-and-framework-environment-a.jpg)