ICA Gruppen Interim report January–March 2015
1
First quarter 12 months Apr 2014–Mar 2015
Full year2014SEKm 2015 2014
Group
Net sales 23,673 19,755 91,092 87,174
Operating profit before depreciation (EBITDA) 1,146 1,028 5,937 5,819
Operating profit (EBIT) excluding non-recurring items 775 699 4,013 3,937
Operating profit (EBIT) 777 704 4,170 4,097
Profit before tax 686 615 3,798 3,727
Profit from continuing operations 529 477 3,157 3,105
Profit for the period 539 299 2,907 2,667
Cash flow from continuing operating activities 221 201 3,814 3,794
Cash flow from operating activities 316 63 3,865 3,612
Operating margin excluding non-recurring items, % 3.3 3.5 4.4 4.5
Operating margin, % 3.3 3.6 4.6 4.7
Return on capital employed, % — — 10.0 10.1
Return on equity, % — — 10.2 9.3
Earnings per ordinary share1, SEK 2.56 1.50 13.59 12.53
Earnings per ordinary share, continuing operations, SEK 2.51 2.39 14.83 14.71
¹ Same figure for ordinary shares and C shares.
Interim report first quarter 2015Good start to 2015 – new structure in place
First quarter in summary
• Consolidated net sales amounted to SEK 23,673 million (19,755). Excluding the effect of the acquisition of Apotek Hjärtat, the increase was 8.7% and the increase in local currency was 7.9%
• Operating profit excluding non-recurring items amounted to SEK 775 million (699). Of the SEK 76 million increase in operating profit, a net amount of SEK 18 million was the effect of the acquisition
• Operating profit excluding non-recurring items includes costs of SEK 53 million related to the acquisition and integration of Apotek Hjärtat
• Profit from continuing operations amounted to SEK 529 million (477)
• Earnings per share, continuing operations, amounted to SEK 2.51 (2.39)
• Cash flow from continuing operations amounted to SEK 221 million (201)
Events after the end of the quarter
• The divestment of ICA Norway could be completed on 13 April. The transaction will generate a capital gain for ICA Gruppen of approximately SEK 1.2 billion in the second quarter of 2015
• On 22 April the Annual General Meeting approved the Board’s proposal for a dividend of SEK 9.50 per ordinary share
• The divestment of Cervera was completed on 23 April resulting in a small capital loss
Apotek Hjärtat is included in ICA Gruppen from and including 15 January 2015. Cura pharmacies, previously part of ICA Sweden, is included in the pharmacy segment for the entire quarter. Historical comparative figures for ICA Sweden have been adjusted to exclude Cura pharmacies. ICA Norway is recognised as a discontinued operation.
ICA Gruppen Interim report January–March 2015
2
CEO’s commentsThe start of 2015 was stable with good growth in both sales and earnings in Sweden and the Baltic countries. The fact that we also finally closed the deal in Norway and can fully focus on successfully integrating Apotek Hjärtat into ICA Gruppen strength-ens this positive feeling. Our new structure is now in place.
ICA Gruppen had very good growth during the quarter and we continued to gain market share in all our markets. This also applies to our new business segment Apotek Hjärtat. In Sweden, food price inflation has risen slightly month for month since the end of 2014 which naturally benefits market growth in general. This can also be seen in sales figures from the ICA stores where the price effect is almost 2% for the quarter. In addition, the new stores that ICA has opened in the past year have got off to a good start. Primarily rising average spend but also more customers and more customer visits have also contributed to this favourable development. The proportion of private label products continues to grow, a key component for further development of ICA’s cus-tomer offering and something that also drives our profitability.
Rollout of online offeringFollowing the test launch in November last year, we are now rolling out our online offering. Today some 20 stores have chosen to start online services on ICA’s new platform and we are aiming for some 50 stores before the summer. The rollout will then continue throughout the year. Our expe-riences so far are positive and several of the stores that are now up and running have steadily increased their online sales even if numbers overall are small. Our goal is to be the leader in online food sales by 2017.
Continued growth in BalticsIn Rimi Baltic we are also growing at a good rate despite low inflation which is most noticeable in Latvia and Lithuania where food prices are currently falling. We are growing both in like-for-like stores and with the aid of an ambitious store establishment programme, primarily in Lithuania, where today we are relatively weaker than in the other two countries. During 2015 we will open an additional 15–20 stores in the Baltic countries.
Focus on healthOur pharmacy operations have today officially been given the name Apotek Hjärtat with ICA as part of the brand. In this way we leverage the strengths of two of Sweden’s strongest brands. Our existing Cura pharmacies will be converted into Apotek Hjärtat during 2015. Otherwise the year will naturally be characterised by the ongoing integration of these operations into ICA Gruppen which will ensure that we realise the synergies from 2016 and beyond which we have already announced. The integration has started well, is following our plans and the underlying earnings in the quarter are also in line with our plan. We have every opportunity to provide Swedish consum-ers with the market’s best and broadest offering within health and wellness, something which is entirely in tune with the times.
Long-term approach to everything we doMany activities are underway throughout the Group and I cannot mention them all here. I can just say that 2015 looks like being every bit as exciting as 2014. After completing two major deals as well as divesting three portfolio companies, we will continue to build on an ICA which will stand strong over time even in a fast-changing market.
Per StrömbergCEO ICA Gruppen
“ 2015 looks like being every bit as exciting as 2014.”
ICA Gruppen Interim report January–March 2015
3
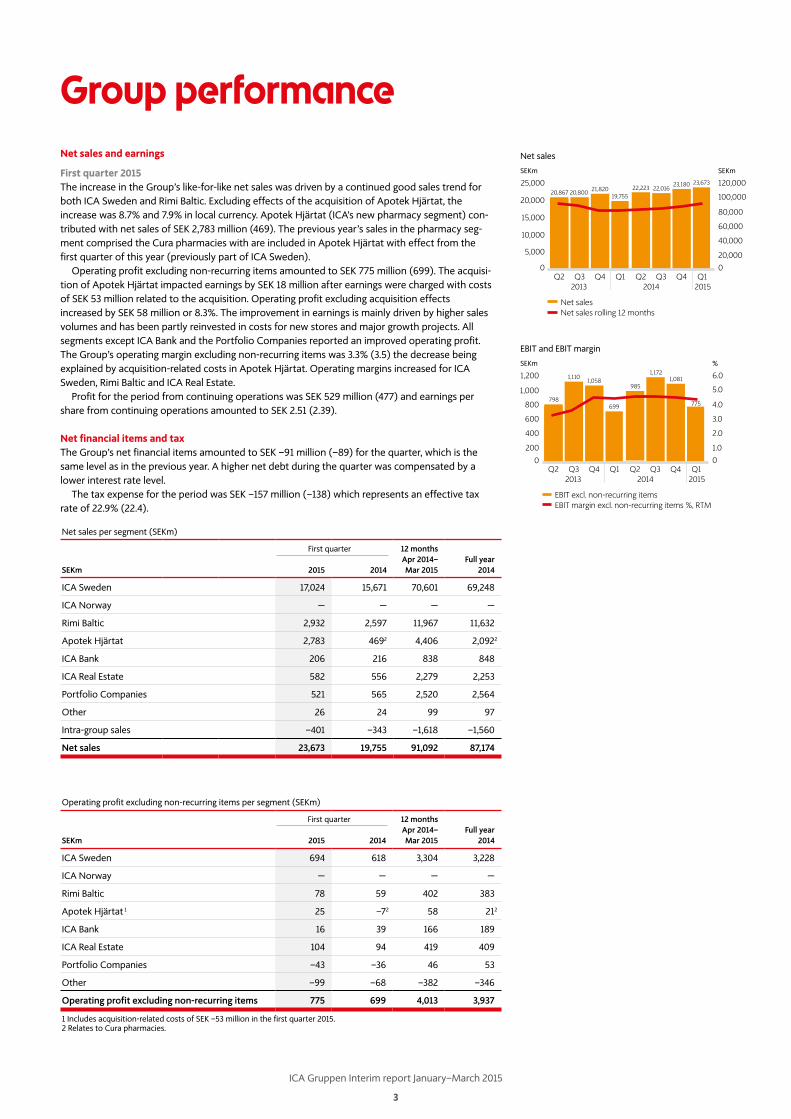
Group performanceNet sales and earnings
First quarter 2015The increase in the Group’s like-for-like net sales was driven by a continued good sales trend for both ICA Sweden and Rimi Baltic. Excluding effects of the acquisition of Apotek Hjärtat, the increase was 8.7% and 7.9% in local currency. Apotek Hjärtat (ICA’s new pharmacy segment) con-tributed with net sales of SEK 2,783 million (469). The previous year’s sales in the pharmacy seg-ment comprised the Cura pharmacies with are included in Apotek Hjärtat with effect from the first quarter of this year (previously part of ICA Sweden).
Operating profit excluding non-recurring items amounted to SEK 775 million (699). The acquisi-tion of Apotek Hjärtat impacted earnings by SEK 18 million after earnings were charged with costs of SEK 53 million related to the acquisition. Operating profit excluding acquisition effects increased by SEK 58 million or 8.3%. The improvement in earnings is mainly driven by higher sales volumes and has been partly reinvested in costs for new stores and major growth projects. All segments except ICA Bank and the Portfolio Companies reported an improved operating profit. The Group’s operating margin excluding non-recurring items was 3.3% (3.5) the decrease being explained by acquisition-related costs in Apotek Hjärtat. Operating margins increased for ICA Sweden, Rimi Baltic and ICA Real Estate.
Profit for the period from continuing operations was SEK 529 million (477) and earnings per share from continuing operations amounted to SEK 2.51 (2.39).
Net financial items and taxThe Group’s net financial items amounted to SEK –91 million (–89) for the quarter, which is the same level as in the previous year. A higher net debt during the quarter was compensated by a lower interest rate level.
The tax expense for the period was SEK –157 million (–138) which represents an effective tax rate of 22.9% (22.4).
Net sales per segment (SEKm)
First quarter 12 months Apr 2014–Mar 2015
Full year2014SEKm 2015 2014
ICA Sweden 17,024 15,671 70,601 69,248
ICA Norway — — — —
Rimi Baltic 2,932 2,597 11,967 11,632
Apotek Hjärtat 2,783 4692 4,406 2,0922
ICA Bank 206 216 838 848
ICA Real Estate 582 556 2,279 2,253
Portfolio Companies 521 565 2,520 2,564
Other 26 24 99 97
Intra-group sales –401 –343 –1,618 –1,560
Net sales 23,673 19,755 91,092 87,174
Operating profit excluding non-recurring items per segment (SEKm)
First quarter 12 months Apr 2014–Mar 2015
Full year2014SEKm 2015 2014
ICA Sweden 694 618 3,304 3,228
ICA Norway — — — —
Rimi Baltic 78 59 402 383
Apotek Hjärtat 1 25 –72 58 212
ICA Bank 16 39 166 189
ICA Real Estate 104 94 419 409
Portfolio Companies –43 –36 46 53
Other –99 –68 –382 –346
Operating profit excluding non-recurring items 775 699 4,013 3,937
1 Includes acquisition-related costs of SEK –53 million in the first quarter 2015.2 Relates to Cura pharmacies.
200
0
400
600
800
1,000
1,200
798
1,1101,058
699
985
1,1721,081
SEKm
1.0
2.0
3.0
4.0
5.0
6.0
%
EBIT and EBIT margin
EBIT excl. non-recurring items
Q3Q2 Q4 Q1 Q2 Q3 Q4 Q1
EBIT margin excl. non-recurring items %, RTM
0
775
201520142013
0
5,000
10,000
15,000
20,000
25,00020,867 20,800 21,820
19,75522,223 22,016
23,180 23,673
SEKm
20,000
40,000
60,000
80,000
100,000
120,000
SEKm
Net sales
201520142013
Net sales
Q3Q2 Q4 Q1 Q2 Q3 Q4 Q1
Net sales rolling 12 months
0
ICA Gruppen Interim report January–March 2015
4
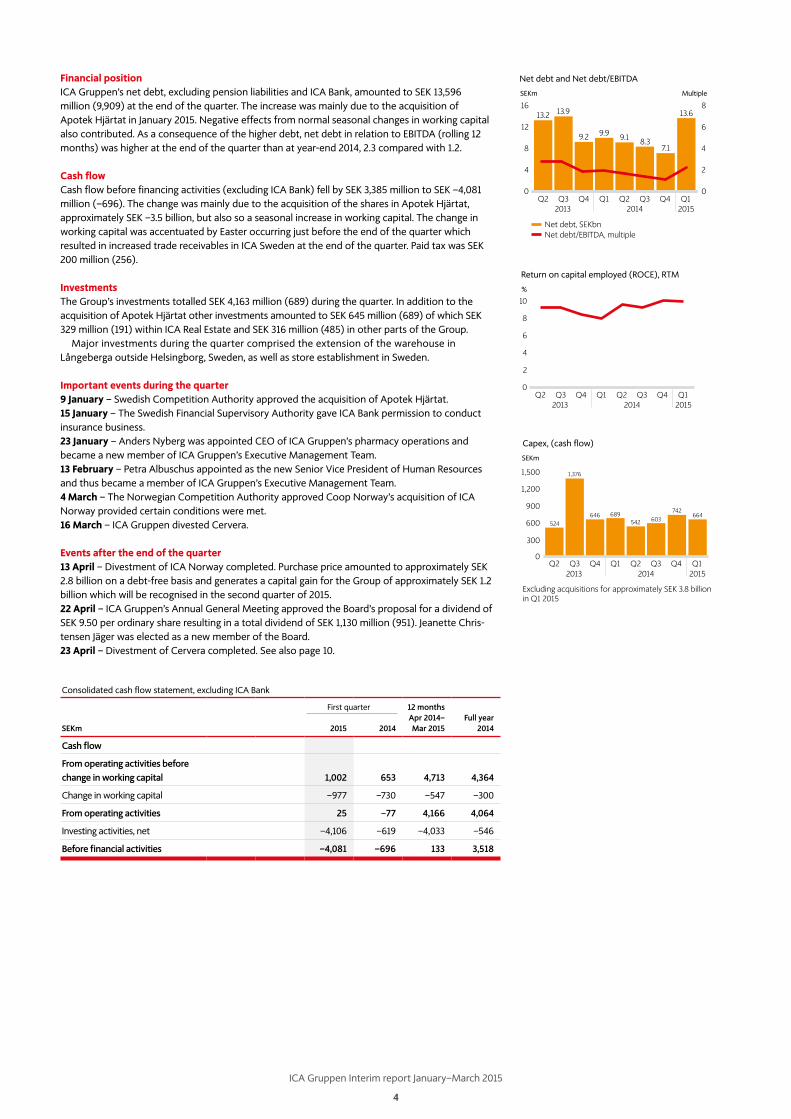
Financial positionICA Gruppen’s net debt, excluding pension liabilities and ICA Bank, amounted to SEK 13,596 million (9,909) at the end of the quarter. The increase was mainly due to the acquisition of Apotek Hjärtat in January 2015. Negative effects from normal seasonal changes in working capital also contributed. As a consequence of the higher debt, net debt in relation to EBITDA (rolling 12 months) was higher at the end of the quarter than at year-end 2014, 2.3 compared with 1.2.
Cash flowCash flow before financing activities (excluding ICA Bank) fell by SEK 3,385 million to SEK –4,081 million (–696). The change was mainly due to the acquisition of the shares in Apotek Hjärtat, approximately SEK –3.5 billion, but also so a seasonal increase in working capital. The change in working capital was accentuated by Easter occurring just before the end of the quarter which resulted in increased trade receivables in ICA Sweden at the end of the quarter. Paid tax was SEK 200 million (256).
InvestmentsThe Group’s investments totalled SEK 4,163 million (689) during the quarter. In addition to the acquisition of Apotek Hjärtat other investments amounted to SEK 645 million (689) of which SEK 329 million (191) within ICA Real Estate and SEK 316 million (485) in other parts of the Group.
Major investments during the quarter comprised the extension of the warehouse in Långeberga outside Helsingborg, Sweden, as well as store establishment in Sweden.
Important events during the quarter9 January – Swedish Competition Authority approved the acquisition of Apotek Hjärtat.15 January – The Swedish Financial Supervisory Authority gave ICA Bank permission to conduct insurance business.23 January – Anders Nyberg was appointed CEO of ICA Gruppen’s pharmacy operations and became a new member of ICA Gruppen’s Executive Management Team. 13 February – Petra Albuschus appointed as the new Senior Vice President of Human Resources and thus became a member of ICA Gruppen’s Executive Management Team.4 March – The Norwegian Competition Authority approved Coop Norway’s acquisition of ICA Norway provided certain conditions were met.16 March – ICA Gruppen divested Cervera.
Events after the end of the quarter13 April – Divestment of ICA Norway completed. Purchase price amounted to approximately SEK 2.8 billion on a debt-free basis and generates a capital gain for the Group of approximately SEK 1.2 billion which will be recognised in the second quarter of 2015.22 April – ICA Gruppen’s Annual General Meeting approved the Board’s proposal for a dividend of SEK 9.50 per ordinary share resulting in a total dividend of SEK 1,130 million (951). Jeanette Chris-tensen Jäger was elected as a new member of the Board.23 April – Divestment of Cervera completed. See also page 10.
Consolidated cash flow statement, excluding ICA Bank
First quarter 12 months Apr 2014–Mar 2015
Full year2014SEKm 2015 2014
Cash flow
From operating activities before change in working capital 1,002 653 4,713 4,364
Change in working capital –977 –730 –547 –300
From operating activities 25 –77 4,166 4,064
Investing activities, net –4,106 –619 –4,033 –546
Before financial activities –4,081 –696 133 3,518
Net debt and Net debt/EBITDA
0
4
8
12
16
0
2
4
6
813.2 13.9
9.2 9.9 9.1 8.37.1
13.6
SEKm Multiple
Net debt, SEKbnNet debt/EBITDA, multiple
Q3Q2 Q4 Q1 Q2 Q3 Q4 Q1201520142013
Return on capital employed (ROCE), RTM
0
2
4
6
8
10%
Q3Q2 Q4 Q1 Q2 Q3 Q4 Q1201520142013
Capex, (cash flow)
201520142013Q3Q2
Excluding acquisitions for approximately SEK 3.8 billion in Q1 2015
Q4 Q1 Q2 Q3 Q4 Q10
600
300
900
1,200
1,500
SEKm
524646
1,376
689542 603
742664
ICA Gruppen Interim report January–March 2015
5
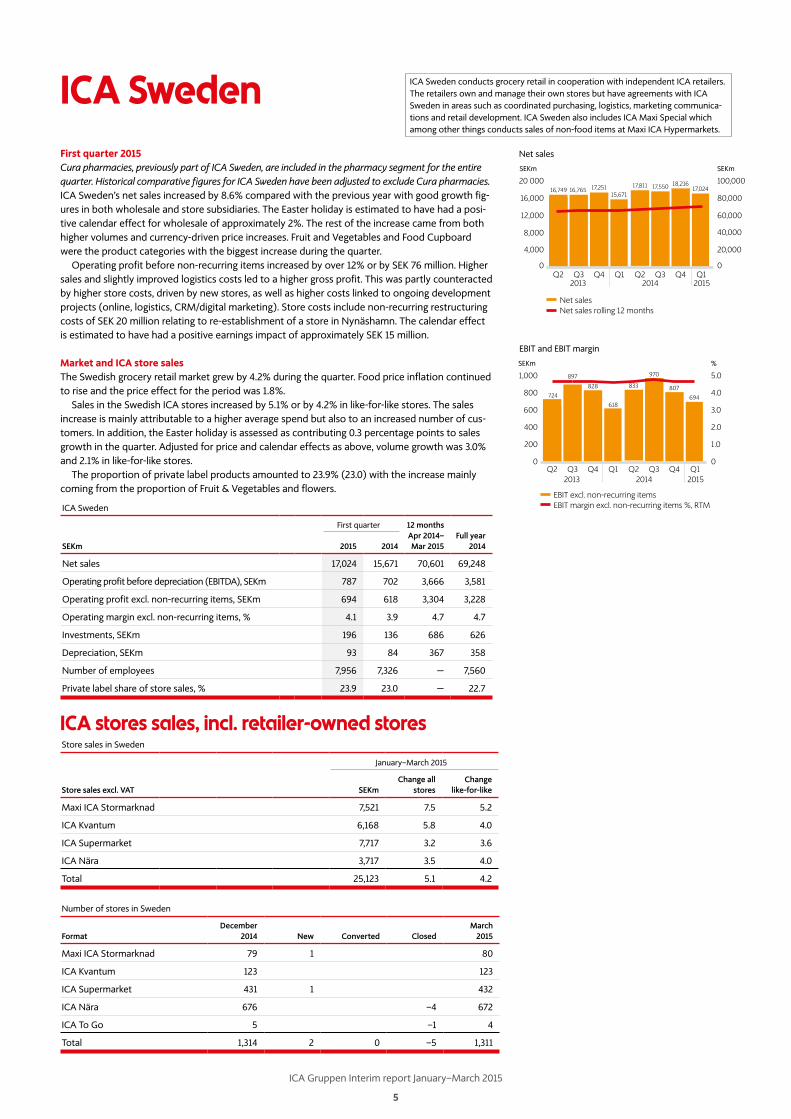
ICA SwedenFirst quarter 2015Cura pharmacies, previously part of ICA Sweden, are included in the pharmacy segment for the entire quarter. Historical comparative figures for ICA Sweden have been adjusted to exclude Cura pharmacies. ICA Sweden’s net sales increased by 8.6% compared with the previous year with good growth fig-ures in both wholesale and store subsidiaries. The Easter holiday is estimated to have had a posi-tive calendar effect for wholesale of approximately 2%. The rest of the increase came from both higher volumes and currency-driven price increases. Fruit and Vegetables and Food Cupboard were the product categories with the biggest increase during the quarter.
Operating profit before non-recurring items increased by over 12% or by SEK 76 million. Higher sales and slightly improved logistics costs led to a higher gross profit. This was partly counteracted by higher store costs, driven by new stores, as well as higher costs linked to ongoing development projects (online, logistics, CRM/digital marketing). Store costs include non-recurring restructuring costs of SEK 20 million relating to re-establishment of a store in Nynäshamn. The calendar effect is estimated to have had a positive earnings impact of approximately SEK 15 million.
Market and ICA store salesThe Swedish grocery retail market grew by 4.2% during the quarter. Food price inflation continued to rise and the price effect for the period was 1.8%.
Sales in the Swedish ICA stores increased by 5.1% or by 4.2% in like-for-like stores. The sales increase is mainly attributable to a higher average spend but also to an increased number of cus-tomers. In addition, the Easter holiday is assessed as contributing 0.3 percentage points to sales growth in the quarter. Adjusted for price and calendar effects as above, volume growth was 3.0% and 2.1% in like-for-like stores.
The proportion of private label products amounted to 23.9% (23.0) with the increase mainly coming from the proportion of Fruit & Vegetables and flowers.
ICA Sweden
First quarter 12 months Apr 2014–Mar 2015
Full year2014SEKm 2015 2014
Net sales 17,024 15,671 70,601 69,248
Operating profit before depreciation (EBITDA), SEKm 787 702 3,666 3,581
Operating profit excl. non-recurring items, SEKm 694 618 3,304 3,228
Operating margin excl. non-recurring items, % 4.1 3.9 4.7 4.7
Investments, SEKm 196 136 686 626
Depreciation, SEKm 93 84 367 358
Number of employees 7,956 7,326 — 7,560
Private label share of store sales, % 23.9 23.0 — 22.7
Number of stores in Sweden
FormatDecember
2014 New Converted ClosedMarch
2015
Maxi ICA Stormarknad 79 1 80
ICA Kvantum 123 123
ICA Supermarket 431 1 432
ICA Nära 676 –4 672
ICA To Go 5 –1 4
Total 1,314 2 0 –5 1,311
ICA Sweden conducts grocery retail in cooperation with independent ICA retailers. The retailers own and manage their own stores but have agreements with ICA Sweden in areas such as coordinated purchasing, logistics, marketing communica-tions and retail development. ICA Sweden also includes ICA Maxi Special which among other things conducts sales of non-food items at Maxi ICA Hypermarkets.
Store sales in Sweden
January–March 2015
Store sales excl. VAT SEKmChange all
storesChange
like-for-like
Maxi ICA Stormarknad 7,521 7.5 5.2
ICA Kvantum 6,168 5.8 4.0
ICA Supermarket 7,717 3.2 3.6
ICA Nära 3,717 3.5 4.0
Total 25,123 5.1 4.2
ICA stores sales, incl. retailer-owned stores
200
0
400
600
800
1,000
724
618
833
970
807
SEKm
1.0
2.0
3.0
4.0
5.0
%
EBIT and EBIT margin
EBIT excl. non-recurring items
Q3Q2 Q4 Q1 Q2 Q3 Q4 Q1
EBIT margin excl. non-recurring items %, RTM
0
694
201520142013
897
828
0
4,000
8,000
12,000
16,000
20 00016,749 16,765 17,251
15,67117,811 17,550 18,216
17,024
SEKm
20,000
40,000
60,000
80,000
100,000
SEKm
Net sales
201520142013
Net sales
Q3Q2 Q4 Q1 Q2 Q3 Q4 Q1
Net sales rolling 12 months
0
ICA Gruppen Interim report January–March 2015
6
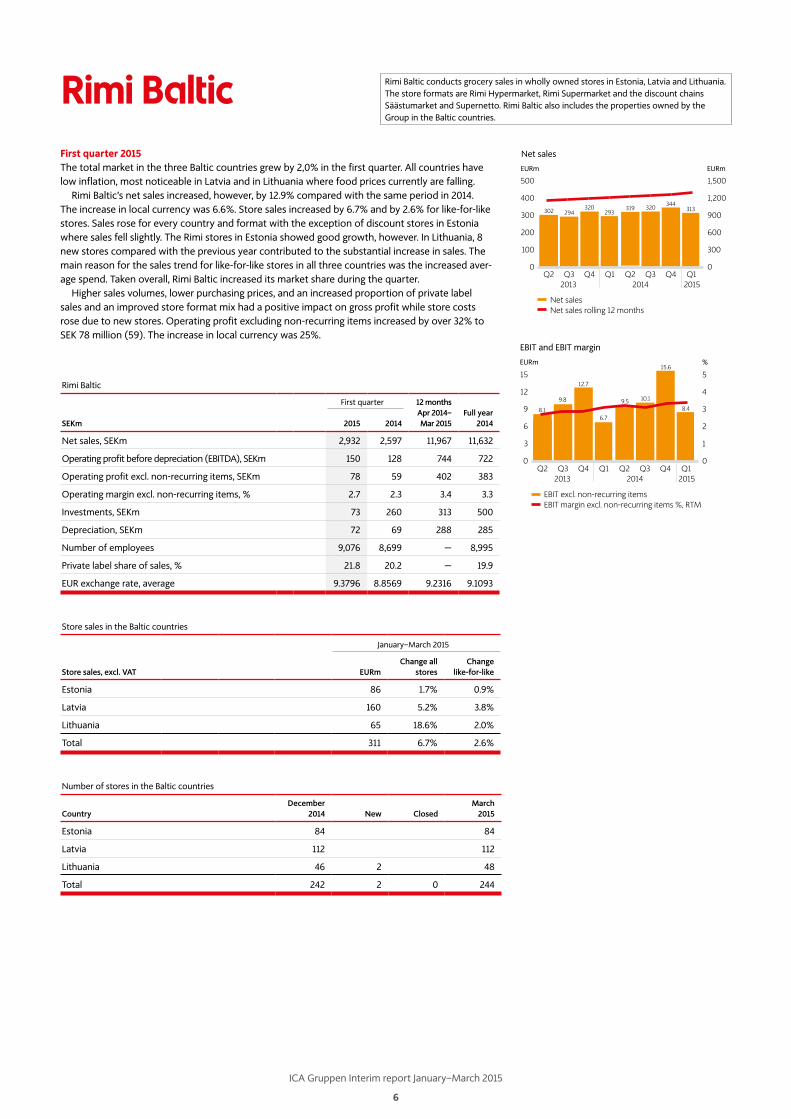
Rimi BalticFirst quarter 2015The total market in the three Baltic countries grew by 2,0% in the first quarter. All countries have low inflation, most noticeable in Latvia and in Lithuania where food prices currently are falling.
Rimi Baltic’s net sales increased, however, by 12.9% compared with the same period in 2014. The increase in local currency was 6.6%. Store sales increased by 6.7% and by 2.6% for like-for-like stores. Sales rose for every country and format with the exception of discount stores in Estonia where sales fell slightly. The Rimi stores in Estonia showed good growth, however. In Lithuania, 8 new stores compared with the previous year contributed to the substantial increase in sales. The main reason for the sales trend for like-for-like stores in all three countries was the increased aver-age spend. Taken overall, Rimi Baltic increased its market share during the quarter.
Higher sales volumes, lower purchasing prices, and an increased proportion of private label sales and an improved store format mix had a positive impact on gross profit while store costs rose due to new stores. Operating profit excluding non-recurring items increased by over 32% to SEK 78 million (59). The increase in local currency was 25%.
Rimi Baltic conducts grocery sales in wholly owned stores in Estonia, Latvia and Lithuania. The store formats are Rimi Hypermarket, Rimi Supermarket and the discount chains Säästumarket and Supernetto. Rimi Baltic also includes the properties owned by the Group in the Baltic countries.
Rimi Baltic
First quarter 12 months Apr 2014–Mar 2015
Full year2014SEKm 2015 2014
Net sales, SEKm 2,932 2,597 11,967 11,632
Operating profit before depreciation (EBITDA), SEKm 150 128 744 722
Operating profit excl. non-recurring items, SEKm 78 59 402 383
Operating margin excl. non-recurring items, % 2.7 2.3 3.4 3.3
Investments, SEKm 73 260 313 500
Depreciation, SEKm 72 69 288 285
Number of employees 9,076 8,699 — 8,995
Private label share of sales, % 21.8 20.2 — 19.9
EUR exchange rate, average 9.3796 8.8569 9.2316 9.1093
Number of stores in the Baltic countries
CountryDecember
2014 New ClosedMarch
2015
Estonia 84 84
Latvia 112 112
Lithuania 46 2 48
Total 242 2 0 244
Store sales in the Baltic countries
January–March 2015
Store sales, excl. VAT EURmChange all
storesChange
like-for-like
Estonia 86 1.7% 0.9%
Latvia 160 5.2% 3.8%
Lithuania 65 18.6% 2.0%
Total 311 6.7% 2.6%
0
15
12
9
6
3
8.1
9.8
12.7
6.7
9.5 10.1
15.6EURm
1
2
3
4
5
%
EBIT and EBIT margin
EBIT excl. non-recurring items
Q3Q2 Q4 Q1 Q2 Q3 Q4 Q1
EBIT margin excl. non-recurring items %, RTM
0
8.4
201520142013
0
100
200
300
500
400
302 294320
293319 320 344
EURm
300
600
900
1,200
1,500
EURm
Net sales
Net sales
Q3Q2 Q4 Q1 Q2 Q3 Q4 Q1
Net sales rolling 12 months
0
201520142013
313
ICA Gruppen Interim report January–March 2015
7
Apotek HjärtatFirst quarter 2015Apotek Hjärtat has been part of ICA Gruppen since 15 January. Comparative figures below relate to Cura pharmacies. Cura is included in the pharmacy segment for the entire quarter.
ICA’s pharmacies had net sales which amounted to SEK 2,783 million (469). Operating profit excluding non-recurring items was SEK 25 million (–7). Operating profit includes a total of SEK 53 million for acquisition-related and integration costs. For the full year 2015 acquisition-related and integration costs are expected to amount to approximately SEK 200 million.
The ongoing integration work is proceeding according to plan. A new organisation and man-agement are in place and the name of the pharmacy operations will be Apotek Hjärtat. Reprofiling of the Cura pharmacies will start before the summer and be completed before the end of the year.
The earlier assessment that the acquisition will realise net annual synergies of approximately SEK 70 million from 2016 and SEK 80 million from 2019 remains unchanged. Insignificant synergy effects were realised in the first quarter.
Pharmacies
First quarter 12 months Apr 2014–Mar 2015
Full year2014SEKm 2015 2014
Net sales, SEKmOf which:
2,783 469 4,406 2,092
– Prescription drugs 2,022 282 3,000 1,260
– OTC drugs 340 107 704 471
– Other products and services 421 80 702 361
Operating profit before depreciation (EBITDA), SEKm 66 3 121 58
Operating profit excl. non-recurring items, SEKm 25 –7 58 21
Operating margin excl. non-recurring items, % 1.1 –1.5 1.3 1.0
Investments, SEKm 12 10 32 30
Depreciation, SEKm 36 10 63 37
Number of employees 2,837 599 — 653
Private label share of other products, % 14.8 6.7 — 7.2
ICA Gruppen’s acquisition of Apotek Hjärtat AB was completed in January 2015. Previously (since 2010) ICA conducted pharmacy operations through Cura pharmacies. As a result of the acquisition ICA Gruppen became the second-largest player in the Swedish pharmacy market with approximately 380 pharmacies.
Number of pharmacies
December 2014 Acquired New Closed
March 2015
Pharmacies 67 307 4 0 378
ICA Gruppen Interim report January–March 2015
8
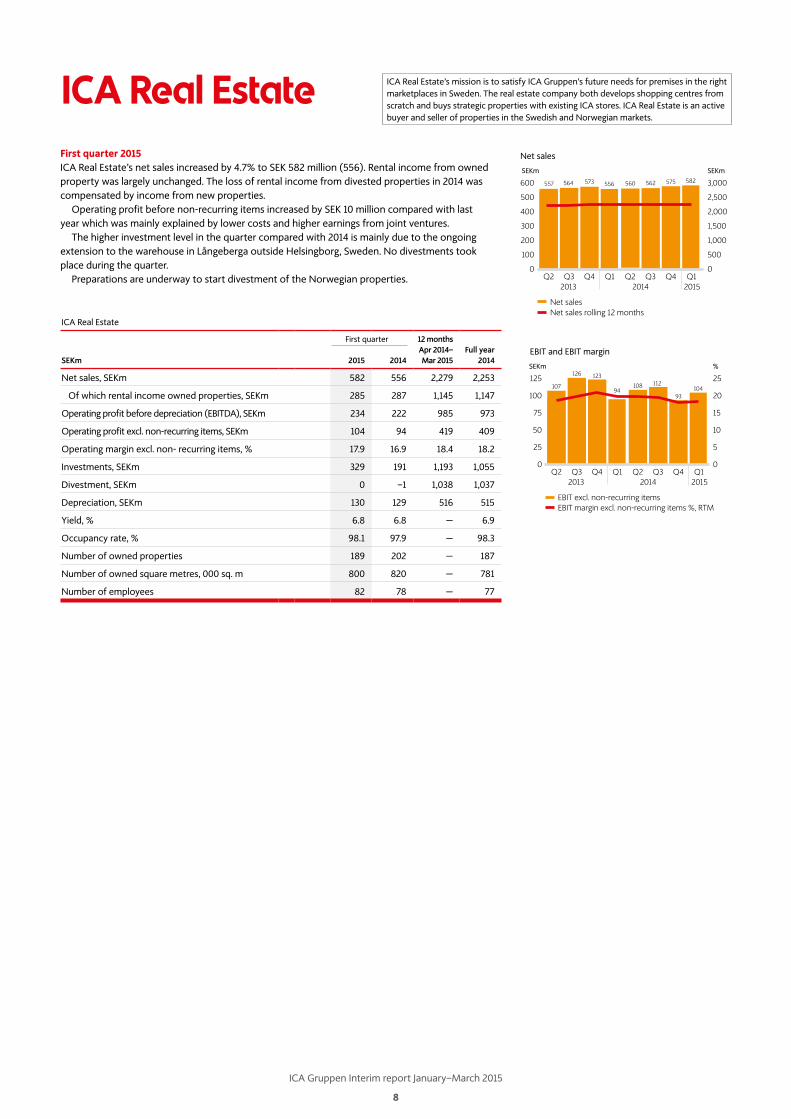
ICA Real EstateFirst quarter 2015ICA Real Estate’s net sales increased by 4.7% to SEK 582 million (556). Rental income from owned property was largely unchanged. The loss of rental income from divested properties in 2014 was compensated by income from new properties.
Operating profit before non-recurring items increased by SEK 10 million compared with last year which was mainly explained by lower costs and higher earnings from joint ventures.
The higher investment level in the quarter compared with 2014 is mainly due to the ongoing extension to the warehouse in Långeberga outside Helsingborg, Sweden. No divestments took place during the quarter.
Preparations are underway to start divestment of the Norwegian properties.
ICA Real Estate
First quarter 12 months Apr 2014–Mar 2015
Full year2014SEKm 2015 2014
Net sales, SEKm 582 556 2,279 2,253
Of which rental income owned properties, SEKm 285 287 1,145 1,147
Operating profit before depreciation (EBITDA), SEKm 234 222 985 973
Operating profit excl. non-recurring items, SEKm 104 94 419 409
Operating margin excl. non- recurring items, % 17.9 16.9 18.4 18.2
Investments, SEKm 329 191 1,193 1,055
Divestment, SEKm 0 –1 1,038 1,037
Depreciation, SEKm 130 129 516 515
Yield, % 6.8 6.8 — 6.9
Occupancy rate, % 98.1 97.9 — 98.3
Number of owned properties 189 202 — 187
Number of owned square metres, 000 sq. m 800 820 — 781
Number of employees 82 78 — 77
ICA Real Estate’s mission is to satisfy ICA Gruppen’s future needs for premises in the right marketplaces in Sweden. The real estate company both develops shopping centres from scratch and buys strategic properties with existing ICA stores. ICA Real Estate is an active buyer and seller of properties in the Swedish and Norwegian markets.
0
25
50
75
100
125107
126 123
108 112
SEKm
EBIT and EBIT margin
104
%
EBIT excl. non-recurring items EBIT margin excl. non-recurring items %, RTM
0
5
15
10
20
25
9394
Q3Q2 Q4 Q1 Q2 Q3 Q4 Q1201520142013
0
100
200
400
300
600
500
557 564 573 556 560 562 575 582
SEKm SEKm
Net sales
Net salesNet sales rolling 12 months
0
500
1,000
2,000
1,500
2,500
3,000
Q3Q2 Q4 Q1 Q2 Q3 Q4 Q1201520142013
ICA Gruppen Interim report January–March 2015
9
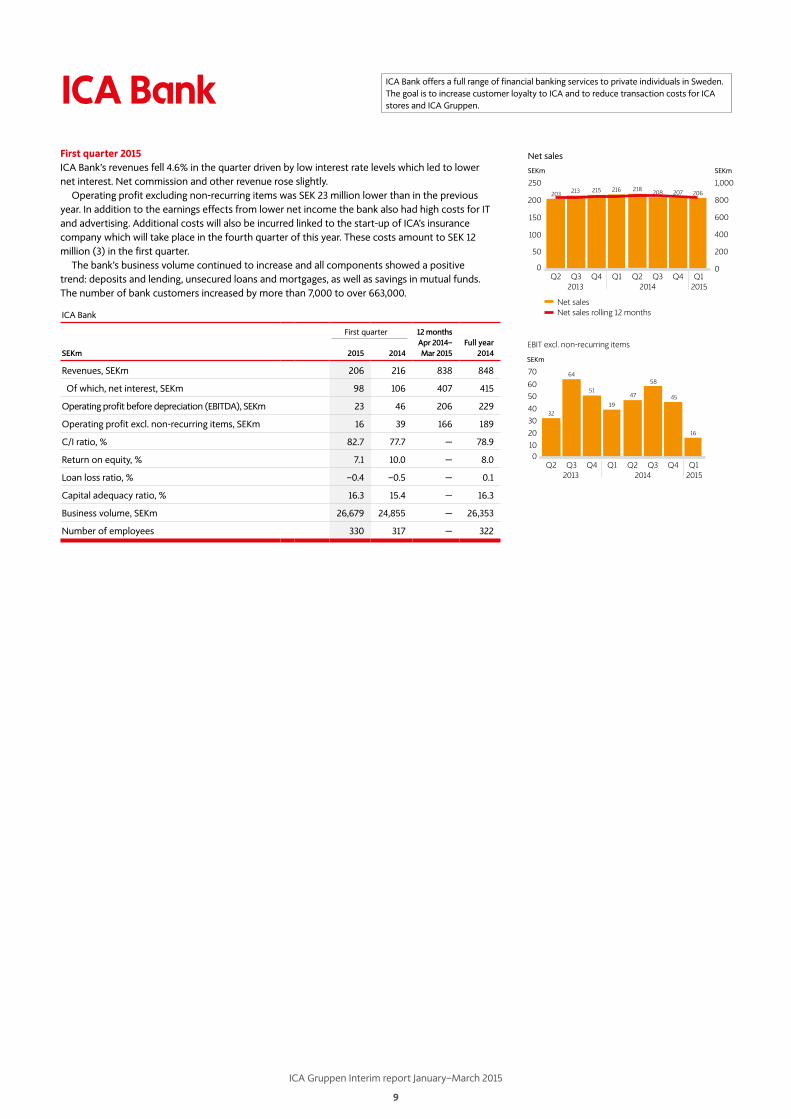
ICA BankFirst quarter 2015ICA Bank’s revenues fell 4.6% in the quarter driven by low interest rate levels which led to lower net interest. Net commission and other revenue rose slightly.
Operating profit excluding non-recurring items was SEK 23 million lower than in the previous year. In addition to the earnings effects from lower net income the bank also had high costs for IT and advertising. Additional costs will also be incurred linked to the start-up of ICA’s insurance company which will take place in the fourth quarter of this year. These costs amount to SEK 12 million (3) in the first quarter.
The bank’s business volume continued to increase and all components showed a positive trend: deposits and lending, unsecured loans and mortgages, as well as savings in mutual funds. The number of bank customers increased by more than 7,000 to over 663,000.
0
50
100
150
200
250203 213 215 216 218 208 207 206
SEKm
200
400
600
1,000
800
SEKm
Net sales
Net salesNet sales rolling 12 months
0Q3Q2 Q4 Q1 Q2 Q3 Q4 Q1
201520142013
ICA Bank offers a full range of financial banking services to private individuals in Sweden. The goal is to increase customer loyalty to ICA and to reduce transaction costs for ICA stores and ICA Gruppen.
100
20
3040
5060
70
32
64
51
39
47
58
45
SEKm
EBIT excl. non-recurring items
16
Q3Q2 Q4 Q1 Q2 Q3 Q4 Q1201520142013
ICA Bank
First quarter 12 months Apr 2014–Mar 2015
Full year2014SEKm 2015 2014
Revenues, SEKm 206 216 838 848
Of which, net interest, SEKm 98 106 407 415
Operating profit before depreciation (EBITDA), SEKm 23 46 206 229
Operating profit excl. non-recurring items, SEKm 16 39 166 189
C/I ratio, % 82.7 77.7 — 78.9
Return on equity, % 7.1 10.0 — 8.0
Loan loss ratio, % –0.4 –0.5 — 0.1
Capital adequacy ratio, % 16.3 15.4 — 16.3
Business volume, SEKm 26,679 24,855 — 26,353
Number of employees 330 317 — 322
ICA Gruppen Interim report January–March 2015
10
Portfolio CompaniesFirst quarter 2015The portfolio companies’ net sales amounted to SEK 521 million (565). Since the first quarter of 2014, Forma publishing and Kjell & Company have been divested. In addition, inkClub has sold Beauty Planet. Adjusted for these changes like-for-like sales increased from SEK 497 million to SEK 517 million or by almost 4%. The increase is attributable to Hemtex and to inkClub excluding Beauty Planet.
Operating profit excluding non-recurring items was SEK 7 million lower and SEK 3 million lower like-for-like. Cervera’s earnings improved while earnings for inkClub and Hemtex were slightly lower than in the previous year.
Divestment of CerveraOn 16 March, ICA Gruppen signed an agreement to sell Cervera. The deal could be completed on 23 April following approval from the Swedish Competition Authority.
The purchase price amounted to SEK 160 million. After a conditional shareholder dividend to ICA Gruppen of SEK 35 million, the remaining consideration was divided between ICA Gruppen and co-owners according to their holding percentage. ICA Gruppen owned 91.4% of Cervera. Taken overall, the sale provided a positive cash flow effect for ICA Gruppen of SEK 135 million and a capital loss of approximately SEK 10 million after deduction for transaction costs.
With effect from the second quarter of 2015, the portfolio companies are Hemtex and inkClub. Hemtex is a home textile retail chain with stores in Sweden, Finland and Estonia. With a total of 157 stores, Hemtex is the Nordic region’s leading home textile chain. inkClub conducts online sales of a range of consumables to customers in 14 European countries.
Portfolio Companies
First quarter 12 months Apr 2014–Mar 2015
Full year2014SEKm 2015 2014
Net sales, SEKm 521 565 2,520 2,564
Operating profit/loss after depreciation (EBITDA), SEKm –30 –27 595 598
Operating profit/loss excl. non-recurring items, SEKm –43 –36 46 53
Operating margin excl. non-recurring items, % –8.3 –6.4 1.8 2.1
Investments, SEKm 17 13 53 49
Depreciation, SEKm 11 8 44 41
Number of employees 952 1,082 — 1,025
Number of stores, incl. franchise stores
FormatDecember
2014 New ClosedMarch
2015
Cervera 70 –1 69
Hemtex 157 157
Total 227 0 –1 226
Store sales
January–March 2015
Store sales excl. VAT SEKmChange all
storesChange
like-for-like
Hemtex 173 –3.3% 0.6%
Cervera 228 6.0% 5.3%
ICA Gruppen Interim report January–March 2015
11
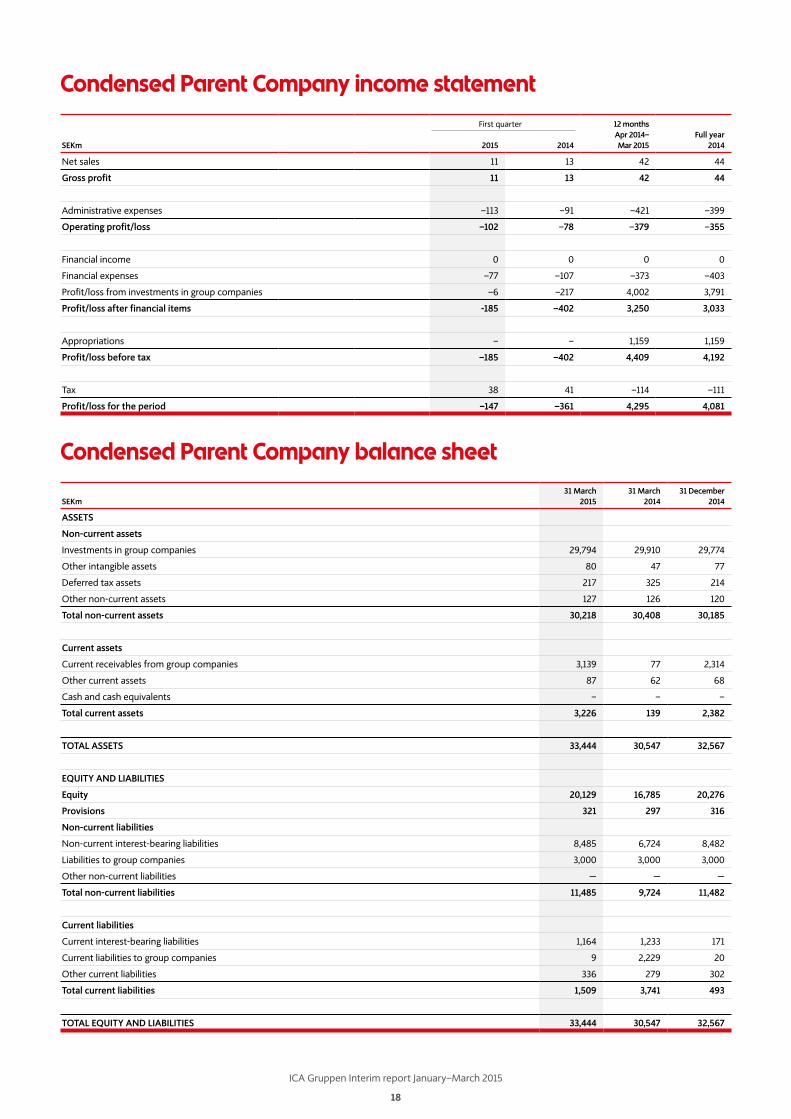
Parent Company performanceThe Parent Company’s net sales amounted to SEK 11 million (13) in the first quarter. Loss before tax amounted to SEK 185 million (–402). The change in earnings can mainly be attributed to impairment of shares in Cervera Intressenter AB in the first quarter of 2014.
Share informationShare capital in ICA Gruppen amounts to SEK 502,866,988 distributed among 201,146,795 shares, each with a quota value of SEK 2.50. At the end of the period the number of C shares amounted to 82,067,892 and the number of ordinary shares amounted to 119,078,903, of which 141,655 ordi-nary shares are held by ICA Gruppen. Ordinary shares and C shares carry the same voting rights but a different dividend entitlement. While ordinary shares have an unlimited dividend entitle-ment, C shares do not carry entitlement to cash profit distribution. All C shares will be converted into ordinary shares on 1 January 2016, which means that thereafter the company will only have one class of share in the form of ordinary shares with dividend entitlement. The total number of shares will remain unchanged after the conversion.
Ownership structure – Largest identified shareholders in ICA Gruppen at 31 March 2015
Number of shares Share of capital and voting rights, %
ICA-handlarnas Förbund 103,163,599 51.3
Industrivärden & Investment AB Promotion 21,125,000 10.5
Leif Jönsson 1,259,601 0.6
Robur Försäkring 1,256,580 0.6
Norges Bank 1,249,475 0.6
SEB Investment Management 1,094,382 0.5
Handelsbanken Funds 914,438 0.4
Handelsbanken Pension Fund 900,000 0.4
Handelsbanken Pension Foundation 850,000 0.4
AMF – Insurance and Funds 799,312 0.4
Ten largest shareholders total: 50,544,495 65.9
Other shareholders 68,534,753 34.1
Total 201,146,795
Source: Euroclear Sweden AB
Seasonal variationsGrocery retail sales are affected by national holidays and when these occur. Christmas and Easter in particular are key holidays for groceries. For a large part of the retail sector the fourth quarter is seasonally the strongest quarter of the year.
Risks and uncertaintiesICA Gruppen works at Group level to systematically identify and manage the risks associated with its operations. The risk management process is an integrated part of the strategy and budget work of each unit. Risks are consolidated and risk management is reported to and monitored by ICA Gruppen’s Executive Management and Board of Directors. The key risk areas are legal risks, market risks, sustainability and product safety risks, brand risks as well as continuity risks.
ICA Gruppen has significant exposure to the Nordic and Baltic grocery sector. Economic down-turns and political decisions are factors which could have a negative impact on the Group’s sales and earnings. ICA Gruppen’s finance policy stipulates how financial risks should be managed and cur-tailed. The policy also provides a framework for the Group’s treasury management. More information about risk management is provided on pages 16–20 of ICA Gruppen’s Annual Report for 2014.
Related-party transactionsNo significant transactions took place between ICA Gruppen and related parties during the period.
Other, Group
ICA Gruppen Interim report January–March 2015
12
Financial statementsConsolidated statement of comprehensive income
First quarter 12 months Apr 2014–Mar 2015
Full year2014SEKm Note 2015 2014
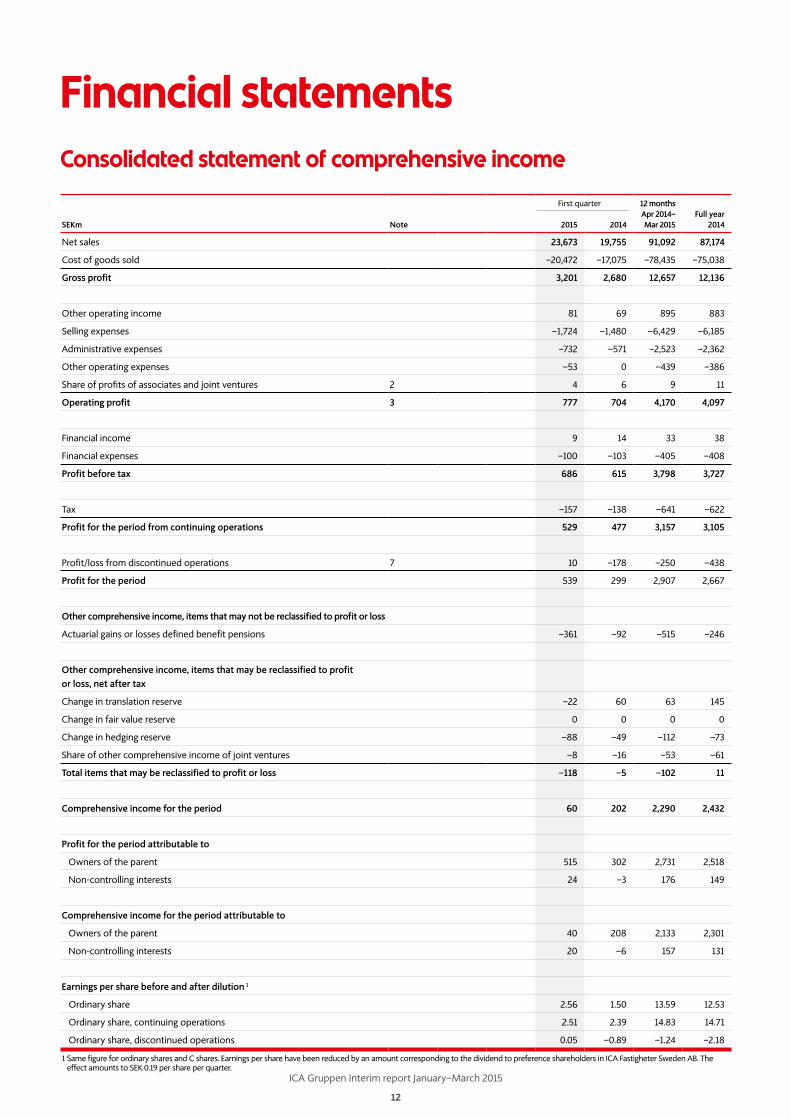
Net sales 23,673 19,755 91,092 87,174
Cost of goods sold –20,472 –17,075 –78,435 –75,038
Gross profit 3,201 2,680 12,657 12,136
Other operating income 81 69 895 883
Selling expenses –1,724 –1,480 –6,429 –6,185
Administrative expenses –732 –571 –2,523 –2,362
Other operating expenses –53 0 –439 –386
Share of profits of associates and joint ventures 2 4 6 9 11
Operating profit 3 777 704 4,170 4,097
Financial income 9 14 33 38
Financial expenses –100 –103 –405 –408
Profit before tax 686 615 3,798 3,727
Tax –157 –138 –641 –622
Profit for the period from continuing operations 529 477 3,157 3,105
Profit/loss from discontinued operations 7 10 –178 –250 –438
Profit for the period 539 299 2,907 2,667
Other comprehensive income, items that may not be reclassified to profit or loss
Actuarial gains or losses defined benefit pensions –361 –92 –515 –246
Other comprehensive income, items that may be reclassified to profit or loss, net after tax
Change in translation reserve –22 60 63 145
Change in fair value reserve 0 0 0 0
Change in hedging reserve –88 –49 –112 –73
Share of other comprehensive income of joint ventures –8 –16 –53 –61
Total items that may be reclassified to profit or loss –118 –5 –102 11
Comprehensive income for the period 60 202 2,290 2,432
Profit for the period attributable to
Owners of the parent 515 302 2,731 2,518
Non-controlling interests 24 –3 176 149
Comprehensive income for the period attributable to
Owners of the parent 40 208 2,133 2,301
Non-controlling interests 20 –6 157 131
Earnings per share before and after dilution 1
Ordinary share 2.56 1.50 13.59 12.53
Ordinary share, continuing operations 2.51 2.39 14.83 14.71
Ordinary share, discontinued operations 0.05 –0.89 –1.24 –2.18
1 Same figure for ordinary shares and C shares. Earnings per share have been reduced by an amount corresponding to the dividend to preference shareholders in ICA Fastigheter Sweden AB. The effect amounts to SEK 0.19 per share per quarter.
ICA Gruppen Interim report January–March 2015
13
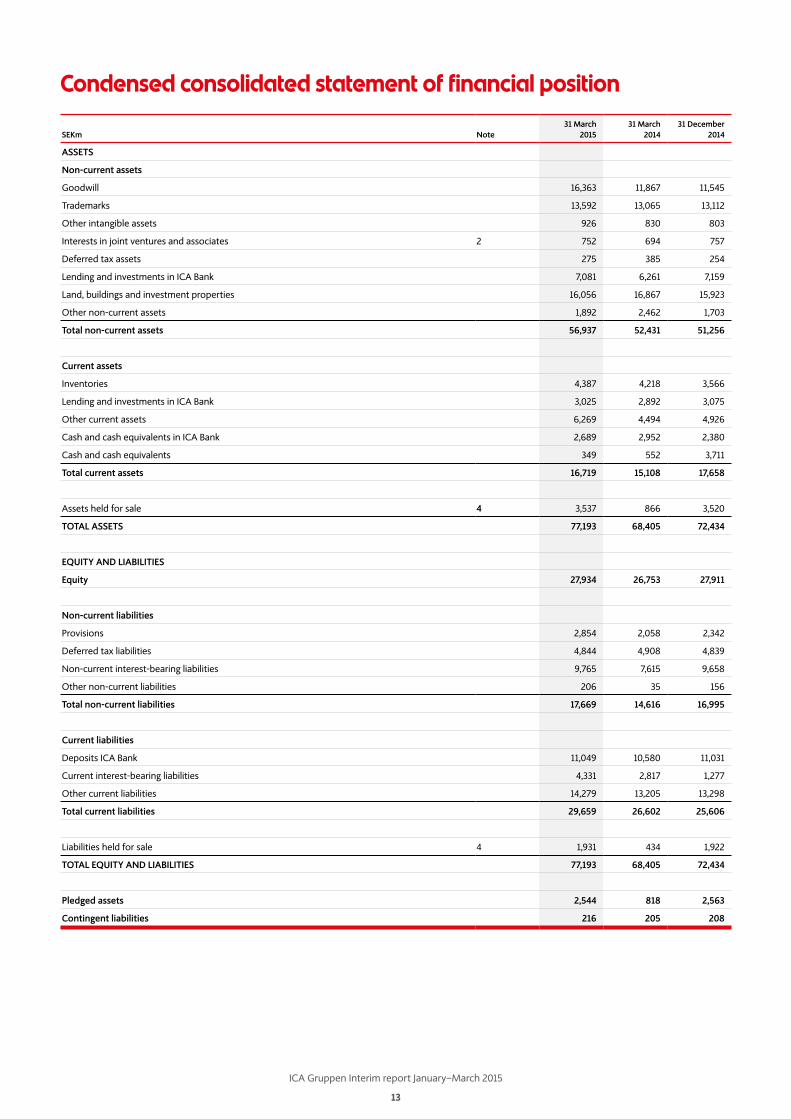
Condensed consolidated statement of financial position
SEKm Note31 March
201531 March
2014 31 December
2014
ASSETS
Non-current assets
Goodwill 16,363 11,867 11,545
Trademarks 13,592 13,065 13,112
Other intangible assets 926 830 803
Interests in joint ventures and associates 2 752 694 757
Deferred tax assets 275 385 254
Lending and investments in ICA Bank 7,081 6,261 7,159
Land, buildings and investment properties 16,056 16,867 15,923
Other non-current assets 1,892 2,462 1,703
Total non-current assets 56,937 52,431 51,256
Current assets
Inventories 4,387 4,218 3,566
Lending and investments in ICA Bank 3,025 2,892 3,075
Other current assets 6,269 4,494 4,926
Cash and cash equivalents in ICA Bank 2,689 2,952 2,380
Cash and cash equivalents 349 552 3,711
Total current assets 16,719 15,108 17,658
Assets held for sale 4 3,537 866 3,520
TOTAL ASSETS 77,193 68,405 72,434
EQUITY AND LIABILITIES
Equity 27,934 26,753 27,911
Non-current liabilities
Provisions 2,854 2,058 2,342
Deferred tax liabilities 4,844 4,908 4,839
Non-current interest-bearing liabilities 9,765 7,615 9,658
Other non-current liabilities 206 35 156
Total non-current liabilities 17,669 14,616 16,995
Current liabilities
Deposits ICA Bank 11,049 10,580 11,031
Current interest-bearing liabilities 4,331 2,817 1,277
Other current liabilities 14,279 13,205 13,298
Total current liabilities 29,659 26,602 25,606
Liabilities held for sale 4 1,931 434 1,922
TOTAL EQUITY AND LIABILITIES 77,193 68,405 72,434
Pledged assets 2,544 818 2,563
Contingent liabilities 216 205 208
ICA Gruppen Interim report January–March 2015
14
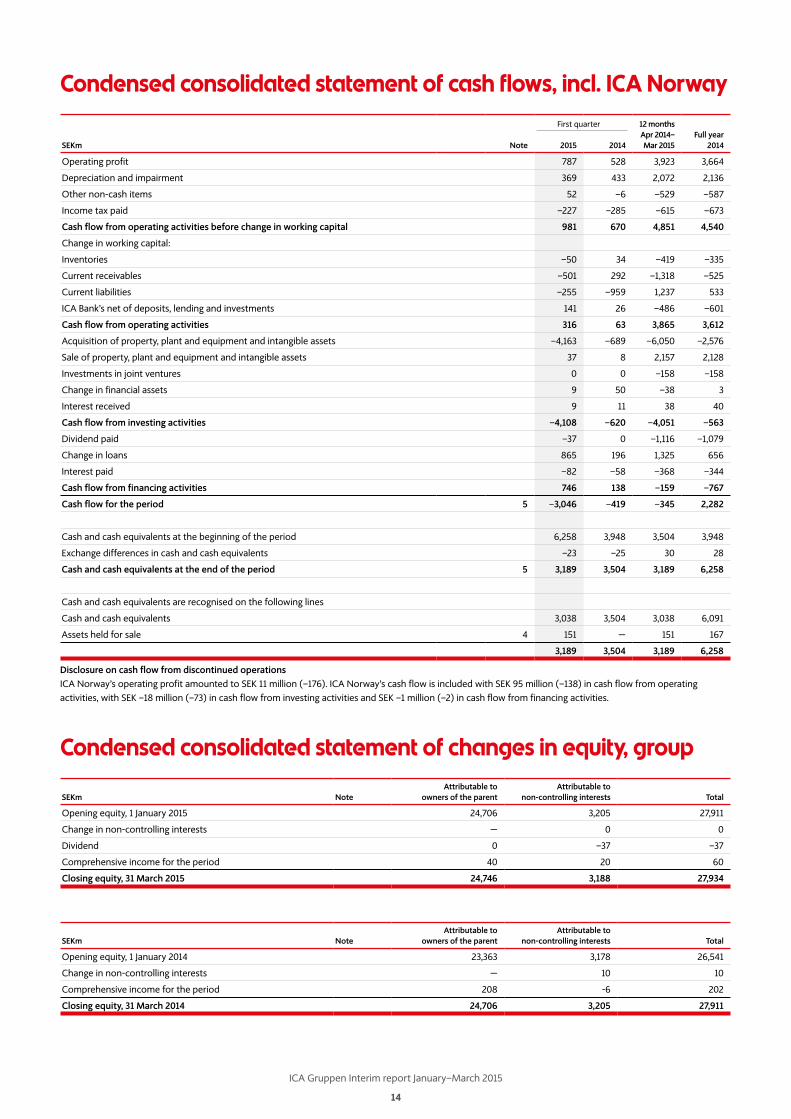
Condensed consolidated statement of cash flows, incl. ICA NorwayFirst quarter 12 months
Apr 2014–Mar 2015
Full year2014SEKm Note 2015 2014
Operating profit 787 528 3,923 3,664
Depreciation and impairment 369 433 2,072 2,136
Other non-cash items 52 –6 –529 –587
Income tax paid –227 –285 –615 –673
Cash flow from operating activities before change in working capital 981 670 4,851 4,540
Change in working capital:
Inventories –50 34 –419 –335
Current receivables –501 292 –1,318 –525
Current liabilities –255 –959 1,237 533
ICA Bank’s net of deposits, lending and investments 141 26 –486 –601
Cash flow from operating activities 316 63 3,865 3,612
Acquisition of property, plant and equipment and intangible assets –4,163 –689 –6,050 –2,576
Sale of property, plant and equipment and intangible assets 37 8 2,157 2,128
Investments in joint ventures 0 0 –158 –158
Change in financial assets 9 50 –38 3
Interest received 9 11 38 40
Cash flow from investing activities –4,108 –620 –4,051 –563
Dividend paid –37 0 –1,116 –1,079
Change in loans 865 196 1,325 656
Interest paid –82 –58 –368 –344
Cash flow from financing activities 746 138 –159 –767
Cash flow for the period 5 –3,046 –419 –345 2,282
Cash and cash equivalents at the beginning of the period 6,258 3,948 3,504 3,948
Exchange differences in cash and cash equivalents –23 –25 30 28
Cash and cash equivalents at the end of the period 5 3,189 3,504 3,189 6,258
Cash and cash equivalents are recognised on the following lines
Cash and cash equivalents 3,038 3,504 3,038 6,091
Assets held for sale 4 151 — 151 167
3,189 3,504 3,189 6,258
Disclosure on cash flow from discontinued operations ICA Norway’s operating profit amounted to SEK 11 million (–176). ICA Norway’s cash flow is included with SEK 95 million (–138) in cash flow from operating activities, with SEK –18 million (–73) in cash flow from investing activities and SEK –1 million (–2) in cash flow from financing activities.
Condensed consolidated statement of changes in equity, group
SEKm NoteAttributable to
owners of the parentAttributable to
non-controlling interests Total
Opening equity, 1 January 2015 24,706 3,205 27,911
Change in non-controlling interests — 0 0
Dividend 0 –37 –37
Comprehensive income for the period 40 20 60
Closing equity, 31 March 2015 24,746 3,188 27,934
SEKm NoteAttributable to
owners of the parentAttributable to
non-controlling interests Total
Opening equity, 1 January 2014 23,363 3,178 26,541
Change in non-controlling interests — 10 10
Comprehensive income for the period 208 -6 202
Closing equity, 31 March 2014 24,706 3,205 27,911
ICA Gruppen Interim report January–March 2015
15
Supplementary disclosures – GroupNOTE 1, ACCOUNTING PRINCIPLESThis interim report is prepared according to IAS 34. The accounting principles and calculation methods are the same as those applied in the 2014 Annual Report. For 2015 only a few amendments have been published from IASB and IFRIC. These amendments have not had any material impact on ICA Gruppen’s financial statements.
New standards from IASB not endorsed by the EU with relevance for ICA Gruppen:
IFRS 15 Revenues from Contracts with Customers was published in May 2014 and comes into force on 1 January 2017. IASB proposes that the introduction is delayed one year until 1 January 2018. In a preliminary analysis, ICA Gruppen’s assessment is that the effect on the financial statements will be limited when it is introduced.
IFRS 9 Financial instruments was published in 2014. It comes into force for the financial year that starts on 1 January 2018. It has not yet been possible to assess the effects of its introduction, but the standard of relevance, among other things, for recognition of credit losses, and therefore in particular for ICA Bank, as well as for hedge accounting.
The preparation of the financial statements in accordance with IFRS requires management to make assessments, estimates and assumptions that affect the application of the accounting principles and the carrying amounts in the income statement and the balance sheet. Estimates and assumptions are based on historical experience and a number of factors that are considered reasonable based on the circumstances. The results of these estimates and assumptions are used to assess the carrying amounts of assets and liabilities that are not readily apparent from other sources. Actual results may differ from the estimates and assessments.
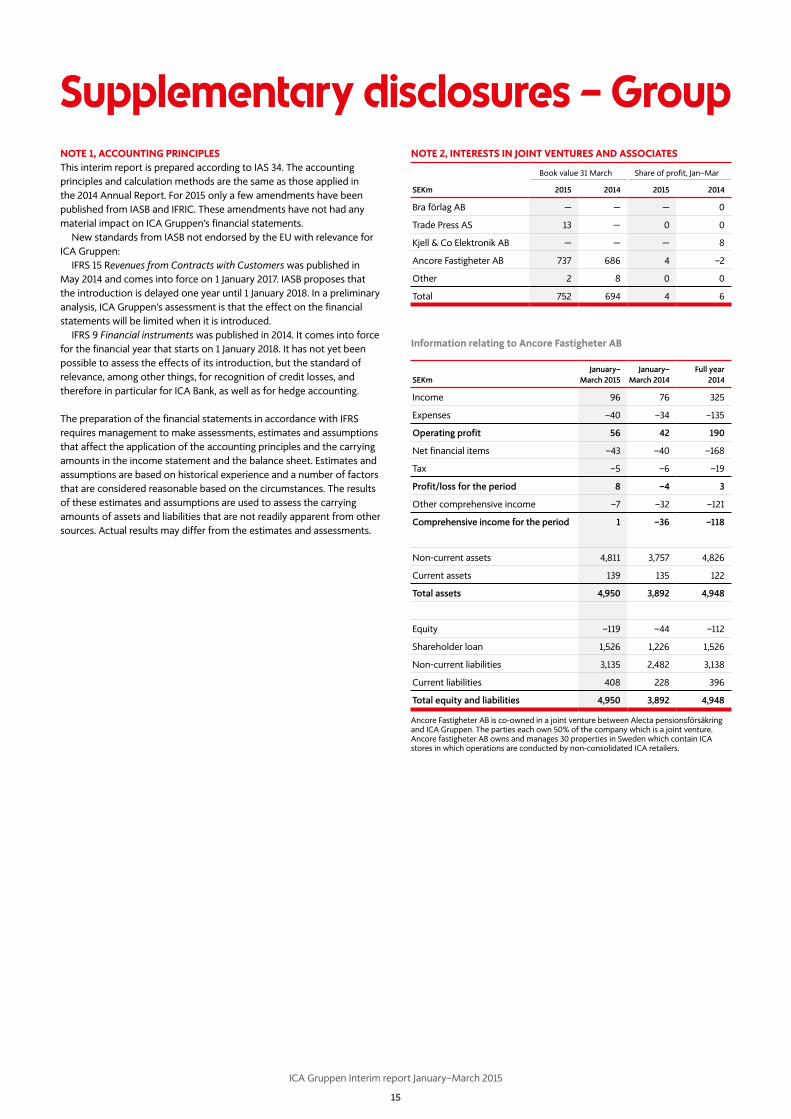
NOTE 2, INTERESTS IN JOINT VENTURES AND ASSOCIATES
Book value 31 March Share of profit, Jan–Mar
SEKm 2015 2014 2015 2014
Bra förlag AB — — — 0
Trade Press AS 13 — 0 0
Kjell & Co Elektronik AB — — — 8
Ancore Fastigheter AB 737 686 4 –2
Other 2 8 0 0
Total 752 694 4 6
Information relating to Ancore Fastigheter AB
SEKmJanuary–
March 2015January–
March 2014Full year
2014
Income 96 76 325
Expenses –40 –34 –135
Operating profit 56 42 190
Net financial items –43 –40 –168
Tax –5 –6 –19
Profit/loss for the period 8 –4 3
Other comprehensive income –7 –32 –121
Comprehensive income for the period 1 –36 –118
Non-current assets 4,811 3,757 4,826
Current assets 139 135 122
Total assets 4,950 3,892 4,948
Equity –119 –44 –112
Shareholder loan 1,526 1,226 1,526
Non-current liabilities 3,135 2,482 3,138
Current liabilities 408 228 396
Total equity and liabilities 4,950 3,892 4,948
Ancore Fastigheter AB is co-owned in a joint venture between Alecta pensionsförsäkring and ICA Gruppen. The parties each own 50% of the company which is a joint venture. Ancore fastigheter AB owns and manages 30 properties in Sweden which contain ICA stores in which operations are conducted by non-consolidated ICA retailers.
ICA Gruppen Interim report January–March 2015
16
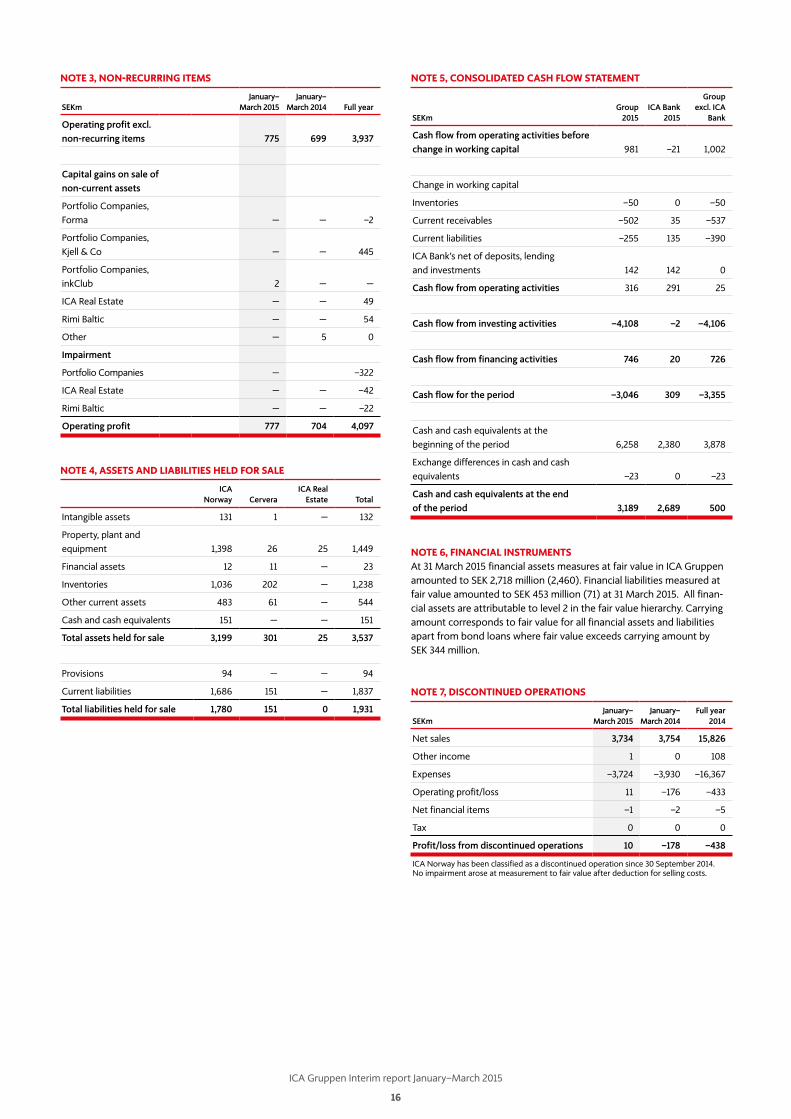
NOTE 3, NON-RECURRING ITEMS
SEKmJanuary–
March 2015January–
March 2014 Full year
Operating profit excl. non-recurring items 775 699 3,937
Capital gains on sale of non-current assets
Portfolio Companies, Forma — — –2
Portfolio Companies, Kjell & Co — — 445
Portfolio Companies, inkClub 2 — —
ICA Real Estate — — 49
Rimi Baltic — — 54
Other — 5 0
Impairment
Portfolio Companies — –322
ICA Real Estate — — –42
Rimi Baltic — — –22
Operating profit 777 704 4,097
NOTE 4, ASSETS AND LIABILITIES HELD FOR SALE
ICA Norway Cervera
ICA Real Estate Total
Intangible assets 131 1 — 132
Property, plant and equipment 1,398 26 25 1,449
Financial assets 12 11 — 23
Inventories 1,036 202 — 1,238
Other current assets 483 61 — 544
Cash and cash equivalents 151 — — 151
Total assets held for sale 3,199 301 25 3,537
Provisions 94 — — 94
Current liabilities 1,686 151 — 1,837
Total liabilities held for sale 1,780 151 0 1,931
NOTE 5, CONSOLIDATED CASH FLOW STATEMENT
SEKmGroup
2015ICA Bank
2015
Group excl. ICA
Bank
Cash flow from operating activities before change in working capital 981 –21 1,002
Change in working capital
Inventories –50 0 –50
Current receivables –502 35 –537
Current liabilities –255 135 –390
ICA Bank’s net of deposits, lending and investments 142 142 0
Cash flow from operating activities 316 291 25
Cash flow from investing activities –4,108 –2 –4,106
Cash flow from financing activities 746 20 726
Cash flow for the period –3,046 309 –3,355
Cash and cash equivalents at the beginning of the period 6,258 2,380 3,878
Exchange differences in cash and cash equivalents –23 0 –23
Cash and cash equivalents at the end of the period 3,189 2,689 500
NOTE 6, FINANCIAL INSTRUMENTSAt 31 March 2015 financial assets measures at fair value in ICA Gruppen amounted to SEK 2,718 million (2,460). Financial liabilities measured at fair value amounted to SEK 453 million (71) at 31 March 2015. All finan-cial assets are attributable to level 2 in the fair value hierarchy. Carrying amount corresponds to fair value for all financial assets and liabilities apart from bond loans where fair value exceeds carrying amount by SEK 344 million.
NOTE 7, DISCONTINUED OPERATIONS
SEKmJanuary–
March 2015January–
March 2014Full year
2014
Net sales 3,734 3,754 15,826
Other income 1 0 108
Expenses –3,724 –3,930 –16,367
Operating profit/loss 11 –176 –433
Net financial items –1 –2 –5
Tax 0 0 0
Profit/loss from discontinued operations 10 –178 –438
ICA Norway has been classified as a discontinued operation since 30 September 2014. No impairment arose at measurement to fair value after deduction for selling costs.
ICA Gruppen Interim report January–March 2015
17
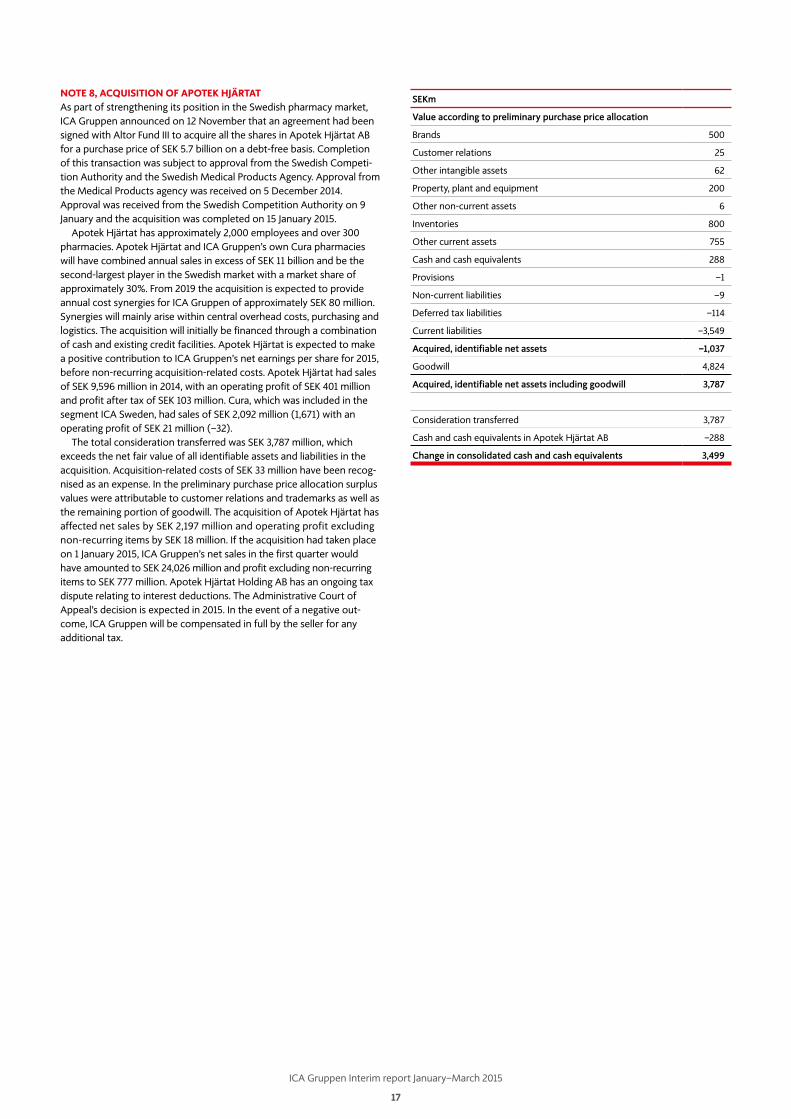
NOTE 8, ACQUISITION OF APOTEK HJÄRTATAs part of strengthening its position in the Swedish pharmacy market, ICA Gruppen announced on 12 November that an agreement had been signed with Altor Fund III to acquire all the shares in Apotek Hjärtat AB for a purchase price of SEK 5.7 billion on a debt-free basis. Completion of this transaction was subject to approval from the Swedish Competi-tion Authority and the Swedish Medical Products Agency. Approval from the Medical Products agency was received on 5 December 2014. Approval was received from the Swedish Competition Authority on 9 January and the acquisition was completed on 15 January 2015.
Apotek Hjärtat has approximately 2,000 employees and over 300 pharmacies. Apotek Hjärtat and ICA Gruppen’s own Cura pharmacies will have combined annual sales in excess of SEK 11 billion and be the second-largest player in the Swedish market with a market share of approximately 30%. From 2019 the acquisition is expected to provide annual cost synergies for ICA Gruppen of approximately SEK 80 million. Synergies will mainly arise within central overhead costs, purchasing and logistics. The acquisition will initially be financed through a combination of cash and existing credit facilities. Apotek Hjärtat is expected to make a positive contribution to ICA Gruppen’s net earnings per share for 2015, before non-recurring acquisition-related costs. Apotek Hjärtat had sales of SEK 9,596 million in 2014, with an operating profit of SEK 401 million and profit after tax of SEK 103 million. Cura, which was included in the segment ICA Sweden, had sales of SEK 2,092 million (1,671) with an operating profit of SEK 21 million (–32).
The total consideration transferred was SEK 3,787 million, which exceeds the net fair value of all identifiable assets and liabilities in the acquisition. Acquisition-related costs of SEK 33 million have been recog-nised as an expense. In the preliminary purchase price allocation surplus values were attributable to customer relations and trademarks as well as the remaining portion of goodwill. The acquisition of Apotek Hjärtat has affected net sales by SEK 2,197 million and operating profit excluding non- recurring items by SEK 18 million. If the acquisition had taken place on 1 January 2015, ICA Gruppen’s net sales in the first quarter would have amounted to SEK 24,026 million and profit excluding non-recurring items to SEK 777 million. Apotek Hjärtat Holding AB has an ongoing tax dispute relating to interest deductions. The Administrative Court of Appeal’s decision is expected in 2015. In the event of a negative out-come, ICA Gruppen will be compensated in full by the seller for any additional tax.
SEKm
Value according to preliminary purchase price allocation
Brands 500
Customer relations 25
Other intangible assets 62
Property, plant and equipment 200
Other non-current assets 6
Inventories 800
Other current assets 755
Cash and cash equivalents 288
Provisions –1
Non-current liabilities –9
Deferred tax liabilities –114
Current liabilities –3,549
Acquired, identifiable net assets –1,037
Goodwill 4,824
Acquired, identifiable net assets including goodwill 3,787
Consideration transferred 3,787
Cash and cash equivalents in Apotek Hjärtat AB –288
Change in consolidated cash and cash equivalents 3,499
ICA Gruppen Interim report January–March 2015
18
Condensed Parent Company income statement
Condensed Parent Company balance sheet
First quarter 12 months Apr 2014–Mar 2015
Full year2014SEKm 2015 2014
Net sales 11 13 42 44
Gross profit 11 13 42 44
Administrative expenses –113 –91 –421 –399
Operating profit/loss –102 –78 –379 –355
Financial income 0 0 0 0
Financial expenses –77 –107 –373 –403
Profit/loss from investments in group companies –6 –217 4,002 3,791
Profit/loss after financial items -185 –402 3,250 3,033
Appropriations – – 1,159 1,159
Profit/loss before tax –185 –402 4,409 4,192
Tax 38 41 –114 –111
Profit/loss for the period –147 –361 4,295 4,081
SEKm31 March
201531 March
201431 December
2014
ASSETS
Non-current assets
Investments in group companies 29,794 29,910 29,774
Other intangible assets 80 47 77
Deferred tax assets 217 325 214
Other non-current assets 127 126 120
Total non-current assets 30,218 30,408 30,185
Current assets
Current receivables from group companies 3,139 77 2,314
Other current assets 87 62 68
Cash and cash equivalents – – –
Total current assets 3,226 139 2,382
TOTAL ASSETS 33,444 30,547 32,567
EQUITY AND LIABILITIES
Equity 20,129 16,785 20,276
Provisions 321 297 316
Non-current liabilities
Non-current interest-bearing liabilities 8,485 6,724 8,482
Liabilities to group companies 3,000 3,000 3,000
Other non-current liabilities — — —
Total non-current liabilities 11,485 9,724 11,482
Current liabilities
Current interest-bearing liabilities 1,164 1,233 171
Current liabilities to group companies 9 2,229 20
Other current liabilities 336 279 302
Total current liabilities 1,509 3,741 493
TOTAL EQUITY AND LIABILITIES 33,444 30,547 32,567
ICA Gruppen Interim report January–March 2015
19
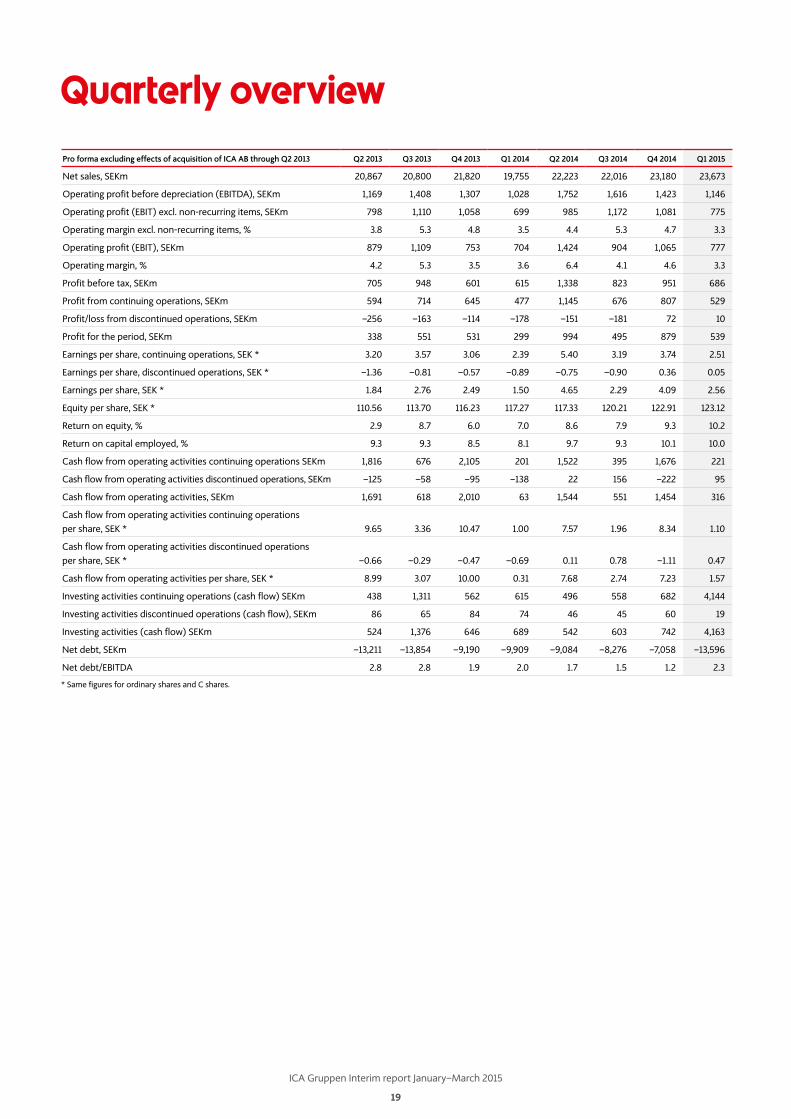
Quarterly overviewPro forma excluding effects of acquisition of ICA AB through Q2 2013 Q2 2013 Q3 2013 Q4 2013 Q1 2014 Q2 2014 Q3 2014 Q4 2014 Q1 2015
Net sales, SEKm 20,867 20,800 21,820 19,755 22,223 22,016 23,180 23,673
Operating profit before depreciation (EBITDA), SEKm 1,169 1,408 1,307 1,028 1,752 1,616 1,423 1,146
Operating profit (EBIT) excl. non-recurring items, SEKm 798 1,110 1,058 699 985 1,172 1,081 775
Operating margin excl. non-recurring items, % 3.8 5.3 4.8 3.5 4.4 5.3 4.7 3.3
Operating profit (EBIT), SEKm 879 1,109 753 704 1,424 904 1,065 777
Operating margin, % 4.2 5.3 3.5 3.6 6.4 4.1 4.6 3.3
Profit before tax, SEKm 705 948 601 615 1,338 823 951 686
Profit from continuing operations, SEKm 594 714 645 477 1,145 676 807 529
Profit/loss from discontinued operations, SEKm –256 –163 –114 –178 –151 –181 72 10
Profit for the period, SEKm 338 551 531 299 994 495 879 539
Earnings per share, continuing operations, SEK * 3.20 3.57 3.06 2.39 5.40 3.19 3.74 2.51
Earnings per share, discontinued operations, SEK * –1.36 –0.81 –0.57 –0.89 –0.75 –0.90 0.36 0.05
Earnings per share, SEK * 1.84 2.76 2.49 1.50 4.65 2.29 4.09 2.56
Equity per share, SEK * 110.56 113.70 116.23 117.27 117.33 120.21 122.91 123.12
Return on equity, % 2.9 8.7 6.0 7.0 8.6 7.9 9.3 10.2
Return on capital employed, % 9.3 9.3 8.5 8.1 9.7 9.3 10.1 10.0
Cash flow from operating activities continuing operations SEKm 1,816 676 2,105 201 1,522 395 1,676 221
Cash flow from operating activities discontinued operations, SEKm –125 –58 –95 –138 22 156 –222 95
Cash flow from operating activities, SEKm 1,691 618 2,010 63 1,544 551 1,454 316
Cash flow from operating activities continuing operations per share, SEK * 9.65 3.36 10.47 1.00 7.57 1.96 8.34 1.10
Cash flow from operating activities discontinued operations per share, SEK * –0.66 –0.29 –0.47 –0.69 0.11 0.78 –1.11 0.47
Cash flow from operating activities per share, SEK * 8.99 3.07 10.00 0.31 7.68 2.74 7.23 1.57
Investing activities continuing operations (cash flow) SEKm 438 1,311 562 615 496 558 682 4,144
Investing activities discontinued operations (cash flow), SEKm 86 65 84 74 46 45 60 19
Investing activities (cash flow) SEKm 524 1,376 646 689 542 603 742 4,163
Net debt, SEKm –13,211 –13,854 –9,190 –9,909 –9,084 –8,276 –7,058 –13,596
Net debt/EBITDA 2.8 2.8 1.9 2.0 1.7 1.5 1.2 2.3
* Same figures for ordinary shares and C shares.
ICA Gruppen Interim report January–March 2015
20
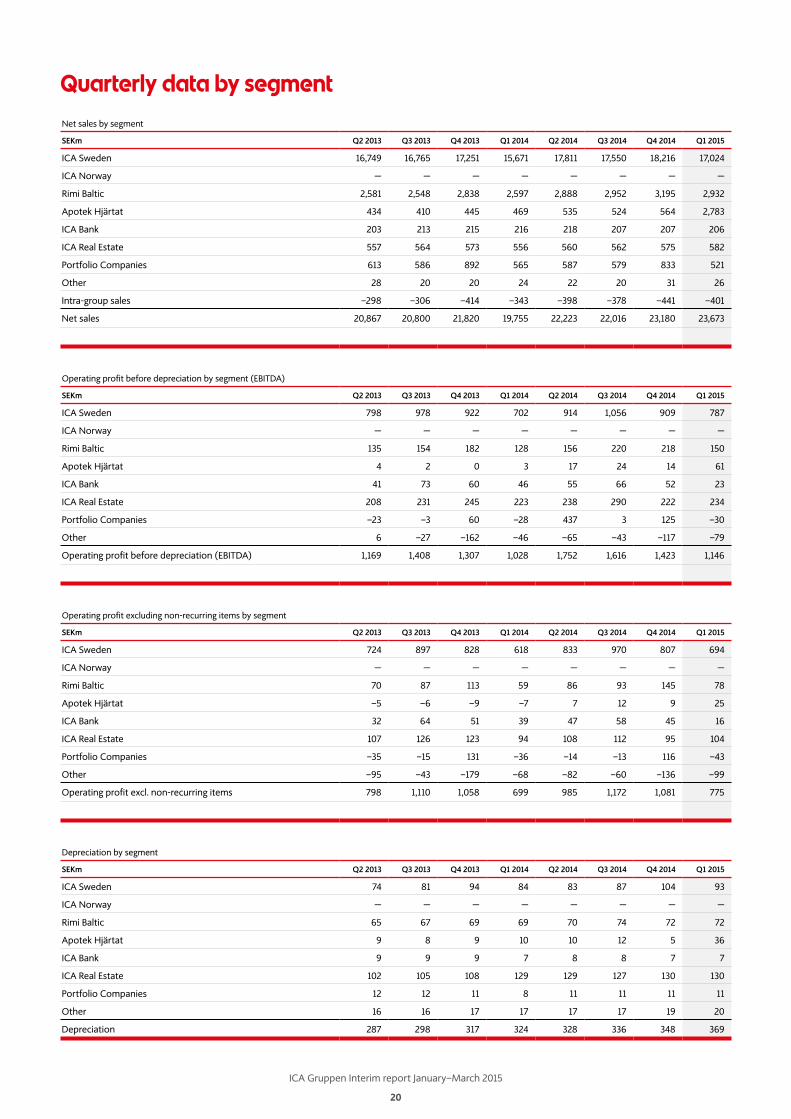
Quarterly data by segment
Operating profit excluding non-recurring items by segment
SEKm Q2 2013 Q3 2013 Q4 2013 Q1 2014 Q2 2014 Q3 2014 Q4 2014 Q1 2015
ICA Sweden 724 897 828 618 833 970 807 694
ICA Norway — — — — — — — —
Rimi Baltic 70 87 113 59 86 93 145 78
Apotek Hjärtat –5 –6 –9 –7 7 12 9 25
ICA Bank 32 64 51 39 47 58 45 16
ICA Real Estate 107 126 123 94 108 112 95 104
Portfolio Companies –35 –15 131 –36 –14 –13 116 –43
Other –95 –43 –179 –68 –82 –60 –136 –99
Operating profit excl. non-recurring items 798 1,110 1,058 699 985 1,172 1,081 775
Depreciation by segment
SEKm Q2 2013 Q3 2013 Q4 2013 Q1 2014 Q2 2014 Q3 2014 Q4 2014 Q1 2015
ICA Sweden 74 81 94 84 83 87 104 93
ICA Norway — — — — — — — —
Rimi Baltic 65 67 69 69 70 74 72 72
Apotek Hjärtat 9 8 9 10 10 12 5 36
ICA Bank 9 9 9 7 8 8 7 7
ICA Real Estate 102 105 108 129 129 127 130 130
Portfolio Companies 12 12 11 8 11 11 11 11
Other 16 16 17 17 17 17 19 20
Depreciation 287 298 317 324 328 336 348 369
Net sales by segment
SEKm Q2 2013 Q3 2013 Q4 2013 Q1 2014 Q2 2014 Q3 2014 Q4 2014 Q1 2015
ICA Sweden 16,749 16,765 17,251 15,671 17,811 17,550 18,216 17,024
ICA Norway — — — — — — — —
Rimi Baltic 2,581 2,548 2,838 2,597 2,888 2,952 3,195 2,932
Apotek Hjärtat 434 410 445 469 535 524 564 2,783
ICA Bank 203 213 215 216 218 207 207 206
ICA Real Estate 557 564 573 556 560 562 575 582
Portfolio Companies 613 586 892 565 587 579 833 521
Other 28 20 20 24 22 20 31 26
Intra-group sales –298 –306 –414 –343 –398 –378 –441 –401
Net sales 20,867 20,800 21,820 19,755 22,223 22,016 23,180 23,673
Operating profit before depreciation by segment (EBITDA)
SEKm Q2 2013 Q3 2013 Q4 2013 Q1 2014 Q2 2014 Q3 2014 Q4 2014 Q1 2015
ICA Sweden 798 978 922 702 914 1,056 909 787
ICA Norway — — — — — — — —
Rimi Baltic 135 154 182 128 156 220 218 150
Apotek Hjärtat 4 2 0 3 17 24 14 61
ICA Bank 41 73 60 46 55 66 52 23
ICA Real Estate 208 231 245 223 238 290 222 234
Portfolio Companies –23 –3 60 –28 437 3 125 –30
Other 6 –27 –162 –46 –65 –43 –117 –79
Operating profit before depreciation (EBITDA) 1,169 1,408 1,307 1,028 1,752 1,616 1,423 1,146
ICA Gruppen Interim report January–March 2015
21
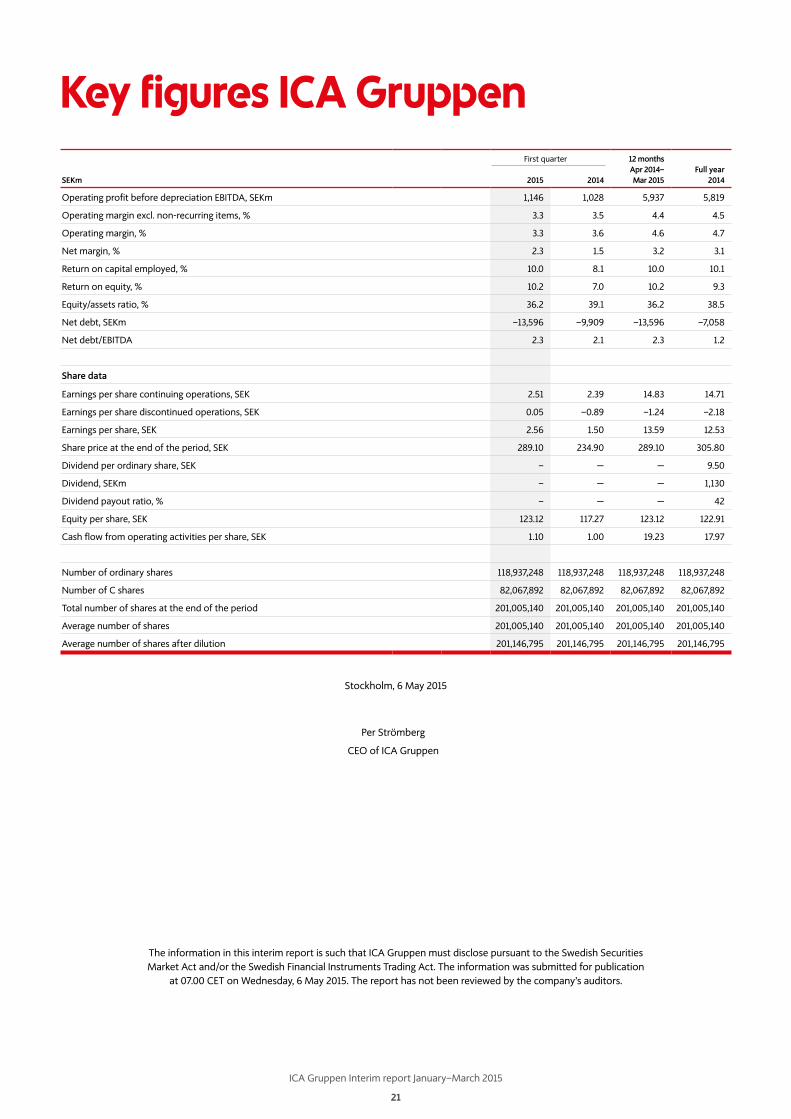
Key figures ICA Gruppen
Stockholm, 6 May 2015
Per Strömberg
CEO of ICA Gruppen
The information in this interim report is such that ICA Gruppen must disclose pursuant to the Swedish Securities Market Act and/or the Swedish Financial Instruments Trading Act. The information was submitted for publication
at 07.00 CET on Wednesday, 6 May 2015. The report has not been reviewed by the company’s auditors.
First quarter 12 months Apr 2014–Mar 2015
Full year2014SEKm 2015 2014
Operating profit before depreciation EBITDA, SEKm 1,146 1,028 5,937 5,819
Operating margin excl. non-recurring items, % 3.3 3.5 4.4 4.5
Operating margin, % 3.3 3.6 4.6 4.7
Net margin, % 2.3 1.5 3.2 3.1
Return on capital employed, % 10.0 8.1 10.0 10.1
Return on equity, % 10.2 7.0 10.2 9.3
Equity/assets ratio, % 36.2 39.1 36.2 38.5
Net debt, SEKm –13,596 –9,909 –13,596 –7,058
Net debt/EBITDA 2.3 2.1 2.3 1.2
Share data
Earnings per share continuing operations, SEK 2.51 2.39 14.83 14.71
Earnings per share discontinued operations, SEK 0.05 –0.89 –1.24 –2.18
Earnings per share, SEK 2.56 1.50 13.59 12.53
Share price at the end of the period, SEK 289.10 234.90 289.10 305.80
Dividend per ordinary share, SEK – — — 9.50
Dividend, SEKm – — — 1,130
Dividend payout ratio, % – — — 42
Equity per share, SEK 123.12 117.27 123.12 122.91
Cash flow from operating activities per share, SEK 1.10 1.00 19.23 17.97
Number of ordinary shares 118,937,248 118,937,248 118,937,248 118,937,248
Number of C shares 82,067,892 82,067,892 82,067,892 82,067,892
Total number of shares at the end of the period 201,005,140 201,005,140 201,005,140 201,005,140
Average number of shares 201,005,140 201,005,140 201,005,140 201,005,140
Average number of shares after dilution 201,146,795 201,146,795 201,146,795 201,146,795
ICA Gruppen Interim report January–March 2015
22
Definitions of key figures
Hard discountDistinctly low price store with limited product range
Joint ventureCooperation project, a joint venture company.
MTNA medium-term note in a continuously offered debt note with predetermined maturity date.
Near FoodItems such as household products, pet food and non-prescription drugs.
Non foodItems that are not food, such as clothing and footwear.
Private labelsOwn brand products.
Glossary
Capital adequacy ratio (ICA Bank)Refers to ICA Bank. The bank’s capital base in relation to risk-weighted items.
Capital employedTotal assets less non-interest bearing liabilities and provisions.
Cash flow from operating activities per shareCash flow from operating activities for the period divided by the average number of shares outstanding.
C/I ratio (ICA Bank)Total costs in relation to total income.
Earnings per C shareSame definition as Earnings per ordinary share, since ordinary shares and C shares provide entitlement to equal participation in earnings and equity. C shares do not carry entitlement to a cash dividend, however, which is the case for ordinary shares.
Earnings per ordinary shareProfit for the period, excluding non-controlling interests, divided by the average number of shares outstanding.
EBITDA(Earnings Before Interest, Taxes, Depreciation and Amortisation) Operating profit, excluding acquisition effects, before depreciation and impairment.
Equity/assets ratioEquity including non-controlling interests as a percentage of total assets.
Equity per shareEquity, excluding non-controlling interests, divided by the total number of shares outstanding.
InvestmentsInvestments paid during the period according to the statement of cash flows.
Loan loss ratio (ICA Bank)Bad debts in relation to average lending.
Net debtInterest-bearing liabilities excluding pensions, ICA Bank and cash and cash equivalents.
Net interest (ICA Bank)Difference between the bank’s interest income and interest expense.
Net marginProfit for the period as a percentage of net sales.
Non-recurring itemsGain/loss on disposal of non-current assets, impairment of non-current assets as well as major structural changes. The term also includes the gain which arose in 2013 when the remaining shares in ICA AB were acquired.
Occupancy rate (ICA Real Estate)Market rental for rented properties divided by total rental income (contracted annual rent + market rent for unrented premises).
Operating marginOperating profit as a percentage of net sales.
Return on capital employedProfit after financial income, excluding acquisition effects, as a percent-age of average capital employed. ICA Bank’s operations are excluded from both the income statement and balance sheet when calculating return on capital employed.
Return on equityProfit after tax as a percentage of average equity. ICA Bank’s operations are excluded from both the income statement and balance sheet when calculating return on equity.
Yield (ICA Real Estate)Operating net in relation to average book value.
ICA Gruppen Interim report January–March 2015
23
For further information, please contact:Frans Benson, VP Investor Relations tel. +46 8-561 50 020
ICA Gruppen press service tel +46 10 422 52 52
Press and analyst meetingICA Gruppen is arranging a press and analyst meeting at Tändsticks-palatset, Stockholm on Wednesday, 6 May 2015 at 10.00 CET. CEO Per Strömberg and CFO Sven Lindskog will present the interim report.
The meeting will be webcast and can be followed at www.icagruppen.se/investors. There is also an opportunity to call in on tel. +46 8 566 426 69, +44 20 3428 1436.
Calendar19 August 2015 Interim report January–June 201511 November 2015 Interim report January–September 201510 February 2016 Interim report January–December 2015
Sustainability reportICA Gruppen will publish its Sustainability report for the first quarter of 2015 on 7 May. The report will be available at icagruppen.se
Contact and calendar
ICA Gruppen AB (publ) is a leading retail company with a focus on food and health. The Group includes ICA Sweden and Rimi Baltic which mainly conduct grocery retail, ICA Real Estate which owns and manages properties, ICA Bank which offers financial services and, since January 2015, Apotek Hjärtat which conducts pharmacy operations. The Group also includes the wholly owned portfolio company inkClub and the partly owned portfolio company Hemtex. For more information see icagruppen.se
ICA Gruppen AB (publ)Svetsarvägen 16SE-171 93 SolnaTel. +46 8 561 500 00www.icagruppen.seReg. no. 556048-2837
Recommended