Embed Size (px)
Citation preview


Management Discussion
& Analysis
ECONOMIC BACKGROUND
The Gross Domestic Product (GDP) growthrate for the past two years has successivelyslowed, down to 6.2% in 2011-12 and furtherto 5% in 2012-13. Despite this, thecompound annual growth rate (CAGR) of GDPat factor cost, over the decade ending2012-13 was 7.9%.
The economy slowed down rapidly despiterecovering from the global financial crisis,due to a variety of reasons such as, highinflation, reduced consumption demand,deceleration in corporate and infrastructureinvestment and tighter monetary policy. Theeconomy was also hit by additional shocks of aslowing global economy, weighed down by thecrisis in the Euro area and uncertainties aboutfiscal policy in the United States.
As growth turned sluggish and governmentrevenues did not keep pace with spending,the fiscal deficit threatened to breach thetarget. With government savings falling, andprivate savings also shrinking, the currentaccount deficit, which is the investment thatcannot be financed by domestic savings andhas to be financed through trade surplus,also widened.
However, India is still in an enviable positionwith the GDP expected to climb to 6.4%again, in 2013-14. The growth is expectedto increase further to 6.7% in 2014-15,according to the World Bank's latest IndiaDevelopment Update, a bi-annual report onthe Indian economy. The Prime Minister'sEconomic Advisory Panel expects theeconomic growth rate to increase to 6.4% in2013-14 from 5% during 2012-13, on theback of improvement in the performance ofagriculture and manufacturing sectors.
INDUSTRY PERSPECTIVE
India's pharmaceutical sector is poised togrow from the present US$ 15.6 billion, toUS$ 35.9 billion by 2017. A similar forecasthas been published in a PricewaterhouseCoopers (PwC) report which believes that theindustry size could possibly touch US$ 74billion by 2020. The Indian Government'sPharma Vision 2020 also aims at making Indiaa global leader in end-to-end manufactureby 2020, and hence the Government isplanning to set up a US$ 640 million venturecapital fund to boost drug discovery andfurther strengthen the pharmaceutical sector.
According to industry estimates, the Indianpharmaceutical industry produces about
60,000 generic brands in 60 therapeuticcategories and manufactures more than 400different APIs. Presently, generics dominatethe market while the expectations are thatpatent-protected products are likely toconstitute 10% of the industry cake by 2015.Both Indian and foreign multinationals areset to launch patented drugs across India.
Rural India is likely to witness a step-up indemand since manufacturers are reaching outto chemists by expanding their distributionnetwork. Pharma industry is likely to seegreater vibrancy when the networks start toimpact manufacturing by 2015. India isconsidered a high-value hub for clinical trialsdue to the presence of genetically diversepopulation and availability of skilled doctors.
In its bid to step up Indian exports from thepresent tally of US$ 310 billion and reach atarget of US$ 500 billion by 2014, thegovernment believes that pharma is a majorthrust sector growing at 15% annually andgenerics is a major strength area. Pharmaindustry is considered a focus area to achievethe overall target. India is expected to doublepharmaceutical exports in the next few years,with the Pharmaceutical Export PromotionCouncil (Pharmexcil) eyeing overseas salesworth US$ 20 billion by the end of 2014-15.The figure stood at around $10 billion in2010-11.
Traditionally India has been exporting toregulated markets, the US and the EU marketsaccounting for a major share apart from otherregulated markets such as Oceania and Japanand less regulated markets such as LatinAmerica, Africa and parts of Asia. Indiawitnessed a phenomenal growth in the EUand North America, with growth in Africa alsobeing spectacular. In the former marketsIndia has largely been existent in the upperend of the value chain.
Japan offers a fresh opportunity for qualityconscious manufacturers. Given the heavypressure on the health requirements,specially its aging population, Japan whichis a US$ 109 billion market, of which genericsconstitute 8%, has decided to enlarge itsgenerics portfolio. Japan today represents anopportunity for the Indian pharmaceuticalindustry. India has also entered into an FTAwith Japan, which is a conscious agreementto mutually increase cooperation in thepharma sector. An element of this is the factthat Japan has extended national treatmentto Indian companies.
Aurobindo Annual Report 2012-13 / 27
Salient features of the Indian pharmaindustry are:
● Accounts for over 10% of globalpharmaceutical production;
● Manufactures over 60,000 genericbrands across 60 therapeuticcategories;
● Produces more than 400 different APIs;
● Over 120 US FDA and 84 UK MHRAapproved manufacturing facilities inIndia;
● Manufacturing cost of Indian pharmacompanies is up to 65% lower than thatof US firms and almost half of that ofEuropean manufacturers;
● Lower cost of production and R&Dcapabilities boosts competitiveness ofIndian pharma companies;
● Comparative cost advantage enhancesIndian pharma exports; and,
● Pharma industry exports amount toapproximately US$ 310 bn a year.
COMPANY PERSPECTIVE
After creating a name for itself in themanufacture of bulk actives and ensuring afirm foundation of cost effective productioncapabilities together with a clutch of loyalcustomers, the Company has entered thehigh-margin specialty generic formulationssegment, with a global marketing network.The business is systematically organized withan identified accountability structure and afocused team for each key internationalmarket. Aurobindo's business strategyincludes gaining volumes and market sharesin every business/segment it enters.
Aurobindo has a robust product portfoliospread over major product areasencompassing CVS, CNS, anti-retroviral,antibiotics, gastroenterologicals, anti-diabetics and anti-allergic with approvedmanufacturing facilities by US FDA, UK MHRA,WHO, MCC-SA, ANVISA-Brazil for both APIs& formulations and has a global presencewith own infrastructure, strategic alliances,subsidiaries & joint ventures.
The generics portfolio offers 470 products/dossiers (March 31, 2013 covering developedmarkets of USA, European Union, SouthAfrica, Canada & Australia) in majortherapeutic areas of CNS, gastro-intestinal,cardiovascular/anti-diabetics, anti-retrovirals, anti-allergics, anti-biotics,carbapenems, ophthalmics and oral
contraceptives. A synchronized supply chainleverages strong product developmentcapabilities. State-of-the-art manufacturingfacilities and vertical integration with captivesource of APIs has created a strategiccompetitive advantage.
The formulation business is systematicallyorganized with a divisional structure and hasa focused team for key international markets.Leveraging on its large manufacturinginfrastructure for APIs and formulations, wideand diversified basket of products andconfidence of its customers, it aims toachieve US$ 2 billion revenues by 2015-16.Aurobindo's nine units for APIs/intermediatesand six units for formulations are designedto meet the requirements of both advancedas well as emerging market opportunities.
Over the years, Aurobindo has evolved intoa knowledge driven company. It is R&Dfocused, has a multi-product portfolio withmulti-country manufacturing facilities and isbecoming a marketing conglomerate acrossthe world.
Aurobindo's R&D strengths lie in developingintellectual property in non-infringingprocesses and resolving complex chemistrychallenges. In the process, Aurobindodevelops new drug delivery systems, dosageformulations and applies new technology forbetter processes.
The medium term strategy of the Companyis to continuously globalize the intellectualproperty assets and enhance value toshareholders and customers. In globalmarkets, the Company continues to retainand enhance cost-efficient quality leadershipin its chosen segments, such as newer anti-infectives and lifestyle disease drugs. It isthe endeavor of the Company to achieve thisby resolving complex chemistry challenges,improving process efficiencies, adoptingglobal scale manufacturing and using cost-effective market networks throughout itsaddressable markets. Aurobindo aims torepeat its success and emerge as a majorplayer in regulated markets.
The long-term growth strategies being putin to action include:
● Developing a broad portfolio of DMFs/ANDAs through non-infringingprocesses and intellectual propertiesand become a significant player in thegenerics market, especially in theregulated markets;
● Managing cost efficiency in a mega-manufacturing environment approvedby US FDA/European regulatoryauthorities; and in the process, enhancethe attractiveness of Aurobindo toalliance partners;
● Resolving complex chemical challengesand offering advanced drugs to theglobal markets;
● Globalising and further penetrating themarkets through joint ventures/subsidiaries/organic means into China,Brazil and other Latin Americancountries; and,
● Emerging as a leading player in globalhigh-quality innovative specialtygeneric formulations and domesticbrand segments.
Aurobindo Pharma has tie-ups with a fewcustomers, giving them a competitive edgethrough faster product development andoptimized costs. The strategy is based onco-working and collaborative alliances andpartnerships with global pharmaceuticalmajors.
Some of the notable features of thisarrangement are:
● Strict confidentiality and utmostsecrecy are maintained throughabsolute adherence to the non-disclosure clause;
● Efficient supply chain management andoptimal utilization of capacities, areensured enabling Aurobindo to pass onsubstantial cost benefits to itscustomers;
● Aurobindo is a stickler for deadlines.Recently, the Company commercializedan API involving a 14-step process withfive chiral centers in just 13 weeks;
● A huge library with syndicateddatabases is available and the latestsoftware ensures quick and efficientliterature/patent survey and retrievalof information;
● Multi-disciplinary project teamsinterface with the customers right fromthe start to ensure a seamlessintegrated approach. Theirresponsiveness enables rapid executionof projects;
● Besides conforming to cGMP and cGLPdue attention is given to safety, healthand environment aspects;

● The Company has harnessed the latestin communication technology -dedicated server, video conferencing,tele-conferencing, etc. to ensureconstant communication throughoutthe life of the project; and,
● A right mix of instrumentation andproduction expertise ensures dueemphasis on profiling, characterizationof compounds and reduction inimpurities, chiral resolution andimpurity profiling. All these ensure thehighest quality of deliverables and yieldoptimization.
The Company's competitive advantage is incapturing a large portfolio of approvals,backed up by a global standard R&D effortthat offers several patented non-infringingprocesses and intellectual properties, and acost efficient mega-manufacturingenvironment complying with US FDA and EUauthorities.
The corporate plans are to ensure growththrough organic means and adoptingstrategic joint ventures and alliances. Theobjective is to maximize the revenues andmargins while risks are minimized.
THREATS AND CHALLENGES
Aurobindo is in a competitive market andthe challenges are from both Indianmanufacturers who have similar productionfacilities as well as those in China and Europe.Human resources with similar skills, talentsand experiences in the industry are mobilebetween competing companies. Yet, it mustbe appreciated that Indian manufacturers ingeneral, and Aurobindo in particular, havemade an impact on the global stage and haveworked hard to get shelf space.
Price sensitivities get tested in a crowdedmarket where price tends to sag while volumebusiness gets done. Competingpharmaceutical companies have severalsimilar bio-equivalent products in the samemarket manufactured at facilities that havebeen approved by the highest regulatoryauthorities. All of them stay focused on thesame markets resulting in price elasticitybeing tested and margins eroding.
This threat, however, does not affectAurobindo because of its control over rawmaterial sourcing. The Company is a dominantplayer in the active ingredients business andhas been able to control its quality, save ontimelines, control its costs and has the abilityto deliver at short notice. Pricing power i.e.
the ability to price lower and yet manage toget higher return on sales than thecompetitors, is a potent strength. This is aunique advantage that Aurobindo enjoys overmanufacturers across the world.
Key strengths of the Company include itsmanufacturing infrastructure, the knowledgebase at the research centers and the abilityto deal successfully with its process chemistrystrengths. All the strengths have been testedfrom the perspective plan to manufacturingplant and later in the market place. There isa powerful marketing infrastructure backedup by state-of-the-art manufacturing systemsthat are driving the business.
Aurobindo has been timing its launches totake advantage of products going off-patentand the opportunities available in a first-mover market. This strategy is built aroundthe in-house R&D capabilities, technologystrength in manufacturing facilities and themarketing infrastructure. The Company hasworked on its speed-to-market abilities andis quick to convert product approvals intoinvoices.
The Company has unmatched strengths tocope with the challenges of the market suchas experienced staff with ability to anticipatemarket needs, plan for product launches withsupportive documentation, create productsthat meet regulatory norms and execute planswithin tight cost and time budgets. Theprofessionals within the Company have beentrained to create opportunities, replicate thesuccesses and drive business growth.
INTERNAL CONTROL
The Company has implemented Oracle basedERP which not only adds to the controls, buthas led to faster information, analysis andimproved decision making.
Aurobindo has a well-defined internal controlsystem which is adequately monitored.Checks and balances and control systemshave been established to ensure that assetsare safeguarded, utilized with properauthorization and recorded in the books ofaccount.
There is a proper definition of roles andresponsibilities across the organization toensure information flow and monitoring.These are supplemented by internal auditcarried out by a firm of CharteredAccountants. The Company has an AuditCommittee consisting of four directors, allof whom are independent. This Committeereviews the internal audit reports, statutory

Aurobindo Annual Report 2012-13 / 29
audit reports, the quarterly and annualfinancial statements and discusses allsignificant audit observations and follow upactions arising from them.
HUMAN RESOURCES
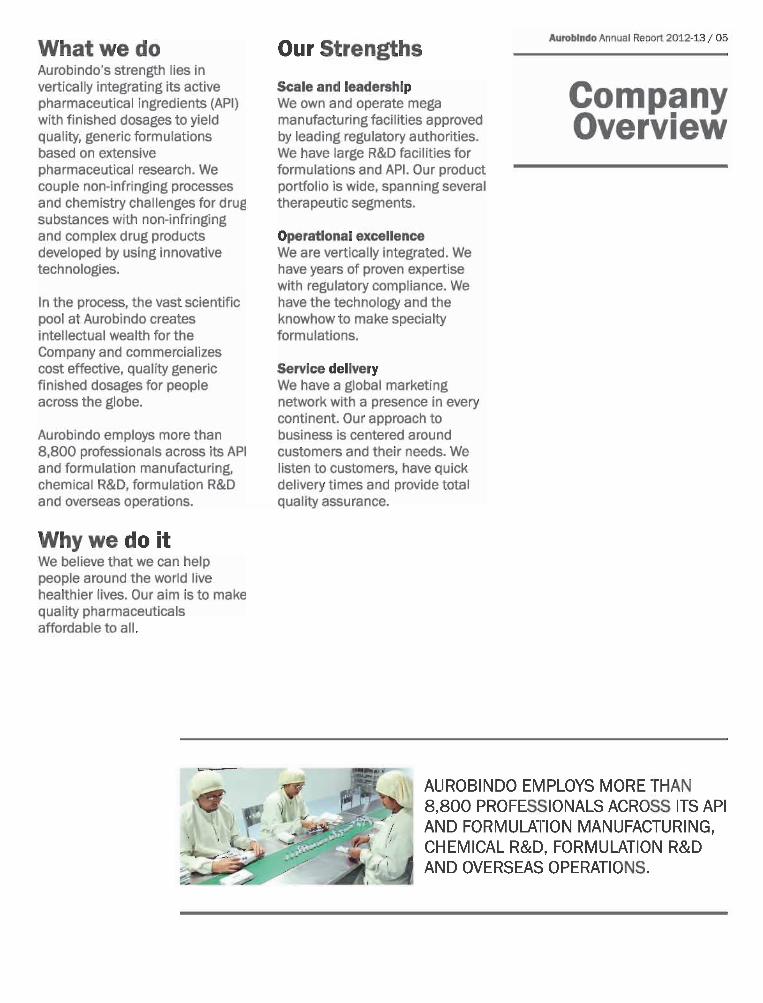
Aurobindo Pharma has a team of more than8,800 professionals working at its variousdivisions - API manufacturing, formulationmanufacturing, chemical R&D, formulationR&D and overseas operations. About 80% ofthese employees are graduates, postgraduates and PhDs.
The Company has recrafted its humanresource philosophy and put it into actionacross the organization. In brief, they areiterated below:
● To attract, build and retain right talentat all levels;
● To create and nurture performanceculture through continuous capabilitybuilding, performance measurementand leveraging of IT;
● To foster leadership at all levels throughtrust, empowerment and openness;
● To strengthen collaborative approachfor business excellence; and,
● To promote a vibrant work culture basedon innovation and to incentivize peoplebased on productivity/outstandingperformance.
In line with the HR philosophy theemphasis has been on the five criticaldimensions of people management:
● Establishment of vibrant organizationalculture;
● Talent attraction and retention;
● Continuous capability building;
● Recognition of outstandingperformance of the team/individuals;and,
● Staff welfare.
In order to keep pace with the changingglobal business scenario, Aurobindo hastaken up various change managementinitiatives. One of them is 'AurobindoAchieving Competitive Edge' or A2CE. Thisinitiative has created a forum to tap creativetalent among employees, bring significantimprovement in the form of high productivityand quality, realize better asset utilizationand manpower deployment. Teams andindividuals are rewarded and recognized forproject deliverables and learning. A2CE
reaches out to Aurobindo employees throughmonthly project reviews and a portal -a2ce.com - that shares best practices withemployees.
Another initiative is 'Mission Quality' whichaims to create and augment the qualityculture across the organization to assess ourstaff and executives in quality standardscompliance and their commitment to quality.An assessment based on key performanceindices and quality metrics has been carriedout at our formulation units to identifyMaster Quality Leaders (MQL) who willfacilitate our quality initiatives across theorganization.
Industrial relations continue to be peacefuland harmonious. The management hasinitiated various measures such as formationof bipartite forums and joint managementcouncils to promptly redress staff grievancesand to improve welfare amenities in theplants. During the period under review, therewas no incident of work stoppage or loss ofproduction due to IR related issues.
CORPORATE SOCIAL RESPONSIBILITY
Aurobindo's CSR charter covers thefollowing areas of activities:
● Social welfare and
● Education
Under the social welfare scheme, theCompany provides medical care andcommunity service activities such asprovision of potable water at nearby villages,provision of bore well tanks and overheadtanks, laying of roads connecting villages.
Under the education scheme, the Companyprovides financial support and sponsors poorbut meritorious students to undergo variouscourses and finances village schools to driveeducation among the students of villagecommunity members etc. The aim is toprovide relevant and useful education towomen and children in different locationswhere Aurobindo is present. This program wasinitiated to introduce non-academicknowledge and skills of traditional trades inthe surrounding villages.
Aurobindo had provided subsidizedtransportation to the local people. TheCompany received a State Award for BestCommunity Service from the Government ofAndhra Pradesh.
OUTLOOK
The Company is confident of growth both inAPI and formulations API, given the fact that
sales are being ramped up in all the previousquarters spread across all the geographies.This trend is expected to continue withseveral new launches as well as improvingthe base business. There is likely to besignificant growth in the injectable side ofthe business. In case of the APIs, theobjective is to grow the high value products,gain momentum in developed markets andtaper-off the non-competitive products.
Aurobindo performed well in the recent pastdespite lack of supplies from Unit-IV andUnit-VI. This situation is now corrected andgoing forward, both units would addsignificantly to the top and bottom line.Capacity utilization is improving at Unit-VIIand Unit-XII. It needs to be appreciated thatthe Company has an enviable productportfolio and regulatory approvals. The focuswill be step up the volumes of high valueproducts, improve the reach in the marketwhile taking care to reduce overall costs.
The Company will capitalize on its inherentstrengths, some of which are iteratedbelow:
● Cost effective vertically integratedmanufacturing systems;
● Current Good Manufacturing Practices(cGMP) and regulatory compliantfacilities producing high-quality APIsand finished dosage formulations;
● Best-in class, best-in cost, largemanufacturing capacity;
● High visibility in API and generics;
● Strong financial position with abilityto scale up;
● Highly skilled professionals withregulatory expertise and competent todeliver on development, productprocesses and regulatory standards;
● Access to new technologies.
In the long-run an increased thrust oncombination drugs, in-licensing initiatives,co-marketing/alliances with MNCs and othermeasures like enhanced focus on OTCs,vaccines, institutional segment as well asfocus on reaching direct to the customersare some of the drivers for gaining tractionin increasing revenues, EBITDA margin andReturn on Investment higher than theindustry average. The Company is targetingto be cash flow positive, by lowering theleverage, striving to expand earnings andreducing interest outgo.

The management has a proven ability tosuccessfully take on challenges. Efforts areon to become more proactive in recognizingand managing risks through a formalstructured framework. The magnitude of therecent financial crisis, as well as itssignificant impact on the world economy andon many of the Company's customers andsuppliers highlighted, more than ever, theneed to have a broad and comprehensive riskmanagement approach.
Aurobindo is adopting a broad and strategicapproach to risk management taking intoaccount both internal and external risks andstrengthening the governance process torespond swiftly to changing dynamics.
The Company has taken cognizance of thecompliance and operational risks to beaddressed involving the people, theprocesses, technology and outsourcing ofproducts and services. While there are severalrisks associated with a pharmaceuticalmanufacturing company, some of them arepresented below to appreciate the stepsbeing taken to mitigate them.
Economic and geopolitical
An economic slowdown in the U.S. or Europecould adversely affect the Company's businessand results of operations.
Aurobindo has a product basket that straddlesseveral therapeutic segments and hasapproximately 51.7% of its formulationsrevenues from the U.S., another 26.1% fromthe European Union and emerging markets,while anti-retrovirals make up the balance22.2%. Formulations sales constitute about57.2% of the total revenue, while APIbusiness accounts for 42.8%. Care is takento grow in each of the product segments andthe Company is striving to improve itspresence in all its markets.
The Company holds regulatory approvals forlarge number of products in the U.S. andEurope in a bid to widen the geographicalreach. The product portfolio and the pipelineare being further strengthened, with a viewto gaining new market presence. Efforts arealso being made to strengthen presence inpotentially large markets such as Japan,Brazil, South Africa, Canada, Australia, Northand West Africa as well as Middle East tostep up business. These initiatives would alsohelp consolidate Aurobindo's volumes andrevenues over the long term, therebyspreading the risk portfolio.
Slowdown in any one economy will not havea major influence on the industry. Overall, the
Risks & their
Management
healthcare industry is not price elastic and ishence, reasonably insulated from recessionarytrends.
Competitive pressure
Our products face intense competition fromproducts developed or under development byother companies in India and abroad.Competition could be from majorpharmaceutical and chemical companies,specialized contract research organizationsand research and development firms.
In a highly competitive market betweenequally competent players, it is critical tohave unmatched and unique strengths thatimprove market share, reduce risks whileadding potential value. Aurobindo indeed hasunique strengths which enable the Companyto face competitive pressures better than itspeers.
This risk perception would not significantlyimpact Aurobindo since it is verticallyintegrated in its manufacturing processes.For most of its generic formulations, theCompany has captive manufacture of activeingredients. This ensures timely availability,helps keep the cost under control andimprove margins. In a price sensitiveindustry, with its operational efficienciesAurobindo is able to offer products atcompetitive prices. This is one of the majorstrengths of the Company.
Regulatory requirements
In an industry where there are stringentregulatory requirements, some of ourcompetitors, especially multinationalpharmaceutical companies, have greaterexperience in clinical testing and humanclinical trials of pharmaceutical products andin obtaining international regulatoryapprovals. This could render our technologiesand products uncompetitive or limit our abilityto introduce new products adversely impactingour business.
Aurobindo has a talent pool of over 816scientists who have considerable experiencein handling complex chemistry as well asfiling applications with the regulatoryauthorities. The in-house team has appliedfor 2,500 approvals for ANDAs out of which258 filings are with the US FDA. Approvals/tentative approvals received from US FDAtotal 179 as at March 31, 2013.
Similarly, as on the same date, the team hasfiled over 2,000 DMFs including 172 with USFDA. 532 patent applications have been filedwith various authorities of which 79 havebeen granted.
Like all businesses, Aurobindo'sbusiness too involves risks. Riskmanagement is an integral part ofthe Company's plans, businessstrategies, monitoring systemsand results. It takes in allorganizational processes geared toearly risk detection, identificationand timely implementation ofappropriate counter measures.
The Company has embedded riskmanagement activities in theoperational responsibilities ofmanagement and made them anintegral part of overall governance,organizational and accountabilitystructure.
At Aurobindo, risk is defined as anycontingency that has a potentialnegative impact on achievingbusiness goals, especially onearnings trends.
One of the priorities in theCompany's growth trajectory isactive risk management, buildingfurther on the current successfulpractices and learning fromexperiences. It also provides thebasis to select risks that drivevalue while proactively mitigating,managing or transferring risks thatdo not create value.
Aurobindo Annual Report 2012-13 / 31
The capabilities of the research scientistshave been amply proved by the aggressivefiling and the speed at which the approvalshave been received. The research team hasalso demonstrated their ability to scale upand commercialize the products.
Aurobindo is dedicated to supplying highestquality medicines to customers and iscommitted to healthier life. Hence, theCompany at all times strives to conform toregulatory standards, meet stringentrequirements of customers to ensure thedrugs sold provide health care and wellnessfor the consumers.
The Company has put in place the necessarysystems to prevent any violations ordeviations. Yet, there have been a fewisolated instances in the past. Aurobindo'steam has taken up such exceptional eventsearnestly for prevention of their recurrence.The quality systems have been revisited tostrengthen them while training inputs havebeen stepped up to elevate the level ofawareness, supervision and control.
Aurobindo is striving to ensure that it isbenchmarked as the best-in-class and therebyprovide reassurance to all stakeholders. Everyeffort is hence being taken to ensure thatthere is no compromise on quality of productsand processes.
Pricing power
Certain of our products are subject to pricecontrols or other pressures on pricing. Pricecontrols limit the financial benefits of growthin the life sciences market and the introductionof new products.
With near perfect competition in the genericindustry, prices are a function of supply anddemand. Prices do trend in response tosupplies as well as competitive pressures.Domestic pricing is also influenced by globaltrends in both availability and price ofimported active ingredients.
Industry players with marked presence insegments with demand are able todifferentiate themselves and offer valueproposition. In some segments, the brandvalue and offer has enabled players to pricethe products appropriately. Aurobindo is ableto cope with pricing pressures and theCompany's focus on quality assurance hasminimized the possibilities ofcommoditization.
Aurobindo strives to protect margins and hasbeen responsive to the needs of growth aswell as profitability.
Patent protection
Our success will depend on our ability in futureto obtain patents, protect trade secrets andother proprietary information and operatewithout infringing on the proprietary rightsof others.
Aurobindo has a dedicated IPR team oftrained scientists whose primary task is toensure that the Company's products aremanufactured using only non-infringingprocesses. So far the Company has filed for532 patents and has been granted 79 non-infringing process patents.
Adequate care is taken to respect tradesecrets, knowhow and other proprietaryinformation and ensure that the employees,vendors and suppliers sign confidentialityagreements.
Market risks
We depend on the U.S. market for a significantpart of our future operating results. Failureto develop profitable operations in that marketcould adversely affect our business, resultsof operations, financial condition or prospects.
The Company has been consciously spreadingits risks. Both formulations and API businessare being grown. While the initial thrust forthe generic business was made to gainfoothold in the U.S., the Company is makingsignificant inroads into the European,Australian and Japanese markets. Aurobindowould be further accelerating with itsmarketing strategy to gain business volumefor both businesses in the addressablemarkets.
Ongoing efforts are to widen the geographicalspread by foraying into markets with largepotential in Latam and the Rest of the World.In order to improve the business, results ofoperations and financial condition, thestrategy is being implemented with a timebound action plan.
Exchange rate
Currency exchange rates could undergo changewith Indian rupee being volatile and due toglobal macroeconomic situation. This couldaffect earnings.
Presently, the rupee is showing signs ofweakness in relation to the USD and there isno hedging of the currencies. The Companyis also conscious of the impact on earningswhen the volatility can be sharp and moveboth ways. This is being mitigated by thefollowing actions:
� To minimize the adverse impact of rupeeappreciation, need based forward coveris being taken on a selective basis.
� The Company enters in to foreignexchange contracts only on a limitedbasis to hedge assets, liabilities andanticipated future cash flows,denominated in foreign currency.Natural hedge available in relation tounderlying contracts helps minimizethe risk.
� Operating margins are being improvedby larger proportion of formulationssales. This will also help drive themargins, mitigating the possiblecurrency exchange loss.
In the ultimate analysis, Aurobindo is in thebusiness of manufacturing and marketingAPIs and formulations and will always makeeffort to mitigate the temporary shading ofprofits.
People risks
Aurobindo's success depends largely upon thehighly-skilled professionals and the ability toattract and retain competent managerialpersonnel. The industry is human capitalintensive with a high rate of attrition.
Aurobindo is a result oriented Company witha focused approach to customers, marketsand products. There is a premium attachedto completing tasks on time and being costconscious. Aurobindo is therefore ademanding organization and hence recruits,trains and builds a team of achievers.
Aurobindo has been fine tuning its HRpractices with the objective of providing anenvironment that encourages people todeliver results. The current phase ofaccelerated growth is backed by systems thatmeet future needs. Second-in-command ineach key function and decentralizedmanagement style has developed a muchstronger organization culture.
There is a proactive approach to humanresource management and the employees aregiven responsibility with authority. Emphasisis also on accountability and they areencouraged to raise the bar and perform totheir potential. The professional approachin day-to-day management has enabled thestaff to stay motivated. Continuous andconsistent structured interactions andcommunications help the personnel updateand upgrade their knowledge and skills andhelp minimize the operational risks. ERPaided monitoring and formalized supervisorycontrols are in place to mitigate compliancerisks.
As in the past, the attrition in the Companyis much lower than the industry average.

NOTICE is hereby given that the Twenty Sixth
Annual General Meeting of the Members of
Aurobindo Pharma Limited will be held on
Wednesday, the 7th day of August, 2013at 4.00 p.m. at Taj Deccan, Road No.1,Banjara Hills, Hyderabad - 500034 to
transact the following business:
ORDINARY BUSINESS
1. To receive, consider and adopt the
Audited Balance Sheet as at March 31,
2013 and the Statement of Profit and
Loss and Cash Flow Statement for the
year ended on that date and the Report
of the Board of Directors and the
Auditors thereon.
2. To declare dividend on the Equity
Shares.
3. To appoint a Director in place of
Mr. P. Sarath Chandra Reddy who retires
by rotation and being eligible, offers
himself for re-appointment.
4. To appoint a Director in place of
Mr. K. Ragunathan who retires by
Notice
rotation and being eligible, offers
himself for re-appointment.
5. To appoint a Director in place of
Dr. M. Sivakumaran who retires by
rotation and being eligible, offers
himself for re-appointment.
6. To appoint M/s. S.R. Batliboi &
Associates LLP (Registration No.
101049W) as Statutory Auditors of the
Company to hold office from the
conclusion of this Annual General
Meeting until the conclusion of next
Annual General Meeting and to
authorize the Board of Directors to fix
their remuneration.
By Order of the Board
A. MOHAN RAMI REDDYAVP (Legal) & Company Secretary
HyderabadMay 30, 2013
Notes
1. A MEMBER ENTITLED TO ATTEND AND VOTE
AT THE MEETING IS ENTITLED TO APPOINT
A PROXY TO ATTEND AND VOTE ON A POLL
INSTEAD OF HIMSELF/HERSELF AND THE
PROXY NEED NOT BE A MEMBER OF THE
COMPANY. In order to become valid, the
proxy forms should be deposited at the
Registered Office of the Company not less
than 48 hours before the time fixed for
holding the meeting.
2. The Register of Members and Share
Transfer Books of the Company will
remain closed from August 1, 2013 to
August 7, 2013 (both days inclusive).
3. The Board of Directors of the Company
has declared an interim dividend
@100% i.e. ̀ 1 per share of Face Value of
`1 for the year 2012-13 on February 7,
2013 and has been paid to the members
on February 27, 2013.
The final dividend on equity shares
@50% i.e. `0.50 per share of `1 as
recommended by the Board of Directors,
if declared at the ensuing Annual
General Meeting, will be paid to those
Members whose names appear on the
Company's Register of Members on July
31, 2013; in respect of shares held in
electronic form, the dividend will be
paid to Members whose names are
furnished by National Securities
Depository Limited and Central

Aurobindo Annual Report 2012-13 / 33
Pharma Limited, are hereby requested
to do so by surrendering the original
share certificates of Sri Chakra Remedies
Limited/Gold Star Remedies Limited to
the Company's Registrar and Transfer
Agents, M/s. Karvy Computershare
Private Limited.
7. To avoid loss of dividend warrants in
transit and undue delay in respect of
receipt of dividend warrants, the
Company has provided a facility to the
Members for remittance of dividend
through the Electronic Clearing System
(ECS). For this purpose, the details such
as, name of the bank, name of the
branch, 9-digit code number appearing
on the MICR band of the cheque
supplied by the bank, account type,
account number etc are to be furnished
to your DP if the shares are in electronic
form or to the Registrar & Transfer
Agents, if they are held in physical
mode.
8. As part of the 'Green Initiative in
Corporate Governance', the Ministry of
Depository Services Limited as
beneficial owners as on that date.
4. Pursuant to the provisions of Section
205A of the Companies Act, 1956, the
unpaid/unclaimed dividend for the year
2005-06 will be transferred to the
Investor Education and Protection Fund
of the Central Government on the due
date.
5. Members holding shares in physical
form are requested to notify
immediately any change in their address
to the Company's Registrar and Transfer
Agents M/s. Karvy Computershare
Private Limited. Members holding
shares in electronic form may intimate
any such changes to their respective
Depository Participants (DPs).
6. Pursuant to the amalgamation of Sri
Chakra Remedies Limited (formerly Gold
Star Remedies Limited) with Aurobindo
Pharma Limited, the erstwhile
shareholders of Sri Chakra Remedies
Limited, who have not yet exchanged
their shares with shares of Aurobindo
Corporate Affairs by its circular dated
April 21, 2011 and April 29, 2011 has
permitted companies to send various
notices/documents (including notice
calling annual general meeting, audited
financial documents, directors' report,
auditor's report etc.) to their Members
through the electronic mode to the
registered Email addresses of the
Members. It is a welcome move for the
society at large, as this will reduce
paper consumption to a great extent
and allow public to contribute towards
a greener environment.
We encourage our Members to
participate in this green initiative and
update their e-mail ID's and receive the
communication through the electronic
mode. Those who wish to receive future
communications in electronic mode are
requested to send their Email ID to the
Registrar & Transfer Agents of the
Company. If the shares are held in
electronic mode, kindly have your Email
registered with your respective DP.

Directors’ Report
Dear Members ,
Your Directors are pleased to present the 26th Annual Report of the Company together withthe Audited Accounts for the financial year ended March 31, 2013.
FINANCIAL RESULTS
2012-13 2011-12
Gross Turnover 55695.0 43787.3
Profit before depreciation, finance costs,tax and exceptional items 9845.7 5925.6
Depreciation/Amortization 1713.9 1429.4
Finance costs 1147.4 931.1
Exchange difference adjusted to borrowing cost(Revised Schedule VI) 1353.2 1744.7
Profit before tax 5631.2 1820.4
Provision for tax/Deferred tax 671.3 (952.1)
Profit after tax before exceptional item 4959.9 2772.5
Less: Exceptional items – 3198.6
Net Profit/(Loss) after exceptional items 4959.9 (426.1)
Balance brought forward from previous year 14797.1 15561.5
Balance available for appropriation 19757.0 15135.4
AppropriationsDividend on equity shares 436.8 291.1
Tax on dividend 72.0 47.2
General reserve 496.0 –
Surplus carried to Balance Sheet 18752.2 14797.1
Standalone financials
DIVIDEND
Your Directors have proposed a final dividendof 50% i.e. `0.50 per equity share and withthe interim dividend of 100% i.e. ̀ 1 per equityshare, the total dividend for the financial year2012-13 comes to 150% i.e. `1.50 per shareon the equity share of `1 against 100% i.e.`1 per share of `1 paid in the previous year.
FINANCIAL HIGHLIGHTS
Your Company continued to show steadyperformance, achieved increase in revenues,operating profit and bottom line during thefinancial year 2012-13, despite themacroeconomic challenges in almost all theoverseas markets. On the manufacturing side,there was severe stress due to shortage aswell as high cost of power purchased fromstate grids. Currencies remained volatile, withintermittent sharp movements.
Your Company demonstrated its resilience andthe strength of its business model byexpanding the product portfolio andaggressively marketing them, managing costsbetter in an inflationary environment,stepping up its manufacturing efficiencies and
by staying focused on steadily raising itsbottom line. Every effort as in the past wasmade to expand the global footprint andconsolidate the position in the existinggrowth markets. Overall, the focus was onimproving shareholder value.
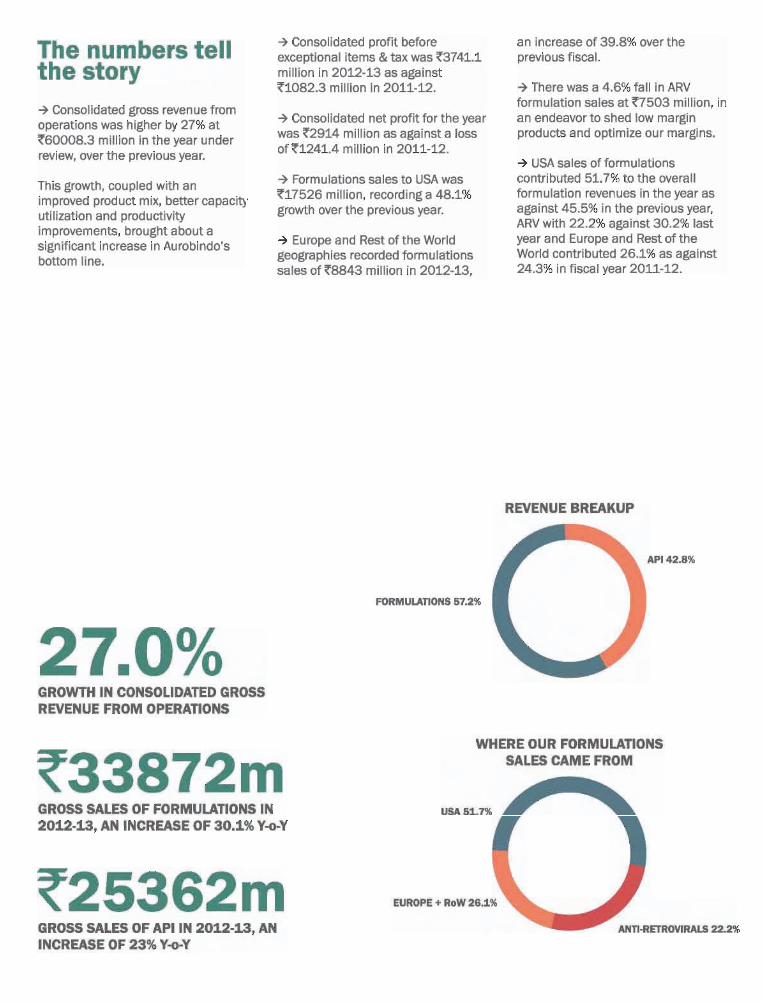
The consolidated gross revenue fromoperations was higher by 27% at `60008.3million in the year under review, over theprevious year. The formulation and API ratioduring the year was 57:43. Consolidated netoperating income inclusive of dossier incomeof ̀ 759.8 million is ̀ 58553.2 million showinga growth of 26.5% over the previous year.
Consolidated gross revenue from formulationduring the year was `33872 million, 30.1%higher on a year-on-year basis. In the APImarkets, both domestic and overseas, yourCompany strived to increase its share of highvalue products and special efforts were madeto build relationships in the developedmarkets. API revenues for the year underreview were `25362 million, a growth of 23%over the previous year, on account of favorabledemand scenario as well as focused efforts atenhancing product realizations.
` Million
Dividend
200
2010-11
%
150
2012-13*
* includes 50% proposed
100
2011-12

Aurobindo Annual Report 2012-13 / 35
There has been a year-on-year improvementin EBITDA by 200 basis points. EBITDA beforeforex adjustments and other income for theyear was `8891 million which is 15.2% of netoperating income and has gone up by 45.7%on year-on-year basis. Profitability during theyear under review has improved due to bettersales and business mix which had favorableimpact on material consumption to net salesby 3.4%, and staff cost to net sales marginallydecreased by 25 basis points and otherexpenses to net sales increased by 1.1%.
As far as foreign exchange is concerned, theclosing rupee dollar rate was `54.285 onMarch 31, 2013 while it was `50.875 onMarch 31, 2012. The rupee has been highlyvolatile through the year and has depreciatedby 6.7% during the financial year. This hasresulted in a net exchange loss of `1634.4million during the year which includes an amountof `1353.2 million on borrowings adjusted tofinance charges as per revised Schedule VI. Ithas also increased your Company's borrowingsby approximately ̀ 2100 million as on March 31,2013 on account of restatement.
REVIEW OF OPERATIONS
Formulations sales to USA was ̀ 17526 million,recording a 48.1% growth over the previousyear. Europe and Rest of the World geographiesrecorded a sale of `8843 million in 2012-13,an increase of 39.8% over the previous fiscal.There was a 4.6% fall in ARV formulation salesat `7503 million, in an endeavour to shedlow margin products and optimize on ourmargins. Strategic action was taken to beselective in building products and marketsthat contribute to the bottom line.
In terms of segmental contribution to theformulations revenue, the share of US was51.7% against 45.5% in the previous year.Similarly, European as well as the rest of theworld was 26.1% against 24.3% and ARV was22.2% against 30.2% in the previous year.The segmental shift in both API andformulations is reflective of your Company'sefforts to improve margins and this trend isexpected to continue.
In generic markets of US, UK, Germany, Spainand the Netherlands, your Company isprogressing well. Additional thrust to raise themarketing presence and gain margin is ongoingin countries such as Japan, Portugal and Italy.The subsidiaries in the US have turned aroundand are substantially improving their sales.
In respect of US business, your Company hashad a balanced growth between new product
introductions and the base business. Therewas an increased presence with key customers.The marketing efforts were directed towardsexpanding strongly through retail chains withnew product launches. Necessarily, aggressivepositions were taken from an inventorystandpoint in preparations for those launches;wherever required, your Company builtinventory to take advantage of launch needs,while trimming inventory costs as a routine.Today, Aurobindo has a well balanced portfolioand a pragmatic growth plan.
In the formulation business, your Company isspreading across the geographies to grow ineach of the geography independently ratherthan trying to be focused on only one or twomarkets. In case of API business, the objectiveis to grow high value and niche products whiletaking advantage of the vertically integratedmanufacturing systems.
Your Company targets to grow the ARVbusiness while ensuring that the focus remainson the bottom line. During the year, inkeeping with this strategy, Aurobindoparticipated in tenders where the Companycould quote a price which will ensurecompetitive margins rather than just chasingthe top-line. There is a very large portfolio ofARV products with your Company and theobjective is to grow this business whileclimbing the value chain.
OUTLOOK
Going ahead, introduction of new productsby your Company is expected to be a strongdriver in the formulations market with about20 to 25 launches in 2013-14 and efforts shallcontinue to increase the penetration in theexisting baseline business.
The focus on API is to reduce the dependencyon the pure Betalactam products. YourCompany has 279 DMFs filed in the U.S.,Europe and Japan. While Aurobindo has agrowing presence in the US and severalcountries of Europe for over several years, adetermined effort is being made to makeinroads in to Japan. Today Aurobindo exportssix API products and intermediates to severalprestigious customers in that country.Purposeful efforts are being made to grow thisquality-conscious market, and your Companyhas been able to maintain more than 50%growth in Japan in each of the last sixquarters.
Aurobindo has a wide array of well-balancedproducts on offer. Some are specialized andcan drive higher margins, some belong to
niche spaces such as ophthalmics, whileothers are typical mass market, high volumemolecules that are expected to boost thebottom line over the next couple of years.There are others that are gaining highervolumes which are being leveraged to takeadvantage of the in-house API strengths,vertical integration of capacities andimproving manufacturing efficiencies.
There are a large number of ANDA applicationsthat have been submitted in the past fewmonths, which await approvals, adding to thepipeline of products on offer. Your Companybelieves that there would be significantincrease in the product basket over next 2 to3 years. Aurobindo is making a foray in tothe injectables market which could gaintraction in the latter half of 2013-14. Giventhat there are fewer competitors than in solidorals, the objective is to gain around 10-15%market share as the Company moves forward.
It needs to be highlighted that the improvedperformance in 2012-13 was without themanufacturing capacities at Unit-IV, Unit-VIand less than optimum capacity utilizationat Unit-XII. The recent spate of approvalswould further ramp up the capacity utilizationat Unit-VII. Team Aurobindo is fairly confidentof improving the market share and top lineevery quarter of the year ahead.
It is expected that European operations incountries such as Italy and Portugal wouldstabilize in 2013-14 and turn around a yearlater. Meanwhile operations in countries suchas UK, the Netherlands, Germany and Spainare targeted to grow faster than the previousyear. Volumes in Canada are also picking upand Australian operations are likely tostabilize over the next 18 to 24 months.
Aurobindo has made a foray into the CRAMSbusiness in the past few months and believesthat it should become a significant portionof the income in about 3 years. While it hasstarted contributing to the business model,and is likely to improve gradually, yourCompany shall work to ramp up the CRAMSbusiness, build a mutually advantageousrelationship with customers, become adependable resource and contributemeaningfully to the revenue stream.
Your Company will be overcoming a majorchallenge in availability and cost of power.The possibility of plant shutdown and costescalation through diesel generationthreatened the operations of almost all yourCompany's facilities. The year under review

witnessed an energy crisis which includedthree-day week power holiday, surprise power-cuts and prohibitive cost increases.Considerable relief has now been worked outby independently installing the meters in allbut one of the production units, to do powertrading through the power exchange whichhas brought down the cost and added to thecertainty of power availability.
RESEARCH & DEVELOPMENT
During 2012-13, your Company developedcertain niche products involving complexchemistry and technology and strived toreduce cost of certain fast moving/highvolume products. Further, your Company hasopted to go for establishing the CRAMSdivision and a few projects have beenactivated.
Your Company carried out processdevelopment/scale-up of various nicheproducts (such as Fondaparinux Sodium,Isosulfan Blue, Iron Sucrose, FosaprepitantDimeglumine etc.), which involve complexchemistry and complicated purificationtechnology. Further, Aurobindo has developedthe processes to commercialize differentCarbapenem antibiotics, such as Meropenem,Imipenem, Doripenem and Ertapenem. Duringthe year under review, your Company has alsoinitiated R&D in the area of nutraceuticals,peptides and biocatalysis.
New technologies and processes were workedout to develop soft gel capsules, infusionbags, OTC ANDA products, OTC monographproducts and suspension based injectables.
Looking ahead, your Company would focus onthe R&D activities in the coming year as well,with special emphasis on the development ofniche products, nutraceuticals, peptides andbiocatalysis and strengthen its CRAMSbusiness.
ENVIRONMENT, HEALTH & SAFETY
During the year under review, your Companyinitiated benchmarking itself with the bestin the industry by conducting safetymanagement evaluation (SME) in partnershipwith one of the best consultants in thechemical industry for safety performance. Theconsultants visited all the API facilities,interacted with senior management personneland representative employee groups, observedthe operations, and provided key insights onareas of improvement. Action is being takenon all their suggested improvements.
Substantial investments were made in the area
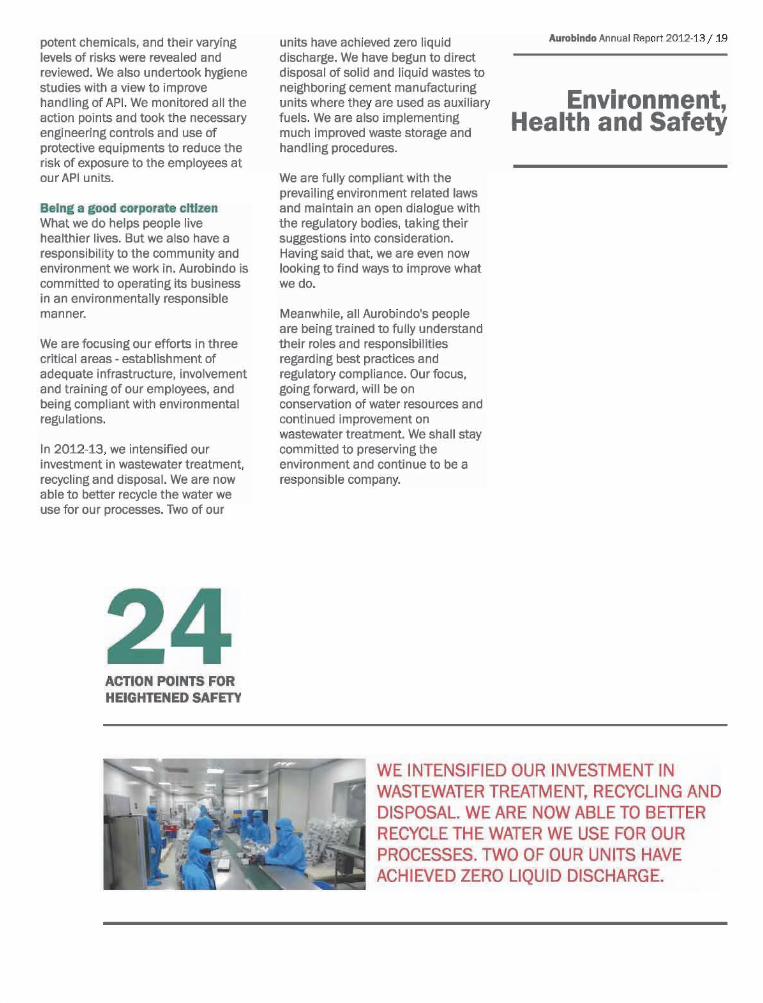
of wastewater treatment, recycling anddisposal. As part of the Company policy andto comply with regulations, disposal ofwastewater generated from manufacturingprocesses of API units to common effluenttreatment plants has been stopped. Two of yourCompany's facilities have even achieved zeroliquid discharge competencies. In 2012-13, itwas decided to sustain the same level ofoperating conditions of treatment systems anddemonstrate consistency in performance oforganization in wastewater treatment.
More importantly, your Company couldsuccessfully demonstrate to the governmenton the commitment of Aurobindo toenvironment management relating to itsactivities through the inspections and auditsconducted by high level technical expertcommittees constituted for the purpose.
SUBSIDIARIES/JOINT VENTURES
As approved by the Board the reports andaccounts of the subsidiary companies are notannexed to this Report. A statement pursuantto Section 212 of the Companies Act, 1956however, is annexed.
Annual accounts of the subsidiary companiesare kept at the Registered Office of theCompany as well as at the Registered Officesof the respective subsidiary companies forscrutiny by any member. Members interestedin obtaining a copy of the accounts of thesubsidiaries may write to the CompanySecretary.
HUMAN RESOURCES
A governing council has been constituted toserve as an apex body in Aurobindo to shapeHR agenda and actions within theorganization with the objective of enhancingbusiness performance and capability of peopleunder a strong value based framework. Thecouncil gives a broad direction and supportinitiation for talent management programs inline with short term and long term businessimperatives/organizational needs.
A new chapter has been added in the area ofstrategic leadership development bypartnering with a leading consulting firm. Thisinitiative aims at providing role clarity,mapping of functional and behavioral skillsand consequently creation of individualdevelopment plan and covers all middle leveland senior level leadership positions acrossAPI and formulations business.
The management has given adequateattention to employee communications to
Book Value
84.0
2011
`
80.4
2012
One equity share of `5 sub-divided into five
equity shares of `1 each with effect from
February 11, 2011 (adjusted)
89.5
2013
Consolidated
As at March 31
Aurobindo Annual Report 2012-13 / 37
share various developments in the businessand at the organizational level. Apart from aperiodic newsletter mode of communication,half-yearly Town Hall meeting is organized atAPI and formulations level to address thegroup at large and communicate variousdevelopments and apprise them of short andlong term dimensions of the business and forbetter interactions. There is a perceptibleimprovement in the corporate performanceand proactive approach to business, byemployees at all levels.
DIRECTORS
In accordance with the provisions of theCompanies Act, 1956, read with the Articlesof Association of the Company, Mr. P. SarathChandra Reddy, Mr. K. Ragunathan andDr. M. Sivakumaran retire by rotation at theensuing Annual General Meeting. All of thembeing eligible offer themselves and seekre-appointment.
Mr. P.V. Ramprasad Reddy relinquished hisresponsibilities as Whole-time Director of theCompany with effect from December 1, 2012and continues to be a Non-Executive Directoron the Board. He has been appointed asManaging Director designated as Chairman inAurobindo Pharma USA Inc., US, the whollyowned subsidiary of the Company with effectfrom December 1, 2012.
Mr. Ravindra Y. Shenoy ceased to be the JointManaging Director of the Company due to hisresignation with effect from November 9,2012.
A brief profile of Mr. P. Sarath Chandra Reddy,Mr. K. Ragunathan and Dr. M. Sivakumaranare provided in the Report on CorporateGovernance forming part of the Annual report.
DIRECTORS' RESPONSIBILITY STATEMENT
Pursuant to the provisions of Section 217(2AA) of the Companies Act, 1956 asamended, the Board of Directors confirm thatin the preparation of the Statement of Profitand Loss for the year ended March 31, 2013and the Balance Sheet as at that date:
i. the applicable accounting standardshave been followed:
ii. selected such accounting policies andapplied them consistently and madejudgements and estimates that arereasonable and prudent so as to give atrue and fair view of the state of affairsof the Company as at the end of thefinancial year and of the profit of theCompany for the year;
iii. proper and sufficient care has beentaken for the maintenance of adequateaccounting records in accordance withthe provisions of the Companies Act,1956 for safeguarding the assets of theCompany and for preventing anddetecting fraud and other irregularities;and,
iv. the annual accounts have been preparedon a going concern basis.
CORPORATE GOVERNANCE
The certificate of a Practicing CompanySecretary Mr. S. Chidambaram with regard tocompliance of conditions of CorporateGovernance as stipulated under Clause 49 ofthe Listing Agreement with the StockExchanges in India is annexed.
AUDITORS' & AUDITORS' REPORT
The statutory auditors' report is annexed tothis report.The notes on financial statementsreferred to in the Auditors' Report are selfexplanatory and do not call for any furthercomments.
M/s. S.R. Batliboi & Associates LLP, CharteredAccountants retire at the ensuing AnnualGeneral Meeting and being eligible, offerthemselves for re-appointment as StatutoryAuditors of the Company for the financial year2013-14.
COST AUDITORS
M/s. Sagar & Associates, Cost Accountants,have been reappointed as Cost Auditors ofthe Company with the consent of the CentralGovernment of India to conduct cost audit ofthe Company for the year 2012-13. The duedate for filing Cost Audit Report of theCompany in XBRL format for 2011-12 wasFebruary 28, 2013 and the same was filed withthe Ministry of Corporate Affairs on February27, 2013.
CONSERVATION OF ENERGY, TECHNOLOGYABSORPTION ETC.
Information in accordance with the provisionsof Section 217 (1) (e) of the Companies Act,1956 read with the Companies (Disclosure ofParticulars in the Report of Board of Directors)Rules, 1988 is given in Annexure I formingpart of this Report.
FIXED DEPOSITS
Your Company has not accepted any fixeddeposits during the year under review. As suchno amount of principal or interest wasoutstanding on the date of the Balance Sheet.
INDUSTRIAL RELATIONS
Industrial relations at all units of the Companyhave been harmonious and cordial.The employees stand motivated and haveshown initiative in improving the Company'sperformance.
PARTICULARS OF EMPLOYEES
The particulars of employees as required tobe disclosed in accordance with the provisionsof Section 217 (2A) of the Companies Act,1956 and the Companies (Particulars ofEmployees) Rules, 1975 as amended areannexed to the Directors' Report. However,as per the provisions of Section 219 (1)(b)(iv)of the Companies Act, 1956, the Report andAccounts are being sent to all the membersof the Company excluding the aforesaidinformation. Any member interested inobtaining such particulars may write to theCompany Secretary.
EMPLOYEE STOCK OPTION SCHEME
The Members at the Annual General Meetingof the Company held on September 18, 2006approved formulation of Employee StockOption Scheme-2006 (ESOP 2006) for theeligible employees and Directors of theCompany and its subsidiaries.
Under ESOP 2006 Scheme 1,715,500 optionswere granted and 90,000 equity shares of `1each were issued and allotted during the year.
Details of the options granted up toMarch 31, 2013 are set out in the annexure tothis Report, as required under Clause 12 ofthe Securities and Exchange Board of India(Employee Stock Options Scheme and EmployeeStock Purchase Scheme) Guidelines, 1999.
ACKNOWLEDGEMENTS
Your Company is grateful to the customersand business associates for their support andencouragement. Your Board is appreciativeof the passion, dedication and commitmentdemonstrated on the job by all the employeesand is confident that they shall continue tounderwrite the Company's growth. YourDirectors wish to place on record theirgratitude to the valuable clientele, Union andstate governments, banks, financialinstitutions, and shareholders and seek theircontinuing support, guidance, and assistancein all our future endeavors.
For and on behalf of the Board
Hyderabad K. RAGUNATHANMay 30, 2013 Chairman
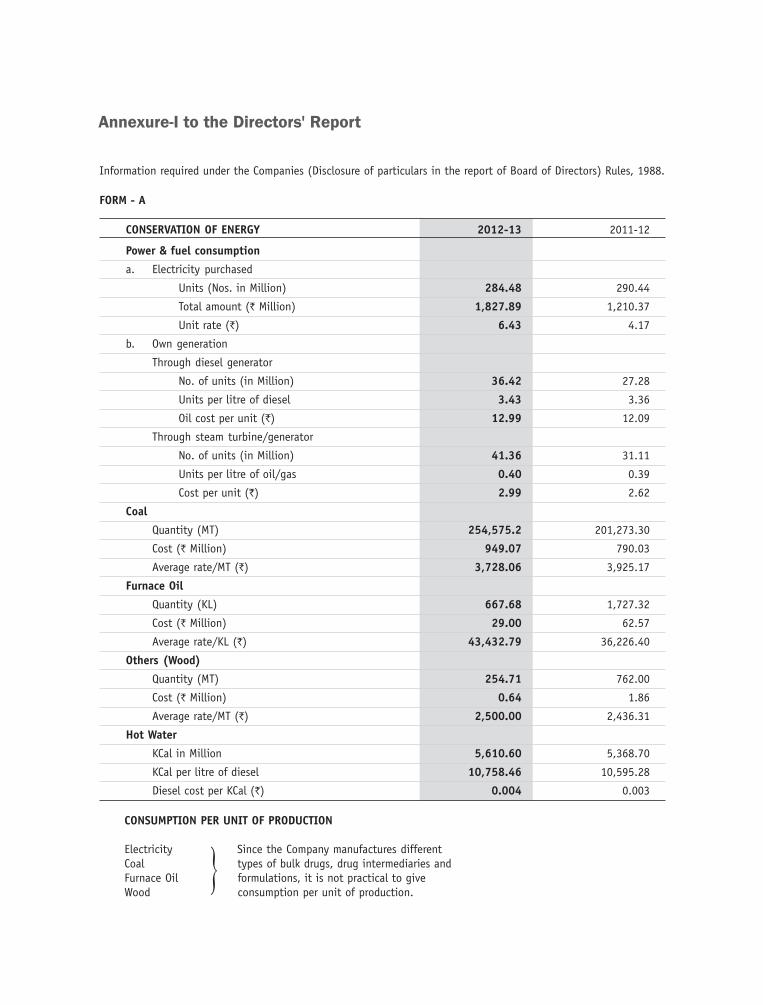
Annexure-I to the Directors' Report
Information required under the Companies (Disclosure of particulars in the report of Board of Directors) Rules, 1988.
FORM - A
CONSERVATION OF ENERGY 2012-13 2011-12
Power & fuel consumption
a. Electricity purchased
Units (Nos. in Million) 284.48 290.44
Total amount (` Million) 1,827.89 1,210.37
Unit rate (`) 6.43 4.17
b. Own generation
Through diesel generator
No. of units (in Million) 36.42 27.28
Units per litre of diesel 3.43 3.36
Oil cost per unit (`) 12.99 12.09
Through steam turbine/generator
No. of units (in Million) 41.36 31.11
Units per litre of oil/gas 0.40 0.39
Cost per unit (`) 2.99 2.62
Coal
Quantity (MT) 254,575.2 201,273.30
Cost (` Million) 949.07 790.03
Average rate/MT (`) 3,728.06 3,925.17
Furnace Oil
Quantity (KL) 667.68 1,727.32
Cost (` Million) 29.00 62.57
Average rate/KL (`) 43,432.79 36,226.40
Others (Wood)
Quantity (MT) 254.71 762.00
Cost (` Million) 0.64 1.86
Average rate/MT (`) 2,500.00 2,436.31
Hot Water
KCal in Million 5,610.60 5,368.70
KCal per litre of diesel 10,758.46 10,595.28
Diesel cost per KCal (`) 0.004 0.003
CONSUMPTION PER UNIT OF PRODUCTION
Electricity Since the Company manufactures differentCoal types of bulk drugs, drug intermediaries andFurnace Oil formulations, it is not practical to giveWood consumption per unit of production.
}
Aurobindo Annual Report 2012-13 / 39
` Million
` Million
FORM - B
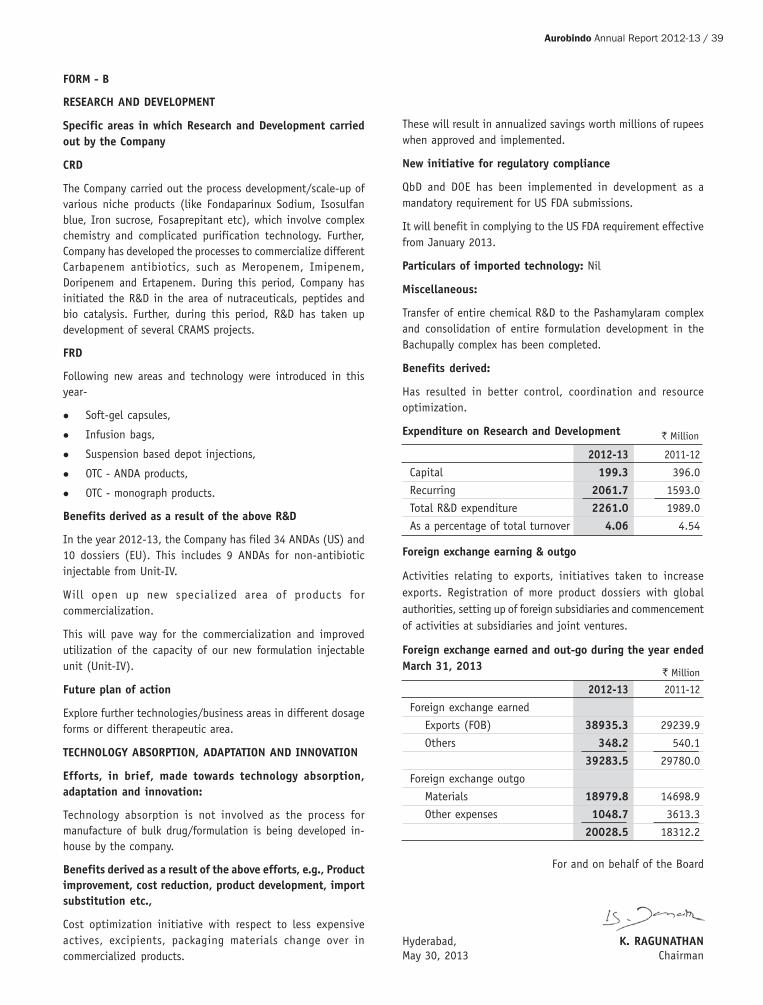
RESEARCH AND DEVELOPMENT
Specific areas in which Research and Development carriedout by the Company
CRD
The Company carried out the process development/scale-up ofvarious niche products (like Fondaparinux Sodium, Isosulfanblue, Iron sucrose, Fosaprepitant etc), which involve complexchemistry and complicated purification technology. Further,Company has developed the processes to commercialize differentCarbapenem antibiotics, such as Meropenem, Imipenem,Doripenem and Ertapenem. During this period, Company hasinitiated the R&D in the area of nutraceuticals, peptides andbio catalysis. Further, during this period, R&D has taken updevelopment of several CRAMS projects.
FRD
Following new areas and technology were introduced in thisyear-
� Soft-gel capsules,
� Infusion bags,
� Suspension based depot injections,
� OTC - ANDA products,
� OTC - monograph products.
Benefits derived as a result of the above R&D
In the year 2012-13, the Company has filed 34 ANDAs (US) and10 dossiers (EU). This includes 9 ANDAs for non-antibioticinjectable from Unit-IV.
Will open up new specialized area of products forcommercialization.
This will pave way for the commercialization and improvedutilization of the capacity of our new formulation injectableunit (Unit-IV).
Future plan of action
Explore further technologies/business areas in different dosageforms or different therapeutic area.
TECHNOLOGY ABSORPTION, ADAPTATION AND INNOVATION
Efforts, in brief, made towards technology absorption,adaptation and innovation:
Technology absorption is not involved as the process formanufacture of bulk drug/formulation is being developed in-house by the company.
Benefits derived as a result of the above efforts, e.g., Productimprovement, cost reduction, product development, importsubstitution etc.,
Cost optimization initiative with respect to less expensiveactives, excipients, packaging materials change over incommercialized products.
These will result in annualized savings worth millions of rupeeswhen approved and implemented.
New initiative for regulatory compliance
QbD and DOE has been implemented in development as amandatory requirement for US FDA submissions.
It will benefit in complying to the US FDA requirement effectivefrom January 2013.
Particulars of imported technology: Nil
Miscellaneous:
Transfer of entire chemical R&D to the Pashamylaram complexand consolidation of entire formulation development in theBachupally complex has been completed.
Benefits derived:
Has resulted in better control, coordination and resourceoptimization.
Expenditure on Research and Development
2012-13 2011-12
Capital 199.3 396.0
Recurring 2061.7 1593.0
Total R&D expenditure 2261.0 1989.0
As a percentage of total turnover 4.06 4.54
Foreign exchange earning & outgo
Activities relating to exports, initiatives taken to increaseexports. Registration of more product dossiers with globalauthorities, setting up of foreign subsidiaries and commencementof activities at subsidiaries and joint ventures.
Foreign exchange earned and out-go during the year endedMarch 31, 2013
2012-13 2011-12
Foreign exchange earned
Exports (FOB) 38935.3 29239.9
Others 348.2 540.1
39283.5 29780.0
Foreign exchange outgo
Materials 18979.8 14698.9
Other expenses 1048.7 3613.3
20028.5 18312.2
For and on behalf of the Board
Hyderabad, K. RAGUNATHANMay 30, 2013 Chairman

DETAILS OF STOCK OPTIONS PURSUANT TO SEBI GUIDELINES ON STOCK OPTIONS
DESCRIPTION PLAN 2006
Number of Options available under the Scheme 39,95,250Total number of Options granted 32,10,500Options granted during the year 17,15,500Pricing formula The market price of the share quoted on a day prior to the
grant date quoted on the BSE or National Stock Exchange,wherever volumes traded are higher.
Options vested during FY 2012-13 1,20,500Options exercised during FY 2012-13 90,000The total number of shares arising as a result of exercise of options 90,000Options lapsed during financial year 2012-13 which are subject to reissue 4,16,500Variation of terms of Options NilMoney realized by exercise of Options during 2011-12 (`) 82,44,000Grant price (Face Value of `1) Prevailing on grant date
October 30, 2006 `120.70July 31, 2007 `132.35October 31, 2007 `114.50December 16, 2011 `91.60June 19, 2012 `106.05January 9, 2013 `200.70January 28, 2013 `187.40
Total number of Options in force as on March 31, 2013(Cumulative) 24,64,000
Grant details of members of senior management team Name of employee No. of optionsMr. Arvind Vasudeva 500,000Ms. Gita Rao 4,500Mr. U. Udaya Sankar 4,500Mr. Sharma Hemant Kumar 3,750Mr. G.P. Prasad 3,750Mr. V. Naga Prasad 4,500Mr. A. T. Bapuji 4,500Mr. Aminul Islam 3,750Mr. Ram Biyani 5,000Mr. C. V. Narayana Rao 5,000Mr. Jacob Joseph 5,000Mr. Sudhir B. Singhi 14,250Mr. A. Mohan Rami Reddy 6,250
Number of other employees who receive a grantin any one year of options amounting to 5% or moreof options granted during that year Mr. Arvind Vasudeva 500,000
Number of employees who were granted Options,during any one year, equal to or exceeding 1% ofthe issued capital (excluding outstanding warrantsand conversions) of the Company at the time of grant Nil
Diluted Earnings per Share (EPS) pursuant to issueof shares on exercise of Option calculated in accordancewith Accounting Standard AS-20
(Contd..)
Annexure-II to the Directors' Report

Aurobindo Annual Report 2012-13 / 41
DESCRIPTION PLAN 2006
i. Method of calculation of employee compensation The Company has calculated the employee compensationcost cost using the intrinsic value of the stock options.
The grant price is the market price prevailing on the grantdate. Therefore, there will be no compensation cost as perIntrinsic Value Basis.
ii. Difference between the employee compensationcost so computed at (i) above and the employeecompensation cost that shall have been recognizedif it had used the fair value of the options (`) 28,96,304
iii. The impact of the difference on profits and
on EPS of the Company (`) PAT 495,99,49,202
Less: Additional cost
(`) based on Fair Value 28,96,304
(`) Adjusted PAT 495,70,52,898
(`) Adjusted EPS 17.03
iv. Weighted average exercise price and fair value ofstock OptionsStock Options granted on (during the year) 3,00,000 options on June 19, 2012
5,00,000 options on January 9, 20139,15,500 options on January 28, 2013
Weighted Average Exercise Price (`) 139.80Weighted average Fair Value (`) 166.21Closing market price at NSE on the date of grant (`) On October 30, 2006 - `120.69
On July 31, 2007 - `132.35On October 31, 2007 - `114.50On December 16, 2011 - `91.60On June 19, 2012 - `106.05On January 9, 2013 - `200.70On January 28, 2013 - `187.40
v. Description of the method and significant The Black - Scholes option-pricing model was developedassumptions used during the year to estimate for estimating fair value of traded options that have nothe fair value of the Options, including the vesting restrictions and are fully transferable. Since,following weighted average information option-pricing models require use of substantive
assumptions, changes therein can materially affect thefair value of options. The option-pricing models do notnecessarily provide a reliable measure of the fair value ofoptions.
vi. The main assumptions used in the Black - Scholesoption-pricing model during the year were as follows:
Risk-free interest rate (%) 8
Expected Life of options from the date(s) of grant (Years) 6
Expected volatility (%) 0.31
Dividend yield 1.33 (133%)
Note: The Equity Share of `5 each was split into five equity shares of `1 each with effect from February 11, 2011. The number of shares,number of options, grant price, weighted average exercise price, weighted average fair value and closing market price at NSE mentionedherein is taken after giving effect to the split.
For and on behalf of the Board
Hyderabad K. RAGUNATHANMay 30, 2013 Chairman

Company's Philosophy on Corporate Governance
Aurobindo has always attached great importance to good and
responsible corporate governance. The Company belongs to all the
stakeholders and the corporate objective is to maximize shareholder
value ethically and legally. Hence, efforts are made to raise
transparency, trust and confidence of stakeholders in the way the
Company is run. The team at Aurobindo operates as a trustee on
behalf of every shareholder - large or small.
The Company will continue to strive to be a wealth creator to
meet stakeholder expectations and be a responsible citizen in its
societal commitments. In the achievement of its goals, the Company
utilizes its resources with accountability and professionalism to
meet the needs of customers and deliver on their expectations;
meet the commitments with vendors, partners, employees,governments and the community.
Board of Directors
The Board of Directors guides, directs and oversees the managementand protects long term interests of shareholders, employees andthe society at large. The Board also ensures compliance of theapplicable provisions and code of ethical standards wherever theCompany and its subsidiaries are present.
Size and Composition of the Board
As on March 31, 2013 the Board consists of ten Directors. Four ofthem are Executive and six are Non-Executive Directors. YourCompany has taken all necessary steps to strengthen the Boardwith optimum combination of executive and non-executive/independent directors.
Composition of Board of Directors as on March 31, 2013
Number of Attendance Number of Number ofBoard at the last directorships committee
Name Category Meetings AGM held on in other in positions heldattended August 7, companies other companies
2012 Chairman Member
Mr. K. Ragunathan Non-Executive Independent 5 Yes – – – –
Mr. K. Nithyananda Reddy Promoter and Executive 5 Yes 5 – – 13,762,350
Mr. N. Govindarajan Executive 4 Yes 2 – – 50,000
Dr. M. Sivakumaran Executive 5 Yes 2 – – 7,345,680
Mr. M. Madan Mohan Reddy Executive 5 Yes 1 – – 1,005
Mr. P.V. Ramprasad Reddy Promoter and Non-Executive 3 No – – – 19,481,440
Mr. P. Sarath Chandra Reddy Non-Executive Non-Independent 4 No 8 – – 16,390
Mr. M. Sitarama Murthy Non-Executive Independent 4 Yes 2 1 3 –
Dr. D. Rajagopala Reddy Non-Executive Independent 5 Yes – – – –Dr. C. Channa Reddy Non-Executive Independent 4 Yes 1 – – –Note: a. Other directorships are exclusive of Indian private limited companies and foreign companies.
b. Mr. N. Govindarajan was appointed as Managing Director of the Company with effect from June 1, 2012. He was Chief Executive Officer of the Company prior toappointment as Managing Director.
c. Mr. Ravindra Y. Shenoy was appointed as Joint Managing Director of the Company with effect from June 1, 2012 and resigned with effect from November 9, 2012. Duringhis tenure, he attended one Board Meeting.
d. Dr. P.L. Sanjeev Reddy retired at the Annual General Meeting held on August 7, 2012 and has attended two Board Meetings held till that date.e. Mr. P.V. Ramprasad Reddy, was Whole-time Director of the Company till November 30, 2012 and continues to be on the Board as a Non-Executive Director.
No. ofshares of`1 each
held in theCompany
Report on Corporate Governance

Aurobindo Annual Report 2012-13 / 43
During the year, five Board Meetings were held on the following dates:
Date of meeting Board Strength No. of Directors Present
May 29, 2012 10 8
August 7, 2012 12 10
August 25, 2012 11 10
November 9, 2012 10 10
February 7, 2013 10 9
Details of Directors proposed for appointment/re-appointment:
Mr. P. Sarath Chandra Reddy, Mr. K. Ragunathan andDr. M. Sivakumaran retire by rotation and being eligible,seek re-appointment.
Mr. P. Sarath Chandra Reddy, aged 28 years, is a graduatein Business Administration. He is a second generationentrepreneur experienced in general management and hasexpertise in project executions. He is presently Whole-timeDirector of Axis Clinicals Limited and a Director in TridentChemphar Limited, Axis Clinicals India Limited, SarasInfrastructure Projects Limited, Rosa Avenues India PrivateLimited and PVR Holdings Private Limited. He is also adirector in subsidiary companies of Aurobindo PharmaLimited viz., APL Health Care Limited, APL Research CentreLimited, Auro Peptides Limited, Aurobindo AntibioticsLimited and Auronext Pharma Private Limited. He holds16,390 shares in the Company.
Mr. K. Ragunathan, aged 50 years, is a Bachelor of Commercefrom Madras University, and a Member of the Institute ofChartered Accountants of India. He holds a Post Graduatediploma in computerized financial management andspecialized in ERP design and development and is a CertifiedManagement Consultant.
He is one of the leading management consultants, possessingexpertise in management consulting, enterprise softwareprocesses, business transaction structuring, corporate lawprocedures and compliances, capital market and depositoryoperation related consulting and the like.
He has over 28 years of experience in consulting, havingstarted as a consultant at a very young age of 19 years.During the course of his career, he has been exposed tovarious business transaction structuring and intricacies inbusiness negotiation. He has contributed articles on variousissues concerning business transactions and legalcompliances thereto in leading Indian corporate lawmagazines.
He was awarded as a topper in the examination at all Indialevel for the 'CMC' certification course during the year 2000.
He was elected as the chairman of the Hyderabad chapterof International Fiscal Association.
He is a director of Sathguru Management Consultants PrivateLimited and a Director of DFK International, a top 10international association of independent accounting firmsand business advisers. He does not hold any shares in theCompany.
Dr. M. Sivakumaran, aged 70 years, is presently a Whole-time Director of the Company. He holds a Master's Degree inScience and has been awarded a PhD in Organic Chemistry.He has about 40 years of experience in the pharmaceuticalindustry. He is responsible for the technological evolutionof the Company. Dr. M. Sivakumaran looks after researchand development, generic product development and totalquality management. He is a Director on the Board of APLResearch Centre Limited and APL Healthcare Limited, thesubsidiaries of Company. He holds 7,345,680 Equity Sharesof Re.1 each in the Company.
Audit Committee
The scope and function of the Audit Committee is to regularlyreview the internal control, systems and procedures,accounting policies and other matters that protect theinterest of the stakeholders, ensure compliance with thelaws of the land, and monitor with a view to provide effectivesupervision of the management's process, ensure accurate,timely and proper disclosures, transparency, integrity andquality of financial reporting. The composition, procedures,powers and role/functions of the Audit Committeeconstituted by the Company comply with the requirementsof Clause 49 of the Listing Agreement and provisions of theCompanies Act, 1956.
Role of Audit Committee
The Audit Committee's role is briefly described below:
oversee the Company's financial reporting process anddisclosure of financial information to ensure that thefinancial statements are fair, sufficient and credible;
review with management the quarterly and annual financialstatement before submission to the Board for approval;
review with the management, the statement of uses/application of funds raised through an issue viz public issue,rights issue, preferential issue, etc;
recommend the appointment, re-appointment and ifrequired, replacement/removal of statutory auditor, fixationof audit fee and approval for payment of any other services;
deliberate with statutory auditors before the auditcommences on the nature and scope of audit, as well ashaving post-audit discussion to ascertain any area ofconcern;
review the qualifications, if any, in the draft audit report;
review with the management, performance of statutory andinternal auditors, and adequacy of the internal controlsystems;
assess the adequacy of internal audit function;
determine and resolve with internal auditors any significantfindings and follow-up thereon;
review the findings of investigation by the internal auditorsin matters where there is suspected fraud or irregularity, ora failure of internal control systems of a material nature,and report such matters to the Board;
review the financial statements of material unlistedsubsidiary companies, in particular, the investments if anymade by the unlisted subsidiary companies;
appraise the Company's financial and risk managementpolicies;
analyze the reasons or substantial default, if any, in thepayment to depositors, debenture holders, shareholders (incase of non-payment of declared dividends) and creditors;
approve appointment of CFO after assessing thequalifications, experience & background, etc. of thecandidate; and,
review the functioning the whistle blower mechanism.
Composition and other details of Audit Committee
The Audit Committee comprises of three Non-ExecutiveDirectors, all of them being Independent Directors. The headsof finance & accounts, internal auditors and therepresentative of the statutory auditors are the permanentinvitees to the meetings of the Audit Committee. TheCompany Secretary is the Secretary to the Committee. Therepresentative of the Cost Auditors is also invited to themeetings of Audit Committee whenever matters relating tocost audit are considered.
Mr. M. Sitarama Murthy, Chairman of the Committee, is aNon-Executive Independent Director having expertise inaccounting and financial management.
During the year, the Audit Committee met four times onMay 29, 2012; August 7, 2012; November 9, 2012 andFebruary 7, 2013.
Name of the Committee Member No. of Meetings Attendance
Mr. M. Sitarama Murthy 4 3
Mr. K. Ragunathan 4 4
Dr. D. Rajagopala Reddy 4 4
The attendance at the Audit Committee meetings during the financial year 2012-13 is as under:
Compensation/Remuneration Committee
Role of the Compensation/ Remuneration Committee
The Compensation/Remuneration Committee of the Companyrecommends the compensation package and other terms andconditions of Executive Directors, grant of options to eligibleemployees and Directors and administers the Employee StockOption Scheme from time to time.
The remuneration of Executive Chairman, Managing Directorand other Whole-time Directors is recommended by the
Compensation Committee and the remuneration is paid based on the
resolutions approved by the members at their meetings and such
other authorities as may be required. This Committee reviews annually
the performance of all Executive Directors.
Composition and other details of Compensation/RemunerationCommittee
The composition of the Compensation/Remuneration Committeecomprises of three Non-Executive Directors. The Chairman of theCommittee is a Non-Executive Independent Director.

Aurobindo Annual Report 2012-13 / 45
`
During the year, the Compensation Committee met three times on May 29, 2012; August 25, 2012 and January 9, 2013.
Name of the Committee Member No. of Meetings Attendance
Dr. D. Rajagopala Reddy 3 3
Mr. M. Sitarama Murthy 3 2
Dr. C. Channa Reddy 3 –
Note:a. Dr. D. Rajagopala Reddy is the Chairman of the Committee.b. Dr. C. Channa Reddy was appointed as a member of the Committee with effect from November 9, 2012.c. Dr. P. L. Sanjeev Reddy ceased to be a member of the Committee consequent to his retirement with effect from August 7, 2012 and attended one
meeting held up to that date.d Mr. P. Sarath Chandra Reddy has resigned from the committee with effect from November 9, 2012 and attended both meetings held up to that date.
Details of remuneration paid to Directors during the financial year 2012-13
a. Executive Directors
Name Salary Perquisites Contribution Totalto P.F.
Mr. P.V. Ramprasad Reddy* 3,000,000 3,612,500 6,240 6,618,740
Mr. K. Nithyananda Reddy 4,725,000 4,360,244 9,360 9,094,604
Dr. M. Sivakumaran 4,725,000 4,366,600 9,360 9,100,960
Mr. M. Madan Mohan Reddy 4,725,000 4,376,960 9,360 9,111,320
Mr. N. Govindarajan* 7,929,750 7,844,780 7,800 15,782,330
Mr. Ravindra Y. Shenoy* 1,718,113 1,866,976 1,686 3,586,775
TOTAL 26,822,863 26,428,060 43,806 53,294,729
* part of the year
Note: Mr. N. Govindarajan, Managing Director was paid `25,000,000 as commission for the year 2012-13, in addition to the above remuneration.
b. Non-Executive Directors
Sitting fee of `20,000 is being paid for attending each meeting of the Board of Directors and `10,000 for each meeting ofthe Committees of Board of Directors. During the year, the sitting fees paid was as follows:
Name Sitting fees
Dr. P.L. Sanjeev Reddy 50,000
Mr. M. Sitarama Murthy 130,000
Mr. P. Sarath Chandra Reddy 100,000
Mr. K. Ragunathan 140,000
Dr. D. Rajagopala Reddy 170,000
Dr. C. Channa Reddy 80,000
Mr. P.V. Ramprasad Reddy –
Shareholders/Investors' Grievance CommitteeThe main function of the Committee is to review and re-dress shareholders/investors' grievance pertaining to:
a. Transfer, transmission, split and consolidation of share holding of investors;
b. Dematerialization/rematerialization of shares;
c. Non-receipt of dividends and other corporate benefits;
d. Replacement of lost/mutilated/stolen share certificates;
e. Non-receipt of annual reports; and
f. Registration of change of addresses, etc.
Constitution of the Committee
Mr. P. Sarath Chandra Reddy, Chairman
Mr. K. Nithyananda Reddy, Member
Mr. M. Madan Mohan Reddy, Member
Dr. D. Rajagopala Reddy, Member
`
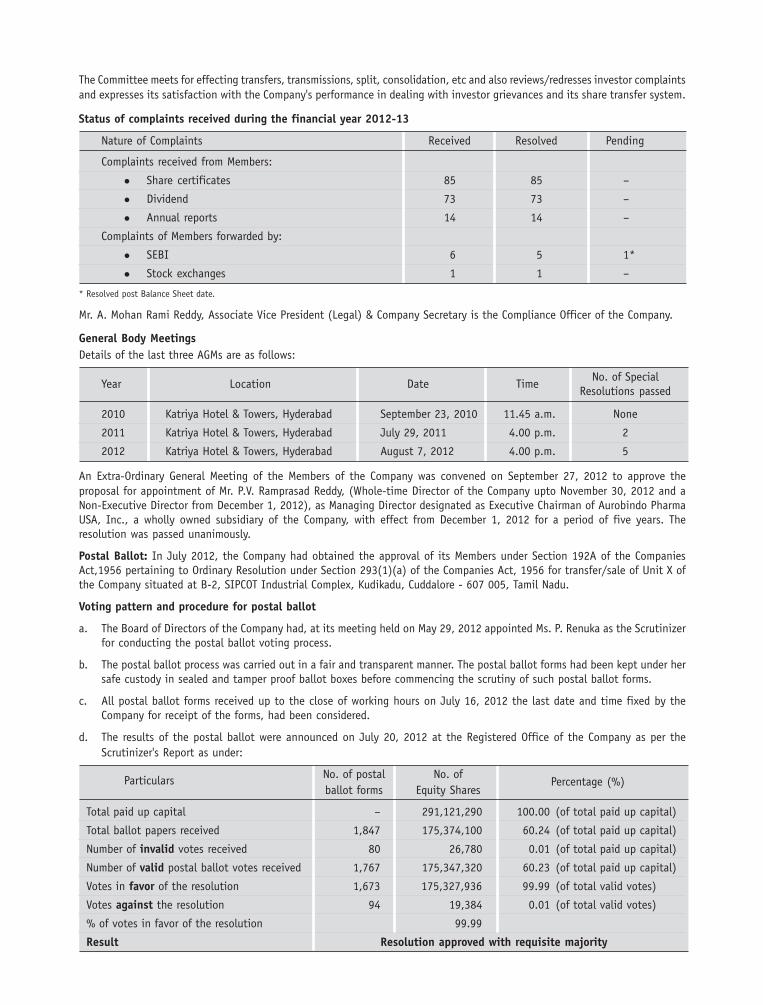
The Committee meets for effecting transfers, transmissions, split, consolidation, etc and also reviews/redresses investor complaintsand expresses its satisfaction with the Company's performance in dealing with investor grievances and its share transfer system.
Status of complaints received during the financial year 2012-13
Nature of Complaints Received Resolved Pending
Complaints received from Members:
� Share certificates 85 85 –
� Dividend 73 73 –
� Annual reports 14 14 –
Complaints of Members forwarded by:
� SEBI 6 5 1*
� Stock exchanges 1 1 –
* Resolved post Balance Sheet date.
Mr. A. Mohan Rami Reddy, Associate Vice President (Legal) & Company Secretary is the Compliance Officer of the Company.
General Body MeetingsDetails of the last three AGMs are as follows:
Year Location Date TimeNo. of Special
Resolutions passed
2010 Katriya Hotel & Towers, Hyderabad September 23, 2010 11.45 a.m. None
2011 Katriya Hotel & Towers, Hyderabad July 29, 2011 4.00 p.m. 2
2012 Katriya Hotel & Towers, Hyderabad August 7, 2012 4.00 p.m. 5
An Extra-Ordinary General Meeting of the Members of the Company was convened on September 27, 2012 to approve theproposal for appointment of Mr. P.V. Ramprasad Reddy, (Whole-time Director of the Company upto November 30, 2012 and aNon-Executive Director from December 1, 2012), as Managing Director designated as Executive Chairman of Aurobindo PharmaUSA, Inc., a wholly owned subsidiary of the Company, with effect from December 1, 2012 for a period of five years. Theresolution was passed unanimously.
Postal Ballot: In July 2012, the Company had obtained the approval of its Members under Section 192A of the CompaniesAct,1956 pertaining to Ordinary Resolution under Section 293(1)(a) of the Companies Act, 1956 for transfer/sale of Unit X ofthe Company situated at B-2, SIPCOT Industrial Complex, Kudikadu, Cuddalore - 607 005, Tamil Nadu.
Voting pattern and procedure for postal ballot
a. The Board of Directors of the Company had, at its meeting held on May 29, 2012 appointed Ms. P. Renuka as the Scrutinizerfor conducting the postal ballot voting process.
b. The postal ballot process was carried out in a fair and transparent manner. The postal ballot forms had been kept under hersafe custody in sealed and tamper proof ballot boxes before commencing the scrutiny of such postal ballot forms.
c. All postal ballot forms received up to the close of working hours on July 16, 2012 the last date and time fixed by theCompany for receipt of the forms, had been considered.
d. The results of the postal ballot were announced on July 20, 2012 at the Registered Office of the Company as per theScrutinizer's Report as under:
Particulars No. of postal No. ofPercentage (%)
ballot forms Equity Shares
Total paid up capital – 291,121,290 100.00 (of total paid up capital)
Total ballot papers received 1,847 175,374,100 60.24 (of total paid up capital)
Number of invalid votes received 80 26,780 0.01 (of total paid up capital)
Number of valid postal ballot votes received 1,767 175,347,320 60.23 (of total paid up capital)
Votes in favor of the resolution 1,673 175,327,936 99.99 (of total valid votes)
Votes against the resolution 94 19,384 0.01 (of total valid votes)
% of votes in favor of the resolution 99.99
Result Resolution approved with requisite majority

Aurobindo Annual Report 2012-13 / 47
Disclosures
CEO and CFO Certification
The Managing Director and Chief Financial Officer have
submitted a certificate to the Board as contemplated under
Clause 49 of the Listing Agreement.
Related Party Transactions
No transaction of material nature has been entered into by
the Company with its Directors/management and their
relatives, etc. that may have a potential conflict with the
interests of the Company. The Register of Contracts
containing transactions, in which Directors are interested,
is placed before the Board regularly.
Transactions with related parties are disclosed in the
schedule on Notes to Accounts in the Annual Report.
Details of Non-Compliance and Penalties
There were no instances of non-compliance or penalties/
strictures by the stock exchanges/SEBI/statutory authorities
on any matter related to capital markets during the last
three years.
Code of Conduct
The Board of Directors has laid down a 'Code of Conduct'
(Code) for all the Board Members and the senior management
of the Company and this Code is posted on the website of
the Company. Annual declaration is obtained from every
person covered by the Code.
The Company has established a mechanism for employees
to report to the management, concerns about unethical
behavior, actual or suspected fraud or violation of the
Company's code of conduct or ethics policy. The employees
have been appropriately communicated within the
organization about the mechanism and have been provided
direct access to the Chairman of the Audit Committee. The
mechanism also lays emphasis on making enquiry into
whistle blower complaint received by the Company.
Risk Management
The Company recognizes that it faces various financial,
market, technical and operational risks including regulatory
and compliance risks and needs to take appropriate steps
to minimize such risks. The Board regularly discusses the
significant business risks identified by the management and
the mitigation process being taken up. During 2013-14,
the Company will be creating a separate Risk Management
Department for identifying, measuring and monitoring the
various risks the Company is exposed to and initiate
appropriate mitigating measures, on an ongoing basis.
Details of compliance with mandatory requirements andadoption of the non-mandatory requirements
The Company has complied with the mandatory requirementsof Clause 49 and is in the process of implementation ofnon-mandatory requirements.
Means of Communication
The Company has a website www.aurobindo.com. Thequarterly and half yearly financial statements are not sent tothe individual households of the Members; however, the sameare placed on the Company's website for the information ofMembers and general public and also published in leadingnewspapers in English and Telugu (Regional language).Further, all material information which has some bearing onthe operations of the Company is sent to the stock exchangesand also placed on the Company's website.
The Management Discussion and Analysis forms part of thisReport and is provided separately in the Annual Report.
GENERAL SHAREHOLDERS INFORMATION
26th Annual General Meeting
As mentioned in the Notice, the 26th Annual General Meetingof the Company will be held on Wednesday, August 7, 2013at 4.00 p.m. at Taj Deccan, Road No.1, Banjara Hills,Hyderabad - 500034.
Quarterly Results
The financial year of the Company is April to March.
Financial calendar (tentative and subject to change) of thefinancial year 2013-14 is as follows:
UnauditedFinancial Results for
On or before
1st Quarter August 14, 2013
2nd Quarter November 14, 2013
3rd Quarter February 14, 2014
4th Quarter May 30, 2014
Book Closure
From August 1, 2013 to August 7, 2013 (both days inclusive)for the purpose of Annual General Meeting and payment ofdividend (subject to approval of Members).
Payment of Dividend
The Board approved interim dividend of 100% i.e. `1 pershare of face value of `1 at its meeting held on February 7,2013 for the financial year 2012-13, which was paid to theeligible shareholders on February 27, 2013. Subject to theapproval of Members, the final dividend of 50% i.e. `0.50, ifdeclared, will be paid within 30 days from the date of theAnnual General Meeting to the eligible shareholders.

Listing Details
The Company's shares are at present listed on the following stock exchanges and the listing fees for the financial
year 2013-14 has been paid to both the stock exchanges:
Stock Exchanges Stock Code
BSE Limited (BSE) 524804
Phiroze Jeejeebhoy Towers
25th Floor, Dalal Street
Mumbai - 400 001
National Stock Exchange of India Limited (NSE) AUROPHARMAExchange Plaza, Bandra-Kurla ComplexBandra (East), Mumbai - 400 051
ISIN No. : INE406A01037
Monthly high & low quotations and volume of shares traded on NSE during the year
NSE (`) S & P CNX NiftyMonth High Low Close Volume High Low
2012 April 141.40 109.00 114.05 31,713,528 5378.75 5154.30
May 134.30 100.50 108.85 28,667,618 5279.60 4789.00
June 111.90 103.65 110.00 18,723,620 5286.25 4770.35
July 118.25 100.10 109.00 15,004,921 5348.55 5032.40
August 116.20 101.30 110.30 24,987,896 5448.60 5164.65
September 144.90 111.15 142.00 44,665,832 5735.15 5215.70
October 164.80 136.10 158.45 38,956,132 5815.35 4888.20
November 189.90 158.90 188.00 55,261,469 5885.25 5548.35
December 201.40 181.75 189.40 43,370,039 5965.15 5823.15
2013 January 204.90 178.70 187.40 39,484,810 6111.80 5935.20
February 195.90 157.90 160.90 44,470,590 6052.95 5671.90
March 170.40 127.15 145.95 39,479,514 5971.20 5604.85
Monthly high & low quotations and volume of shares traded on BSE during the year
BSE (`) BSE SensexMonth High Low Close Volume High Low
2012 April 141.15 102.25 130.95 5,304,660 17664.10 17010.16
May 132.50 100.75 109.15 3,301,707 17432.33 15809.71
June 111.75 103.00 109.95 2,274,135 17448.48 15748.98
July 118.20 100.35 108.60 2,466,779 17631.19 16598.48
August 117.45 99.65 110.70 4,746,968 17972.54 17026.97
September 144.75 111.15 141.70 8,631,155 18869.94 17250.80
October 164.75 136.15 158.30 7,070,855 19137.29 18393.42
November 189.85 159.00 188.05 8,721,672 19372.70 18255.69
December 201.40 181.10 189.30 5,846,567 19612.18 19149.03
2013 January 204.90 178.80 187.65 5,336,427 20203.66 19508.93
February 195.80 158.15 161.50 7,211,700 19966.69 18793.97March 170.30 127.15 145.90 4,869,332 19754.66 18568.43
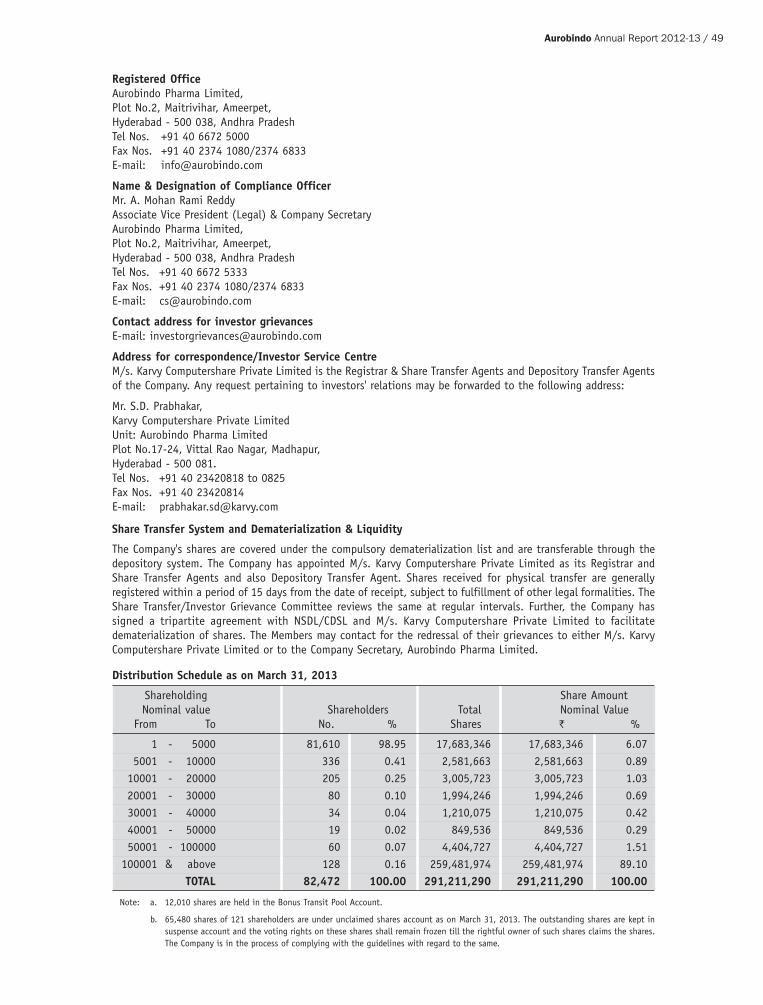
Aurobindo Annual Report 2012-13 / 49
Registered OfficeAurobindo Pharma Limited,Plot No.2, Maitrivihar, Ameerpet,Hyderabad - 500 038, Andhra PradeshTel Nos. +91 40 6672 5000Fax Nos. +91 40 2374 1080/2374 6833E-mail: [email protected]
Name & Designation of Compliance OfficerMr. A. Mohan Rami ReddyAssociate Vice President (Legal) & Company SecretaryAurobindo Pharma Limited,Plot No.2, Maitrivihar, Ameerpet,Hyderabad - 500 038, Andhra PradeshTel Nos. +91 40 6672 5333Fax Nos. +91 40 2374 1080/2374 6833E-mail: [email protected]
Contact address for investor grievancesE-mail: [email protected]
Address for correspondence/Investor Service CentreM/s. Karvy Computershare Private Limited is the Registrar & Share Transfer Agents and Depository Transfer Agentsof the Company. Any request pertaining to investors' relations may be forwarded to the following address:
Mr. S.D. Prabhakar,Karvy Computershare Private LimitedUnit: Aurobindo Pharma LimitedPlot No.17-24, Vittal Rao Nagar, Madhapur,Hyderabad - 500 081.Tel Nos. +91 40 23420818 to 0825Fax Nos. +91 40 23420814E-mail: [email protected]
Share Transfer System and Dematerialization & Liquidity
The Company's shares are covered under the compulsory dematerialization list and are transferable through thedepository system. The Company has appointed M/s. Karvy Computershare Private Limited as its Registrar andShare Transfer Agents and also Depository Transfer Agent. Shares received for physical transfer are generallyregistered within a period of 15 days from the date of receipt, subject to fulfillment of other legal formalities. TheShare Transfer/Investor Grievance Committee reviews the same at regular intervals. Further, the Company hassigned a tripartite agreement with NSDL/CDSL and M/s. Karvy Computershare Private Limited to facilitatedematerialization of shares. The Members may contact for the redressal of their grievances to either M/s. KarvyComputershare Private Limited or to the Company Secretary, Aurobindo Pharma Limited.
Distribution Schedule as on March 31, 2013
Shareholding Share AmountNominal value Shareholders Total Nominal Value
From To No. % Shares ` %
1 - 5000 81,610 98.95 17,683,346 17,683,346 6.075001 - 10000 336 0.41 2,581,663 2,581,663 0.89
10001 - 20000 205 0.25 3,005,723 3,005,723 1.0320001 - 30000 80 0.10 1,994,246 1,994,246 0.69
30001 - 40000 34 0.04 1,210,075 1,210,075 0.42 40001 - 50000 19 0.02 849,536 849,536 0.29 50001 - 100000 60 0.07 4,404,727 4,404,727 1.51100001 & above 128 0.16 259,481,974 259,481,974 89.10
TOTAL 82,472 100.00 291,211,290 291,211,290 100.00
Note: a. 12,010 shares are held in the Bonus Transit Pool Account.
b. 65,480 shares of 121 shareholders are under unclaimed shares account as on March 31, 2013. The outstanding shares are kept insuspense account and the voting rights on these shares shall remain frozen till the rightful owner of such shares claims the shares.The Company is in the process of complying with the guidelines with regard to the same.
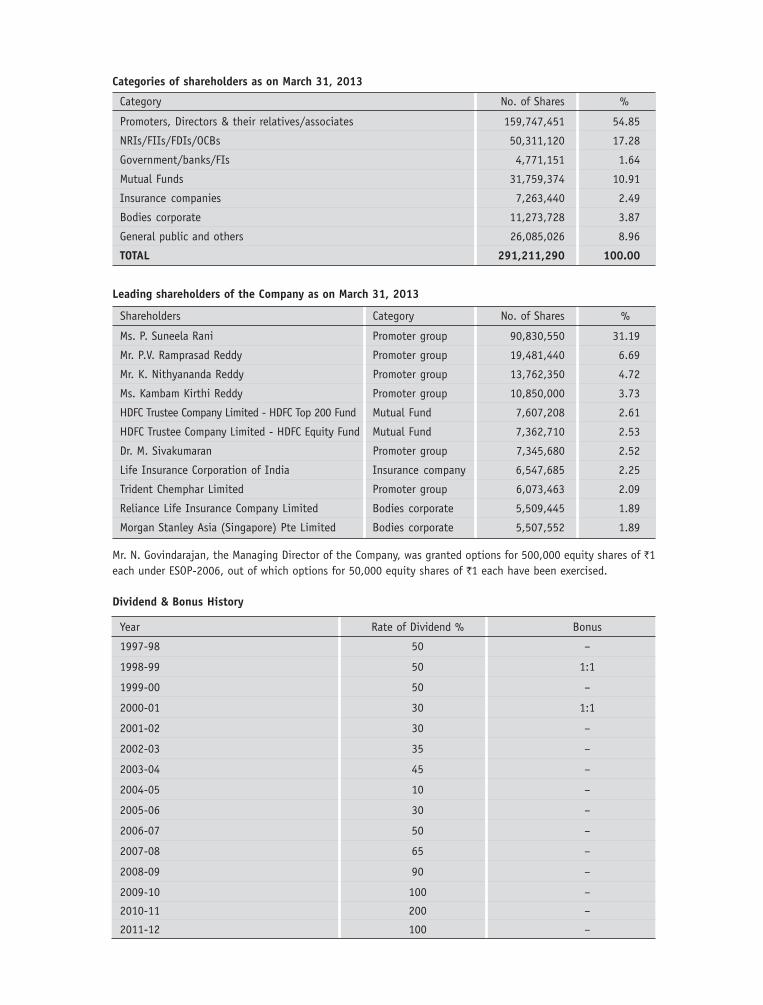
Categories of shareholders as on March 31, 2013
Category No. of Shares %
Promoters, Directors & their relatives/associates 159,747,451 54.85
NRIs/FIIs/FDIs/OCBs 50,311,120 17.28
Government/banks/FIs 4,771,151 1.64
Mutual Funds 31,759,374 10.91
Insurance companies 7,263,440 2.49
Bodies corporate 11,273,728 3.87
General public and others 26,085,026 8.96
TOTAL 291,211,290 100.00
Leading shareholders of the Company as on March 31, 2013
Shareholders Category No. of Shares %
Ms. P. Suneela Rani Promoter group 90,830,550 31.19
Mr. P.V. Ramprasad Reddy Promoter group 19,481,440 6.69
Mr. K. Nithyananda Reddy Promoter group 13,762,350 4.72
Ms. Kambam Kirthi Reddy Promoter group 10,850,000 3.73
HDFC Trustee Company Limited - HDFC Top 200 Fund Mutual Fund 7,607,208 2.61
HDFC Trustee Company Limited - HDFC Equity Fund Mutual Fund 7,362,710 2.53
Dr. M. Sivakumaran Promoter group 7,345,680 2.52
Life Insurance Corporation of India Insurance company 6,547,685 2.25
Trident Chemphar Limited Promoter group 6,073,463 2.09
Reliance Life Insurance Company Limited Bodies corporate 5,509,445 1.89
Morgan Stanley Asia (Singapore) Pte Limited Bodies corporate 5,507,552 1.89
Mr. N. Govindarajan, the Managing Director of the Company, was granted options for 500,000 equity shares of `1each under ESOP-2006, out of which options for 50,000 equity shares of `1 each have been exercised.
Dividend & Bonus History
Year Rate of Dividend % Bonus
1997-98 50 –
1998-99 50 1:1
1999-00 50 –
2000-01 30 1:1
2001-02 30 –
2002-03 35 –
2003-04 45 –
2004-05 10 –
2005-06 30 –
2006-07 50 –
2007-08 65 –
2008-09 90 –
2009-10 100 –
2010-11 200 –
2011-12 100 –
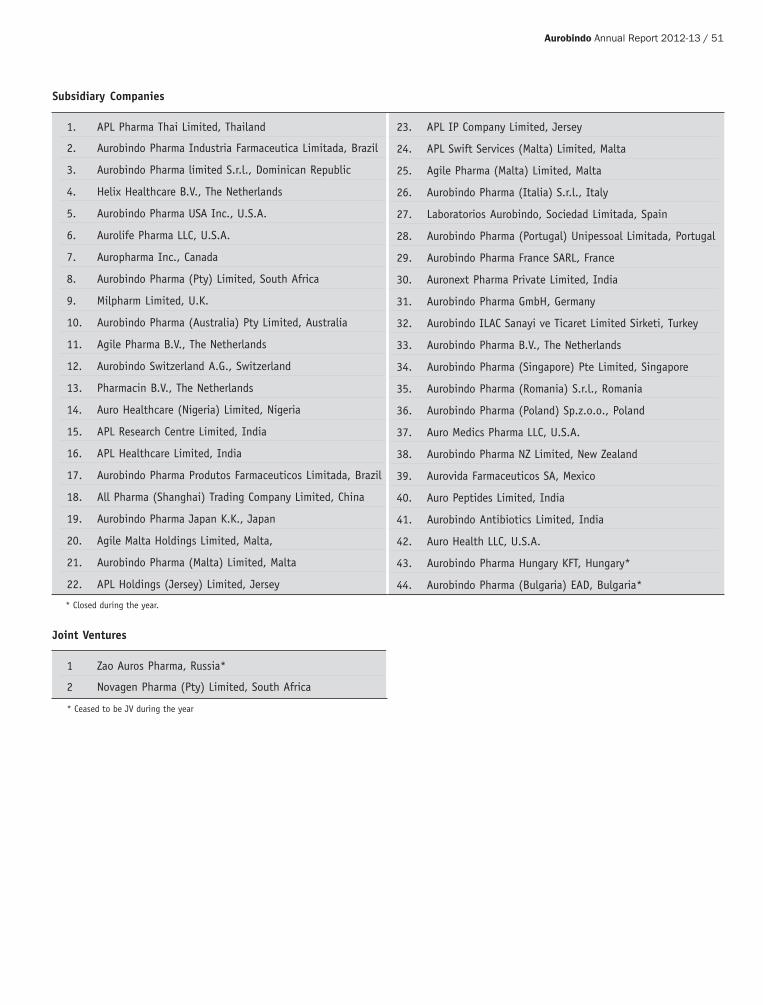
Aurobindo Annual Report 2012-13 / 51
Subsidiary Companies
1. APL Pharma Thai Limited, Thailand
2. Aurobindo Pharma Industria Farmaceutica Limitada, Brazil
3. Aurobindo Pharma limited S.r.l., Dominican Republic
4. Helix Healthcare B.V., The Netherlands
5. Aurobindo Pharma USA Inc., U.S.A.
6. Aurolife Pharma LLC, U.S.A.
7. Auropharma Inc., Canada
8. Aurobindo Pharma (Pty) Limited, South Africa
9. Milpharm Limited, U.K.
10. Aurobindo Pharma (Australia) Pty Limited, Australia
11. Agile Pharma B.V., The Netherlands
12. Aurobindo Switzerland A.G., Switzerland
13. Pharmacin B.V., The Netherlands
14. Auro Healthcare (Nigeria) Limited, Nigeria
15. APL Research Centre Limited, India
16. APL Healthcare Limited, India
17. Aurobindo Pharma Produtos Farmaceuticos Limitada, Brazil
18. All Pharma (Shanghai) Trading Company Limited, China
19. Aurobindo Pharma Japan K.K., Japan
20. Agile Malta Holdings Limited, Malta,
21. Aurobindo Pharma (Malta) Limited, Malta
22. APL Holdings (Jersey) Limited, Jersey
23. APL IP Company Limited, Jersey
24. APL Swift Services (Malta) Limited, Malta
25. Agile Pharma (Malta) Limited, Malta
26. Aurobindo Pharma (Italia) S.r.l., Italy
27. Laboratorios Aurobindo, Sociedad Limitada, Spain
28. Aurobindo Pharma (Portugal) Unipessoal Limitada, Portugal
29. Aurobindo Pharma France SARL, France
30. Auronext Pharma Private Limited, India
31. Aurobindo Pharma GmbH, Germany
32. Aurobindo ILAC Sanayi ve Ticaret Limited Sirketi, Turkey
33. Aurobindo Pharma B.V., The Netherlands
34. Aurobindo Pharma (Singapore) Pte Limited, Singapore
35. Aurobindo Pharma (Romania) S.r.l., Romania
36. Aurobindo Pharma (Poland) Sp.z.o.o., Poland
37. Auro Medics Pharma LLC, U.S.A.
38. Aurobindo Pharma NZ Limited, New Zealand
39. Aurovida Farmaceuticos SA, Mexico
40. Auro Peptides Limited, India
41. Aurobindo Antibiotics Limited, India
42. Auro Health LLC, U.S.A.
43. Aurobindo Pharma Hungary KFT, Hungary*
44. Aurobindo Pharma (Bulgaria) EAD, Bulgaria*
Joint Ventures
1 Zao Auros Pharma, Russia*
2 Novagen Pharma (Pty) Limited, South Africa
* Ceased to be JV during the year
* Closed during the year.

Unit No. Address
Unit-I Survey No.379, 385, 386, 388 to 396 & 269, Borpatla, Hatnoora Mandal,Medak District, 502 296, Andhra Pradesh
Unit-II Plot No.103/A & 104/A, SVCIE, Industrial Development Area, Bollaram,Jinnaram Mandal, Medak District, 500 092, Andhra Pradesh
Unit-III Survey No.313 & 314 Bachupally, Quthubullapur Mandal, Ranga Reddy District,500 090, Andhra Pradesh
Unit-IV Plot No.4 in Sy. No.151 and Plot Nos.34 to 48 in Sy. Nos. part of 146, 150,151, 152, 153 and 154 situated in Phase-III, APIIC, EPIP, IDA, Pashamylaram,Patancheru Revenue Mandal , Medak District, 502 307, Andhra Pradesh
Unit-V Plot Nos.68 to 70, 73 to 91, 95, 96, 260 & 261, Industrial Development Area,Chemical Zone, Pashamylaram, Patancheru Mandal, Medak District, 502 307,Andhra Pradesh
Unit-VI Survey No. 329/39 & 329/47, Chitkul Village, Patancheru Mandal, MedakDistrict, 502 307, Andhra Pradesh
Unit-VII (SEZ) Sy.Nos.411/P, 425/P, 434/P, 435/P & 458/P, Plot No.S1/A, Special EconomicZone (Pharma), APIIC, Green Industrial Park, Polepally Village, JedcherlaMandal, Mahaboob Nagar, 509 302, Andhra Pradesh
Unit-VIII Survey No.10 & 13, Gaddapothram, Industrial Development Area - KazipallyIndustrial Area, Jinnaram Mandal, Medak District, 502 319, Andhra Pradesh
Unit-IX Survey No.369, 370, 371 & 374, Gundlamachanoor, Hatnoora Mandal, MedakDistrict, 502 296, Andhra Pradesh
Unit-XI Survey No.61-66, Industrial Development Area, Pydibhimavaram, RanasthalamMandal, Srikakulam District, 532 409, Andhra Pradesh
Unit-XII Survey No.314, Bachupally, Quthubullapur Mandal, Ranga Reddy District,500 090, Andhra Pradesh
Unit-XIV JN Pharma City, Road No.10,11 & 19, 20, E Bonangi Village, Parawada,Visakhapatnam District, 531 021, Andhra Pradesh
APLRC-I Survey No. 313 & 314, Bachupally, Quthbullapur Mandal, Ranga Reddy District,500 090, Andhra Pradesh
APLRC-II Survey No.71 & 72, Indrakaran Village, Sangareddy Mandal, Medak District,502 203, Andhra Pradesh
Bhiwadi Unit 1128, RIICO Phase-III, Bhiwadi, 301 019, Rajasthan (under sublease toAuronext Pharma Private Limited, a subsidiary of the Company)
Plant Locations

Aurobindo Annual Report 2012-13 / 53
The Members ofAurobindo Pharma Limited
We have examined the compliance of conditions of corporate governance by Aurobindo Pharma Limited (TheCompany) for the year ended March 31, 2013, as stipulated in Clause 49 of the Listing Agreement of the saidCompany with the stock exchanges.
The compliance of conditions of corporate governance is the responsibility of the management. Our examinationwas limited to review the procedures and implementation thereof, adopted by the Company, for ensuring thecompliance of the conditions of the corporate governance. It is neither an audit nor an expression of opinion offinancial statements of the Company.
In our opinion and to the beset of our information and according to the explanations given to us, we certify thatthe Company has complied with the conditions of corporate governance as stipulated in the above mentionedListing Agreement.
We further state that such compliance is neither an assurance as to the future viability of the Company nor theefficiency or effectiveness with which the management has conducted the affairs of the Company.
S. CHIDAMBARAMCompany Secretary in Practice
Hyderabad, May 30, 2013 C.P. No. 2286
Certificate on Compliance with the conditions of Corporate Governanceunder Clause 49 of the Listing Agreement
Declaration
I, N. Govindarajan, Managing Director, hereby declare that as provided under Clause 49 of the Listing Agreements
with the stock exchanges, the Board Members and the senior management personnel have confirmed compliance
with the Code of Conduct and Ethics for the year ended March 31, 2013.
For Aurobindo Pharma Limited
N. GOVINDARAJANHyderabad, May 30, 2013 Managing Director

Contents to the
Financial Statements
55 Independent Auditors' Report
58 Balance Sheet
59 Statement of Profit and Loss
60 Cash Flow Statement
62 Notes to financial statements
96 Statement regarding subsidiary companies
98 Consolidated Financial Statements
135 Attendance Slip / Proxy

Aurobindo Annual Report 2012-13 / 55
The Members ofAurobindo Pharma Limited
Report on the Financial Statements
We have audited the accompanying financial statements ofAurobindo Pharma Limited ("the Company"), which comprise theBalance Sheet as at March 31, 2013, and the Statement of Profitand Loss and Cash Flow Statement for the year then ended, and asummary of significant accounting policies and other explanatoryinformation.
Management's Responsibility for the Financial Statements
Management is responsible for the preparation of these financialstatements that give a true and fair view of the financial position,financial performance and cash flows of the Company in accordancewith accounting principles generally accepted in India, includingthe Accounting Standards referred to in sub-section (3C) of Section211 of the Companies Act, 1956 ("the Act"). This responsibilityincludes the design, implementation and maintenance of internalcontrol relevant to the preparation and presentation of the financialstatements that give a true and fair view and are free from materialmisstatement, whether due to fraud or error.
Auditor's Responsibility
Our responsibility is to express an opinion on these financialstatements based on our audit. We conducted our audit inaccordance with the Standards on Auditing issued by the Instituteof Chartered Accountants of India. Those Standards require thatwe comply with ethical requirements and plan and perform theaudit to obtain reasonable assurance about whether the financialstatements are free from material misstatement.
An audit involves performing procedures to obtain audit evidenceabout the amounts and disclosures in the financial statements.The procedures selected depend on the auditor's judgment,including the assessment of the risks of material misstatement ofthe financial statements, whether due to fraud or error. In makingthose risk assessments, the auditor considers internal controlrelevant to the Company's preparation and fair presentation of thefinancial statements in order to design audit procedures that areappropriate in the circumstances. An audit also includes evaluatingthe appropriateness of accounting policies used and thereasonableness of the accounting estimates made by management,as well as evaluating the overall presentation of the financialstatements. We believe that the audit evidence we have obtainedis sufficient and appropriate to provide a basis for our audit opinion.
Opinion
In our opinion and to the best of our information and accordingto the explanations given to us, the financial statements give the
information required by the Act in the manner so required andgive a true and fair view in conformity with the accountingprinciples generally accepted in India:
a. in the case of the Balance Sheet, of the state of affairs of theCompany as at March 31, 2013;
b. in the case of the Statement of Profit and Loss, of the profitfor the year ended on that date; and
c. in the case of the Cash Flow Statement, of the cash flows forthe year ended on that date.
Report on Other Legal and Regulatory Requirements
1. As required by the Companies (Auditor's Report) Order, 2003("the Order") issued by the Central Government of India interms of sub-section (4A) of Section 227 of the Act, we givein the Annexure a statement on the matters specified inparagraphs 4 and 5 of the Order.
2. As required by Section 227(3) of the Act, we report that:
a. We have obtained all the information and explanationswhich to the best of our knowledge and belief werenecessary for the purpose of our audit;
b. In our opinion proper books of account as required bylaw have been kept by the Company so far as appearsfrom our examination of those books;
c. The Balance Sheet, Statement of Profit and Loss, andCash Flow Statement dealt with by this Report are inagreement with the books of account;
d. In our opinion, the Balance Sheet, Statement of Profitand Loss, and Cash Flow Statement comply with theAccounting Standards referred to in sub-section (3C) ofSection 211 of the Act; and
e. On the basis of written representations received fromthe Directors as on March 31, 2013 and taken on recordby the Board of Directors, none of the Directors isdisqualified as on March 31, 2013, from being appointed
as a director in terms of clause (g) of sub-section (1) of
Section 274 of the Act.
For S.R. BATLIBOI & ASSOCIATES LLPChartered AccountantsICAI Firm's Registration Number: 101049W
per VIKAS KUMAR PANSARIPartnerMembership No. 93649Hyderabad, May 30, 2013
Independent Auditors' Report
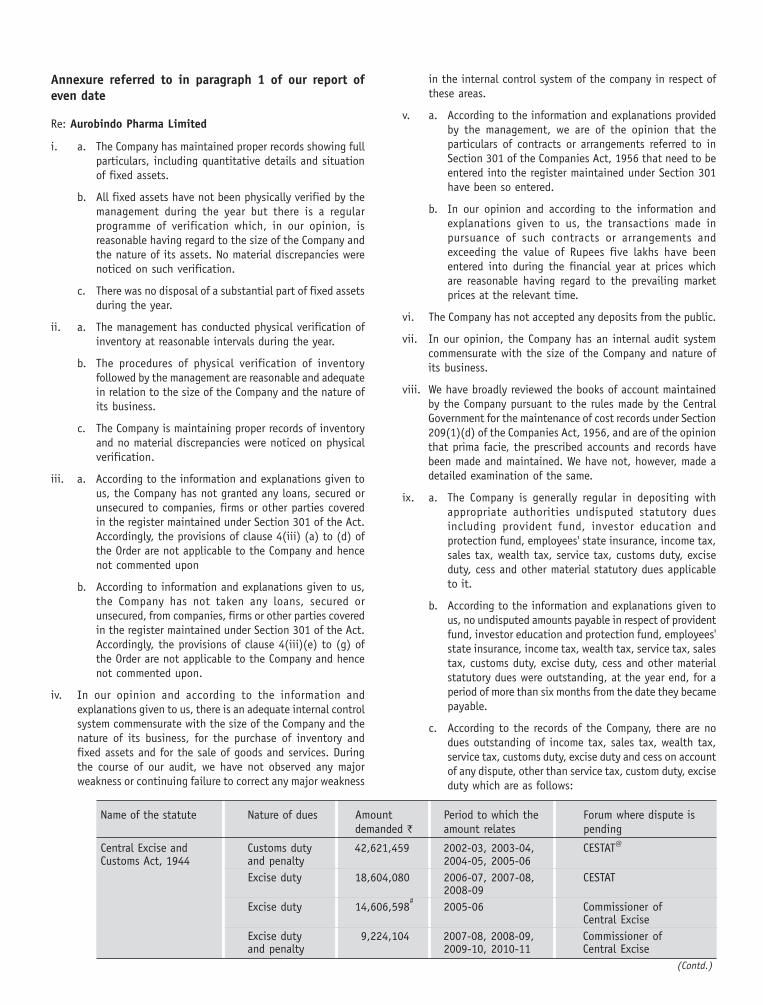
Annexure referred to in paragraph 1 of our report ofeven date
Re: Aurobindo Pharma Limited
i. a. The Company has maintained proper records showing fullparticulars, including quantitative details and situationof fixed assets.
b. All fixed assets have not been physically verified by themanagement during the year but there is a regularprogramme of verification which, in our opinion, isreasonable having regard to the size of the Company andthe nature of its assets. No material discrepancies werenoticed on such verification.
c. There was no disposal of a substantial part of fixed assetsduring the year.
ii. a. The management has conducted physical verification ofinventory at reasonable intervals during the year.
b. The procedures of physical verification of inventoryfollowed by the management are reasonable and adequatein relation to the size of the Company and the nature ofits business.
c. The Company is maintaining proper records of inventoryand no material discrepancies were noticed on physicalverification.
iii. a. According to the information and explanations given tous, the Company has not granted any loans, secured orunsecured to companies, firms or other parties coveredin the register maintained under Section 301 of the Act.Accordingly, the provisions of clause 4(iii) (a) to (d) ofthe Order are not applicable to the Company and hencenot commented upon
b. According to information and explanations given to us,the Company has not taken any loans, secured orunsecured, from companies, firms or other parties coveredin the register maintained under Section 301 of the Act.Accordingly, the provisions of clause 4(iii)(e) to (g) ofthe Order are not applicable to the Company and hencenot commented upon.
iv. In our opinion and according to the information andexplanations given to us, there is an adequate internal controlsystem commensurate with the size of the Company and thenature of its business, for the purchase of inventory andfixed assets and for the sale of goods and services. Duringthe course of our audit, we have not observed any majorweakness or continuing failure to correct any major weakness
in the internal control system of the company in respect ofthese areas.
v. a. According to the information and explanations providedby the management, we are of the opinion that theparticulars of contracts or arrangements referred to inSection 301 of the Companies Act, 1956 that need to beentered into the register maintained under Section 301have been so entered.
b. In our opinion and according to the information andexplanations given to us, the transactions made inpursuance of such contracts or arrangements andexceeding the value of Rupees five lakhs have beenentered into during the financial year at prices whichare reasonable having regard to the prevailing marketprices at the relevant time.
vi. The Company has not accepted any deposits from the public.
vii. In our opinion, the Company has an internal audit systemcommensurate with the size of the Company and nature ofits business.
viii. We have broadly reviewed the books of account maintainedby the Company pursuant to the rules made by the CentralGovernment for the maintenance of cost records under Section209(1)(d) of the Companies Act, 1956, and are of the opinionthat prima facie, the prescribed accounts and records havebeen made and maintained. We have not, however, made adetailed examination of the same.
ix. a. The Company is generally regular in depositing withappropriate authorities undisputed statutory duesincluding provident fund, investor education andprotection fund, employees' state insurance, income tax,sales tax, wealth tax, service tax, customs duty, exciseduty, cess and other material statutory dues applicableto it.
b. According to the information and explanations given tous, no undisputed amounts payable in respect of providentfund, investor education and protection fund, employees'state insurance, income tax, wealth tax, service tax, salestax, customs duty, excise duty, cess and other materialstatutory dues were outstanding, at the year end, for aperiod of more than six months from the date they becamepayable.
c. According to the records of the Company, there are nodues outstanding of income tax, sales tax, wealth tax,service tax, customs duty, excise duty and cess on accountof any dispute, other than service tax, custom duty, exciseduty which are as follows:
Name of the statute Nature of dues Amount Period to which the Forum where dispute isdemanded ` amount relates pending
Central Excise and Customs duty 42,621,459 2002-03, 2003-04, CESTAT@
Customs Act, 1944 and penalty 2004-05, 2005-06Excise duty 18,604,080 2006-07, 2007-08, CESTAT
2008-09Excise duty 14,606,598
#2005-06 Commissioner of
Central ExciseExcise duty 9,224,104 2007-08, 2008-09, Commissioner ofand penalty 2009-10, 2010-11 Central Excise
(Contd.)
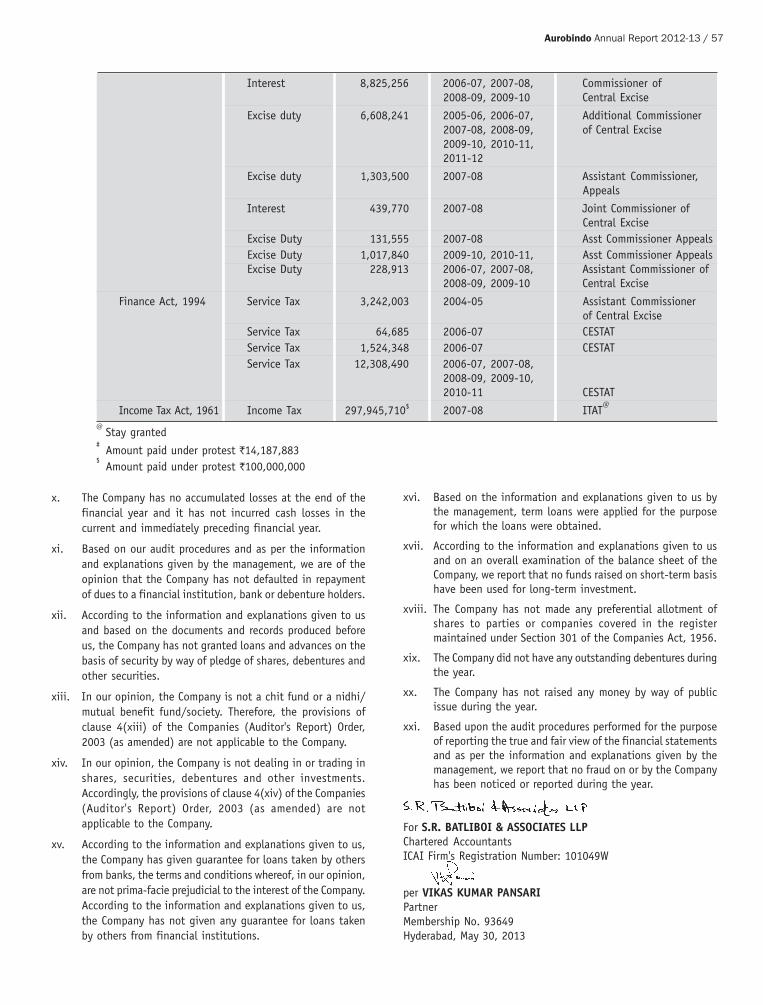
Aurobindo Annual Report 2012-13 / 57
Interest 8,825,256 2006-07, 2007-08, Commissioner of2008-09, 2009-10 Central Excise
Excise duty 6,608,241 2005-06, 2006-07, Additional Commissioner2007-08, 2008-09, of Central Excise2009-10, 2010-11,2011-12
Excise duty 1,303,500 2007-08 Assistant Commissioner,Appeals
Interest 439,770 2007-08 Joint Commissioner ofCentral Excise
Excise Duty 131,555 2007-08 Asst Commissioner AppealsExcise Duty 1,017,840 2009-10, 2010-11, Asst Commissioner AppealsExcise Duty 228,913 2006-07, 2007-08, Assistant Commissioner of
2008-09, 2009-10 Central Excise
Finance Act, 1994 Service Tax 3,242,003 2004-05 Assistant Commissionerof Central Excise
Service Tax 64,685 2006-07 CESTATService Tax 1,524,348 2006-07 CESTATService Tax 12,308,490 2006-07, 2007-08,
2008-09, 2009-10,2010-11 CESTAT
Income Tax Act, 1961 Income Tax 297,945,710$ 2007-08 ITAT@
@Stay granted
#Amount paid under protest `14,187,883
$Amount paid under protest `100,000,000
x. The Company has no accumulated losses at the end of thefinancial year and it has not incurred cash losses in thecurrent and immediately preceding financial year.
xi. Based on our audit procedures and as per the informationand explanations given by the management, we are of theopinion that the Company has not defaulted in repaymentof dues to a financial institution, bank or debenture holders.
xii. According to the information and explanations given to usand based on the documents and records produced beforeus, the Company has not granted loans and advances on thebasis of security by way of pledge of shares, debentures andother securities.
xiii. In our opinion, the Company is not a chit fund or a nidhi/mutual benefit fund/society. Therefore, the provisions ofclause 4(xiii) of the Companies (Auditor's Report) Order,2003 (as amended) are not applicable to the Company.
xiv. In our opinion, the Company is not dealing in or trading inshares, securities, debentures and other investments.Accordingly, the provisions of clause 4(xiv) of the Companies(Auditor's Report) Order, 2003 (as amended) are notapplicable to the Company.
xv. According to the information and explanations given to us,the Company has given guarantee for loans taken by othersfrom banks, the terms and conditions whereof, in our opinion,are not prima-facie prejudicial to the interest of the Company.According to the information and explanations given to us,the Company has not given any guarantee for loans takenby others from financial institutions.
xvi. Based on the information and explanations given to us bythe management, term loans were applied for the purposefor which the loans were obtained.
xvii. According to the information and explanations given to usand on an overall examination of the balance sheet of theCompany, we report that no funds raised on short-term basishave been used for long-term investment.
xviii. The Company has not made any preferential allotment ofshares to parties or companies covered in the registermaintained under Section 301 of the Companies Act, 1956.
xix. The Company did not have any outstanding debentures duringthe year.
xx. The Company has not raised any money by way of publicissue during the year.
xxi. Based upon the audit procedures performed for the purposeof reporting the true and fair view of the financial statementsand as per the information and explanations given by themanagement, we report that no fraud on or by the Companyhas been noticed or reported during the year.
For S.R. BATLIBOI & ASSOCIATES LLPChartered AccountantsICAI Firm's Registration Number: 101049W
per VIKAS KUMAR PANSARIPartnerMembership No. 93649Hyderabad, May 30, 2013

EQUITY AND LIABILITIESSHAREHOLDERS' FUNDS
Share capital 2 291.2 291.1Reserves and surplus 3 29,099.8 24,640.6
29,391.0 24,931.7NON-CURRENT LIABILITIES
Long-term borrowings 4 10,410.6 8,337.4Deferred tax liabilities (Net) 5 679.4 37.9Long-term provisions 6 85.0 41.2
11,175.0 8,416.5CURRENT LIABILITIES
Short-term borrowings 7 17,339.0 16,082.1Trade payables 8 9,012.8 5,848.5Other current liabilities 9 680.4 4,057.8Short-term provisions 6 647.5 575.5
27,679.7 26,563.9TOTAL 68,245.7 59,912.1
ASSETSNON-CURRENT ASSETS
Fixed Assets Tangible assets 10 20,119.1 16,266.5Intangible assets – 0.9Tangible assets - Capital work-in-progress 1,663.4 5,580.8
Non-current investments 11 7,079.4 6,103.2Loans and advances 12 2,891.0 1,784.9Trade receivables 13 – –Other non-current assets 15 185.8 1.2
31,938.7 29,737.5CURRENT ASSETS
Current investments 16 0.4 186.8Inventories 17 14,317.3 12,192.6Trade receivables 13 17,305.9 14,262.8Cash and bank balances 18 1,145.7 140.1Loans and advances 12 2,759.8 2,624.8Other current assets 14 777.9 767.5
36,307.0 30,174.6TOTAL 68,245.7 59,912.1
Summary of significant accounting policies 1
The accompanying notes are an integral part of the financial statements.
Balance Sheet as at March 31, 2013
NotesAs at As at
March 31, 2013 March 31, 2012
(All amounts in Indian Rupees million, except share data and where otherwise stated)
As per our report of even date. For and on behalf of the Board of Directors of Aurobindo Pharma Limited
For S.R. BATLIBOI & ASSOCIATES LLPChartered AccountantsICAI Firm Registration No. 101049W N. GOVINDARAJAN Dr. M. SIVAKUMARAN
Managing Director Director
per VIKAS KUMAR PANSARIPartnerMembership No. 93649 SUDHIR B. SINGHI A. MOHAN RAMI REDDY
Chief Financial Officer AVP (Legal) &Hyderabad, May 30, 2013 Company Secretary

Aurobindo Annual Report 2012-13 / 59
INCOME Revenue from operations (Gross) 19 55,695.0 43,787.3
Less: Excise duty 42 1,444.0 972.8
Revenue from operations (Net) 54,251.0 42,814.5
Other income 20 265.1 190.6
TOTAL REVENUE 54,516.1 43,005.1
EXPENSES Cost of materials consumed 21 30,536.4 23,932.9
Purchase of traded goods 780.9 355.2
(Increase)/decrease in work-in-progress,
traded and finished goods 22 (1,210.8) 898.7
Employee benefit expenses 23 4,314.2 3,641.0
Other expenses 24 10,249.7 8,251.7
Depreciation/amortization 25 1,713.9 1,429.4
Finance costs 26 2,500.6 2,675.8
TOTAL EXPENSES 48,884.9 41,184.7
PROFIT BEFORE EXCEPTIONAL ITEMS AND TAX 5,631.2 1,820.4
Exceptional items 27 – 3,198.6
PROFIT/(LOSS) BEFORE TAX 5,631.2 (1,378.2)
Current tax 30 1,265.0 48.7
MAT credit (1,265.0) –
Deferred tax charge/(credit) 641.5 (1,180.3)
Tax relating to previous years 29.8 179.5
TOTAL TAX EXPENSE 671.3 (952.1)
PROFIT/(LOSS) FOR THE YEAR 4,959.9 (426.1)
EARNINGS PER EQUITY SHARE 46
Basic earnings per share ` 17.04 (1.46)
Diluted earnings per share ` 17.02 (1.46)
Nominal value per equity share ` 1.00 1.00
Summary of significant accounting policies 1
The accompanying notes are an integral part of the financial statements.
Statement of Profit and Loss for the year ended March 31, 2013
Notes Year ended Year ended
March 31, 2013 March 31, 2012
(All amounts in Indian Rupees million, except share data and where otherwise stated)
As per our report of even date. For and on behalf of the Board of Directors of Aurobindo Pharma Limited
For S.R. BATLIBOI & ASSOCIATES LLPChartered AccountantsICAI Firm Registration No. 101049W N. GOVINDARAJAN Dr. M. SIVAKUMARAN
Managing Director Director
per VIKAS KUMAR PANSARIPartnerMembership No. 93649 SUDHIR B. SINGHI A. MOHAN RAMI REDDY
Chief Financial Officer AVP (Legal) &Hyderabad, May 30, 2013 Company Secretary

Cash Flow Statement for the year ended March 31, 2013 Year ended Year ended
March 31, 2013 March 31, 2012
CASH FLOW FROM
OPERATING ACTIVITIES Net profit before tax and exceptional items 5,631.2 1,820.4
Adjustments to reconcile profit before tax to net cash flows
Depreciation and amortization 1,713.9 1,429.4
Provision for trade receivables (Net) 1.5 94.6
Bad debts written off 183.4 32.9
Provision for diminution on investment 690.0 268.7
Profit on sale of investment (46.8) –
Balances no longer required written back (7.9) (14.3)
Unrealised foreign exchange loss/(gain) (Net) 410.0 886.9
Loss/(profit) on sale of fixed assets (Net) 30.7 (5.8)
Interest expense 991.2 730.3
Interest income (41.2) (71.0)
Operating profit before working capital changes 9,556.0 5,172.1
Movements in working capital
Decrease/(increase) in trade receivables (3,097.7) 787.1
Decrease/(increase) in inventories (2,124.7) 417.6
Decrease/(increase) in loans and advances (80.1) 846.2
Increase in other current/non-current assets (157.8) (380.7)
Increase/(decrease) in trade payables 3,148.9 (1,506.3)
Increase/(decrease) in provision for retirement benefits 116.0 (6.1)
Increase/(decrease) in other current liabilities 47.2 (4.4)
Cash generated from operations 7,407.8 5,325.5
Direct taxes paid (Net of refunds) (1,158.6) (285.0)
NET CASH FLOW FROM OPERATING ACTIVITIES (A) 6,249.2 5,040.5
CASH FLOW USED IN
INVESTING ACTIVITIES Purchase of fixed assets, including capital work-in-progress
and capital advances (1657.9) (4011.9)
Proceeds from sale of fixed assets 16.5 5.1
Purchase of non-current investments made in subsidiaries (1,369.1) (1,532.9)
Investments in bank deposits (having original maturity of
more than 3 months) (30.0) –
Proceeds of current investments 233.2 –
Loans to subsidiaries (75.0) 264.7
Loans repaid by subsidiaries 14.1 –
Share application money to subsidiaries (112.6) (105.9)
Share application money to others (3.3) (12.2)
Interest received 34.5 54.9
NET CASH FLOW USED IN INVESTING ACTIVITIES (B) (2,949.6) (5,338.2)
(All amounts in Indian Rupees million, except share data and where otherwise stated)

Aurobindo Annual Report 2012-13 / 61
Year ended Year ended March 31, 2013 March 31, 2012
CASH FLOW FROM
FINANCING ACTIVITIES Proceeds from issuance of share capital 8.2 –
Proceeds from long-term borrowings 1,601.8 7,461.2
Repayment of long-term borrowings (3,523.4) (1,487.0)
Repayment of FCCBs – (6,207.6)
Redemption premium (Yield to Maturity)
on redemption of FCCBs – (3,198.6)
Proceeds from short-term borrowings (Net) 1,270.0 3,667.6
Interest paid (976.3) (681.7)
Dividend and dividend tax paid (674.3) (338.2)
NET CASH FLOW FROM FINANCING ACTIVITIES (C) (2,294.0) (784.2)
NET INCREASE/(DECREASE) IN CASH AND CASH EQUIVALENTS (A+B+C) 1,005.6 (1,081.9)
Cash and cash equivalents at the beginning of the year 140.1 1,222.1
Cash and cash equivalents at the end of the year 1,145.7 140.1
Components of cash and cash equivalents
Cash and bank balances includes:
Cash on hand 5.3 6.5
Balance with banks:
Current accounts 1,050.3 31.9
Cash credit accounts 82.3 96.3
Fixed deposit accounts 31.2 1.2
Unpaid dividend accounts* 7.8 5.4
Cash and bank balances as per Balance Sheet 1,176.9 141.3
Less: Fixed deposits considered as investing activities 31.2 1.2
Total cash and cash equivalents (Refer Note 18) 1,145.7 140.1
Summary of significant accounting policies (Refer Note 1)
*The Company can utilize these balances only toward settlement of unpaid dividend.
(All amounts in Indian Rupees million, except share data and where otherwise stated)
As per our report of even date. For and on behalf of the Board of Directors of Aurobindo Pharma Limited
For S.R. BATLIBOI & ASSOCIATES LLPChartered AccountantsICAI Firm Registration No. 101049W N. GOVINDARAJAN Dr. M. SIVAKUMARAN
Managing Director Director
per VIKAS KUMAR PANSARIPartnerMembership No. 93649 SUDHIR B. SINGHI A. MOHAN RAMI REDDY
Chief Financial Officer AVP (Legal) &Hyderabad, May 30, 2013 Company Secretary

1. STATEMENT OF SIGNIFICANT ACCOUNTING POLICIES
a. Basis of preparation
These financial statements have been prepared inaccordance with generally accepted accounting principlesin India (Indian GAAP) under the historical cost conventionon accrual basis to comply in all material respects withthe notified Accounting Standards by the CompaniesAccounting Standards Rules, 2006 (as amended), otherpronouncements of the Institute of Chartered Accountantsof India and the relevant provisions of the Companies Act,1956. The accounting policies have been consistentlyapplied by the Company and are consistent with thoseused in the previous year.
b. Use of estimates
The preparation of financial statements in conformity withIndian GAAP requires the management to make judgments,estimates and assumptions that affect the reported amountsof revenues, expenses, assets and liabilities and thedisclosure of contingent liabilities at the date of thefinancial statements and the results of operations duringthe reporting year. Although these estimates are basedupon management’s best knowledge of current events andactions, actual results could differ from these estimates.
c. Revenue recognition
Revenue is recognized to the extent that it is probablethat the economic benefits will flow to the Company andthe revenue can be reliably measured.
Revenue from sale of goods is recognized on dispatch (inrespect of exports on the date of the bill of lading orairway bill) which coincides with transfer of significantrisks and rewards to customer and is net of trade discounts,sales returns and sales tax, where applicable. Excise dutydeducted from revenue (gross) is the amount that isinlcuded in revenue (gross) and not the entire amount ofliability arising during the year.
Revenue from sale of dossiers/licenses/services isrecognized in accordance with the terms of the relevantagreements as accepted and agreed with the customers.
Interest is recognized on a time proportion basis takinginto account the amount outstanding and the rateapplicable.
Dividend is recognized as and when the Company’s rightto receive payment is established by the reporting date.
d. Fixed assets and depreciation
Fixed assets are stated at cost less accumulateddepreciation, impairment losses and specific grant/subsidies, if any. Cost comprise of purchase price, freight,non-refundable taxes and duties and any attributable costof bringing the asset to its working condition for itsintended use. Borrowing costs relating to acquisition offixed assets which take substantial period of time to getready for use are included to the extent they relate to theperiod till such assets are ready for intended use. All otherborrowing costs are expensed in the period they occur.
Notes to financial statements for the year ended March 31, 2013(All amounts in Indian Rupees million, except share data and where otherwise stated)
Expenditure directly relating to construction activity iscapitalized. Indirect expenditure is capitalized to the extentthose relate to the construction activity or is incidentalthereto. Income earned during construction period isdeducted from the total expenditure relating toconstruction activity.
Assets retired from active use and held for disposal arestated at their estimated net realizable values or net bookvalues, whichever is lower.
Assets under finance leases, where there is no reasonablecertainty that the Company will obtain the ownership bythe end of the lease term are capitalized and are depreciatedover the lease term or estimated useful life of the asset oruseful life envisaged in Schedule XIV of the CompaniesAct, 1956 whichever is shorter.
Premium paid on leasehold land is amortised over the leaseterm.
Depreciation is provided on the straight-line method, basedon the useful life of the assets as estimated by themanagement which generally coincides with ratesprescribed under Schedule XIV to the Companies Act, 1956except assets acquired at the Bhiwadi unit in Rajasthanfor which depreciation is provided on a straight-line basis,at the rates that are higher than those specified in ScheduleXIV to the Companies Act, 1956 and are based on usefullives as estimated by management. In these cases the ratesare as under:
Leasehold buildings : 5%
Plant & machinery : 20%
Assets costing upto `5,000 are depreciated fully in theyear of purchase.
e. Intangibles
Cost relating to licenses, which are acquired, are capitalizedand amortized on a straight-line basis over their usefullife not exceeding ten years. Research costs are expensedas incurred. Development expenditure incurred in respectof internally generated intangible assets such as productdevelopment is carried forward when the futurerecoverability can reasoably be regarded as assured.
f. Impairment of tangible and intangible assets
The carrying amounts of assets are reviewed at each BalanceSheet date if there is any indication of impairment basedon internal/external factors. An impairment loss isrecognized wherever the carrying amount of an assetexceeds its recoverable amount. The recoverable amountis the greater of the asset’s net selling price and its valuein use. In assessing value in use, the estimated futurecash flows are discounted to their present value using apre-tax discount rate that reflects current marketassessments of the time value of money and risks specificto the asset.
After impairment, depreciation is provided on the revisedcarrying amount of the asset over its remaining usefullife.

Aurobindo Annual Report 2012-13 / 63
g. Government grants and subsidies
Grants and subsidies are recognized when there is areasonable assurance that the grant or subsidy will bereceived and that all underlying conditions thereto will becomplied with. When the grant or subsidy relates to anasset, its value is deducted in arriving at the carryingamount of the related asset.
h. Investments
Investments that are readily realisable and intended to beheld for not more than one year from the date on whichsuch investments are made, are classified as currentinvestments. All other investments are classified as longterm investments. Current investments are carried at lowerof cost and fair value determined on individual investmentbasis.
Long-term investments are carried at cost. However,diminution in value is provided to recognize a decline,other than temporary, in the value of the investments.
i. Inventories
Raw materials, packing materials, stores, spares andconsumables are valued at lower of cost, calculated on'First-in-First out' basis, and net realizable value. Itemsheld for use in the production of inventories are not writtendown below cost if the finished product in which thesewill be incorporated are expected to be sold at or abovecost.
Finished goods and work-in-progress are valued at lowerof cost and net realisable value. Cost includes materials,labour and a proportion of appropriate overheads basedon normal operating capacity. Cost of finished goodsincludes excise duty. Cost is determined on a weightedaverage basis.
Trading goods are valued at lower of cost and net realisablevalue. Cost includes cost of purchase and other costsincurred in bringing the inventories to their presentlocation and condition. Cost is determined on a 'First-in-First out' basis.
Net realisable value is the estimated selling price in theordinary course of business, reduced by the estimated costsof completion and costs to effect the sale.
j. Employee benefits
Employee benefit in the form of provident fund is a definedcontribution scheme and the contributions are charged tothe Statement of Profit and Loss in the year of which thecontributions to the respective funds are due. There areno other obligations other than the contribution payableto the respective authorities.
Gratuity is a defined benefit obligation and is providedfor on the basis of an actuarial valuation on project unitcredit method made at the end of each financial year.
Short-term compensated absences are provided for basedon estimates. Long-term compensated absences areprovided for based on actuarial valuation. The actuarialvaluation is done as per projected unit credit method atthe end of each financial year.
Notes to financial statements for the year ended March 31, 2013
(All amounts in Indian Rupees million, except share data and where otherwise stated)
Actuarial gains/losses are immediately taken to Statementof Profit and Loss and are not deferred.
The Company presents the entire leave as a current liabilityin the Balance Sheet, since it does not have anunconditional right to defer its settlement for 12 monthsafter the reporting date.
k. Income taxes
Tax expense comprises of current and deferred tax. Currentincome tax is measured at the amount expected to be paidto the tax authorities in accordance with the Indian IncomeTax Act, 1961. Deferred income taxes reflect the impact ofcurrent year timing differences between taxable incomeand accounting income for the year and reversal of timingdifferences of earlier years.
Deferred tax is measured based on the tax rates and thetax laws enacted or substantively enacted at the BalanceSheet date. Deferred tax assets are recognized only to theextent that there is reasonable certainty that sufficientfuture taxable income will be available against which suchdeferred tax assets can be realised.
In the situations where the Company is entitled to taxholiday under Income Tax Act, 1961, no deferred tax isrecognized in respect of timing differences which reverseduring the tax holiday period, to the extent Company'sgross total income is subject to the deduction during thetax holiday period. Deferred tax in respect of timingdifferences which reverse after the tax holiday period isrecognized in the year in which timing difference originate.
Unrecognized deferred tax assets of earlier years are re-assessed and recognized to the extent that it has becomereasonably certain or virtually certain, as the case may bethat future taxable income will be available against whichsuch deferred tax assets can be realised.
The carrying amount of deferred tax assets are reviewed ateach Balance Sheet date. The Company writes-down thecarrying amount of a deferred tax asset to the extent thatit is no longer reasonably certain or virtually certain, asthe case may be, that sufficient future taxable income willbe available against which deferred tax asset can berealised. Any such write-down is reversed to the extentthat it becomes reasonably certain or virtually certain, asthe case may be, that sufficient future taxable income willbe available.
Minimum alternate tax (MAT) paid in a year is charged tothe statement of profit and loss as current tax. The Companyrecognizes MAT credit available as an asset only to theextent that there is convincing evidence that the companywill pay normal income tax during the specified period,i.e. the period for which MAT credit is allowed to be carriedforward. In the year in which the Company recognizes MATcredit as an asset in accordance with the Guidance Noteon Accounting for Credit Available in respect of MinimumAlternative Tax under the Income Tax Act, 1961, the saidasset is created by way of credit to the statement of profitand loss and shown as 'MAT credit entitlement'. TheCompany reviews the 'MAT credit entitlement' asset at each
reporting date and writes down the asset to the extentthe Company does not have convincing evidence that itwill pay normal tax during the specified period.
l. Foreign exchange transactions
Initial recognition: Foreign currency transactions arerecorded in the reporting currency, by applying to theforeign currency amount the exchange rate between thereporting currency and foreign currency at the date of thetransaction.
Conversion: Foreign currency monetary items are reportedat year-end rates. Non-monetary items which are carriedin terms of historical cost denominated in foreign currencyare reported using the exchange rate at the date of thetransaction.
Exchange differences: Exchange differences arising on thesettlement of monetary items or on reporting monetaryitems of Company at rates different from those at whichthey were initially recorded during the year, or reported inprevious financial statements, are recognized as incomeor as expenses in the year in which they arise.
Forward exchange contracts not intended for tradingpurposes: In case of forward exchange contracts, differencebetween the forward rate and the exchange rate on thedate of transaction is recognized as expense or incomeover the life of the contract. Exchange differences on suchcontracts are recognized in the statement of profit andloss in the year in which the exchange rates change. Anyprofit or loss arising on cancellation or renewal of forwardexchange contract is recognized as income or as expensefor the year.
m. Export benefits, incentives and licenses
Export benefits on account of duty drawback and exportpromotion schemes are accrued and accounted in the yearof export, and are included in other operating revenue. Otherbenefits in the form of advance authorisation for importsare accounted for on purchase of imported materials.
n. Leases
Where the Company is lessee
Finance leases, where the substantial risks and benefitsincidental to ownership of the leased items are transferredto the Company, are capitalized at the lower of the fairvalue and present value of the minimum lease paymentsat the inception of the lease term and disclosed as leasedassets. Lease payments are apportioned between thefinance charges and reduction of the lease liability basedon the implicit rate of return. Finance charges are chargeddirectly against income. Lease management fees, legalcharges and other initial direct costs are capitalized.
Leases, where the lessor effectively retains substantiallyall the risks and benefits of ownership of the leased itemare classified as operating leases. Operating lease paymentsare recognized as an expense in the Statement of Profitand Loss on a straight-line basis over the lease term.
Notes to financial statements for the year ended March 31, 2013
(All amounts in Indian Rupees million, except share data and where otherwise stated)
o. Earnings per share
Basic earnings per share is calculated by dividing the netprofit or loss for the year attributable to equity shareholdersby the weighted average number of equity sharesoutstanding during the year.
For the purpose of calculating diluted earnings per share,the net profit or loss for the year attributable to equityshareholders and the weighted average number of equityshares outstanding during the year are adjusted for theeffects of all dilutive potential equity shares.
p. Provisions
A provision is recognized when the company has a presentobligation as a result of past event, it is probable that anoutflow of resources embodying economic benefits will berequired to settle the obligation and a reliable estimatecan be made of the amount of the obligation. Provisionsare not discounted to their present value and aredetermined based on the best estimate required to settlethe obligation at the reporting date. These estimates arereviewed at each reporting date and adjusted to reflectthe current best estimates.
q. Cash and cash equivalents
Cash and cash equivalents in the cash flow statementscomprise cash at bank and in hand and short-terminvestments with an original maturity of three months orless.
r. Employee stock compensation cost
Measurement and disclosure of the employee share-basedpayment plans is done in accordance with SEBI (EmployeeStock Option Scheme and Employee Stock Purchase Scheme)Guidelines, 1999 and the Guidance Note on Accountingfor Employee Share Based Payments Plans, issued by theInstitute of Chartered Accountants of India. The Companymeasures compensation cost relating to employee stockoptions using the intrinsic value method. Compensationexpense, if any, is amortized over the vesting period ofthe option on a straight line basis.
s. Contingent liabilities
A contingent liability is possible obligation that arisesfrom past events whose existence will be confirmed by theoccurrence or non occurrence of one or more uncertainfuture events beyond the control of Company or a presentobligation that is not recognized because it is not probablethat an outflow of resources will be required to settle theobligation. A contingent liability also arises in extremelyrare cases where there is a liability that can not berecognized because it can not be measure reliably. TheCompany does not recognize the contingent liability butdiscloses its existence in the financial statements.
t. Borrowing cost
Borrowing cost includes interest incurred in connectionwith the arrangement of borrowings and exchangedifferences arising from foreign currency borrowings tothe extent they are regarded as an adjustment to theinterest cost.

Aurobindo Annual Report 2012-13 / 65
As at As atMarch 31, 2013 March 31, 2012
2. SHARE CAPITAL
AUTHORISED 660,000,000 (March 31, 2012: 660,000,000)
equity shares of `1 each 660.0 660.01,000,000 (March 31, 2012: 1,000,000)preference shares of `100 each 100.0 100.0
760.0 760.0ISSUED, SUBSCRIBEDAND FULLY PAID-UP SHARES
291,211,290 (March 31, 2012: 291,121,290)equity shares of `1 each 291.2 291.1TOTAL 291.2 291.1
a. Reconciliation of the equity shares outstanding at the beginning and at the end of the year As at March 31, 2013 As at March 31, 2012
Numbers Value Numbers Value
Equity shares
At the beginning of the year 291,121,290 291.1 291,121,290 291.1
Issued during the year under employee stock option plan 90,000 0.1 – –
Outstanding at the end of the year 291,211,290 291.2 291,121,290 291.1
b. Terms/rights attached to equity shares
The Company has only one class of equity shares having a par values of `1 per share. Each holder of equity shares is entitled to onevote per share.
The Company declares and pays dividends in Indian rupees. The dividend proposed by the Board of Directors is subject to theapproval of shareholders in the ensuing Annual General Meeting.
During the year ended March 31, 2013, the amount of dividend per share recognized as distributions to equity shareholders was `1.5(March 31, 2012: `1) including interim dividend of `1 (March 31, 2012: Nil).
In the event of liquidation of the Company, the holders of equity shares will be entitled to receive remaining assets of the Company,after distribution of all preferential amounts. However, no such preferential amounts exist currently. The distribution will be inproportion to the number of equity shares held by the shareholders.
c. Details of shareholders holding more than 5% equity shares in the Company As at March 31, 2013 As at March 31, 2012
Number % holding Numbers % holding
Mr. P.V. Ramprasad Reddy 19,481,440 6.69 19,481,440 6.69
Mrs. P. Suneela Rani 90,830,550 31.19 90,830,550 31.20
TOTAL 110,311,990 110,311,990
As per records of the Company, including its register of shareholders/members and other declarations received from shareholders
regarding beneficial interest, the above shareholding represents both legal and beneficial ownerships of shares.
d. For details of shares reserved for issue under Employee Stock Option Plan (ESOP) of the Company, Refer Note 31.
Notes to financial statements for the year ended March 31, 2013
(All amounts in Indian Rupees million, except share data and where otherwise stated)

As at As atMarch 31, 2013 March 31, 2012
3. RESERVES AND SURPLUS
CAPITAL RESERVE 91.1 91.1
CAPITAL REDEMPTION RESERVE 90.0 90.0
SECURITIES PREMIUM
ACCOUNT As per last Balance Sheet 3,442.1 3,442.1
Add: Premium on conversion of Foreign Currency
Convertible Bonds – –
Add: Premium on exercise of employee stock options 8.2 –
3,450.3 3,442.1
GENERAL RESERVE As per last Balance Sheet 6,220.3 6,220.3
Add: Transferred from Statement of Profit and Loss 496.0 –
6,716.3 6,220.3
SURPLUS IN THE STATEMENT OF PROFIT AND LOSS
Balance as per last financial statements 14,797.1 15,561.5
Profit/(loss) for the year 4,959.9 (426.1)
Less: Appropriations
On equity shares of `1 each
Proposed dividend @ `0.5 (Previous year - `1) 145.6 291.1
Interim dividend paid @ `1 (Previous year - Nil) 291.2 –
Tax on dividend 72.0 47.2
Transfer to general reserve 496.0 –
Total appropriations 1,004.8 338.3
NET SURPLUS IN THE STATEMENT OF PROFIT AND LOSS 18,752.2 14,797.1
TOTAL 29,099.8 24,640.6
Notes to financial statements for the year ended March 31, 2013
(All amounts in Indian Rupees million, except share data and where otherwise stated)
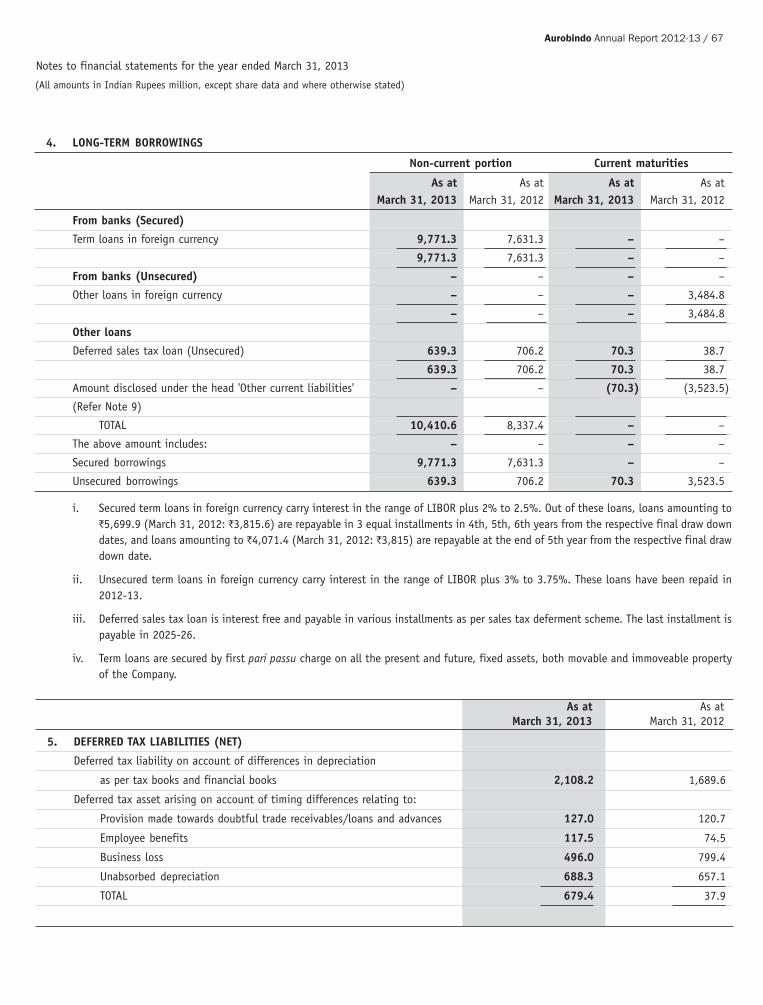
Aurobindo Annual Report 2012-13 / 67
4. LONG-TERM BORROWINGS
Non-current portion Current maturities
As at As at As at As atMarch 31, 2013 March 31, 2012 March 31, 2013 March 31, 2012
From banks (Secured)
Term loans in foreign currency 9,771.3 7,631.3 – –
9,771.3 7,631.3 – –
From banks (Unsecured) – – – –
Other loans in foreign currency – – – 3,484.8
– – – 3,484.8
Other loans
Deferred sales tax loan (Unsecured) 639.3 706.2 70.3 38.7
639.3 706.2 70.3 38.7
Amount disclosed under the head 'Other current liabilities' – – (70.3) (3,523.5)
(Refer Note 9)
TOTAL 10,410.6 8,337.4 – –
The above amount includes: – – – –
Secured borrowings 9,771.3 7,631.3 – –
Unsecured borrowings 639.3 706.2 70.3 3,523.5
i. Secured term loans in foreign currency carry interest in the range of LIBOR plus 2% to 2.5%. Out of these loans, loans amounting to`5,699.9 (March 31, 2012: `3,815.6) are repayable in 3 equal installments in 4th, 5th, 6th years from the respective final draw downdates, and loans amounting to `4,071.4 (March 31, 2012: `3,815) are repayable at the end of 5th year from the respective final drawdown date.
ii. Unsecured term loans in foreign currency carry interest in the range of LIBOR plus 3% to 3.75%. These loans have been repaid in2012-13.
iii. Deferred sales tax loan is interest free and payable in various installments as per sales tax deferment scheme. The last installment ispayable in 2025-26.
iv. Term loans are secured by first pari passu charge on all the present and future, fixed assets, both movable and immoveable propertyof the Company.
As at As atMarch 31, 2013 March 31, 2012
5. DEFERRED TAX LIABILITIES (NET)
Deferred tax liability on account of differences in depreciation
as per tax books and financial books 2,108.2 1,689.6
Deferred tax asset arising on account of timing differences relating to:
Provision made towards doubtful trade receivables/loans and advances 127.0 120.7
Employee benefits 117.5 74.5
Business loss 496.0 799.4
Unabsorbed depreciation 688.3 657.1
TOTAL 679.4 37.9
Notes to financial statements for the year ended March 31, 2013
(All amounts in Indian Rupees million, except share data and where otherwise stated)

6. PROVISIONSLong-term Short-termAs at As at As at As at
March 31, 2013 March 31, 2012 March 31, 2013 March 31, 2012
For employee benefitsGratuity (Refer Note 32) 85.0 41.2 30.0 25.0Compensated absences – – 230.7 163.5
85.0 41.2 260.7 188.5Other provisions – – – –
For proposed dividend – – 145.6 291.1For tax on proposed dividend – – 24.8 47.2Provision for income tax (Net of advance tax) – – 216.4 48.7
– – 386.8 387.0TOTAL 85.0 41.2 647.5 575.5
As at As atMarch 31, 2013 March 31, 2012
7. SHORT-TERM BORROWINGSLoans repayable on demand from banks - working capital loans
Cash credit facilities (secured) 62.2 5.0Buyers credit (secured) 2,700.2 2,444.1Buyers credit (unsecured) 1,152.4 878.5Packing credit loans (secured) 4,737.8 4,341.3Packing credit loans (unsecured) 6,115.0 7,654.5
Short-term loans from banks (secured) 1,485.7 508.8Short-term loans from banks (unsecured) 1,085.7 250.0
TOTAL 17,339.0 16,082.1The above amount includes
Secured borrowings 8,985.9 7,299.1Unsecured borrowings 8,353.1 8,783.0
17,339.0 16,082.1
All secured loans payable on demand and secured short-term loans from banks are secured by first charge by way of hypothecation of all the stocks, book debts and other current assets
(both present and future) and second charge on all the fixed assets of the Company both present and future subject to charges created in favour of term lenders.
8. TRADE PAYABLESTrade payables for supplies and services 9,012.8 5,848.5(Refer Note 35 for details of dues to Micro, Small & Medium Enterprises)
9. OTHER CURRENT LIABILITIESCurrent maturities of long-term borrowings (Refer Note 4) 70.3 3,523.5Creditors for capital goods 264.3 253.0Trade deposits 0.1 1.0Unclaimed dividend (Refer Note 36) 7.8 5.4Interest accrued but not due on borrowings 107.3 92.4Advance from customers 144.9 58.4Other payables – –
Statutory liabilities 85.7 96.4Others – 27.6TOTAL 680.4 4,057.8
Notes to financial statements for the year ended March 31, 2013
(All amounts in Indian Rupees million, except share data and where otherwise stated)
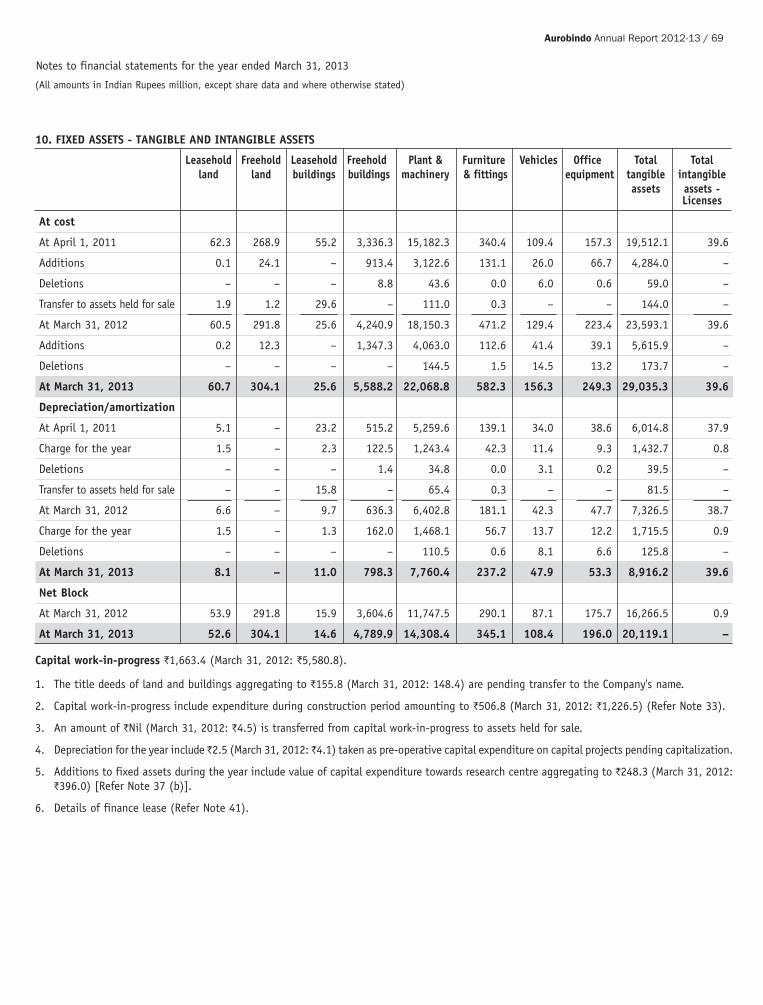
Aurobindo Annual Report 2012-13 / 69
10. FIXED ASSETS - TANGIBLE AND INTANGIBLE ASSETS
Leasehold Freehold Leasehold Freehold Plant & Furniture Vehicles Office Total Totalland land buildings buildings machinery & fittings equipment tangible intangible
assets assets -Licenses
At cost
At April 1, 2011 62.3 268.9 55.2 3,336.3 15,182.3 340.4 109.4 157.3 19,512.1 39.6
Additions 0.1 24.1 – 913.4 3,122.6 131.1 26.0 66.7 4,284.0 –
Deletions – – – 8.8 43.6 0.0 6.0 0.6 59.0 –
Transfer to assets held for sale 1.9 1.2 29.6 – 111.0 0.3 – – 144.0 –
At March 31, 2012 60.5 291.8 25.6 4,240.9 18,150.3 471.2 129.4 223.4 23,593.1 39.6
Additions 0.2 12.3 – 1,347.3 4,063.0 112.6 41.4 39.1 5,615.9 –
Deletions – – – – 144.5 1.5 14.5 13.2 173.7 –
At March 31, 2013 60.7 304.1 25.6 5,588.2 22,068.8 582.3 156.3 249.3 29,035.3 39.6
Depreciation/amortization
At April 1, 2011 5.1 – 23.2 515.2 5,259.6 139.1 34.0 38.6 6,014.8 37.9
Charge for the year 1.5 – 2.3 122.5 1,243.4 42.3 11.4 9.3 1,432.7 0.8
Deletions – – – 1.4 34.8 0.0 3.1 0.2 39.5 –
Transfer to assets held for sale – – 15.8 – 65.4 0.3 – – 81.5 –
At March 31, 2012 6.6 – 9.7 636.3 6,402.8 181.1 42.3 47.7 7,326.5 38.7
Charge for the year 1.5 – 1.3 162.0 1,468.1 56.7 13.7 12.2 1,715.5 0.9
Deletions – – – – 110.5 0.6 8.1 6.6 125.8 –
At March 31, 2013 8.1 – 11.0 798.3 7,760.4 237.2 47.9 53.3 8,916.2 39.6
Net Block
At March 31, 2012 53.9 291.8 15.9 3,604.6 11,747.5 290.1 87.1 175.7 16,266.5 0.9
At March 31, 2013 52.6 304.1 14.6 4,789.9 14,308.4 345.1 108.4 196.0 20,119.1 –
Capital work-in-progress `1,663.4 (March 31, 2012: `5,580.8).
1. The title deeds of land and buildings aggregating to `155.8 (March 31, 2012: 148.4) are pending transfer to the Company's name.
2. Capital work-in-progress include expenditure during construction period amounting to `506.8 (March 31, 2012: `1,226.5) (Refer Note 33).
3. An amount of `Nil (March 31, 2012: `4.5) is transferred from capital work-in-progress to assets held for sale.
4. Depreciation for the year include ̀ 2.5 (March 31, 2012: ̀ 4.1) taken as pre-operative capital expenditure on capital projects pending capitalization.
5. Additions to fixed assets during the year include value of capital expenditure towards research centre aggregating to `248.3 (March 31, 2012:`396.0) [Refer Note 37 (b)].
6. Details of finance lease (Refer Note 41).
Notes to financial statements for the year ended March 31, 2013
(All amounts in Indian Rupees million, except share data and where otherwise stated)
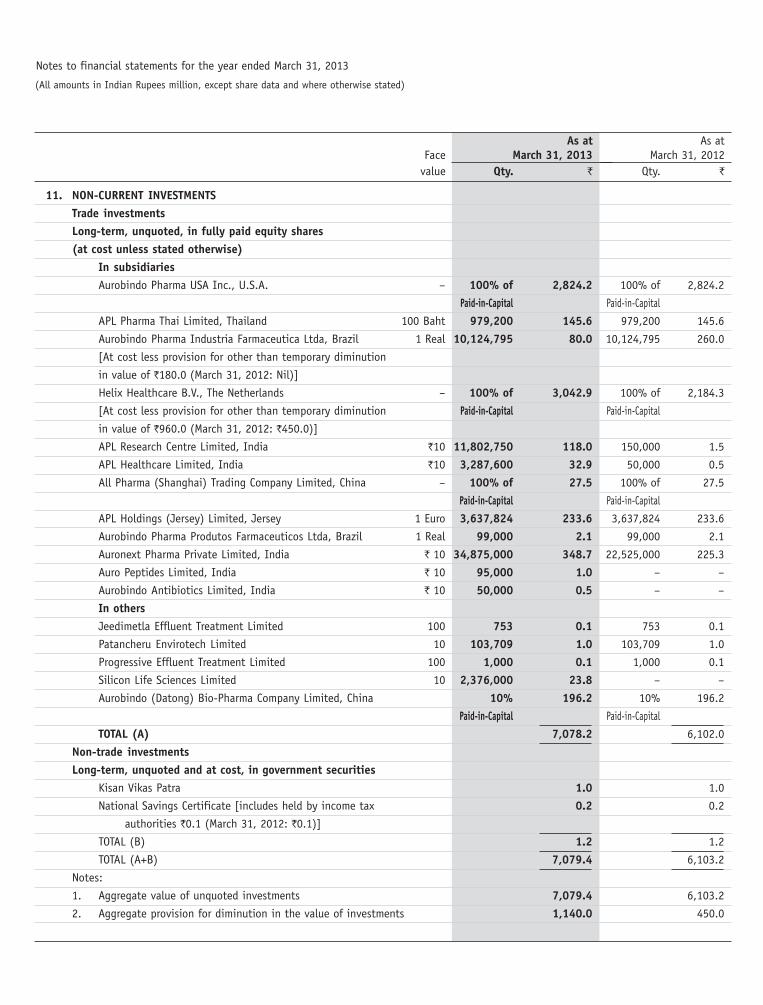
11. NON-CURRENT INVESTMENTSTrade investmentsLong-term, unquoted, in fully paid equity shares(at cost unless stated otherwise)
In subsidiariesAurobindo Pharma USA Inc., U.S.A. – 100% of 2,824.2 100% of 2,824.2
Paid-in-Capital Paid-in-Capital
APL Pharma Thai Limited, Thailand 100 Baht 979,200 145.6 979,200 145.6
Aurobindo Pharma Industria Farmaceutica Ltda, Brazil 1 Real 10,124,795 80.0 10,124,795 260.0
[At cost less provision for other than temporary diminution
in value of `180.0 (March 31, 2012: Nil)]
Helix Healthcare B.V., The Netherlands – 100% of 3,042.9 100% of 2,184.3
[At cost less provision for other than temporary diminution Paid-in-Capital Paid-in-Capital
in value of `960.0 (March 31, 2012: `450.0)]
APL Research Centre Limited, India `10 11,802,750 118.0 150,000 1.5
APL Healthcare Limited, India `10 3,287,600 32.9 50,000 0.5
All Pharma (Shanghai) Trading Company Limited, China – 100% of 27.5 100% of 27.5
Paid-in-Capital Paid-in-Capital
APL Holdings (Jersey) Limited, Jersey 1 Euro 3,637,824 233.6 3,637,824 233.6
Aurobindo Pharma Produtos Farmaceuticos Ltda, Brazil 1 Real 99,000 2.1 99,000 2.1
Auronext Pharma Private Limited, India ` 10 34,875,000 348.7 22,525,000 225.3
Auro Peptides Limited, India ` 10 95,000 1.0 – –
Aurobindo Antibiotics Limited, India ` 10 50,000 0.5 – –
In othersJeedimetla Effluent Treatment Limited 100 753 0.1 753 0.1
Patancheru Envirotech Limited 10 103,709 1.0 103,709 1.0
Progressive Effluent Treatment Limited 100 1,000 0.1 1,000 0.1
Silicon Life Sciences Limited 10 2,376,000 23.8 – –
Aurobindo (Datong) Bio-Pharma Company Limited, China 10% 196.2 10% 196.2
Paid-in-Capital Paid-in-Capital
TOTAL (A) 7,078.2 6,102.0
Non-trade investmentsLong-term, unquoted and at cost, in government securities
Kisan Vikas Patra 1.0 1.0
National Savings Certificate [includes held by income tax 0.2 0.2
authorities `0.1 (March 31, 2012: `0.1)]
TOTAL (B) 1.2 1.2
TOTAL (A+B) 7,079.4 6,103.2
Notes:
1. Aggregate value of unquoted investments 7,079.4 6,103.2
2. Aggregate provision for diminution in the value of investments 1,140.0 450.0
As at As atFace March 31, 2013 March 31, 2012
value Qty. ` Qty. `
Notes to financial statements for the year ended March 31, 2013
(All amounts in Indian Rupees million, except share data and where otherwise stated)
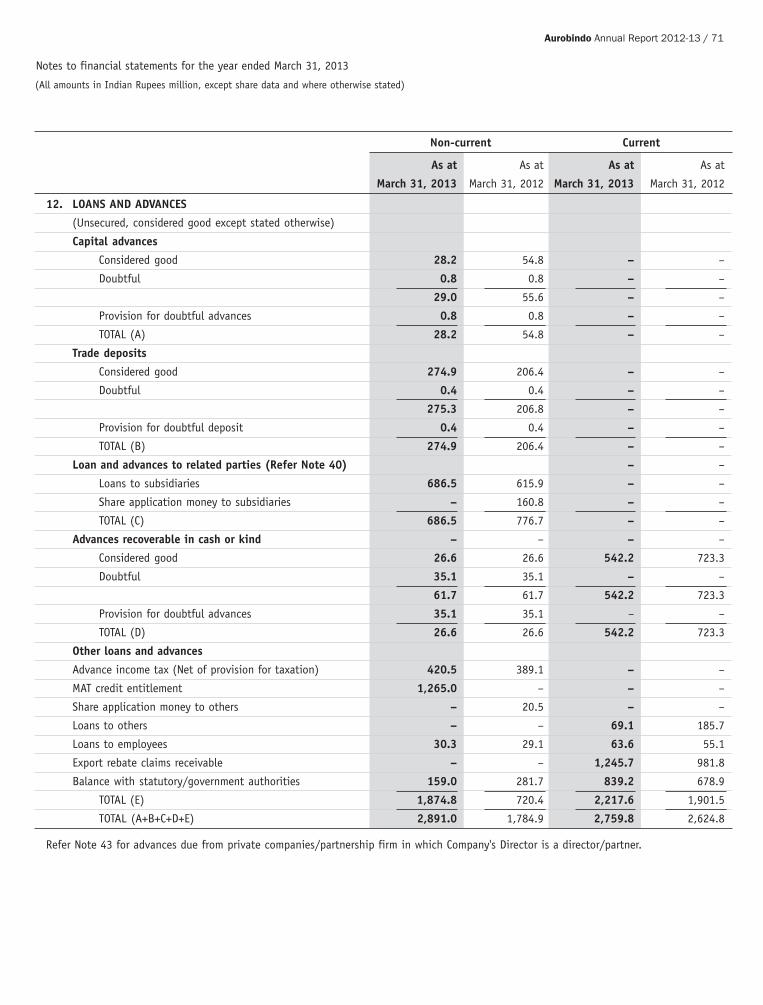
Aurobindo Annual Report 2012-13 / 71
Non-current Current
As at As at As at As at
March 31, 2013 March 31, 2012 March 31, 2013 March 31, 2012
12. LOANS AND ADVANCES
(Unsecured, considered good except stated otherwise)
Capital advances
Considered good 28.2 54.8 – –
Doubtful 0.8 0.8 – –
29.0 55.6 – –
Provision for doubtful advances 0.8 0.8 – –
TOTAL (A) 28.2 54.8 – –
Trade deposits
Considered good 274.9 206.4 – –
Doubtful 0.4 0.4 – –
275.3 206.8 – –
Provision for doubtful deposit 0.4 0.4 – –
TOTAL (B) 274.9 206.4 – –
Loan and advances to related parties (Refer Note 40) – –
Loans to subsidiaries 686.5 615.9 – –
Share application money to subsidiaries – 160.8 – –
TOTAL (C) 686.5 776.7 – –
Advances recoverable in cash or kind – – – –
Considered good 26.6 26.6 542.2 723.3
Doubtful 35.1 35.1 – –
61.7 61.7 542.2 723.3
Provision for doubtful advances 35.1 35.1 – –
TOTAL (D) 26.6 26.6 542.2 723.3
Other loans and advances
Advance income tax (Net of provision for taxation) 420.5 389.1 – –
MAT credit entitlement 1,265.0 – – –
Share application money to others – 20.5 – –
Loans to others – – 69.1 185.7
Loans to employees 30.3 29.1 63.6 55.1
Export rebate claims receivable – – 1,245.7 981.8
Balance with statutory/government authorities 159.0 281.7 839.2 678.9
TOTAL (E) 1,874.8 720.4 2,217.6 1,901.5
TOTAL (A+B+C+D+E) 2,891.0 1,784.9 2,759.8 2,624.8
Refer Note 43 for advances due from private companies/partnership firm in which Company's Director is a director/partner.
Notes to financial statements for the year ended March 31, 2013
(All amounts in Indian Rupees million, except share data and where otherwise stated)

Non-current Current
As at As at As at As at
March 31, 2013 March 31, 2012 March 31, 2013 March 31, 2012
13. TRADE RECEIVABLES
(Unsecured, considered good unless stated otherwise)
Outstanding for a period exceeding six months from the
date they are due for payment
Considered good – – 678.4 913.0
Doubtful 11.3 190.8 325.9 144.9
11.3 190.8 1,004.3 1,057.9
Provision for doubtful receivables 11.3 190.8 325.9 144.9
TOTAL (A) – – 678.4 913.0
Others
Considered good (B) – – 16,627.5 13,349.8
TOTAL (A+B) – – 17,305.9 14,262.8
Refer Note 44 for trade receivables due from private companies/partnership firm in which Company’s Director is a director/partner.
As at As atMarch 31, 2013 March 31, 2012
14. OTHER CURRENT ASSETS
(Unsecured, considered good unless stated otherwise)
Unamortized premium on forward contract – 29.6
Insurance claim receivable 38.3 127.3
Export incentives receivable 608.0 486.1
Assets held for sale 64.3 67.0
Interest accrued on deposits 20.6 9.7
Interest accrued on investments 0.6 0.6
Interest accrued on loans to subsidiaries 23.0 27.4
Receivables - others 23.1 19.8
TOTAL 777.9 767.5
15. OTHER NON-CURRENT ASSETS
(Unsecured, considered good unless stated otherwise)
Export incentives receivable 154.6 –
Non-current bank balances (Refer Note 18) 31.2 1.2
TOTAL 185.8 1.2
Notes to financial statements for the year ended March 31, 2013
(All amounts in Indian Rupees million, except share data and where otherwise stated)

Aurobindo Annual Report 2012-13 / 73
16. CURRENT INVESTMENTS
Current portion of long-term investment (at cost)
Aurobindo (Datong) Bio-Pharma Company Limited, China – – 9.5% 186.4
(unquoted, in fully paid equity shares) Paid-in-Capital
Unquoted, in fully paid equity shares, at lower of cost and market value
Citadel Aurobindo Biotech Limited, India 100 70,000 – 70,000 –
[Aggregate provision for diminution in value of `7.0
(March 31, 2012: `7.0)]
Quoted, in fully paid equity shares, at lower of cost and market value
Andhra Bank 10 4,520 0.4 4,520 0.4
TOTAL 0.4 186.8
1. Aggregate value of unquoted investments – 186.4
2. Aggregate value of quoted investments 0.4 0.4
3. Market value of quoted investments 0.4 0.5
4. Aggregate provision for diminution in the value of investments 7.0 7.0
As at As atFace March 31, 2013 March 31, 2012
value Qty ` Qty `
As at As atMarch 31, 2013 March 31, 2012
17. INVENTORIES
(Valued at lower of cost and net realizable value)
Raw materials [includes in-transit `316.1 (March 31,2012: `453.5)] 6,670.3 5,690.7
Packing materials 808.5 903.3
Work-in-progress (Refer Note 22) 4,989.6 4,236.1
Finished goods [includes in-transit `65.4 (March 31, 2012: `186.4) Refer Note 22] 1,246.9 778.2
Trading goods (Refer Note 22) – 11.4
Stores, spares and consumables 602.0 572.9
TOTAL 14,317.3 12,192.6
Notes to financial statements for the year ended March 31, 2013
(All amounts in Indian Rupees million, except share data and where otherwise stated)

Non-current CurrentAs at As at As at As at
March 31, 2013 March 31, 2012 March 31, 2013 March 31, 2012
18. CASH AND BANK BALANCES
Cash and cash equivalents
Balance with banks:
On current accounts – – 1,050.3 31.9
On cash credit accounts – – 82.3 96.3
On unpaid dividend account – – 7.8 5.4
Cash on hand – – 5.3 6.5
– – 1,145.7 140.1
Other bank balances – – – –
Margin money deposits* 31.2 1.2 – –
31.2 1.2 – –
Amount disclosed under non–current assets (Refer Note 15) (31.2) (1.2) – –
TOTAL – – 1,145.7 140.1
* Given against bank guarantees and performance guarantees.
Margin money deposits include deposits attached by Enforcement Directorate of `30.0 (March 31, 2012: Nil).
Year ended Year endedMarch 31, 2013 March 31, 2012
19. REVENUE FROM OPERATIONS (GROSS)
Sale of products 54,641.4 42,494.4
Sale of services 331.7 524.4
Other operating revenue
Scrap sales 36.5 46.1
Export incentives 685.4 722.4
TOTAL 55,695.0 43,787.3
Details of sale of products
Active Pharmaceutical Ingredients (APIs) & Intermediates 23,708.5 19,107.0
Formulations - Tablets & Capsules 26,804.5 20,224.6
Formulations - Injections 1,366.1 1,350.8
Formulations - Syrups 1,036.2 707.4
API trading goods 698.7 350.0
Others 1,027.4 754.6
54,641.4 42,494.4
Details of services
Dossier income 297.6 496.4
Service income 34.1 28.0
331.7 524.4
Notes to financial statements for the year ended March 31, 2013
(All amounts in Indian Rupees million, except share data and where otherwise stated)

Aurobindo Annual Report 2012-13 / 75
Year ended Year endedMarch 31, 2013 March 31, 2012
20. OTHER INCOME
Interest income on
Bank deposits 1.5 35.7
Other advances and deposits 22.5 18.6
Loans to subsidiaries 17.2 16.7
Dividend income on
Current investments-trade – –
Balances no longer required written back 7.9 14.3
Profit on sale of fixed assets (Net) – 5.8
Profit on sale of investment 46.8 –
Foreign exchange gain (Net) 115.0 –
Miscellaneous income 54.2 99.5
TOTAL 265.1 190.6
21. COST OF MATERIALS CONSUMED
Raw material consumed
Opening stock 5,690.7 5,482.2
Add: Purchases 29,086.6 22,063.0
34,777.3 27,545.2
Less: Closing stock 6,670.3 5,690.7
Cost of raw material consumed 28,107.0 21,854.5
Packing materials consumed 2,429.4 2,078.4
TOTAL 30,536.4 23,932.9
Details of cost of materials consumed
Material name
6 APA 3,138.0 2,659.0
7 ACA 1,043.9 1,072.9
Beta-Thymidine 1,283.3 1,456.3
Ceftriaxone Sodium 1,034.5 787.9
7 ADCA 875.1 690.6
Amino Carbinol 271.4 526.7
Others - packing materials 2,429.4 2,078.4
- others 20,460.8 14,661.1
30,536.4 23,932.9
Notes to financial statements for the year ended March 31, 2013
(All amounts in Indian Rupees million, except share data and where otherwise stated)
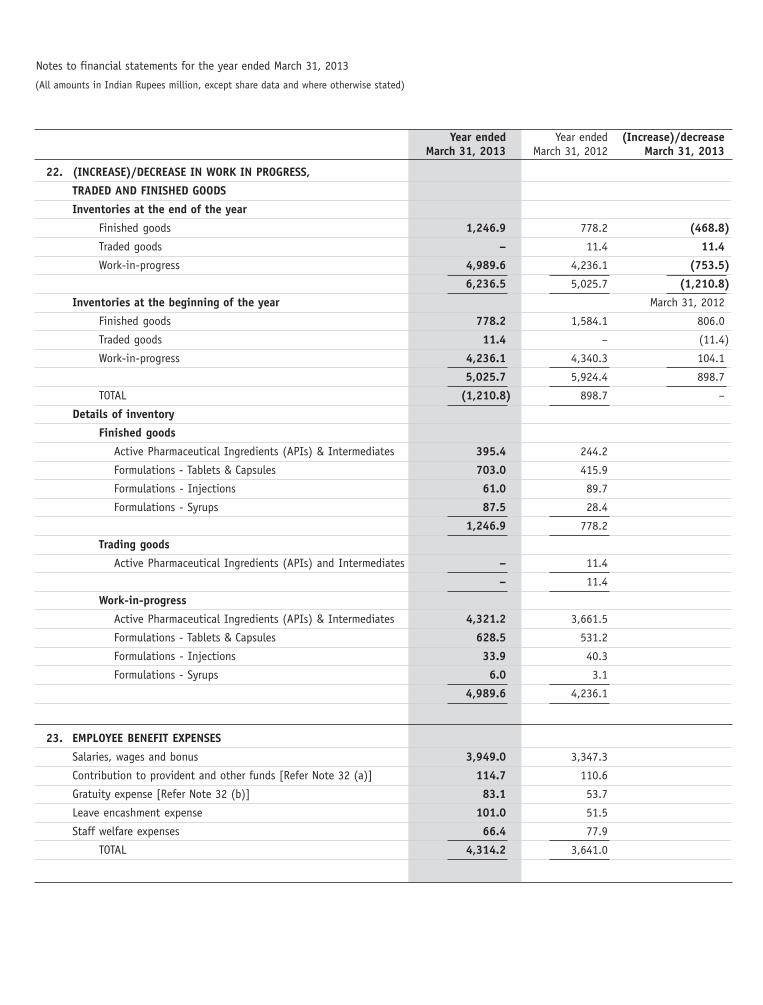
Year ended Year ended (Increase)/decreaseMarch 31, 2013 March 31, 2012 March 31, 2013
22. (INCREASE)/DECREASE IN WORK IN PROGRESS,
TRADED AND FINISHED GOODS
Inventories at the end of the year
Finished goods 1,246.9 778.2 (468.8)
Traded goods – 11.4 11.4
Work-in-progress 4,989.6 4,236.1 (753.5)
6,236.5 5,025.7 (1,210.8)
Inventories at the beginning of the year March 31, 2012
Finished goods 778.2 1,584.1 806.0
Traded goods 11.4 – (11.4)
Work-in-progress 4,236.1 4,340.3 104.1
5,025.7 5,924.4 898.7
TOTAL (1,210.8) 898.7 –
Details of inventory
Finished goods
Active Pharmaceutical Ingredients (APIs) & Intermediates 395.4 244.2
Formulations - Tablets & Capsules 703.0 415.9
Formulations - Injections 61.0 89.7
Formulations - Syrups 87.5 28.4
1,246.9 778.2
Trading goods
Active Pharmaceutical Ingredients (APIs) and Intermediates – 11.4
– 11.4
Work-in-progress
Active Pharmaceutical Ingredients (APIs) & Intermediates 4,321.2 3,661.5
Formulations - Tablets & Capsules 628.5 531.2
Formulations - Injections 33.9 40.3
Formulations - Syrups 6.0 3.1
4,989.6 4,236.1
23. EMPLOYEE BENEFIT EXPENSES
Salaries, wages and bonus 3,949.0 3,347.3
Contribution to provident and other funds [Refer Note 32 (a)] 114.7 110.6
Gratuity expense [Refer Note 32 (b)] 83.1 53.7
Leave encashment expense 101.0 51.5
Staff welfare expenses 66.4 77.9
TOTAL 4,314.2 3,641.0
Notes to financial statements for the year ended March 31, 2013
(All amounts in Indian Rupees million, except share data and where otherwise stated)

Aurobindo Annual Report 2012-13 / 77
Year ended Year endedMarch 31, 2013 March 31, 2012
24. OTHER EXPENSES
Conversion charges 307.9 233.1
Consumption of stores and spares 608.2 644.6
Chemicals consumed 804.9 801.5
Power and fuel 3,163.4 2,266.4
Carriage inward 320.0 256.0
Factory maintenance 131.5 145.0
Effluent treatment expenses 55.3 41.1
(Increase)/decrease of excise duty on inventory (Refer Note 42) 4.2 (31.8)
Repairs and maintenance
i. Plant and machinery 399.8 336.9
ii. Buildings 175.1 164.7
iii. Others 27.0 28.1
Rent 17.1 23.8
Rates and taxes 71.5 77.1
Printing and stationery 82.4 91.1
Postage and telephones 39.5 28.7
Insurance 125.3 95.9
Legal and professional charges 267.8 273.7
Directors’ sitting fees 0.7 0.8
Remuneration to auditors (Refer Note 38) 7.6 7.3
Sales commission 317.3 278.1
Carriage outwards 1,142.4 970.8
Selling expenses 208.5 114.5
Rebates and discounts 15.2 44.3
Travelling and conveyance 93.8 96.9
Vehicle maintenance expenses 4.6 3.9
Analytical charges 360.6 343.7
Provision for diminution on non-current investment 690.0 268.7
Bad debts written off 183.4 32.9
Donations (Refer Note 39) 1.7 4.1
Registration and filing charges 261.9 42.4
Provision for trade receivables (Net) 1.5 94.6
Loss on sale of assets (Net) 30.7 –
Foreign exchange loss (Net) – 214.9
Miscellaneous expenses 328.9 258.0
TOTAL 10,249.7 8,251.7
Notes to financial statements for the year ended March 31, 2013
(All amounts in Indian Rupees million, except share data and where otherwise stated)

Year ended Year endedMarch 31, 2013 March 31, 2012
25. DEPRECIATION/AMORTIZATION
Depreciation of tangible assets 1713.0 1,428.7
Amortization of intangible assets 0.9 0.7
TOTAL 1,713.9 1,429.4
26. FINANCE COSTS
Interest on loans from banks 991.2 730.3
Bank charges 156.2 200.8
Exchange difference to the extent considered as an adjustment to borrowing costs 1,353.2 1,744.7
TOTAL 2,500.6 2,675.8
27. EXCEPTIONAL ITEMS
Redemption premium (Yield to Maturity) on redemption of FCCB Bonds – 3,198.6
(Refer Note below)
– 3,198.6
Note: The outstanding Tranche A and Tranche B Zero Coupon Foreign Currency Convertible Bonds ('FCCB' or 'Bonds') of USD 139.20 Million,issued in May 2006, were repaid in entirety on maturity in the previous year along with the redemption premium (Yield to Maturity)amounting to `3,198.6, inclusive of withholding taxes.
28. Capital and other commitments
Estimated amount of contracts (net of advances) remaining to be executed on capital account and not provided for - `211.5(March 31, 2012: `476.5).
29. Contingent liabilities
Particulars As at As atMarch 31, 2013 March 31, 2012
Outstanding bank guarantees 486.3 391.9
Claims arising from disputes not acknowledged as debts
- indirect taxes (excise duty and service tax)* 196.3 140.7
Claims arising from disputes not acknowledged as debts - direct taxes* 105.0 105.0
Claims against the Company not acknowledged as debts* 493.1 23.7
Bills discounted with banks 3,252.9 –
Corporate guarantee to bank for loan taken by 100% subsidiary – 1,589.8
* in respect of above matters, future cash outfows in respect of contingent liabilities are determinable only on receipt of judgementspending at various forums/authorities.
30. The income tax authorities had carried out search operations on the Company at certain locations during the previous year. The Company hasfully co-operated with the authorities and various statements were recorded during the course of these operations. In order to avoid possiblelitigations, without admitting any irregularities, the Company had decided to offer an additional income and to pay the resultant tax.Accordingly, provision for income tax of `48.7 on this additional income had been made in the previous year. The proceedings are in progressand no other material implications are expected by the management in this matter.
Notes to financial statements for the year ended March 31, 2013
(All amounts in Indian Rupees million, except share data and where otherwise stated)

Aurobindo Annual Report 2012-13 / 79
31. Employee stock options
a. Employee Stock Option Plan 'ESOP-2004'
The Company instituted an Employee Stock Option Plan 'ESOP-2004' as per the special resolution passed in the 17th Annual GeneralMeeting held on July 31, 2004. This scheme has been formulated in accordance with the Securities Exchange Board of India (EmployeeStock Option Scheme and Employee Stock Purchase Scheme) Guidelines, 1999 to grant options of 2,538,500 to eligible employees onAugust 1, 2004 and July 28, 2005. The method of settlement under scheme is by issue of equity shares of the Company. Each optioncomprises of one underlying equity share of `1 each. The said options vest on an annual basis at 15%, 20%, 25% and 40% over a periodof four years and can be exercised over a period of six years from the date of grant of options.
The options have been granted at the then prevailing market price of `72.52 per share and hence the question of accounting foremployee deferred compensation expenses does not arise as the Company follows intrinsic value method.
The details of options outstanding of ESOP 2004 Scheme:
Year ended Year endedMarch 31, 2013 March 31, 2012
Options outstanding at the beginning of the year – 11,345
Granted during the year – –
Vested/exercisable during the year – –
Exercised during the year – –
Forfeited during the year subject to reissue – 11,345
Options outstanding at end of the year – –
Exercisable at the end of the year – –
Weighted average exercise price (`) – 72.52
Weighted average fair value of options at the date of grant (`) – 75.03
b. Employee Stock Option Plan 'ESOP-2006'
The Company instituted an Employee Stock Option Plan 'ESOP-2006' as per the special resolution passed in the 19th Annual GeneralMeeting held on September 18, 2006. This scheme has been formulated in accordance with the Securities Exchange Board of India(Employee Stock Option Scheme and Employee Stock Purchase Scheme) Guidelines, 1999. The Compensation Committee accordingly,granted total 3,210,500 options under seven grants of 175,000, 25,000, 90,000, 1,205,000, 300,000, 500,000 and 915,500 options toeligible employees on October 30, 2006, July 31, 2007, October 31, 2007, December 16, 2011, June 19, 2012, January 9, 2013 andJanuary 28, 2013 respectively. The method of settlement under scheme is by issue of equity shares of the Company. Each optioncomprises of one underlying equity share of `1 each. The said options vest on an annual basis at 10%, 15%, 25% and 50% over a periodof four years and can be exercised over a period of six years from the date of grant of options. The options have been granted at thethen prevailing market price of `120.70, `132.35, `114.50, `91.60, `106.05, `200.70 and `187.40 per share respectively andhence the question of accounting for employee deferred compensation expenses does not arise as the Company follows intrinsic valuemethod.
The details of options outstanding of ESOP 2006 Scheme:
Year ended Year endedMarch 31, 2013 March 31, 2012
Options outstanding at the beginning of the year 1,255,000 250,000
Granted during the year 1,715,500 1,205,000
Vested/exercisable during the year – 12,500
Exercised during the year 90,000 –
Forfeited during the year subject to reissue 416,500 200,000
Options outstanding at end of the year 2,464,000 1,255,000
Exercisable at the end of the year 43,000 50,000
Weighted average exercise price (`) 99.59 97.07
Weighted average fair value of options at the date of grant (`) 118.34 115.56
Notes to financial statements for the year ended March 31, 2013
(All amounts in Indian Rupees million, except share data and where otherwise stated)

Range of Number of options Weighted average remainingexercise prices (`) outstanding contractual life of options (in years)
As at March 31, 2013 91 to 201 2,464,000 5.30
As at March 31, 2012 91 to 133 1,255,000 5.53
c. Disclosure as per Fair Value Method
The Company’s net profit/(loss) and earnings per share would have been as under, had the compensation cost for employees’ stockoptions been recognized based on the fair value at the date of grant in accordance with ''Black Scholes'' model.
Year ended Year endedMarch 31, 2013 March 31, 2012
Profit/(loss) after taxationAs reported in Statement of Profit and Loss 4,959.9 (426.1)
Less: Additional employee compensation cost based on Fair Value 2.9 0.7
Profit/(loss) after taxation as per Fair Value Method 4,957.0 (426.8)
Earnings per shareBasic
No. of shares 291,141,509 291,121,290
EPS as reported (`) 17.04 (1.46)
EPS as per Fair Value Method (`) 17.03 (1.47)
Diluted
No. of shares 291,355,959 291,127,562
EPS as reported (`) 17.02 (1.46)
EPS as per Fair Value Method (`) 17.01 (1.47)
The following assumptions were used for calculation of fair value of grants:
Year ended Year endedMarch 31, 2013 March 31, 2012
ESOP 2006 ESOP 2006
Risk-free interest rate (%) 8 8
Expected life of options (Years) 6 6
Expected volatility (%) 0.31 4.32
Dividend yield 1.33 1.33
32. Employee benefits
Year ended Year endedMarch 31, 2013 March 31, 2012
a. Disclosures related to defined contribution plan
Provident fund contribution recognized as expense in the
Statement of Profit and Loss 89.5 82.8
Notes to financial statements for the year ended March 31, 2013
(All amounts in Indian Rupees million, except share data and where otherwise stated)
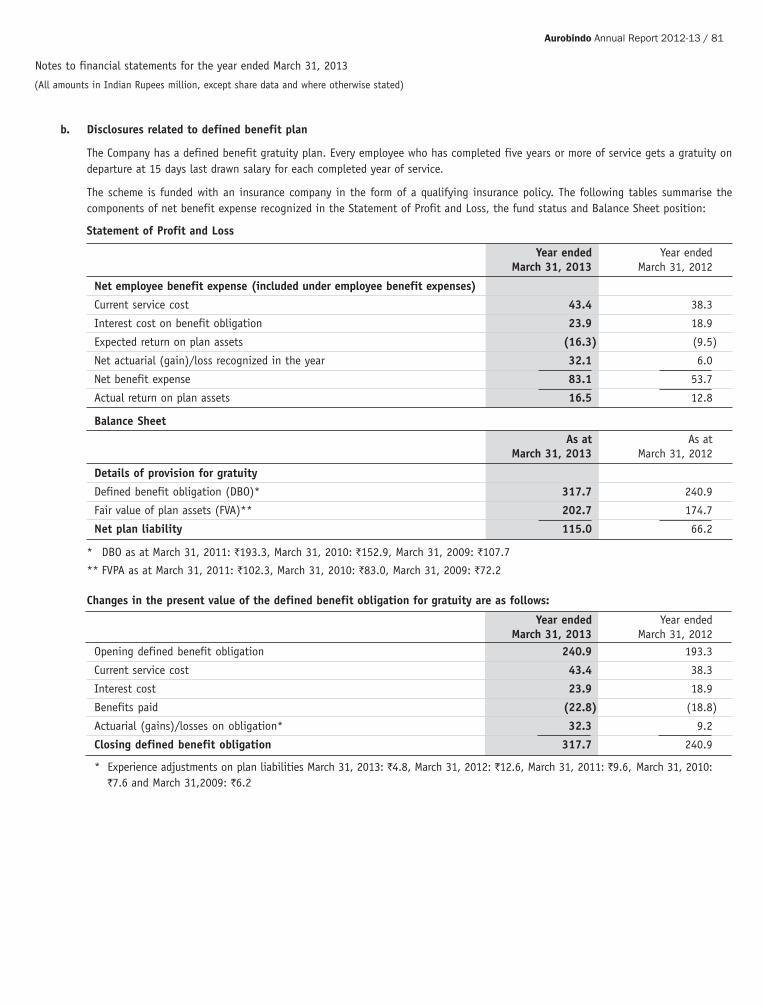
Aurobindo Annual Report 2012-13 / 81
b. Disclosures related to defined benefit plan
The Company has a defined benefit gratuity plan. Every employee who has completed five years or more of service gets a gratuity ondeparture at 15 days last drawn salary for each completed year of service.
The scheme is funded with an insurance company in the form of a qualifying insurance policy. The following tables summarise thecomponents of net benefit expense recognized in the Statement of Profit and Loss, the fund status and Balance Sheet position:
Statement of Profit and Loss
Year ended Year endedMarch 31, 2013 March 31, 2012
Net employee benefit expense (included under employee benefit expenses)
Current service cost 43.4 38.3
Interest cost on benefit obligation 23.9 18.9
Expected return on plan assets (16.3) (9.5)
Net actuarial (gain)/loss recognized in the year 32.1 6.0
Net benefit expense 83.1 53.7
Actual return on plan assets 16.5 12.8
Balance SheetAs at As at
March 31, 2013 March 31, 2012
Details of provision for gratuity
Defined benefit obligation (DBO)* 317.7 240.9
Fair value of plan assets (FVA)** 202.7 174.7
Net plan liability 115.0 66.2
* DBO as at March 31, 2011: `193.3, March 31, 2010: `152.9, March 31, 2009: `107.7
** FVPA as at March 31, 2011: `102.3, March 31, 2010: `83.0, March 31, 2009: `72.2
Changes in the present value of the defined benefit obligation for gratuity are as follows:
Year ended Year endedMarch 31, 2013 March 31, 2012
Opening defined benefit obligation 240.9 193.3
Current service cost 43.4 38.3
Interest cost 23.9 18.9
Benefits paid (22.8) (18.8)
Actuarial (gains)/losses on obligation* 32.3 9.2
Closing defined benefit obligation 317.7 240.9
* Experience adjustments on plan liabilities March 31, 2013: `4.8, March 31, 2012: `12.6, March 31, 2011: `9.6, March 31, 2010:`7.6 and March 31,2009: `6.2
Notes to financial statements for the year ended March 31, 2013
(All amounts in Indian Rupees million, except share data and where otherwise stated)
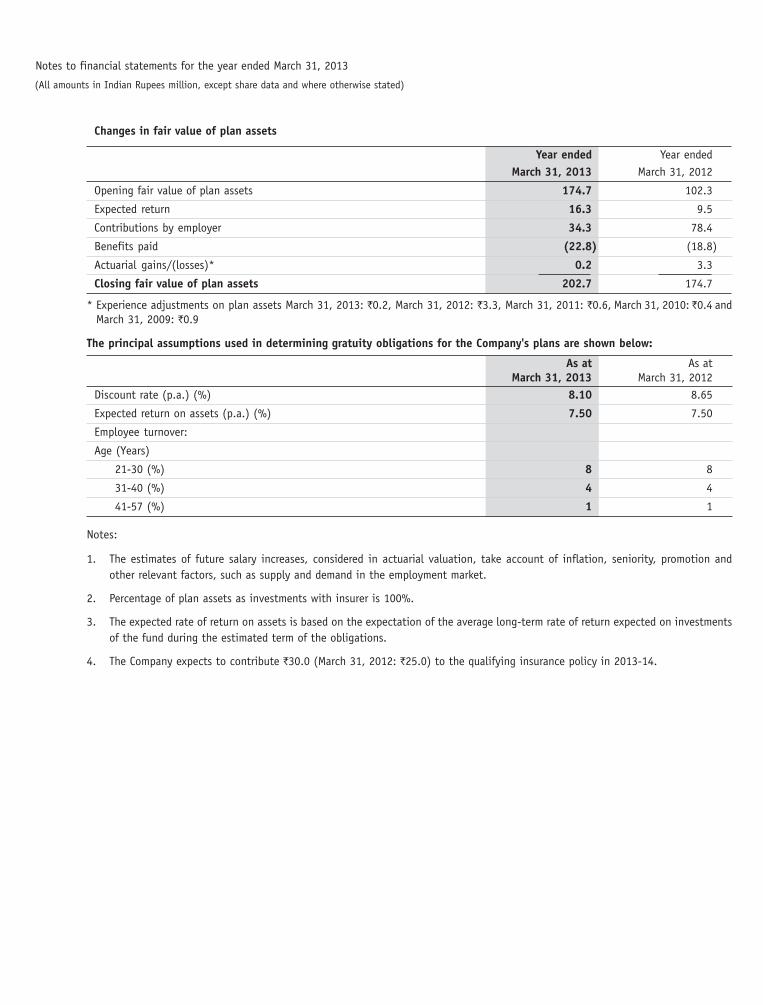
Changes in fair value of plan assets
Year ended Year endedMarch 31, 2013 March 31, 2012
Opening fair value of plan assets 174.7 102.3
Expected return 16.3 9.5
Contributions by employer 34.3 78.4
Benefits paid (22.8) (18.8)
Actuarial gains/(losses)* 0.2 3.3
Closing fair value of plan assets 202.7 174.7
* Experience adjustments on plan assets March 31, 2013: `0.2, March 31, 2012: `3.3, March 31, 2011: `0.6, March 31, 2010: ̀ 0.4 andMarch 31, 2009: `0.9
The principal assumptions used in determining gratuity obligations for the Company's plans are shown below:
As at As atMarch 31, 2013 March 31, 2012
Discount rate (p.a.) (%) 8.10 8.65
Expected return on assets (p.a.) (%) 7.50 7.50
Employee turnover:
Age (Years)
21-30 (%) 8 8
31-40 (%) 4 4
41-57 (%) 1 1
Notes:
1. The estimates of future salary increases, considered in actuarial valuation, take account of inflation, seniority, promotion andother relevant factors, such as supply and demand in the employment market.
2. Percentage of plan assets as investments with insurer is 100%.
3. The expected rate of return on assets is based on the expectation of the average long-term rate of return expected on investmentsof the fund during the estimated term of the obligations.
4. The Company expects to contribute `30.0 (March 31, 2012: `25.0) to the qualifying insurance policy in 2013-14.
Notes to financial statements for the year ended March 31, 2013
(All amounts in Indian Rupees million, except share data and where otherwise stated)

Aurobindo Annual Report 2012-13 / 83
33. Expenditure during construction period pending capitalization
As at As atMarch 31, 2013 March 31, 2012
Balance brought forward 1,226.6 692.7
Add: Incurred during the year
Salaries, wages and bonus 122.4 159.1
Staff welfare expenses 2.4 3.5
Consumption of raw material for testing 112.1 53.1
Consumption of stores and spares 60.7 114.7
Carriage inward 0.5 0.3
Power and fuel 151.0 163.7
Conversion charges 9.9 9.8
Rates and taxes 2.0 7.4
Printing and stationery 2.6 4.0
Postage and telephones 0.3 0.6
Insurance 4.4 3.5
Legal and professional charges 10.9 15.0
Travelling and conveyance 2.5 2.3
Depreciation 2.5 4.2
Miscellaneous expenses 24.5 26.4
1,735.3 1,260.3
Less: Capitalized to fixed assets during the year 1,228.4 33.7
Balance carried forward 506.9 1,226.6
34. Disclosure regarding derivative financial instruments
a. The aggregate amount of forward contracts entered into by the Company and remaining outstanding at year end are given below:
Sell
US $ Nil, `Nil (March 31,2012: US $ 18.0, `915.8) - To hedge receivables in foreign currency.
US $ Nil, `Nil (March 31,2012: US $ 27.0, `1,373.6) - To hedge external commercial borrowing draw down.
b. Particulars of unhedged foreign currency exposure are detailed below at the exchange rate prevailing as at the Balance Sheet date:
Particulars As at As atMarch 31, 2013 March 31, 2012
Loans availed (26,648.0) (26,943.2)
Trade receivables 16,014.0 9,289.5
Loans and advances (including other current assets) 854.0 1,069.4
Trade payables (including creditors for capital goods) (3,583.8) (1,672.3)
Interest accrued but not due (107.3) (81.1)
Investments 6,552.1 6,059.8
Bank balances 1,008.2 19.6
Notes to financial statements for the year ended March 31, 2013
(All amounts in Indian Rupees million, except share data and where otherwise stated)

35. Details of dues to micro, small and medium enterprises as defined under the MSMED Act, 2006
Details As at As atMarch 31, 2013 March 31, 2012
The principal amount remaining unpaid as at the end of the year. 5.6 21.5
The amount of interest accrued and remaining unpaid at the end of the year. 0.7 2.9
Amount of interest paid by the Company in terms of Section 16 of Micro Smalland Medium Enterprise Development Act, 2006 along with the amounts ofpayments made beyond the appointed date during the year. – –
Amount of interest due and payable for the period of delay in making paymentwithout the interest specified under the Micro Small and Medium EnterpriseDevelopment Act, 2006. – –
The amount of further interest remaining due and payable in the succeeding years,until such date when the interest dues as above are actually paid to the smallenterprises for the purpose of disallowance as a deductible expenditure underSection 23 of the Micro Small and Medium Enterprise Development Act, 2006. – –
36. In respect of the amounts mentioned under Section 205C of the Companies Act, 1956 there are no dues that are to be credited to the InvestorEducation and Protection Fund as at March 31, 2013 `Nil (March 31, 2012: Nil)
37. Research and Development expenses
a. Details of Research and Development expenses incurred during the year, debited under various heads of Statement of Profit and Loss isgiven below:
Particulars Year ended Year endedMarch 31, 2013 March 31, 2012
Material and stores and spares consumption 500.2 430.9
Power and fuel 56.5 25.0
Repairs and maintenance 40.6 32.7
Employee benefit expenses 567.9 473.3
Analytical charges 332.6 327.2
Depreciation 89.3 65.9
Others 498.0 238.0
TOTAL 2,085.1 1,593.0
b. Details of capital expenditure incurred for Research and Development are given below:
Particulars Year ended Year endedMarch 31, 2013 March 31, 2012
Land – 8.5
Buildings 49.0 126.7
Plant and machinery
- Plant and machinery 7.5 13.8
- Lab equipment 143.3 94.7
- Pipes and valves 1.8 24.8
- Data processing equipment 4.3 12.5
- Electrical installations 4.8 26.8
Office equipment 19.7 39.2
Furniture 10.2 38.6
Vehicles 7.7 10.4
TOTAL 248.3 396.0
Notes to financial statements for the year ended March 31, 2013
(All amounts in Indian Rupees million, except share data and where otherwise stated)

Aurobindo Annual Report 2012-13 / 85
38. Remuneration to statutory auditors (including service tax where applicable)
Particulars Year ended Year endedMarch 31, 2013 March 31, 2012
As Auditors
Statutory audit 5.5 5.5
Limited review 1.5 1.2
In other capacity
Certification 0.1 0.2
Reimbursement of expenses 0.4 0.3
Effect of service tax 0.1 0.1
TOTAL 7.6 7.3
39. Donation to political parties
Particulars Year ended Year endedMarch 31, 2013 March 31, 2012
Communist Party of India (Marxist) 0.1 0.3
Communist Party of India 0.2 0.3
Bharatiya Janatha Party – 0.8
TOTAL 0.3 1.4
40. Related party disclosures
Names of related parties and description of relationship
Subsidiaries
1. APL Pharma Thai Limited, Thailand2. ALL Pharma (Shanghai) Trading Company Limited, China3. Aurobindo Pharma USA Inc., U.S.A.4. Aurobindo Pharma Industria Farmaceutica Ltda, Brazil5. Helix Healthcare B.V., The Netherlands6. APL Holdings (Jersey) Limited, Jersey7. Aurobindo Pharma Produtos Farmaceuticos Ltda, Brazil8. APL Healthcare Limited, India9. Auronext Pharma Private Limited, India10. APL Research Centre Limited, India11. Auro Pharma Inc., Canada12. Aurobindo Pharma (Pty) Limited, South Africa13. Aurobindo Pharma (Australia) Pty Limited, Australia14. Agile Pharma B.V., The Netherlands15. Aurobindo Switzerland AG, Switzerland16. Auro Healthcare (Nigeria) Limited, Nigeria17. Aurobindo ILAC Sanayi ve Ticaret Limited Sirketi, Turkey18. Aurobindo Pharma (Singapore) Pte Limited, Singapore19. Aurobindo Pharma Limited, s.r.l., Dominican Republic20. Aurobindo Pharma Japan K.K., Japan21. Pharmacin B.V., The Netherlands22. Aurobindo Pharma GmbH, Germany23. Aurobindo Pharma (Portugal) Unipessoal LDA, Portugal24. Aurobindo Pharma (Bulgaria) EAD, Bulgaria25. Aurobindo Pharma France SARL, France
Notes to financial statements for the year ended March 31, 2013
(All amounts in Indian Rupees million, except share data and where otherwise stated)

26. Laboratorios Aurobindo S L, Spain27. Agile Malta Holdings Limited, Malta28. Aurobindo Pharma B.V., The Netherlands29. Aurobindo Pharma (Romania) s.r.l., Romania30. Aurobindo Pharma (Poland) Sp.z.o.o., Poland31. Aurobindo Pharma (Italia) S.r.l., Italy32. Agile Pharma (Malta) Limited, Malta33. Aurobindo Pharma (Malta) Limited, Malta34. APL IP Company Limited, Jersey35. APL Swift Services (Malta) Limited, Malta36. Milpharm Limited, U.K.37. Aurolife Pharma LLC, U.S.A.38. Auro Peptides Limited, India39. Auro Medics Pharma LLC, U.S.A.40. Aurobindo Pharma NZ Limited, New Zealand41. Aurovida Farmaceutica SA DE CV, Mexico42. Aurobindo Antibiotics Limited, India43. Auro Health LLC, U.S.A. (w.e.f. September 13, 2012)44. Aurobindo Pharma Hungary Kereskedelmi KFT, Hungary (Closed w.e.f. September 13, 2012)
Joint ventures1. Novagen Pharma (Pty) Limited, South Africa (Joint venture of a subsidiary)
2. Zao Auros Pharma, Russia (Joint venture of a subsidiary) (Closed during the year without any operations)
Enterprises over which key management personnel or their relatives exercise significant influence1. Pravesha Industries Private Limited, India
2. Sri Sai Packaging, India (Partnership firm)
3. Trident Chemphar Limited, India
4. Auropro Soft Systems Private Limited, India
5. Axis Clinicals Limited, India
6. Pranit Projects Private Limited, India
7. Pranit Packaging Private Limited, India
8. Matri Mirra Packaging Private Limited, India
9. Vaxer Pharma Limited, India
10. Silicon Life Sciences Private limited, India
11. Orem Access Bio Inc., India
Key managerial personnel1. Mr. P.V. Ramprasad Reddy, Director
(Resigned as Chairman w.e.f. June 1, 2012 and retired as Whole-time Director w.e.f. December 1, 2012)
2. Mr. K. Nithyananda Reddy, Whole-time Director
3. Dr. M. Sivakumaran, Whole-time Director
4. Mr. M. Madan Mohan Reddy, Whole-time Director
5. Mr. N. Govindarajan, Managing Director
6. Mr. Ravindra Shenoy, Joint Managing Director (Resigned w.e.f. November 9, 2012)
Relatives to key managerial personnel1. Mr. P. Sarath Chandra Reddy (Son of Mr. P.V. Ramprasad Reddy, Director)
2. Mrs. Kambam Kirthi Reddy (Daughter of Mr. K. Nithyananda Reddy, Whole-time Director)
3. Mr. Vishnu M. Sriram (Son-in-law of Dr. M. Sivakumaran, Whole-time Director)
Notes to financial statements for the year ended March 31, 2013
(All amounts in Indian Rupees million, except share data and where otherwise stated)
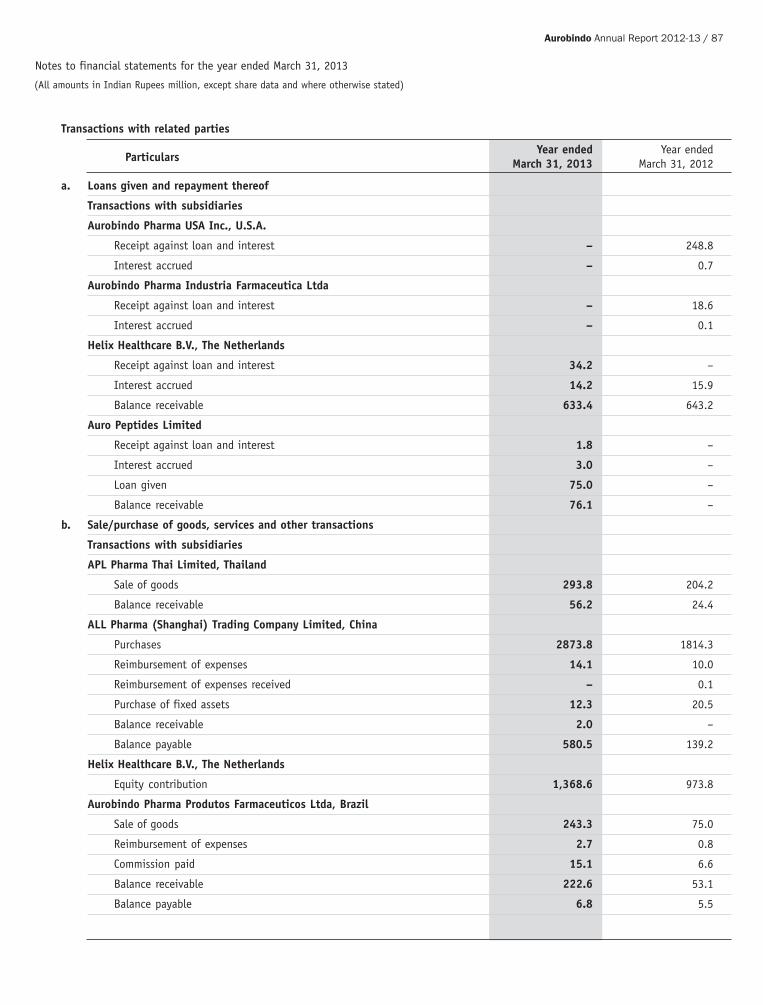
Aurobindo Annual Report 2012-13 / 87
Transactions with related parties
ParticularsYear ended Year ended
March 31, 2013 March 31, 2012
a. Loans given and repayment thereof
Transactions with subsidiaries
Aurobindo Pharma USA Inc., U.S.A.
Receipt against loan and interest – 248.8
Interest accrued – 0.7
Aurobindo Pharma Industria Farmaceutica Ltda
Receipt against loan and interest – 18.6
Interest accrued – 0.1
Helix Healthcare B.V., The Netherlands
Receipt against loan and interest 34.2 –
Interest accrued 14.2 15.9
Balance receivable 633.4 643.2
Auro Peptides Limited
Receipt against loan and interest 1.8 –
Interest accrued 3.0 –
Loan given 75.0 –
Balance receivable 76.1 –
b. Sale/purchase of goods, services and other transactions
Transactions with subsidiaries
APL Pharma Thai Limited, Thailand
Sale of goods 293.8 204.2
Balance receivable 56.2 24.4
ALL Pharma (Shanghai) Trading Company Limited, China
Purchases 2873.8 1814.3
Reimbursement of expenses 14.1 10.0
Reimbursement of expenses received – 0.1
Purchase of fixed assets 12.3 20.5
Balance receivable 2.0 –
Balance payable 580.5 139.2
Helix Healthcare B.V., The Netherlands
Equity contribution 1,368.6 973.8
Aurobindo Pharma Produtos Farmaceuticos Ltda, Brazil
Sale of goods 243.3 75.0
Reimbursement of expenses 2.7 0.8
Commission paid 15.1 6.6
Balance receivable 222.6 53.1
Balance payable 6.8 5.5
Notes to financial statements for the year ended March 31, 2013
(All amounts in Indian Rupees million, except share data and where otherwise stated)

ParticularsYear ended Year ended
March 31, 2013 March 31, 2012
Notes to financial statements for the year ended March 31, 2013
(All amounts in Indian Rupees million, except share data and where otherwise stated)
APL IP Company Limited, Jersey
Sale of services 80.3 113.0
Reimbursement of expenses received – 7.2
Balance receivable 476.4 578.4
APL Swift Services (Malta) Limited, Malta
Sale of goods 1,087.1 899.2
Purchase of services 5.8 4.2
Reimbursement of expenses 7.3 6.3
Balance receivable 734.9 670.3
Balance payable 9.7 7.5
Aurobindo Pharma USA Inc., U.S.A.
Sale of goods 11,185.8 4,761.4
Reimbursement of expenses 108.0 –
Balance receivable 6,345.5 3,040.8
Balance payable 6.2 5.8
Coporate gurantee given for bank loan 339.3 1,589.8
Equity contribution – 404.6
Aurobindo Pharma Industria Farmaceutica Ltda, Brazil
Sale of goods 472.5 258.0
Reimbursement of expenses 5.5 4.0
Commission paid – 10.4
Balance receivable 598.1 376.4
Balance payable 0.1 0.3
Equity contribution – 154.5
Auro Pharma Inc., Canada
Sale of goods 250.8 74.6
Reimbursement of expenses 2.3 1.3
Balance receivable 197.7 66.8
Balance payable 3.3 1.0
Aurobindo Pharma (Pty) Limited, South Africa
Sale of goods 1,129.1 1,122.8
Reimbursement of expenses – 0.2
Commission paid 2.7 35.9
Balance receivable 458.0 658.0
Balance payable 0.2 18.6
Pharmacin B.V., The Netherlands
Sale of goods 112.1 96.2
Commission paid 21.7 18.9

Aurobindo Annual Report 2012-13 / 89
Notes to financial statements for the year ended March 31, 2013
(All amounts in Indian Rupees million, except share data and where otherwise stated)
ParticularsYear ended Year ended
March 31, 2013 March 31, 2012
Reimbursement of expenses – 2.4
Balance receivable 50.7 57.6
Balance payable 49.6 32.2
Milpharm Limited, U.K.
Sale of goods 382.5 (15.5)
Reimbursement of expenses 20.1 22.3
Balance receivable 321.8 11.5
Balance payable 24.0 13.6
Aurolife Pharma LLC, U.S.A.
Sale of goods 716.2 412.3
Sale of fixed assets 2.6 –
Reimbursement of expenses 1.8 1.8
Balance receivable 513.9 396.7
Balance payable 0.7 –
Aurobindo Pharma Japan K.K., Japan
Sale of goods 58.3 193.1
Reimbursement of expenses 0.3 0.1
Commission paid 26.3 9.9
Balance receivable – 54.6
Balance payable 11.8 3.9
Aurobindo Pharma (Malta) Limited, Malta
Sale of goods – (5.4)
Reimbursement of expenses 5.2 0.8
Balance receivable – –
Balance payable – 6.5
Aurobindo Pharma (Italia) S.r.l., Italy
Sale of goods 0.4 –
Balance receivable 0.4 –
Auronext Pharma Private Limited, India
Sale of goods 24.7 14.6
Purchases 43.3 –
Sale of fixed assets 0.1 3.9
Rent received 1.8 1.6
Reimbursement of expenses 0.7 0.1
Equity allotment 123.5 94.9
Share application money given 96.5 52.0
Share application money given pending allotment (Closing balance) – 27.0
Balance receivable 20.6 13.0

ParticularsYear ended Year ended
March 31, 2013 March 31, 2012
Notes to financial statements for the year ended March 31, 2013
(All amounts in Indian Rupees million, except share data and where otherwise stated)
Aurobindo Pharma (Australia) Pty Limited, Australia
Sale of goods 34.2 6.2
Reimbursement of expenses – 2.6
Commission paid – 0.4
Balance receivable 29.0 6.3
Balance payable – 2.6
Laboratorios Aurobindo S L, Spain
Sale of goods 169.7 8.1
Balance receivable 132.3 8.0
Auro Medics Pharma LLC, U.S.A.
Sale of goods 537.4 89.4
Balance receivable 497.3 89.1
Auro Healthcare (Nigeria) Limited, Nigeria
Commission paid 0.7 0.4
Reimbursement of expenses 0.1 –
Balance payable 1.1 0.4
APL Healthcare Limited, India
Equity allotment 32.4 –
Share application money given 13.7 –
Share application money given pending allotment (Closing balance) – 18.7
APL Research Centre Limited, India
Equity allotment 116.5 –
Share application money given 1.9 53.4
Share application money given pending allotment (Closing balance) – 114.6
Auro Peptides Limited, India
Equity allotment 1.0 –
Share application money 0.5 0.5
Rent received 4.4 –
Reimbursement of expenses received 0.1 –
Sale of fixed assets 1.0 –
Balance receivable 5.4 –
Aurobindo Antibiotics Limited, India
Equity contribution 0.5 –
Note: For closing balance of investments and provision for diminution in value of investments, Refer Note 11.

Aurobindo Annual Report 2012-13 / 91
Notes to financial statements for the year ended March 31, 2013
(All amounts in Indian Rupees million, except share data and where otherwise stated)
ParticularsYear ended Year ended
March 31, 2013 March 31, 2012
c. Transactions with enterprises over which key management personnel ortheir relatives exercise significant influencePravesha Industries Private Limited, India
Sale of goods 0.4 6.3Purchase of goods 1,028.8 1,050.3Purchase of fixed assets – 0.3Rent and electricity charges received 0.6 0.1Balance receivable – 25.2
Sri Sai Packaging, IndiaSale of goods 0.3 0.2Sale of fixed assets 0.2 –Purchase of goods 122.1 103.1Balance receivable – 2.1
Axis Clinicals Limited, IndiaPurchase of services 337.0 281.7Electricity expenses 0.9 5.8Rent expenses 2.6 12.1Purchase of fixed assets 0.6 5.9Balance payable 49.7 31.1
Trident Chemphar Limited, IndiaSale of goods 218.5 336.3Purchase of goods 299.3 36.3Balance receivable 116.4 273.5Balance payable 62.5 8.1
Auropro Soft Systems Private Limited, IndiaPurchase of goods 3.2 2.4Purchase of services 16.8 15.1Purchase of fixed assets – 12.8Balance receivable – –Balance payable – 0.1
Pranit Packaging Private Limited, IndiaPurchase of goods 75.4 53.0Sale of goods – –Balance payable – 1.4
Pranit Projects Private Limited, IndiaPurchase of services (Civil services) 22.7 58.9Balance payable 2.5 4.0
Matri Mirra Packaging Private Limited, IndiaPurchase of goods 127.5 50.0Sale of goods 19.5 0.9Balance receivable – 3.6
Vaxer Pharma LimitedSale of goods 18.8 –Balance receivable 6.8 –
Silicon Life Sciences Private Limited, IndiaSale of goods 0.7 –Share application given pending allotment (Closing balance) – –
Orem Access Bio Inc., IndiaPurchase of goods 41.8 –Balance receivable 8.5 –

ParticularsYear ended Year ended
March 31, 2013 March 31, 2012
d. Transactions with key managerial personnel or their relativesMr. P.V. Ramprasad ReddyManagerial remuneration 6.6 8.7Mr. K. Nithyananda ReddyManagerial remuneration 9.1 8.7Rent expense 1.6 1.6Dr. M. SivakumaranManagerial remuneration 9.1 8.7Mr. M. Madan Mohan ReddyManagerial remuneration 9.1 8.7Mr. P. Sarath Chandra ReddyDirector sitting fees 0.1 0.1Mrs. Kambam Kirthi ReddyRemuneration – 0.7Mr. Vishnu M. SriramRemuneration 3.3 3.0Mr. N. GovindarajanManagerial remuneration 43.1 –Balance payable 25.0 –Mr. Ravindra ShenoyManagerial remuneration 3.6 –
e. Disclosure pursuant to clause 32 of Listing Agreement
Loans and advances in the nature of loans to subsidiaries
Maximum outstanding atClosing Balance any time during the yearas at March 31 ended March 31
Name of the companies 2013 2012 2013 2012
Subsidiaries
Aurobindo Pharma USA Inc., U.S.A. – – – 248.8
Aurobindo Pharma Industria Farmaceutica Ltda, Brazil – – – 18.6
Auro Peptides Limited, India 75.0 – 75.0 –
Helix Healthcare B.V., The Netherlands 611.5 615.9 647.2 615.9
41. Leases
a. Operating lease
Operating leases are mainly in the nature of lease of office premises with no restrictions and are renewable/cancellable at the option ofeither of the parties. There is no escalation clause in the lease agreement. There are no sub-leases. There are no restrictions imposed bylease arrangements. The aggregate amount of operating lease payments recognized in the Statement of Profit and Loss is `17.0(March 31, 2012: `23.7).
The Company has not recognized any contingent rent as expense in the Statement of Profit and Loss.
Notes to financial statements for the year ended March 31, 2013
(All amounts in Indian Rupees million, except share data and where otherwise stated)

Aurobindo Annual Report 2012-13 / 93
b. Finance lease
Building includes factory buildings acquired on finance lease. The agreement is silent on renewal terms and transfer of legal title at theend of lease term.
The lease agreement did not specify minimum lease payments over the future period. The factory building is acquired on lease at aconsideration of `25.5 (March 31, 2012: `25.5).
The net carrying amount of the buildings obtained on finance lease - `14.6 (March 31, 2012: `15.9).
42. In accordance with paragraph 10 of Notified Accounting Standard 9 on Revenue Recognition, excise duty on sales amounting to `1,444.0(March 31, 2012: `972.8) has been reduced from sales in Statement of Profit and Loss and excise duty on increase/decrease in closing stockof finished goods amounting to `4.2 [March 31, 2012: `31.8 (credit)] has been debited to the Statement of Profit and Loss.
43. Details of advances due from private companies in which Company's Director is a director.
Pravesha Industries Private Limited, India `Nil (March 31, 2012: `22.6)
44. i. Details of trade receivables due from private companies in which Company's Director is a director.
Pravesha Industries Private Limited, India `Nil (March 31, 2012: `2.5)
ii. Details of trade receivables due from partnership firm in which Company's Director is a partner.
Sri Sai Packaging, India `Nil (March 31, 2012: Nil)
45. Interest in joint ventures
Details of interest in jointly controlled entities are given below:
Name of joint venture Share Assets Liabilities Income ExpenditureProfit/(Loss)
after tax
Novagen Pharma (Pty) Limited 50% 404.4 84 766 697 69
413.6 231 706 616 90
a. Contingent liabilities of the above joint ventures ` Nil (March 31, 2012: Nil).
b. Capital commitments of the above joint ventures ` Nil (March 31, 2012: Nil).
c. Novagen Pharma (Pty) Limited, incorporated in South Africa, is engaged in distribution of pharmaceuticals products.
d. Previous year's figures have been disclosed in italics.
e. All figures presented above represent Company's share only.
46. Earnings per share
Year ended Year endedParticulars March 31, 2013 March 31, 2012
Profit/(Loss) after taxation considered for calculation of basic and diluted earnings per share 4,959.9 (426.1)
Weighted average number of equity shares considered for calculation of basicearnings per share (a) 291,141,509 291,121,290
Effect of dilution on account of Employee Stock Options granted (b) 214,450 6,272
Weighted average number of equity shares considered for calculation of dilutedearnings per share (a+b) 291,355,959 291,127,562
Notes to financial statements for the year ended March 31, 2013
(All amounts in Indian Rupees million, except share data and where otherwise stated)

47. Imported and indigenous raw materials, stores and spares and lab chemicals consumed (excluding expenses incurred duringconstruction period)
Year ended Year endedMarch 31, 2013 March 31, 2012% ` % `
Raw materials and packing material
- Imported 60 18,229.8 61 14,554.0
- Indigenous 40 12,306.6 39 9,378.9
TOTAL 100 30,536.4 100 23,932.9
Stores and spares
- Imported 6 35.8 6 36.2
- Indigenous 94 572.4 94 608.4
TOTAL 100 608.2 100 644.6
Lab chemicals
- Imported 7 59.6 14 114.3
- Indigenous 93 745.3 86 687.2
TOTAL 100 804.9 100 801.5
48. Value of imports calculated on CIF basis
Year ended Year endedMarch 31, 2013 March 31, 2012
Raw materials and packing materials 17,845.8 13,845.1
Capital goods 349.1 730.4
Stores and spares and lab chemicals 84.4 123.4
TOTAL 18,279.3 14,698.9
49. Expenditure in foreign currency (accrual basis)
Year ended Year endedMarch 31, 2013 March 31, 2012
Travelling 21.4 24.6
Commission on sales 175.2 156.9
Product registration and filing fee 221.0 35.5
Overseas office expenses 31.2 12.4
Legal and professional charges 205.4 207.6
Interest 334.2 228.8
Redemption premium (Yield to Maturity) on redemption of FCCBs – 2862.6
Others 178.0 84.9
TOTAL 1,166.4 3,613.3
Notes to financial statements for the year ended March 31, 2013
(All amounts in Indian Rupees million, except share data and where otherwise stated)

Aurobindo Annual Report 2012-13 / 95
Notes to financial statements for the year ended March 31, 2013
(All amounts in Indian Rupees million, except share data and where otherwise stated)
50. Earnings in foreign currency (accrual basis)
Year ended Year endedMarch 31, 2013 March 31, 2012
Exports on F.O.B. basis 38,710.1 29,239.9
Interest 14.2 16.6
Sale of dossiers/services 331.8 523.5
TOTAL 39,056.1 29,780.0
51. Segment reporting
In accordance with Accounting Standard 17 - Segment Reporting, segment information has been provided in the Consolidated Financial
Statements of the Company and therefore no separate disclosure on segment information is given in these standalone financial statements.
52. The figures of previous year have been regrouped/rearranged, wherever necessary to conform to those of the current year.
As per our report of even date. For and on behalf of the Board of Directors of Aurobindo Pharma Limited
For S.R. BATLIBOI & ASSOCIATES LLPICAI Firm Registration No. 101049WChartered Accountants N. GOVINDARAJAN Dr. M. SIVAKUMARAN
Managing Director Director
per VIKAS KUMAR PANSARIPartnerMembership No. 93649 SUDHIR B. SINGHI A. MOHAN RAMI REDDY
Chief Financial Officer AVP (Legal) &Hyderabad, May 30, 2013 Company Secretary

(Con
td...)
Stat
emen
t pu
rsua
nt t
o Se
ctio
n 21
2 of
the
Com
pani
es A
ct,
1956
rel
atin
g to
sub
sidi
ary
com
pani
es(A
ll am
ount
s in
Ind
ian
Rupe
es m
illio
n, e
xcep
t sh
are
data
and
whe
re o
ther
wis
e st
ated
)
Part
icul
ars
Repo
rtin
gEx
chan
geCa
pita
lRe
serv
esTo
tal
Tota
lIn
vest
men
tsTu
rnov
erPr
ofit
/Pr
ovis
ion
Prof
it/
Coun
try
curr
ency
rate
asse
tslia
bilit
ies
othe
r th
an(L
oss)
for
(Los
s)in
vest
men
tbe
fore
taxa
tion
afte
rin
sub
sidi
ary
taxa
tion
taxa
tion
APL
Phar
ma
Thai
Lim
ited
aTH
B 1
.85
185
.4 2
5.8
233.
5 2
2.3
– 3
05.2
(11
.1)
–(1
1.1)
Thai
land
Auro
bind
o Ph
arm
a In
dust
riaFa
rmac
euti
ca L
tdaa
Reai
s 2
6.88
272
.3 (
227.
4) 6
02.9
558
.1 –
839
.0 (
103.
7) –
(10
3.7)
Braz
ilHel
ix H
ealt
hcar
e B.
V.EU
RO 6
9.50
4,4
98.2
(33
5.9)
207
.2 6
36.6
– –
(19
.2)
– (
19.2
)Th
e Ne
ther
land
sAu
robi
ndo
Phar
ma
USA,
Inc
.US
D 5
4.29
3,3
48.0
1,1
59.3
7,8
65.6
6,6
80.5
– 1
3,03
7.9
439
.6–
439
.6U.S
.A.
Auro
life
Phar
ma
LLC,
USD
54.
29 3
,311
.4 (
1,22
8.0)
4,4
90.5
2,4
07.2
– 2
,060
.8 (
152.
6) –
(15
2.6)
U.S
.A.
Auro
Pha
rma
Inc.
CND
53.
44 2
31.2
(11
0.3)
350
.6 2
29.7
– 4
31.1
5.6
– 5
.6Ca
nada
Auro
bind
o Ph
arm
a (P
ty)
Lim
ited
ZAR
5.8
8 2
46.4
105
.1 5
48.0
293
.5 9
7.0
1,2
27.7
11.
1 3
.1 8
.0So
uth
Afric
aM
ilpha
rm L
imit
edGB
P 8
2.23
312
.2 1
93.7
1,1
00.6
594
.7 –
1,1
82.4
64.
7 1
5.8
48.
9U.K
.Au
robi
ndo
Phar
ma
(Aus
tral
ia)
Pty
Lim
ited
AUD
56.
63 4
03.3
(23
3.7)
209
.4 3
9.8
– 6
9.6
(13
6.0)
– (
136.
0)Au
stra
liaAu
robi
ndo
Phar
ma
Hun
gary
Kere
sked
elm
i, KF
TbH
UF
0.2
5 3
.5 (
3.5)
– –
– –
– –
–H
unga
ryAg
ile P
harm
a B.
V.EU
RO 6
9.50
2,6
85.3
128
.0 1
36.3
9.5
– –
254
.7 –
254
.7Th
e Ne
ther
land
sAu
robi
ndo
Swit
zerla
nd A
GCH
F 5
7.00
78.
1 (
88.6
) 1
.1 1
1.6
– –
(47
.7)
– (
47.7
)Sw
itze
rland
Phar
mac
in B
.V.
EURO
69.
50 1
.3 1
15.3
318
.5 2
02.0
– 6
66.4
40.
9 9
.5 3
1.4
The
Neth
erla
nds
Auro
Hea
lthc
are
(Nig
eria
)Li
mit
edNa
ira (
NGN)
0.3
4 1
6.0
(14
.0)
2.4
0.4
– –
(2.
0) –
(2.
0)Ni
geria
APL
Rese
arch
Cen
tre
Lim
ited
INR
1.0
0 1
18.0
–11
8.0
– –
– –
– –
Indi
aAP
L H
ealt
hcar
e Li
mit
edIN
R 1
.00
32.
9 –
33.
0 0
.1 –
– –
– –
Indi
aAu
robi
ndo
Phar
ma
Prod
utos
Farm
aceu
tico
s Lt
daa
Reai
s 2
6.88
2.7
10.
019
5.7
183
.0 –
228
.4 2
.5 –
2.5
Braz
ilAl
l Ph
arm
a (S
hang
hai)
Tra
ding
Com
pany
Lim
ited
aRM
B 8
.74
43.
7 6
0.8
438
.3 3
33.8
– 3
,324
.8 1
6.1
6.0
10.
1Ch
ina
Auro
bind
o Ph
arm
a Ja
pan
K.K.
JPY
0.5
8 8
5.8
(49
.9)
46.
4 1
0.5
– 6
5.1
0.5
0.2
0.3
Japa
nAg
ile M
alta
Hol
ding
s Li
mit
edEU
RO 6
9.50
352
.7 2
79.0
239.
0 0
.1 –
– 1
74.9
33.5
141
.5M
alta
Auro
bind
o Ph
arm
a (M
alta
) Li
mite
dEU
RO 6
9.50
392
.6 1
5.3
1,1
52.7
744
.8 –
648
.0 1
60.4
32.8
127
.6M
alta
APL
Hol
ding
s (J
erse
y) L
imit
edEU
RO 6
9.50
252
.8 5
.52.
0 1
.3 –
– 1
.2 –
1.2
Jers
eyAP
L IP
Com
pany
Lim
ited
EURO
69.
50 7
.3 7
22.8
1,2
08.9
478
.8 –
86.
5 (
339.
9) –
(33
9.9)
Jers
eyAP
L Sw
ift S
ervi
ces
(Mal
ta)
Lim
ited
EURO
69.
50 2
50.2
(12
4.2)
765
.7 6
39.7
– 1
,242
.3 1
1.8
– 1
1.8
Mal
taAg
ile P
harm
a (M
alta
) Li
mit
edEU
RO 6
9.50
1.7
(1.
6) 0
.2 0
.1 –
– (
0.2)
– (
0.2)
Mal
taAu
robi
ndo
Phar
ma
(Ita
lia)
S.r.l
.EU
RO 6
9.50
779
.9 (
557.
7) 6
17.6
395
.4 –
89.
8 (
174.
5) –
(17
4.5)
Ital
yLa
bora
torio
s Au
robi
ndo
SLEU
RO 6
9.50
326
.0 (
180.
4) 5
74.5
428
.9 –
216
.9 (
102.
2) (
30.7
) (
71.6
)Sp
ain

Aurobindo Annual Report 2012-13 / 97
Stat
emen
t pu
rsua
nt t
o Se
ctio
n 21
2 of
the
Com
pani
es A
ct,
1956
rel
atin
g to
sub
sidi
ary
com
pani
es(A
ll am
ount
s in
Ind
ian
Rupe
es m
illio
n, e
xcep
t sh
are
data
and
whe
re o
ther
wis
e st
ated
)
Part
icul
ars
Repo
rtin
gEx
chan
geCa
pita
lRe
serv
esTo
tal
Tota
lIn
vest
men
tsTu
rnov
erPr
ofit
/Pr
ovis
ion
Prof
itCo
untr
ycu
rren
cyra
teas
sets
liabi
litie
sot
her
than
(Los
s)fo
r(L
oss)
inve
stm
ent
befo
reta
xati
onaf
ter
in s
ubsi
diar
yta
xati
onta
xati
on
Auro
bind
o Ph
arm
a (P
ortu
gal)
Unip
esso
al L
DAEU
RO 6
9.50
470
.0 (
400.
8) 2
52.4
183
.3 –
103
.7 (
181.
3) 5
.2(1
86.5
)Po
rtug
alAu
robi
ndo
Phar
ma
Fran
ce S
ARL
EURO
69.
50 8
7.4
(60
.3)
151
.6 1
24.5
– –
(21
.2)
–(2
1.2)
Fran
ceAu
rone
xt P
harm
a Pr
ivat
e Li
mite
dIN
R 1
.00
465
.0 (
132.
9) 6
38.5
306
.4 –
69.
8 (
98.3
) –
(98
.3)
Indi
aAu
robi
ndo
Phar
ma
GmbH
EURO
69.
50 1
.7 9
0.0
542.
9 4
51.2
– 1
40.2
(34
.8)
–(3
4.8)
Germ
any
Auro
bind
o IL
AC S
anay
i ve
Tica
ret
Lim
ited
Sirk
eti
TRY
30.
00 1
05.9
(42
.7)
67.
1 3
.9 –
– (
12.9
) –
(12
.9)
Turk
eyAu
robi
ndo
Phar
ma
B.V.
EURO
69.
50 1
.3 7
.322
0.6
212
.0 –
– (
27.4
) (
5.5)
(21
.9)
The
Neth
erla
nds
Auro
bind
o Ph
arm
a (S
inga
pore
)Pt
e Li
mit
edSG
D 4
3.72
3.5
(3.
4) 0
.1 –
– –
(2.
1) –
(2.1
)Si
ngap
ore
Auro
bind
o Ph
arm
a (R
oman
ia)
s.r.l.
aRO
N 1
5.76
19.
0 (
9.8)
10.
3 1
.1 –
– (
7.9)
–(7
.9)
Rom
ania
Auro
bind
o Ph
arm
a (P
olan
d)Sp
.z.o
.o.
PLN
16.
45 1
8.2
(18
.4)
1.7
1.9
– –
(14
.1)
–(1
4.1)
Pola
ndAu
robi
ndo
Phar
ma
Lim
ited
, s.r.
l.DO
P 1
.31
1.0
(0.
7) 0
.3 –
– –
(0.
5) –
(0.5
)Do
min
ican
Rep
ublic
Auro
med
ics
Phar
ma
LLC
USD
54.
29 1
0.9
2.4
525.
5 5
12.2
– 5
39.9
19.
0 –
19.0
U.S
.A.
Auro
bind
o Ph
arm
a NZ
Lim
ited
NZD
– –
– –
– –
– –
––
New
Zea
land
Auro
vida
Far
mac
euti
caSA
DE
CVa
MXN
(Mpe
so)
4.4
1 1
16.1
(0.
1) 1
19.0
3.0
– –
(0.
1) –
(0.1
)M
exic
oAu
ro P
epti
des
Lim
ited
INR
1.0
0 1
.0 –
94.
1 9
3.1
– –
– –
–In
dia
Auro
Hea
lth
LLC
USD
54.
29 –
(13
.0)
57.
7 7
0.8
– –
(13
.0)
–(1
3.0)
U.S
.A.
Auro
bind
o An
tibi
otic
s Li
mit
edIN
R 1
.00
0.5
– 0
.5 –
– –
– –
–In
dia
Hyd
erab
ad,
May
30,
201
3
Not
es1.
None
of
the
subs
idia
ries
have
pro
pose
d di
vide
nd d
urin
g th
e ye
ar.
How
ever
, Ag
ile (
Mal
ta)
Hol
ding
s Li
mit
ed h
as p
aid
an a
mou
nt o
f `26
4.1,
Aur
obin
do P
harm
a (M
alta
) Li
mit
edha
s pa
id a
n am
ount
of `11
2.3
and
APL
IP C
ompa
ny L
imit
ed h
as p
aid
an a
mou
nt o
f `1.
8 as
div
iden
d du
ring
the
year
.a
The
finan
cial
yea
r of
the
se c
ompa
nies
end
on
Dece
mbe
r 31
. H
owev
er,
the
resu
lts
give
n ar
e as
of
Mar
ch 3
1, 2
013.
bTh
e co
mpa
ny c
ease
d to
be
subs
idia
ry o
f th
e Co
mpa
ny d
urin
g th
e ye
ar.
For
and
on b
ehal
f of
the
Boa
rd o
f Di
rect
ors
of A
urob
indo
Pha
rma
Lim
ited
N.
Govi
ndar
ajan
Dr.
M.
SIVA
KUM
ARAN
Man
agin
g Di
rect
orDi
rect
or
SUDH
IR B
. SI
NGH
IA.
MOH
AN R
AMI
REDD
YCh
ief
Fina
ncia
l Of
ficer
AVP
(Leg
al)
&Co
mpa
ny S
ecre
tary

The Board of Directors ofAurobindo Pharma Limited
We have audited the accompanying consolidated financial statementsof Aurobindo Pharma Limited ("the Company"), its subsidiaries andjoint venture, which comprise the Consolidated Balance Sheet as atMarch 31, 2013, and the Consolidated Statement of Profit and Lossand the Consolidated Cash Flow Statement for the year then ended,and a summary of significant accounting policies and other explanatoryinformation.
Management's Responsibility for the Consolidated FinancialStatements
Management is responsible for the preparation of these consolidatedfinancial statements that give a true and fair view of the consolidatedfinancial position, consolidated financial performance and consolidatedcash flows of the Company in accordance with accounting principlesgenerally accepted in India. This responsibility includes the design,implementation and maintenance of internal control relevant to thepreparation and presentation of the consolidated financial statementsthat give a true and fair view and are free from material misstatement,whether due to fraud or error.
Auditor's Responsibility
Our responsibility is to express an opinion on these consolidatedfinancial statements based on our audit. We conducted our audit inaccordance with the Standards on Auditing issued by the Institute ofChartered Accountants of India. Those Standards require that wecomply with ethical requirements and plan and perform the audit toobtain reasonable assurance about whether the consolidated financialstatements are free from material misstatement.
An audit involves performing procedures to obtain audit evidenceabout the amounts and disclosures in the consolidated financialstatements. The procedures selected depend on the auditor'sjudgement, including the assessment of the risks of materialmisstatement of the consolidated financial statements, whether dueto fraud or error. In making those risk assessments, the auditorconsiders internal control relevant to the Company's preparation andpresentation of the consolidated financial statements that give atrue and fair view in order to design audit procedures that areappropriate in the circumstances. An audit also includes evaluatingthe appropriateness of accounting policies used and the reasonablenessof the accounting estimates made by management, as well as
evaluating the overall presentation of the consolidated financialstatements. We believe that the audit evidence we have obtained issufficient and appropriate to provide a basis for our audit opinion.
Opinion
In our opinion and to the best of our information and according tothe explanations given to us, the consolidated financial statementsgive a true and fair view in conformity with the accounting principlesgenerally accepted in India:
a. in the case of the Consolidated Balance Sheet, of the state ofaffairs of the Company as at March 31, 2013;
b. in the case of the Consolidated Statement of Profit and Loss, ofthe profit for the year ended on that date; and
c. in the case of the Consolidated Cash Flow Statement, of thecash flows for the year ended on that date.
Other Matter
We did not audit total assets of `23,899,965,052 as at March 31,2013, total revenues of `20,991,890,665 and net cash inflowsamounting to `371,036,875 for the year then ended, included in theaccompanying consolidated financial statements in respect of certainsubsidiaries and joint venture, whose financial statements and otherfinancial information have been audited by other auditors and whosereports have been furnished to us. Our opinion, in so far as it relatesto the affairs of such subsidiaries and joint ventures is based solelyon the report of other auditors. Our opinion is not qualified in respectof this matter.
For S.R. Batliboi & Associates LLPChartered AccountantsICAI Firm Registration No. 101049W
per VIKAS KUMAR PANSARIPartnerMembership No. 93649Hyderabad, May 30, 2013
Independent Auditors' Report
on Consolidated Financial Statements

Aurobindo Annual Report 2012-13 / 99
EQUITY AND LIABILITIESSHAREHOLDERS' FUNDS
Share capital 2 291.2 291.1Reserves and surplus 3 25,766.4 23,105.4
26,057.6 23,396.5Minority interest 110.0 102.1
NON-CURRENT LIABILITIESLong-term borrowings 4 11,482.6 9,646.3Deferred tax liabilities (Net) 5 680.0 38.5Long-term provisions 6 90.0 42.4
12,252.6 9,727.2CURRENT LIABILITIES
Short-term borrowings 7 22,361.2 16,082.1Trade payables 8 9,687.4 6,601.4Other current liabilities 9 1,508.7 5,803.4Short-term provisions 6 800.9 663.6
34,358.2 29,150.5TOTAL 72,778.4 62,376.3
ASSETSNON-CURRENT ASSETS
Fixed assets Tangible assets 10 24,390.5 19,872.1Intangible assets 11 1,998.2 2,074.4Tangible assets - Capital work-in-progress 1,995.9 5,999.6Intangible assets - Under development 189.2 454.5
Non-current investments 12 222.4 198.6Deferred tax assets (Net) 5 – 54.3Loans and advances 13 2,428.1 1,081.2Trade receivables 14 – –Other non-current assets 16 186.6 1.2
31,410.9 29,735.9CURRENT ASSETS
Current investments 17 0.4 186.8Inventories 18 19,235.9 15,455.6Trade receivables 14 15,969.8 12,399.6Cash and bank balances 19 2,084.5 708.6Loans and advances 13 3,320.8 3,148.5Other current assets 15 756.1 741.3
41,367.5 32,640.4TOTAL 72,778.4 62,376.3
Summary of significant accounting policies 1
The accompanying notes are an integral part of the financial statements.
Consolidated Balance Sheet as at March 31, 2013
NotesAs at As at
March 31, 2013 March 31, 2012
(All amounts in Indian Rupees million, except share data and where otherwise stated)
As per our report of even date. For and on behalf of the Board of Directors of Aurobindo Pharma Limited
For S.R. BATLIBOI & ASSOCIATES LLPChartered AccountantsICAI Firm Registration No. 101049W N. GOVINDARAJAN Dr. M. SIVAKUMARAN
Managing Director Director
per VIKAS KUMAR PANSARIPartnerMembership No. 93649 SUDHIR B. SINGHI A. MOHAN RAMI REDDY
Chief Financial Officer AVP (Legal) &Hyderabad, May 30, 2013 Company Secretary
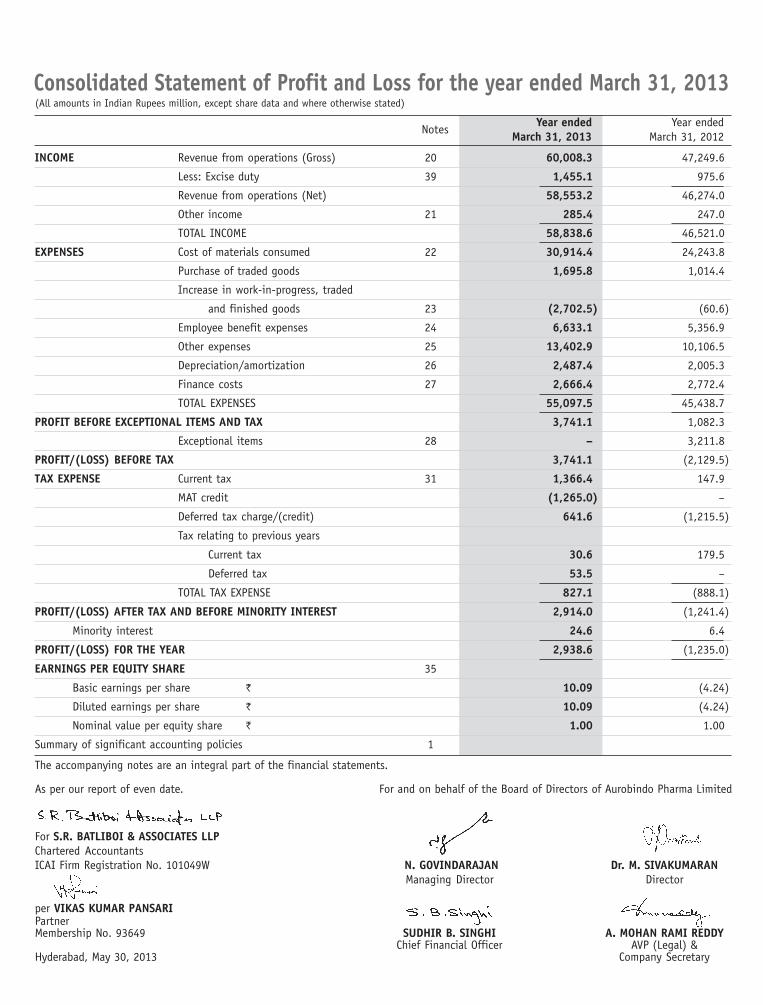
INCOME Revenue from operations (Gross) 20 60,008.3 47,249.6
Less: Excise duty 39 1,455.1 975.6
Revenue from operations (Net) 58,553.2 46,274.0
Other income 21 285.4 247.0
TOTAL INCOME 58,838.6 46,521.0
EXPENSES Cost of materials consumed 22 30,914.4 24,243.8
Purchase of traded goods 1,695.8 1,014.4
Increase in work-in-progress, traded
and finished goods 23 (2,702.5) (60.6)
Employee benefit expenses 24 6,633.1 5,356.9
Other expenses 25 13,402.9 10,106.5
Depreciation/amortization 26 2,487.4 2,005.3
Finance costs 27 2,666.4 2,772.4
TOTAL EXPENSES 55,097.5 45,438.7
PROFIT BEFORE EXCEPTIONAL ITEMS AND TAX 3,741.1 1,082.3
Exceptional items 28 – 3,211.8
PROFIT/(LOSS) BEFORE TAX 3,741.1 (2,129.5)
TAX EXPENSE Current tax 31 1,366.4 147.9
MAT credit (1,265.0) –
Deferred tax charge/(credit) 641.6 (1,215.5)
Tax relating to previous years
Current tax 30.6 179.5
Deferred tax 53.5 –
TOTAL TAX EXPENSE 827.1 (888.1)
PROFIT/(LOSS) AFTER TAX AND BEFORE MINORITY INTEREST 2,914.0 (1,241.4)
Minority interest 24.6 6.4
PROFIT/(LOSS) FOR THE YEAR 2,938.6 (1,235.0)
EARNINGS PER EQUITY SHARE 35
Basic earnings per share ` 10.09 (4.24)
Diluted earnings per share ` 10.09 (4.24)
Nominal value per equity share ` 1.00 1.00
Summary of significant accounting policies 1
The accompanying notes are an integral part of the financial statements.
Consolidated Statement of Profit and Loss for the year ended March 31, 2013
Notes Year ended Year ended
March 31, 2013 March 31, 2012
(All amounts in Indian Rupees million, except share data and where otherwise stated)
As per our report of even date. For and on behalf of the Board of Directors of Aurobindo Pharma Limited
For S.R. BATLIBOI & ASSOCIATES LLPChartered AccountantsICAI Firm Registration No. 101049W N. GOVINDARAJAN Dr. M. SIVAKUMARAN
Managing Director Director
per VIKAS KUMAR PANSARIPartnerMembership No. 93649 SUDHIR B. SINGHI A. MOHAN RAMI REDDY
Chief Financial Officer AVP (Legal) &Hyderabad, May 30, 2013 Company Secretary

Aurobindo Annual Report 2012-13 / 101
Consolidated Cash flow statement for the year ended March 31, 2013 Year ended Year ended
March 31, 2013 March 31, 2012
CASH FLOW FROM
OPERATING ACTIVITIES Net profit before tax, minority interest and exceptional items 3,741.1 1,082.3
Non-cash adjustment to reconcile profit before tax to
net cash flows:
Depreciation and amortization 2,487.4 2,005.3
Provision for trade receivables (Net) (16.2) 28.9
Bad debts/advances written off 246.4 34.1
Balances no longer required written back (11.3) (15.0)
Unrealized foreign exchange loss/(gain) (Net) 518.4 920.9
Profit on sale of investment (46.8) –
Loss on sale/writeoff of fixed assets (Net) 164.6 36.4
Interest expense 1,132.3 813.2
Interest income (29.2) (56.6)
Dividend income – –
Operating profit before working capital changes 8,186.7 4,849.5
Foreign currency translation adjustments (30.2) 105.0
Movements in working capital:
Increase/(decrease) in trade payables 2,973.0 (1,144.5)
Increase in inventories (3,780.3) (902.9)
(Increase)/decrease in trade receivables (3,672.6) 221.7
Increase in other current/non-current assets (157.8) (380.7)
(Increase)/decrease in loans and advances (121.9) 898.3
Increase/(decrease) in provision for retirement benefits 129.5 (2.5)
Increase in other current liabilities 414.5 27.2
Cash generated from operations 3,940.9 3,671.1
Direct taxes paid (Net of refunds) (1,192.2) (408.6)
NET CASH FLOW FROM OPERATING ACTIVITIES (A) 2,748.7 3,262.5
CASH FLOW USED IN
INVESTING ACTIVITIES Purchase of fixed assets and intangibles, including
capital work-in-progress and capital advances (2,732.6) (5,713.2)
Proceeds from sale of fixed assets and intangibles 56.8 47.6
Proceeds from sale of current investment 233.2 –
Share application money to others (3.3) (12.2)
Investment in bank deposits (Net) (35.7) (8.7)
Interest received 18.2 54.9
Dividend received – –
NET CASH FLOW USED IN INVESTING ACTIVITIES (B) (2,463.4) (5,631.6)
(All amounts in Indian Rupees million, except share data and where otherwise stated)

Year ended Year ended March 31, 2013 March 31, 2012
CASH FLOW FROM
FINANCING ACTIVITIES Proceeds from issuance of share capital 8.2 –
Proceeds from long-term borrowings 1,804.9 11,063.7
Repayment of long-term borrowings (5,231.0) (2,905.0)
Repayment of FCCBs – (6,207.6)
Redemption premium (Yield to Maturity)
on redemption of FCCBs – (3,198.6)
Proceeds from short-term borrowings (Net) 6,293.7 3,529.4
Interest paid (1,120.6) (755.2)
Dividends and dividend tax paid (674.3) (338.2)
NET CASH FLOW GENERATED FROM FINANCING ACTIVITIES (C) 1,080.9 1,188.5
NET INCREASE/(DECREASE) IN CASH AND CASH EQUIVALENTS (A+B+C) 1,366.2 (1,180.6)
CASH AND CASH EQUIVALENTS AT THE BEGINNING OF THE YEAR 656.4 1,837.1
Effect of exchange differences on cash and cash equivalents 4.7 (0.1)
CASH AND CASH EQUIVALENTS AT THE END OF THE YEAR 2,027.3 656.4
Components of cash and bank balances
Cash on hand 9.2 8.3
Balance with banks
on current account 1,928.0 543.5
on cash credit account 82.3 99.2
on deposit account 89.2 53.4
on unpaid dividend account* 7.8 5.4
Cash and bank balances as per Consolidated Balance Sheet 2,116.5 709.8
Less: Fixed deposits considered as investing activities (89.2) (53.4)
Cash and cash equivalents considered for cash flows (Refer Note 19) 2,027.3 656.4
Summary of significant accounting policies (Refer Note 1)
* The Group can utilize these balances only towards settlement of unpaid dividend.
(All amounts in Indian Rupees million, except share data and where otherwise stated)
As per our report of even date. For and on behalf of the Board of Directors of Aurobindo Pharma Limited
For S.R. BATLIBOI & ASSOCIATES LLPChartered AccountantsICAI Firm Registration No. 101049W N. GOVINDARAJAN Dr. M. SIVAKUMARAN
Managing Director Director
per VIKAS KUMAR PANSARIPartnerMembership No. 93649 SUDHIR B. SINGHI A. MOHAN RAMI REDDY
Chief Financial Officer AVP (Legal) &Hyderabad, May 30, 2013 Company Secretary

Aurobindo Annual Report 2012-13 / 103
1. STATEMENT OF SIGNIFICANT ACCOUNTING POLICIES
a. Basis of consolidation
The Consolidated Financial Statements of Aurobindo Pharma Limited ('APL' or 'the parent company') together with its subsidiaries andjoint venture entities (collectively termed as 'the Group' or 'the Consolidated Entities') are prepared in accordance with generallyaccepted accounting principles in India (Indian GAAP) under the historical cost convention on accrual basis to comply in all materialrespects with the mandatory Accounting Standards ('AS') notified by Companies Accounting Standards Rules, 2006 (as amended),other pronouncements of the Institute of Chartered Accountants of India and relevant provisions of the Companies Act, 1956 usinguniform accounting policies for like transactions and other events in similar circumstances and are presented to the extent possiblein the same manner as the Company’s seperate financial statements. The accounting policies have been consistently applied by theCompany and are consistent with those used in the previous year.
Investments in subsidiaries, except where investments are acquired exclusively with a view to its subsequent disposal in the immediatenear future, are accounted in accordance with accounting principles as defined under AS 21 'Consolidated Financial Statements' on aline by line basis. Investments in joint ventures has been accounted using proportionate consolidation method as per AS 27 'FinancialReporting of Interests in Joint Ventures'.
All material inter-company balances and inter-company transactions and resulting unrealized profits or losses are eliminated onconsolidation.
Elimination of unrealized profits or losses in joint venture entities is to the extent of Group’s share in the joint venture.
Minorities’ interest in net profits of consolidated subsidiaries for the year is identified and adjusted against the income in order toarrive at the net income attributable to the shareholders of the Group. Their share of net assets is identified and presented in theConsolidated Balance Sheet separately. Where accumulated losses attributable to the minorities are in excess of their equity in theabsence of the contractual obligation on the minorities, the same are accounted for by the Group.
The financial statements of the entities used for the purpose of consolidation are drawn up to same reporting date as that of theparent company i.e. year ended March 31, 2013.
The Consolidated Financial Statements for the year ended March 31, 2013 have been prepared on the basis of the financial statementsof the following subsidiaries and joint venture entities:
Name of the consolidated entities
Country of Nature of % of interestincorporation interest March 31,
2013 2012
APL Pharma Thai Limited Thailand Subsidiary 97.9% 97.9%
Aurobindo Pharma Industria Farmaceutica Limiteda Brazil Subsidiary 99.8% 99.8%
Helix Healthcare B.V. The Netherlands Subsidiary 100% 100%
Aurobindo Pharma USA Inc. U.S.A. Subsidiary 100% 100%
Auro Pharma Inc. Canada Subsidiary 100% 100%
Aurobindo Pharma (Pty) Limited South Africa Subsidiary 100% 100%
Milpharm Limited U.K. Subsidiary 100% 100%
Agile Pharma B.V. The Netherlands Subsidiary 100% 100%
Aurobindo Pharma (Australia) Pty Limited Australia Subsidiary 100% 100%
Auro Healthcare (Nigeria) Limited Nigeria Subsidiary 100% 100%
Aurobindo Switzerland AG Switzerland Subsidiary 100% 100%
Aurobindo Pharma Hungary Kereskedelmi, KFT4 Hungary Subsidiary – 100%
Pharmacin B.V. The Netherlands Subsidiary 100% 100%
Aurobindo Pharma Produtos Farmaceuticos Ltda Brazil Subsidiary 100% 100%
All Pharma (Shanghai) Trading Company Limited China Subsidiary 100% 100%
APL Holdings (Jersey) Limited Jersey Subsidiary 100% 100%
Notes to Consolidated Financial Statements for the year ended March 31, 2013
(Contd...)

Name of the consolidated entitiesCountry of Nature of % of interest
incorporation interest March 31,2013 2012
APL IP Company Limited Jersey Subsidiary 100% 100%
Aurobindo Pharma Japan K.K. Japan Subsidiary 100% 100%
Agile Malta Holdings Limited Malta Subsidiary 100% 100%
Aurobindo Pharma (Malta) Limited Malta Subsidiary 100% 100%
APL Swift Services (Malta) Limited Malta Subsidiary 100% 100%
Agile Pharma (Malta) Limited Malta Subsidiary 100% 100%
Laboratorios Aurobindo, S.L. Spain Subsidiary 100% 100%
Aurobindo Pharma (Italia) S.r.l. Italy Subsidiary 100% 100%
Aurobindo Pharma (Portugal) Unipessoal LDA Portugal Subsidiary 100% 100%
Aurobindo Pharma (Bulgaria) EAD1 Bulgaria Subsidiary – –
Aurobindo Pharma France SARL France Subsidiary 100% 100%
Aurolife Pharma LLC U.S.A. Subsidiary 100% 100%
Aurobindo Pharma GmbH Germany Germany Subsidiary 100% 100%
Aurobindo ILAC Sanayi ve Ticaret Limited Sirketi, Turkey Turkey Subsidiary 100% 100%
APL Research Centre Limited India Subsidiary 100% 100%
APL Healthcare Limited India Subsidiary 100% 100%
Aurosal Pharmaceuticals, LLC2 U.S.A. Joint venture – –
Novagen Pharma (Pty) Limited South Africa Joint venture 50% 50%
Auronext Pharma Private Limited India Subsidiary 75% 75%
Aurobindo Pharma (Singapore) Pte Limited Singapore Subsidiary 100% 100%
Aurobindo Pharma B.V. The Netherlands Subsidiary 100% 100%
Aurobindo Pharma (Romania) s.r.l. Romania Subsidiary 100% 100%
Aurobindo Pharma (Poland) Sp.z.o.o. Poland Subsidiary 100% 100%
Aurobindo Pharma Limited, s.r.l. Dominican Republic Subsidiary 100% 100%
Auro Peptides Limited (w.e.f. January 2, 2012) India Subsidiary 100% 100%
Auro Medics Pharma LLC, USA (w.e.f. from May 18, 2011) U.S.A. Subsidiary 100% 100%
Zao Auros Pharma, Russia5 Russia Joint Venture – 50%
Aurobindo Pharma NZ Limited (w.e.f. February 10, 2012)3 New Zealand Subsidiary 100% 100%
Aurovida Farmaceutica SA DE CV (w.e.f. February 10, 2012) Mexico Subsidiary 100% 100%
Auro Health LLC (w.e.f. September 13, 2012) U.S.A. Subsidiary 100% –
Aurobindo Antibiotics Limited (w.e.f. July 10, 2012) India Subsidiary 100% –
Notes:
1 Closed its operations on August 19, 2011.
2 Closed its operations on December 31, 2011.
3 Aurobindo Pharma NZ Limited, New Zealand was incorporated during the year 2011-12 and there was no activity during the year ended March 31,2013; hence the same has not been consolidated.
4 Closed its operations on September 13, 2012.
5 Closed during the current year without any operations.
6 The figures for the subsidiaries/joint venture have been considered upto the date of disposal/closure.
Notes to Consolidated Financial Statements for the year ended March 31, 2013

Aurobindo Annual Report 2012-13 / 105
Notes to Consolidated Financial Statements for the year ended March 31, 2013
b. Use of estimates
The preparation of Consolidated Financial Statements inconformity with Indian GAAP requires the management tomake judgments, estimates and assumptions that affectthe reported amounts of revenues, expenses, assets andliabilities and the disclosure of contingent liabilities atthe date of the consolidated financial statements and theresults of operations during the reporting period. Althoughthese estimates are based upon management’s bestknowledge of current events and actions, actual resultscould differ from these estimates.
c. Revenue recognition
Revenue is recognized to the extent that it is probablethat the economic benefits will flow to the Group and therevenue can be reliably measured.
i. Revenue from sale of goods is recognized on dispatch(in respect of exports on the date of the bill of ladingor airway bill) which coincides with transfer ofsignificant risks and rewards to customer and is netof trade discounts, sales returns and sales tax, whereapplicable. Excise duty deducted from revenue (gross)is the amount that is included in revenue (gross)and not the entire amount of liability arising duringthe year.
ii. Revenue from sale of dossiers/licenses/services isrecognized in accordance with the terms of therelevant agreements as accepted and agreed with thecustomers.
iii. Interest is recognized on a time proportion basistaking into account the amount outstanding and therate applicable.
iv. Dividend is recognized as and when the Group’s rightto receive payment is established by the reportingdate.
d. Fixed assets and depreciation
i. Fixed assets are stated at cost less accumulateddepreciation, impairment losses and specific grant/subsidies, if any. Cost comprise of purchase price,freight, non refundable taxes and duties and anyattributable cost of bringing the asset to its workingcondition for its intended use. Borrowing costsrelating to acquisition of fixed assets which takesubstantial period of time to get ready for use areincluded to the extent they relate to the period tillsuch assets are ready for intended use. All otherborrowing costs are expensed in the period they occur.
ii. Expenditure directly relating to construction activityis capitalized. Indirect expenditure is capitalized tothe extent those relate to the construction activityor is incidental thereto. Income earned duringconstruction period is deducted from the totalexpenditure relating to construction activity.
iii. Assets retired from active use and held for disposalare stated at their estimated net realizable values ornet book values, whichever is lower.
iv. Assets under finance leases, where there is noreasonable certainty that the Group will obtain theownership by the end of the lease term are capitalizedand are depreciated over the lease term or estimateduseful life of the asset or useful life envisaged inSchedule XIV of the Companies Act, 1956, whicheveris shorter.
v. Premium paid on leasehold land is amortized overthe lease term.
vi. Fixed assets of overseas subsidiaries and overseasjoint venture entities are depreciated over theestimated useful lives using the 'Straight LineMethod'.
vii. Depreciation on assets other than specified above isprovided on the straight-line method, based on theuseful life of the assets as estimated by themanagement which generally coincides with ratesprescribed under Schedule XIV to the Companies Act,1956 except assets acquired at the Bhiwadi unit inRajasthan for which depreciation is provided on astraight-line basis, at the rates that are higher thanthose specified in Schedule XIV to the CompaniesAct, 1956 and are based on useful lives as estimatedby management. In these cases the rates are as under:
Leasehold Building : 5%
Plant and Machinery : 20%
viii. Assets costing below `5,000 are depreciated fully inthe year of purchase.
e. Intangibles
Intangible assets consists of goodwill, computer software,licenses, patents and product development costs.
Goodwill represents the excess of purchase considerationover the net book value of assets acquired of the subsidiarycompanies as on the date of investment. Goodwill is notamortized but is tested for impairment on a periodic basisand impairment losses are recognized where applicable.
Computer software license cost is expensed in the year ofpurchase as there is no expected future economic benefit.
Cost relating to licenses and patents which are acquired,are capitalized and amortized on a straight-line basis overtheir useful life not exceeding ten years.
Research costs are expensed as incurred. Developmentexpenditure incurred in respect of internally generatedintangible assets such as product development is carriedforward when the future recoverability can reasonably beregarded as assured. Any expenditure carried forward isamortized on a straight-line basis over the period ofexpected future economic benefit from the related project,not exceeding ten years.
The carrying value of intangible assets is reviewed forimpairment annually when the asset is not available foruse, and otherwise when events or changes in circumstancesindicate that the carrying value may not be recoverable.
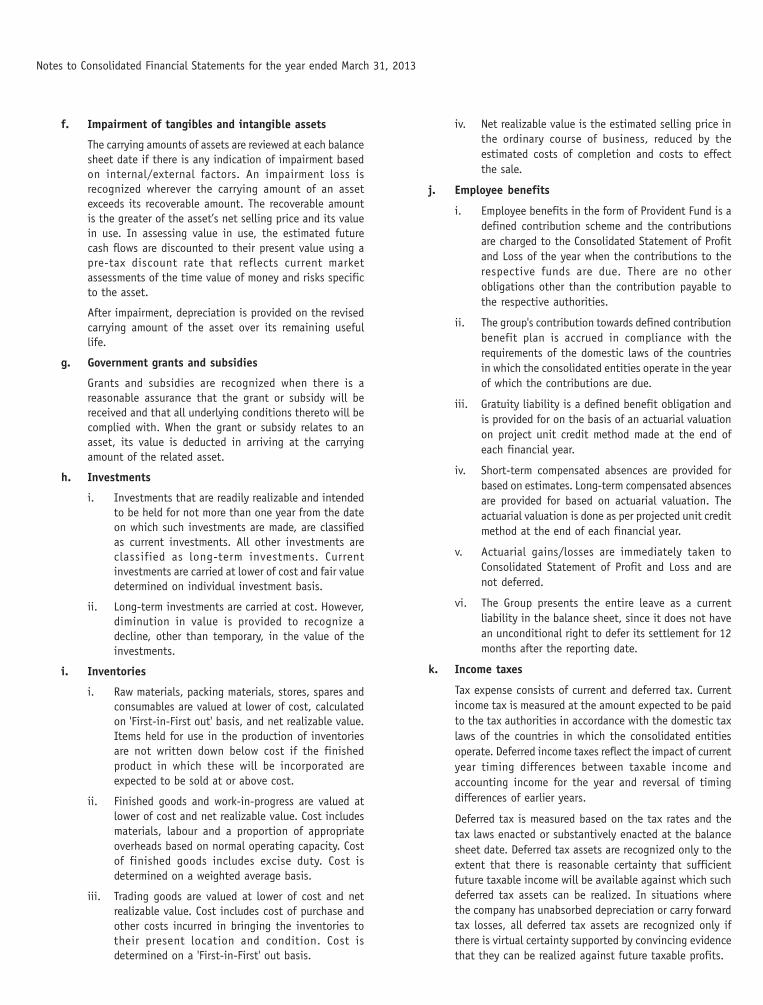
Notes to Consolidated Financial Statements for the year ended March 31, 2013
f. Impairment of tangibles and intangible assets
The carrying amounts of assets are reviewed at each balancesheet date if there is any indication of impairment basedon internal/external factors. An impairment loss isrecognized wherever the carrying amount of an assetexceeds its recoverable amount. The recoverable amountis the greater of the asset’s net selling price and its valuein use. In assessing value in use, the estimated futurecash flows are discounted to their present value using apre-tax discount rate that reflects current marketassessments of the time value of money and risks specificto the asset.
After impairment, depreciation is provided on the revisedcarrying amount of the asset over its remaining usefullife.
g. Government grants and subsidies
Grants and subsidies are recognized when there is areasonable assurance that the grant or subsidy will bereceived and that all underlying conditions thereto will becomplied with. When the grant or subsidy relates to anasset, its value is deducted in arriving at the carryingamount of the related asset.
h. Investments
i. Investments that are readily realizable and intendedto be held for not more than one year from the dateon which such investments are made, are classifiedas current investments. All other investments areclassified as long-term investments. Currentinvestments are carried at lower of cost and fair valuedetermined on individual investment basis.
ii. Long-term investments are carried at cost. However,diminution in value is provided to recognize adecline, other than temporary, in the value of theinvestments.
i. Inventories
i. Raw materials, packing materials, stores, spares andconsumables are valued at lower of cost, calculatedon 'First-in-First out' basis, and net realizable value.Items held for use in the production of inventoriesare not written down below cost if the finishedproduct in which these will be incorporated areexpected to be sold at or above cost.
ii. Finished goods and work-in-progress are valued atlower of cost and net realizable value. Cost includesmaterials, labour and a proportion of appropriateoverheads based on normal operating capacity. Costof finished goods includes excise duty. Cost isdetermined on a weighted average basis.
iii. Trading goods are valued at lower of cost and netrealizable value. Cost includes cost of purchase andother costs incurred in bringing the inventories totheir present location and condition. Cost isdetermined on a 'First-in-First' out basis.
iv. Net realizable value is the estimated selling price inthe ordinary course of business, reduced by theestimated costs of completion and costs to effectthe sale.
j. Employee benefits
i. Employee benefits in the form of Provident Fund is adefined contribution scheme and the contributionsare charged to the Consolidated Statement of Profitand Loss of the year when the contributions to therespective funds are due. There are no otherobligations other than the contribution payable tothe respective authorities.
ii. The group's contribution towards defined contributionbenefit plan is accrued in compliance with therequirements of the domestic laws of the countriesin which the consolidated entities operate in the yearof which the contributions are due.
iii. Gratuity liability is a defined benefit obligation andis provided for on the basis of an actuarial valuationon project unit credit method made at the end ofeach financial year.
iv. Short-term compensated absences are provided forbased on estimates. Long-term compensated absencesare provided for based on actuarial valuation. Theactuarial valuation is done as per projected unit creditmethod at the end of each financial year.
v. Actuarial gains/losses are immediately taken toConsolidated Statement of Profit and Loss and arenot deferred.
vi. The Group presents the entire leave as a currentliability in the balance sheet, since it does not havean unconditional right to defer its settlement for 12months after the reporting date.
k. Income taxes
Tax expense consists of current and deferred tax. Currentincome tax is measured at the amount expected to be paidto the tax authorities in accordance with the domestic taxlaws of the countries in which the consolidated entitiesoperate. Deferred income taxes reflect the impact of currentyear timing differences between taxable income andaccounting income for the year and reversal of timingdifferences of earlier years.
Deferred tax is measured based on the tax rates and thetax laws enacted or substantively enacted at the balancesheet date. Deferred tax assets are recognized only to theextent that there is reasonable certainty that sufficientfuture taxable income will be available against which suchdeferred tax assets can be realized. In situations wherethe company has unabsorbed depreciation or carry forwardtax losses, all deferred tax assets are recognized only ifthere is virtual certainty supported by convincing evidencethat they can be realized against future taxable profits.

Aurobindo Annual Report 2012-13 / 107
In the situations where the Group is entitled to tax holidayunder Income Tax Act, 1961, no deferred tax is recognizedin respect of timing differences which reverse during thetax holiday period, to the extent Company's gross totalincome is subject to the deduction during the tax holidayperiod. Deferred tax in respect of timing differences whichreverse after the tax holiday period is recognized in theyear in which timing difference originate.
Unrecognized deferred tax assets of earlier years are re-assessed and recognized to the extent that it has becomereasonably certain or virtually certain, as the case may bethat future taxable income will be available against whichsuch deferred tax assets can be realized.
Deferred tax assets and liabilities pertaining toconsolidated entities are not set off against each other asthe Group does not have a legal right to do so.
The carrying amount of deferred tax assets are reviewedat each balance sheet date. The Group writes-down thecarrying amount of a deferred tax asset to the extent thatit is no longer reasonably certain or virtually certain, asthe case may be, that sufficient future taxable incomewill be available against which deferred tax asset can berealized. Any such write-down is reversed to the extentthat it becomes reasonably certain or virtually certain, asthe case may be, that sufficient future taxable incomewill be available.
Minimum alternate tax (MAT) paid in a year is charged tothe statement of profit and loss as current tax. TheCompany recognizes MAT credit available as an asset onlyto the extent that there is convincing evidence that theCompany will pay normal income tax during the specifiedperiod, i.e. the period for which MAT credit is allowed tobe carried forward. In the year in which the companyrecognizes MAT credit as an asset in accordance with theGuidance Note on Accounting for Credit Available in respectof Minimum Alternative Tax under the Income Tax Act,1961, the said asset is created by way of credit to thestatement of profit and loss and shown as 'MAT CreditEntitlement.' The Company reviews the 'MAT creditentitlement' asset at each reporting date and writes downthe asset to the extent the Company does not haveconvincing evidence that it will pay normal tax duringthe specified period.
l. Foreign exchange transactions
Initial recognition
Foreign currency transactions are recorded in the reportingcurrency, by applying to the foreign currency amount theexchange rate between the reporting currency and foreigncurrency at the date of the transaction.
Conversion
Foreign currency monetary items are reported at year-endrates. Non-monetary items which are carried in terms ofhistorical cost denominated in foreign currency arereported using the exchange rate at the date of thetransaction.
Notes to Consolidated Financial Statements for the year ended March 31, 2013
Exchange differences
Exchange differences arising on the settlement of monetaryitems or on reporting monetary items of Company at ratesdifferent from those at which they were initially recordedduring the year, or reported in previous financialstatements, are recognized as income or as expenses inthe year in which they arise.
Forward exchange contracts not intended for trading purposes
In case of forward exchange contracts, difference betweenthe forward rate and the exchange rate on the date oftransaction is recognized as expense or income over thelife of the contract. Exchange differences on such contractsare recognized in the statement of consolidated profit andloss in the year in which the exchange rates change. Anyprofit or loss arising on cancellation or renewal of forwardexchange contract is recognized as income or as expensefor the year.
m. Translation of integral and non-integral foreignoperation
In accordance with the accounting principles as prescribedunder the AS 11 (Revised) and based on the analysis ofrelevant criteria, as explained below, the Group hasdesignated the operations of following overseasconsolidated entities viz Aurobindo Pharma IndustriaFarmaceutica Ltda; APL Pharma Thai Limited; HelixHealthcare B.V.; Auro Pharma Inc.; Aurobindo Pharma (Pty)Limited; Aurobindo Switzerland AG; Aurobindo Pharma(Australia) Pty Limited; Auro Healthcare (Nigeria) Limited;Aurobindo Pharma Hungary Kereskedelmi, KFT; Agile PharmaB.V.; Aurobindo Pharma Produtos Farmaceuticos Ltda; AllPharma (Shanghai) Trading Company Limited; APL Holdings(Jersey) Limited; Aurobindo Pharma Japan K.K.; Agile MaltaHoldings Limited; Agile Pharma (Malta) Limited;Laboratorios Aurobindo, S.L.; Aurobindo Pharma (Italia)S.r.l.; Aurobindo Pharma (Portugal) Unipessoal LDA;Aurobindo Pharma France SARL; Aurobindo Pharma GmbHGermany; Aurobindo ILAC Sanayi ve Ticaret Limited Sirketi;Novagen Pharma (Pty) Limited; Aurobindo Pharma(Singapore) Pte Limited; Aurobindo Pharma B.V.; AurobindoPharma (Romania) s.r.l.; Aurobindo Pharma (Poland)Sp.z.o.o.; Aurobindo Pharma Limited, s.r.l.; Auro HealthLLC and Aurovida Farmaceutica SA de CV as 'integral foreignoperations':
a. These foreign operations are under the directsupervision and control of the parent company’smanagement;
b. There are high proportions of inter-companytransactions;
c. These foreign operations are mainly financed by theparent company; and
d. Cash flows of these foreign operations have directimpact on the cash flows of the parent company.
The financial statements of an integral foreignoperation are translated as if the transactions of the

foreign operation have been those of the parentcompany itself.
In translating the financial statements of a non-integral foreign operation for incorporation inconsolidated financial statements, the assets andliabilities, both monetary and non-monetary, of thenon-integral foreign operation are translated at theclosing rate; income and expense items of the non-integral foreign operation are translated using averageexchange rates prevailing during the reporting period.All resulting exchange differences are accumulatedin a foreign currency translation reserve until thedisposal of the net investment.
On the disposal/closure of a non-integral foreignoperation, the cumulative amount of the exchangedifferences which have been deferred and which relateto that operation are recognized as income or asexpenses in the same period in which the gain orloss on disposal is recognized.
When there is a change in the classification of aforeign operation, the translation proceduresapplicable to the revised classification are appliedfrom the date of the change in the classification.
n. Export benefits, incentives and licenses
Export benefits on account of duty drawback and exportpromotion schemes are accrued and accounted in the yearof export, and are included in other operating revenue.Other benefits in the form of advance authorisation forimports are accounted for on purchase of importedmaterials.
o. Leases
Where the Group is lessee
Finance leases, where the substantial risks and benefitsincidental to ownership of the leased items are transferredto the Group, are capitalized at the lower of the fair valueand present value of the minimum lease payments at theinception of the lease term and disclosed as leased assets.Lease payments are apportioned between the financecharges and reduction of the lease liability based on theimplicit rate of return. Finance charges are charged directlyagainst income. Lease management fees, legal charges andother initial direct costs are capitalized.
Leases, where the lessor effectively retains substantiallyall the risks and benefits of ownership of the leased itemare classified as operating leases. Operating lease paymentsare recognized as an expense in the consolidated statementof profit and loss on a straight-line basis over the leaseterm.
p. Earnings per share
Basic earnings per share is calculated by dividing the netconsolidated profit or loss for the year attributable to equity
Notes to Consolidated Financial Statements for the year ended March 31, 2013
shareholders by the weighted average number of equityshares outstanding during the year.
For the purpose of calculating diluted earnings per share,the net consolidated profit or loss for the year attributableto equity shareholders and the weighted average numberof shares outstanding during the year are adjusted for theeffects of all dilutive potential equity shares.
q. Provisions
A provision is recognized when the Group has a presentobligation as a result of past event and it is probable thatan outflow of resources will be required to settle theobligation in respect of which a reliable estimate can bemade. Provisions are not discounted to its present valueand are determined based on best estimate required tosettle the obligation at the balance sheet date. These arereviewed at each balance sheet date and adjusted to reflectthe current best estimates.
r. Cash and cash equivalents
Cash and cash equivalents in the cash flow statementscomprise cash at bank and in hand and short-terminvestments with an original maturity of three months orless.
s. Employee stock compensation cost
Measurement and disclosure of the employee share-basedpayment plans is done in accordance with SEBI (EmployeeStock Option Scheme and Employee Stock Purchase Scheme)Guidelines, 1999 and Guidance Note on Accounting forEmployee Share Based Payment Plans, issued by theInstitute of Chartered Accountants of India. The Groupmeasures compensation cost relating to employee stockoptions using the intrinsic value method. Compensationexpense if any, is amortized over the vesting period of theoption on a straight line basis.
t. Contingent liabilities
A contingent liability is possible obligation that arisesfrom past events whose existence will be confirmed by theoccurrence or non occurrence of one or more uncertainfuture events beyond the control of Group or a presentobligation that is not recognized because it is not probablethat an outflow of resources will be required to settle theobligation. A contingent liability also arises in extremelyrare cases where there is a liability that can not berecognized because it can not be measured reliably. TheGroup does not recognize the contingent liability butdiscloses its existence in the consolidated financialstatements.
u. Borrowing cost
Borrowing cost includes interest incurred in connectionwith the arrangement of borrowings and exchangedifferences arising from foreign currency borrowings tothe extent they are regarded as an adjustment to theinterest cost.

Aurobindo Annual Report 2012-13 / 109
Notes to Consolidated Financial Statements for the year ended March 31, 2013
(All amounts in Indian Rupees million, except share data and where otherwise stated)
As at As atMarch 31, 2013 March 31, 2012
2. SHARE CAPITAL
AUTHORISED 660,000,000 (March 31, 2012: 660,000,000)
equity shares of `1 each 660.0 660.01,000,000 (March 31, 2012: 1,000,000)preference shares of `100 each 100.0 100.0
760.0 760.0ISSUED, SUBSCRIBEDAND FULLY PAID-UP SHARES
291,211,290 (March 31, 2012: 291,121,290)equity shares of `1 each 291.2 291.1TOTAL 291.2 291.1
a. Reconciliation of the equity shares outstanding at the beginning and at the end of the year As at March 31, 2013 As at March 31, 2012
Numbers ` Numbers `
Equity shares
At the beginning of the year 291,121,290 291,121,290 291,121,290 291,121,290
Issued during the year under employee stock option plan 90,000 90,000 – –
Outstanding at the end of the year 291,211,290 291,211,290 291,121,290 291,121,290
b. Terms/rights attached to equity shares
The parent company has only one class of equity shares having a par values of `1 per share. Each holder of equity shares is entitledto one vote per share.
The parent company declares and pays dividends in Indian rupees. The dividend proposed by the Board of Directors is subject to theapproval of shareholders in the ensuing Annual General Meeting.
During the year ended March 31, 2013, the amount of dividend per share recognized as distributions to equity shareholders was `1.5(March 31, 2012: `1) including interim dividend of `1 (March 31, 2012: Nil).
In the event of liquidation of the parent company, the holders of equity shares will be entitled to receive remaining assets of theparent company, after distribution of all preferential amounts. However, no such preferential amounts exist currently. The distributionwill be in proportion to the number of equity shares held by the shareholders.
c. Details of shareholders holding more than 5% equity shares in the Company
As at March 31, 2013 As at March 31, 2012
Number % holding Numbers % holding
Mr. P.V. Ramprasad Reddy 19,481,440 6.69 19,481,440 6.69
Mrs. P. Suneela Rani 90,830,550 31.19 90,830,550 31.20
TOTAL 110,311,990 110,311,990
As per records of the parent company, including its register of shareholders/members and other declarations received from
shareholders regarding beneficial interest, the above shareholding represents both legal and beneficial ownerships of shares.
d. For details of shares reserved for issue under Employee Stock Option Plan (ESOP) of the parent company, refer note 32.
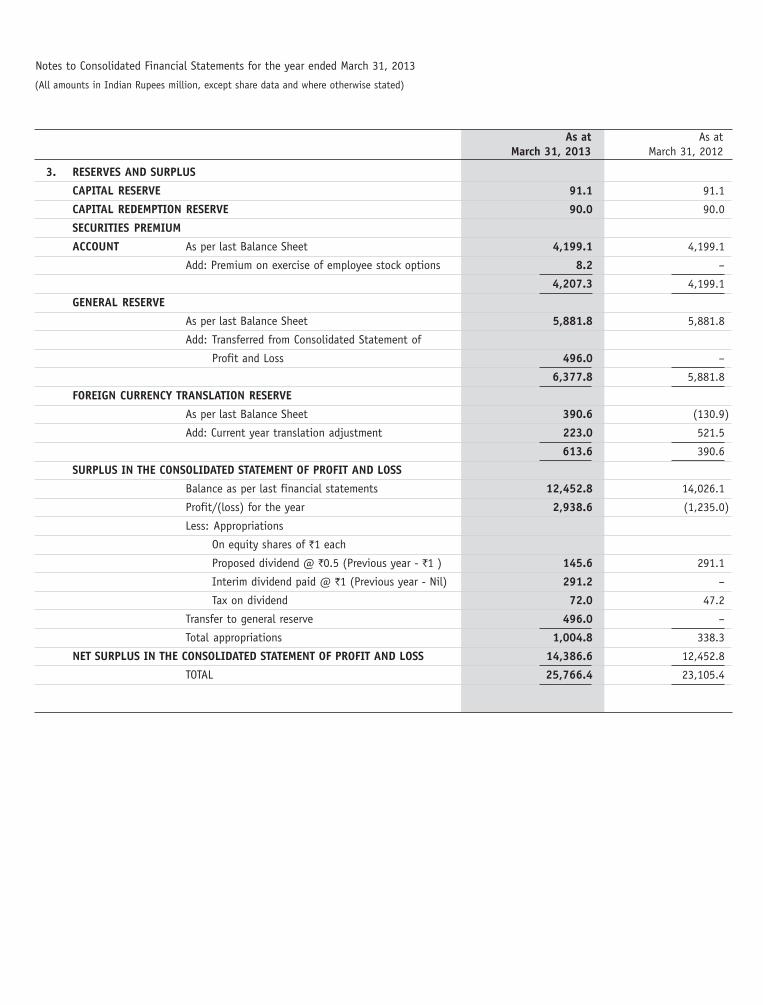
As at As atMarch 31, 2013 March 31, 2012
3. RESERVES AND SURPLUS
CAPITAL RESERVE 91.1 91.1
CAPITAL REDEMPTION RESERVE 90.0 90.0
SECURITIES PREMIUM
ACCOUNT As per last Balance Sheet 4,199.1 4,199.1
Add: Premium on exercise of employee stock options 8.2 –
4,207.3 4,199.1
GENERAL RESERVE
As per last Balance Sheet 5,881.8 5,881.8
Add: Transferred from Consolidated Statement of
Profit and Loss 496.0 –
6,377.8 5,881.8
FOREIGN CURRENCY TRANSLATION RESERVE
As per last Balance Sheet 390.6 (130.9)
Add: Current year translation adjustment 223.0 521.5
613.6 390.6
SURPLUS IN THE CONSOLIDATED STATEMENT OF PROFIT AND LOSS
Balance as per last financial statements 12,452.8 14,026.1
Profit/(loss) for the year 2,938.6 (1,235.0)
Less: Appropriations
On equity shares of `1 each
Proposed dividend @ `0.5 (Previous year - `1 ) 145.6 291.1
Interim dividend paid @ `1 (Previous year - Nil) 291.2 –
Tax on dividend 72.0 47.2
Transfer to general reserve 496.0 –
Total appropriations 1,004.8 338.3
NET SURPLUS IN THE CONSOLIDATED STATEMENT OF PROFIT AND LOSS 14,386.6 12,452.8
TOTAL 25,766.4 23,105.4
Notes to Consolidated Financial Statements for the year ended March 31, 2013
(All amounts in Indian Rupees million, except share data and where otherwise stated)

Aurobindo Annual Report 2012-13 / 111
4. LONG-TERM BORROWINGS
Non-current portion Current maturitiesAs at As at As at As at
March 31, 2013 March 31, 2012 March 31, 2013 March 31, 2012
From banks - SecuredTerm loans - Foreign currency 10,653.4 8,423.0 78.7 424.2Term loans - Rupee loans 187.7 197.8 22.5 11.5
10,841.1 8,620.8 101.2 435.7From banks - UnsecuredTerm loans - Foreign currency – 318.0 339.3 4,756.6
– 318.0 339.3 4,756.6Other loans - UnsecuredDeferred sales tax loan 641.5 707.5 70.3 38.7
641.5 707.5 70.3 38.7Amount disclosed under the head'Other current liabilities' (Refer Note 9) (510.8) (5,231.0)
TOTAL 11,482.6 9,646.3 – –The above amount includesSecured borrowings 10,841.1 8,620.8 101.2 435.7Unsecured borrowings 641.5 1,025.5 409.6 4,795.3
i. Secured term loans in foreign currency amounting to `9,771.3 carry interest in the range of LIBOR plus 2% to 2.5%. Out of theseloans, loans amounting to `5,699.9 (March 31, 2012: `3,815.6) are repayable in 3 equal installments in 4th, 5th, 6th years from therespective final draw down dates, and loans amounting to `4,071.4 (March 31, 2012: `3,815.6) are repayable at the end of 5th yearfrom the respective final draw down date. These loans are secured by first pari passu charge on all the present and future fixed assets,both movable and immoveable property of the parent company.
ii. Secured terms loan in foreign currency amounting to `48.2 carry an interest of 6 month LIBOR plus 50 basis points with interestpayments at monthly intervals (current interest rate being 4.96% per annum). The banks shall reset the interest rates after every sixmonths. The foreign currency term loans are repayable in 14 quarterly installments of `3.4 each and 4 quarterly installments of`5.1 each, starting from December 31, 2011. In case of higher cost of funds/non availability of foreign currency after 6 months thebank reserves the right to convert the foreign currency term loan into Indian rupee term loan with interest of base rate plus 3%(current base rate is 10.25%). Secured term loan in Indian rupee amounting to `210.2 carry an interest rate of 13% per annum (fixedfor two years) payable monthly with reset option after 2 years. All Indian rupee term loans are repayable in 14 quarterly installmentsof `1.5 and 4 quarterly installments of `2.3 starting from December 31, 2011, except the term loan of `176.0, for which repaymentof 16 equal quarterly installments of `11.0 shall begin after 6 months of scheduled commencement of commercial operations date asper the sanction letter but not later than September 30, 2012. These loans are secured by a first charge on entire fixed assets ofAuronext Pharma Private Limited (both present and future) and collateral security of present and future current assets of AuronextPharma Private Limited.
iii. Secured foreign currency term loans amounting to `655.7 carry interest rate of 4.02% and is payable over a period of 20 years inequal monthly installments and the last installment is payable in October, 2031. Secured foreign currency term loans amounting to`32.5 carry interest rate of 4.60% and is payable over a period of 5 years in equal monthly installments and the last installment ispayable in May, 2016. Secured foreign currency term loans amounting to `75.5 carry interest rate of 3.86% and is payable over aperiod of 5 years in equal monthly installments and the last installment is payable in September, 2016. Secured foreign currency termloans amounting to `21.9 carry interest rate of 3.92% and is payable over a period of 5 years in equal monthly installments and thelast installment is payable in December, 2016. Secured foreign currency term loans amounting to `44.7 carry interest rate of 4.10%and is payable over a period of 7 years in equal monthly installments and the last installment is payable in November, 2019. Securedforeign currency term loans amounting to `82.3 carry interest rate of LIBOR plus 3.0% and is payable over a period of 7 years in equalmonthly installments and the last installment is payable in June 2020. These loans are secured by property, fixed assets, inventoryand trade receivable of Aurolife Pharma LLC, Aurobindo Pharma USA Inc and Auromedics Pharma LLC.
iv. Unsecured term loans in foreign currency amounting to `339.3 carry interest rate of 3 months LIBOR plus 1.70% and the lastinstallment is payable in May 2013.
v. Deferred sales tax loan is interest free and payable in various installments as per sales tax deferment scheme. The last installment ispayable in 2025-26.
Notes to Consolidated Financial Statements for the year ended March 31, 2013
(All amounts in Indian Rupees million, except share data and where otherwise stated)

As at As atMarch 31, 2013 March 31, 2012
5. DEFERRED TAX LIABILITIES/ASSETS
Deferred tax liabilities (Net) consists of
Differences in depreciation as per tax books and financial books 2,108.8 1,690.0
Provision made towards doubtful trade receivables/loans and advances (127.0) (120.7)
Retirement benefits (117.5) (74.5)
Business loss (496.0) (799.4)
Unabsorbed depreciation (688.3) (657.1)
Others – 0.2
Total deferred tax liabilities (Net) 680.0 38.5
Deferred tax assets (Net) consists of
Business loss – 70.1
Others – (15.8)
Total Deferred tax assets (Net) – 54.3
6. PROVISIONS
Long-term Short-term
As at As at As at As atMarch 31, 2013 March 31, 2012 March 31, 2013 March 31, 2012
For employee benefitsGratuity (Refer Note 33) 90.0 42.4 30.0 25.0
Compensated absences – – 252.6 175.6
90.0 42.4 282.6 200.6
Other provisions
For proposed dividend – – 145.6 291.1
For tax on proposed dividend – – 24.8 47.2
Provision for income tax (Net of advance tax) – – 347.9 124.7
– – 518.3 463.0
TOTAL 90.0 42.4 800.9 663.6
Notes to Consolidated Financial Statements for the year ended March 31, 2013
(All amounts in Indian Rupees million, except share data and where otherwise stated)

Aurobindo Annual Report 2012-13 / 113
As at As atMarch 31, 2013 March 31, 2012
7. SHORT-TERM BORROWINGS
Loans repayble on demand from banks - Working capital loans
Cash credit facilities (secured) 72.4 5.0
Buyers credit (secured) 2,700.1 2,444.1
Buyers credit (unsecured) 1,152.4 878.5
Packing credit loans (secured) 4,737.8 4,341.2
Packing credit loans (unsecured) 6,115.0 7,654.5
Bill discounting facility (secured) 2,733.1 –
Bill discounting facility (Unsecured) 573.2 –
Short-term loans (Secured) 3,191.5 508.8
Short-term loans from banks (Unsecured) 1,085.7 250.0
TOTAL 22,361.2 16,082.1
The above amount includes
Secured borrowings 13,434.9 7,299.1
Unsecured borrowings 8,926.3 8,783.0
22,361.2 16,082.1
Secured loans amounting to `11,718.9 payable on demand and secured short-term loans from banks, are secured by first charge by way of hypothecation of all thestocks, book debts and other current assets (both present and future) and second charge on all the fixed assets of the parent company both present and futuresubject to charges created in favour of term lenders.
Line of credit amounting to `1,705.8 is secured by current assets and non-current assets of Aurolife Pharma LLC, Aurobindo Pharma USA Inc and AuromedicsPharma LLC, excluding intangible assets.
Secured loans amounting to `10.2 is secured through cession over trade receivables of Novagen Pharma (Pty) Limited.
8. TRADE PAYABLES
Trade payables for supplies and services 9,687.4 6,601.4
9. OTHER CURRENT LIABILITIES
Current maturities of long-term borrowings (Refer Note 4) 510.8 5,231.0
Creditors for capital goods 282.3 253.0
Trade deposits 0.1 18.8
Unclaimed dividend 7.8 5.4
Interest accrued but not due on borrowings 116.5 104.8
Advances from customers 171.3 58.5
Other payables
Statutory liabilities 92.9 104.3
Others 327.0 27.6
TOTAL 1,508.7 5,803.4
Notes to Consolidated Financial Statements for the year ended March 31, 2013
(All amounts in Indian Rupees million, except share data and where otherwise stated)

10. FIXED ASSETS - TANGIBLES
Leasehold Freehold Leasehold Freehold Plant & Furniture Vehicles Office Totalland land buildings buildings equipment & fixtures equipment
AT COST OR VALUATION
At April 1, 2011 62.3 508.7 57.1 4,237.2 16,770.5 434.8 121.6 237.0 22,429.2
Additions 0.1 80.6 3.2 1,536.3 3,406.9 146.0 27.7 77.8 5,278.6
Disposals – – – 8.8 43.6 0.8 8.0 0.7 61.9
Transfer to assets held for sale 1.9 1.2 29.6 – 111.0 0.3 – – 144.0
Other adjustments
Exchange differences – (26.5) (0.2) (94.4) (206.2) (8.4) (1.3) (9.1) (346.1)
At March 31, 2012 60.5 614.6 30.9 5,859.1 20,229.0 588.1 142.6 323.2 27,848.0
Additions 0.2 45.3 32.8 1,405.1 4,651.2 168.9 46.6 62.2 6,412.3
Disposals – – – – 153.1 13.9 14.9 13.3 195.2
Other adjustments
Exchange differences – (14.4) (1.4) (81.3) (118.2) (2.8) (2.2) (2.4) (222.7)
At March 31, 2013 60.7 674.3 65.1 7,345.5 24,845.3 745.9 176.5 374.5 34,287.8
DEPRECIATION
At April 1, 2011 5.1 4.7 23.8 590.5 5,482.0 186.8 41.0 70.9 6,404.8
Charge for the year 1.5 3.2 2.5 168.9 1,382.0 58.9 13.3 16.3 1,646.6
Disposals – – – 1.5 34.8 0.6 3.9 0.4 41.2
Transfer to assets held for sale – – 15.8 – 65.4 0.3 – – 81.5
Other adjustments
Exchange differences – (0.8) (0.1) (8.2) (29.4) (4.5) (0.9) (3.3) (47.2)
At March 31, 2012 6.6 8.7 10.6 766.1 6,793.2 249.3 51.3 90.1 7,975.9
Charge for the year 1.5 3.6 3.7 221.5 1,679.4 77.8 19.3 23.1 2,029.9
Disposals – – – – 111.0 11.5 8.5 6.4 137.4
Other adjustments
Exchange differences – (0.6) (0.1) (5.1) (19.2) (1.1) (1.6) (1.2) (28.9)
At March 31, 2013 8.1 12.9 14.4 992.7 8,380.8 316.7 63.7 108.0 9,897.3
Net Block
At March 31, 2012 53.9 605.9 20.3 5,093.0 13,435.8 338.8 91.3 233.1 19,872.1
At March 31, 2013 52.6 661.4 50.7 6,352.8 16,464.5 429.2 112.8 266.5 24,390.5
Capital work-in-progress `1,995.9 (`5,999.6).
1. The title deeds of land and buildings aggregating to `155.8 (March 31, 2012: 148.4) are pending transfer to the Company's name.
2. Capital work-in-progress include expenditure during construction period amounting to `506.9 (March 31, 2012: `1,296.7) (Refer Note 34).
3. An amount of `Nil (March 31, 2012: `4.5) is transferred from capital work-in-progress to assets held for sale.
4. Depreciation for the year include ̀ 2.5 (March 31, 2012: ̀ 4.2) taken as pre-operative capital expenditure on capital projects pending capitalization.
5. Details of finance lease (Refer Note 37).
6. Land to the extent of 100.44 acres amounting to `99.0 (March 31, 2012: Nil ) has been attached by the Directorate of Enforcement in a legalcase pertaining to the parent company.
Notes to Consolidated Financial Statements for the year ended March 31, 2013
(All amounts in Indian Rupees million, except share data and where otherwise stated)

Aurobindo Annual Report 2012-13 / 115
11. FIXED ASSETS - INTANGIBLES
Goodwill Product development cost Licenses and patents Total
GROSS BLOCK
At April 1, 2011 505.6 69.5 1,375.7 1,950.8
Additions – 43.4 961.8 1,005.2
Internal development –
Disposals – 55.6 40.9 96.5
Other adjustments
Exchange differences (35.8) (7.4) (111.8) (155.0)
At March 31, 2012 541.4 64.7 2,408.4 3,014.5
Additions – 108.8 379.6 488.4
Disposals – 70.2 158.1 228.3
Other adjustments
Exchange differences (13.0) (9.5) (49.8) (72.3)
At March 31, 2013 554.4 112.8 2,679.7 3,346.9
Amortization
At April 1, 2011 – 41.4 547.8 589.2
Charge for the year – 17.5 345.4 362.9
Disposals – 17.9 31.7 49.6
Other adjustments
Exchange differences – (2.7) (34.9) (37.6)
At March 31, 2012 – 43.7 896.4 940.1
Charge for the year – 39.3 420.7 460.0
Disposals – – 64.2 64.2
Other adjustments
Exchange differences – 2.5 (15.3) (12.8)
At March 31, 2013 – 80.5 1,268.2 1,348.7
Net Block
At March 31, 2012 541.4 21.0 1,512.0 2,074.4
At March 31, 2013 554.4 32.3 1,411.5 1,998.2
Intangibles under development `189.2 (`454.5).
Notes to Consolidated Financial Statements for the year ended March 31, 2013
(All amounts in Indian Rupees million, except share data and where otherwise stated)

As at As atMarch 31, 2013 March 31, 2012
12. NON-CURRENT INVESTMENTS
Trade investments
Long-term, unquoted, in fully paid equity shares
(at cost unless stated otherwise)
i. 753 (753) equity shares of Jeedimetla
Effluent Treatment Limited of `100 each 0.1 0.1
ii. 103,709 (103,709) equity shares of Patancheru
Envirotech Limited of `10 each 1.0 1.0
iii. 1,000 (1,000) equity shares of Progressive Effluent
Treatment Limited of `100 each 0.1 0.1
iv. 2,376,000 (Nil) equity shares of Silicon Life Sciences Limited of `10 23.8 –
v. 10% (10%) of Paid-in-Capital of Aurobindo (Datong)
Bio-Pharma Company Limited, China (Refer Note 17 for current portion) 196.2 196.2
TOTAL (A) 221.2 197.4
Non-trade investments
Long-term, unquoted and at cost, in government securities
i. Kisan Vikas Patra 1.0 1.0
ii. National Savings Certificate [includes `0.1 held by income tax 0.2 0.2
authorities (March 31, 2012: `0.1)]
TOTAL (B) 1.2 1.2
TOTAL (A+B) 222.4 198.6
Notes:
1. Aggregate value of unquoted investments 222.4 198.6
2. Aggregate provision for diminution in the value of investments – –
Notes to Consolidated Financial Statements for the year ended March 31, 2013
(All amounts in Indian Rupees million, except share data and where otherwise stated)

Aurobindo Annual Report 2012-13 / 117
Non-current CurrentAs at As at As at As at
March 31, 2013 March 31, 2012 March 31, 2013 March 31, 2012
13. LOANS AND ADVANCES
(Unsecured, considered good except stated otherwise)
Capital advances
Considered good 187.5 54.8 – –
Doubtful 0.8 0.8 – –
188.3 55.6 – –
Provision for doubtful advances 0.8 0.8
TOTAL (A) 187.5 54.8 – –
Trade deposit
Considered good 281.5 211.7 9.3 10.7
Doubtful 0.4 0.4 – –
281.9 212.1 9.3 10.7
Provision for doubtful deposit 0.4 0.4 – –
TOTAL (B) 281.5 211.7 9.3 10.7
Advances recoverable in cash or kind
Considered good 84.3 94.4 859.8 1,074.1
Doubtful 35.1 35.1 – –
119.4 129.5 859.8 1,074.1
Provision for doubtful advances 35.1 35.1 – –
TOTAL (C) 84.3 94.4 859.8 1,074.1
Other loans and advances
Advance income tax (Net of provision for taxation) 420.6 389.0 79.9 93.1
MAT credit entitlement 1,265.0 – – –
Share application money to others – 20.5 – –
Loans to others – – 70.3 187.6
Loans to employees 30.2 29.1 66.2 57.2
Export rebate claims receivable – – 1,245.7 981.8
Balances with statutory/government authorities 159.0 281.7 989.6 744.0
TOTAL (D) 1,874.8 720.3 2,451.7 2,063.7
TOTAL (A+B+C+D) 2,428.1 1,081.2 3,320.8 3,148.5
Refer Note 40 for advances due from private companies or partnership firms in which parent company's Director is a director or partner.
Notes to Consolidated Financial Statements for the year ended March 31, 2013
(All amounts in Indian Rupees million, except share data and where otherwise stated)

Non-current CurrentAs at As at As at As at
March 31, 2013 March 31, 2012 March 31, 2013 March 31, 2012
14. TRADE RECEIVABLES(Unsecured, considered good unless stated otherwise)
Outstanding for a period exceeding six months from the
date they are due for payment
Considered good – – 801.1 435.0
Doubtful 14.6 238.8 259.2 53.6
14.6 238.8 1,060.3 488.6
Provision for doubtful receivables 14.6 238.8 259.2 53.6
TOTAL (A) – – 801.1 435.0
Others
Considered good – – 15,168.7 11,964.6
Doubtful – – 2.4 –
– – 15,171.1 11,964.6
Provision for doubtful receivables – – 2.4 –
TOTAL (B) – – 15,168.7 11,964.6
TOTAL (A+B) – – 15,969.8 12,399.6
Refer Note 41 for trade receivables due from private companies or partnership firms in which parent company's Director is a director or partner.
As at As atMarch 31, 2013 March 31, 2012
15. OTHER CURRENT ASSETS
(Unsecured, considered good unless stated otherwise)
Unamortized permium on forward contract – 29.6
Insurance claim receivable 38.3 127.3
Export incentives receivable 608.0 486.1
Assets held for sale 64.3 67.0
Interest accrued on deposits 21.8 10.8
Interest accrued on investments 0.6 0.6
Receivables - Others 23.1 19.9
TOTAL 756.1 741.3
16. OTHER NON-CURRENT ASSETS
(Unsecured, considered good unless stated otherwise)
Export incentives receivable 154.6 –
Non-current bank balances (Refer Note 19) 32.0 1.2
TOTAL 186.6 1.2
Notes to Consolidated Financial Statements for the year ended March 31, 2013
(All amounts in Indian Rupees million, except share data and where otherwise stated)

Aurobindo Annual Report 2012-13 / 119
As at As atMarch 31, 2013 March 31, 2012
17. CURRENT INVESTMENTSCurrent portion of long-term investment (at cost)Nil (9.5%) of Paid-in-Capital of Aurobindo (Datong) Bio-Pharma Company Limited, China
(unquoted, in fully paid equity shares) – 186.4
Unquoted, in fully paid equity shares, at lower of cost and market value70,000 (70,000) shares of Citadel Aurobindo Biotech Limited of `100 each – –
[Aggregate provision for diminution in value of `7.0 (March 31, 2012: `7.0)]
Quoted, in fully paid equity shares, at lower of cost and market value4,520 (4,520) equity shares of Andhra Bank of `10 each 0.4 0.4
TOTAL 0.4 186.8
1. Aggregate value of unquoted investments – 186.4
2. Aggregate value of quoted investments 0.4 0.4
3. Market value of quoted investments 0.4 0.6
4. Aggregate provision for diminution in the value of investments 7.0 7.0
18. INVENTORIES(Valued at lower of cost and net realizable value)
Raw materials (includes in transit `316.1 (March 31, 2012: `453.5) 7,297.2 6,084.5
Packing materials 808.5 905.4
Work-in-progress (Refer Note 23) 5,072.2 4,472.1
Finished goods (includes in transit `65.4 (March 31,2012 `186.4) (Refer Note 23) 5,138.8 3,277.9
Trading goods (Refer Note 23) 185.6 124.1
Stores, spares and consumables 733.6 591.6TOTAL 19,235.9 15,455.6
Non-current Current
As at As at As at As atMarch 31, 2013 March 31, 2012 March 31, 2013 March 31, 2012
19. CASH AND BANK BALANCESCash and cash equivalentsBalances with banks:
On current accounts – – 1,928.0 543.5On cash credit accounts – – 82.3 99.2On unpaid dividend account – – 7.8 5.4
Cash on hand – – 9.2 8.3– – 2,027.3 656.4
Other bank balancesDeposits with original maturity for more than 12 months – – 4.4 2.8Deposits with original maturity for more than 3 monthsbut less than 12 months – – 35.6 33.3Margin money deposit* 32.0 1.2 17.2 16.1
32.0 1.2 57.2 52.2Amount disclosed under non–current assets (Refer Note 16) (32.0) (1.2) – –
TOTAL – – 2,084.5 708.6
* Given against bank guarantees and performance guarantees. Margin money deposits include deposits of the parent company attached byEnforcement Directorate of `30.0 (March 31, 2012: Nil).
Notes to Consolidated Financial Statements for the year ended March 31, 2013
(All amounts in Indian Rupees million, except share data and where otherwise stated)

Year ended Year endedMarch 31, 2013 March 31, 2012
20. REVENUE FROM OPERATIONS (GROSS)Sale of products 58,433.7 45,855.0Sale of services 852.7 626.2Other operating revenue
Scrap sales 36.5 46.1Export incentives 685.4 722.3TOTAL 60,008.3 47,249.6
Details of servicesDossier income 759.8 598.6Service income 92.9 27.6TOTAL 852.7 626.2
21. OTHER INCOMEInterest income on
Bank deposits 4.2 37.4Others advances and deposits 25.0 19.2
Dividend income on current investments - trade – –Provision no longer required on doubtful debts written back 15.0 –Balances no longer required written back 11.3 15.0Profit on sale of investment 46.8 –Commission income 22.0 15.9Miscellaneous income 161.1 159.5
TOTAL 285.4 247.0
22. COST OF MATERIALS CONSUMEDRaw material consumed
Opening stock 6,084.5 5,705.3Add: Purchases 29,492.8 22,515.6
35,577.3 28,220.9Less: Closing stock 7,297.2 6,084.5
Cost of raw material consumed 28,280.1 22,136.4Adjustment for fluctuation in exchange rates 22.4 (18.5)Packing materials consumed 2,611.9 2,125.9
TOTAL 30,914.4 24,243.8
23. INCREASE IN WORK-IN-PROGRESS, TRADED AND FINISHED GOODSInventories at the beginning of the year
Traded goods 124.1 57.0 (61.5)Work-in-progress 4,472.1 4,488.9 (600.1)Finished goods 3,277.9 3,055.7 (1,860.9)
7,874.1 7,601.6 (2,522.5)Inventories at the end of the year March 31, 2012
Traded goods 185.6 124.1 (67.1)Work-in-progress 5,072.2 4,472.1 (16.8)Finished goods 5,138.8 3,277.9 (222.2)
10,396.6 7,874.1 (272.5) (2,522.5) (272.5)
On account of stock written off 325.6 180.4Adjustment for fluctuation in exchange rates (145.6) (392.3)
TOTAL (2,702.5) (60.6)
Notes to Consolidated Financial Statements for the year ended March 31, 2013
(All amounts in Indian Rupees million, except share data and where otherwise stated)
Year ended Year ended IncreaseMarch 31, 2013 March 31, 2012 March 31, 2013

Aurobindo Annual Report 2012-13 / 121
Year ended Year endedMarch 31, 2013 March 31, 2012
24. EMPLOYEE BENEFIT EXPENSESSalaries, wages and bonus 5,880.7 4,801.6Contribution to provident and other funds 237.6 206.4Retirement benefits (Refer Note 33) 190.4 115.8Staff welfare expenses 324.4 233.1
TOTAL 6,633.1 5,356.9
25. OTHER EXPENSESConversion charges 331.4 233.1Consumption of stores and spares 664.6 672.2Chemicals consumed 823.5 818.2Power and fuel 3,247.2 2,323.6Carriage inward 433.6 350.5Factory maintenance 156.7 157.9Effluent treatment expenses 55.3 41.1Decrease/(Increase) of excise duty on inventory (Refer Note 39) 4.2 (31.8)Repairs and maintenance
i. Plant and machinery 452.7 379.4ii. Buildings 182.7 169.4iii. Others 71.1 58.4
Rent 84.2 84.4Rates and taxes 121.6 109.6Printing and stationery 98.1 107.1Postage and telephones 79.6 57.7Insurance 229.7 172.3Legal and professional charges 507.7 469.0Directors' sitting fees 0.7 0.9Remuneration to auditors 7.6 7.3Sales commission 298.1 237.2Carriage outwards 1,752.2 1,348.9Selling expenses 880.4 372.9Rebates and discounts 129.1 123.0Travelling and conveyance 200.4 166.4Vehicle maintenance expenses 41.2 31.7Analytical charges 365.8 343.9Bad debts/advances written off 246.4 34.1Provision for trade receivables (Net) – 28.8Donations 3.2 4.6Registration, license and filing charges 600.2 105.7Foreign exchange loss (Net) 281.2 488.2Product development expenses 57.6 49.9Safety and security 12.3 8.9Product destruction expenses/Stock written off 357.4 211.8Software license and implementation expenses 15.7 18.1Loss on sale/writeoff of fixed assets (Net) 164.6 36.4Miscellaneous expenses 444.9 315.7
TOTAL 13,402.9 10,106.5
Notes to Consolidated Financial Statements for the year ended March 31, 2013
(All amounts in Indian Rupees million, except share data and where otherwise stated)

Year ended Year endedMarch 31, 2013 March 31, 2012
26. DEPRECIATION/AMORTIZATION
Depreciation of tangible assets 2,027.4 1,642.4
Amortization of intangible assets 460.0 362.9
TOTAL 2,487.4 2,005.3
27. FINANCE COSTS
Interest 1,132.3 813.2
Bank charges 180.9 214.5
Exchange difference to the extent considered as an adjustment to borrowing costs 1,353.2 1,744.7
TOTAL 2,666.4 2,772.4
28. EXCEPTIONAL ITEMS
Redemption premium (Yield to Maturity) on redemption of FCCB Bonds (Refer Note i) – 3,198.6
Loss on sale/closure of subsidiaries and joint ventures (Refer Note ii) – 13.2
TOTAL – 3,211.8
Note:
i. The outstanding Tranche A and Tranche B Zero Coupon Foreign Currency Convertible Bonds ('FCCB' or 'Bonds') of USD 139.2 Million,issued in May 2006, were repaid in entirety on maturity in the previous year along with the redemption premium (Yield to Maturity)amounting to `3,198.6, inclusive of withholding taxes.
ii. During the previous year, the Group has disposed of its subsidiary Aurobindo Pharma (Bulgaria) EAD and Aurosal Pharmaceuticals,LLC, U.S.A. a 50% joint venture entity.
29. Capital and other commitments
Estimated amount of contracts (Net of advances) remaining to be executed on capital account and not provided for - `299.6(March 31, 2012: `483.6).
30. Contingent liabilities
As at As atMarch 31, 2013 March 31, 2012
Outstanding bank guarantees 486.3 397.4
Claims arising from disputes not acknowledged as debts - indirect taxes
(excise duty and service tax)* 196.3 140.7
Claims arising from disputes not acknowledged as debts - direct taxes* 105.0 105.0
Claims against the Group not acknowledged as debts* 493.1 23.7
* in respect of above matters, future cash outfows in respect of contingent liabilities are determinable only on receipt of judgementspending at various forums/authorities.
Notes to Consolidated Financial Statements for the year ended March 31, 2013
(All amounts in Indian Rupees million, except share data and where otherwise stated)
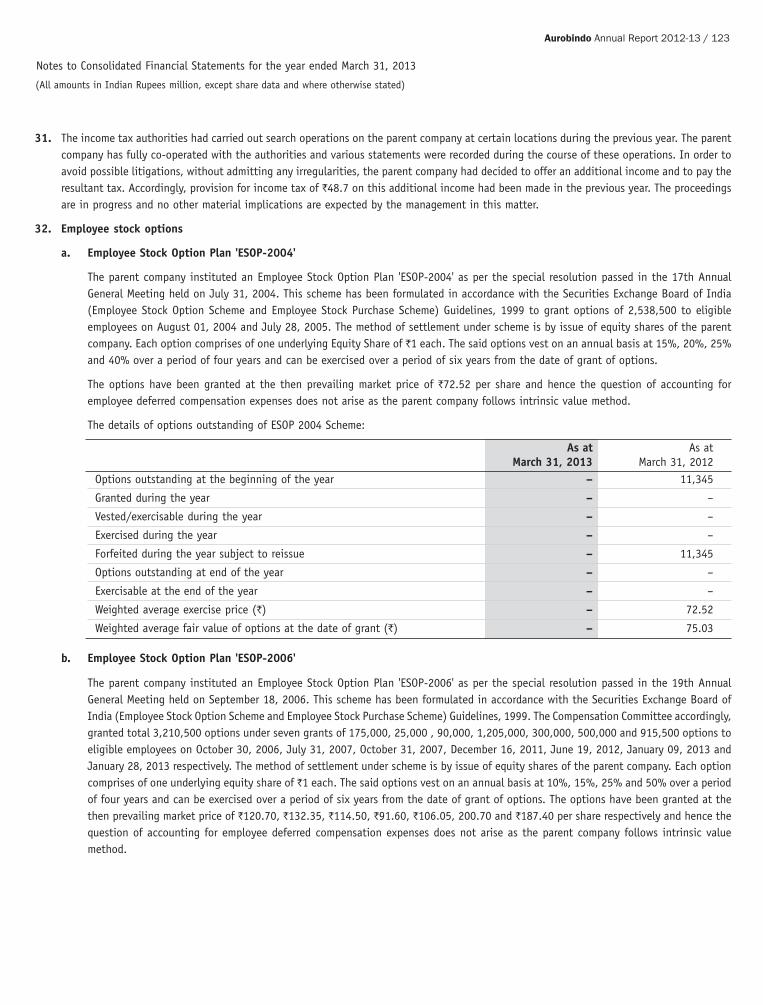
Aurobindo Annual Report 2012-13 / 123
31. The income tax authorities had carried out search operations on the parent company at certain locations during the previous year. The parentcompany has fully co-operated with the authorities and various statements were recorded during the course of these operations. In order toavoid possible litigations, without admitting any irregularities, the parent company had decided to offer an additional income and to pay theresultant tax. Accordingly, provision for income tax of `48.7 on this additional income had been made in the previous year. The proceedingsare in progress and no other material implications are expected by the management in this matter.
32. Employee stock options
a. Employee Stock Option Plan 'ESOP-2004'
The parent company instituted an Employee Stock Option Plan 'ESOP-2004' as per the special resolution passed in the 17th AnnualGeneral Meeting held on July 31, 2004. This scheme has been formulated in accordance with the Securities Exchange Board of India(Employee Stock Option Scheme and Employee Stock Purchase Scheme) Guidelines, 1999 to grant options of 2,538,500 to eligibleemployees on August 01, 2004 and July 28, 2005. The method of settlement under scheme is by issue of equity shares of the parentcompany. Each option comprises of one underlying Equity Share of `1 each. The said options vest on an annual basis at 15%, 20%, 25%and 40% over a period of four years and can be exercised over a period of six years from the date of grant of options.
The options have been granted at the then prevailing market price of `72.52 per share and hence the question of accounting foremployee deferred compensation expenses does not arise as the parent company follows intrinsic value method.
The details of options outstanding of ESOP 2004 Scheme:
As at As atMarch 31, 2013 March 31, 2012
Options outstanding at the beginning of the year – 11,345
Granted during the year – –
Vested/exercisable during the year – –
Exercised during the year – –
Forfeited during the year subject to reissue – 11,345
Options outstanding at end of the year – –
Exercisable at the end of the year – –
Weighted average exercise price (`) – 72.52
Weighted average fair value of options at the date of grant (`) – 75.03
b. Employee Stock Option Plan 'ESOP-2006'
The parent company instituted an Employee Stock Option Plan 'ESOP-2006' as per the special resolution passed in the 19th AnnualGeneral Meeting held on September 18, 2006. This scheme has been formulated in accordance with the Securities Exchange Board ofIndia (Employee Stock Option Scheme and Employee Stock Purchase Scheme) Guidelines, 1999. The Compensation Committee accordingly,granted total 3,210,500 options under seven grants of 175,000, 25,000 , 90,000, 1,205,000, 300,000, 500,000 and 915,500 options toeligible employees on October 30, 2006, July 31, 2007, October 31, 2007, December 16, 2011, June 19, 2012, January 09, 2013 andJanuary 28, 2013 respectively. The method of settlement under scheme is by issue of equity shares of the parent company. Each optioncomprises of one underlying equity share of `1 each. The said options vest on an annual basis at 10%, 15%, 25% and 50% over a periodof four years and can be exercised over a period of six years from the date of grant of options. The options have been granted at thethen prevailing market price of `120.70, `132.35, `114.50, `91.60, `106.05, 200.70 and `187.40 per share respectively and hence thequestion of accounting for employee deferred compensation expenses does not arise as the parent company follows intrinsic valuemethod.
Notes to Consolidated Financial Statements for the year ended March 31, 2013
(All amounts in Indian Rupees million, except share data and where otherwise stated)
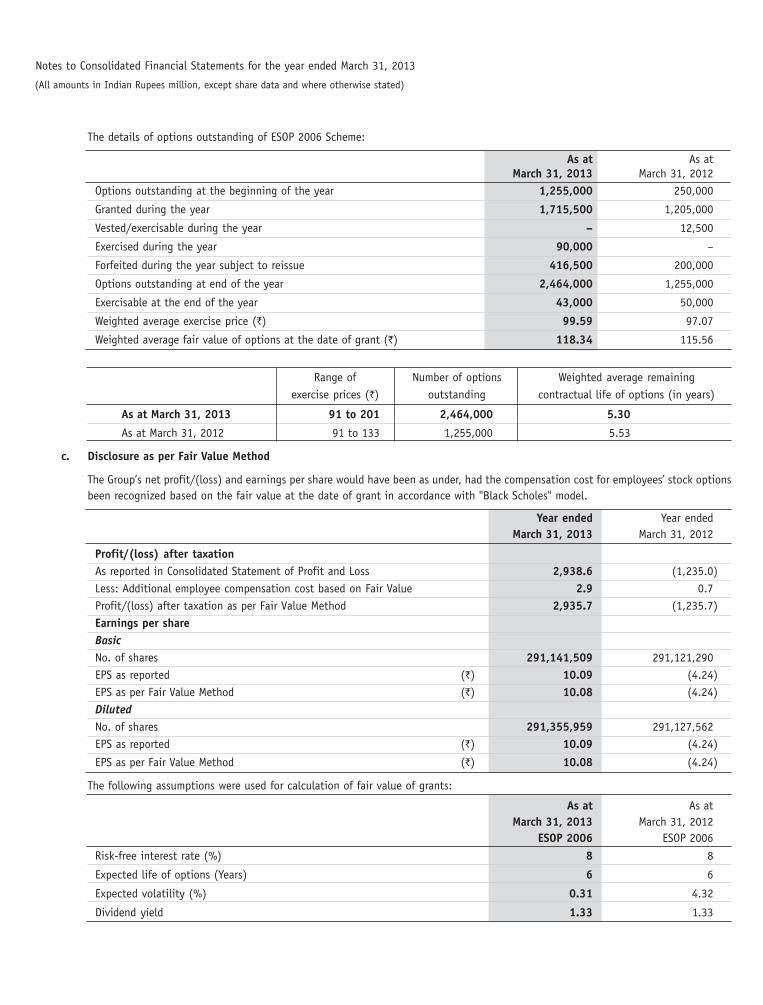
The details of options outstanding of ESOP 2006 Scheme:
As at As atMarch 31, 2013 March 31, 2012
Options outstanding at the beginning of the year 1,255,000 250,000
Granted during the year 1,715,500 1,205,000
Vested/exercisable during the year – 12,500
Exercised during the year 90,000 –
Forfeited during the year subject to reissue 416,500 200,000
Options outstanding at end of the year 2,464,000 1,255,000
Exercisable at the end of the year 43,000 50,000
Weighted average exercise price (`) 99.59 97.07
Weighted average fair value of options at the date of grant (`) 118.34 115.56
Range of Number of options Weighted average remainingexercise prices (`) outstanding contractual life of options (in years)
As at March 31, 2013 91 to 201 2,464,000 5.30
As at March 31, 2012 91 to 133 1,255,000 5.53
c. Disclosure as per Fair Value Method
The Group’s net profit/(loss) and earnings per share would have been as under, had the compensation cost for employees’ stock optionsbeen recognized based on the fair value at the date of grant in accordance with ''Black Scholes'' model.
Year ended Year endedMarch 31, 2013 March 31, 2012
Profit/(loss) after taxationAs reported in Consolidated Statement of Profit and Loss 2,938.6 (1,235.0)Less: Additional employee compensation cost based on Fair Value 2.9 0.7Profit/(loss) after taxation as per Fair Value Method 2,935.7 (1,235.7)Earnings per shareBasicNo. of shares 291,141,509 291,121,290EPS as reported (`) 10.09 (4.24)EPS as per Fair Value Method (`) 10.08 (4.24)DilutedNo. of shares 291,355,959 291,127,562EPS as reported (`) 10.09 (4.24)
EPS as per Fair Value Method (`) 10.08 (4.24)
The following assumptions were used for calculation of fair value of grants:
As at As atMarch 31, 2013 March 31, 2012
ESOP 2006 ESOP 2006
Risk-free interest rate (%) 8 8
Expected life of options (Years) 6 6
Expected volatility (%) 0.31 4.32
Dividend yield 1.33 1.33
Notes to Consolidated Financial Statements for the year ended March 31, 2013
(All amounts in Indian Rupees million, except share data and where otherwise stated)
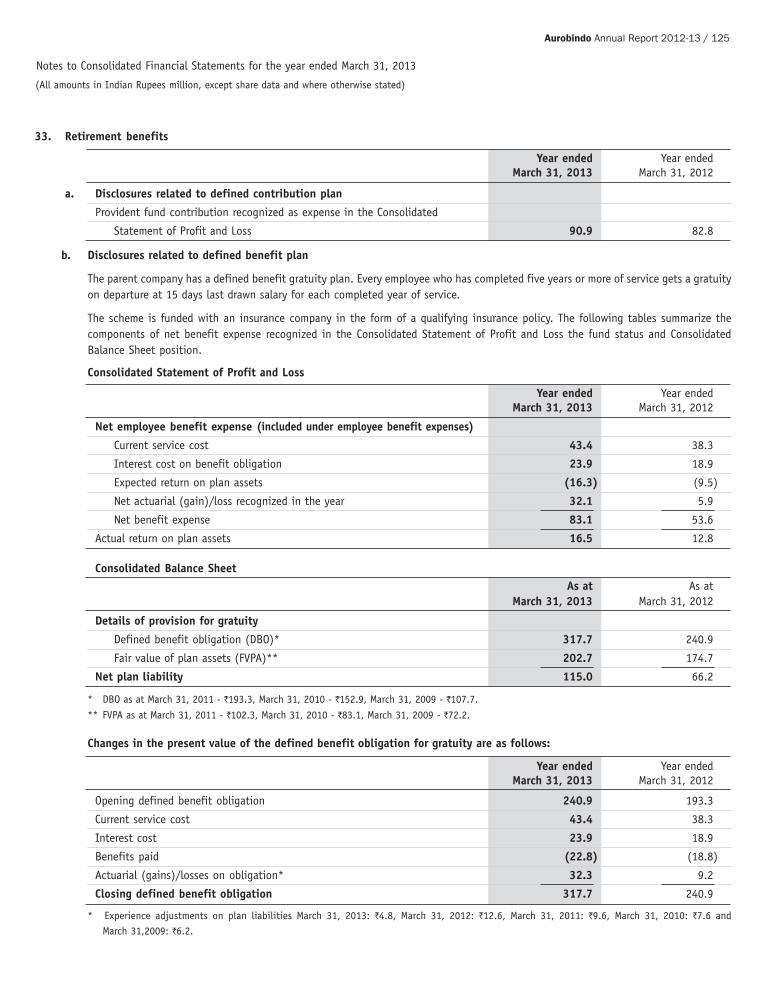
Aurobindo Annual Report 2012-13 / 125
33. Retirement benefits
Year ended Year endedMarch 31, 2013 March 31, 2012
a. Disclosures related to defined contribution plan
Provident fund contribution recognized as expense in the Consolidated
Statement of Profit and Loss 90.9 82.8
b. Disclosures related to defined benefit plan
The parent company has a defined benefit gratuity plan. Every employee who has completed five years or more of service gets a gratuityon departure at 15 days last drawn salary for each completed year of service.
The scheme is funded with an insurance company in the form of a qualifying insurance policy. The following tables summarize thecomponents of net benefit expense recognized in the Consolidated Statement of Profit and Loss the fund status and ConsolidatedBalance Sheet position.
Consolidated Statement of Profit and Loss
Year ended Year endedMarch 31, 2013 March 31, 2012
Net employee benefit expense (included under employee benefit expenses)
Current service cost 43.4 38.3
Interest cost on benefit obligation 23.9 18.9
Expected return on plan assets (16.3) (9.5)
Net actuarial (gain)/loss recognized in the year 32.1 5.9
Net benefit expense 83.1 53.6
Actual return on plan assets 16.5 12.8
Consolidated Balance SheetAs at As at
March 31, 2013 March 31, 2012
Details of provision for gratuity
Defined benefit obligation (DBO)* 317.7 240.9
Fair value of plan assets (FVPA)** 202.7 174.7
Net plan liability 115.0 66.2
* DBO as at March 31, 2011 - `193.3, March 31, 2010 - `152.9, March 31, 2009 - `107.7.
** FVPA as at March 31, 2011 - `102.3, March 31, 2010 - `83.1, March 31, 2009 - `72.2.
Changes in the present value of the defined benefit obligation for gratuity are as follows:
Year ended Year endedMarch 31, 2013 March 31, 2012
Opening defined benefit obligation 240.9 193.3
Current service cost 43.4 38.3
Interest cost 23.9 18.9
Benefits paid (22.8) (18.8)
Actuarial (gains)/losses on obligation* 32.3 9.2
Closing defined benefit obligation 317.7 240.9
* Experience adjustments on plan liabilities March 31, 2013: `4.8, March 31, 2012: `12.6, March 31, 2011: `9.6, March 31, 2010: `7.6 andMarch 31,2009: `6.2.
Notes to Consolidated Financial Statements for the year ended March 31, 2013
(All amounts in Indian Rupees million, except share data and where otherwise stated)
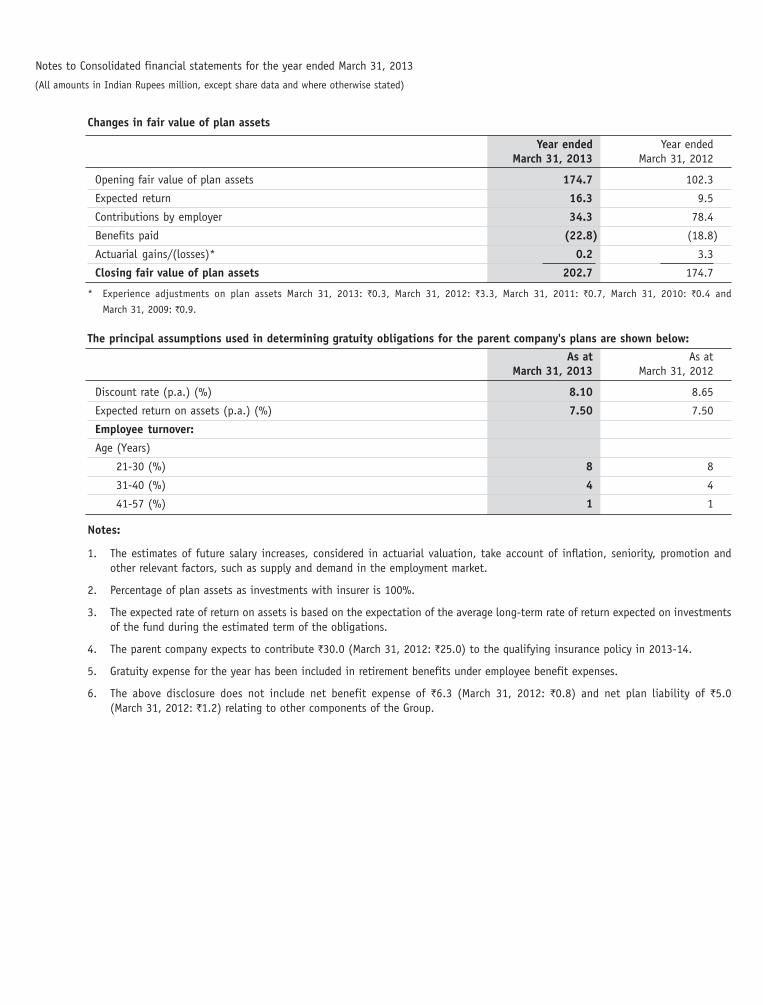
Changes in fair value of plan assets
Year ended Year endedMarch 31, 2013 March 31, 2012
Opening fair value of plan assets 174.7 102.3
Expected return 16.3 9.5
Contributions by employer 34.3 78.4
Benefits paid (22.8) (18.8)
Actuarial gains/(losses)* 0.2 3.3
Closing fair value of plan assets 202.7 174.7
* Experience adjustments on plan assets March 31, 2013: `0.3, March 31, 2012: `3.3, March 31, 2011: `0.7, March 31, 2010: `0.4 and
March 31, 2009: `0.9.
The principal assumptions used in determining gratuity obligations for the parent company's plans are shown below:As at As at
March 31, 2013 March 31, 2012
Discount rate (p.a.) (%) 8.10 8.65
Expected return on assets (p.a.) (%) 7.50 7.50
Employee turnover:
Age (Years)
21-30 (%) 8 8
31-40 (%) 4 4
41-57 (%) 1 1
Notes:
1. The estimates of future salary increases, considered in actuarial valuation, take account of inflation, seniority, promotion andother relevant factors, such as supply and demand in the employment market.
2. Percentage of plan assets as investments with insurer is 100%.
3. The expected rate of return on assets is based on the expectation of the average long-term rate of return expected on investmentsof the fund during the estimated term of the obligations.
4. The parent company expects to contribute `30.0 (March 31, 2012: `25.0) to the qualifying insurance policy in 2013-14.
5. Gratuity expense for the year has been included in retirement benefits under employee benefit expenses.
6. The above disclosure does not include net benefit expense of `6.3 (March 31, 2012: `0.8) and net plan liability of `5.0(March 31, 2012: `1.2) relating to other components of the Group.
Notes to Consolidated financial statements for the year ended March 31, 2013
(All amounts in Indian Rupees million, except share data and where otherwise stated)
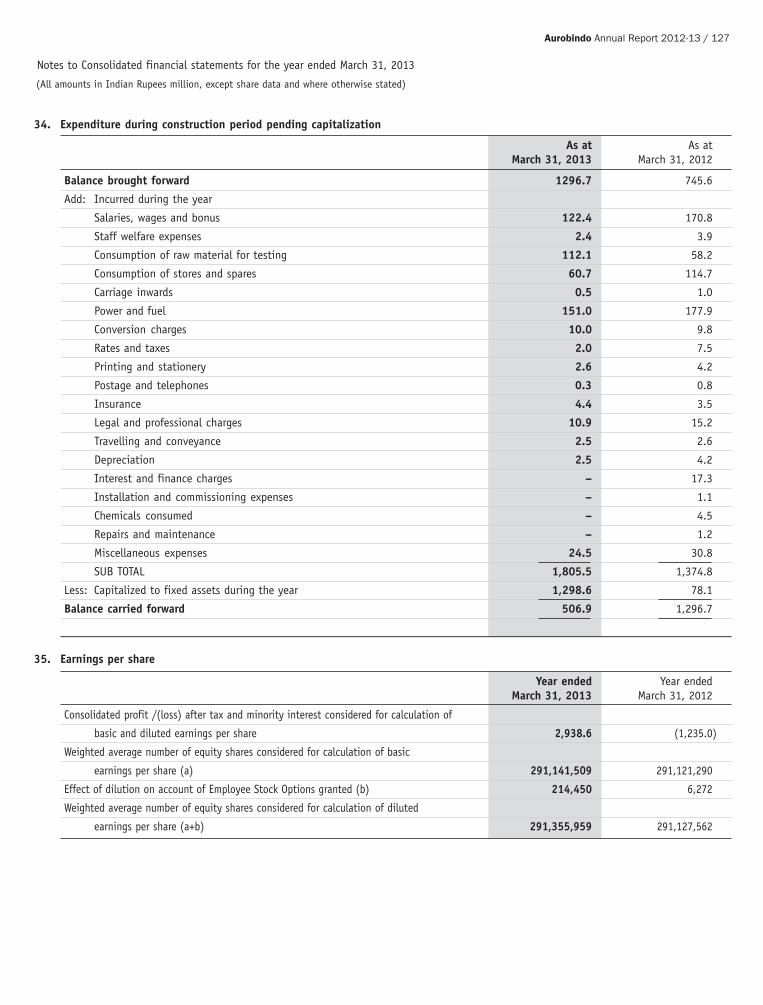
Aurobindo Annual Report 2012-13 / 127
34. Expenditure during construction period pending capitalization
As at As atMarch 31, 2013 March 31, 2012
Balance brought forward 1296.7 745.6
Add: Incurred during the year
Salaries, wages and bonus 122.4 170.8
Staff welfare expenses 2.4 3.9
Consumption of raw material for testing 112.1 58.2
Consumption of stores and spares 60.7 114.7
Carriage inwards 0.5 1.0
Power and fuel 151.0 177.9
Conversion charges 10.0 9.8
Rates and taxes 2.0 7.5
Printing and stationery 2.6 4.2
Postage and telephones 0.3 0.8
Insurance 4.4 3.5
Legal and professional charges 10.9 15.2
Travelling and conveyance 2.5 2.6
Depreciation 2.5 4.2
Interest and finance charges – 17.3
Installation and commissioning expenses – 1.1
Chemicals consumed – 4.5
Repairs and maintenance – 1.2
Miscellaneous expenses 24.5 30.8
SUB TOTAL 1,805.5 1,374.8
Less: Capitalized to fixed assets during the year 1,298.6 78.1
Balance carried forward 506.9 1,296.7
35. Earnings per share
Year ended Year endedMarch 31, 2013 March 31, 2012
Consolidated profit /(loss) after tax and minority interest considered for calculation of
basic and diluted earnings per share 2,938.6 (1,235.0)
Weighted average number of equity shares considered for calculation of basic
earnings per share (a) 291,141,509 291,121,290
Effect of dilution on account of Employee Stock Options granted (b) 214,450 6,272
Weighted average number of equity shares considered for calculation of diluted
earnings per share (a+b) 291,355,959 291,127,562
Notes to Consolidated financial statements for the year ended March 31, 2013
(All amounts in Indian Rupees million, except share data and where otherwise stated)

36. Related party disclosures
i. Names of related parties and description of relationship
a. Jointly controlled enterprises
Novagen Pharma (Pty) Limited, South Africa (Joint venture of a subsidiary)
Zao Auros Pharma, Russia (Joint venture of a subsidiary) - w.e.f. July 26, 2011 (Closed during the current year)
b. Enterprises over which key management personnel or relatives exercise significant influence
Pravesha Industries Private Limited, India
Sri Sai Packaging, India (Partnership firm)
Trident Chemphar Limited, India
Auropro Soft Systems Private Limited, India
Axis Clinicals Limited, India
Pranit Projects Private Limited, India
Pranit Packaging Private Limited, India
Matri Mirra Packaging Private Limited, India
Vaxer Pharma Limited, India
Veritaz Healthcare Limited, India
Silicon Life Sciences Private Limited, India
Orem Access Bio Inc, India
ABS Mercantile Private Limited, India
c. Key managerial personnel
Mr. P.V. Ramprasad Reddy, Chairman (Resigned as Chairman w.e.f. June 01, 2012 and retired as Whole-time Director w.e.f.December 1, 2012)
Mr. K. Nithyananda Reddy, Whole-time Director
Dr. M. Sivakumaran, Whole-time Director
Mr. M. Madan Mohan Reddy, Whole-time Director
Mr. N. Govindarajan, Managing Director
Mr. Ravindra Shenoy, Joint Managing Director (Resigned w.e.f. November 9, 2012)
d. Relative to key managerial personnel
Mr. P. Sarath Chandra Reddy (Son of Mr. P.V. Ramprasad Reddy, Director)
Mrs. Kambam Kirthi Reddy (Daughter of Mr. K. Nithyananda Reddy, Whole-time Director)
Mr. Vishnu M. Sriram (Son-in-law of Dr. M. Sivakumaran, Whole-time Director)
ii. Transactions with related parties
a. Transactions with enterprises over which key management personnel or their relatives exercise significant influence
Particulars Year ended Year endedMarch 31, 2013 March 31, 2012
Pravesha Industries Private Limited, India
Sale of goods 0.4 6.3
Purchase of goods 1,079.6 1,103.2
Purchase of fixed assets – 0.3
Sale of fixed assets 8.9 –
Rent received 0.6 0.1
Balance receivable 9.1 25.2
Balance payable 14.5 23.9
Notes to Consolidated financial statements for the year ended March 31, 2013
(All amounts in Indian Rupees million, except share data and where otherwise stated)

Aurobindo Annual Report 2012-13 / 129
Particulars Year ended Year endedMarch 31, 2013 March 31, 2012
Sri Sai Packaging, IndiaSale of goods 0.3 0.2
Sale of fixed assets 0.2 –
Purchase of goods 122.1 103.1
Balance receivable – 2.1
Axis Clinicals Limited, IndiaPurchase of services 337.0 334.5
Electricity expenses 0.9 5.8
Rent expenses 2.6 12.1
Purchase of fixed assets 0.6 5.9
Balance payable 50.0 47.1
Trident Chemphar Limited, IndiaSale of goods 218.5 336.3
Purchase of goods 299.3 36.3
Balance receivable 116.5 273.5
Balance payable 62.5 8.1
Auropro Soft Systems Private Limited, IndiaPurchase of stores and spares 3.2 2.4
Purchase of services 16.8 15.1
Purchase of fixed assets – 12.8
Balance receivable – –
Balance payable – 0.1
Pranit Packaging Private Limited, IndiaPurchase of goods 75.4 53.0
Sale of goods – –
Sale of fixed assets 1.1 –
Balance receivable 1.1 –
Balance payable – 1.4
Pranit Projects Private Limited, IndiaPurchase of services (Civil services) 22.7 58.9
Balance payable 2.5 4.0
Matri Mirra Packaging Private Limited, IndiaPurchase of goods 127.5 50.0
Sale of goods 19.5 0.9
Balance receivable – 3.6
Vaxer Pharma Limited, IndiaSale of goods 18.8 –
Balance receivable 6.8 –
Veritaz Healthcare Limited, IndiaSale of goods 4.9 –
Silicon Life Sciences Private Limited, IndiaPurchase of goods 26.6 –
Sale of goods 0.7 –
Share application given pending allotment (Closing balance) – –
Notes to Consolidated financial statements for the year ended March 31, 2013
(All amounts in Indian Rupees million, except share data and where otherwise stated)
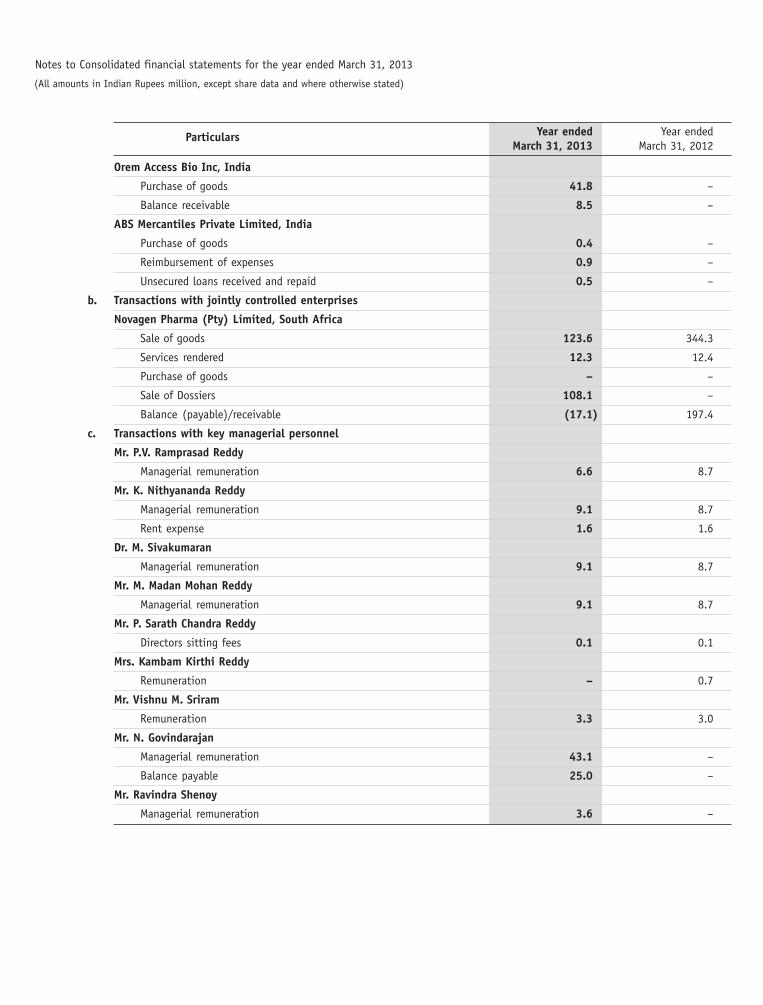
Particulars Year ended Year endedMarch 31, 2013 March 31, 2012
Orem Access Bio Inc, India
Purchase of goods 41.8 –
Balance receivable 8.5 –
ABS Mercantiles Private Limited, India
Purchase of goods 0.4 –
Reimbursement of expenses 0.9 –
Unsecured loans received and repaid 0.5 –
b. Transactions with jointly controlled enterprises
Novagen Pharma (Pty) Limited, South Africa
Sale of goods 123.6 344.3
Services rendered 12.3 12.4
Purchase of goods – –
Sale of Dossiers 108.1 –
Balance (payable)/receivable (17.1) 197.4
c. Transactions with key managerial personnel
Mr. P.V. Ramprasad Reddy
Managerial remuneration 6.6 8.7
Mr. K. Nithyananda Reddy
Managerial remuneration 9.1 8.7
Rent expense 1.6 1.6
Dr. M. Sivakumaran
Managerial remuneration 9.1 8.7
Mr. M. Madan Mohan Reddy
Managerial remuneration 9.1 8.7
Mr. P. Sarath Chandra Reddy
Directors sitting fees 0.1 0.1
Mrs. Kambam Kirthi Reddy
Remuneration – 0.7
Mr. Vishnu M. Sriram
Remuneration 3.3 3.0
Mr. N. Govindarajan
Managerial remuneration 43.1 –
Balance payable 25.0 –
Mr. Ravindra Shenoy
Managerial remuneration 3.6 –
Notes to Consolidated financial statements for the year ended March 31, 2013
(All amounts in Indian Rupees million, except share data and where otherwise stated)
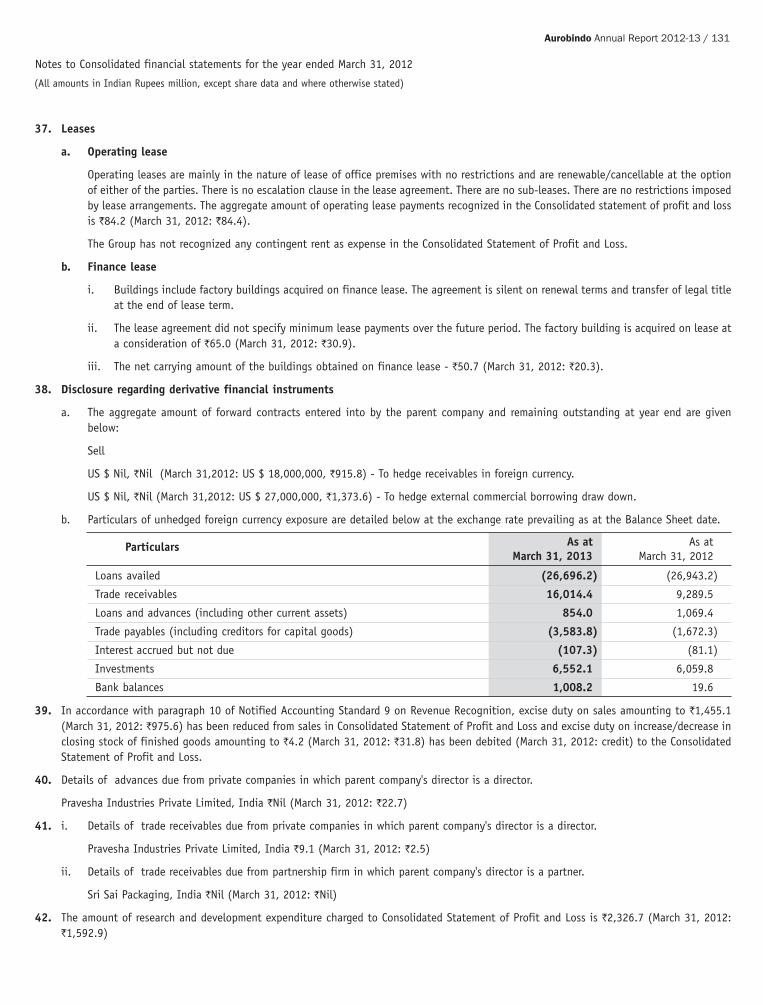
Aurobindo Annual Report 2012-13 / 131
37. Leases
a. Operating lease
Operating leases are mainly in the nature of lease of office premises with no restrictions and are renewable/cancellable at the optionof either of the parties. There is no escalation clause in the lease agreement. There are no sub-leases. There are no restrictions imposedby lease arrangements. The aggregate amount of operating lease payments recognized in the Consolidated statement of profit and lossis `84.2 (March 31, 2012: `84.4).
The Group has not recognized any contingent rent as expense in the Consolidated Statement of Profit and Loss.
b. Finance lease
i. Buildings include factory buildings acquired on finance lease. The agreement is silent on renewal terms and transfer of legal titleat the end of lease term.
ii. The lease agreement did not specify minimum lease payments over the future period. The factory building is acquired on lease ata consideration of `65.0 (March 31, 2012: `30.9).
iii. The net carrying amount of the buildings obtained on finance lease - `50.7 (March 31, 2012: `20.3).
38. Disclosure regarding derivative financial instruments
a. The aggregate amount of forward contracts entered into by the parent company and remaining outstanding at year end are givenbelow:
Sell
US $ Nil, `Nil (March 31,2012: US $ 18,000,000, `915.8) - To hedge receivables in foreign currency.
US $ Nil, `Nil (March 31,2012: US $ 27,000,000, `1,373.6) - To hedge external commercial borrowing draw down.
b. Particulars of unhedged foreign currency exposure are detailed below at the exchange rate prevailing as at the Balance Sheet date.
Particulars As at As atMarch 31, 2013 March 31, 2012
Loans availed (26,696.2) (26,943.2)
Trade receivables 16,014.4 9,289.5
Loans and advances (including other current assets) 854.0 1,069.4
Trade payables (including creditors for capital goods) (3,583.8) (1,672.3)
Interest accrued but not due (107.3) (81.1)
Investments 6,552.1 6,059.8
Bank balances 1,008.2 19.6
39. In accordance with paragraph 10 of Notified Accounting Standard 9 on Revenue Recognition, excise duty on sales amounting to `1,455.1(March 31, 2012: `975.6) has been reduced from sales in Consolidated Statement of Profit and Loss and excise duty on increase/decrease inclosing stock of finished goods amounting to `4.2 (March 31, 2012: `31.8) has been debited (March 31, 2012: credit) to the ConsolidatedStatement of Profit and Loss.
40. Details of advances due from private companies in which parent company's director is a director.
Pravesha Industries Private Limited, India `Nil (March 31, 2012: `22.7)
41. i. Details of trade receivables due from private companies in which parent company's director is a director.
Pravesha Industries Private Limited, India `9.1 (March 31, 2012: `2.5)
ii. Details of trade receivables due from partnership firm in which parent company's director is a partner.
Sri Sai Packaging, India `Nil (March 31, 2012: `Nil)
42. The amount of research and development expenditure charged to Consolidated Statement of Profit and Loss is `2,326.7 (March 31, 2012:`1,592.9)
Notes to Consolidated financial statements for the year ended March 31, 2012
(All amounts in Indian Rupees million, except share data and where otherwise stated)
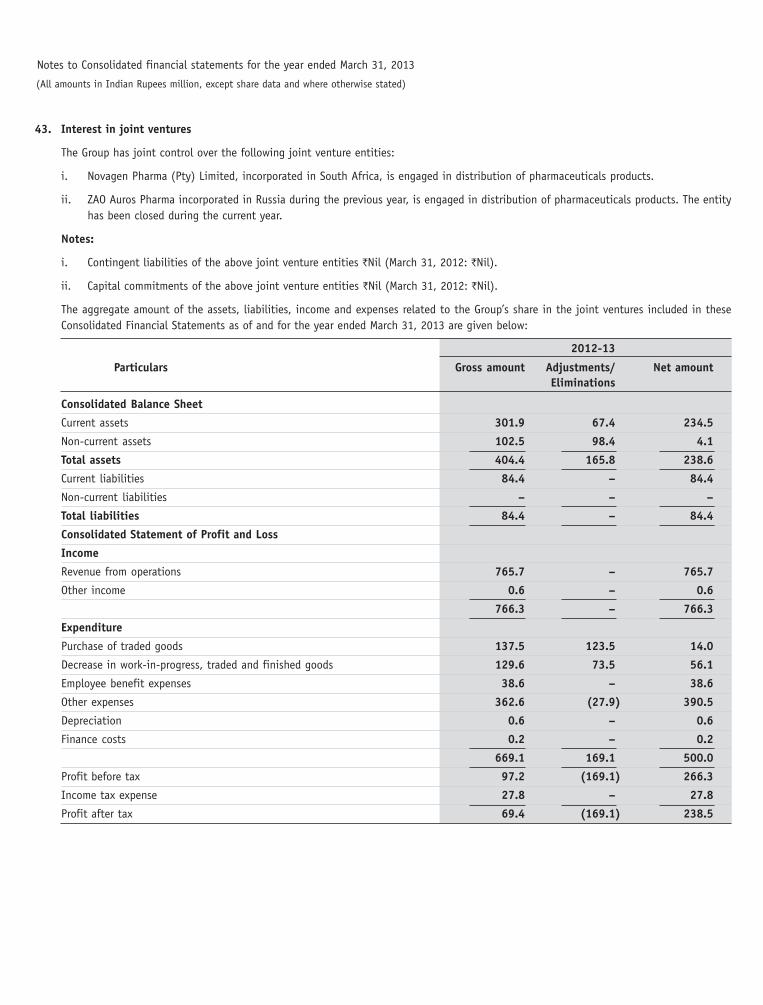
43. Interest in joint ventures
The Group has joint control over the following joint venture entities:
i. Novagen Pharma (Pty) Limited, incorporated in South Africa, is engaged in distribution of pharmaceuticals products.
ii. ZAO Auros Pharma incorporated in Russia during the previous year, is engaged in distribution of pharmaceuticals products. The entityhas been closed during the current year.
Notes:
i. Contingent liabilities of the above joint venture entities `Nil (March 31, 2012: `Nil).
ii. Capital commitments of the above joint venture entities `Nil (March 31, 2012: `Nil).
The aggregate amount of the assets, liabilities, income and expenses related to the Group’s share in the joint ventures included in theseConsolidated Financial Statements as of and for the year ended March 31, 2013 are given below:
2012-13
Particulars Gross amount Adjustments/ Net amountEliminations
Consolidated Balance Sheet
Current assets 301.9 67.4 234.5
Non-current assets 102.5 98.4 4.1
Total assets 404.4 165.8 238.6
Current liabilities 84.4 – 84.4
Non-current liabilities – – –
Total liabilities 84.4 – 84.4
Consolidated Statement of Profit and Loss
Income
Revenue from operations 765.7 – 765.7
Other income 0.6 – 0.6
766.3 – 766.3
Expenditure
Purchase of traded goods 137.5 123.5 14.0
Decrease in work-in-progress, traded and finished goods 129.6 73.5 56.1
Employee benefit expenses 38.6 – 38.6
Other expenses 362.6 (27.9) 390.5
Depreciation 0.6 – 0.6
Finance costs 0.2 – 0.2
669.1 169.1 500.0
Profit before tax 97.2 (169.1) 266.3
Income tax expense 27.8 – 27.8
Profit after tax 69.4 (169.1) 238.5
Notes to Consolidated financial statements for the year ended March 31, 2013
(All amounts in Indian Rupees million, except share data and where otherwise stated)

Aurobindo Annual Report 2012-13 / 133
2011-12
Particulars Gross amount Adjustments/ Net amountEliminations
Consolidated Balance Sheet
Current assets 400.5 122.4 278.1
Non-current assets 13.2 – 13.2
Total assets 413.7 122.4 291.3
Current liabilities 230.6 196.0 34.6
Non-current liabilities – – –
Total liabilities 230.6 196.0 34.6
Consolidated Statement of Profit and Loss
Income
Revenue from operations 705.7 – 705.7
Other income – (3.0) 3.0
705.7 (3.0) 708.7
Expenditure
Purchase of traded goods 348.3 343.1 5.2
Increase in work-in-progress, traded and finished goods (101.8) (52.6) (49.2)
Employee benefit expenses 34.4 – 34.4
Other expenses 307.1 12.4 294.7
Depreciation 0.3 – 0.3
Finance costs 0.1 – 0.1
588.4 302.9 285.5
Profit before tax 117.3 (305.9) 423.2
Income tax expense 27.5 – 27.5
Profit after tax 89.8 (305.9) 395.7
44. Segment information
a. Identification of reportable segments
Segments are identified in line with AS 17 'Segment Reporting', taking into consideration the internal organisation and managementstructure as well as the differential risk and returns of the segment.
Based on the Group’s business model of vertical integration, pharmaceuticals have been considered as the only reportable businesssegment and hence no separate financial disclosures provided in respect of its single business segment.
Operations of the Group are managed from independent locations, which are located in different geographical locations. However eachof these operating locations are further aggregated based on the following factors: (a) similarity of economic and political conditions;(b) relationships between operations in different geographical areas; (c) proximity of operations; (d) special risks associated withoperations in a particular area; (e) exchange control regulations; and (f) the underlying currency risk. Accordingly, the following havebeen identified as operating and reportable segments: (a) 'India', (b) 'USA' (c) 'Europe' and (d) 'Rest of the World'.
b. Method of pricing inter segment transfers
Inter segment sales are generally accounted at fair values and the same have been eliminated in consolidation. The accounting policiesof the segments are substantially the same as those described in the 'Statement of Significant Accounting Policies' as under para 1above.
Notes to Consolidated financial statements for the year ended March 31, 2013
(All amounts in Indian Rupees million, except share data and where otherwise stated)

c. Financial information as required in respect of operating and reportable segments is as given below:
For the year ended and as at March 31, 2013Particulars India U.S.A. Europe Rest of Eliminations Consolidated
the WorldRevenue
External sales 37,500.7 13,585.1 3,291.1 4,176.3 – 58,553.2Inter-segment sales 16,745.3 – 108.0 2,926.2 (19,779.5) –Total revenue 54,246.0 13,585.1 3,399.1 7,102.5 (19,779.5) 58,553.2
Other informationSegment assets 62,680.5 13,831.6 6,090.4 4,130.6 (15,979.9) 70,753.2Other assets 2,025.2TOTAL ASSETS 72,778.4Segment liabilities 10,745.7 7,828.4 3,171.8 2,165.7 (12,148.4) 11,763.2Other liabilities 34,957.6TOTAL LIABILITIES 46,720.8Capital expenditure 1,801.7 430.2 195.9 336.7 – 2,764.5Depreciation/amortization 1,733.3 203.2 562.8 75.9 (87.8) 2,487.4Non-cash expenses other
than depreciation 104.1 360.1 199.9 95.0 (5.6) 753.5
For the year ended and as at March 31, 2012Particulars India U.S.A. Europe Rest of Eliminations Consolidated
the WorldRevenue
External sales 34,518.5 6,864.8 1,924.5 2,966.2 – 46,274.0Inter-segment sales 8,296.4 – 5.8 1,819.1 (10,121.3) –Total revenue 42,814.9 6,864.8 1,930.3 4,785.3 (10,121.3) 46,274.0
Other informationSegment assets 53,323.7 9,240.2 4,929.0 2,847.8 (8,901.4) 61,439.3Other assets 937.0TOTAL ASSETS 62,376.3Segment liabilities 7,685.4 4,028.4 2,375.9 1,922.4 (7,195.4) 8,816.7Other liabilities 30,163.1TOTAL LIABILITIES 38,979.8Capital expenditure 4,336.3 472.2 818.8 129.9 – 5,757.2Depreciation/amortization 1,434.4 154.7 469.4 41.3 (94.5) 2,005.3Non-cash expenses other
than depreciation 8.7 181.5 53.9 72.4 – 316.5
45. The figures of previous year have been regrouped/rearranged, wherever necessary to conform to those of the current year.
Notes to Consolidated financial statements for the year ended March 31, 2013
(All amounts in Indian Rupees million, except share data and where otherwise stated)
As per our report of even date. For and on behalf of the Board of Directors of Aurobindo Pharma Limited
For S.R. BATLIBOI & ASSOCIATES LLPChartered AccountantsICAI Firm Registration No. 101049W N. GOVINDARAJAN Dr. M. SIVAKUMARAN
Managing Director Director
per VIKAS KUMAR PANSARIPartnerMembership No. 93649 SUDHIR B. SINGHI A. MOHAN RAMI REDDY
Chief Financial Officer AVP (Legal) &Hyderabad, May 30, 2013 Company Secretary

AUROBINDO PHARMA LIMITEDRegistered Office: Plot No.2, Maitrivihar, Ameerpet, Hyderabad – 500 038.
Mr./Ms. ...............................................................
...............................................................
...............................................................
...............................................................
ATTENDANCE SLIP
DayDateTime
Venue
Wednesday
7th August, 2013
4.00 p.m.
Taj DeccanRoad No.1, Banjara Hills,Hyderabad 500 034
Demat ParticularsDP ID No.
Client ID No.
I hereby record my presence atthe 26th ANNUAL GENERALMEETING of the Company
Signature of the Member or Proxy○ ○ ○ ○ ○ ○ ○ ○ ○ ○ ○ ○ ○ ○ ○ ○
MEMBER PROXY
(Please tick as applicable)
Note: 1. Only Members of the Company or their proxies will be allowed to attend theMeeting ON PRODUCTION OF ATTENDANCE SLIP duly completed and signed.
2. Please fill this admission slip and hand it over at the entrance of the hall duly signed.
3. Members are requested to bring their copies of Annual Report with them.
4. Members who hold shares in dematerialised form are requested to bring theirClient ID and DP ID numbers for easy identification of attendance at the Meeting.
I/We ...................................................................................................................................................................
of.......................................................................................................................................................................
being Member(s) of AUROBINDO PHARMA LIMITED hereby appoint.........................................................................
of........................................................................................................................................... or failing him/her
.....................................................................................................................................................................
of ..................................................................................................................................................................
as my/our proxy to vote for me/us on my/our behalf at the 26th ANNUAL GENERAL MEETING of the Company to be held
at 4.00 p.m. on Wednesday, the 7th August, 2013 and at any adjournment thereof.
Date........................... Signature.............................................................
Affix a15 paiseRevenueStamp
(Address)
(Address of proxy)
(Name of alternate proxy)
(Address of alternate proxy)
✂
Note: The Proxy in order to be effective should be duly stamped, completed and signed and must be deposited at the Registered Office of the Companynot less than 48 hours before the time for holding the aforesaid Meeting. The Proxy need not be a member of the Company.
No. of Shares
Reg. Folio No.
FORM OF PROXY
No. of Shares
Demat ParticularsDP ID No.
Client ID No.
Reg. Folio No.
✂
(Name of Member)
(Name of proxy)
AUROBINDO PHARMA LIMITEDRegistered Office: Plot No.2, Maitrivihar, Ameerpet, Hyderabad – 500 038.✂
Tear
Her
e