EU Commission – DG Environment
Promoting Innovative Business Models with Environmental Benefits
Final report
November 2008
EU Commission
Innovative Business Models
with Environmental Benefits
Final report
November 2008
COWI A/S Parallelvej 2
DK-2800 Kongens Lyngby
Denmark Tel +45 45 97 22 11
Fax +45 45 97 22 12
www.cowi.com
Report no. 4
Issue no. 3
Date of issue 25 November 2008
Prepared VIHU, GUWE, TIGU, ELO
Checked NEF, VIHU
Approved ELO
Innovative Business Models with Environmental Benefits
1
.
Table of Contents
1 Executive summary 3
2 Introduction 6
3 Depth and Breadth of the Analysis 8
3.1 Categorisation of Generic Case Studies 8
4 Product Service Systems 11
4.1 Energy Service Companies 11
4.2 Design, Build, Finance, Operate 14
4.3 Chemical Management Services 16
4.4 Resource Management 19
4.5 Remanufacturing 21
4.6 Car-sharing 23
5 Drivers for PSS 26
5.1 Environmental benefits 29
5.2 Business rationale 29
5.3 Political attractiveness 31
6 Market possibilities 33
7 Realising PSS 39
7.1 Barriers to PSS 39
7.2 Overcoming the barriers 40
7.3 Integrating PSS in business development 45
8 Conclusion and Recommendations 47
9 Case analyses 50
9.1 Energy Service Companies 50
9.2 Design, Build, Finance, Operate 61
Innovative Business Models with Environmental Benefits
2
.
9.3 Chemical Management Services 68
9.4 Resource Management 78
9.5 Remanufacturing 85
9.6 Car-sharing 92
10 Case catalogue 102
11 Sources 115
11.1 References 115
11.2 List of case interviews 117
11.3 Internet 118
Innovative Business Models with Environmental Benefits
3
.
1 Executive summary
Greater spread and application of innovation in business models that reduce
resource use has the potential to create multi-billion euro markets in the EU and
overseas and bring very substantial environmental and economic benefits.
The actual spread of these business models currently covers a very broad range
of sectors including industrial production of solid goods, fluids and ingredients
as well as transportation, construction and maintenance, agriculture and public
services.
But they have been utilised to only limited extent with a very unequal distribu-
tion between different countries and industries.
The most promising benefits appear to be realised by different kinds of Product
Service Systems (PSS). They are alternatives to the selling of products or ser-
vices that offer greater profits. If PSS were more widely applied they could lead
to greatly reduced consumption of energy and raw materials as well as reduced
waste production.
Case studies examined 8 successful business models to distil the factors that
make them successful and to understand why such business models are not cur-
rently more widespread.
These include chemical management systems, where chemical suppliers take
back chemicals they sell – a model more widely applied in the US than in the
EU and waste management co-operation where General Motors co-operate with
waste specialists to reduce waste production and share savings from effective
waste management. There are examples where business model change has led
to 20% reductions in waste and 65% increases in recycling – with correspond-
ing financial gain. Some of these types of business models are estimated to
have markets worth €5bn or more per year.
The key factor for success is that the company actually have a potential in the
form of either product capacity or knowledge that could be captured by divert-
ing into a service market or taking the responsibility of the process related to
the product. Key features:
• Capturing the potential: PSS projects changes the scope of the supplier.
Instead of focusing on the product, the deals focus on the outcome from
the combination of product and service. This combination gives the sup-
Innovative Business Models with Environmental Benefits
4
.
plier the opportunity to use their specialised knowledge about the use of
the product to realise a potential that is not realised in ordinary contracts.
This means that the supplier of e.g. chemicals or energy-consuming sys-
tems can capitalise the full capability of their product and know-how to
improve their business case and reduce prices at the same time.
• Incentives: All the cases are based on creating new incentives for the part-
ners. The provider in many cases gains an incentive for a lifetime perspec-
tive on investments, and both receiver and provider get an incentive to re-
duce the use of material or energy in production and use. Both incentives
bring down the operating costs. These savings are split through different
kinds of contractual regulations to make both partners benefit economi-
cally.
• Risk management: In many of these models the compensation mecha-
nisms that the contract is based on are decisive for the sharing of risk. It is
an additional source of income for the provider in these agreements to be
able to handle risk better than the partner could do by himself. This ability
to control risk is closely linked with the aforementioned potential and in-
centives leading to new and better solutions.
The cases show, that the economic results are very positive. Many projects real-
ise annual wins of 20% or more that can be split between the supplier and the
customer. Customers can benefit from reduced prices, less hassle and a green
image. PSS providers can enter new markets, increase profitability by obtaining
a higher position in the value chain, retain customers, sustain a green image and
fulfil future legislation.
The spread of PSS is currently limited by several avoidable factors. These
mainly relate to lack of knowledge, inertia in ways of working and difficulties
in communicating new complicated business cases. Providers of product ser-
vice systems sometimes need to invest in change whilst facing an uncertain fu-
ture of policies and regulation that might - or might not - incentivise companies
to save resources.
Both business leaders and policy-makers can take action to seize the opportu-
nity these business models offer and speed their spread.
Business leaders can find opportunities to profit from PSS models by inves-
tigating:
• Existing technical capabilities - or knowledge that is capable of saving re-
sources but which is not utilised by existing business models.
• Possible wins that could be realised and shared in a partnership relation
with customers and business partners.
• Opportunities for selling outcomes, rather than products.
• Willingness to pay for intangible value such as e.g. reputation for sustain-
ability.
Innovative Business Models with Environmental Benefits
5
.
Policy-makers can support the development of PSS models by:
• Take environmentally-friendly business models seriously as a means to
achieve environment and innovation policy goals
• Shaping regulation to give greater incentives for reduced resource use and
lower unfair competition from subsidised resource use.
• Checking existing regulation to remove blocks to the delivery of outcomes
(rather than products) by businesses.
• Examine the potential in their region, using knowledge of local culture and
economic conditions to assess the drivers and barriers.
• Setting up non-profit organisations documenting benefits - commercial and
environmental - and spreading knowledge about specific models
• Secure a flow of outcome-based deals to reduce market insecurity, either
through public purchases or through regulation of private companies.
• Make existing networks and infrastructure accessible to companies that
need them to make their business model operational.
Business associations could break down barriers to uptake through the promo-
tion of knowledge of PSS through business networks.
Innovative Business Models with Environmental Benefits
6
.
2 Introduction
This report contains the findings from a study on innovative business models
with environmental benefits that COWI has conducted on behalf of the Euro-
pean Commission.
In recent years, resource efficiency has ranged highly on the global business
and political agenda. Driven by rising energy and material prices and a limited
stock of fossil fuels, climate change and increasing public awareness of envi-
ronmental issues, reduced resource use is now an issue that is taken seriously
by international and national business and by (non-) governmental organisa-
tions around the world. This has among other things led to a search for new
ways in which energy and resource consumption can be reduced and damaging
CO2 emissions curbed.
This report is first and foremost to investigate for businesses the benefits and
availability of innovative, economically viable and environmentally-friendly
business models. This report describes a selection of innovative business mod-
els that are economically profitable and also have positive environmental ef-
fects.
It identifies the promise and pitfalls of the different types of business models
leading to policy recommendations that can contribute to the greater spread of
this type of business models.
This report can thus be used as an inspiration catalogue for business people,
politicians, civil servants, and international profit and non-profit organisations
that are interested in implementing or simply learning more about innovative
business models that can foster sustainability and enhance competitiveness at
the same time.
On the following pages, the reader is introduced to the logic, potential and op-
portunities of six types of Product Service Systems (PSS) (chapter 4). Based on
these descriptions, the next chapters analyse what drives PSS (chapter 5), what
the market potential is for PSS (chapter 6) and how PSS and can be realised
(chapter 7) leading to the conclusions and recommendations for business and
policy-makers who want to promote PSS (chapter 8).
Chapter 9 contains detailed studies of the six types of business models, describ-
ing their incentives and barriers. Chapter 10 gives short descriptions of all 85
Innovative Business Models with Environmental Benefits
7
.
examples of innovative business models found in the investigation. The ana-
lysed case studies are summed up in the table below.
Case Essentials
Case study I
TAC Energy Solutions
Energy saving partnership between the provider, TAC Energy Solutions, and the cus-
tomer, Regionfastigheter, Sweden leading to split savings from of € 1.26 million/year and
reduced energy consumption for heating of 30 %
Case study II
Novo Nordisk and Dong
Energy
Dong Energy and Novo Nordisk have set up an energy partnership. Dong Energy helps
Novo Nordisk identifying energy-saving projects on a non-fee basis. The energy savings
that are realized through the partnership are committed to purchasing wind power from
Dong Energy. The project is expected to reduce CO2 emissions equalling approximately
130,000 tonnes and will make the business case for windmills more attractive.
Case study III
PFI Street lighting
Hampshire County Council, UK, procure the responsibility for building and maintaining the
lighting net for a contractually determined sum from a contractor. The contractor gets an
incentive to reduce operation and maintenance costs - thereby reducing the use of energy
and materials. This optimisation also leads to economic savings realised by both partners.
Case study IV
PPG Industries
PPG industries cooperate with General Motors/Opel on a process and chemical manage-
ment programme. PPG is obliged to a continuous reduction of the use of chemicals. Gen-
eral Motors realise the savings and rewards PPG for the fulfilment of the agreement. The
deal leads to reduced chloride in the wastewater and reduced wastewater sludge.
Case study V
Houghton
Houghton offers fluid management services based on a fixed price business model, where
Houghton takes over the responsibility for the customer's management of lubricants. The
customer benefits from reduced downtime of production lines. Houghton benefits from the
reducing the amount of chemicals used
Case Study VI
General Motors
General Motors has outsourced the management of waste - primarily packaging and
chemical waste as paint sludge - to a Resource Management Contractor. A gain-sharing
mechanism in the contracts gives the contractor incentives to assist GM in eliminating the
production of waste and to increase the reuse and recycling of waste.
Case Study VII
ASML
ASML provides expensive microlithography systems for the semiconductor industry. When
their customers no longer need the system they have acquired from ASML, ASML buys it
back and send it back on the market after a sufficient upgrading. The method keeps the
price and production time relatively low and increases profit potential for ASML.
Case VIII
Mobility CarSharing
Mobility CarSharing Switzerland has 79,000 customers sharing 2,000 vehicles in 400 cit-
ies and towns in Switzerland and Liechtenstein. The customers are charged according to
hours of use and mileage driven. The costs include fuel, insurance and maintenance. The
total annual energy savings from Mobility’s private customers in 2005 is estimated to 78.4
TJ (terajoules), which equals approximately 2.5 million litre of gasoline.
Innovative Business Models with Environmental Benefits
8
.
3 Depth and Breadth of the Analysis
The report is based on a comprehensive screening of the business model land-
scape from around the world. Approximately one hundred experts and/or or-
ganisations were contacted to form a case catalogue encompassing over 80 ge-
neric as well as substantive business models, which shows the breadth of possi-
bilities.
The study's sources included:
• Private sector representatives (representatives from firms applying innova-
tive business models).
• Representatives from research institutions (universities, business schools
and other research institutions).
• Public sector representatives.
• The case catalogue was also compiled using reviews of academic literature
as well as policy reports and other available documents/reports on the sub-
ject.
Further analysis of the 8 selected cases was based on more interviews of repre-
sentatives from the analysed companies as well as an expert workshop with
leading scholars in the field of PSS from universities and other research institu-
tions.
3.1 Categorisation of Generic Case Studies
The majority of the business models gathered in the case catalogue are various
types of product service systems (PSS). Furthermore many of the most promis-
ing business models turned out to be different types of PSS. A handful of ge-
neric business models were selected for closer scrutiny/case analysis to investi-
gate promises and barriers for the implementation of various types of PSS.
Innovative Business Models with Environmental Benefits
9
.
A PSS can be defined as consisting of "tangible products and intangible ser-
vices designed and combined so that they are jointly capable of fulfilling spe-
cific customer needs" (Tukker 2004, 246).1
The key feature of PSS is that there is a shift away from product orientation
toward a greater emphasis on delivery of the function of the product combined
with relevant service. For example, instead of selling fuel, a company may offer
certain levels of heating in a building. Or, instead of selling pesticides, a com-
pany may sell a maximum level of harvest loss.
Various types of PSS exist. A conventional classification distinguishes between
three main types of PSS (Tukker, 2004). These are:
• Product-oriented services: This business model is still geared towards
sales of products but extra services are added for instance maintenance
contracts, supply of consumables and take-back agreements.
• User-oriented services: Traditional products play an important role but
the business model is not geared towards selling products; examples are
product lease; product renting or sharing and product pooling.
• Result-oriented services: The client and the provider agree on a result but
there is no pre-determined product; examples are delivery of a functional
result as in the two examples mentioned above.
Moving from the first to the latter categories of PSS, the reliance on the product
decreases, and the needs of the client are formulated in more abstract terms.
Six generic PSS models were chosen from the case catalogue for a more de-
tailed case analysis. These were:
• Chemical Management Services (CMS)
• Resource Management (RM)
• Energy Service Companies (ESCO)2
• Design Build Finance Operate (DBFO)
• Remanufacturing
• Car-sharing
The first four business models belong to the result-oriented services category of
PSS as they all shift the focus from the input to the result. Remanufacturing
which is based on altering used products to be ready for resale can be argued to
belong to the product-oriented services category. Finally, car-sharing is method
to make more people use the same car and thus a form of user-oriented PSS
service. In the cases analysed here, there is thus a spread in the type of PSS that
1 Elsewhere, PSS has also been defined as “a system of products, services, supporting net-
works and infrastructure that is designed to be: competitive, satisfy customers’ needs and
have a lower environmental impact than traditional business models” (Mont 2002, 240). 2 Definitions and descriptions of the six business models selected here are available in
chapter 4 and 9.
Innovative Business Models with Environmental Benefits
10
.
are encompassed by the analysis, nevertheless with the majority of the cases
belonging to the result-oriented services category. The reason for this is that
function-oriented business models within the result-oriented PSS category have
been identified as being particularly promising in environmental terms (Tukker
2004, 259).
The in-depth case analyses evolved around four key parameters:
• Key features of the business model
• Business rationale
• Environmental case
• Possibilities and barriers
We carried out detailed case analysis for each generic business model, with one
or two case examples (chapter 9). In total, eight concrete case examples are in-
cluded.
The cases were analysed to generate general knowledge about the functionality
of PSS and how it can be utilised further. On the basis of the case analyses a
workshop discussions, a number of findings about the potential, applicability
and policy recommendations have been generated, covering the following top-
ics:
• What are the opportunities for the successful business models to spill over
from one sector/country to others?
• What are the barriers to this development in regulation and in the market
respectively?
• How can innovative business models with positive environmental impacts
be more widely disseminated on the market?
• Which policy changes can support the development and dissemination of
innovative business models?
Innovative Business Models with Environmental Benefits
11
.
4 Product Service Systems
The core logic of a Product Service System (PSS) is that the focus shifts away
from delivering products or services towards delivering functionality to the cus-
tomer.
This shift gives companies possibilities to realise economic as well as environ-
mental potentials that are not captured by ordinary business models. Experience
shows that PSS can be applied in a very wide range of sectors using different
methodologies.
The following sections will describe six different ways of using PSS when do-
ing business. Each description highlights the potential, logic and opportunities
of the models. The aim of the descriptions is to give generic input to business
case considerations in companies who may consider PSS. Furthermore, each
model contains one or two short cases of successful PSSs using the model.
In-depth descriptions of the business models and cases are found in chapter 9.
This chapter also contains all the references behind the arguments in these
shorter descriptions.
4.1 Energy Service Companies
An energy service company (ESCO) is a company which delivers energy ser-
vices, assumes financial risk relative to energy projects and further is paid ac-
cording to the extent of realised energy savings. In an ESCO project the energy
provider optimises the consumer's energy consumption through application of
more energy-efficient technologies and by optimising the energy consumption,
primarily with respect to heating and lighting.
Application ESCOs are known in all kinds of buildings and plants including schools,
hospitals and production facilities and are considered to be one of the most
promising PSS models. The method can be applied in both the public and the
private sectors, but the opportunities are most obvious in rundown public facili-
ties.
The model has the potential of realising 170MJ/m2/year of energy savings lead-
ing to substantial reductions in CO2 emissions. This effect can be even bigger if
savings are spent on green energy investments as in the DONG Energy -Novo
Nordisk case. If this model was applied in all construction facilities it has been
Environmental
benefits
Innovative Business Models with Environmental Benefits
12
.
estimated to reduce national CO2 emissions by 10% in Denmark. This figure
will probably not be smaller in other countries.
Project framework ESCOs are contractual relations between companies or a company and a public
organisation. The typical length of the contracts is 5-10 years, but some con-
tracts are longer to secure that long-term considerations are taken into account.
What's new? This business model differs from traditional business models in the sense that
the client no longer contracts for a fixed product/service. The provider is given
relatively free hands in bringing about the technical solutions that are necessary
to achieve energy savings. The core feature is that the risk of the project is
normally transferred to the contractor which means that he/she is incentivised
to bringing about as large savings as possible because this is tied to the pay-
ments that the contractor receives.
Here, it is important to note the new role of the buyer. He/she has to maintain a
more hands-off approach relative to traditional procurement models, and this
requires a different type of relationship with the contractor.
The traditional command-and-control approach is not appropriate in this type of
project. Instead a partnership approach, in the conventional meaning of the
word, is more appropriate. Another core feature is the investment element: i.e.
that the ESCO company normally is re-
sponsible for or involved in the project
finance; e.g. assistance in the arranging
of finance by way of the energy saving
guarantee.
The new division of risk creates new
contracting behaviour and incentivises
the buyer and in particular the supplier
in new ways. A key benefit of the ESCO
model is that it has the potential to real-
ise significant energy savings without
constituting a liability for the recipient
company. Often, there will be a guaran-
teed minimum saving, and the savings
finance the capital costs.
Supplier's benefits An ESCO gives the supplier the
opportunity to capitalise the value that is
created by the solution. The business
model is particularly attractive to sup-
pliers who can offer a solution that is
technically and/or environmentally su-
perior to the competitors'.
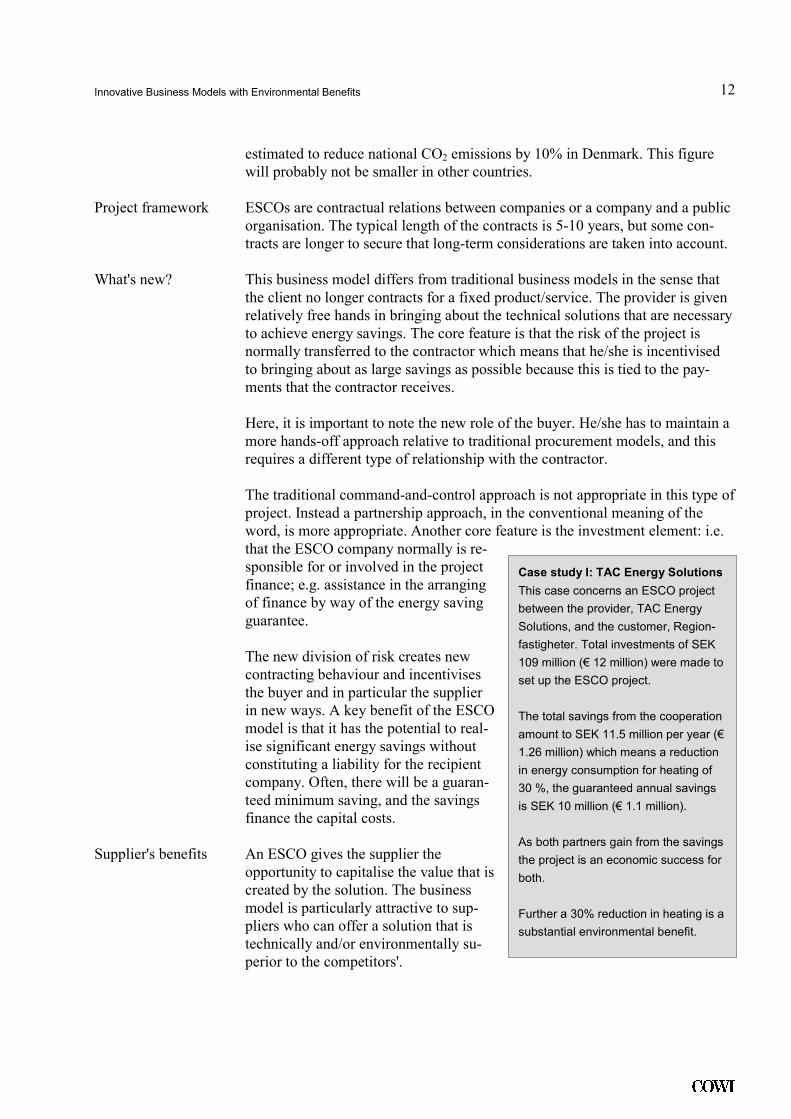
Case study I: TAC Energy Solutions
This case concerns an ESCO project
between the provider, TAC Energy
Solutions, and the customer, Region-
fastigheter. Total investments of SEK
109 million (€ 12 million) were made to
set up the ESCO project.
The total savings from the cooperation
amount to SEK 11.5 million per year (€
1.26 million) which means a reduction
in energy consumption for heating of
30 %, the guaranteed annual savings
is SEK 10 million (€ 1.1 million).
As both partners gain from the savings
the project is an economic success for
both.
Further a 30% reduction in heating is a
substantial environmental benefit.

Innovative Business Models with Environmental Benefits
13
.
A good technical solution will have lower risk of failure and can therefore give
better functionality in a performance-based agreement and create better eco-
nomic results than a traditional sale of products. An ESCO rewards the supplier
with the best solution.
The unique DONG Energy - Novo Nordisk cooperation gives further benefits
for the supplier as the ESCO-cooperation makes it possible to invest in green
energy at lower risk than their competitors.
Customer's benefits For the customer the prime
benefit is the ESCO's ability
to curb a negative cost trend
in an aging estate stock and
to support the long-term de-
velopment of buildings and
plants.
The ESCO makes it possible
to lower energy consump-
tion, better the coordination
within the operational or-
ganisation and upgrade
technical standards - all
bringing about lower costs -
without investing scarce
capital.
Further the cases show that
ESCO can be used to reduce
CO2 emissions in a cost neu-
tral manner and shift to
green energy consumption at
the same time. For the cus-
tomer this brings about two
benefits. First, it prepares the
business for a carbon-
constrained future by reduc-
ing carbon dependency and
curbing rising energy ex-
penses. Second, it realises
intangible value in the sense that it signals to the broader community that com-
pany cares about the climate.
The key precondition is knowledge about the existence of the models. It seems
that the market is becoming more aware of ESCOs when energy prices price
and there is a general interest in energy efficiency and climate change. Further,
aggressive energy saving goals in some countries are pushing the development
of the ESCO-sector.
Essential
preconditions
Case study II: Novo Nordisk and Dong Energy
A Danish energy producer, Dong Energy, and Novo
Nordisk, producer of pharmaceuticals have set up
an energy partnership. The essence of the partner-
ship is that Dong Energy helps Novo Nordisk with
regard to identifying energy-saving projects on a
non-fee basis.
Novo Nordisk is committed to convert all the energy
savings that are realized through the partnership,
into purchasing of wind power from Dong Energy.
By 2014 the partnership is expected to have brought
about a reduction in CO2 emissions equalling ap-
proximately 130,000 tonnes. Novo Nordisk's own
calculations suggest that should all Danish manu-
facturers follow the same model then total CO2
emissions in Denmark could be reduced by 10 %
(six million tonnes).
In the EU-15 the manufacturing sector stands for
21.9 % of total greenhouse gas emissions, this
equals approximately 901 million tonnes green-
house gas emissions (Federal Statistical Office
2008, 11 and 15). Thus, when extrapolating to the
EU-15 a 10 % reduction in greenhouse gas emis-
sions in the manufacturing sector would equal a cut
in the range of 90 million tonnes.
Innovative Business Models with Environmental Benefits
14
.
To make ESCO solutions attractive it is essential that the price of energy is not
kept low artificially, that there is no legal constraints on investment in energy
savings and a general policy that gives incentives for energy savings.
Further, to make a co-operation like the Novo Nordisk - DONG Energy part-
nership attractive it is essential that it is possible to measure and claim individ-
ual companies' investments in green energy.
The European Commission estimates that the marked for ESCOs can develop
to a volume in the range of €5-10 billion per annum within a short-term per-
spective. This gives reasons to believe that there is a large unrealised ESCO
potential in Europe.
An estimation of the overall revenue for the US industry in 2006 was $3.6 bil-
lion. There was an annual growth in the industry of 20 % in the period 1991-
2000. This figure dropped down to 3 % in the period 2000-2004. However,
from 2004-2006 this increased drastically again to 22 %. The industry revenue
in 2008 is estimated to be around $5.25 billion in US alone. A similar devel-
opment in Europe is likely to be given the right political backing.
4.2 Design, Build, Finance, Operate
The Design Build Finance Operate (DBFO) model is a form of Public-Private
Partnership (PPP). A PPP is a contractual relationship between a public author-
ity and a private contractor used for construction projects requiring long-term
investments. Significant for the DBFO model is that while the public authority
is the owner, it is the private contractor that designs, builds, finances and oper-
ates the construction in question.
Application DBFO is already applied in a long range of sectors including building,
infrastructure, transport systems and military equipment. The model is focused
on delivering the functional result of a combination of investment, construction
and operation to the public sector.
It is yet to be proven that DBFO has significant environmental benefits but the
model in its essence gives incentives to minimise operation cost including en-
ergy and minimise maintenance.
The environmental potential in DBFOs would be considerably larger if public
sector procurers focused more on the environmental side of the projects. The
model in itself makes it easy to apply TCO-thinking.
Project framework The typical DBFO model covers a period of several decades - typically 30-35
years - some even longer. It is based on comprehensive agreements as a co-
operation that long, makes it relevant to regulate a lot of aspects of the coopera-
tion.
Due to these obstacles the model is normally reserved for large contracts.
Market
opportunities
Environmental
benefits
Innovative Business Models with Environmental Benefits
15
.
What's new? The public authority specifies the desired output and it is up to the contractor to
deliver this output, and as such it is a form of Performance Based Building. Just
like the case with the ESCO model, in a PPP, the buyer assumes a different role
relative to traditional procurement models. Again, the contractor must be given
the necessary elbowroom to come up with the innovative solutions that bring
about the hoped for superior solutions. A partnering approach is thus also im-
portant here. The long-term nature of the business relationship emphasises fur-
ther the importance of a partnering approach.
Normally, in DBFOs the private sector party assumes ownership of the asset for
the contract period which typically concerns 30-35 years. After this, the asset is
transferred back to public ownership. An interesting detail is that the private
party commits to handing back an asset which meets certain minimum mainte-
nance standards. This means that asset maintenance is not neglected during the
project period; a problem which is all too well-known in the public sector.
The DBFO model is closely related to the ESCO model and the two models do
to some extent share the same logic. In both models, there is a significant move
towards delivering function as opposed to products. The provider normally as-
sumes project risk (i.e. the provider commits to certain performance standards –
remuneration of provider is con-
tingent on its performance) and
the provider normally finances
necessary upfront capital in-
vestments (in the narrow under-
standing of the terms).
Supplier's benefits The supplier in a DBFO is
secured a long-term, stable in-
come from the project and is
incentivised to secure reliability
and long-term minimisation of
cost.
Further, the large bidding cost is
offset by the very large portfolio
of assignments that is part of the
deal.
Finally, DBFOs' deals are
known to be good financial as-
sets as soon as the project is de-
livered successfully making it
attractive for all partners to in-
vest in the deal.
Customer's benefits The same incentives bring about benefits for the customer. As the supplier is
incentivised to construct assets that can be efficiently maintained and operated,
the cost of operation is brought down. In particular within the public sector a
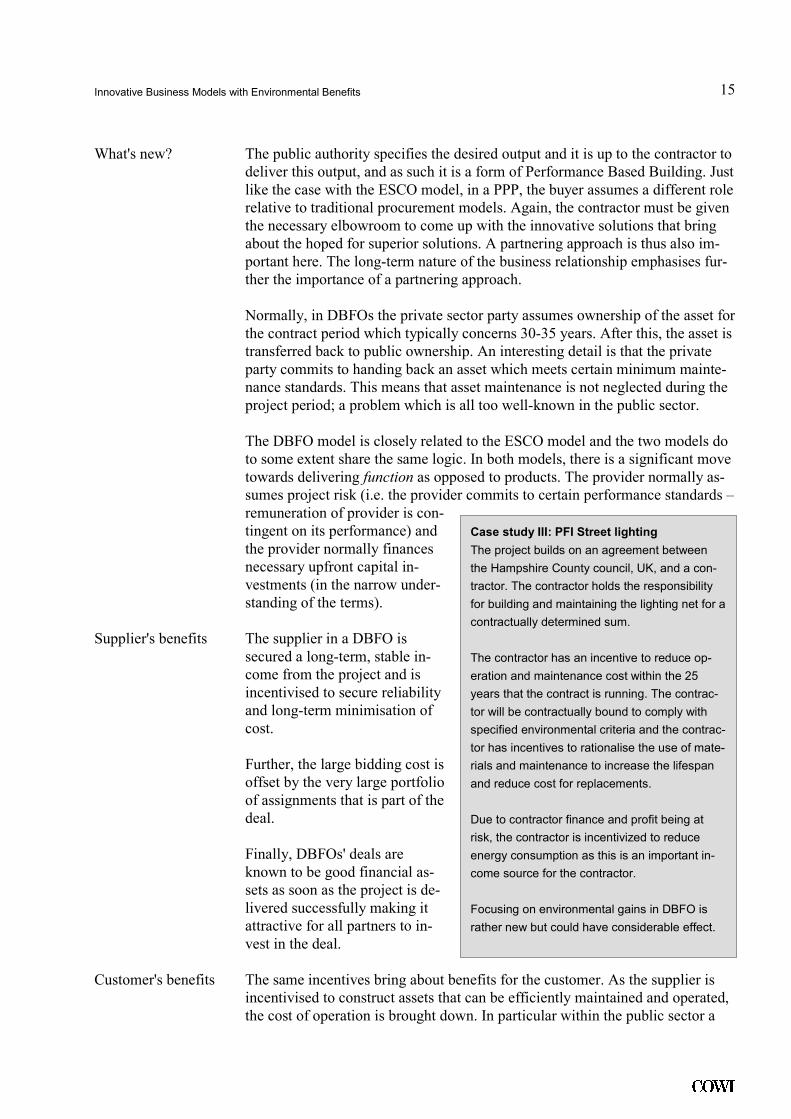
Case study III: PFI Street lighting
The project builds on an agreement between
the Hampshire County council, UK, and a con-
tractor. The contractor holds the responsibility
for building and maintaining the lighting net for a
contractually determined sum.
The contractor has an incentive to reduce op-
eration and maintenance cost within the 25
years that the contract is running. The contrac-
tor will be contractually bound to comply with
specified environmental criteria and the contrac-
tor has incentives to rationalise the use of mate-
rials and maintenance to increase the lifespan
and reduce cost for replacements.
Due to contractor finance and profit being at
risk, the contractor is incentivized to reduce
energy consumption as this is an important in-
come source for the contractor.
Focusing on environmental gains in DBFO is
rather new but could have considerable effect.
Innovative Business Models with Environmental Benefits
16
.
lack of maintenance of public assets is often a problem and that makes the
room for improvement in DBFO deals significant.
The customer is a good situation knowing the price, not just of the product, not
just of the service, but of the functionality of the deal. That makes it possible to
focus on the TCO of a project and not just one-year budgets.
It is hard to measure the exact economic benefits of DBFO as it is difficult to
point out a baseline, but most studies conclude that the possible gains are sub-
stantial.
DBFOs are not easily brought about as they challenge several aspects of public
regulation including financial management principles, procurement rules and
standards, tax and VAT-regulation as well as substantial culturally-based scep-
ticism towards private contractors.
Most countries have dealt with these obstacles by enforcing focused PPP laws
(dealing with DBFO) and establishing national organisations promoting DBFO
and other forms of PPP.
To realise environmental benefits from DBFO it is essential that the environ-
mental perspective is in focus in the procurement criteria and contract-awarding
mechanism. Most important is a shift of focus from the "low bid approach" to
an approach focusing on the life cycle cost of the project.
The market for PPP can be considered to be substantial. In the period 2004-
2005 alone, about 206 PPP deals were closed worldwide with a value of ap-
proximately US$52 billion. In the United Kingdom alone more than 750 PPP
projects with a total capital value of £37.6 billion were implemented in the pe-
riod 1995-2007.
Several other European countries are in a developing stage in DBFO but there
is little doubt that the future aggregated European market for DBFO is massive.
4.3 Chemical Management Services
In a traditional chemical supplier-customer relationship, the supplier earns his
profit by maximising the volume of sold chemicals. Relative to this, chemical
management services (CMS) constitute a shift to a strategic alliance business
relationship. Instead of purchasing chemicals (a product), the customer buys
chemical management services.
Application CMS is applied in a very wide range of sectors including production of cars,
aerospace and aircrafts, transport, machines and electrical equipment, metal
industry, boiler treatment, cooling systems and wastewater treatment.
The management systems handle all kinds of chemicals including solvents,
coatings, lubricants, industrial gases, adhesives, water treatment chemicals,
tanners and printing ink. This makes it relevant in all kinds of production.
Essential
preconditions
Market
opportunities
Innovative Business Models with Environmental Benefits
17
.
The CMS concept also has a potential within agrochemicals, where contracts
can be set up, in which the supplier guaranties the farmer a certain performance
for the crop in terms of quantity and quality. The supplier specifies a plan for
the application of the product. The concept has been used in the US but has not
been applied in Europe yet.
Furthermore, the logic of CMS could in principle be applied to a wide range of
other ingredient-suppliers including e.g. medicine, enzymes or active microor-
ganisms.
The environmental logic of CMS is that less lubricant is used and wasted if the
supplier is incentivised to reduce instead of maximise the volume. This means
that less lubricant is used to maintain the machine, less paint is used in the coat-
ing of cars or less adhesive is used to assemble a product.
Further a CMS deal makes it possible to incentivise the development and use of
environmentally-friendly products by setting up goals to e.g. reduce the chlo-
ride concentration in the wastewater or reduce the amount of wastewater
sludge.
Project framework The projects are agreed between commercial partners. They often imply longer
contractual relations - e.g. 3-5 years
- as a CMS needs some initial in-
vestment, the value of which needs
to be captured in the contract.
The size of the contract and the or-
ganisational interaction can vary a
lot from one project to another with
contract sums from € 5,000 to
1,000,000 a year.
What's new? The chemical provider takes a direct
role with respect to managing the
customer's chemicals throughout the
chemical life cycle, including the
purchasing, managing and keeping
track of chemicals. Thereby a shift
takes place in the responsibility for
the management of the customer's
production processes and the quality
of final products. This is expected to
lead to a reduction in chemical con-
sumption, in prices on chemicals as
well as improved manufacturing
processes. As a consequence im-
proved environmental performance
is achieved.
Environmental
benefits
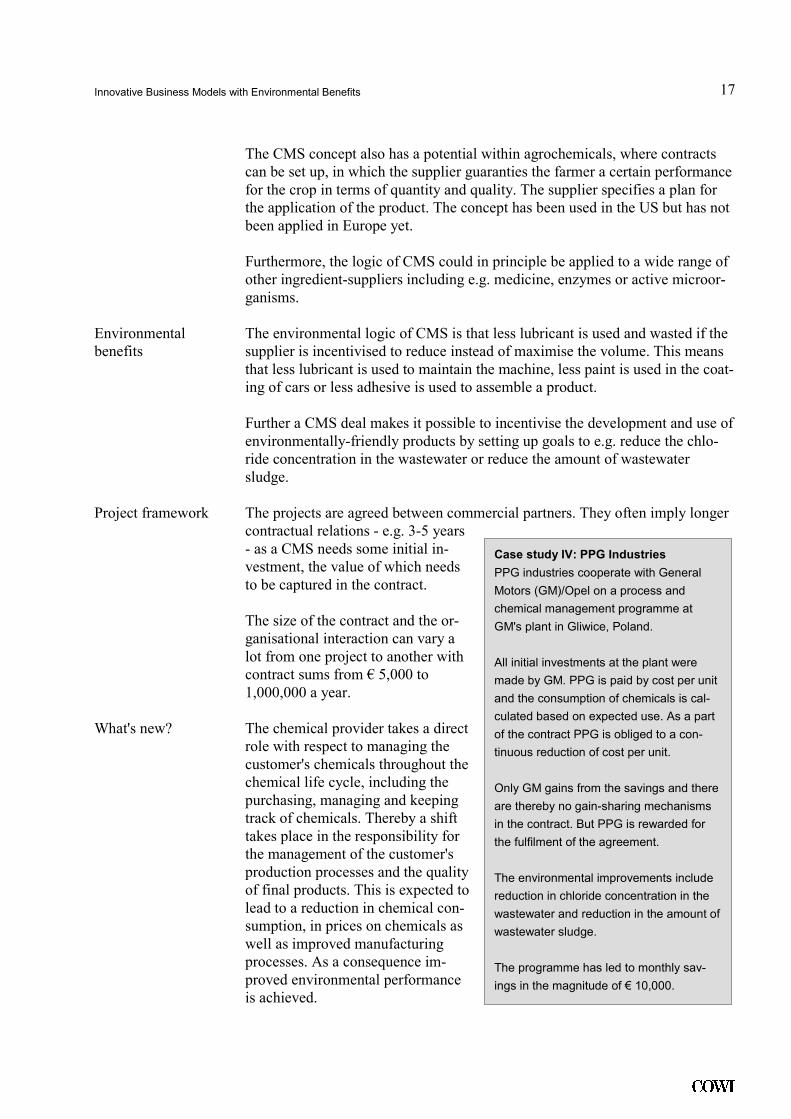
Case study IV: PPG Industries
PPG industries cooperate with General
Motors (GM)/Opel on a process and
chemical management programme at
GM's plant in Gliwice, Poland.
All initial investments at the plant were
made by GM. PPG is paid by cost per unit
and the consumption of chemicals is cal-
culated based on expected use. As a part
of the contract PPG is obliged to a con-
tinuous reduction of cost per unit.
Only GM gains from the savings and there
are thereby no gain-sharing mechanisms
in the contract. But PPG is rewarded for
the fulfilment of the agreement.
The environmental improvements include
reduction in chloride concentration in the
wastewater and reduction in the amount of
wastewater sludge.
The programme has led to monthly sav-
ings in the magnitude of € 10,000.
Innovative Business Models with Environmental Benefits
18
.
A typical example of CMS is, for instance, long-term business relations be-
tween automakers and paint producers, where, instead of selling paint, the paint
producer sells a painting service. The automaker then pays per painted car. This
incentivises the paint producer to reduce the consumption of paint and to opti-
mise paint processes.
Supplier's benefits The supplier gains from the long business relation with the customer securing
long-term business. Further it makes it possible for the supplier to realise the
business potential in their superior knowledge of the qualities of the chemicals
and the correct management of them.
The CMS deal normally gives the supplier massive incentives to realise savings
as only very high savings need to be split with the customer. E.g. a typical
model is that savings exceeding € 500,000 are shared evenly between Hough-
ton and the customer.
Further applying CMS allows the suppliers to introduce new value-adding
products and services that help to maintain growth in the business.
Customer's benefits By the year of implementation of a CMS the net savings gained are from 5-20
% and within the first three years most companies have annual savings of from
6 to 10 %. After 5 years the sav-
ings are in the magnitude of 0-5 %
per year. The savings are primarily
obtained through reducing the
chemical consumption, reducing
the prices on chemicals and im-
proving manufacturing processes.
These savings are reflected in the
attractive deals with the CMS sup-
plier that can lead to reductions of
up to e.g. 50% of costs of lubri-
cants. Further soft savings are ob-
tained by reducing the downtime
on the plant and by avoiding addi-
tional labour costs.
A large barrier to introducing
CMS among chemical suppliers is
a traditional mindset, where profit
depends on the quantity of chemi-
cals they sell. Barriers to the sup-
pliers are also that the customers
are not fully aware of the concept
and do not have a full understand-
ing of the life cycle costs of
chemicals.
Essential
preconditions
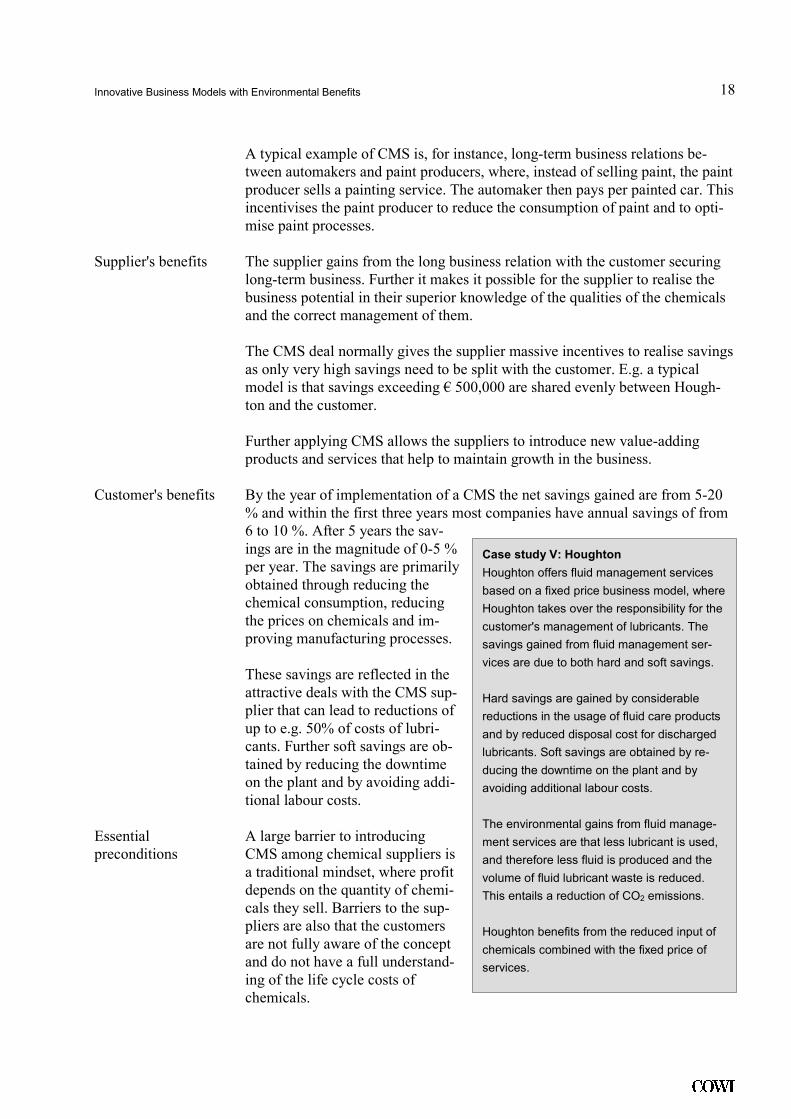
Case study V: Houghton
Houghton offers fluid management services
based on a fixed price business model, where
Houghton takes over the responsibility for the
customer's management of lubricants. The
savings gained from fluid management ser-
vices are due to both hard and soft savings.
Hard savings are gained by considerable
reductions in the usage of fluid care products
and by reduced disposal cost for discharged
lubricants. Soft savings are obtained by re-
ducing the downtime on the plant and by
avoiding additional labour costs.
The environmental gains from fluid manage-
ment services are that less lubricant is used,
and therefore less fluid is produced and the
volume of fluid lubricant waste is reduced.
This entails a reduction of CO2 emissions.
Houghton benefits from the reduced input of
chemicals combined with the fixed price of
services.
Innovative Business Models with Environmental Benefits
19
.
To promote CMS it has proven a good idea to establish knowledge centers
showing the benefits and possibilities to potential suppliers and customers.
Further, it might be effectful to make public information campaigns focusing
on companies.
From 2000 to 2004 the CMS market in the US has grown about 50 % and made
up a market of US$ 1.22 billion. In 2004, CMS has reached the largest market
penetration in the US in the automotive industry where 75-80 % of the industry
is utilising CMS. Air transportation maintenance (40-50 %), electronics (30-40
%), and aerospace manufacturing (25-30 %) are other sectors with a large mar-
ket penetration. From 2000 to 2004, CMS had grown from application in 4 to
11 different industrial sectors.
In Europe, CMS is to a wide extent applied within the automotive and aero-
space industries. CMS is growing in Europe but is not applied as widespread as
in the US. Wider application of CMS constitutes a significant potential.
4.4 Resource Management
The idea in resource management (RM) is to set up a contractual arrangement
between a waste-producing organisation and a waste contractor with incentives
to preventing, recycling and recovering waste. This can be organised by setting
up a mutually beneficial business relationships that encourage cost-efficient
resource efficiency, recover savings and open up for gain-sharing mechanisms
between the customer and the waste contractor.
Application The model can in principle be applied in all waste producing organisations
including both public and private production. The potential is biggest in large
organisations as the task of managing the resources becomes more difficult the
larger the organisation.
On the other hand, very large companies may find it even more attractive to set
up internal resource management programmes to realise all the benefits - given
that they have the sufficient knowledge about the resources used and waste
produced in their processes.
RM has led to a reduction in the volume of waste that is sent to landfills and
incinerators. This leads to reduction in methane emissions from landfills and
reduced CO2 emissions and NOX emissions from combustion.
A minimisation of the demand for virgin materials entails reduction in the en-
ergy consumption to extract process and manufacture products. This reduction
in energy consumption leads to reduction of fossil fuel consumption and thus
reduction of emissions of CO2 and NOX.
There are examples of RM which have led to a 20 % reduction in overall waste
generation and a 65 % increase in recycling.
Market
opportunities
Environmental
benefits
Innovative Business Models with Environmental Benefits
20
.
Project framework Establishing a RM programme may entail initial investments. The way the
investments are split between the waste contractor and the customer must be
settled before the programme is set up.
What's new? Resource Management (RM) is a business model that is based on changing the
relationship between waste-generating organisations and their waste contrac-
tors. Traditional waste and recycling contracts feature "a profit incentive to
contractors to maximise disposal levels (hauls) and/or a limited scope of service
with multiple contractors handling separate waste streams or recyclables."
The compensation structure of a RM, on the other hand, can be organised in
such a way that the contractor has an incentive to help the customer make con-
tinuous improvements in resource efficiency. This can be ensured if the RM
contractor's profit margin improves by assisting the customer in decreasing
waste generation and increasing reuse and diversion.
This means a significant change of attitude by the contractor: Performance in-
stead of volume, resource efficiency instead of maximising waste and a strate-
gic alliance instead of a minimal interface.
Supplier's benefits The contract is based on a mutually beneficial business relationships that
encourages cost-efficient resource efficiency, recovers savings and opens up for
gain-sharing mechanisms.
The main benefit of the supplier is the shared gains. Another benefit is the pos-
sibility of building a partnership with the waste producer in a more and more
competitive market for waste handling.
Finally, RM gives the waste contractor a better access to the disposal proce-
dures at the waste producing companies which makes it possible to optimise the
sorting of the waste and raising the potential for recycling.
Customer's benefits RM gives the waste contractor incentives
to emphasise cost-effective resource effi-
ciency by preventing, recycling and re-
covering waste and by limiting the hauling
and disposal of waste.
When the contractor implements changes
that decreases costs on a permanent basis,
the contractor gets a share of the savings
gained, but the rest of the savings are real-
ised by the customer.
One year after implementing the RM
models at several of their production sites,
GM realised a 20 % reduction on overall
waste generation (30,000 ton) and a 65 %
increase in recycling (from 50,000 to over
82,000 tons). In addition to this the com-
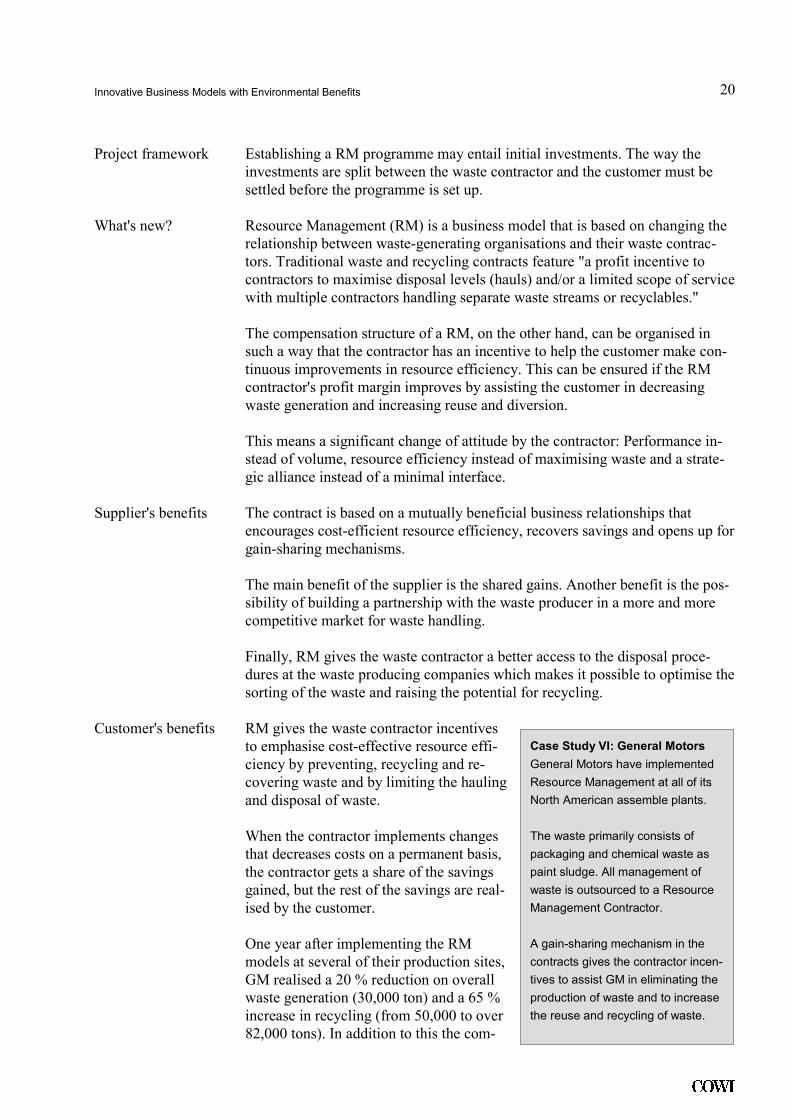
Case Study VI: General Motors
General Motors have implemented
Resource Management at all of its
North American assemble plants.
The waste primarily consists of
packaging and chemical waste as
paint sludge. All management of
waste is outsourced to a Resource
Management Contractor.
A gain-sharing mechanism in the
contracts gives the contractor incen-
tives to assist GM in eliminating the
production of waste and to increase
the reuse and recycling of waste.
Innovative Business Models with Environmental Benefits
21
.
pany had substantial reductions in the company's waste management costs (the
waste management costs were decreased 15-30 %).
RM is implemented in all of GM North America's manufacturing facilities,
where a single supplier manages all waste at each plant. By 2007 the RM pro-
gramme has here led to savings in the magnitude of US$ 6 million over the
previous three years.
RM does not need a lot of preconditions as it is a development of an existing
market.
The main barrier to RM is lack of knowledge of the opportunities and possible
results. In the US this has been dealt with by a non-profit organisation Waste-
Wise that promotes RM solutions and has assisted organisations in making fea-
sibility studies of potential savings by application of RM.
Studies of the potential for other US organisations show that the organisations
have a large potential for improving their waste minimisation and recycling of
waste and reducing their waste management costs.
The same potential is most likely found in Europe which makes RM a promis-
ing business model.
4.5 Remanufacturing
Remanufacturing is a strategy to bring used products back on the market. The
method is applied when a product that is considered "used" by one customer
can be made attractive to other customers with a relatively small effort. The
idea is to bring the product back to its original specification or modernise and
upgrade the product to new specifications.
Application Some of the examples of sectors with successful remanufacturing of consumer
durable goods are automotive parts, computers, laser toner cartridges, photo-
copiers, cleaning equipment, single-use cameras, refrigerators, washing ma-
chines, stoves and microwave ovens. This list shows that remanufacturing can
be applied to most products given the right setup.
A specific potential is products with failures that are covered by the warranty,
products that are harmed during transportation or products that have been
leased out.
Remanufacturing constitutes the potential for achieving environmental advan-
tages both upstream and downstream. Due to the reuse of products, upstream
entails less consumption of raw material, and downstream as less waste is pro-
duced.
Project framework The frameworks for remanufacturing differ substantially from one product to
another. They all include a need for a reverse logistic setup that gives the sup-
Essential
preconditions
Market
opportunities
Environmental
benefits
Innovative Business Models with Environmental Benefits
22
.
plier access to the used goods. Further, an efficient method for disassembling
and assessing if the parts are in good condition is needed.
What's new? Remanufacturing constitutes the potential for enhancing the opportunities of
recycling to better realise the value in used goods that are not worn out. The
business rationale of remanufacturing is to bring the products back to a stan-
dard where profit can be made on selling them.
This differs substantially from both other types of production as well from
other methods of recycling.
Supplier's benefits Remanufacturing gives the
suppliers a possibility to show a
green profile ensuring that all
value is extracted from there
products.
Further, the right setup can de-
liver very good economic re-
sults. In the case of ASML a
product that can be sold after
refurbishment at € 1.2 million is
bought back at € 400,000. €
400,000 is used to bring the sys-
tem up to the newest specifica-
tion and € 400,000 is the profit
ASML makes. By giving a war-
ranty on the remarketed prod-
ucts, ASML takes a risk, but
most components are the same
with known conditions.
Finally, remanufacturing con-
tains the option of changing the
audience of a product, e.g. alter-
ing production equipment when
they cannot meet the standards
of their initial purpose.
Customer's benefits The value proposition of remarketing is simple: When you no longer need the
equipment the supplier buys it back at a good price.
Further, remanufacturing can make complicated products (ASML systems)
more available and reduce the price of less complicated ones (single-use cam-
eras).
Remanufacturing is dependent on two preconditions in a company. First, the
production and distribution systems must make it possible to find and integrate
used products. Second, the incentives of sales persons and marketing efforts
must support the sale of remanufactured products.
Essential
preconditions
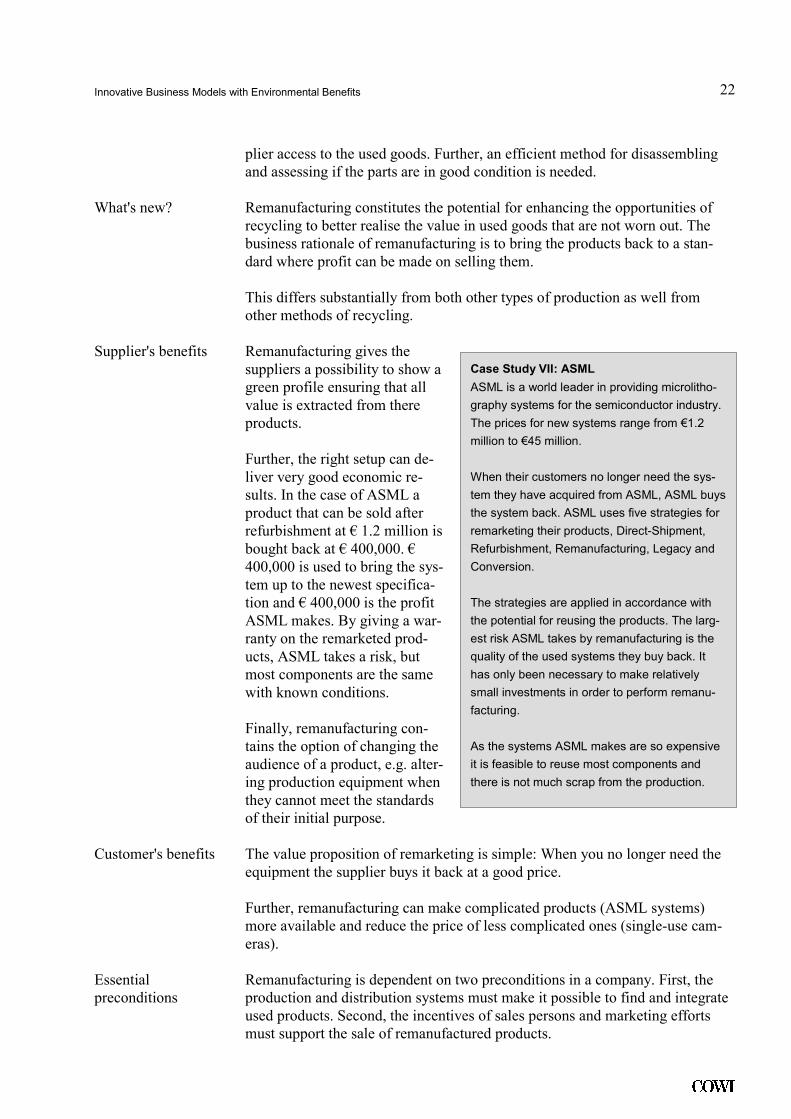
Case Study VII: ASML
ASML is a world leader in providing microlitho-
graphy systems for the semiconductor industry.
The prices for new systems range from €1.2
million to €45 million.
When their customers no longer need the sys-
tem they have acquired from ASML, ASML buys
the system back. ASML uses five strategies for
remarketing their products, Direct-Shipment,
Refurbishment, Remanufacturing, Legacy and
Conversion.
The strategies are applied in accordance with
the potential for reusing the products. The larg-
est risk ASML takes by remanufacturing is the
quality of the used systems they buy back. It
has only been necessary to make relatively
small investments in order to perform remanu-
facturing.
As the systems ASML makes are so expensive
it is feasible to reuse most components and
there is not much scrap from the production.
Innovative Business Models with Environmental Benefits
23
.
A more structural precondition is the possibility of establishing reverse logistics
to make it possible for a company to get the used product back in good shape
and at relatively low costs compared to the price of the product.
The case of Fuji Xerox is illustrative: In 1989, 5 % of the scrapped machines
were remanufactured. In 2005, Fuji Xerox had reached a recovery of 98 % of
the used products. This gives massive possibilities for reducing production cost
and maintaining good relations with costumers.
For many companies the essence of remanufacturing is a platform design mak-
ing it possible to change specific parts without discarding the entire product.
Electronic waste is growing at an annual rate of 3-5 % which is three times lar-
ger than the growth of general waste. This can be considered an opportunity
rather than a problem.
4.6 Car-sharing
Car-sharing is a model of car rental where the car can be rented for a short pe-
riod of time, often per hour. In many Car-sharing Organisations (CSOs) a
membership is a prerequisite for participating. To become a member an entry
deposit is paid. Moreover, on a monthly or yearly basis a membership fee is
paid, and costs for use of the vehicles are based on amount of time the vehicle
has been used and the mileage driven.
Application Car-sharing is applied to all kinds of
cars. Private customers are the main
target audience but successful CSOs
have spread the market to company
cars giving access to a diverse range
of deals.
The largest environmental benefits
from car-sharing are achieved through
shifts in the car-sharing customers’
mobility patterns. Car-sharers are far
more likely to combine use of a car
with public transportation than private
car-owners.
According to Swiss Mobility’s own
figures the result of their car-sharing
are yearly savings of 520,000 litre fuel
and a reduction of 1,458 ton CO2. In
2005, the fuel consumption of Mobil-
ity’s vehicles was 25 % lower than the
average for all Swiss cars.
If similar wins could be realised across Europe the result would be tremendous.
Market
opportunities
Environmental
benefits
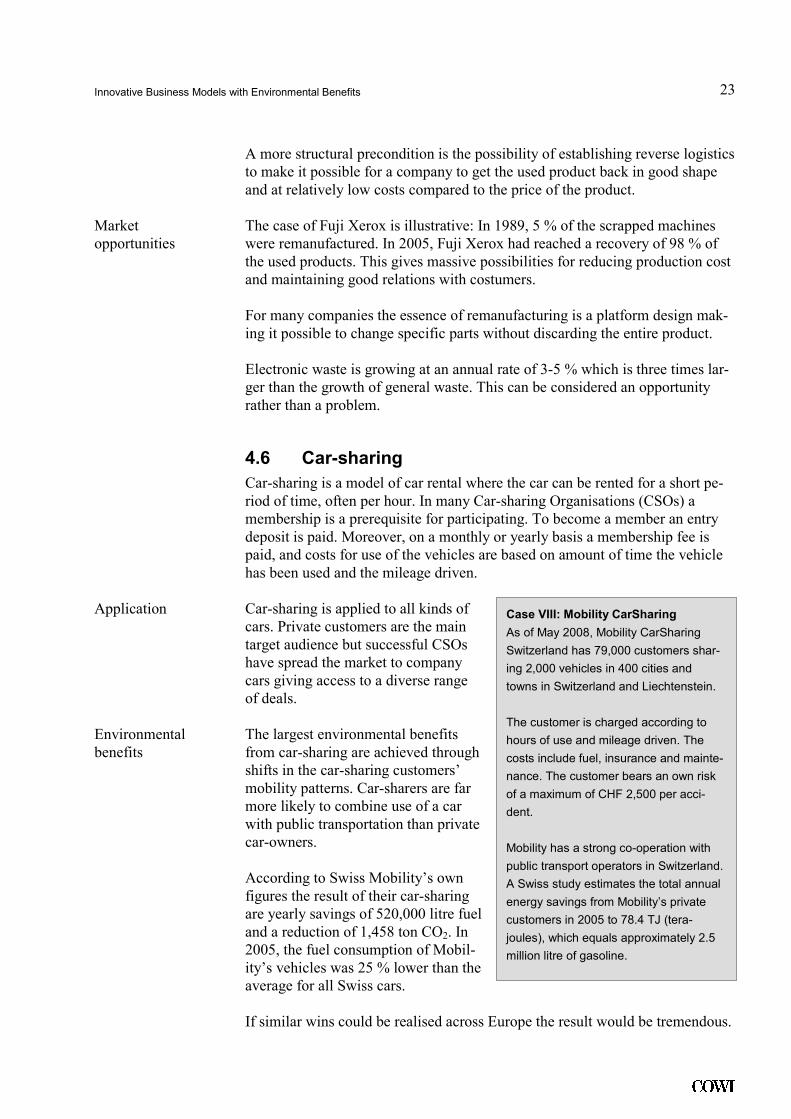
Case VIII: Mobility CarSharing
As of May 2008, Mobility CarSharing
Switzerland has 79,000 customers shar-
ing 2,000 vehicles in 400 cities and
towns in Switzerland and Liechtenstein.
The customer is charged according to
hours of use and mileage driven. The
costs include fuel, insurance and mainte-
nance. The customer bears an own risk
of a maximum of CHF 2,500 per acci-
dent.
Mobility has a strong co-operation with
public transport operators in Switzerland.
A Swiss study estimates the total annual
energy savings from Mobility’s private
customers in 2005 to 78.4 TJ (tera-
joules), which equals approximately 2.5
million litre of gasoline.
Innovative Business Models with Environmental Benefits
24
.
Project framework The contracts are based on paid memberships making the relation more binding
than ordinary car rental. The service of the CSO includes fuel, insurance, main-
tenance and cleaning.
All in all the focus is changed from the actual car to an easily accessible means
of transportation.
What's new? Car-sharing is a model of car rental that fills a hole in the market between
ordinary rental and actual ownership. The difference from ownership is that
that the customer has access to a pool of cars spread across the country/city in-
stead of having one vehicle parked outside the front door. The difference from
rental is that access is very easy and that the service is cheaper if the need for a
car is more than occasional and not permanent.
Supplier's benefits Many CSOs are private organisation that would not be in the business if it was
not for the environmental profile making the aim purely ideological.
For other CSOs being private rental companies car-sharing is an opportunity to
reach a group of customers that wants a green image or has needs that are not
met by ordinary ownership, lease or rental.
Customer's benefits The advantage to the customer of car-sharing is to gain the flexibility of cars in
terms of a means of transportation without having the costs and liabilities of
owning a car. By having access to a fleet of vehicles the type of vehicle can be
adjusted to match the customer's needs.
Successful systems are characterised by car stations which are located near the
customer’s residence (every 500 meters in Zurich) and minimal effort is used to
book the vehicle or to check in and out.
A “typical” CSO customer that uses public transportation for 75 % of her trips
and car-sharing for the remaining 25 % could, depending on the yearly distance
covered, make yearly savings in the magnitude of € 3,114 and € 1,552.
Car-sharing can often with advantage be combined with public transportation.
Many CSOs cooperate with public transportation providers, and many car sta-
tions (the places where the car is picked up and left) are located in connection
with public transportation, i.e. next to railway stations.
Together with access to parking lots the biggest barrier to car-sharing is the
popular attitude. In a recent survey only 5% of respondents in a German survey
were willing to share cars due to loss of personal status.
These barriers make it relevant for public authorities to help CSOs to establish
themselves by giving access to parking space, distributing information and be
forerunners in using car-sharing where relevant.
In Switzerland over 1 % of the population is member of Mobility. The potential
for car-sharing in Switzerland is estimated at 0.5 million persons. This corre-
sponds to approximately 6.7 % of the Swiss population. 1 % of the EU27 popu-
Essential
preconditions
Market
opportunities

Innovative Business Models with Environmental Benefits
25
.
lation is approximately 5 million people. Assuming that a similar percentage of
the population in the EU27 has the potential for being members of a car-sharing
organisation, the car-sharing potential is 33 million EU citizens.
Car transport accounts for a sizable majority of (inland) passenger transport in
the EU Member States. This suggests that in principle there is a large potential
market for car-sharing but it is unlikely that the general potential is as big as in
Switzerland.
Innovative Business Models with Environmental Benefits
26
.
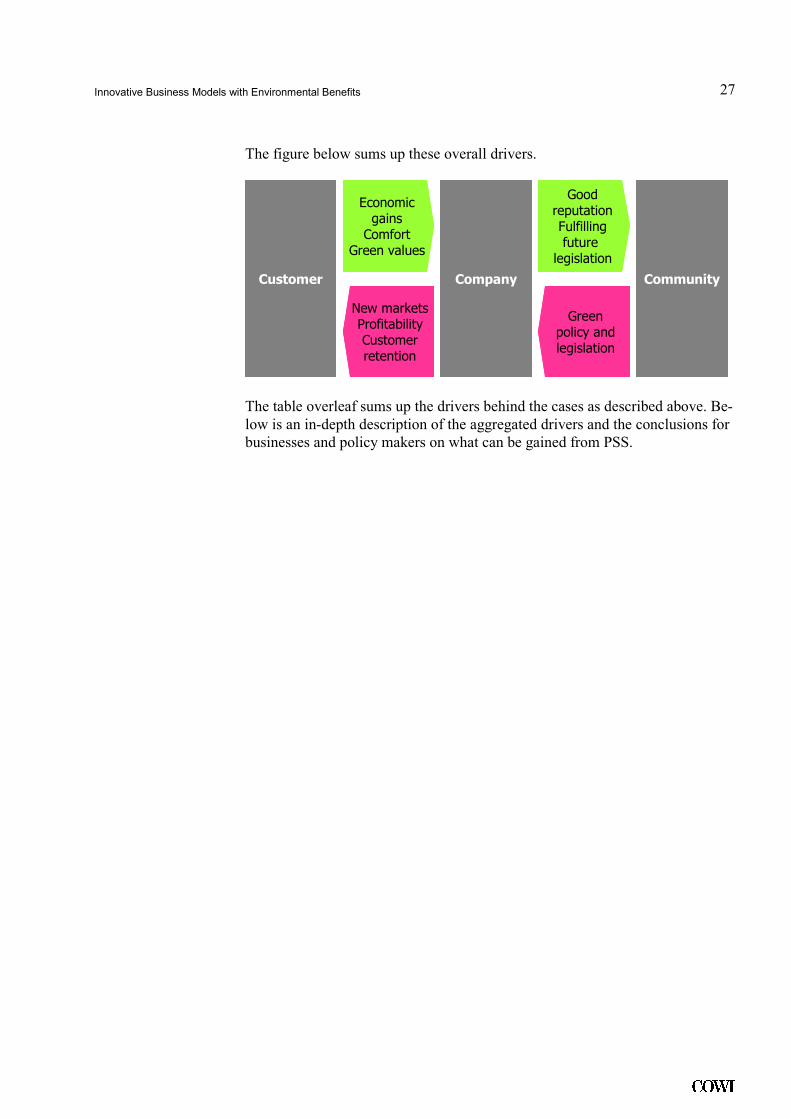
5 Drivers for PSS
As the above presentation of the various PSS models suggests they contain
promising benefits. Under the right circumstances and when implemented cor-
rectly, environmental as well as business benefits can be achieved. In order to
gain an overview of the promises of each business model, we can, in general
terms, distinguish between environmental benefits, business rationale and po-
litical attractiveness.
The models are brought to market by companies who expect commercial gains
from the models. The companies are acting in an environment, where both cus-
tomers and the political demands of the community play a crucial role.
The relation between the customers and the companies is driven by:
• The customers wish to reduce cost and risk and at the same time gain a
more comfortable relationship where they can focus on their core compe-
tences, further PSS can support a good reputation of doing green business.
• The companies on the other hand wish to enhance their markets into new
areas, raise profit by climbing the value chain and reduce their commercial
risk - primarily by making longer, broader deals with the customers focus-
ing on output instead of input.
The relation between the companies and the community is driven by:
• The wish of the community to implement green legislation and policy in
the most cost-efficient way. PSS offers environmental benefits at no cost
for the community.
• The companies wish to secure a good reputation. Environmentally-friendly
business models can be a way to take a calculated risk that future legisla-
tion will focus even more on environmental issues. This gives the compa-
nies who implement new business models a head start.
Innovative Business Models with Environmental Benefits
27
.
The figure below sums up these overall drivers.
Customer Company Community
EconomicgainsComfort
Green values
New marketsProfitabilityCustomerretention
GoodreputationFulfillingfuture legislation
Greenpolicy andlegislation
Customer Company Community
EconomicgainsComfort
Green values
New marketsProfitabilityCustomerretention
GoodreputationFulfillingfuture legislation
Greenpolicy andlegislation
The table overleaf sums up the drivers behind the cases as described above. Be-
low is an in-depth description of the aggregated drivers and the conclusions for
businesses and policy makers on what can be gained from PSS.
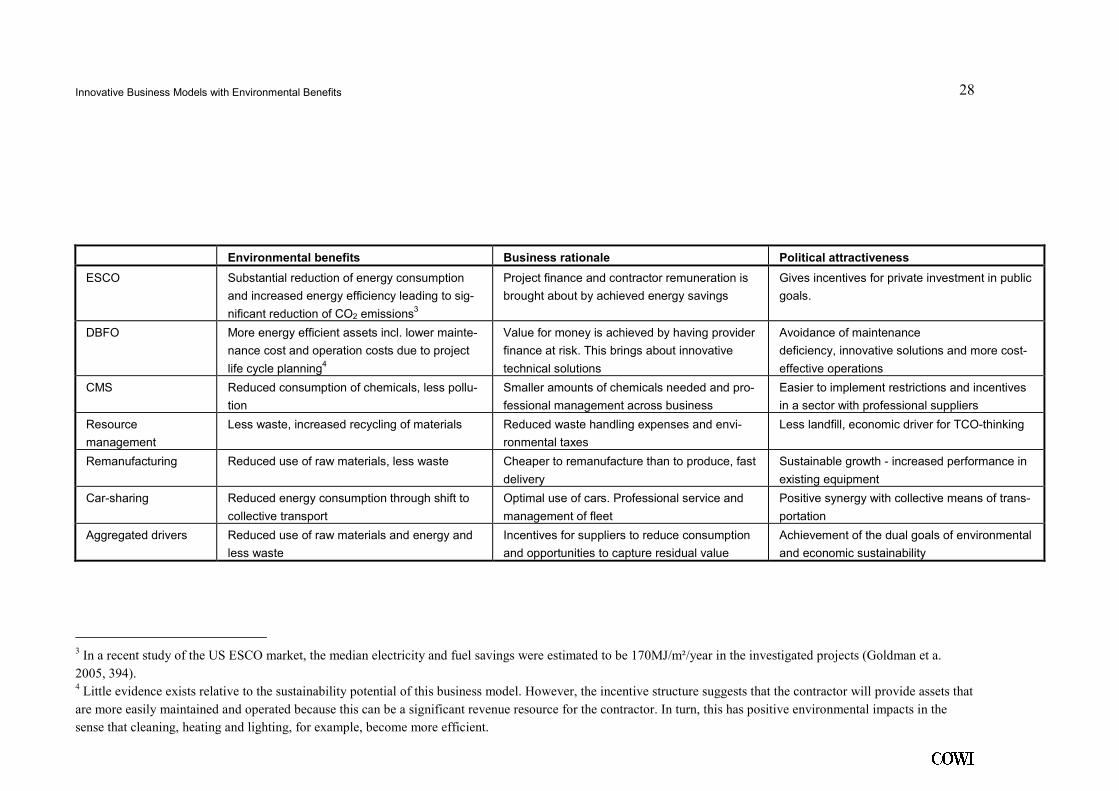
Innovative Business Models with Environmental Benefits 28
.
Environmental benefits Business rationale Political attractiveness
ESCO Substantial reduction of energy consumption
and increased energy efficiency leading to sig-
nificant reduction of CO2 emissions3
Project finance and contractor remuneration is
brought about by achieved energy savings
Gives incentives for private investment in public
goals.
DBFO More energy efficient assets incl. lower mainte-
nance cost and operation costs due to project
life cycle planning4
Value for money is achieved by having provider
finance at risk. This brings about innovative
technical solutions
Avoidance of maintenance
deficiency, innovative solutions and more cost-
effective operations
CMS Reduced consumption of chemicals, less pollu-
tion
Smaller amounts of chemicals needed and pro-
fessional management across business
Easier to implement restrictions and incentives
in a sector with professional suppliers
Resource
management
Less waste, increased recycling of materials Reduced waste handling expenses and envi-
ronmental taxes
Less landfill, economic driver for TCO-thinking
Remanufacturing Reduced use of raw materials, less waste Cheaper to remanufacture than to produce, fast
delivery
Sustainable growth - increased performance in
existing equipment
Car-sharing Reduced energy consumption through shift to
collective transport
Optimal use of cars. Professional service and
management of fleet
Positive synergy with collective means of trans-
portation
Aggregated drivers Reduced use of raw materials and energy and
less waste
Incentives for suppliers to reduce consumption
and opportunities to capture residual value
Achievement of the dual goals of environmental
and economic sustainability
3 In a recent study of the US ESCO market, the median electricity and fuel savings were estimated to be 170MJ/m²/year in the investigated projects (Goldman et a.
2005, 394). 4 Little evidence exists relative to the sustainability potential of this business model. However, the incentive structure suggests that the contractor will provide assets that
are more easily maintained and operated because this can be a significant revenue resource for the contractor. In turn, this has positive environmental impacts in the
sense that cleaning, heating and lighting, for example, become more efficient.
Innovative Business Models with Environmental Benefits
29
.
5.1 Environmental benefits
All six models seem to promise positive environmental effects. The different
models focus on different sectors but they all build on the same overall ration-
ale: Reduce the input in the form of raw material and energy and reduce the
output in the form of waste.
The incentives to change behaviour differ between the models. For ESCO,
DBFO and CMS the incentive is handled by the supplier through a contractual
setup. ESCO reduces energy use, DBFO optimises lifetime costs and CMS re-
duces the use of chemicals.
The cases show that ESCO and CMS in particular promise to bring about sub-
stantial environmental benefits. ESCOs can reduce energy consumption by
170MJ/m2/year and potentially reduce national CO2 emissions by 10% given
the right framework. CMS can halve the use of chemicals and give incentives
to reduce harmful ingredients.
In resource management and remanufacturing the incentives rest with both the
producer, the waste handling company (sometimes the same) and the customer.
The potential is not as clear as in ESCO and CMS, but there are examples of
resource management which has led to a 20 % reduction in overall waste gen-
eration and a 65 % increase in recycling.
In car sharing it is the customer who has the incentive to reduce the use of en-
ergy and the incentive seems to be effective. Studies show that shared cars con-
sume 25% less fuel and can interact in a successful way with public transporta-
tion.
These results show that the environmental perspective in promoting PSS is sub-
stantial and can be an essential part of greening the economy of companies as
well as countries.
5.2 Business rationale
The business rationale of ESCO, DBFO, CMS and RM is related and the com-
pensation mechanisms for these four business models are similar. The funda-
mental idea is that a shift in the traditional business relationship between sup-
plier and customer takes place.
Instead of making profit by selling a volume of products the supplier/provider
offers a function where they provide the product and manage the application of
products more efficiently. There is thus a significant change in incentive struc-
tures making it possible for suppliers to create value by using their insight into
the functionality of their products.
Further the successful cases show that products often contain an unrealised po-
tential that is only released, when the supplier gets the responsibility of the
functional result.
Innovative Business Models with Environmental Benefits
30
.
The business models of remanufacturing and car-sharing are fundamentally
different. The business rationale behind remanufacturing is to capture the resid-
ual value of used products. The business rationale in car-sharing is to organise
car-based mobility in a way that meets the needs of customers with a green pro-
file and customers who are not satisfied with owning, leasing or renting cars.
Car-sharing has the special feature that a lot of the operators are small, semi-
commercial organisations with more focus on the environment than the busi-
ness.
Across all the cases four themes are significant:
• Capturing the potential: PSS projects changes the scope of the supplier.
Instead of focusing on the product, the deals focus on the outcome from
the combination of product and service. This combination gives the sup-
plier the opportunity to use their specialised knowledge about the use of
the product to realise a potential that is not realised in ordinary contracts.
This means that the supplier of e.g. chemicals or energy-consuming sys-
tems can capitalise the full capability of their product and know-how to
improve their business case and reduce prices at the same time.
• Incentives: All the cases are based on creating new incentives for the part-
ners. The provider in many cases gains an incentive for a lifetime perspec-
tive on investments, and both receiver and provider get an incentive to re-
duce the use of material or energy in production and use. Both incentives
bring down the operating costs. These savings are split through different
kinds of contractual regulations to make both partners benefit economi-
cally.
• Risk management: In ESCO, DBFO, CMS and RM the compensation
mechanisms that the contract is based on are decisive for the sharing of
risk. It is an additional source of income for the provider in these agree-
ments to be able to handle risk better than the partner could do by himself.
This ability to control risk is closely linked with the aforementioned poten-
tial and incentives leading to new and better solutions.
• Reputation: Most of the cases are primarily based on ways to make profit,
where the environmental advantage is a positive side effect. A better repu-
tation for the partners is only mentioned directly in relation to car-sharing
and one of the types of ESCO, whereas the other cases carry the potential
of capitalising the reputation of the costumers. The example with the Novo
Nordisk - DONG Energy partnership shows that reputation can be a very
important driver, potentially leading to massive investments and strong
business relations.
The cases show, that the economic results are very positive. Many projects real-
ise annual wins of 20% or more that can be split between the supplier and the
customer.
Innovative Business Models with Environmental Benefits
31
.
Moreover, the cases show that a successful PSS-supplier can be in a very com-
fortable position with strong client relations, secure business and opportunities
as well as incentives to develop even stronger solutions and concepts.
The decision to invest in PSS is a balance between the need to be in sync with
the market - and not in front of it - and still be the one to offer the new and bet-
ter business models before the competitors.
By changing focus from traditional sale of the product to PSS, the company
gives up the power position of knowing more about the product and trades it for
a more valuable place in the value chain. This shift is not risk free and should
be based on a solid business case.
A major consideration in building such a business case is the development in
the political agenda. Will the future be better or worse for the business case of a
PSS? And what is the right timing in going to market?
5.3 Political attractiveness
As political decisions and agendas are very important to businesses who may
consider PSS there is a substantial responsibility in developing PSS which rests
with the policy makers.
As shown in section 5.1 PSS can deliver great value in realising environmental
goals including:
• Energy efficiency (ESCO, DBFO, Car-sharing)
• Sustainable growth (remanufacturing)
• Total Cost of Operation approach (all models in general and RM in par-
ticular)
Policy makers can achieve greater policy results by using policy tools with lev-
erage to get a private effort going. Compared to a national budget the gains for
the involved parties in the models are modest and often related to minor parts
of a business' operations or the budget of a household. But the aggregated po-
tential of the models is enormous making it possible to reduce CO2 and NOX
emissions substantially and reduce the use of raw materials and the production
of waste on a scale that can realise national environmental policy.
To reach these opportunities policy makers could implement the following ini-
tiatives supporting each of the six models:
• ESCO: Not subsidise energy prices and give public authorities access to
energy-saving investment. Further: Make it possible to register and meas-
ure individual companies' investments in green energy.
Innovative Business Models with Environmental Benefits
32
.
• DBFO: Put in place legislation that deals with legal barriers relating to
procurement, tax and financial management and promote the use of DBFO
actively.
• CMS: Spread the knowledge about CMS and make official statistics about
the achieved results to make the business case more accessible to compa-
nies.
• RM: Spread the knowledge about RM and make official statistics about the
achieved results to make the business case more accessible to companies.
Raise incentives to RM by making waste production more expensive.
• Remanufacturing: Raise incentives to remanufacture by making waste pro-
duction more expensive and open up public opportunities for reverse logis-
tics. Be a forerunner in buying remanufactured products.
• Car-sharing: Make parking space accessible in the right places, facilitate
cooperation with public transportation agencies and be a forerunner in buy-
ing car-sharing services, and provide discounts on road toll and parking
fees for car-sharing vehicles.
Innovative Business Models with Environmental Benefits
33
.
6 Market possibilities
This chapter is an estimation of the possible market for PSS. For each of the
models we ask two questions:
• Does it have potential to spread further in the analysed sector - e.g. to other
countries?
• Does it have potential to spread to other sectors?
There is no statistics available about the actual spread of PSS. The reason is
that PSS models are not often recognised as such and it is still an area in its
early development. Moreover, it is also difficult to acquire statistics on PSS
because this label covers a broad variety of different business models. Further
the six PSS models reviewed in the table below are also relatively open-ended.
Moreover, it should also be noted that the estimations below are uncertain in
the sense that little accurate statistics exist and therefore much relies on estima-
tion and judgements. These methodological caveats should be kept in mind
when reading the table below.
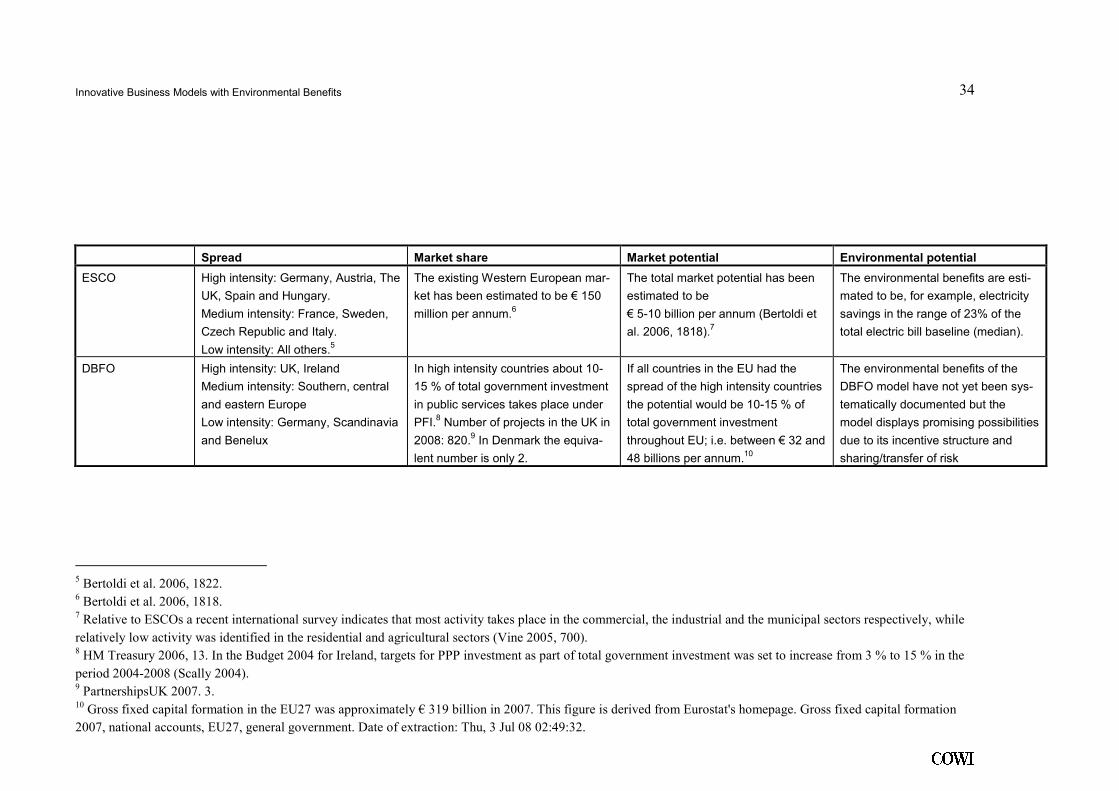
Innovative Business Models with Environmental Benefits 34
.
Spread Market share Market potential Environmental potential
ESCO High intensity: Germany, Austria, The
UK, Spain and Hungary.
Medium intensity: France, Sweden,
Czech Republic and Italy.
Low intensity: All others.5
The existing Western European mar-
ket has been estimated to be € 150
million per annum.6
The total market potential has been
estimated to be
€ 5-10 billion per annum (Bertoldi et
al. 2006, 1818).7
The environmental benefits are esti-
mated to be, for example, electricity
savings in the range of 23% of the
total electric bill baseline (median).
DBFO High intensity: UK, Ireland
Medium intensity: Southern, central
and eastern Europe
Low intensity: Germany, Scandinavia
and Benelux
In high intensity countries about 10-
15 % of total government investment
in public services takes place under
PFI.8 Number of projects in the UK in
2008: 820.9 In Denmark the equiva-
lent number is only 2.
If all countries in the EU had the
spread of the high intensity countries
the potential would be 10-15 % of
total government investment
throughout EU; i.e. between € 32 and
48 billions per annum.10
The environmental benefits of the
DBFO model have not yet been sys-
tematically documented but the
model displays promising possibilities
due to its incentive structure and
sharing/transfer of risk
5 Bertoldi et al. 2006, 1822. 6 Bertoldi et al. 2006, 1818. 7 Relative to ESCOs a recent international survey indicates that most activity takes place in the commercial, the industrial and the municipal sectors respectively, while
relatively low activity was identified in the residential and agricultural sectors (Vine 2005, 700). 8 HM Treasury 2006, 13. In the Budget 2004 for Ireland, targets for PPP investment as part of total government investment was set to increase from 3 % to 15 % in the
period 2004-2008 (Scally 2004). 9 PartnershipsUK 2007. 3. 10 Gross fixed capital formation in the EU27 was approximately € 319 billion in 2007. This figure is derived from Eurostat's homepage. Gross fixed capital formation
2007, national accounts, EU27, general government. Date of extraction: Thu, 3 Jul 08 02:49:32.
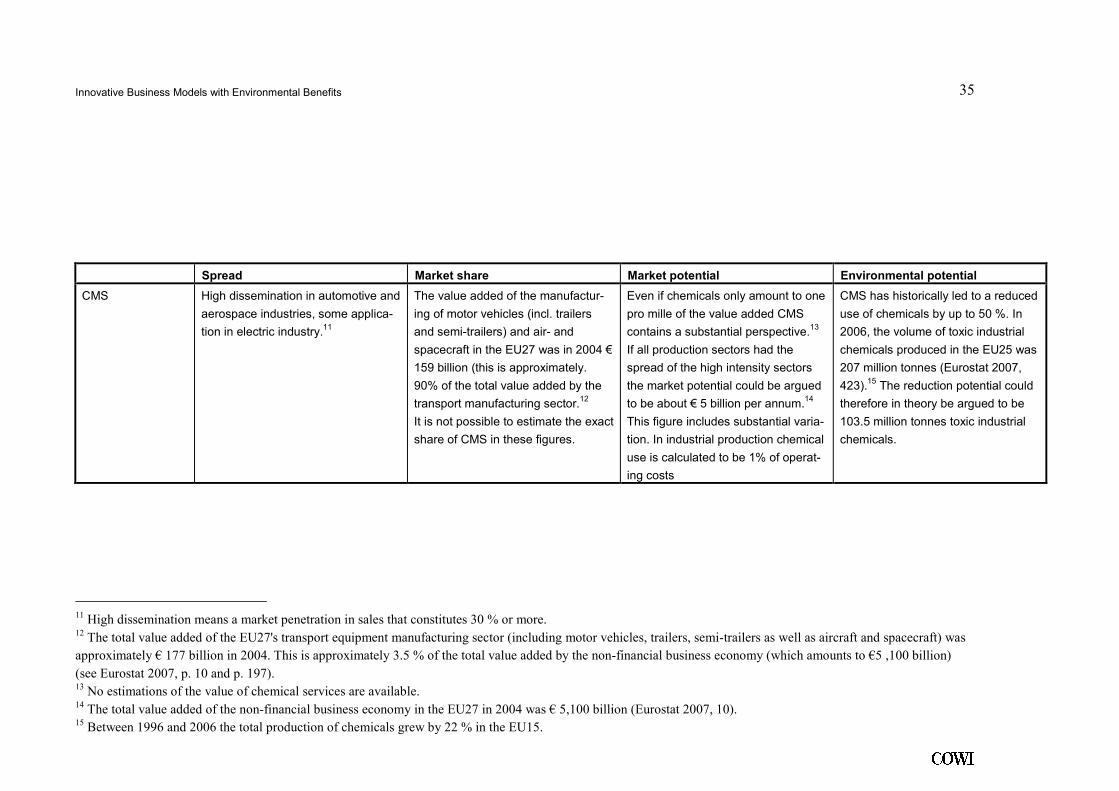
Innovative Business Models with Environmental Benefits 35
.
Spread Market share Market potential Environmental potential
CMS High dissemination in automotive and
aerospace industries, some applica-
tion in electric industry.11
The value added of the manufactur-
ing of motor vehicles (incl. trailers
and semi-trailers) and air- and
spacecraft in the EU27 was in 2004 €
159 billion (this is approximately.
90% of the total value added by the
transport manufacturing sector.12
It is not possible to estimate the exact
share of CMS in these figures.
Even if chemicals only amount to one
pro mille of the value added CMS
contains a substantial perspective.13
If all production sectors had the
spread of the high intensity sectors
the market potential could be argued
to be about € 5 billion per annum.14
This figure includes substantial varia-
tion. In industrial production chemical
use is calculated to be 1% of operat-
ing costs
CMS has historically led to a reduced
use of chemicals by up to 50 %. In
2006, the volume of toxic industrial
chemicals produced in the EU25 was
207 million tonnes (Eurostat 2007,
423).15 The reduction potential could
therefore in theory be argued to be
103.5 million tonnes toxic industrial
chemicals.
11 High dissemination means a market penetration in sales that constitutes 30 % or more.
12 The total value added of the EU27's transport equipment manufacturing sector (including motor vehicles, trailers, semi-trailers as well as aircraft and spacecraft) was
approximately € 177 billion in 2004. This is approximately 3.5 % of the total value added by the non-financial business economy (which amounts to €5 ,100 billion)
(see Eurostat 2007, p. 10 and p. 197). 13 No estimations of the value of chemical services are available.
14 The total value added of the non-financial business economy in the EU27 in 2004 was € 5,100 billion (Eurostat 2007, 10).
15 Between 1996 and 2006 the total production of chemicals grew by 22 % in the EU15.
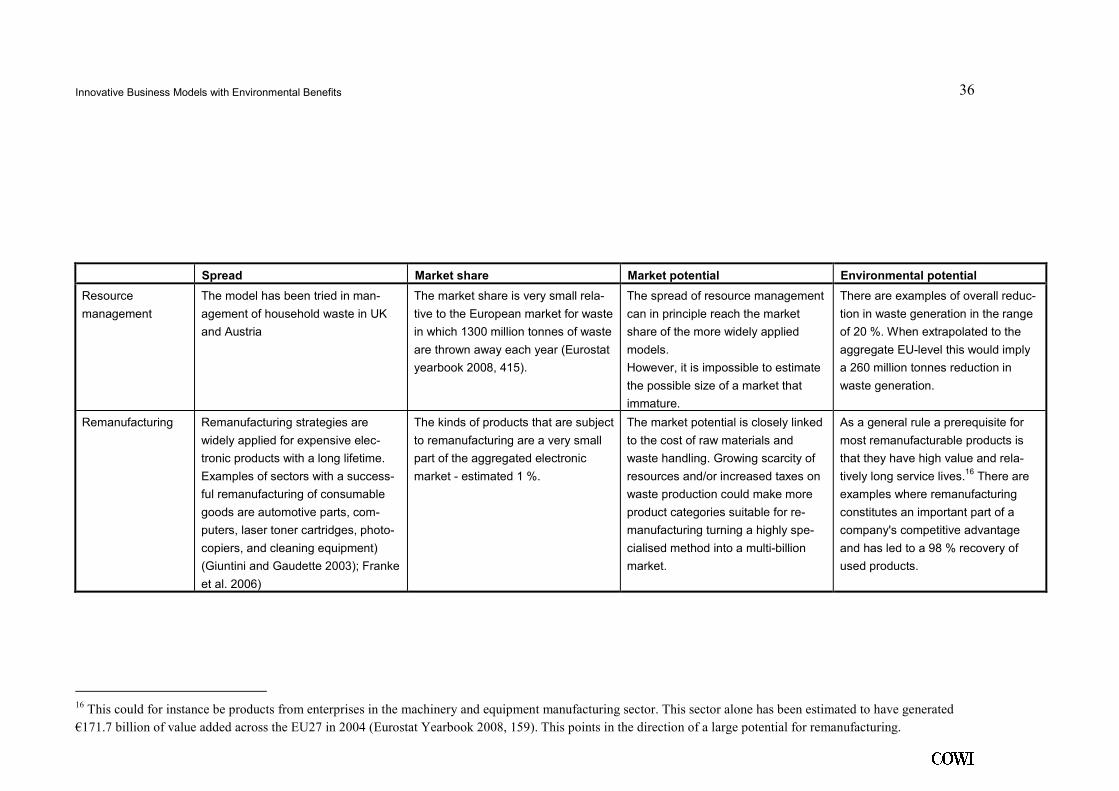
Innovative Business Models with Environmental Benefits 36
.
Spread Market share Market potential Environmental potential
Resource
management
The model has been tried in man-
agement of household waste in UK
and Austria
The market share is very small rela-
tive to the European market for waste
in which 1300 million tonnes of waste
are thrown away each year (Eurostat
yearbook 2008, 415).
The spread of resource management
can in principle reach the market
share of the more widely applied
models.
However, it is impossible to estimate
the possible size of a market that
immature.
There are examples of overall reduc-
tion in waste generation in the range
of 20 %. When extrapolated to the
aggregate EU-level this would imply
a 260 million tonnes reduction in
waste generation.
Remanufacturing Remanufacturing strategies are
widely applied for expensive elec-
tronic products with a long lifetime.
Examples of sectors with a success-
ful remanufacturing of consumable
goods are automotive parts, com-
puters, laser toner cartridges, photo-
copiers, and cleaning equipment)
(Giuntini and Gaudette 2003); Franke
et al. 2006)
The kinds of products that are subject
to remanufacturing are a very small
part of the aggregated electronic
market - estimated 1 %.
The market potential is closely linked
to the cost of raw materials and
waste handling. Growing scarcity of
resources and/or increased taxes on
waste production could make more
product categories suitable for re-
manufacturing turning a highly spe-
cialised method into a multi-billion
market.
As a general rule a prerequisite for
most remanufacturable products is
that they have high value and rela-
tively long service lives.16 There are
examples where remanufacturing
constitutes an important part of a
company's competitive advantage
and has led to a 98 % recovery of
used products.
16 This could for instance be products from enterprises in the machinery and equipment manufacturing sector. This sector alone has been estimated to have generated
€171.7 billion of value added across the EU27 in 2004 (Eurostat Yearbook 2008, 159). This points in the direction of a large potential for remanufacturing.
Innovative Business Models with Environmental Benefits 37
.
Spread Market share Market potential Environmental potential
Car sharing The model exists in all of Europe but
the popularity varies.
About 1 % of the Swiss population
are members. In most European
countries it is about 0.1 %. This mar-
ket share is very low when consider-
ing that in 2004, 82.8 % of all inland
passenger km were related to pas-
senger cars (Eurostat Yearbook
2008, 380).
If all European countries had a 1 %
car-sharing this would imply that ap-
proximately 5 million EU citizens
would be members of a car-sharing
arrangement.
Need for parking lots is reduced.
More energy efficient car types.
Change in mobility patterns (car-
shares are more liable to combine
with public transportation). In a Swiss
study, energy savings from one car-
sharing service (which has around
79,000 customers) was estimated to
be 78.4 terajoules.
Aggregated
evaluation
For most of the PSS models studied
here, we see that relative to conven-
tional business models their dissemi-
nation is limited with substantial local
variation across sectors as well as
countries.
The addressed models only consti-
tute a minor part of the market.
Based on the mere size of the gen-
eral markets and the dissemination in
the most successful PSS markets,
the analysed business models have a
multi-billion Euro market potential.
Under the right circumstances and
when implemented properly the
models surveyed here do seem to
contain a very positive and promising
environmental potential reducing the
consumption of energy and raw ma-
terial as well as reducing waste.
Innovative Business Models with Environmental Benefits
38
.
Even though uncertain the analysis shows that potential for PSS is quite big.
Some of the models - ESCO, DBFO and CMS - already show a business poten-
tial of several billion Euros each.
Further, some of the less widely applied models - like Resource Management
and Remanufacturing - have shown great successes outside Europe that are yet
to be learned from.
Finally, car-sharing has a substantial unfulfilled potential that can be accentu-
ated if the market focus shifts from individual cities and smaller regions to
large cross-national networks with high intensity in densely populated areas.
The market potential is supported by substantial possibilities of realising envi-
ronmental savings that can raise the opportunities of realising intangible value
from the business models as both suppliers and customers act green when bas-
ing the cooperation on a PSS.
To sum up, the analysis of the market potential shows that the opportunities of
doing good business and better the environment at the same time are great.
Innovative Business Models with Environmental Benefits
39
.
7 Realising PSS
The above chapters showed that the spread of PSS is limited even though the
potential market, value generation and environmental benefits are substantial.
This makes it relevant to investigate what barriers PSS models face and how
the successful models have coped with the barriers.
7.1 Barriers to PSS
The case studies point out eight different barriers that are relevant for all the
projects. The eight barriers can be divided into two groups: Five of them are
general barriers to innovation that also apply to all kinds of new ideas, three of
them are more specific barriers, that are of particular relevance to environmen-
tally-friendly business models.
The five relevant innovation barriers are:
• Lack of trust between customer and supplier: A key to innovative co-
operation is a good business relationship based on mutual trust. This is a
key issue in alliance and partnership research and has also been identified
as an issue in a recent report/ overview of the ESCO market (EFP 2007).
• New risk: New models carry new risks – to which people are often more
risk averse than more familiar risks. They are an issue for companies, cus-
tomers and financial institutions alike. The risks can be different for the
three parties but one thing they have in common is that they are unknown.
There is no experience with calculating or handling the risks and therefore
they might be perceived as bigger than they are. DBFOs are good exam-
ples as they involve a large transfer of risk to the supplier raising the ques-
tion: Can they deliver? The logic of the model is that private finance is a
firmer hand than public management, but the insecurity lingers until the
project is fully functional.
• Need of common vision: Cooperation needs a common vision: What is it
good for? A common vision can be hard to reach between partners who
used to have clearly separated roles. This is particularly relevant in re-
source management and CMS which both imply that a subcontractor that is
usually quite invisible is suddenly ion the strategic agenda.
Innovative Business Models with Environmental Benefits
40
.
• Inertia: An often acknowledged barrier to innovation is the inertia in
rules, traditions and ways of doing things. A good example is car-sharing
which needs a lot of infrastructure of public partners to be successful. Pub-
lic inertia has been a major obstacle to realising this model.
• Transaction costs: It will often be expensive to make the transition from
one business model to another. Further, the complexity of the business
deals (this is particularly the case vis-à-vis DBFO) also incurs transaction
costs.
The three other barriers that are specific to new business models with environ-
mental benefits are:
• Uncertain incentives: The models are driven by their functional result, but
it can be hard to measure the achievements of the models, and often the in-
centives are linked to a policy or market price that might change. The re-
wards of all the models are influenced by public rules for example, the re-
lation is very clear for ESCOs, as the feasibility of the model is closely re-
lated to the price of energy which is partly dependent on public regulation.
The rewards from environmental savings often depend on the public policy
on putting a price on environmental harm.
• Lack of knowledge: It is not all companies who know the possibilities
open to them and if they do, they know more about the environmental per-
spectives than the commercial ones. This barrier is of particular relevance
because PSS models are quite complex relative to other ways of doing
business, so require some knowledge to consider the opportunities.
• New infrastructure: Many of these environmentally-friendly models need
a new infrastructure to make it possible to do business. This brings up
transaction costs at a systemic level. The best example of this barrier is the
need for reverse supply chain, disassembly methods and screening proce-
dures in remanufacturing.
7.2 Overcoming the barriers
The analysed cases have one thing in common: they have the potential to over-
come the barriers. This section will focus on how they did it and what others
can learn from their experiences.
The table overleaf sums up the ways the cases have overcome the barriers and
are the foundation of a more generic approach to realising PSS.
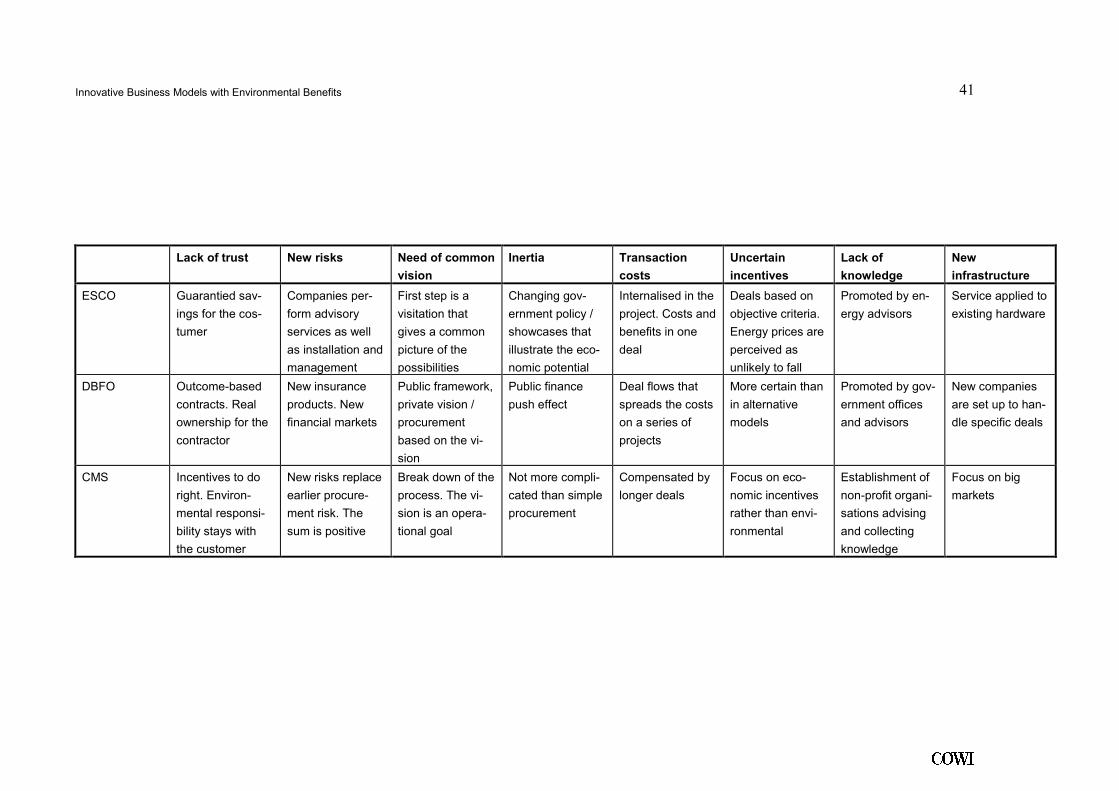
Innovative Business Models with Environmental Benefits 41
.
Lack of trust New risks Need of common
vision
Inertia Transaction
costs
Uncertain
incentives
Lack of
knowledge
New
infrastructure
ESCO Guarantied sav-
ings for the cos-
tumer
Companies per-
form advisory
services as well
as installation and
management
First step is a
visitation that
gives a common
picture of the
possibilities
Changing gov-
ernment policy /
showcases that
illustrate the eco-
nomic potential
Internalised in the
project. Costs and
benefits in one
deal
Deals based on
objective criteria.
Energy prices are
perceived as
unlikely to fall
Promoted by en-
ergy advisors
Service applied to
existing hardware
DBFO Outcome-based
contracts. Real
ownership for the
contractor
New insurance
products. New
financial markets
Public framework,
private vision /
procurement
based on the vi-
sion
Public finance
push effect
Deal flows that
spreads the costs
on a series of
projects
More certain than
in alternative
models
Promoted by gov-
ernment offices
and advisors
New companies
are set up to han-
dle specific deals
CMS Incentives to do
right. Environ-
mental responsi-
bility stays with
the customer
New risks replace
earlier procure-
ment risk. The
sum is positive
Break down of the
process. The vi-
sion is an opera-
tional goal
Not more compli-
cated than simple
procurement
Compensated by
longer deals
Focus on eco-
nomic incentives
rather than envi-
ronmental
Establishment of
non-profit organi-
sations advising
and collecting
knowledge
Focus on big
markets
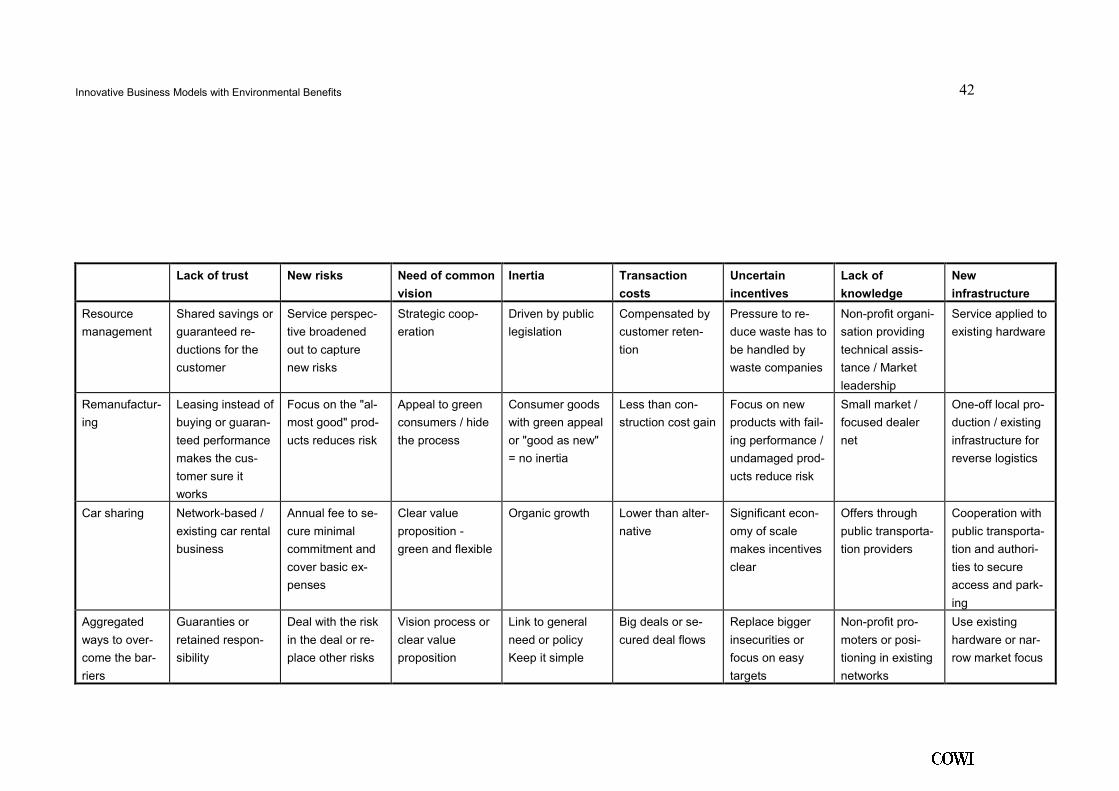
Innovative Business Models with Environmental Benefits 42
.
Lack of trust New risks Need of common
vision
Inertia Transaction
costs
Uncertain
incentives
Lack of
knowledge
New
infrastructure
Resource
management
Shared savings or
guaranteed re-
ductions for the
customer
Service perspec-
tive broadened
out to capture
new risks
Strategic coop-
eration
Driven by public
legislation
Compensated by
customer reten-
tion
Pressure to re-
duce waste has to
be handled by
waste companies
Non-profit organi-
sation providing
technical assis-
tance / Market
leadership
Service applied to
existing hardware
Remanufactur-
ing
Leasing instead of
buying or guaran-
teed performance
makes the cus-
tomer sure it
works
Focus on the "al-
most good" prod-
ucts reduces risk
Appeal to green
consumers / hide
the process
Consumer goods
with green appeal
or "good as new"
= no inertia
Less than con-
struction cost gain
Focus on new
products with fail-
ing performance /
undamaged prod-
ucts reduce risk
Small market /
focused dealer
net
One-off local pro-
duction / existing
infrastructure for
reverse logistics
Car sharing Network-based /
existing car rental
business
Annual fee to se-
cure minimal
commitment and
cover basic ex-
penses
Clear value
proposition -
green and flexible
Organic growth Lower than alter-
native
Significant econ-
omy of scale
makes incentives
clear
Offers through
public transporta-
tion providers
Cooperation with
public transporta-
tion and authori-
ties to secure
access and park-
ing
Aggregated
ways to over-
come the bar-
riers
Guaranties or
retained respon-
sibility
Deal with the risk
in the deal or re-
place other risks
Vision process or
clear value
proposition
Link to general
need or policy
Keep it simple
Big deals or se-
cured deal flows
Replace bigger
insecurities or
focus on easy
targets
Non-profit pro-
moters or posi-
tioning in existing
networks
Use existing
hardware or nar-
row market focus
Innovative Business Models with Environmental Benefits
43
.
The table shows that for each barrier there are at least two different ways to deal with them. Often these ways are alternative routes, but in some cases they can be applied simultaneously - sometimes by different actors.
The premise for this part of the analysis is that both companies and policy-makers can have tasks to fulfil to broaden the road to PSS.
• Lack of trust: Customers generally tend to do business with partners they trust or products they know. If you want to sell a new concept - maybe even to a new customer - trust can build by guaranteeing contractually that the promised savings are realised. To be sure to deliver the guaranteed functionality it may be attractive to take on tasks that are normally per-formed by the customer. These tasks can include operations, management and disposal.
• New risk: A related issue is that new concepts carry new risks for both supplier and customer. To make the deals attractive the supplier can choose to take on more risk than in an ordinary deal (see guarantees above) or design the system to replace other more threatening risks for the cus-tomer. E.g. a new performance risk "does the supplier have the manage-ment expertise needed?" can replace a market risk "is the product available at the right price and quality later on?" Suppliers can compare potential benefits, examine successful models and consider their own risk mitigation strategies.
• Need of common vision: The more the business relation is based on a partnership approach, the greater is the need for a common vision. Suc-cessful PSS-suppliers either offer a stringent and easily implemented vi-sion process, or have a value proposition that is so clear and obvious that the need for the new business model replace the need for a unique common vision. The latter is the easiest - but not always possible to a sufficient de-gree.
• Inertia: Change takes some time and effort to happen and sometimes in-volve changed a regulation and/or policy. To shorten the lead time compa-nies can create publicly available business cases or political cases stating how the business model fulfils the needs or policy of customers and pol-icy-makers. Further, it is a successful strategy to start out with a business model as simple as possible - even sacrificing smaller gains that can be re-alised in later transactions, when the market has got used to the new model.
• Transaction costs: Another reason to focus on simplicity is that complex deals are expensive to implement. An extreme case is DBFO where trans-action costs make deals smaller than € 20 million unviable. Some com-plexity is needed in PSS so the companies must focus on setting up big deals with big partners or secure a deal flow through agreements with pub-lic or private organisations.
• Uncertain incentives: PSS is often heavily linked to political issues as taxes and sector regulation. This makes the incentives uncertain because
Innovative Business Models with Environmental Benefits
44
.
policy can change. A successful PSS must structure the system to capture even bigger uncertainties. E.g. it may be uncertain what the exact prices and taxes on waste handling will be in the future, but a long deal reduces uncertainty related to the demand for waste services - and that is an attrac-tive swop. Another way to deal with the uncertain incentives is to go for the easy targets. E.g. many CMS and ESCO deals only capture the short-term wins and not the more uncertain long-term ones.
• Lack of knowledge: It is hard to communicate the complex PSS-deals. Companies can create a business case, as described above in relation to in-ertia, to show the positive effects or to position the PSS-model in existing networks. E.g. ESCOs are promoted by energy advisors, Car-sharing can be promoted by public transportation companies.
• New infrastructure: It may need a big change to realise a new way of do-ing business. To limit investment and risk, successful PSS-companies use existing networks in different ways (e.g. supermarkets collect single-use cameras) or focus on narrow market segments - at least in the beginning (today CMS is almost limited to big companies in big countries).
The figure below sums up the barriers and the way successful PSSs have han-dled them.
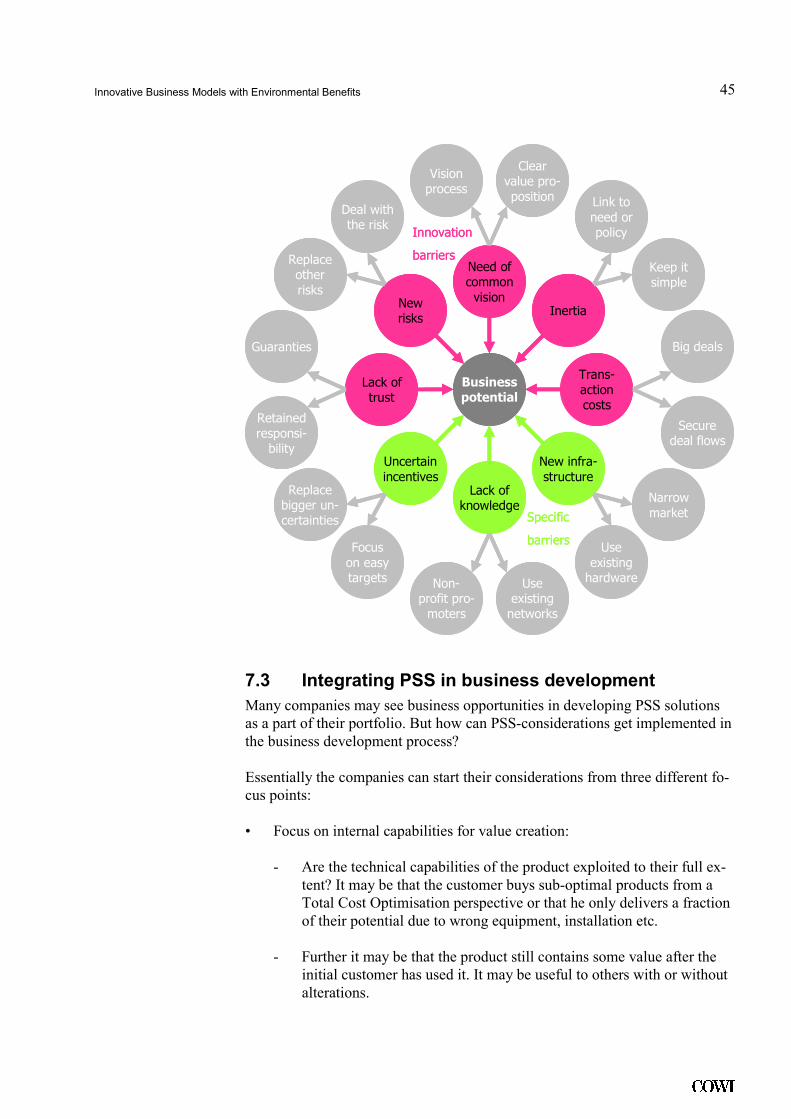
Innovative Business Models with Environmental Benefits
45
.
Businesspotential
Need ofcommonvision
Uncertainincentives
New infra-structure
Lack ofknowledge
Lack oftrust
Newrisks
Inertia
Trans-actioncosts
Specific
barriers
Innovation
barriers
Non-profit pro-moters
Clearvalue pro-position
Visionprocess
Deal withthe risk
Link toneed orpolicy
Keep itsimple
Replaceotherrisks
Big deals
Securedeal flows
Narrowmarket
Useexistinghardware
Focuson easytargets Use
existingnetworks
Replacebigger un-certainties
Retainedresponsi-bility
Guaranties
7.3 Integrating PSS in business development
Many companies may see business opportunities in developing PSS solutions as a part of their portfolio. But how can PSS-considerations get implemented in the business development process?
Essentially the companies can start their considerations from three different fo-cus points:
• Focus on internal capabilities for value creation:
- Are the technical capabilities of the product exploited to their full ex-tent? It may be that the customer buys sub-optimal products from a Total Cost Optimisation perspective or that he only delivers a fraction of their potential due to wrong equipment, installation etc.
- Further it may be that the product still contains some value after the initial customer has used it. It may be useful to others with or without alterations.
Innovative Business Models with Environmental Benefits
46
.
- Is the knowledge of the company transferred into value creation? Most times suppliers know more about the products than the customers. This knowledge may constitute a potential to manage the product bet-ter in the use, operation or disposal phases.
• Focus on the potential value to be realised in cooperation:
- Do the customers know something about the use or management of the product that could lead to better value creation if a partnership re-lation is established?
- Do (potential) business partners know something about service, equipment or parts related to the product that could lead to better value creation if a partnership relation is established?
• Focus on the intangible value potential of the product:
- What is the intangible value created by the product today, e.g. reputa-tion, security etc. and what is the potential for creation of intangible value in relation to the aforementioned focus points?
- What is the willingness to pay for intangible value in the relevant markets?
- How do policies and regulatory incentives influence the demand for intangible value? E.g. is it possible to document the customers' contri-bution to CO2-reduction as in the Novo Nordisk-DONG Energy case?
The company may be able to establish more attractive business models that capture the analysed potential through:
• Partnership agreements with business partners or customers that make it possible to capture and share the value created in cooperation.
• New services and product-service systems that utilise the knowledge and technical capability of the company's products
• Market communication of environmental benefits of the product-service system in the form of business cases that show tangible and intangible value.
Innovative Business Models with Environmental Benefits
47
.
8 Conclusion and Recommendations
The potential market for Product Service Systems is estimated in the billions of euros. If exploited fully would yield substantial business, balance of trade and environmental benefits. These benefits include export opportunities, which would also multiply environmental benefits.
It is also clear that the market for PSS is developing slowly and faces several barriers - even compared to other innovative business models. This is particu-larly true in the more southern countries of the EU, which correspondingly have the greatest potential for benefit. These barriers (described in Chapter 7) are:
- Uncertain rewards
- Lack of knowledge of the potential benefits
- New infrastructure requiring investment
Businesses can do much to capture the potential of these business models and overcome these barriers themselves. The initiatives that suppliers and custom-ers can take to achieve this are described in section 7.3 above.
To profit, individual businesses should:
• Investigate the opportunities for profit in this area – by identifying untapped potential:
o What technological potential is going untapped?
o What knowledge could be shared that could unlock potential in a co-operation?
o What intangible value could be realised?
o What opportunities could come from selling outcomes, rather than products?
• Understand the barriers and take appropriate steps to overcome them
• Use existing models as inspiration and guidance.
Innovative Business Models with Environmental Benefits
48
.
Changes in business models to PSS would be part of the trend in the EU econ-omy towards provision of services as the growth sector.
Business associations could have an important role in spreading the benefits of PSS: the barriers to spread are often lack of knowledge of the benefits, familiar-ity with successes and in lack of co-operation between suppliers and customers. The promotion of PSS through business networks could be significant in over-coming inertia.
Policy makers should also facilitate and promote greater spread of PSS.
Policy makers should:
• Take environmentally-friendly business models seriously as a means to achieve environmental goals.
• Include business model innovation within innovation policy and promote the teaching of business model innovation in universities and business schools.
To set up public policy which promotes PSS, policy makers should:
• Examine the areas of potential, using knowledge of local culture and eco-nomic conditions to assess the drivers and barriers.
• Audit existing regulation, (for example relating to product standards) and including innovation policy, to remove legal barriers to PSS approaches - as innovation in business models is sometimes unintentionally blocked by regulation designed to facilitate good functioning of existing business mod-els. Greater outcome-based policy allows innovation to thrive.
• Create economic policy that supports growth of these models – internalising environmental externalities. Policy which aligns society's goals with the goals of the businesses is a very important element in relation to influencing market behaviour.17 Tangible as well as intangible benefits (reputation) should accrue from environmentally sustainable behaviour. It should pay off to, for instance, to reduce CO2 emissions.18 To set up the incentives for change, prices facing companies need to reflect the social costs of business decisions. One way to internalise environmental externalities is by fiscal in-struments. If prices of resources (e.g. energy) are right, business will have the right incentives to innovate in these ways. If not, these business models will remain disadvantaged.
17 The Novo Nordisk-Dong Energy partnership analysed below is a good example of how a
number of important framework conditions render a certain business model viable. 18 For instance, in Denmark, energy suppliers are incentivized to reduce customer consump-
tion due to the introduction of a special tariff which is collected from the consumer (Danish
Energy Authority 2007). The utility companies are therefore compensated financially for
helping consumers to reduce energy consumption.
Innovative Business Models with Environmental Benefits
49
.
To spread knowledge about PSS policy makers could:
• Set up non-profit organisations that can solve the problems of knowledge limitation (e.g. associations for innovative business models with the aim of enhancing awareness of such business models, developing tools, best prac-tice examples etc.).19 This approach has been applied successfully in USA to spread Chemical Management Systems to more sectors.
• Development of tools for measuring environmental benefits and business viability of the identified business models for marketing purposes (both for buyers, suppliers and customers). A lack of developed evaluation tools can constitute an entry barrier. This point is connected to the bullet point above.
To make infrastructure accessible policy makers could:
• Secure deal flows or provide a link for private initiative to make it less risky to invest in new infrastructure. This could be through green public procurement - in extreme cases this could take the form of pre-commercial procurement.
• Make existing networks or hardware available for service providers - for all or through a tendering procedure.
• Help new car-sharing organisations in the start-up phase by public support for establishing the needed infrastructure. The establishment of car stations and special parking lots reserved exclusively for shared cars can boost the initiation of car-sharing. In Switzerland it has taken 20 years to build up Mobility’s infrastructure of car stations.
• More specifically, build a certificate system to make investments in renew-able energy visible to give companies a clear incentive to invest in sustain-able energy.
It is important to note that the relevance of the various policy recommendations vary from country to country depending on the specific institutional context. Thus, for example, some of the business models require quite strong institu-tional structures in order to be viable in the first place. While in some context great emphasis must be put on general institution building, in others more atten-tion can be directed towards the business model itself and its implementation.
19 In a recent international survey of the ESCO industry, it was suggested that one of the
most important steps a country can take to promote the ESCO industry is to establish an
association of ESCOs (Vine 2005, 693).
Innovative Business Models with Environmental Benefits
50
.
9 Case analyses
This section will include six subsections each section dealing with one generic business model. In addition to investigation of the specific cases, the analysis will also draw upon extant knowledge about the generic model itself. Thus the case analyses will, to the extent possible, be infused by already available knowledge about energy service companies, design-build-finance-operate, chemical management systems, resource management, remanufacturing and car-sharing.
The case analyses:
• Describe the business models
• Indicate the Market Potential
• Describe the Barriers to diffusion and how they can be overcome.
9.1 Energy Service Companies
An ESCO can be defined as "a company that provides energy-efficiency-related and other value-added services and for which performance contracting is a core part of its energy-efficiency services business" (Goldman et al 2005). An ESCO typically assumes some extent of performance risk meaning that their profit is tied to the actual amount of energy savings. The projects normally have a rela-tively large up front capital cost which is typically assumed by the ESCO.
The EU-directive on energy and end-use efficiency defines an ESCO in the fol-lowing way:
"a natural or legal person that delivers energy services and/or other energy efficiency improvement measures in a user's facility or premises, and accepts
some degree of financial risk in so doing. The payment for the services deliv-
ered is based (either wholly or in part) on the achievement of energy efficiency
improvements and on the meeting of the other agreed performance criteria;" (2006/32/EC, Art. 3.1.)
Following from this definition it becomes clear that an ESCO involves two key features. First, that the company assumes some extent of financial risk. Second, that the ESCO's payment is based on the extent of realized energy sav-
Innovative Business Models with Environmental Benefits
51
.
ings/improvements. These features create strong incentives for the ESCO to implement optimal energy solutions because the business model is typically based on a 'no cure no pay' basis. Having provider finance at risk in this way can be expected to create strong incentives for innovation and effective energy management.
An ESCO – in the narrow understanding of the term - is effectively a functional result product-service-system (PSS), and is by PSS researchers highlighted as one of the most promising PSS models (Tukker et al 2004). The customer pays the provider for delivering an outcome; e.g. a specific indoor climate or a cer-tain level of heating. The recent rise in interest in ESCOs has among other things been suggested to be rising energy prices, renewed interest in energy ef-ficiency and climate change, aggressive energy saving goals (for US federal agencies) (Hopper et al 2007).
It should be noted that there is a lack of a common and unambiguous definition of the ESCO concept and different stakeholders may define the term differ-ently. For the same reason, international overviews of ESCO markets are somewhat ambiguous as we often do not know exactly what type of models are included in the statistics. In the narrow understanding of the term, a ‘real’ ESCO involves a guaranteed energy saving, finance - or assistance to link fi-nancing of the project to the guarantied energy saving - and the remuneration of the ESCO-company is moreover tied to the extent of energy savings achieved (Bertoldi et al, 2006a).
In the context of this report, we operate with a somewhat broader definition, as we below include a case example which does not involve the finance element (only through overall policy regulation), moreover in that particular case, there are no guaranteed savings. However, the remuneration of the energy company is directly and indirectly tied to the amount of energy savings achieved (see de-scription of the Novo Nordisk and Dong Energy partnership below). Thus al-though the mentioned partnership does not constitute what some may label ‘a real’ ESCO it has been included in the analysis. This particular partnership is the first of its kind in the world; and entails a very promising and positive envi-ronmental impact as well as sound business viability. Last but not least, it is a good example of how careful government regulation together with the envi-ronmental programmes of international non-profit organizations lead to innova-tive business models that perhaps would not have been sustainable without these general framework conditions.
9.1.1 Business rationale
Many estimations of the market for energy services have been elaborated. In 2000, the market for energy efficiency services in Western Europe was esti-mated to be €150 million per annum. This figure is relatively small compared to the estimation of the market potential to approximately €5-10 billion per an-num in 2006, indicating a growth in the assessed market potential (Bertoldi et al 2006a). Other studies assert that the total amount of ESCO activity outside the US was between $560 million and $620 million in 2001, and that this was
Innovative Business Models with Environmental Benefits
52
.
only half to one-third of the ESCO revenues for the US for the same year (Vine, 2005).
This gives reasons to believe that there is a large unrealized ESCO potential in Europe. An estimation of the overall revenue for the US industry in 2006 was $3.6 billion. There was an annual growth in the industry of 20 % in the period 1991-2000. This figure dropped down to 3 % in the period 2000-2004. How-ever from 2004-2006 this increased drastically again to 22 %. The industry revenue in 2008 is estimated to be around $5.25 billion in US alone (Hopper et al 2007).
Within Europe, leading ESCO-countries, i.e. countries with the most intensive ESCO activity (in the narrow understanding of the term) are: Germany, Austria, the UK, Spain and Hungary. Countries with medium ESCO activity are France, Sweden, Czech Republic and Italy. All other European countries are placed in a low activity category, including for example The Netherlands and Denmark (Bertoldi et al 2006, 1822). Major differences among EU member states exist not only in relation to development of national ESCO industries but also in terms of type of projects and terms of implementation (Bertoldi et al 2006).
Below follow two case studies illustrating the use of the ESCO model.
Case study I – TAC Energy Solutions
The first case concerns an ESCO project between the provider, TAC Energy Solutions and the customer, Regionfastigheter. TAC is an international market leader in the building automation industry (TAC 2008c). Regionfastigheter is, on the other hand, one of the largest building administrators in Sweden with a real estate portfolio of approximately 1,400,000 m2 in Skåne, a region in the south-most part of Sweden. Regionfastigheter acts as a strategic partner for its largest tenant, which is the public health sector in Skåne, and employs 370 peo-ple (TAC 2008b).
The content of the ESCO project is energy efficiency, retrofits and refurbish-ments projects within three hospital areas in the Skåne region (PU Benefs, 2005). The project involves 11 buildings (1 university hospital, 5 hospitals and 5 office buildings). Additionally, the project also involves training and capacity building of staff. However, Regionfastigheter was not interested in outsourcing of operational and maintenance work. The project comprises the following works (PU Benefs, 2005):
• air handling retrofit, • installation of heat recovery, • rebuilding of heating and cooling systems, • updated control systems and water saving efforts, • new metering, energy statistics, follow up structure, and • targeted training of administrative and managerial staff.
Total savings amount to SEK 11.5 million per year which means a reduction in energy consumption for heating of 30 %; the guaranteed savings are however
Background
Savings and investment
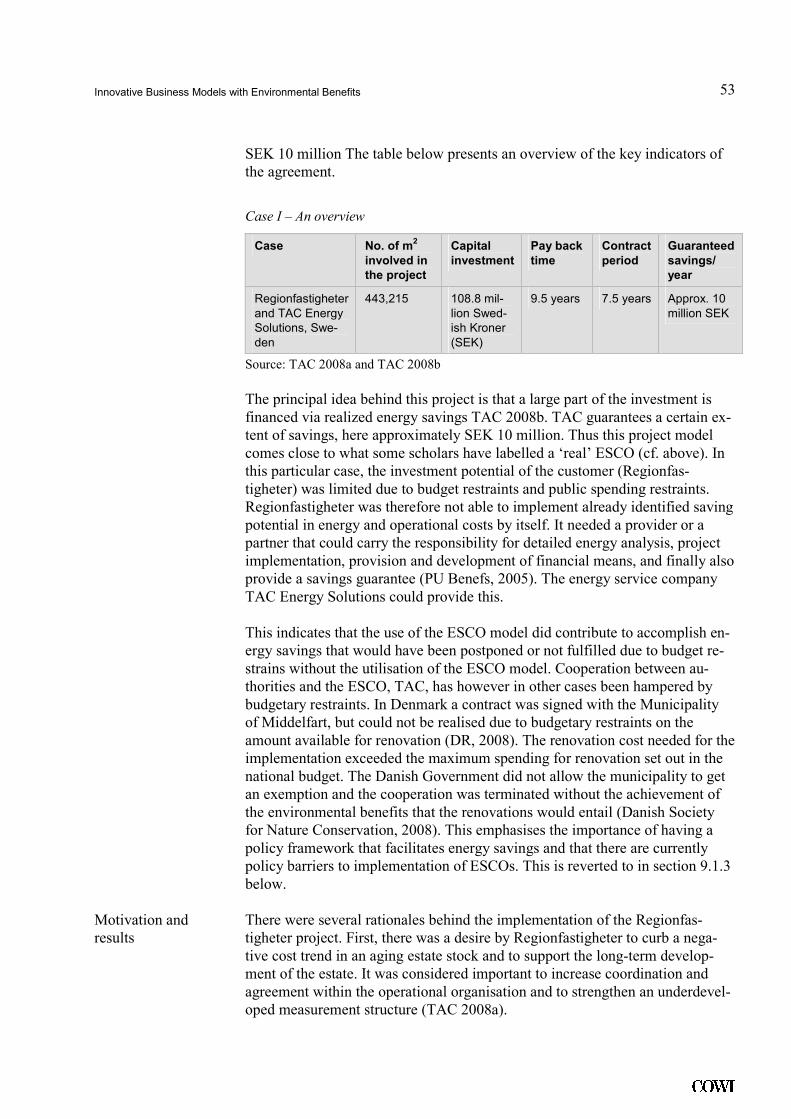
Innovative Business Models with Environmental Benefits
53
.
SEK 10 million The table below presents an overview of the key indicators of the agreement.
Case I – An overview
Case No. of m2
involved in
the project
Capital
investment
Pay back
time
Contract
period
Guaranteed
savings/
year
Regionfastigheter and TAC Energy Solutions, Swe-den
443,215 108.8 mil-lion Swed-ish Kroner (SEK)
9.5 years 7.5 years Approx. 10 million SEK
Source: TAC 2008a and TAC 2008b
The principal idea behind this project is that a large part of the investment is financed via realized energy savings TAC 2008b. TAC guarantees a certain ex-tent of savings, here approximately SEK 10 million. Thus this project model comes close to what some scholars have labelled a ‘real’ ESCO (cf. above). In this particular case, the investment potential of the customer (Regionfas-tigheter) was limited due to budget restraints and public spending restraints. Regionfastigheter was therefore not able to implement already identified saving potential in energy and operational costs by itself. It needed a provider or a partner that could carry the responsibility for detailed energy analysis, project implementation, provision and development of financial means, and finally also provide a savings guarantee (PU Benefs, 2005). The energy service company TAC Energy Solutions could provide this.
This indicates that the use of the ESCO model did contribute to accomplish en-ergy savings that would have been postponed or not fulfilled due to budget re-strains without the utilisation of the ESCO model. Cooperation between au-thorities and the ESCO, TAC, has however in other cases been hampered by budgetary restraints. In Denmark a contract was signed with the Municipality of Middelfart, but could not be realised due to budgetary restraints on the amount available for renovation (DR, 2008). The renovation cost needed for the implementation exceeded the maximum spending for renovation set out in the national budget. The Danish Government did not allow the municipality to get an exemption and the cooperation was terminated without the achievement of the environmental benefits that the renovations would entail (Danish Society for Nature Conservation, 2008). This emphasises the importance of having a policy framework that facilitates energy savings and that there are currently policy barriers to implementation of ESCOs. This is reverted to in section 9.1.3 below.
There were several rationales behind the implementation of the Regionfas-tigheter project. First, there was a desire by Regionfastigheter to curb a nega-tive cost trend in an aging estate stock and to support the long-term develop-ment of the estate. It was considered important to increase coordination and agreement within the operational organisation and to strengthen an underdevel-oped measurement structure (TAC 2008a).
Motivation and results
Innovative Business Models with Environmental Benefits
54
.
The project started in 2004/2005 and the results are positive so far. The early training and optimizing efforts have delivered more savings than expected (PU Benefs, 2005). This ESCO has resulted in lower energy consumption, clearer coordination within the operational organization, upgrading of technical stan-dards and new products simplifying operation work, and simple and unitary solutions which bring about lower costs. The project may moreover serve as a flagship case for others in the whole Skåne Region, higher operational reliabil-ity, and finally increased in-house competence (TAC 2008a).
Experience has shown that the planning and purchasing process is time con-suming in a project of this size, and that there is a need to set up an internal team with complementary competences that can manage the tendering process and contractual work. Another lesson is that internal preparation was vital to avoid internal opposition. A subsequent analysis of the project states that a key part of the success is to anchor the project among internal stakeholders before approaching the market (PU Benefs 2005). Another important policy-related lesson is that there was a lack of knowledge and interpretation capacity among public branch organizations concerning financial, accounting and contractual aspects of energy service contracting and third party financing (PU Benefs 2005). This may work as a barrier for the implementation of ESCOs. Barriers to the ESCOs will be reverted to in section 9.1.3.
Key findings from case study I
The case indicates that cooperation with an ESCO, in this case TAC, can lead to significant savings in energy consumption at a limited cost to the customer, which is particularly impor-tant for public authorities operating under strong budget restraints. It does, however, also indicate that budget restraints may be a barrier to the implementation of an agreement with an ESCO as seen in Middelfart municipality where a project that was both economically and environmentally viable was blocked due to politically inflicted budgetary barriers.
Case example II - partnership between Novo Nordisk and Dong Energy
In May 2007 the energy producer Dong Energy and Novo Nordisk, producer of pharmaceuticals, signed a partnership agreement. The essence of the partner-ship is that Dong Energy helps Novo Nordisk in identifying energy-saving pro-jects (on a non-fee basis). In addition to giving energy advice, Dong Energy is committed to disseminate best practice between different parts of the Novo Nordisk group, and to produce fact sheets and guidelines for best practice. Novo Nordisk, on the other hand, commits to convert all the energy savings that are realized through the partnership into purchasing of new green electric-ity from Dong Energy. This is a groundbreaking partnership on wind power as it creates a unique win-win situation were Novo Nordisk in a cost neutral man-ner can reduce CO2 emissions and shift to green energy consumption at the same time. For Dong Energy, on the other hand, the partnership with Novo Nordisk is an effective means to achieve the energy savings that it has commit-ted itself to achieve in an agreement with the Danish Government. In 2006, Danish energy companies committed to create documentable savings in their customers’ energy consumption. And Novo Nordisk's shift into green energy consumption contributes to create a market and secure the investment in a new
Background
Innovative Business Models with Environmental Benefits
55
.
windmill park at Horns Rev II – an investment that without this partnership would involve a considerably higher risk.
The partnership between Dong Energy and Novo Nordisk runs until 2020. Originally, Novo Nordisk contemplated to establish its own wind farm as an important means to realize its climate goals (Børsen, 2008a). However, realiz-ing that this was not a part of its core business, Novo Nordisk decided instead to enter into negotiations with Dong Energy. These negotiations lasted about a year and resulted in the innovative partnership described above. Dong is cur-rently negotiating with other Danish business corporations to establish similar partnerships (Børsen, 2008a).
In the Novo Nordisk/Dong Energy partnership external framework conditions are significant drivers for this innovative partnership. In 2006, Novo Nordisk, signed a voluntary climate saver agreement with the World Wide Fund for Na-ture (WWF) and became a part of the latter organization's 'Climate Savers' pro-gramme.20 This programme currently involves 14 multinational corporations and in total these companies will, by 2010, have cut carbon emissions by ap-proximately 13 million tons annually. This is equivalent of taking more than 3 million cars off the road every year (WWF, 2008a). In the agreement with WWF, Novo Nordisk has committed to reduce its total carbon dioxide emis-sions from production by 10 % below 2004 levels by 2014. When taking into account the average growth of Novo Nordisk in the same period, this means that the company has committed to a 65 % relative reduction of its CO2 emis-sions in the mentioned period. (Børsen, 2008a)
Here, the climate agreement with WWF is an important driver for Novo Nord-isk's overall climate strategy. The climate strategy is global and has the follow-ing three main components:
• cLEAN®: a lean programme (the Novo version of the LEAN philosophy) • Energy Savings (projects to optimise energy consumption). • Green energy (renewable energy)
It is by way of the above three levers that Novo Nordisk will achieve the target reduction agreed with WWF in 2006. Two thirds of the emission reductions will be reached by the company’s cLEAN® programme while the vast part of the remaining third will be realized through the Novo Nordisk – Dong Energy partnership. By 2014 the partnership is thus expected to have brought about a reduction in CO2
emissions equalling approximately 130,000 tonnes (Vibeke Burchard, 25 April 2008). The partnership covers only the Danish Novo Nord-isk premises, because the Danish production facilities account for 85 % of the company’s global emissions (Vibeke Burchard, 25 April, 2008).
General concerns about the climate have led to agreements between Novo Nordisk and WWF on the one hand, and between the Danish Government and the Danish energy companies on the other hand. These are important frame- 20 Read more about WWF's 'Climate Savers Programme' here:
http://www.worldwildlifefund.org/climate/projects/climatesavers/companies.cfm
External drivers
Innovative Business Models with Environmental Benefits
56
.
work conditions that make this business model a viable business model. Dong is bound by its Public Service Obligations (PSOs). PSOs are obligations put on Danish collective electricity suppliers and concerns i.e. support to production of renewable energy hereunder wind energy. The PSO is collected from consum-ers as a tariff (Danish Energy Authority, 2007) and constitutes support to the production of renewable energy.
Hence, by entering this partnership, Novo Nordisk achieves two important things. First, it prepares the business for a carbon-constrained future by reduc-ing carbon dependency and curbing rising energy expenses. Second, it realizes intangible value in the sense that it signals to the broader community that Novo Nordisk cares about the climate. According to Dong Energy, the desire to im-prove the image of the company is essential for engaging in green projects, and it is important to be able to show and materialise the effort in the branding process. Having a visible, tangible output of the greening process is according to Dong Energy pivotal in getting commitments from the business community and here the Danish system with renewable energy certificates is important (Christian S. Berthelsen 18 May 2008). The certificates provide a guarantee that the energy derives from a renewable energy source in accordance with the Directive on the promotion of electricity produced from renewable energy sources in the internal electricity market (2001/77/EC).
Currently, almost 300 energy saving projects are in the pipeline within the Novo group. These projects cover all areas of energy supply - including ventila-tion, cooling, compressed air, water treatment, boilers, illumination etc. In par-ticular, a substantial potential has been identified in optimisation of the ventila-tion & cooling systems. One of the projects – concerning the optimisation of cooling water supply in Kalundborg – gave a saving corresponding to five mil-lion kWh in 2007. Also, small adjustments like not ventilating during nights and weekends in administrative areas have shown a large energy-saving poten-tial. (Vibeke Burchard, 25 April, 2008) As Novo Nordisk was already working on energy-saving projects before its cooperation with Dong Energy (imple-mented in May 2007) it is difficult to distinguish between which projects are a part of the Novo Nordisk /Dong Energy partnership, and which are imple-mented outside the auspices of the partnership.
The energy-saving efforts are financed by the PSO-tariff paid by consumers, mentioned above. For Dong Energy the agreement with the Government means an average reduction in consumer consumption of energy in the range of 144 gWh in the period 2006-2013 (Dong energy, 2008b).
An important aspect of this deal is that the supply of green electricity is condi-tioned to come from new windmills. In effect this means that the Novo Nordisk and Dong Energy partnership is paving the way for a new wind farm (Horns Rev II) that Dong Energy is establishing in the North Sea. The expectation is that by 2010, Novo Nordisk will absorb 30 % of the capacity of that windmill park. Thus in this particular business model a unique link is created between energy savings and greening of energy supply.
Environmental effect
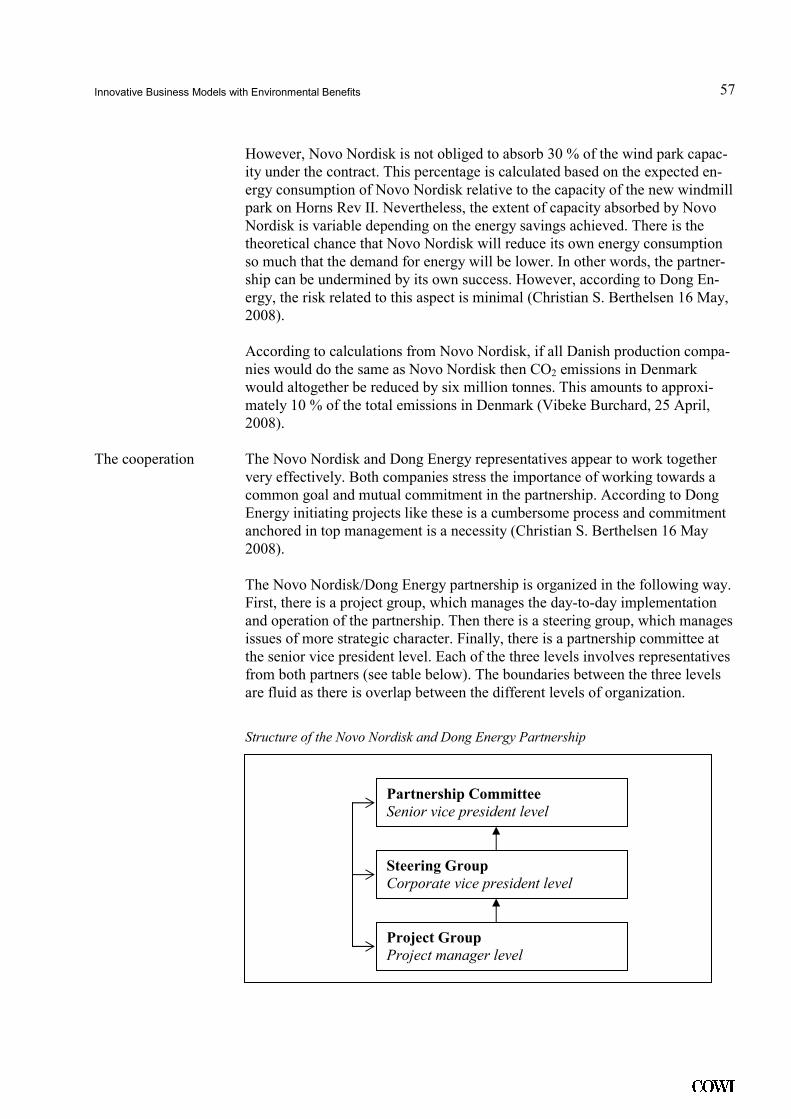
Innovative Business Models with Environmental Benefits
57
.
However, Novo Nordisk is not obliged to absorb 30 % of the wind park capac-ity under the contract. This percentage is calculated based on the expected en-ergy consumption of Novo Nordisk relative to the capacity of the new windmill park on Horns Rev II. Nevertheless, the extent of capacity absorbed by Novo Nordisk is variable depending on the energy savings achieved. There is the theoretical chance that Novo Nordisk will reduce its own energy consumption so much that the demand for energy will be lower. In other words, the partner-ship can be undermined by its own success. However, according to Dong En-ergy, the risk related to this aspect is minimal (Christian S. Berthelsen 16 May, 2008).
According to calculations from Novo Nordisk, if all Danish production compa-nies would do the same as Novo Nordisk then CO2 emissions in Denmark would altogether be reduced by six million tonnes. This amounts to approxi-mately 10 % of the total emissions in Denmark (Vibeke Burchard, 25 April, 2008).
The Novo Nordisk and Dong Energy representatives appear to work together very effectively. Both companies stress the importance of working towards a common goal and mutual commitment in the partnership. According to Dong Energy initiating projects like these is a cumbersome process and commitment anchored in top management is a necessity (Christian S. Berthelsen 16 May 2008).
The Novo Nordisk/Dong Energy partnership is organized in the following way. First, there is a project group, which manages the day-to-day implementation and operation of the partnership. Then there is a steering group, which manages issues of more strategic character. Finally, there is a partnership committee at the senior vice president level. Each of the three levels involves representatives from both partners (see table below). The boundaries between the three levels are fluid as there is overlap between the different levels of organization.
Structure of the Novo Nordisk and Dong Energy Partnership
The cooperation
Partnership Committee
Senior vice president level
Steering Group
Corporate vice president level
Project Group
Project manager level
Innovative Business Models with Environmental Benefits
58
.
Dong Energy holds the responsibility of designing and building the new wind park. Should Dong Energy fail to do so, they are entitled to assign a new sup-plier to Novo Nordisk. The Novo Nordisk and Dong Energy partnership is not, as already noted earlier, an ESCO in the traditional sense of the term because it does not involve guaranteed energy savings and finance21.
Key findings from case study II
This cooperation offers a mutually beneficial situation for both companies – it offers the opportunity for implementing environmental projects with high effect at a low cost and with limited risk. Moreover, the cooperation offers positive publicity and contributes to greening the image of both companies. The case indicates that external drivers are important in mo-tivating such partnerships and that tangible results to use in the branding process are valu-able.
Certificates of green energy are important as they make the effort of the company tangible. This is important to make the efforts visible in terms of image and branding.
9.1.2 Environmental case
The ESCO model represents a possibility for gaining environmental effects and reducing emissions. A report from the US suggests that the median ESCO pro-ject saves approximately 170MJ/m2/year of energy, and further that the median annual electricity saving in 'lighting only' projects is 23 % of utility bill base-line (Goldman et al 2005, 394). The model opens up for a range of agreements that can be used both for international conglomerates and growing SMEs.
The above-mentioned two cases illustrate the possibilities for mutual gain and how the use of this model can serve as a driver for greening the energy con-sumption. As is seen in the case of Novo Nordisk and Dong Energy, the agree-ment reduces overall consumption and shifts the remaining energy consumption into relying on renewable energy, hence contributing to creating the basis for development of a new windmill park.
In Novo Nordisk, small adjustments have made significant reductions. Energy saving projects implemented in the period 2005-2007 are estimated to have re-duced CO2 emissions by 12,000 tonnes. In 2007 alone, Novo Nordisk imple-mented 50 energy saving projects, out of which 26 had a pay back period of less than 1 year. 13 of these projects were "just do its"; i.e. there was no in-vestment needed (Vibeke Burchard, 25 April, 2008).
If all Danish corporations would follow Novo Nordisk’s example it would re-quire over 10 new wind parks with the size of Horns Rev II. Horns Rev consists today of 80 windmills with a total production capacity of 160 MW. This equals approximately the electricity consumption of 150,000 Danish households (Dong Energy/Vattenfall, 2008). Horns Rev II is expected to consist of 95 new mills with a total production of 218.5 MW. It will further include three large test mills with a total effect of max 15 MW. The project will cover an area of
21 Cf. the definition of Bertoldi, et al 2006
Innovative Business Models with Environmental Benefits
59
.
35 km2 (Danish Energy Authority, 2008). Extrapolated to the European Union there is room for significant reductions.
9.1.3 Possibilities and barriers
As also mentioned above in section 9.1.1, it is estimated that there is a market for ESCO in Europe. The European Commission estimates that the market for ESCOs can develop to a volume in the range of €5-10 billion per annum within a short-term perspective (Dansk Energi 2008) and the Commission has cur-rently registered 150 energy service companies within the European Union (Dansk Energi 2008).
The differences among the European countries are, however, substantial as also mentioned above. And there are different barriers in the countries indicating that the challenges to be overcome in the countries vary.
However, as indicated in the Novo Nordisk case, changes can be done with only minimum input, without there being major structural barriers – as many changes are - as Novo Nordisk categorises it - "just do its". An ESCO here con-stitutes a possibility to create awareness of changes needed at minimum cost. There is a potential for substantial reductions if it is managed to get private companies and public authorities committed to this and if the framework condi-tions are tuned to this and barriers reduced.
Numerous barriers have been identified in the scholarly literature concerning the development of an ESCO industry. And there are several cases of failed co-operation. Among these is the cooperation between Middelfart municipality and TAC, as indicated in section 9.1.1. Another case is from Sweden where, according to a representative from the Danish ESCO market, about ten years ago Vattenfall attempted to implement ESCOs. This effort failed.
From one of the case interviews emerges the finding that the quality of the business relations is important. A project representative from the provider or-ganization points out "good relationships, flexibility and a common vision are decisive for a successful project. We want to work together with the customer, not against the customer". Another interviewee correspondingly notes that the partnership between the involved partners is important. Initiating a project without a common understanding and good relations between the parties might constitute a barrier to the success of the partnership. These statements from the stakeholders generally correspond with academic research on business alliances where increasingly alliance scholars stress the importance of non-tangible as-pects of cooperation such as relational quality and trust, and suggest that such factors of cooperation are important performance antecedents. Therefore, man-agement attention should be directed towards this aspect of cooperation. As noted above legal and administrative barriers have been identified.
The tables below list key barriers for industry, end users and policy. It should be noted that barriers may not be the same throughout the Union and different Member States may encounter different barriers.
Possibilities
Barriers
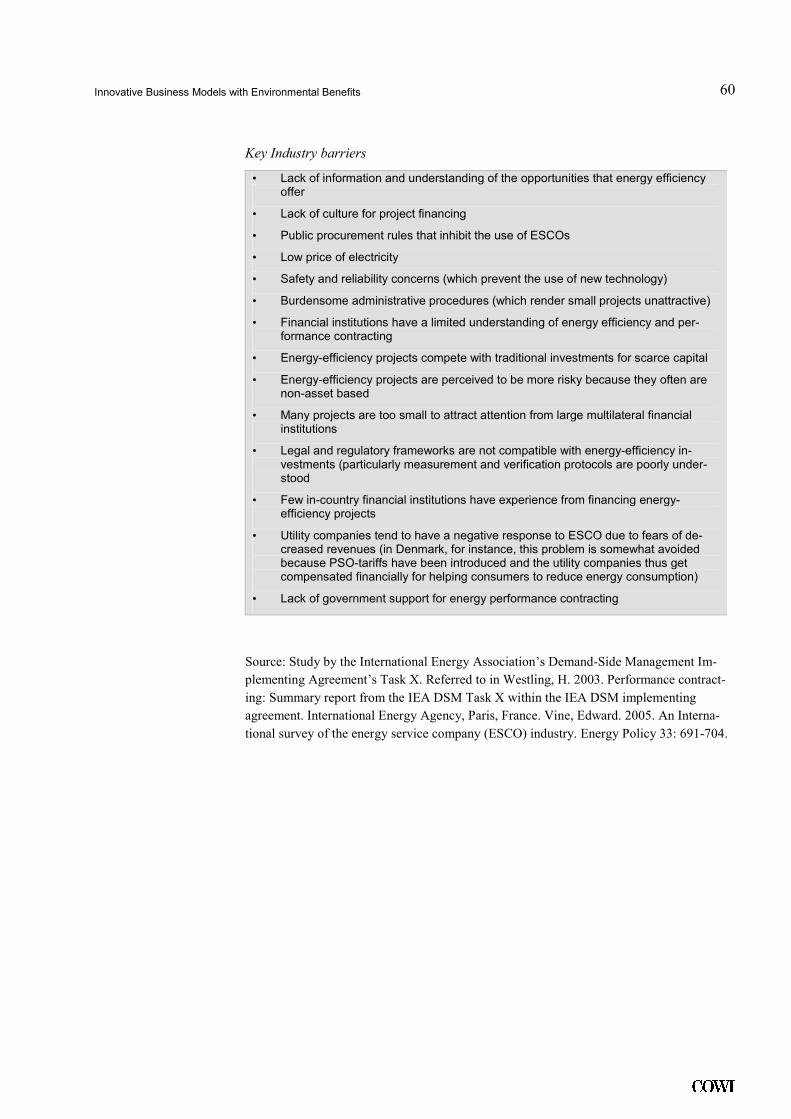
Innovative Business Models with Environmental Benefits
60
.
Key Industry barriers
• Lack of information and understanding of the opportunities that energy efficiency offer
• Lack of culture for project financing
• Public procurement rules that inhibit the use of ESCOs
• Low price of electricity
• Safety and reliability concerns (which prevent the use of new technology)
• Burdensome administrative procedures (which render small projects unattractive)
• Financial institutions have a limited understanding of energy efficiency and per-formance contracting
• Energy-efficiency projects compete with traditional investments for scarce capital
• Energy-efficiency projects are perceived to be more risky because they often are non-asset based
• Many projects are too small to attract attention from large multilateral financial institutions
• Legal and regulatory frameworks are not compatible with energy-efficiency in-vestments (particularly measurement and verification protocols are poorly under-stood
• Few in-country financial institutions have experience from financing energy-efficiency projects
• Utility companies tend to have a negative response to ESCO due to fears of de-creased revenues (in Denmark, for instance, this problem is somewhat avoided because PSO-tariffs have been introduced and the utility companies thus get compensated financially for helping consumers to reduce energy consumption)
• Lack of government support for energy performance contracting
Source: Study by the International Energy Association’s Demand-Side Management Im-
plementing Agreement’s Task X. Referred to in Westling, H. 2003. Performance contract-
ing: Summary report from the IEA DSM Task X within the IEA DSM implementing
agreement. International Energy Agency, Paris, France. Vine, Edward. 2005. An Interna-
tional survey of the energy service company (ESCO) industry. Energy Policy 33: 691-704.
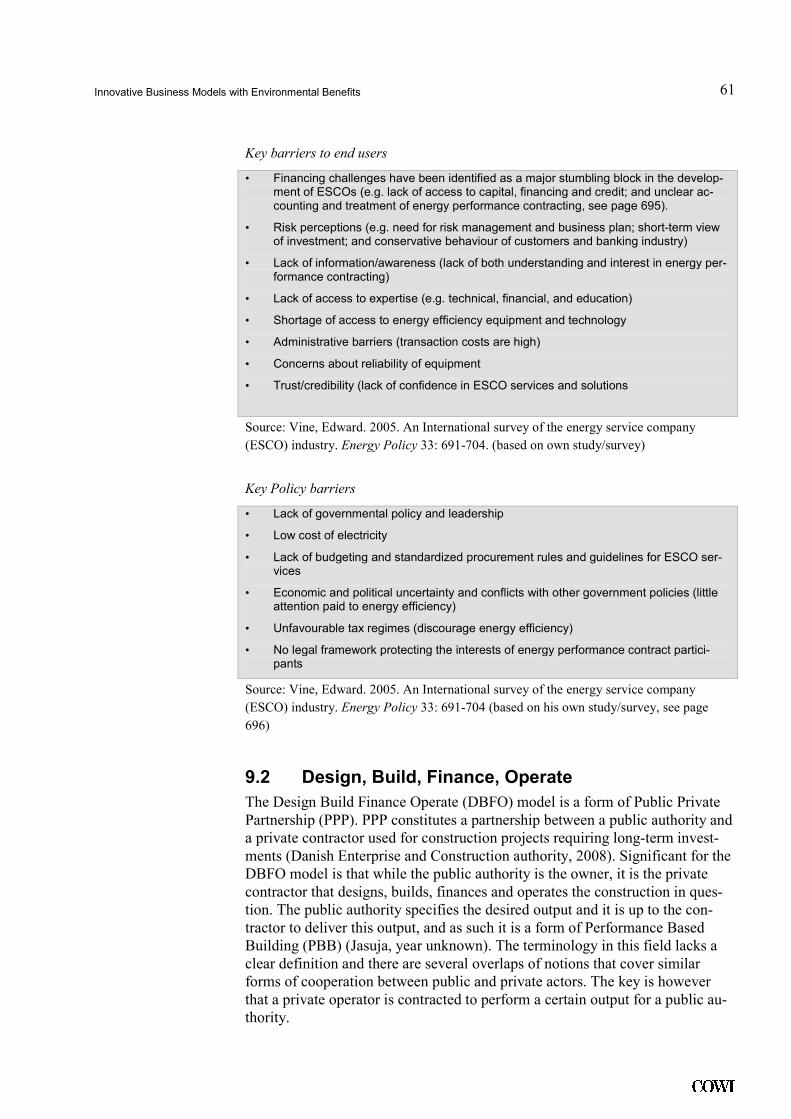
Innovative Business Models with Environmental Benefits
61
.
Key barriers to end users
• Financing challenges have been identified as a major stumbling block in the develop-ment of ESCOs (e.g. lack of access to capital, financing and credit; and unclear ac-counting and treatment of energy performance contracting, see page 695).
• Risk perceptions (e.g. need for risk management and business plan; short-term view of investment; and conservative behaviour of customers and banking industry)
• Lack of information/awareness (lack of both understanding and interest in energy per-formance contracting)
• Lack of access to expertise (e.g. technical, financial, and education)
• Shortage of access to energy efficiency equipment and technology
• Administrative barriers (transaction costs are high)
• Concerns about reliability of equipment
• Trust/credibility (lack of confidence in ESCO services and solutions
Source: Vine, Edward. 2005. An International survey of the energy service company
(ESCO) industry. Energy Policy 33: 691-704. (based on own study/survey)
Key Policy barriers
• Lack of governmental policy and leadership
• Low cost of electricity
• Lack of budgeting and standardized procurement rules and guidelines for ESCO ser-vices
• Economic and political uncertainty and conflicts with other government policies (little attention paid to energy efficiency)
• Unfavourable tax regimes (discourage energy efficiency)
• No legal framework protecting the interests of energy performance contract partici-pants
Source: Vine, Edward. 2005. An International survey of the energy service company
(ESCO) industry. Energy Policy 33: 691-704 (based on his own study/survey, see page
696)
9.2 Design, Build, Finance, Operate
The Design Build Finance Operate (DBFO) model is a form of Public Private Partnership (PPP). PPP constitutes a partnership between a public authority and a private contractor used for construction projects requiring long-term invest-ments (Danish Enterprise and Construction authority, 2008). Significant for the DBFO model is that while the public authority is the owner, it is the private contractor that designs, builds, finances and operates the construction in ques-tion. The public authority specifies the desired output and it is up to the con-tractor to deliver this output, and as such it is a form of Performance Based Building (PBB) (Jasuja, year unknown). The terminology in this field lacks a clear definition and there are several overlaps of notions that cover similar forms of cooperation between public and private actors. The key is however that a private operator is contracted to perform a certain output for a public au-thority.
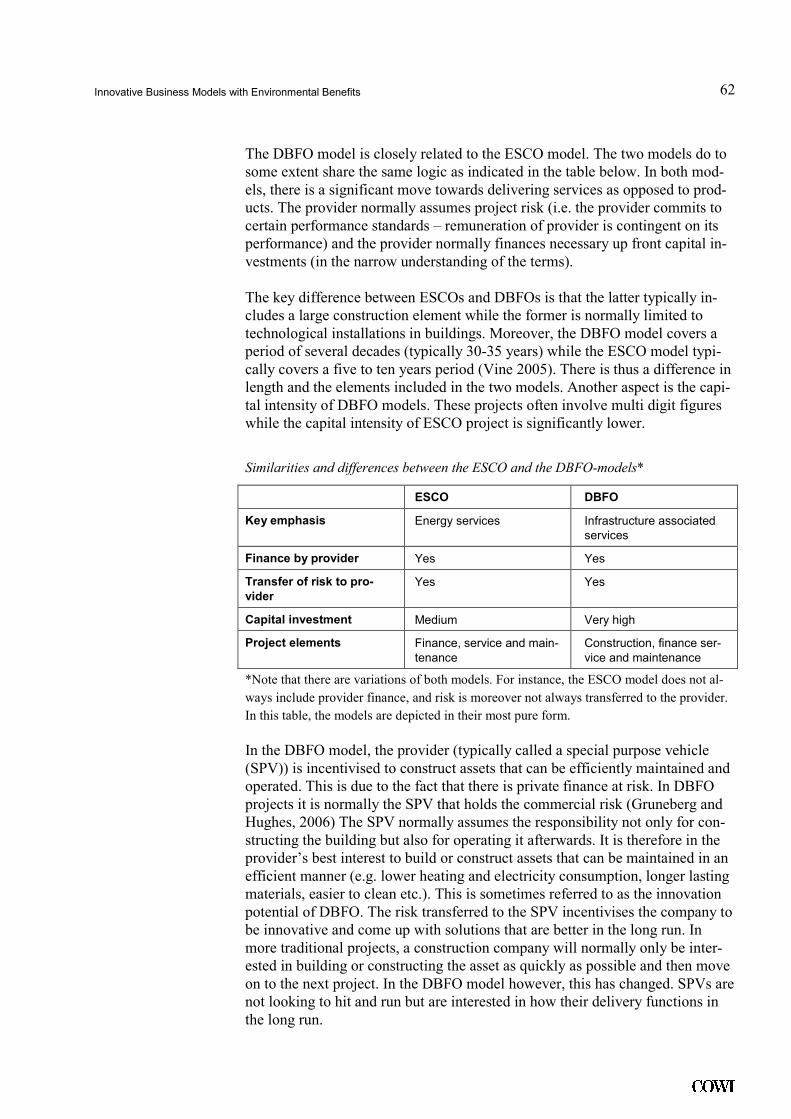
Innovative Business Models with Environmental Benefits
62
.
The DBFO model is closely related to the ESCO model. The two models do to some extent share the same logic as indicated in the table below. In both mod-els, there is a significant move towards delivering services as opposed to prod-ucts. The provider normally assumes project risk (i.e. the provider commits to certain performance standards – remuneration of provider is contingent on its performance) and the provider normally finances necessary up front capital in-vestments (in the narrow understanding of the terms).
The key difference between ESCOs and DBFOs is that the latter typically in-cludes a large construction element while the former is normally limited to technological installations in buildings. Moreover, the DBFO model covers a period of several decades (typically 30-35 years) while the ESCO model typi-cally covers a five to ten years period (Vine 2005). There is thus a difference in length and the elements included in the two models. Another aspect is the capi-tal intensity of DBFO models. These projects often involve multi digit figures while the capital intensity of ESCO project is significantly lower.
Similarities and differences between the ESCO and the DBFO-models*
ESCO DBFO
Key emphasis Energy services Infrastructure associated services
Finance by provider Yes Yes
Transfer of risk to pro-
vider
Yes Yes
Capital investment Medium Very high
Project elements Finance, service and main-tenance
Construction, finance ser-vice and maintenance
*Note that there are variations of both models. For instance, the ESCO model does not al-
ways include provider finance, and risk is moreover not always transferred to the provider.
In this table, the models are depicted in their most pure form.
In the DBFO model, the provider (typically called a special purpose vehicle (SPV)) is incentivised to construct assets that can be efficiently maintained and operated. This is due to the fact that there is private finance at risk. In DBFO projects it is normally the SPV that holds the commercial risk (Gruneberg and Hughes, 2006) The SPV normally assumes the responsibility not only for con-structing the building but also for operating it afterwards. It is therefore in the provider’s best interest to build or construct assets that can be maintained in an efficient manner (e.g. lower heating and electricity consumption, longer lasting materials, easier to clean etc.). This is sometimes referred to as the innovation potential of DBFO. The risk transferred to the SPV incentivises the company to be innovative and come up with solutions that are better in the long run. In more traditional projects, a construction company will normally only be inter-ested in building or constructing the asset as quickly as possible and then move on to the next project. In the DBFO model however, this has changed. SPVs are not looking to hit and run but are interested in how their delivery functions in the long run.
Innovative Business Models with Environmental Benefits
63
.
Another related advantage with the DBFO model is that during the contracted period buildings and other assets are maintained properly. In particular within the public sector, a lack of maintenance of public assets is often a problem. For instance, in Denmark, municipalities alone are estimated to have a lack of maintenance in the range of DKK 3.4 billion by the end of year 2009 (COWI 2008). This is also a key driver for the street lighting case from the UK pre-sented below.
It should be noted that the innovation potential, including energy efficiency, of DBFO is not documented sufficiently in literature. Moreover, the general per-formance of this type of projects is difficult to determine for various reasons (for instance, Hodge and Greve 2007). Current knowledge about the innovation potential therefore tends to be case-based and anecdotal (Smith, 2007). This is also the case in relation to PFI street lighting project, which is used as a case study in this report. Street lighting projects were chosen because these were highlighted by one of the experts that we consulted as having an interesting en-vironmental aspect. PFI, Private Finance Initiative, constitutes a means to fund-ing major capital investments without immediate recourse to the public budget. The PFI was launched by the UK Government in the early 1990s. A private partner, usually a consortium, is contracted to design, build, and in some cases manage new projects. It is thus a variant of PPP and the DBFO model described above. Contracts typically last for 30 years, during which time the public au-thority tends to lease the construction in question (DH, 2008). In the street lighting case the street lighting network is not leased, but can be considered as a stewardship agreement where the public authority owns, but the SPV is the steward of the lighting system.
9.2.1 Business rationale
The business rationale of the model is anchored in transferring certain tasks to a private contractor, the SPV, which is expected to be able to carry out the pro-ject at a lower cost. In the UK for instance, in assessing where PFI is appropri-ate, the Government's approach is based on its commitment to efficiency, eq-uity and accountability and on the Prime Minister's principles of public sector reform. PFI is only used where it can meet these requirements and deliver clear value for money without sacrificing the terms and conditions of staff (DH, 2008).
The SPV on the other hand is secured a long-term stable income from the pro-ject and is incentivised to secure reliability and long-term minimization of cost. In the UK, much interest in PFI derives from cutbacks in government capital expenditure, which influence the turnover of many construction companies (Ezulike et al 1997). According to Ezulike, capital expenditure using PFI is in-creasingly used as a substitute for public sector expenditure (Ezulike et al 1997)
Case example I - PFI Street lighting
The first scheme was signed in December 1998 and The UK Department for Transport or Government Office London has now approved PFI funding for 35 English local authority street lighting projects. In 2007, sixteen of these projects
Background
Innovative Business Models with Environmental Benefits
64
.
were in operation, four were in procurement and 15 are preparing Outline Busi-ness Cases (PFI/PPP Issue 7, January 24, 2007). The motivating factor behind the UK street lighting projects was to enhance the quality of life of the citizens, by reducing the number of accidents and local crime (Wallis, 18 April 2008). The environmental agenda in relation to street lighting only appeared on the agenda a few years back. Driving down energy consumption was not a key ra-tionale behind most of the first PFI street lighting projects. This has only sur-faced as a topic retrospectively.
The South Coast Street lighting PFI is still in the making. The project builds on an agreement between the Hampshire County council and a contractor. The contractor is not finally identified at this point and the contractual negotiations are ongoing. It is expected to have a final bidder early 2009 and to reach finan-cial close in 2009 (Trevor Wallis, 18 April 2008). The agreement between the council and the contractor will be a stewardship, where the contractor holds the responsibility for building and maintaining the lighting net for a contractually determined sum (Trevor Wallis 19 May 2008). The concept implies that the authorities, here Hampshire County council, specify the output, and select the contractor that they consider the best suited to fulfil the requirements set out. It is thus up to the contractor to choose how to deliver the output.
Street lighting in the UK has not been given the proper maintenance and sub-stantial parts of the network are old and needs replacement (Trevor Wallis, 19 May 2008). The investment needed to replace the systems is considerable (OBC, 2007 annex 8). A key objective behind entering a PFI project is that the contractor is responsible for the maintenance within the contract period, which is planned to be 25 years.
It is expected that the project will lead to the following improvements:
• building safe and strong communities, • stewardship of the environment, • improving services, • improving levels of performance, • improving sustainability, • more cost effective use of capital and revenue resources, • improving crime reduction, • reducing traffic accidents, • embracing new technologies, and • innovation.
All investments in the new lighting networks are to be in place within five years after signing the contract. The contractor is, as specified above, responsi-ble for delivering the requested output. The council pays the contractor a unit fee charge. This charge covers two elements. First, the repayment of the loan to cover the investment and second the fixed amount agreed to cover the cost of maintenance. This entails that if cost of maintenance is lower than the agreed amount this is of benefit to the contractor. However, the contractor also holds the risk if maintenance cost exceeds the fixed amount. Hence there is an incen-tive to reduce maintenance cost on the one hand, however, within the perspec-
Objectives
Investment and risk
Innovative Business Models with Environmental Benefits
65
.
tive that the contractor has the responsibility for operation within the 25 years that the contract is running. Neglecting maintenance to increase short-term gain is thus not a viable long-term solution to the contractor.
The risk of changes in energy prices is held by the Council, whereas the risk of changes in the volume is held by the contractor. A volume range is specified in the contract and the contractor is required to pay the extra cost if consumption exceeds the specified range. This implies that there is an incentive for the con-tractor to reduce consumption, or at least avoid that consumption increases.
Environmental considerations are one of the objectives of the cooperation. Par-ticularly the objective of improved sustainability is important for getting a posi-tive environmental effect. This entails examination of "all aspects of sustain-ability and ensuring that development proposals of bidders comply with sus-tainable principles" particularly the following:
• recycling the vast majority of the waste, • use of recycled, recyclable and durable products, • use of energy efficient technologies, • consideration of energy efficient operational practices (e.g. part night light-
ing), and • sustainability of communities themselves. The project will use SMART22 objectives "to maximize the benefits and moni-tor the delivery of this aspect of the service" (OBC, 2007). This indicates that the project is designed to lead to more efficient use of resources hereunder en-ergy consumption and waste.
In most of the lighting projects in the UK, environmental requirements have not been part of the contract specifications and this has on several occasions led to increased energy consumption. In order to achieve an environmental benefit the procurer, here the Council, must be conscious of this fact in outlining the speci-fications.
9.2.2 Environmental case
The environmental gain derives from two key factors. First of all, in specifying the procurement criteria when selecting a contractor the public authorities may include environmental requirements that the contractor must comply with, i.e. green public procurement. In doing so, the contractor will be contractually bound to comply with the specified environmental criteria. Second, in DBFO, the contractor has the full responsibility of the contracted item in question, this being a building or a lighting network etc. This provides the contractor with an incentive to rationalise the use of materials and maintenance to increase the lifespan and reduce cost for replacements. This is likely to reduce waste.
22 specific, measurable, agreed, realistic and timely
Environmental impact
Innovative Business Models with Environmental Benefits
66
.
As the contractor is also responsible for the operation, it is rational to reduce cost of operation hereunder cost of energy consumption. It is therefore likely that the rational contractor will use an energy solution that minimises consump-tion.
Using the DBFO model it is thus likely that an economically rational actor will strive to increase the lifespan of the building, reduce waste and minimise en-ergy consumption and in that way earn his profits.
9.2.3 Possibilities and barriers
The market for PPP can be considered to be substantial. In the period 2004-2005 alone, about 206 PPP deals were closed worldwide with a value of ap-proximately US$52 billion (PricewaterhouseCoopers 2005, 37). In the United Kingdom alone, more than 750 PPP projects with a total capital value of £37.6 billion were implemented in the period 1995-2007 (Partnerships UK 2007, 3).23 In Australia the Government has estimated the market to be some 18 billion Australian dollars (National PPPforum, 2008). In using a DBFO model, the SPV provides a solution that caters for quality, efficiency and effectiveness of the service provision is selected. According to a report from the Serco Institute by Briony Smith, the SPV will try to balance the capital expenditure with the best design to produce the cheapest whole life cost and drive innovation for-ward.
The academic literature on PPP is however fragmented and there are only a limited number of studies focussing on the barriers to this form of procurement. There are possible barriers to PPP both within the public and private sectors.
Barriers in the public sector vary from country to country as to a large degree they depend on the legal setup of the country. Moreover the traditional percep-tion of the role of the state and involvement of the private sector may have an influence. In a report to the US Congress on PPP, impediments to the formation of PPP were identified (US Dept. of Transportation, 2004). The report indicates that barriers i.e. derive from (US Dept. of Transportation, 2004):
• State laws and policies Public procurement laws and procedures may impede or actually prohibit the use of DBFO. An example is if the main focus is on the "low bid ap-proach", often this does not cover a life cycle cost approach
• Local opposition Particularly in projects concerning roads and road pricing for financing a project rather than tax income local opposition may be substantial.
23This number does not include the Buildings Schools for the Future Program (BSF), the
Local Improvement Finance Trust programme (LIFT) and the London Underground PPPs
which taken together add several billion pounds to the above figure.
Possibilities
Barriers
Innovative Business Models with Environmental Benefits
67
.
• Shared responsibilities Barriers may occur due to the national setup for sharing of responsibilities. An example from US transport is that it is the state or local governments that own and operate roads, while a substantial amount of the funding is the responsibility of the federal government which sets out specific re-quirements that must be fulfilled in any project.
• Financing concerns Restrictions on financing may constitute a barrier to PPP. Returning to the example from the transport sector, this can be in the form of limitations to e.g. road pricing limiting the contractor's ability to earn an income. It may also be different tax codes for government and private bonds for infrastruc-ture projects or credit policies.
There are also barriers on the part of the private partner. The construction in-dustry can be characterised as a complex industry with relatively low barriers to entry and exit (Ezulike 1997). However, projects that are relevant for PPP or DBFO are often long-term capital intensive projects that have high require-ments for the SPV. This is one of the reasons why contracts are often awarded to consortia.
In a study carried out by Ezulike in 1997, contractors were asked to identify the main barriers to entry that hinders their involvement in the PFI market, which includes the DBFO. The main barriers identified were:
• Lack of appropriate skills DBFO requires involvement through the whole life cycle of the project and not only the construction phase. Many skills that are traditionally outside the scope of a contractor are needed and both management capabilities, technical and financial ability must be present (Ezulike 1997).
• High participation cost The cost of participating in bidding for projects is considered a substantial barrier to entry. A consortium that is bidding for a project has to deal with a variety of issues even before knowing if the contract is awarded to them, hereunder contracts, construction, design, finance, legal frameworks etc. that all involve cost at the bidding stage (Ezulike 1997).
• High project values The DBFO projects are often capital intensive and require a large invest-ment. The consortium must be geared for this cost (Ezulike 1997).
• Risk The private contractor holds the risk of the project hereunder risks relating to design and construction, commissioning and operation, demand, residual value, technology and financing (Ezulike 1997).
• Credibility and contacts and demands on management time PFI and DBFO projects are mainly awarded to a consortium. This involves that the contractor must gather partners from outside into a partnership for
Innovative Business Models with Environmental Benefits
68
.
the project. This requires both contacts and the ability to build a viable consortium for the duration of the project and it also requires time input from management.
9.3 Chemical Management Services
In the traditional relationship between chemical suppliers and their customer, the supplier makes profit by maximising the volume of sold chemicals. Chemi-cal management services (CMS) constitute a shift from such a traditional sup-plier relationship to a strategic alliance between the chemical supplier and its customer. Instead of purchasing chemicals the customer buys chemical man-agement services. The chemical provider takes a direct role with respect to managing the customer's chemicals throughout the chemical life cycle, includ-ing the purchasing, managing and keeping track of chemicals (CSP, 2004). Thereby a shift takes place in the responsibility for management of the cus-tomer's production processes and the quality of final products.
Definition CMS can be defined as a business model "in which a customer engages with a service provider in a strategic, long-term contract to supply and manage the customer's chemicals and related services" (Stoughton & Votta, 2003). The management of chemicals is outsourced to the chemical supplier. The chemical service provider is specialised in managing chemicals and outsourcing the management of chemicals allows the company to focus on its core business ac-tivities. The chemical service provider assists the company in making economic savings on chemical management.
In traditional chemical management the chemical user purchases the chemicals from a range of different chemical suppliers, known as tier I suppliers. In CMS the chemical service provider becomes the tier I supplier of the chemical user, and the chemical provider purchases chemicals from a range of sub-suppliers, known as tier II suppliers.
Chemical Strategy Partnerships (CSP) is a non-profit organisation that since 1996 has advised manufacturing companies on how they can implement CMS. In 2000 and 2004 CSP has conducted comparable studies of the CMS industry's structure, conduct and performance in the US. Moreover, CSP has made an ar-ray of case studies of US companies that have introduced CMS. From 2000 to 2004 the CMS market in the US has grown about 50 % and made up a market of US$ 1.22 billion. In 2004, CMS has reached the largest market penetration in the US in the automotive industry where 75-80 % of the industries are utiliz-ing CMS. Air transportation maintenance (40-50 %), electronics (30-40 %), and aerospace manufacturing (25-30 %) are other sectors with a large market pene-tration. From 2000 to 2004 CMS had grown from application in 4 to 11 differ-ent industrial sectors (CSP, 2004). In Europe CMS is to a wide extent applied within the automotive and aerospace industries. CMS is growing in Europe but is not applied as widespread as in the US (Oldham & Votta, 2003).
Chemical Strategy Partnership
Innovative Business Models with Environmental Benefits
69
.
More than half of the US companies that use CMS are large companies with a sale of more than US$ 1 billion annually and more than 10,000 employees (CSP, 2004).
In a study from 2006, Kortman et al. investigate the dissemination of CMS in EU. In the study the terminology Chemical Product Services (CPS) is used for CMS. The study distinguishes between two kinds of CPS. In CPS-I the chemi-cals are still sold by volume and extra service is sold on an itemised basis or a cost incorporated in the chemical prices. In CPS II the supplier is paid based on the performance of the service sold. CPS II is similar to CMS. There is not al-ways differentiated between findings regarding CPS I and CPS II business models. The industrial groups where CMS is most widely applied are in ser-vices connected with solvents and coatings followed by lubricants, industrial gases, adhesives, water treatment chemicals, tanners and printing ink (Kortman et al., 2006: 24).
Solvents
It is estimated that the market share of solvents used for cleaning/degreasing purposes is 'high'24 in the car and transport equipment industry and the metal product industry, and 'low to medium' in the machine and electrical equipment industry and in the metal products industry.
Paints/coatings
The application of CPS for painting and coating has a high market penetration in the car industry. In the automotive industry, from 40 to 70 % of painting processes are serviced and from 30 to 45 % of the companies in the aerospace and aircraft industry are using CPS for painting and coating their products.
Lubricants
CPS-based models with service of lubricants are used in the automotive sector and in the metal industry. It is estimated that the application of CPS within lu-bricants has a 'medium' dissemination.
Water treatment chemicals
Chemicals are used in boiler treatment, cooling systems treatment and waste-water treatment. The use of CPS in this sector is estimated as 'low'. Industrial gases
Industrial gases are used in the process of manufacturing products. A low share of the contracts is CMS (Kortman et al., 2006).
The industries where CPS are most widely applied are the car and transporta-tion industries, metal products manufacturing, and machine and electrical equipment industries. Only in the car industry is the application of CMS con-tracts widely applied.
24 The dissemination of the CPS is 'high' if the estimated market penetration in sales consti-
tutes 30 % or more, 'medium' refers to an estimated market penetration of 1-20 % and 'low'
is a market share below 10 %.
Dissemination of CMS in EU
Innovative Business Models with Environmental Benefits
70
.
The application of CMS within adhesives and inks (printing) and tanners is un-sure. The CMS concept also has a potential within agrochemicals, where con-tracts can be set up, in which the supplier guaranties the farmer a certain per-formance for the crop in terms of quantity and quality. The supplier specifies a plan for the application of the product. The concept has been used in the US but has not been applied in Europe.
The character of the chemical compounds is decisive for the potential of setting up CMS. Base chemicals include petrochemicals and derivates and basic in-organics. The application of these products does not require a high level of technical support, and it is therefore concluded that basic chemicals offer little opportunities for suppliers and customers to develop CMS. Fine chemicals are chemical compounds that are made in relatively small amounts in a pure state. The products are used to formulate other products. The application of fine chemicals is considered not suitable for setting up CMS (Kortman et al., 2006).
9.3.2 Business rationale
The business model entails a shift in the way the chemical provider gains profit. Instead of making profit on the volume of sold chemicals the chemical provider is paid according to the service it provides, i.e. the management of chemicals. Contracts for CMS can be designed in various ways.
Performance based contracts
• Here the chemical provider is paid a fixed cost per unit of production. This model can be applied where the production unit is well defined and con-stant, an example is coating of car parts in the automobile industry. Here the chemical producer has an incentive to reduce the consumption of chemicals. (Mont et al., 2006; CSP, 2004)
Shared savings contracts
• The chemical supplier and the customer agree on a chemical budget. Sav-ings on chemicals that entail a chemical consumption below the agreed chemical budget are shared between the chemical provider and its cus-tomer. This contractual model gives the provider an incentive to improve process efficiency and to reduce the consumption of chemicals (Mont et al., 2006).
Cost base-line based contracts
• The purchase cost of chemicals is based on the pattern of use of chemicals. The purchase costs of chemicals are limited and the chemical supplier is guaranteeing a certain reduction of chemical consumption over the time of the contract. (Mont et al., 2006).
Compensation mechanisms
Innovative Business Models with Environmental Benefits
71
.
Other compensation measures are also used, and the contracts are set up by combining different compensation measures. Usually it is the customer who decides the combination of compensation measures (CSP, 2004).
In the year of implementation of a CMS the net savings gained are from 5-20 % and within the first three years most companies have annual savings of from 6 and 10 %. After 5 years the savings are in the magnitude of 0-0.5 % per year. The savings are primarily obtained through reducing the chemical consump-tion, reducing the prices of chemicals and improving manufacturing processes (CSP, 2004).
Case example: PPG Industries
Background PPG Industries is a worldwide supplier of paints and coating, chemicals, glass and fibre glass and optical products. PPG takes part in the manufacturing proc-esses in a broad range of industries, where the company offers both products and services. In the automotive industry the services offered are chemical man-agement, process management, industrial services and special services custom-ised for the customer (http://corportal.ppg.com).
PPG industries cooperate with General Motors (GM)/Opel on a process and chemical management programme at GM's plant in Gliwice, Poland. The plant was built in 1997 and from 1998 production with CMS was initiated. The man-agement of anticorrosion treatment, water treatment, wastewater treatment and waste management is delegated to PPG. PPG's CMS programme includes direct materials, process management, mix room, logistics, storage, quality control, maintenance, cleaning, indirect materials, consumables and chemical manage-ment systems. PPG's personnel at the plant are fully integrated in GM's proc-esses (Oldham & Votta, 2003, Barbara Mucha, 24 April 2008). The basic idea is that by outsourcing part of the production GM can focus on their core busi-ness. From the beginning PPG had to comply with the requirements that GM set up. In terms of the anticorrosion treatment PPG had to fulfil specific process requirements. These requirements specified what chemical product should be used and how the processes should be performed. Other requirements were set up as general requirements, e.g. the waste water had to comply with specifica-tion for the pH level. (Barbara Mucha, 24 April 2008)
It is possible to distinguish between chemicals that are used directly and chemi-cals that are used indirectly in the processing. Directly used chemicals are ap-plied directly to the products, e.g. car doors. The products that are used indi-rectly are all the products that not are applied directly, e.g. solvents or cleaning products. PPG is responsible for the purchase of all chemicals used at the plant. The chemicals used indirectly may be change without asking GM, whereas GM has to approve the substitution of direct chemicals. This reduces the risks for both GM and PGG as GM is in charge of the products used and the risks of er-rors are reduced. (Barbara Mucha, 24 April 2008).
Investments All initial investments at the plant were made by GM.
The contract between PPG and GM is cost-line based. PPG is paid by cost per unit and the consumption of chemicals is calculated based on expected use. In
Contract
Innovative Business Models with Environmental Benefits
72
.
the anticorrosion processing PPG orders an amount of chemicals equal to the expected consumption, and PPG's payment is settled on a half yearly basis based on the actual chemical consumption. Spillage at the plant that PPG is not responsible for is paid by GM. This mechanism ensures that both PPG and GM have incentives to reduce spillages and errors. PPG has taken a risk by setting up a fixed price per unit. There is, however, some flexibility in the contract be-tween PPG and GM to adjust price mechanisms. (Barbara Mucha, 24 April 2008).
As a part of the contract PPG is obliged to continuously reduce the cost per unit (CPU). The reduction of CPU is gained by various initiatives, among others reduction in the use of chemicals. Only GM gains from the savings and there are no gain-sharing mechanisms in the contract. The continuous improvements are developed in cooperation between PPG and GM. On a monthly basis meet-ings are set up where the potential savings and improvements are discussed, and PPG is required to come up with suggestions for process and quality im-provements. Improvements have to be implemented on a yearly basis. (Barbara Mucha, 24 April 2008).
The environmental improvements gained are in terms of reduction in use of chemicals, reduction in water and energy use and substitution of chemicals with less toxic chemicals. The environmental improvements include reduction in chloride concentration in wastewater and reduction in the amount of wastewater sludge. The savings gained by the programme have led to monthly savings in the magnitude of € 10,000 (data from 2003). The plant complies with the local environmental standards, and PPG assists GM in being capable of meeting fu-ture environmental regulations (Oldham & Votta, 2003; Barbara Mucha, 24 April 2008).
Case example: Houghton
Background Houghton is one of the world's largest suppliers of specialist industrial production lubricants and fluid management services. Houghton serves indus-tries within aerospace, aluminium, automotive, bearing, defence, food and bev-erage, machinery fabrication, medical devices, metal finishing, offshore and steel (http://www.houghtonintl.com).
Houghton's fluid management services are based on a fixed price business model, where Houghton takes over the responsibility for the customer's man-agement of lubricants. In the fluid management services Houghton supplies and manages the fluids at the customer's site. The fluid management services are designed to match the customers demand. The activities included in the man-
Continuous im-provements
Environmental im-pact
The compensation mechanisms in the chemical management services that PPG pro-vides for GM/Opel are based on fixed price contracts without gain-sharing mecha-nisms. Agreements about continuous improvements are included in the contracts.
The environmental impact of PPG's business model is a reduction in chemicals used and improved waste management.
Innovative Business Models with Environmental Benefits
73
.
agement services vary from periodical visits to operators based permanently at the customer's production site. The range of involvement at the site depends on the contract that is set up. The contracts vary from € 5,000 to € 1,000,000 a year. In order to be feasible for Houghton to have technicians employed perma-nently in the customer's plant the yearly sale of services must be around € 100,000 (Declan Grant, 9 May 2008).
The lubricants are used to maintain the customer's machines. In the automotive industry a part of the engine manufacturing process is the drilling of holes in an aluminium board where the engine components are later assembled. The ma-chine that drills the holes is maintained with coolants. Through use of the ma-chine the coolants become dirty and in the end the coolants have to be substi-tuted with clean fluids. Fluid management services are based on Houghton hav-ing a better understanding of the fluids. Houghton's technicians are able to pro-vide a more efficient management of the fluids through continuous monitoring of the condition of the fluid, e.g. with respect to bacteria and pH, and by apply-ing recycling equipment to clean and reuse the fluids. In this way the lifetime of the fluids are considerably prolonged. In a worst case scenario of bad fluid management, it may be necessary to change the fluids every week. By improv-ing the fluid management, Houghton is capable of extending the lifetime of the fluids to 6 months. The savings gained from fluid management services are due to both hard and soft savings. Hard savings are gained by considerable reduc-tions in the use of fluids and by reduced disposal cost of discharged lubricants. The fluid waste can be reduced by 90 %, which in large plants can entail reduc-tion in disposal costs corresponding to € 90,000 annually. Soft savings are ob-tained by reducing the downtime on the plant and by avoiding additional labour costs (Declan Grant, 9 May 2008).
Visteon One of Houghton UK's customers is Visteon. Visteon is a worldwide supplier of integrated systems to automobile manufactures. The contract with Houghton was set up in 2003. Until then Visteon had purchased the lubricants from their former supplier and was in charge of applying the products. Based on a tender-ing process Houghton offered Visteon fluid care services. The contract includes four of Visteon's plants. Only at Visteon's plant in Belfast is the application of lubricants entirely outsourced to Houghton. The first contract ran for three years, where Houghton guarantied a 6 % yearly saving during the contract. As part of the contract a gain-sharing mechanism was in place where savings ex-ceeding the annual 6 % would be shared between Houghton and Visteon. Vis-teon's background for setting up the gain-sharing mechanism was to give Houghton an incentive to make additional savings. The gain-sharing mecha-nism has only been used to a limited extent. After the first three years, the con-tract was renewed. As most of the easily achievable savings were achieved, the new contract has lower targets for annual savings. Houghton made the initial investments that were needed to set up the cooperation. This includes feasibility studies and establishment of recycling equipment at some of Visteon's plants. The annual costs of lubricants at the four plants are about £ 400,000. In com-parison the annual use of lubricants was £ 700,000-800,000 when the contract was initiated. A part of these savings is due to reduction in the volume of pro-duction at the plants. Visteon had no problem in establishing the cooperation with Houghton. At one of their plants some of the employees were suspicious
Innovative Business Models with Environmental Benefits
74
.
about the cooperation. But it turned out that Houghton's employees had suffi-cient capacities to carry out the work. The former lubricant supplier had not made any attempt to assist Visteon in reducing the chemical consumption, and this left plenty of opportunities for Houghton to make savings (James Morti-mer, 9 June 2008).
Contract The contracts Houghton set up run for a minimum of 3 years. Some contracts are set up with gain-sharing mechanism. If Houghton is capable of achieving savings above an agreed level, the additional savings are shared. A typical model is that savings exceeding € 500,000 are shared evenly between Hough-ton and the customer. It depends on the customer whether the contract contains agreements on gain-sharing. Houghton often aims at continuous improvement, but this is normally not mentioned in the contracts. The achievement of con-tinuous improvements improves the relationship with the customer (Declan Grant, 9 May 2008).
Investments The implementation of fluid management services demands investments at the customer's site. Such investment ranges from € 20,000 to € 100,000. In many cases Houghton makes these investments. Houghton, however, only makes the investments if it is economically feasible. If the sale of fluid care products is too low, there is a lack of incentive for Houghton to engage in a profound co-operation. The large companies that have implemented fluid management ser-vices with Houghton technicians situated at the plant are located in the larger European countries such as Spain, Italy and UK. The market penetration for fluid management services in smaller countries such as Ireland, Switzerland and Denmark is limited (Declan Grant, 9 May 2008).
The advantage to Houghton in engaging in fluid management services is busi-ness security. The customer is obliged to buy Houghton's services as long as the contract runs. This ensures a certain market share to Houghton. Further, the business model improves the relationship between Houghton and the customer. Trust between Houghton and the customer is an important prerequisite for set-ting up the business model. New customers are primarily obtained through ref-erences and a good reputation. Most customers accept that they are not experts in fluid care management and are therefore willing to outsource the manage-ment of lubricants (Declan Grant, 9 May 2008).
The environmental gains from fluid management services are that less lubricant is used, and therefore less fluid is produced and the volume of fluid lubricant waste is reduced. This entails a reduction in CO2 emissions. Most of Hough-ton's customers have an ISO 14001 certification. By managing the customer's lubricants, Houghton helps the customers to improve their environmental per-formance in accordance with the ISO 14001. Houghton UK has no calculations of the environmental savings gained from implementing their business model.
Risks The contracts are based on fixed prices, so if it turns out that the consumption of lubricants is higher than estimated, Houghton will have to suffer from the losses. Therefore it is crucial for Houghton to make accurate calculations of the consumption of chemicals. If there should be production losses caused by downtime due to mismanagement of the production facility, it would be a dis-
Environmental im-pact
Innovative Business Models with Environmental Benefits
75
.
cussion between Houghton and the customer who bears the responsibility (Declan Grant, 9 May 2008).
Grundfos is a large Danish manufacturer of pump solutions. The company is situated in Bjerringbro, Denmark. 2,800 persons are employed in the produc-tion of pumping equipment. The production takes place at 8 plants. 6 of the plants are situated within a radius of 2 km. At the 8 sites a total of 3½ persons are employed full-time to maintain the production equipment with lubricants and managing the use of fluid care products. Preventive maintenance and man-agement of the production equipment are crucial to Grundfos in order to in-crease the lifespan of the equipment and to reduce failures of the production line. The use of lubricants constitutes significant costs, but compared to large companies, e.g. within the automotive industry, the application of fluid care products at Grundfos does not have a major impact on the overall cost situation.
3 years ago a benchmark was performed to compare whether the current situa-tion could be improved through outsourcing. The cost-benefit analysis showed no significant improvement therefore the company decided to follow the exist-ing in-house process.
Grundfos has not set up targets for reduction of the consumption of lubricants. This is due to the relatively low economic significance of the use of lubricants and because the benchmark showed that the internal process is quite competi-tive to what was used by a similar manufacturer who had outsourced the proc-ess. Moreover, Grundfos buys their fluid care products at a competitive price (Jørgen Hejlesen, 22 May 2008).
9.3.3 Environmental case
CMS constitutes a potential win-win situation for the involved companies and the environment. In the 2004 study of the CMS industry's performance the chemical providers were asked how they help their customers to reduce sources of emission. 54 % of the providers stated that they assisted their customers to reduce emissions by reducing the amount of chemicals being used, and 46 % reduce the emissions by establishing reuse or recycle alternatives. More than 30 % of the providers stated that they helped their customers to reduce emissions through chemical substitution and the same percentage of providers held that
Lubricant manage-ment at Grundfos
The compensation mechanisms in Houghton's fluid management services are base on fixed price contracts. Some of the contracts include gain-sharing mechanisms.
The environmental impact of the Houghton's business model is a reduction of chemi-cals used and improved waste management.
A prerequisite for extensive application of fluid management services is that the cus-tomers company has a high demand for fluid care products.
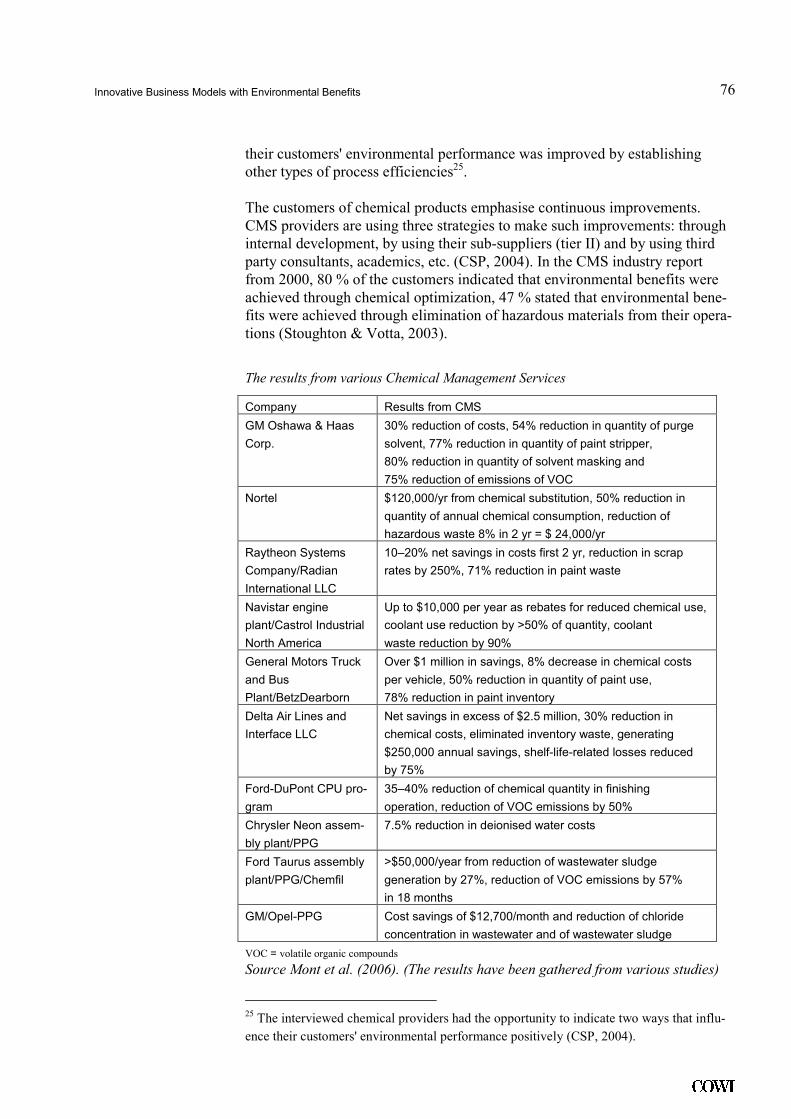
Innovative Business Models with Environmental Benefits
76
.
their customers' environmental performance was improved by establishing other types of process efficiencies25.
The customers of chemical products emphasise continuous improvements. CMS providers are using three strategies to make such improvements: through internal development, by using their sub-suppliers (tier II) and by using third party consultants, academics, etc. (CSP, 2004). In the CMS industry report from 2000, 80 % of the customers indicated that environmental benefits were achieved through chemical optimization, 47 % stated that environmental bene-fits were achieved through elimination of hazardous materials from their opera-tions (Stoughton & Votta, 2003).
The results from various Chemical Management Services
Company Results from CMS
GM Oshawa & Haas
Corp.
30% reduction of costs, 54% reduction in quantity of purge
solvent, 77% reduction in quantity of paint stripper,
80% reduction in quantity of solvent masking and
75% reduction of emissions of VOC
Nortel $120,000/yr from chemical substitution, 50% reduction in
quantity of annual chemical consumption, reduction of
hazardous waste 8% in 2 yr = $ 24,000/yr
Raytheon Systems
Company/Radian
International LLC
10–20% net savings in costs first 2 yr, reduction in scrap
rates by 250%, 71% reduction in paint waste
Navistar engine
plant/Castrol Industrial
North America
Up to $10,000 per year as rebates for reduced chemical use,
coolant use reduction by >50% of quantity, coolant
waste reduction by 90%
General Motors Truck
and Bus
Plant/BetzDearborn
Over $1 million in savings, 8% decrease in chemical costs
per vehicle, 50% reduction in quantity of paint use,
78% reduction in paint inventory
Delta Air Lines and
Interface LLC
Net savings in excess of $2.5 million, 30% reduction in
chemical costs, eliminated inventory waste, generating
$250,000 annual savings, shelf-life-related losses reduced
by 75%
Ford-DuPont CPU pro-
gram
35–40% reduction of chemical quantity in finishing
operation, reduction of VOC emissions by 50%
Chrysler Neon assem-
bly plant/PPG
7.5% reduction in deionised water costs
Ford Taurus assembly
plant/PPG/Chemfil
>$50,000/year from reduction of wastewater sludge
generation by 27%, reduction of VOC emissions by 57%
in 18 months
GM/Opel-PPG Cost savings of $12,700/month and reduction of chloride
concentration in wastewater and of wastewater sludge
VOC = volatile organic compounds
Source Mont et al. (2006). (The results have been gathered from various studies)
25 The interviewed chemical providers had the opportunity to indicate two ways that influ-
ence their customers' environmental performance positively (CSP, 2004).
Innovative Business Models with Environmental Benefits
77
.
The table above shows the results of CMS from a range of programmes. The results origin from various studies and have been gathered by Mont et al. (2006).The results include large economic savings, gained among other by re-duction in the consumption of chemicals.
9.3.4 Possibilities and barriers
In 2003 a study was conducted on CMS among a range of European companies connected to the chemical industry. Based on the study various drivers and bar-riers for CMS in Europe was identified (Mont et al., 2006). The chemical sup-pliers and the customers had different views on the barriers and drivers for CMS.
Drivers Due to an increased competition and declining margin on the traditional market for chemical products, CMS improves the competitive position of the chemical suppliers. Applying CMS allows the suppliers to introduce new value adding products and services that help to maintain growth in the business. CMS can constitute an alternative for the chemical suppliers to price underbidding by their competitors (Mont et al., 2006).
CMS helps to improve the relationship between the chemical supplier and the customer and to create mutual trust. This may lead to enhanced customer loy-alty and long-term contracts. (Mont et al., 2006) Depending on the kind of con-tracts that are set up, CMS can allow the supplier to profit from gain-sharing with the customer (Mont et al., 2006).
By outsourcing the chemical management the customer can focus on his core activities. The customer gains cost savings from CMS through a reduction in the consumption of chemicals, through lower chemical prices and by reducing the number of accidents and associated risks. As the supplier in some cases purchase chemicals for customers, they can negotiate a discount that the com-pany could not do himself. Applying CMS can lead to continuous improve-ments in the company's environmental performance (Mont et al., 2006).
The EU regulation on Registration, Evaluation and Authorizat (REACH) came into force in June 2007. The purpose of the regulation is to improve the protec-tion of human health and the environment by an earlier and better identification of the properties of chemical substances. The directive calls for substitution of the most dangerous chemicals where alternatives are available. The providers and suppliers of chemicals will have to provide information on the properties of their substances. (http://www.chemicalstrategies.org). The directive constitutes a driver for chemical users to subsidise environmentally hazardous chemicals with environmental friendlier products.
Barriers A large barrier to introducing CMS among chemical suppliers is a traditional mindset, where profit depends on the quantity of chemicals they sell. Barriers to the suppliers are also that the customers are not fully aware of the concept and do not have a full understanding of the life-cycle costs of chemicals. Some customers are reluctant to apply CMS as they lack trust in the chemical pro-
Innovative Business Models with Environmental Benefits
78
.
vider's capacities to take care of their chemical management. For CMS to be feasible a certain amount of services has to be sold (Mont et al., 2006).
It is crucial for the customers that CMS does not constitute a threat to the effi-ciency of their processes and the quality of their products - which in the end will affect the competitiveness of the company.
For CMS to be financially feasible for a company the company has to be of a certain magnitude, otherwise they will not be able to outsource al of the proc-ess. Transaction costs are connected to making a baseline of the chemical man-agement costs, to review the existing production line and to go thorough a bid-ding process. These transaction costs may constitute a problem to the imple-mentation of CMS (Oldham & Votta, 2003).
The chemical user may not see the use of chemicals as a priority. The cost of chemical use is often calculated to comprise less than 1 % of the company's operating costs. These calculations do not often include the actual life cycle cost of chemical usage. Lack of cost awareness of chemical use and poor data management lead to difficulties in showing the potential benefits to the man-agement (Oldham & Votta, 2003; CSP, 2004).
The chemical customers indicate that there is a lack of CMS providers and that they have difficulties in understanding the market of CMS, what services the different suppliers really offer. If a company has to change supplier in order to engage in cooperation on CMS, the company has to build up a trust relationship with the new supplier (Mont et al., 2006). Trust between supplier and customer is crucial for CMS to succeed, and the lack of trust can present a large cultural barrier to CMS (Oldham & Votta, 2003).
If the chemical provider's payment is based on a pay per unit contract, the pro-vider may have a lack of incentive to replace chemicals with alternative chemi-cals that are better for the environment but more expensive (Mont et al., 2006).
9.4 Resource Management
Definition Resource Management (RM) is a business model that is based on changing the relationship between waste-generating organisations and their waste contrac-tors. Traditional waste and recycling contracts feature "a profit incentive to contractors to maximize disposal levels (hauls) and/or a limited scope of ser-vice with multiple contractors handling separate waste streams or recyclables" (US EPA, Year unknown).
RM gives the waste contractor incentives to emphasize cost-effective resource efficiency by preventing, recycling and recovering waste and by limiting the hauling and disposal of waste (Ligon et al., 2001).
The differences between traditional hauling and disposal contracts and RM contracts are shown in the table below. RM contracts give an incentive for the contractor to minimize the production of waste.
Innovative Business Models with Environmental Benefits
79
.
RM contracts are based on three premises:
• That there exist opportunities to cost effectively reduce waste and improve recycling.
• That contractors will try to achieve such gains if they are offered proper financial incentives.
• The financial incentives are supported through cost-effective improve-ments to the current waste/recycling system (US EPA, Year unknown).
RM may include external as well as internal handling of waste. The external handling includes monitoring/reporting and recovery services. The internal handling of waste can be optimised by more efficient material use, better stor-age and ordering. The waste stream can thus also be minimised by changing the product or process design (US EPA, 2001). RM can be said to be an approach to move waste management up the reduce - reuse - recycle hierarchy.
The type of RM services stretch from external changes in the waste handling to taking over all of the customer's waste management and making continuous improvements through changes in product and process handling.
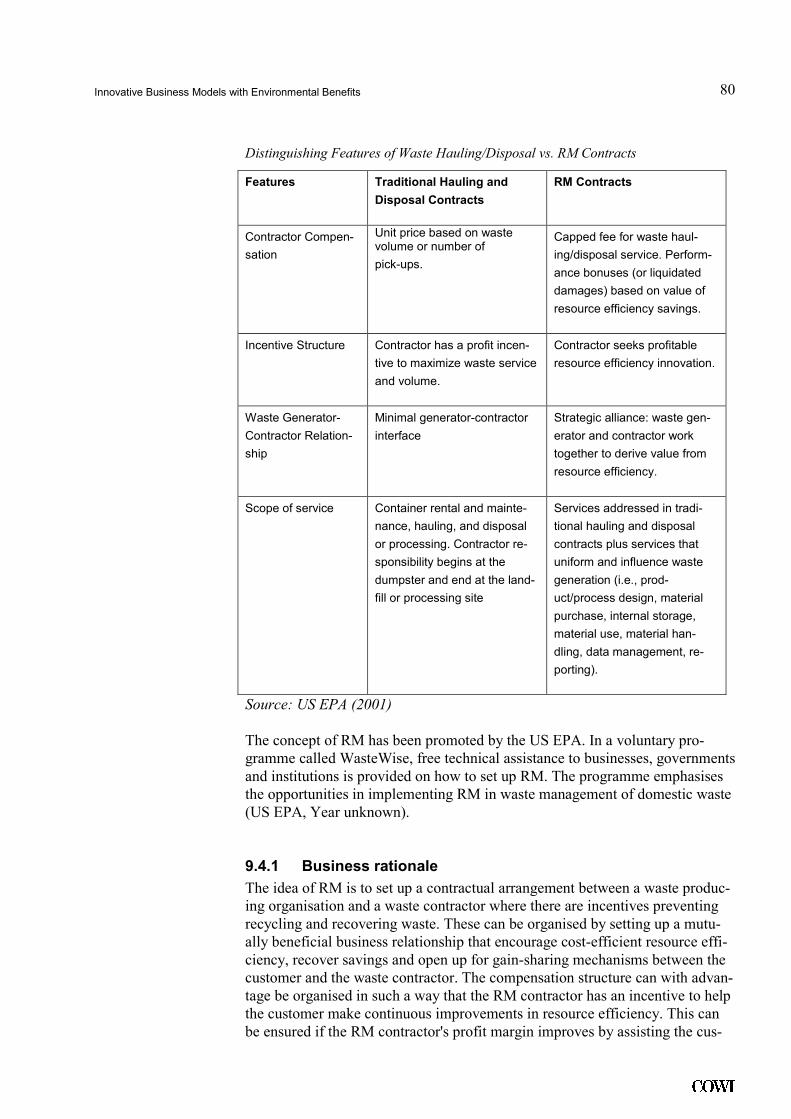
Innovative Business Models with Environmental Benefits
80
.
Distinguishing Features of Waste Hauling/Disposal vs. RM Contracts
Features Traditional Hauling and
Disposal Contracts
RM Contracts
Contractor Compen-
sation
Unit price based on waste volume or number of
pick-ups.
Capped fee for waste haul-
ing/disposal service. Perform-
ance bonuses (or liquidated
damages) based on value of
resource efficiency savings.
Incentive Structure Contractor has a profit incen-
tive to maximize waste service
and volume.
Contractor seeks profitable
resource efficiency innovation.
Waste Generator-
Contractor Relation-
ship
Minimal generator-contractor
interface
Strategic alliance: waste gen-
erator and contractor work
together to derive value from
resource efficiency.
Scope of service Container rental and mainte-
nance, hauling, and disposal
or processing. Contractor re-
sponsibility begins at the
dumpster and end at the land-
fill or processing site
Services addressed in tradi-
tional hauling and disposal
contracts plus services that
uniform and influence waste
generation (i.e., prod-
uct/process design, material
purchase, internal storage,
material use, material han-
dling, data management, re-
porting).
Source: US EPA (2001)
The concept of RM has been promoted by the US EPA. In a voluntary pro-gramme called WasteWise, free technical assistance to businesses, governments and institutions is provided on how to set up RM. The programme emphasises the opportunities in implementing RM in waste management of domestic waste (US EPA, Year unknown).
9.4.1 Business rationale
The idea of RM is to set up a contractual arrangement between a waste produc-ing organisation and a waste contractor where there are incentives preventing recycling and recovering waste. These can be organised by setting up a mutu-ally beneficial business relationship that encourage cost-efficient resource effi-ciency, recover savings and open up for gain-sharing mechanisms between the customer and the waste contractor. The compensation structure can with advan-tage be organised in such a way that the RM contractor has an incentive to help the customer make continuous improvements in resource efficiency. This can be ensured if the RM contractor's profit margin improves by assisting the cus-
Innovative Business Models with Environmental Benefits
81
.
tomer in reducing waste generation and increasing reuse and diversion. The WasteWise programme suggests two main options to establish compensation mechanisms (US EPA, Year unknown).
Pass-Through of Service Costs with 'Shared Savings' and Performance Bonus. In one model the contractors provide the requested waste services e.g. in terms of tip fees, hauling fees, container rental on a 'Pass-Through of Service Costs' basis. The cost pass through is based on biddings for taking over the existing waste services. When the contractor implements changes that on a permanent basis decreases costs, the contractor gets a share of the savings gained. The kinds of improvements that the contractor can implement include over-all re-duction of waste generation, waste diverting more materials, making handling and hauling procedures more efficient, 'right-sizing containers' in order to make cost savings and make behavioural changes. The gain-sharing mechanisms can be designed so that the savings are split between the waste contractor and the customer (e.g. after a 50/50 % sharing model), or that the savings gained above a predetermined level are shared (e.g. after a 70/30 % model in favour of the waste contractor).
Fixed Cost with Guaranteed Cost Reduction. The second model is based on the waste contractor taking over the existing waste services at a predefined annual cost. The costs are calculated based on the previous year's total cost and include guarantees for cost reduction. The cost reduction could be of 5 % annually. If the contractor is confident that savings larger than 5 % can be realised and that there is a potential for continuous improvements. This model gives the contrac-tor an incentive to provide the waste services in an efficient way as the com-pany gains profit directly by this (US EPA, Year unknown).
Establishing a RM programme may entail initial investments. The way the in-vestments are split between the waste contractor and the customer must be set-tled before the programme is set up.
Case study: General Motors
Background The concept of RM is coined by GM. In 1997 GM realised that the existing hauling and disposal contracts were inadequate to produce resource efficiency across GM's 70 North American facilities. The first site were RM was imple-mented was in Lake Orion Facility Assemble Plant. An audit of the site's waste management showed a potential for considerable improvements.
Waste management In such assemble plants thousands of components are assembled to final vehicles. All these components, e.g. instrumental panels, window driers, small electronic parts, are packed in wooden boxes, cardboard, paper and plastic. Many components come on pallets. Some of these package material is return-able other are not. If the components are manufactured overseas, e.g. in China, it does not make sense to return the package material e.g. wooden boxes and pallets. One challenge was to minimise the amount of package waste. Another source of waste generations originates from coating of car parts. The paint used for coating is extremely expensive. Even in the best plants it is only possible to get 60-70 % of the used paint on the car parts. The rest of the volatile paint has to be captured and disposed. A water recycling process is used as method for
Compensation mechanisms
Innovative Business Models with Environmental Benefits
82
.
capturing the paint. The paint is very sticky. It has to be made less sticky and removed from the water. This waste product is called paint sludge. If the mois-ture content of the paint sludge can be reduced it is more suitable as a fuel. Other types of waste chemicals, e.g. oil products, also have to be disposed cor-rectly.
Inspired by the CMS system GM already had implemented at their sites a waste management system was developed. Million of dollars were used to haul and dispose waste. The idea was to consider waste as a resource and to minimise the amount of hauled and disposed waste. GM needed to bring together a team of people that had incentives to eliminate the production of waste and to en-courage reuse, recycling and correct disposal of waste. GM made a review of costs associated with the waste handling and the kind of waste services that they wanted to outsource. Potential tenders were invited to the plant to identify where savings could be made. If the Resource Management Contractor (RMC) was able to eliminate the production of waste or show GM how to reuse or re-cycle material, the costs for hauling and disposal of waste would be reduced and thereby the contractor could make a profit.
The amount of paint sludge that is generated depends on the number of vehicles produced at the plant. The need for heating of the plant is independent on the size of the production, and ashes from burning coal are therefore fixed. The contracts set up with the contractor takes into account whether the amount of waste is fixed or variable.
Instead of having an array of tyre I waste contractors, all waste management is outsourced to one contractor, the RMC. The RMC is responsible for developing a resource management programme on how to eliminate, reduce and reuse waste. This includes a total system analysis and a source operation programme where the closest recycling centre is identified. The RMC has employees situ-ated fulltime on GM's plant. The services covered by the RMC include tradi-tional hauling and disposal of waste and consultancy on how to recycle and re-use material, and advises on what type of container to use in order to reduce costs. Moreover, the RMC advise GM on how to handle waste correctly, e.g. in order to prevent leakages. The RMC are responsible for making the environ-mental reports and material safety data sheets.
The contracts are set up for a three year period. The first year the contract runs, the RMW contractor gets 30 % of the savings that are achieved. The second and third years GM get 100 % of the savings. The contracts require continues improvements throughout the time period that the contract runs. When the con-tract ends, the contract are renegotiated, and if the contractor is able to improve the waste management further, gain sharing mechanisms are included in the new contracts. To increase the incentive for the RSC further, it is considered to increase the contractor's share of savings from 30 to 50 %. This is, however, not yet implemented.
Risks The RMC is assuming all risks associated with the waste management. If the contract states that the plant has to be landfill free, the contractor is liable of ensuring this. If for instance the facility that receives the paint sludge is closing
Resource Manage-ment Contractor
Gain sharing mecha-nisms
Innovative Business Models with Environmental Benefits
83
.
down, the contractor is responsible for proper handling of the paint sludge even if this entails increased costs for transportation. Retooling of the assemble plant in order to manufacture a new vehicle entails a total stop of the production line - and thereby a dramatic reduction in the amount of produced waste. The vari-able costs for waste are thereby zero. In the past GM has continued to pay the RMC the costs of having employees situated at the plant. In some cases the production line has been closed down in up to 2 months. In connection with future retooling of the production line the RMC might have to bear the risk of paying the salary of the on-side employees themselves.
Most of GM's costs associated with implementing Resource Management are related to making cost books of past and present costs connected with waste management and to identify the waste services that the RMC should take over. Some investments can be associated with acquiring new containers and/or to bring in new compactors.
The integration between a RM and a CMS system is crucial. Proper handling of waste in the CMS system impacts directly on the RM system. Clay is for in-stance very suitable for capturing paint. The problem is, however, that this method entails very huge amounts of paint sludge that is not suitable for reuse of incineration.
Results The result from the RM has among other things been improved processing of paint sludge which has entailed higher solid content of paint making the sludge more attractive as a fuel. Opportunities for using paint sludge to development of new - but inferior paint - are also being investigated. 50 % (ca. 23 plants) of the North American plants where RM is implemented are planned to be zero landfill plants by 2010 (Warren Underwood, 22 July 2008).
One year after implementing the RM models at several of their production sites, GM realised a 20 % reduction on overall waste generation (30,000 ton) and a 65 % increase in recycling (from 50,000 to over 82,000 tons). In addition to this the company had substantial reductions in the company's waste management costs (the waste management costs were decreased about 15-30 %). RM is im-plemented in all of GM North America's manufacturing facilities, where a sin-gle supplier manages all waste at each plant. By 2007 the RM programme has here led to savings in the magnitude of US$ 6 million over the previous three years (GM, 2007). Similar waste management systems are implemented in most of the automotive industry. Some of the larger of GM's suppliers and a large company as BASF are using similar systems (Warren Underwood, 22 July 2008).
Innovative Business Models with Environmental Benefits
84
.
9.4.2 Environmental case
Successful RM entails reduction of the consumption of resources and increases waste diversion. The US EPA points at three ways that RM contributes posi-tively to reducing emission of greenhouse gases.
• Reduction in the volume of waste that is sent to landfills and incinerators. This leads to reduction in methane emissions from landfills and reduced CO2 emissions and NOX emissions from combustion.
• A minimisation of the demand for virgin materials entails reduction in the energy consumption to extract process and manufacture products. This re-duction in energy consumption leads to reduction of fossil fuel consump-tion and thus reduction of emissions of CO2 and NOX.
• By slowing down the logging of threes, the CO2 storage capacity of forests is maintained (US EPA, Year unknown).
Studies of the potential for other US organisations show that the organisations have a large potential for improving their waste minimisation and recycling of waste and reducing their waste management costs. Massachusetts Pilot Project involves, for instance, a range of case studies on the potential of RM (Ligon et al., 2001, http://www.mass.gov).
9.4.3 Possibilities and barriers
Reducing disposal volume is an obstacle to companies that normally make profit through disposal volume. The skills necessary for taking care of RM are different from those that are required for providing hauling and disposal ser-vices (US EPA, 2001). The companies have to change the value of the services they gain profit from. The types of companies are also different such as e.g. engineering firms and management consultants (US EPA, 2001).
In an US survey, waste service providers indicated opportunities and barriers to performance contracting of waste management (see table below).
The compensation mechanisms in General Motor's Resource Management contracts are base on fixed price contracts. The contracts include gain-sharing mechanisms, where the contractor gains 30 % of the savings achieved the first year that the contract runs.
The environmental impact of the business model is reduction in the amount of hauled and disposed waste. 50 % of GM's North American assemble plants are planned to be zero landfill plants by 2010.
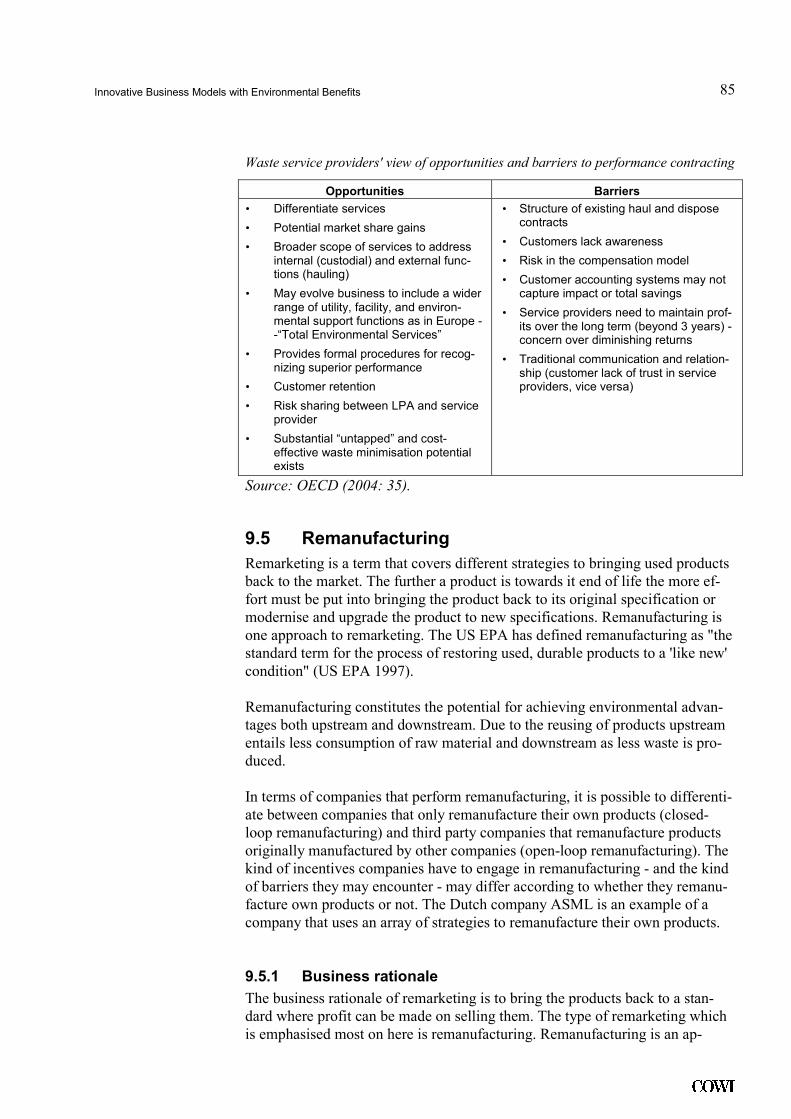
Innovative Business Models with Environmental Benefits
85
.
Waste service providers' view of opportunities and barriers to performance contracting
Opportunities Barriers
• Differentiate services
• Potential market share gains
• Broader scope of services to address internal (custodial) and external func-tions (hauling)
• May evolve business to include a wider range of utility, facility, and environ-mental support functions as in Europe --“Total Environmental Services”
• Provides formal procedures for recog-nizing superior performance
• Customer retention
• Risk sharing between LPA and service provider
• Substantial “untapped” and cost-effective waste minimisation potential exists
• Structure of existing haul and dispose contracts
• Customers lack awareness
• Risk in the compensation model
• Customer accounting systems may not capture impact or total savings
• Service providers need to maintain prof-its over the long term (beyond 3 years) - concern over diminishing returns
• Traditional communication and relation-ship (customer lack of trust in service providers, vice versa)
Source: OECD (2004: 35).
9.5 Remanufacturing
Remarketing is a term that covers different strategies to bringing used products back to the market. The further a product is towards it end of life the more ef-fort must be put into bringing the product back to its original specification or modernise and upgrade the product to new specifications. Remanufacturing is one approach to remarketing. The US EPA has defined remanufacturing as "the standard term for the process of restoring used, durable products to a 'like new' condition" (US EPA 1997).
Remanufacturing constitutes the potential for achieving environmental advan-tages both upstream and downstream. Due to the reusing of products upstream entails less consumption of raw material and downstream as less waste is pro-duced.
In terms of companies that perform remanufacturing, it is possible to differenti-ate between companies that only remanufacture their own products (closed-loop remanufacturing) and third party companies that remanufacture products originally manufactured by other companies (open-loop remanufacturing). The kind of incentives companies have to engage in remanufacturing - and the kind of barriers they may encounter - may differ according to whether they remanu-facture own products or not. The Dutch company ASML is an example of a company that uses an array of strategies to remanufacture their own products.
9.5.1 Business rationale
The business rationale of remarketing is to bring the products back to a stan-dard where profit can be made on selling them. The type of remarketing which is emphasised most on here is remanufacturing. Remanufacturing is an ap-
Innovative Business Models with Environmental Benefits
86
.
proach to remanufacturing where the used products are brought back to a state where the products are 'as new'.
Some of the examples of sectors with a successful remanufacturing of con-sumer durable goods are automotive parts, computers, laser toner cartridges, photocopiers, cleaning equipment, and single-use cameras (Giuntini & Gau-dette, 2003; Franke et al., 2006).
Original equipment manufactures (OEMs) as General Electric, Boeing, Cater-pillar, Deere, Navistar, Xerox, Electrolux and Pitney Bowes have developed business models were remanufacturing of their products is an integrated part. Eastman Kodak and Fuji Photo Film remanufacture their single-use cameras. The cameras are reused up to 10 times after being returned to the film process-ing.
Fuji Xerox is an example of a company that has integrated remanufacturing as a part of their business model. In 1987, Xerox started a programme called 'asset recovery'. The purpose was originally to remove old copy machines from the waste streams and to reuse the machines for resale. In 1989, 5 % of the scrapped machines were remanufactured. In 2005, Fuji Xerox had reached a recovery of 98 % of the used products. In 2000, Fuji Xerox was the first Japa-nese company to reach zero landfill of used products. Fuji Xerox leases their copy machines for 3 years, and then they remanufacture the machines and lease them out again. Fuji Xerox performs the same kind of services on their ma-chines whether they are made of 100 % virgin parts or they are remanufactured. The remanufacturing business model constitutes a significant competitive ad-vantage for Fuji Xerox (Nagler, 1999; Fuji Xerox, 2005; King & Burges, 2005).
Electrolux has remanufactured household appliances since 1998. Environ-mental concerns were the initial driver for remanufacturing products as the profit from the start was very uncertain. The products that are remanufactured are appliances that it has been impossible to repair on site. The remanufactured products are mostly newly manufactured products with failures that are covered by the warranty, products that are harmed during transportation or products that have been leased out. The kinds of products that are remanufactured include refrigerators, washing machines, stoves and microwave ovens (Sundin & Bras, 2005).
Case example: ASML
Background ASML is a world leader in providing microlithography systems for the semiconductor industry. The advanced technology systems are leading edge technology that is critical for production of integrated circuits or microchips. These chips power a wide range of electronic, communication and information technology products. ASML designs, develops and manufactures equipment that is used to transfer circuit patterns onto wafers. The customers include many of the global semiconductor manufactures. (http://www.asml.com) The prices for new systems range from € 1.2 million to € 45 million (Boudewijn Sluijk, 9 May 2008). When their customers no longer need the system they have ac-quired from ASML, ASML buys the systems back. ASML uses five strategies
Innovative Business Models with Environmental Benefits
87
.
for remanufacturing their products, Direct-Shipment, Refurbishment, Remanu-facturing, Legacy and Conversion. The strategies are applied in accordance with the potential for reusing the products. The remanufacturing strategies that ASML applies are an interesting example of different ways to bring products back on the market. The Direct-Shipment is not a remanufacturing strategy, however, it is described to give an overall understanding of when and how dif-ferent remanufacturing strategies are used.
Direct-Shipment ASML facilitates Direct-Shipment of systems, where the systems are reorganised from one location to another without passing through the factory. These systems are in so a good shape that they can be made fully functional on-side with minimal effort. These systems are remarketed as second hand systems (http://www.asml.com; Arnout Meester, 28 April 2008).
As a remanufacturing strategy, reusing - or Direct-Shipment as it is called in ASML - is the cheapest and fastest solution, where the products are in such good condition that they can easily be reused without to much change. The ad-vantages are that there is no need for new materials and the product does not have to be altered. This implies that the amount of waste entering the waste streams is reduced and there is little demand for man-hours to make the product ready for sale. (Vrij et al. 2006) The services included in Direct-Shipment that ASML performs are auditing (ensuring the quality of the product) relocation of the product, qualification (setting up the system and training the users) and up-grading the product. The products are thereby upgraded to a higher standard than the original product.
Refurbishment ASML systems that need more repair in order to be remarketed go through a refurbishment process. The process takes place at ASML sites, where the ma-chines are repaired and the system performance is brought up to the specifica-tions of the newest products. The components that are broken and are likely to cause problems are substituted, and the system is up-graded with the newest components and software. The result is better performance in terms of quality and productivity. The products are sold with full specifications and warranty.
Risk A product that can be sold after refurbishment for € 1.2 million is bought back for € 400.000. € 400.000 is used to bring the system up to the newest specifica-tion and € 400.000 is the profit ASML makes. By giving a warranty on the re-marketed products ASML takes a risk.
Refurbishment only involves minor changes in the product design. Most com-ponents are the same and the small adjustments do not change the functionality of the product. However, some of the components are changed which results in some amount of waste (Vrij et al. 2006).
Remanufacturing In remanufacturing the old machines are taken apart and rebuilt. This results in machines that perform almost as products built on virgin components only. The machines are sold with the specifications of the latest products. The products are sold with a warranty and at an attractive price (http://www.asml.com; Vrij et al., 2006).
Innovative Business Models with Environmental Benefits
88
.
Remanufacturing is a complicated process, where the original product is rebuilt into a new product. The main differences between refurbishment and remanu-facturing are the number of actions that are required to bring the product back to an as-new state.
Remanufacturing constitutes advantages in cases where the product is highly complex and the product's lead time therefore is long or where component costs are extremely high. Building new lenses for ASML's machines requires for in-stance up to a year26, and also remanufacturing lenses can take several months, as the lenses have to be polished and realigned. By means of buffers, ASML has reduced the lead time for remanufactured products in the range of 2-3 months (Vrij et al., 2006; Boudewijn Sluijk, 9 May 2008).
Legacy Some machines are in such a condition that remanufacturing is still possible but no longer economically feasible. The cost of bringing the machines to the original specifications is too high so it is cheaper to purchase a new or a refur-bished/ remanufactured system. ASML makes an audit of the performance of the products. Based on the audit the customers can chose between a portfolio of possible updates. The machines are brought into a shape were they work, but do not meet the original specifications. The products are sold with a very limited warranty. The machines that are remarketed as legacy systems are often 15 years old. The products are still quite expensive, around 40 - 50 % of the price of the original product. ASML is on a market where the technologies develop very fast. The customers that purchase legacy systems do not demand the latest technology. This can be because the customer has to substitute the existing sys-tem to continue the production, the customer wants to add capacity to the exist-ing production or because the customers apply the system on a new market. An example of the later is production of airbags. Integrated sensors for airbags can be made with the type of machines that was used to make top of the line semi-conductors 10-15 years ago (Boudewijn Sluijk, 9 May 2008).
Conversion The machines that no longer work and essentially are scrap still holds a value. ASML buys such systems back at a price corresponding to 5 % of the new price for the system. ASML's systems are built on a platform base. The same plat-form is used for different products, whereupon specific components as the op-tics are added. Formerly, ASML made both lamp and laser-based optic sys-tems. The laser-based technology is no longer in demand. ASML can convert a laser-based system to a lamp-based by substituting the optics. In this way ASML can reuse the platform from systems that are no longer in use.
Originally the systems were not designed with the purpose of remanufacturing. ASML started to perform remanufacturing when the used systems became available and a market for the remarketed systems emerged. It turned out that the platform design was an advantage with respect to remanufacturing the sys-tems. The systems were originally designed on a common platform because it was a more efficient design.
26 ASML has a buffer capacity. This ensures that their customers can receive their systems
within 6 month from ordering (Boudewijn Sluijk, 9 May 2008).
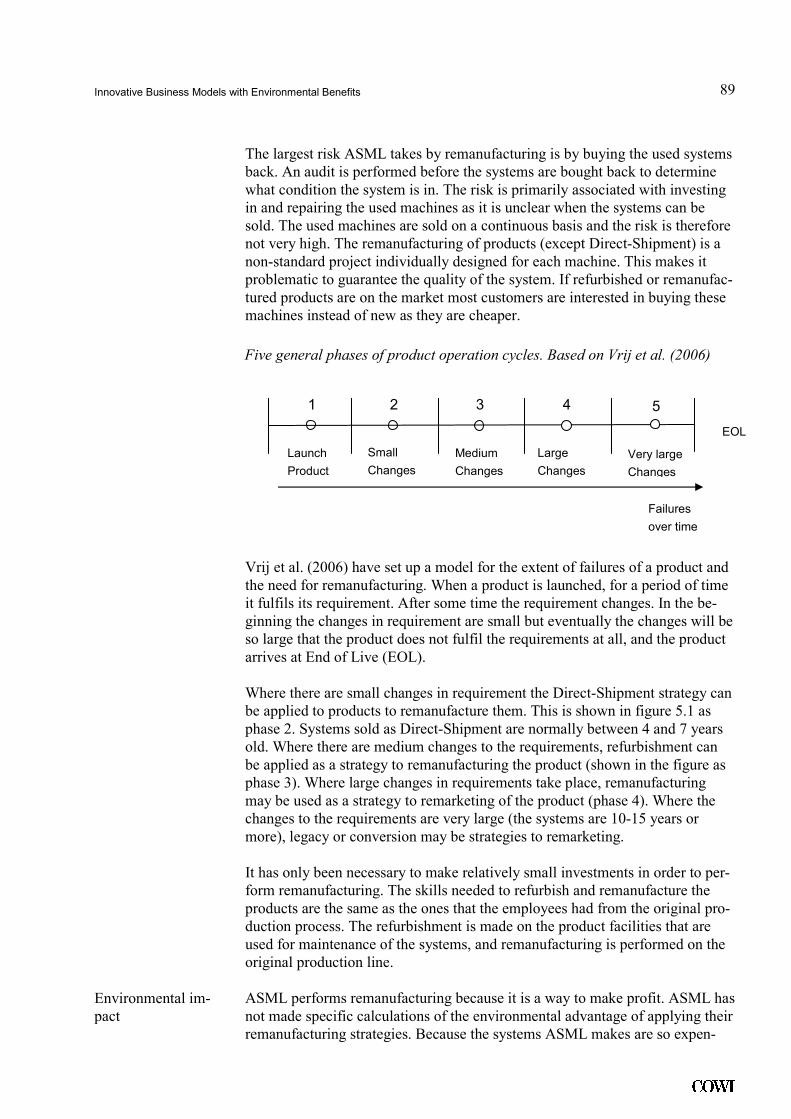
Innovative Business Models with Environmental Benefits
89
.
The largest risk ASML takes by remanufacturing is by buying the used systems back. An audit is performed before the systems are bought back to determine what condition the system is in. The risk is primarily associated with investing in and repairing the used machines as it is unclear when the systems can be sold. The used machines are sold on a continuous basis and the risk is therefore not very high. The remanufacturing of products (except Direct-Shipment) is a non-standard project individually designed for each machine. This makes it problematic to guarantee the quality of the system. If refurbished or remanufac-tured products are on the market most customers are interested in buying these machines instead of new as they are cheaper.
Vrij et al. (2006) have set up a model for the extent of failures of a product and the need for remanufacturing. When a product is launched, for a period of time it fulfils its requirement. After some time the requirement changes. In the be-ginning the changes in requirement are small but eventually the changes will be so large that the product does not fulfil the requirements at all, and the product arrives at End of Live (EOL).
Where there are small changes in requirement the Direct-Shipment strategy can be applied to products to remanufacture them. This is shown in figure 5.1 as phase 2. Systems sold as Direct-Shipment are normally between 4 and 7 years old. Where there are medium changes to the requirements, refurbishment can be applied as a strategy to remanufacturing the product (shown in the figure as phase 3). Where large changes in requirements take place, remanufacturing may be used as a strategy to remarketing of the product (phase 4). Where the changes to the requirements are very large (the systems are 10-15 years or more), legacy or conversion may be strategies to remarketing.
It has only been necessary to make relatively small investments in order to per-form remanufacturing. The skills needed to refurbish and remanufacture the products are the same as the ones that the employees had from the original pro-duction process. The refurbishment is made on the product facilities that are used for maintenance of the systems, and remanufacturing is performed on the original production line.
ASML performs remanufacturing because it is a way to make profit. ASML has not made specific calculations of the environmental advantage of applying their remanufacturing strategies. Because the systems ASML makes are so expen-
Environmental im-pact
Large
Changes
Launch
Product
Small
Changes
Medium
Changes
Very large
Changes
5 1 2 3 4
Failures
over time
EOL
Five general phases of product operation cycles. Based on Vrij et al. (2006)
Innovative Business Models with Environmental Benefits
90
.
sive it is feasible to reuse most components and there is not much scrap from the production. ASML's strategy is an efficient approach to waste minimisation. The amount of original components in each remarketed product varies from system to system. In Direct-Shipment all original components are reused. In the other remanufacturing strategies the amount of components that is substituted depend on the condition of the system and the specification that the system shall meet.
Philips manufactures a broad range of products e.g. household appliances, per-sonal care products, TV-sets, monitors, audio and video products, etc. The ex-pected lifetime of Philips' products is typically 7 years or more. The products are designed to be repaired, but are not designed to be remanufactured.
The products are for household application and most products do not have ex-pensive components (exception LCD panels). It is not economically feasible to reuse components from worn out products that are 7 years or more. The techno-logical development of most products is very fast, and the residual value of old, used products is low. It will therefore be more expensive to organise reverse-logistic and remanufacture products than it will be to manufacture new prod-ucts.
The recycling potential for Philips' products is high and most of the materials from used products can be, and will be recycled more and more (Ton van Veen, 26 May 2008).
9.5.2 Environmental case
The environmental problem of electric parts is that they contain substances that have a damaging impact on the environment when they are disposed of either by landfill are incineration. Further, electronic waste is growing at an annual rate from 3-5 % which is three times larger than the growth of general waste. To cope with these problems, EU has implemented the directive on waste and electrical and electronic equipment (WEEE), where the original equipment manufacturer is made responsible for the treatment and disposal of post-consumer products (King & Burges, 2005). While a strategy to ensure recycling would meet the producer's obligation, many manufactures see recycling as an additional cost as the recycling makes up little or no financial benefit - this is due to the scrap value being lower than recycling costs. The interest in repair-ing or remanufacturing products is "increasing because the potential profits from these smaller loops will be the most 'value-adding' way to discharge ex-tended producer responsibility" (King & Burges, 2005).
A way to estimate the sustainability in environmental terms is the ratio of recy-cled/reused material compared to the total supply of virgin recycled/reused ma-terial (King & Burges, 2005). The example of ASML's management of remanu-facturing their products entails that most components are reused. This means that the environmental impact from scrap from the used machines is reduced to a minimum.
Design of products at Philips
Innovative Business Models with Environmental Benefits
91
.
9.5.3 Possibilities and barriers
A prerequisite for most remanufacturable products is that they have a high value and relatively long service lives. An exception to this is single-use cam-eras and toner cartridges. Smaller appliances like electric shavers and hair dry-ers are almost never refurbished as they are inexpensive and their lifetime is only a few years (Nagler, 1999).
King and Burges (2005) point at four technical barriers to remanufacturing of electrical devices and electronic equipment: reverse logistics, disassembly, component inspection and customer demand.
Reverse logistic is about bringing the used appliances to the remanufacturing company. The problem with reverse logistics is the costs associated with trans-portation of the items, space requirements needed to store the returned prod-ucts, the availability of the used products (many customers lack incentives to return the products as there is often little financial rewards), the identification and handling of returned products can be difficult as there is a huge variety of products being returned.
Disassembly When the products are returned to a manufacturer for potential remanufacturing the products have to be disassembled. Many products are not designed for re-manufacturing. Certain components may be designed to be removed by mainte-nance but the majority is not. The poor condition of the products can make it difficult to disassemble the products because they are damaged or corroded. Many products are produced in the Far East and assemble logic and sequence information is therefore not available to the remanufacturer. It can be a signifi-cant barrier if the remanufacturer has to disassemble a high number of products to learn the best sequence.
After the products have been disassembled, an audit of the quality of the prod-ucts has to be made to assess which parts are suitable for remanufacturing. The remaining parts can be used for recycling or may be disposed of as scrap. This process can be a barrier to remanufacturing as many parts will not be remanu-factured, and it can therefore be time consuming and costly to identify the parts suitable for remanufacturing. In order to assess whether a component is dis-torted or worn an original component has to be available, so that the used com-ponent can be compared with an original. Otherwise it might be difficult to evaluate the level of remanufacturing needed. The inspection of complex as-semblies can be difficult, costly and time consuming. It is therefore necessary to develop efficient inspection procedures.
It is crucial to have a credible and stable demand for remanufactured products. If the remanufactured products do not represent the latest generation of tech-nology, styling and functionality they may have difficulties in competing with new products. It can be difficult to persuade customers to buy cheaper old products if cheaper new products are available. Many customers associate re-manufactured products with 'second hand' products of an inferior quality. It is difficult to change such an understanding of remanufactured products. Remanu-facturing products can constitute a threat to some brands - both in terms of im-
Reverse logistic
Component inspec-tion
Customer demand
Innovative Business Models with Environmental Benefits
92
.
age and sales. Such brands will therefore be reluctant to introduce remanufac-turing of their products.
Remanufactured products can be divided into capital goods and consumer du-rable goods. The capital goods are often remanufactured as the products are expensive and have a long lifespan. The problem with remanufacturing of con-sumer goods is that the process costs of remanufacturing goods often exceed the price of new products (Giuntini & Gaudette; 2003).
Giuntini and Gaudette (2003) point at some further obstacles to remanufactur-ing: The salespeople are often not given an incentive to handle the sale of re-manufactured products to the customer. The product marketing managers often do not put remanufactured products into their strategic selling plan, and re-manufacturing is only performed on individual customer request. Remanufac-turing of products can be difficult as the primarily supply of spare parts comes from the used products. Not until the used products are disassembled, inspected and tested is it known which parts can be reused and which have to be substi-tuted. Further, the disassembling process, testing, inspection and to some extent reassembling require different skills and equipment than the original manufac-turing process. A further barrier is the shortage of skilled technicians.
The designing of products on a platform basis is essential for manufacturing products that are easily remanufactured. The ASML case shows that a platform basis allows the company to convert systems that are no longer in use into working systems. The idea of platform-based designs is to develop a platform that is the base for a range of derivative products. Platform-based design is used for instance by Volkswagen, Black & Decker, Rolls-Royce Aero-engines and Nippondenso Meters. The challenge of designing such a platform is to find a balance between a high component-sharing strategy with limited variability and a high component variability strategy with limited sharing. The difference be-tween the strategies is to what degree the design of the product makes it easier to produce with respect to reduced time, cost and stock levels, and to what de-gree the products are designed to increase market coverage and fit costumer choice. It is difficult to include both (King & Burges, 2005).
9.6 Car-sharing
Definition Car-sharing is a model of car rental where the car can be rented for a short period of time often per hour. Car-sharing can be defined as "sharing vehicle services amongst members, thereby giving them access to a fleet of vehicles"
(Loose et al., 2006).
The kind of car-sharing dealt with here is formally organised by companies, clubs or associations. The organisation owns a fleet of vehicles that can be used through advance booking. In many Car-Sharing Organisations (CSOs) a mem-bership is a prerequisite for participating. To become a member an entry de-posit is paid. Moreover, on a monthly or yearly basis a membership fee is paid, and costs for use of the vehicles are based on amount of time the vehicle has been used and the mileage driven.
Innovative Business Models with Environmental Benefits
93
.
Background Worldwide car-sharing has become increasingly popular within the last 20 years. In Europe car-sharing has reached a relatively large dissemination in Switzerland, Austria, Germany and Holland, and has some popularity in for instance Sweden, Denmark and Italy. In the US 18 car-sharing programmes have a total number of about 234,500 members sharing 5,261 cars and in Can-ada 13 car-sharing programmes involve about 33,900 members sharing 1,499 vehicles (data from January 2008) (http://www.carsharing.net). This corre-sponds to 0.08 % of the US population and 0.1 % of the Canadian population being members of a CSOs (http://www.census.gov; http://www.statcan.ca).
Car-sharing has had a large growth in Switzerland over the last 15-20 year, and Switzerland has become an international leader in organised car-sharing. In 2008, 1.03 % cent of the Swiss population was car-sharing customers (www.bfs.admin.ch, 2008; Peter Muheim, 2 May 2008) In 2008; in comparison 0.18 of the population in Austria were car-sharing customers (www.statistik.at, 2008; Mobility, 2008).
9.6.1 Business rationale
The advantage for the customer of car-sharing is to gain the flexibility of cars in terms of a means of transportation without having the costs and liabilities of owning a car. By having access to a fleet of vehicles the type of vehicle can be adjusted to match the customer's needs.
Using car-sharing is one means of transportation that should be combined with other kinds of transportation. The optimum means of transportation is chosen based on the degree of flexibility and distance to cover. Car-sharing can often with advantage be combined with public transportation. Many CSOs cooperate with public transportation providers, and many car stations (the places where the car is picked up and left) are located in connection with public transporta-tion, i.e. next to railway stations.
To be an attractive alternative to private car ownership, the shared cars have to be easily accessible. The car stations have to be located near the customer’s residence and minimal effort should be used to book the vehicle or to check in and out.
Case: Mobility CarSharing Switzerland
Background Mobility CarSharing Switzerland27 is Europe’s largest CSO. Mobility was established in 1997 by merging the two Swiss CSOs ATG�AutoTeilet Genossenschaft (in English: CarSharing Cooperative) and ShareCom. Both co-operatives were originally founded in 1987 (Mobility, 2007). Mobility is based on providing means of environmentally sound personal transportation (Mobil-ity's constitution, article 2) (Mobility, 1997). Of May 2008, the company has 79,000 customers sharing 2,000 vehicles located at 1,050 car stations in 400 cities and towns in Switzerland and Liechtenstein. Mobility offers car-sharing in all Swiss cities with 10,000 or more inhabitants and in many with less than
27 Mobility CarSharing Switzerland is from hereon referred to as ‘Mobility’.
Innovative Business Models with Environmental Benefits
94
.
10,000 inhabitants. 10 % of the customers are business customers. Mobility is now the only CSO in Switzerland. Since the 1st of January 2008, the Mobility Cooperative and Wolfgang DENZEL AG are offering car-sharing in Austria in the Joint Venture “Denzel Mobility car sharing GmbH”, where 15,000 custom-ers share 200 vehicles (Peter Muheim, 2 May 2008; Mobility, 2008).
Mobility’s fleet of vehicles range from micro cars with space for only 2 persons (e.g. Smart Passion) to minivans with space for 7 persons and large luggage compartments (e.g. Peugeot 807) and transporters (e.g. Mercedes Vito). The fleet includes 10 different types of cars, which gives the customer the opportu-nity to match the type of vehicle with her actual needs.
Membership Mobility organises car-sharing for both private and business customers. Private customers can either subscribe for a basic membership or they can become co-operative members. The cooperative members pay CHF 1,000 for their coop-erative share which they can recover if they leave the cooperative and a one-off administration fee of CHF 250. The basic membership customers pay for an annual subscription, where the fee is a maximum of CHF 29028. Business cus-tomers can choose between an array of products (Basic, Plus, Master and Ex-clusive), see figure 5.2. Depending on the kind of product, the business cus-tomers can get a higher degree of exclusive user rights to the vehicles. Basic, plus and master are types of car-sharing, whereas ‘exclusive’ entitles a firm to be the exclusive user of vehicles even with the firms own logo. Thereby ‘exclu-sive’ is, in addition to the sharing of Mobility’s vehicle fleet, more similar to ordinary car rental. But the reservation management and the whole car man-agement is sourced out to Mobility.
The vehicles are booked by phone or internet. If the vehicle is free it can be booked directly before use. Each vehicle is fixed to a car station, where the ve-hicle has to be picked up and handed over. All vehicles are equipped with an on -board computer that registers the hours driven and the mileage covered. The customers are charged according to hours of use and mileage driven. The prices vary according to what kind of product the customer subscribes to, the time of day where the vehicle is used (it is cheaper to drive at night and more expensive for business customers to drive during weekends) and the mileage driven (a discount is given for each kilometre driven that exceeds the first 100 km).
Risk The costs include fuel, insurance and maintenance - for instance the cleaning of the vehicles. The customer has an own risk of a maximum of CHF 2,500 per accident29 (www.mobility.ch).
28 Mobility offers various reductions depending on membership of organisations that coop-erate with Mobility, e.g. reductions are for instance given if the customers have an annual subscription for the Swiss Federal Railways (SBB). 29 By paying a fixed additional fee, the customers’ liability can be reduced to a maximum of CHF 300 per accident. The magnitude of the fee varies from CHF 125 to 375, depending on whether the customer is a private or business customer and whether the membership covers one or more persons. (www.mobility.ch)
Innovative Business Models with Environmental Benefits
95
.
The demand for shared cars peeks during weekends, and the size of the fleet of cars is designed to match the demand for transportation during the weekends. The capacity of cars is therefore too high during the working days. Business customers primarily use the vehicles on working days, which improve the over-all efficiency of the system. The average private Mobility customer makes 16-17 annual trips with an average distance of 42 km per trip and the average busi-ness customer makes 33 yearly trips and covers an average distance of 55 km per trip (Haefeli et al., 2006; Peter Muheim, 2 May 2008).
During holidays the demand for car-sharing is above average and in summer the demand is higher than in winter. The vehicles are in the fleet for 3-4 years. The size of the vehicle fleet can be adjusted to changes in seasonal demand by selling the old vehicles in winter and purchasing new cars in the spring. Mobil-ity cooperates with car rental companies (Avis/Hertz), where Mobility’s cus-tomers get lucrative offers on car rental. The car rental companies often have excess capacity at weekends and during holidays, where the demand for shared cars peeks. Customers that have a demand for high mileage or long rental peri-ods can use these offers with advantage (Peter Muheim, 2 May 2008).
Mobility has a strong cooperation with 17 different public transport operators in Switzerland. The most comprehensive cooperation is with the Swiss Federal Railways (SBB). Mobility customers with an annual subscription for SBB get a discount on car-sharing. Mobility and SBB cooperate on a Click and Drive concept. Basically, the idea is that the train passengers have easy access to a car
Adjusting the size of the vehicle fleet
Cooperation with public transportation operators
Mobility’s range of products for business customers.
Source: www.mobility.ch
Innovative Business Models with Environmental Benefits
96
.
at all railway stations and car-sharers to trains. Mobility and SBB mutually ad-vertise for the counterpart's products.
Infrastructure The access to parking lots has been decisive for establishing the countrywide car-sharing organisation. Mobility is the single largest renter of parking lots from SBB. Nearly 900 parking lots at 320 railway stations are located next to the stations and are clearly visible. Official pictograms at the railway station signals where Mobility’s cars are situated. The visibility at the railway stations is an important source for Mobility to set focus on their concept.
There has been only little support to Mobility, which also has meant that there are no public parking lots reserved for car-sharing. All parking lots for Mobil-ity’s fleet of vehicles are therefore privately rented. Many of the parking lots that are not located at railway stations are situated in backyards where they are not easily recognised (Peter Muheim, 2 May 2008).
The average distance in terms of time to nearest shared vehicle is 5-10 minutes for most Mobility customers. In larger cities such as Zürich, Mobility has vehi-cles dispersed in the city so the distance between the cars is within 500 meters.
When car-sharing was first launched in Switzerland in 1987, there were no ex-periences from other countries to draw upon. From the beginning the domestic car-sharing organisations cooperated, so it was possible for customers from one CSO to use the other CSO’s vehicles. In Germany there are around 100 CSOs but there is a low extent of cooperation and integration between the car-sharing providers. In Germany it is therefore often difficult for a member of one CSO to use another CSO's vehicles (Peter Muheim, 2 May 2008).
Public transportation in Switzerland is very well developed. Mobility’s fleet of vehicles is spread all over Switzerland and the customers can easily combine car-sharing with public transportation. There has proven to be a certain degree of maturity of the Swiss market for car-sharing. A relatively high number of the population has been willing to substitute the private ownership with shared use of cars (Peter Muheim, 2 May 2008).
Mobility Support AG offers help to start up car-sharing organisations; this cov-ers everything from help in the initial phases to developing business plans and setting up complete systems with the newest car-sharing technologies. Last year Mobility developed the Mobility License System giving the licensee access to the know-how and system platform, to the Mobility brand, to hosting and oper-ating services (i.e. billing and 24h call centre) and to the Mobility academy and support. This complete service package is first used by the Denzel Mobility CarSharing GmbH in Austria (Peter Muheim, 2 May 2008).
Economic gain Mobility drives a sound economic business. In 2007 the company had a turnover on CHF 50.6 million (Mobility, Geschäftsbericht 2007). The same year, the profits before interests and taxes were CHF 1.07 million (Mobility, 2008b).
Innovative Business Models with Environmental Benefits
97
.
The customers' savings by using car-sharing depend highly on the demand for transportation in terms of means of transportation and mileage. According to a Swiss investigation of the economic savings of car-sharing, a “typical” CSO customer that uses public transportation for 75 % of the trips and car-sharing for the remaining 25 % could, depending on the yearly distance covered, make yearly savings in the amount of € 3,114 to € 1,552 (Jacobsson, 2002).
CSOs in Denmark In Denmark all CSOs except Hertz Car-sharing (Hertz Delebilen) are non-profit organisations. These CSOs are based on ideological roots, where the purpose of establishing car-sharing is primarily to reduce car transportation in cramped inner-cities and to gain environmental advantages (Villads Hansen, 8 May 2008). The nine largest CSOs are members of the Danish umbrella organisation for CSOs Danish Car-sharing (Danske Delebiler). On January 2008, these CSOs had 227 cars and a total number of 5,037 members. This corresponds to 0.09 % of the Danish population. Hertz Car-sharing is the single largest pro-vider of shared cars in Denmark with 102 cars and 3,900 members (Statistics of shared cars, 2008; www.danmarksstatistik.dk). The CSOs are located within Greater Copenhagen and in some of the largest Danish provincial towns were the population density is high. The first Danish CSOs emerged in the late 1990s, and Copenhagen Car-sharing (CCS) was founded in 2004. CCS has a fleet of 49 vehicles and about 600 members.
There are three CSOs located in Copenhagen. The Copenhagen municipalities30 support the CSO by providing special parking lots reserved only for shared cars. Each of the Copenhagen CSOs has been allotted a number of these park-ing lots31. The parking lots are, however, not reserved for specific cars, but a gentleman agreement between the CSOs states that the parking lots should not be used by other shared cars. The CSOs try to get these special parking lots lo-cated next to city train stations and bus terminals. The Copenhagen municipal-ity, moreover, supports CSO by giving very cheap parking permits to the shared cars. The Danish non-profit CSOs have set up a cooperation that allows the members to use the other CSOs' vehicles. The cooperation is not effective yet, as a shared booking system is being developed at present (Villads Hansen, 8 May 2008).
30 The municipalities of Copenhagen and Frederiksberg. 31 2/3 of CCS's vehicle fleet is located at these 'car stations'. The last third of the vehicles also have car stations, but are parked at normal parking lots.
Mobility's model of car-sharing has proven to be economically feasible for both Mobil-ity and their customers. In terms of mobility the advantage to the customer is a high degree of flexibility without having the liabilities and costs connected with private car-ownership.
The major environmental improvement achieved by the Swiss car-sharing model is a change of the car-sharing customers' mobility pattern. The car-sharing customers in-crease their usages of more environmentally sustainable transportation systems, i.e. public transportation, walking and biking, after joining the CSO.
Innovative Business Models with Environmental Benefits
98
.
Car-sharing has been in place in Switzerland for a far longer period than in Denmark, and this may to some extent explain the differences in the share of the population using the system. Increased cooperation with the public trans-portation providers would be beneficial for the Danish CSOs. In Copenhagen there has been a certain degree of cooperation between the CSOs and MOVIA, a public transportation provider. MOVIA has advertised for the CSOs and the CSOs on their side have offered a discount for new costumers. A more formal and integrated cooperation with public transportation providers would help the CSOs to establish themselves as an alternative to private car ownership. The taxes on Danish cars are very high and a tax reduction on shared cars would make car-sharing cheaper, which would be a strong incentive to join the CSOs. The Copenhagen system with special parking lots reserved only for shared cars could be improved, if the parking lots were more unambiguously accentuated as special parking lots. At present, it is a large problem that non-shared cars are parked on these special parking lots. A clearer marking of the parking lots would also help to put more focus on car-sharing. The upcoming cooperation between the Danish non-profit CSOs allows their customers to use shared cars in various Danish regions. This will be an advantage for the flexibility of using shared cars (Villads Hansen, 8 May 2008).
9.6.2 Environmental case
In 1998 Peter Muheim made an evaluation of the environmental advantage of car-sharing in Switzerland and in 2006 the Swiss Federal Office of Energy (SFOE) made an evaluation of the environmental advantage from Mobility’s car-sharing. The later study was based on interviews with private customers in 520 households (constituting a total of 1,404 persons) and business customers (a total of 144 companies).
In a study conducted for Oikos Sustainability Case Writing Competition from 2003, Dr. Kai Hockerts identifies two ways in which car-sharing leads directly to increased efficiency in car use.
First, by reducing the number of cars, the need for parking lots is reduced. This is especially an advantage in cramped inner-cities. Mobility serves 77,000 cus-tomers with 2,000 cars which gives a ratio of 38.5 customers per car. In 2002, 2.2 Swiss citizens shared a car. Taking into consideration that some Mobility customers live in households with private cars the ratio of users per car was in 2002 estimated to 1 to 11. The average shared car in Swiss in 2002 was thus shared by a factor 5 compared to privately owned cars (Hockerts, 2003).
Secondly, buy choosing the most efficient vehicle type, car-sharing constitutes a more energy efficient alternative to private car ownership. Mobility’s fleet of vehicles is more environmental friendly than the average for new cars in Swit-zerland. The average fuel consumption for Mobility’s vehicles is 7.19 litre per 100 km compared to an average of 7.62 for new vehicles in Switzerland32. Ac-
32.According to Mobility's fleet specifications from the manufactures the fuel consumption is 6.8 litre per 100 km. 7.2 litre per 100 km reflects the actual fuel consumption. The 7.62 litre per 100 km is the average of new vehicles in Switzerland according to the manufactur-
Innovative Business Models with Environmental Benefits
99
.
cording to Mobility’s own figures the result of their car-sharing is yearly sav-ings of 520,000 litres of fuel and a reduction of 1,458 ton CO2 (www.mobility.ch). In 2005, the fuel consumption of Mobility’s vehicles was 25 % lower than the average for all Swiss cars (Haefeli et al., 2006). The per-formance in terms of fuel consumption per mileage has been quite constant since the Swiss CSOs started at the end of the 1980s (Peter Muheim, 2 May 2008). As fuel consumption is included in Mobility’s prices, Mobility has a strong incentive to optimize the energy efficiency of its fleet of vehicles. The fleet includes hybrid cars and natural gas fuel cars. Mobility has experimented with using electric cars. The use of electric cars have, however, turned out not to be feasible, as there are unsolved problems with respect to limited range and recharging of batteries (Peter Muheim, 2 May 2008).
A third direct advantage of car-sharing is the need for a smaller production of cars. A study of the energy consumption of cars in terms of life cycle analysis shows, however, that by far the largest energy consumption is connected with the operation of the vehicle. A calculation of the energy spent by driving 150,000 km in a car shows that 10 % of the energy is used for manufacturing the car, 10 % on refining the fuel and 80 % on fuel consumption (Jacobsson, 2002).
The largest environmental benefits from car-sharing are achieved indirectly through shifts in the car-sharing users’ mobility patterns. In the study from 1998, Peter Muheim compared the mobility patterns of car-sharing customers with persons that did not use car-sharing. The study showed that private car owners used their car as the preferred means of transportation (Muheim, 1998). Car owners tend to evaluate the costs of public transportation against the vari-able costs of using their car, i.e. the fuel costs, and not the total costs (Hockerts, 2003). Car-sharers were far more liable to combine the use of a car with public transportation (Muheim, 1998). The SFOE study from 2006 showed that 73 % of the interviewed households owned “a General Pass for the Swiss Federal Railways, an annual subscription with the Swiss Federal Railways for a specific route, or an annual ticket for the services of a regional public transport opera-tor” (Haefeli et al., 2006). Furthermore, it was concluded that the households reduce car ownership after joining Mobility. Mobility’s customers did not change their total demand for transportation in terms of kilometre travelled. In contrast to private customers, business customers did not decrease the mileage driven by car after joining Mobility and there was no change in person-kilometres travelled by public transportation (Haefeli et al., 2006).
The SFOE study estimates the total annual energy savings from Mobility’s pri-vate customers in 2005 to 78.4 TJ (terajoules), which equals approximately 2.5 million litre of gasoline. The energy savings corresponded to a reduction of 290 kg CO2 emission per active car-sharing customer. For business customers the energy savings are estimated in the range from 3.0 to 28.4 TJ per year (Haefeli et al., 2006).
ers' specifications, the actual fuel consumption might therefore be even higher for the aver-age new Swiss car. (Peter Muheim, 2 May 2008).
Innovative Business Models with Environmental Benefits
100
.
The potential for car-sharing customers in Switzerland is estimated to 500,000 persons. This potential can only be achieved in partnership with the public transportation system, and a growth rate of 2-3 % is seen as realistic (Haefeli et al., 2006).
9.6.3 Possibilities and barriers
Possibilities In Switzerland over 1 % of the population is a member of Mobility. The potential for car-sharing in Switzerland is estimated at 0.5 million persons (Haefeli et al., 2006). This corresponds to approximately 6.7 % of the Swiss population. 1 % of the EU27 population is approximately 5 million people. As-suming that a similar percentage of the population in the EU27 is a potential for membership of a car-sharing organisation, the car-sharing potential is 33 mil-lion EU citizens. (http://www.eurostat.ec.europa.eu). This number is properly a far too high estimate as not al EU countries have as well developed a public transportation system as Switzerland.
In a study of German CSOs from 2004 the potential for car-sharing was esti-mated at 1.1-1.4 million customers. In a similar study from 1994 the potential was then estimated to 2.45 million. The 2004 study raised the question why only 70,000 persons had joined German CSOs at that time 33.
Barriers The German study showed that:
• The respondents had an insufficient understanding of what the concept of car-sharing was.
• The majority of the respondents were unaware of the presence of local car-sharing offers.
• The majority of respondents saw car-sharing as an innovative service but very few could imagine using car-sharing themselves.
• 75 % of the respondents would prefer to use their own car instead of shar-ing a car with others. Changing people's attitude towards private car-ownership is the largest barrier to car-sharing.
• 75 % of the participants stated that they were the main user of a car and had access to a car at any time.
• 88 % of the respondents stated that they used a car on a daily basis or sev-eral times every week. On the other hand, the share of the respondents that used public transportation or biked was low (26 % for bicycles and 24 % for public transportation).
33 1,000 German-speaking residents above the age of 18 took part in the study. The partici-
pants were representative for the population in cities with 20,000 inhabitants or more. 100
German CSOs were invited to take part in the study, 65 of these answered the questionnaire
(Loose et al., 2006).
Innovative Business Models with Environmental Benefits
101
.
• Only 5 % of the respondents were willing to use a car-sharing offer (Loose et al., 2006).
For some persons the personal status of owning a car is very important, and they are not easily targeted by car-sharing. Car-sharing has to be a convenient alternative to private car ownership. The cars have to be easily accessible which constitutes a problem in areas that are sparsely populated. The Swiss model does not allow for customers to pick up the vehicle in one location and deliver it elsewhere. The logistic challenge would be immense, as the vehicles would have to be redistributed eventually.
Lack of public support has been a challenge to developing car-sharing in Swit-zerland, where especially the lack of parking lots has been a barrier. Mobility has, however, succeeded in providing the necessary parking lots from private stakeholders.
The major obstacle to further development of car-sharing in Switzerland is to stand out as an alternative to private car-ownership. A prerequisite is to become more visible and Mobility is therefore going to launch a commercial campaign on national TV (Peter Muheim, 2 May 2008).
Loose et al. (2006) recommend that CSO gets a better profile and becomes more known to the public. CSOs have to be more aware of their potential cus-tomers and they have to adapt better to the needs of business customers in order to get them as customers. The technical application offered to the customers has to be easy to use. Setting up alliances between CSOs will help them grow.
In a study from 2002, Jacobsson investigated constraints to further development of car-sharing in Sweden. He concluded that lack of cooperation with public transportation operators was a big problem. There was a lack of understanding of car-sharing among various actors and there needed to be a change in the mindset of key actors. Moreover, there was a need for more support from the Swedish media to put emphasis on car-sharing as an alternative to private car-ownership (Jacobsson, 2002).
Innovative Business Models with Environmental Benefits
102
.
10 Case catalogue
Name Brief description
Product Service
System (PSS) PSS = a pre-designed system of products, services, supporting infrastruc-
tures and necessary networks that:
• fulfil a consumer's needs on the market
• have a smaller environmental impact than separate product and services with the same function fulfilment
• are self learning
PSS Carpet producers sell a carpet-service. The carpet is sold with maintenance
of the carpet, i.e. the cleaning with special products and the replacement of
damaged parts of the carpet. After 2-3 years the producer takes the carpet
back and takes care of reuse/end disposal. Environmental benefit is a more
efficient maintenance and end disposal.
PSS Computer manufactures sell a computer service instead of a product. The
manufacture takes the old computers back. Computer parts are primarily
reused - secondarily recycled. This has implication for the design of com-
puters where parts shall be reusable.
PSS Reallocation of furniture in buildings.
Companies offer a furniture-service to companies. As al employees are not
at work at the same time, companies can do with less furniture, if the use of
the furniture is properly planned.
PSS Rolls Royse has changed from selling an engine-product (engines for the
aircraft industry) to selling engine power as output measured as
power/hour. RR is now responsible for the maintenance of the engines.
From a life-cycle perspective the largest environmental impacts are due to
the operation of the engine, i.e. fuel consumption. Rolls Royse has an in-
centive to produce more efficient engines that use less fuel and fewer spare
parts. This is the environmental potential of the product-service system.
PSS Danfoss, a Danish producer of valves, has run an experiment with a prod-
uct-service system. Instead of only selling valves for a cooling system, Dan-
foss sold cooling of refrigerators to Tesco (an English Department Store
chain). The product was cooling to 3 degree Celsius. The energy savings
was split between Danfoss and Tesco. Emersson has made similar experi-
ences in making energy savings with remote monitoring equipment.
PSS - eco-efficiency oriented leasing and renting services
e.g. renting bridges instead of selling them to municipalities
Innovative Business Models with Environmental Benefits
103
.
e.g. chemical leasing services
PSS Grundfos, a Danish producer of pumps, has changed from selling pumps to
selling pumping-service, where the customer pays for amount of removed
water.
PSS Besch 2005
The environmental problems associated with office furniture consumption
call for a more efficient use of office furniture that can decrease emissions
and volume of waste. The author discusses the opportunities and barriers
for the implementation of a PSS for office furniture.
PSS Sharing services from car sharing to laundries to libraries for books and
tools etc. Here it depends a lot on the organization and design if they are
successful and if they are sustainable.
PSS Most radical and with highest sustainability potential (if well organized and
designed) are result oriented services such as
- Koppert pest management in NL, where the companies sell pest free
fields instead of selling pesticides.
Performance-
based Pest
Management
Services
(PSS)
A pest management services provider commits to achieve a certain stan-
dard or level of pest control, instead of being compensated for a particular
treatment or application. Thus, the pest provider has an incentive to reduce
the amount of used pesticides, as pesticides become a cost of service pro-
vision rather than a source of profit.
Electrolux,
Sweden - func-
tional sales of
washing
(PSS)
This is pilot project called Pay-per-Wash, at the Gotland Island in Sweden.
The island was chosen because it was the only place in the world at that
time with intelligent electrical meters installed in 7000 households, which
allows for remote reading. The pilot was introduced into 50 households on
the island. Instead of charging customers to buy a washing machine, the
customer borrows a new washing machine for and pays SEK 495 as a fee
to Electrolux that covers the cost of installation. In return customers are
provided with Electrolux’s ‘intelligent’ energy efficient washing machine.
The washing machine connects to a household electricity meter that is con-
nected via the Internet to a central database that tracks the energy con-
sumption of the product. Customers pay for the function of washing alone.
(www.cfsd.org.uk/events/tspd6/tspd6_3s_cases.html)
Gispen, The
Netherlands -
furniture ser-
vices
(PSS)
Gispen is a designer and producer of Office furnishings. Gispen provides a
leasing package to its customers. It also provides a consultancy service for
product specification in specific situations. Once the furniture is installed
they also assist the customer in moving, updating and reconfiguring the
office furniture for new office plans. They become a partner and facility
manager for the customer.
(www.cfsd.org.uk/events/tspd6/tspd6_3s_cases.html)
Video-
conferencing
systems (PSS)
Videoconferencing provides a voice and video link between geographically
separated parties, allowing “virtual” meetings. Videoconferencing systems
require both equipment (products) and transmission bandwidth (service),
but the service and product are often provided by unrelated vendors (For
example, internet video calls). High-end video conference services are
usually different; product and service are closely linked. For example, in
December 2006, Hewlett Packard (HP) announced the Halo videoconfer-
encing system, which utilizes specially constructed videoconferencing
rooms, life-size high resolution video, and other features. The system en-
Innovative Business Models with Environmental Benefits
104
.
compasses both the rooms, and the network and support services needed
to operate the system.
In principle, videoconferencing offers a substitute for physical travel. To the
extent that videoconferencing replaces physical travel, the energy con-
sumption and emissions associated with travel are prevented (Stoughton et
al., 2007).
Millicare, USA –
carpet mainte-
nance
(PSS)
Millicare started out as a cleaning system and developed an environmental
services system for office carpets and business clients. They also offer
maintenance services for carpets for reconditioning and reinstalling old car-
pet in other areas.
(www.cfsd.org.uk/events/tspd6/tspd6_3s_cases.html)
Mobility, Swit-
zerland - car
sharing
(PSS)
Car-sharing provide the user with a clear cost per unit price for a mobility
service. The car it self is the product and mobility the service. Car sharing
offers a more efficient use of cars compared to individual ownership. Car
sharing differs from car rental by offering car mobility for a short time period
- from 15 min. to a few hours. Car sharing is common in a range of coun-
tries, i.e. Switzerland, Germany, Holland, Spain, Sweden, Denmark, etc.
StattAuto, Ger-
many – car
sharing
(PSS)
This is another car-sharing scheme based in Berlin that employs the mem-
bership system. It has signed up over 200 corporate customers through a
discount scheme in order to help profits and improve the car range avail-
able to its traditional base of weekend drivers.
(www.cfsd.org.uk/events/tspd6/tspd6_3s_cases.html)
Xerox Interna-
tional – photo-
copy re-
manufacturing
(PSS)
Xerox Corporation originally only produced photocopiers, but has devel-
oped into a document company. They now offer a range of services includ-
ing document translation, software, consulting services and outsourcing
services. They also have developed their asset management programme,
where products are sold or leased under contract, guaranteeing customer
satisfaction through functioning machines as a fixed price per copy. Prod-
ucts and processes are designed for re-manufacturing.
(www.cfsd.org.uk/events/tspd6/tspd6_3s_cases.html)
Electric car
battery unit (a
kind of PSS)
Instead of selling battery units to electric cars, a new business model has
been developed, where the battery belongs to a energy provider. The cus-
tomer then buys the output charged battery with a maintenance agreement.
The model is used in a Norwegian model, where the battery unit for the car
model "Think City" is rented on a monthly basis. Shai Agassi an Israeli busi-
nessman has developed a similar concept, where the battery units for elec-
tric cars are rented instead of bought. His company recharges the battery
units with cheap excess power e.g. from wind turbines.
Cradle-to-cradle
(a kind of PSS)
Ecologically intelligent design. Book from 2002. System of life-cycle devel-
opment. Nature inspired design principles.
Description (http://en.wikipedia.org/wiki/Cradle_to_Cradle)
Cradle to Cradle is a phrase coined by Walter R. Stahel in the 1970s and
popularized by William McDonough and Michael Braungart in their 2002
book Cradle to Cradle: Remaking the Way We Make Things. This frame-
work seeks to create production techniques that are not just efficient but are
essentially waste free. In cradle to cradle production all material inputs and
outputs are seen either as technical or biological nutrients. Technical nutri-
ents can be recycled or reused with no loss of quality and biological nutri-
ents composted or consumed. By contrast cradle to grave refers to a com-
Innovative Business Models with Environmental Benefits
105
.
pany taking responsibility for the disposal of goods it has produced, but not
necessarily putting products’ constituent components back into service.
Remanufactur-
ing
(PSS)
The idea of remanufacturing is about restoration and resale of used prod-
ucts. The remanufacturing may be done by the original manufacture (closed
loop) or a third party (open loop). The idea is that refurbishing may be
cheaper than creating new products from scratch. Remanufacturing is
pointed out as an area of high environmental potential in USA.
The savings are often passed down to the costumer that can acquire prod-
ucts at a much lower price than the price of a similar new product.
(Stoughton et al. 2007 - draft paper).
Resource Man-
agement
(PSS)
Resource Management is a performance-based approach to waste man-
agement. It is built on innovative contractual partnership between waste-
generating organizations and a qualified waste contractor that changes
'business as usual' compensation structures and supports and incentivizes
waste minimization and recycling. Resource Management is based on 3
premises: 1) significant cost-effective opportunities to reduce waste and
boost recycling. 2) Contractors will use the opportunities if offered proper
financial incentives. 3) Significant financial incentives to the contractor can
be financed from the savings generated through cost-effective improve-
ments to a waste producer's current waste/recycling system (Stoughton et
al. 2007 - draft paper).
Resource Man-
agement
(PSS)
"Recycle Bank" a recycling company that partners with local governments
in USA to operate municipal solid waste recycling programs in communities
does employ the sharing of cost savings in some of their contract opera-
tions. (http://www.recyclebank.com/)
Resource Man-
agement (PSS)
Sten & Metal - company in Göteborg (Sweden) - cooperate with among
other hospitals about recycling waste, after a win-win model.
Resource Man-
agement
(PSS)
Revalorisation Services in the German Automobile Industry.
The secondary car part network operated by Renet works as a virtual inter-
face between different branches and sectors (see Figure F.1). The second-
hand automobile components are „produced“ by the car recycling industry
collecting and dismantling scrap and accident vehicles. Renet serves as a
kind of „prolongation of their counter“ by re-marketing the used and refur-
bished components preponderantly to the professional and (to a smaller
extent) private vehicle repair sector and also into the automotive aftermar-
ket where car parts dealers start to expand their ranges towards secondary
parts. Simultaneously, automobile industry plays a triple role by supplying
increasingly reliable cars requiring less repair and maintenance, by profiting
considerably from sale of car parts through their dealership workshops and,
finally, by increasingly entering the large-volume automotive repair sector
(Zaring (ed.) 2001).
Third Party Lo-
gistics (3PL)
(PSS)
Third-party logistics (3PL), also referred to as logistics outsourcing or con-
tract logistics, focuses on improving resource utilization and process effi-
ciency in order to reduce costs and improve service. PL providers deliver
comprehensive logistics-related services, including delivery, storage, inven-
tory, customer service, cargo handling, supply/distribution information sys-
tems, etc. 3PL providers are usually not specifically focused on improving
environmental performance, but on improving logistics efficiency. Reduc-
tions in environmental loads are often achieved as by-products of the effi-
Innovative Business Models with Environmental Benefits
106
.
ciency improvements. Policies intended to reduce fuel consumption and
vehicle-miles such modal shifts, joint delivery, and increased load efficiency
also reduce energy consumption and CO2 emissions (Stoughton et al.
2007 - draft paper).
Chemical man-
agement ser-
vices
(CMS)
Chemical Management Services (CMS), an application of Product Service
Systems (PSS) in the chemical sector, attempts to optimise the chemical
consumption patterns. CMS works by changing the fundamental relation-
ship between chemical suppliers and chemical customers and providing
incentives to both sides to reduce the quantity of chemicals used. CMS is
gaining increasing popularity as a tool for cost savings and reducing the
chemical load on the environment. CMS has a high penetration in USA,
especially in the automobile and semiconductor industry but the extent till
which it is being used in Europe is still not well established (Pranshu, 2004).
Chemical
Strategies Part-
nership (CMS)
The Chemical Strategies Partnership (CSP) seeks to reduce chemical use,
waste, risks, and cost through the transformation of the chemical supply
chain by redefining the way chemicals are used and sold.
CSP works with manufacturing companies to help redefine the way they
purchase and manage their chemicals. In this new model, manufacturers
shift away from a traditional supplier relationship to a strategic alliance with
a chemical service provider. Instead of purchasing chemicals, the manufac-
turer purchases chemical services: assistance in purchasing, managing,
and tracking chemicals. This shift to chemical services directly aligns the
incentives of the service provider and manufacturer to reduce chemical use
and costs (www.chemicalstrategies.org).
Chemical man-
agement ser-
vices
(CMS)
Mont et al. 2006 provides in an article an overview of the existing advan-
tages and barriers for CMS providers and customers in the European con-
text, identifies conflicts of interest
between them, and highlights important lessons regarding the role of CMS
in shaping these markets. It reports on findings from interviews with Euro-
pean chemical producers and other stakeholders of chemical management
services and is directed
toward industry professionals interested in chemical management services.
CMS DuPont is a paint producer. DuPont used to sell paint to Fort. Now DuPont
are selling coating of the cars, where they are paid per coated car. The
coating has to fulfil certain quality standards regarding thickness of paint
etc. DuPont therefore has an interest in reducing the consumption of paint.
The consumption of paint is regulated through development of new paint
technology, through more efficient technology, e.g. valves that spray the
paint in a more efficient way, and through avoiding spills and coating errors.
The result is improved environmental performance in terms of lowering the
resource consumption.
Ashland Inc,
USA (CMS)
Ashland Inc is a Chemical company that is a supplier of both speciality
chemicals and the distribution processes for those chemicals.
Ashland has developed an entire management service programme around
procurement, use training, regulatory compliance, waste management, dis-
posal/recycling and energy services. This service package helps the cus-
tomer in reducing operating costs, as well as better managing risk. Contrac-
tual arrangements with customers allow for unit pricing structures, reducing
chemical use and keeping the management of materials with the supplier.
Innovative Business Models with Environmental Benefits
107
.
(www.cfsd.org.uk/events/tspd6/tspd6_3s_cases.html)
Castrol Inc,
North America
– (CMS)
Castrol is a supplier of professional lubricants and associated services.
They offer lubricant service packages that provide the customer with more
than just the product. These include needs assessment, site surveys, ana-
lysing costs and productivity indicators, training, and performance assess-
ment for opportunities in reducing lubricant consumption. They develop
profit from cost savings given to customer, rather than just the volume of
chemicals they sell. (www.cfsd.org.uk/events/tspd6/tspd6_3s_cases.html)
Dow Chemicals
and SafeChem,
Germany –
(CMS)
Dow chemicals developed the Safetainer system in response to German
regulations on the handling of chlorinated solvents (required Chemicals
manufacturers to limit evaporation and make take-back obligatory for these
solvents). SafeChem, a Dow subsidiary in Germany, developed has devel-
oped a closed loop system of delivery and take-back of the used solvents
using Safetainers, to recycle the solvents back to customers.
(www.cfsd.org.uk/events/tspd6/tspd6_3s_cases.html)
DuPont, USA –
carpet leasing
(CMS)
DuPont manufactures carpets and fibres. It has introduced a product-
service solution by leasing carpets to consumers. It also offers a service
package for maintenance and carpet cleaning. They recycle old carpets
through a carpet reclamation scheme.
(www.cfsd.org.uk/events/tspd6/tspd6_3s_cases.html)
CMS Volvo has changed from painting their cars them self to let the paint-
producers make the painting. Volvo then pays per painted car. This implies
environmental savings.
ESCO Energy Service Companies (ESCO) are companies providing energy ser-
vices to final energy users, including the supply and installation of energy-
efficient equipment, the supply of energy, and/or building refurbishment,
maintenance and operation, facility management, and the supply of energy
(including heat) (Bertoldi, 2005).
ESCO In providing the service Vattenfall takes over the responsibility for the cus-
tomer's functional need of heating, cooling, climate control, compressed air
or electricity. The necessary fuel or its equivalent (concerning heating),
financing and maintenance of the equipment are the components needed
for the service innovation are also provided by Vattenfall. The customer
buys the function, and does not need to be concerned about anything con-
cerning the necessary equipment, its maintenance, environmental issues,
new investments etc. Instead the idea is that the customer can then focus
on its core business. Each service contract is unique, and is elaborated in
co-operation with the customers according to their needs and wishes. In the
pre-contract phase expertise is needed to estimate investments and to
make an appropriate offer to the customer. If new equipment is needed to
provide the service, project management is of vital importance. Vattenfall
has an customer management organisation, which is responsible for the
delivery to the customer, and a maintenance organisation that maintains
the equipment
physically (Zaring (ed.) 2001).
ESCO Scottish Power has installed an energy management system for Barnet
Borough Council.
This scheme went operational in December 1997. It involved a £400,000
upgrade to an existing district heating scheme in the London suburb of
Innovative Business Models with Environmental Benefits
108
.
Hendon. The scheme serves over 1,000 homes as well as community
buildings such as schools, libraries and swimming pools with around
1000kW of thermal and 60kW of electrical power. The upgrade involved
installation by Scottish Power of a new 800kW gas-fired CHP unit, which
has replaced an older oil/gas boiler (which was supplemented by costly
electricity from the grid). The Council originally approached the company
with a view to installing a small, supplementary, CHP unit to eliminate the
need for particularly expensive electricity in peak periods. However, Scot-
tish Power suggested installation of a larger unit to replace both the existing
boiler and electricity purchases, and also generate surplus electricity for
sale to the grid. They also offered to provide project financing, in the form of
loans and a government grant of £85,000 (distributed by the Combined
Heat and Power Association). This was accepted and a 10-year contract
was signed between the parties. This guarantees Barnet at least 90%
availability from the unit at a price which compares favourably with the
costs of self-generation. The council also receives a proportion of the reve-
nues from export of electricity to the grid. The new unit is also more than
twice as efficient in terms of energy generation as the plant it replaced, re-
sulting in a reduction of approximately 1,500 tons per annum of carbon di-
oxide emissions (Zaring (ed.) 2001).
TAC/Middelfart
(ESCO)
Middelfart Municipality has made a contract with TAC an (ESCO) about
setting up a energy savings systems for the municipality's buildings (ca. 100
buildings with a total of 170.000 m2. The contract includes primarily heat
and energy (and partially water). The project entails DKK 35-30 mill. in-
vestments in new technology and the setting up of an energy management
system with external monitoring. The project should lead to savings within a
time frame of 7 years. The ESCO has 2 years to demonstrate that savings
take place. It is a no-cure-no-pay agreement. The economic gain from the
savings will be split between the municipality and the ESCO. During the
spring 2008 the ESCO will finish its investigations of the potential savings.
Hereafter the ESCO has 4 years to install the needed technical solutions.
The municipality became aware of the project from the municipalities of
Örebro, Sweden, where TAC has set up a similar successful project. Mid-
delfart is the first Danish municipality to set up contractual arrangement with
an ESCO for energy management of most of its buildings. The project is
closely followed by other Danish municipalities.
ESCO
Modstrøm
Modstrøm: a new power provider on the Danish energy market that assist
costumer with counselling about energy savings.
Eastern Energy,
UK – ESCO
Eastern Energy is one of the energy service providers in the UK that pro-
vide more than just energy to their customers. They have a business devel-
opment team that offer services to their business customers that help in
monitoring and saving energy. Services include sub-metering, energy man-
agement data through load consumption and profiling, process monitoring,
as well as training in utility awareness and post training facilitation.
(www.cfsd.org.uk/events/tspd6/tspd6_3s_cases.html)
ESCO Berliner Energiagentur has participated in a range of projects in Berlin.
One example is an energy management system set up for Bartel & Sohn.
The company Bartel & Sohn (a glass machining company with about 100
employees) assigned Berliner Energieagentur GmbH the heat supply and
Innovative Business Models with Environmental Benefits
109
.
the introduction of an energy management system.
The installation of the energy management system is intended to reduce
the energy demand and is composed of the central electronic energy input
control system, partially in connection with the production facilities. Econo-
misation potentials are analysed and evaluated. Furthermore, measures to
reduce the demand of compressed air and effluents are implemented.
• supplied total area: ca. 10,000 m2
• natural gas condensing boiler unit: 200 kWh
• restoration of the existing oil boiler: 800 kWh
• commencement of supply: 2004
Berliner Energieagentur participates in the resulting savings.
www.berliner-e-agentur.de
Deconstruction
(PPS)
Deconstruction is a concept for selective dismantling or removal of materi-
als from building before or instead of demolition. The idea is to reuse as
much of old buildings as possible. The concept is evaluated as having a
high potential of environmental improvements in USA. In the US 'business
as usual' (BAU) is a low degree of reuse/recycle of materials from old build-
ings. In many cases deconstruction is an economically viable option, as it
often is cheaper to dismantle a building and selling the salvaged materials
than it is to demolish the building and pay for the disposal of wreckage.
Companies are specializing in offering deconstruction services.
Industrial Sym-
biosis - (IS)
Kalundborg
A symbiotic relationship between to or more companies where waste prod-
ucts from one company are either disposed of for free to the other com-
pany(ies) or bought on marked terms. In case of the industrial symbioses in
Kalundborg, Denmark, there are seven firms involved in the project and 20
different projects. This symbiosis has had significant environmental as well
as business benefits (www.symbiosis.dk).
IS -
Avedøreværket
(Christian Han-
sen). Alterna-
tively
TEP/COWI
Example of Industrial symbiosis in Avedøre, Denmark.
IS Case of Industrial Symbiosis in Landskrona, Sweden.
Mirata, M. (2005).
IS Examples of Industrial Symbiosis:
Austrian province of Styria, the Ruhr region of Germany, the JyvaÈ skylaÈ
region of Finland and the petrochemical complexes of Los Angeles, Hous-
ton and Sarnia (Canada).
Desrochers (2002).
IS Cases of Industrial Symbiosis in England.
Mirata (2004) reviews the factors influencing the development and sus-
tained operation of regional industrial symbiosis (IS) networks and dis-
cusses the roles a coordination body can play to alter these factors so as to
catalyse the development and functioning of such networks
Green Supply Is a concept, where a company controls the performance of companies up-
Innovative Business Models with Environmental Benefits
110
.
Chain Man-
agement
or downstream to improve in an environmentally friendly way. This concept
is relevant when the environmental improvements are followed by eco-
nomic savings.
Green Supply
Chain Man-
agement
Applied in some of the companies of the Nordic Partnership.
Hartmann, Coloplast, Novozymes and Flygt have succeeded in putting
pressure on their suppliers to produce more environmentally friendly. The
suppliers have gained from this economically by getting long-term con-
tracts.
Green Supply
Chain Man-
agement
Green Supply Chain Management in China.
Zhu, Q and R.P. Cote (2004):
The Guitang Group, a Chinese sugar complex, has developed an embry-
onic eco-industrial development by applying an integrated approach to
green supply chain management. The paper describes the Guitang Group
and its evolving integrated green supply chain management model.
Eco-efficient
Services (ESS)
All kinds of commercial market that offers aiming at fulfilling customers
needs by selling the utilisation of a product (system) instead of providing
just the product. ESS are services, relating to any kind of product, in which
some of the property rights are kept by the producer.
An eco-efficient producer service is one which improves the eco-efficiency
of customer activities. This can be done directly (by replacing an alternative
product-service mix) or indirectly (by influencing customer activities to be-
come more eco-efficient).
Mobility care
sharing
This is very common in Switzerland but not Germany for instance. Probably
depends on the public transport infrastructure.
Business mod-
els for building-
integrated solar
energy
«Solarsiedlung am Schlierberg» is an award-winning solar housing estate
in the city of Freiburg im Breisgau (Germany). Rolf Disch, an architect with
a longstanding experience in low-energy architecture, has driven the project
through a 10-year period that started with the planning of the first buildings
in 1997 and resulted in construction and completion of 50 single-family
homes and a commercial building complex between 2000 and 2006. Today,
180 people are living in the solar housing estate, and the related commer-
cial building provides office space for an additional 240 people. While low
energy architecture has recently become more and more popular in various
European countries, this project is unique in that the buildings generate
more energy than they consume, which is why Rolf Disch has coined the
term "plus-energy houses". This has become possible by combining the
latest insights about energy efficiency in buildings (such as high-
performance transparent insulation, heat recovery) with replacing traditional
roof structures by large-scale photovoltaic panels (Wüstenhagen, 2008).
EPR (extended
producer re-
sponsibility)
Extended Producer Responsibility (EPR) is a strategy designed to promote
the integration of environmental costs associated with products throughout
their life cycles into the market price of the products (OECD 1999).
Extended producer responsibility imposes accountability over the entire life
cycle of products and packaging introduced on the market. This means that
firms, which manufacture, import and/or sell products and packaging, are
required to be financially or physically responsible for such products after
their useful life. They must either take back spent products and manage
them through reuse, recycling or in energy production, or delegate this re-
sponsibility to a third party, a so-called producer responsibility organization
Innovative Business Models with Environmental Benefits
111
.
(PRO), which is paid by the producer for spent-product management. In this
way, EPR shifts responsibility for waste from government to private indus-
try, obliging producers, importers and/or sellers to internalise waste man-
agement costs in their product prices (Hanisch, 2000).
PPPs (public-
private partner-
ships
Private finance, design, build, operation and maintenance of public infra-
structure over a sustained period of time which ushers in new governance
practices
[currently awaiting examples from Building Schools for the Future (BSF)]
Exploitation of
waste heat
LEGO and Billund Municipality concerning waste water. Joint project aimed
at solving problems with getting rid of waste water in the area.
Win-Win trans-
portation solu-
tions
Win-Win transportation solutions help solve transportation problems by
removing market distortions that encourage inefficient travel behaviour and
help to increase consumer choice. These solutions are cost effective and
technically feasible reforms based on market principles.
CSA (commu-
nity supported
agriculture)
Community supported production-consumption concepts where the con-
sumers become co-designer and co-producer in the system. Especially
available in the area of food/ organic food production at the moment.
Community supported agriculture (CSA) is a new idea in farming, one that
has been gaining momentum since its introduction to the United States
from Europe in the mid-1980s. The CSA concept originated in the 1960s in
Switzerland and Japan, where consumers interested in safe food and farm-
ers seeking stable markets for their crops joined together in economic part-
nerships (http://www.nal.usda.gov/afsic/pubs/csa/csadef.shtml).
Design offices In the consulting business there are very interesting design offices coming
up, that analyze where environmental problems are and design a solution
for the existing problem, then approach the company/ organization which
has the problem and sells them the solution for license fees.
After a period of high investments these consultancies then can live from
license fees that are generated as long as the client companies apply their
solutions.
Micro factory
retailing (MFR)
With micro-factory retailing the terms of competition are changed. Rather
than seeking to match the high-volume, low unit cost approach of traditional
manufacturing and distribution, micro factory retailing (MFR) refutes that
logic by placing small factories within the markets they serve - and so elimi-
nates the distinction between production and retailing. Rather than having
one large plant producing, say 250,000 cars per annum the MFR approach
would involve 50 plants, each assembling 5,000 cars per annum (i.e.
250,000 in total). There would be no separate distribution channels or sales
outlets: the factory is also the sales, maintenance, service and repair loca-
tion. Power train components and other generic items could be centrally
produced in conveniently located highly automated facilities for distribution
to the decentralised assembly plants, thus benefiting from economies of
scale. Ironically this would conform to the early Ford dictum of “Manufactur-
ing near the source of supply and assembling near the point of distribution”.
THE ECO-
ROVER
CONCEPT: AN
ALTERNATIVE
COMMUNITY
The eco-rover is a concept developed by Bill Tubbs, an entrepreneur based
in Canada. In brief, his idea has two main elements:
• A fleet of cars is owned, operated and maintained by a third-party
transport provider who serves a range of transportation needs in a community;
Innovative Business Models with Environmental Benefits
112
.
TRANSPORTA
TION SCHEME
• The fleet uses existing vehicles (i.e. buys in used cars) that are continuously ‘refreshed’ in order to reduce and potentially elimi-nate depreciation.
The underlying principle is one of improving eco-efficiency through en-
hanced utilisation of vehicles. The communal provision of transportation
reduces the amount of time the vehicle is left idle: a typical car in private
ownership is in use of only 5% of the time, often much less.
New climate
model (Dong
and Novo)
A business model changes energy savings to new wind turbines. DONG - a
Danish energy provider - cooperates with Novo - a Danish medical com-
pany. The economic gains provided by energy savings in Novo is used to
build wind turbines in a new of shore wind turbine park 'Horns Rev II' estab-
lished by DONG. Very significant levels of energy savings have been re-
corded.
Success history
about ecologi-
cal milk produc-
tion.
Holm et al. (ed.) "Økologisk modernisering på dansk - Brud og bevægelser i
miljøindsatsen", Frydenlund 2008. (se kap. 11, 13 og 14 for historierne om
historien bag økologisk mælk og nye passive huse).
Success history
about passive
housing
Holm et al. (ed.) "Økologisk modernisering på dansk - Brud og bevægelser i
miljøindsatsen", Frydenlund 2008. (se kap. 11, 13 og 14 for historierne om
historien bag økologisk mælk og nye passive huse).
Just-in-time Just-in-time (JIT) is a manufacturing and inventory management technique,
initially developed by the Toyota Motor Corporation, which has been widely
adopted around the world. It is often considered to be synonymous with
lean production, and has been hailed for its efficiency, customer service,
and cost savings. This paper seeks to inventory and analyze the environ-
mental effects of switching from traditional management to JIT. After outlin-
ing the many environmental impacts, it further seeks to address the impacts
from supplier transportation, which have not been extensively addressed by
previous researchers (Nathan, 2007).
Cookson
Group, UK –
specialist engi-
neering leasing.
Cookson Group supplies engineering products for the steel, glass and ce-
ramics sectors. One of its services is to rent refractory furnace liners to
steel companies in order to help them avoid refractory disposal and stock-
ing problems. They also provide consultancy to their customers in order to
lower customer's production costs with project management services.
(www.cfsd.org.uk/events/tspd6/tspd6_3s_cases.html)
Greenstar
Community
centre, USA –
e-commerce
services
The Greenstar community centre is essentially a group of products that
deliver e-commerce service capabilities to virtually any place within the
world. The centre is a unified hardware system, which is highly portable.
The community enclosure includes a segmented room enclosing a medical
clinic with basic equipment and tele-medicine connections, a classroom, an
e-commerce and computer workstation, all powered by a commercial-grade
photo-voltaic solar power array, and connected to the Web through a satel-
lite dish or digital cellular modem for high-speed telecommunications. The
Greenstar Corporation works with a community to develop products of cul-
tural value, and to translate that into market value using the community
centre. (www.cfsd.org.uk/events/tspd6/tspd6_3s_cases.html)
Mobile Dish-
washing, Ger-
The German Federation for Environment and Nature Protection has been
using a mobile dishwashing service system at outdoor festivals and mar-
Innovative Business Models with Environmental Benefits
113
.
many – domes-
tic services
kets since 1992. It reduces plastic waste by washing porcelain and
stainless steel, using environmentally friendly cleaning products.
(www.cfsd.org.uk/events/tspd6/tspd6_3s_cases.html)
Oce, The Neth-
erlands – pho-
tocopier and
printer re-
manufacture
Oce produces Photocopiers and Printers and has a commitment to the en-
vironment and eco-design and has been involved with various projects in
the Netherlands. Oce design products for a long lifetime and since 1990
they have taken back their products with components re-used back into the
market or recycled back into raw materials.
(www.cfsd.org.uk/events/tspd6/tspd6_3s_cases.html)
Odin Organic
Vegetables,
Netherlands –
subscription
food
Odin supplies a service of organically grown fruit and vegetables direct to
consumers from Farmers. The consumer receives the produce by paying a
fixed subscription fee. All produce is supplied to Odin by growers on a fixed
price contract, without using third parties such as wholesalers or auctions.
Odin also offers its growers advice on agricultural and horticultural matters
by experts as part of the supply relationship.
(www.cfsd.org.uk/events/tspd6/tspd6_3s_cases.html)
Philips Omnidi-
agnost – medi-
cal systems
The OmniDiagnost is a Radiography and Fluoroscopy (RF) system de-
signed for patient examinations within hospitals. Maintenance and further
technical support for the system can be offered remotely and these func-
tions are available through service contracts. Philips also offers full training
in its operation under clinical conditions using purpose-built facilities. Philips
also offers the option of leasing the product over purchasing.
(www.cfsd.org.uk/events/tspd6/tspd6_3s_cases.html)
Renew Inc,
USA – furniture
re-manufacture
Renew Inc. re-manufactures previously owned Steelcase® office furniture
systems to "as new" condition employing environmentally responsible refin-
ishing techniques. Renew offers four services programs that maximize the
value of your existing furniture assets. These services programs can be
used to purchase either remanufactured Renew or new Steelcase furniture.
(www.cfsd.org.uk/events/tspd6/tspd6_3s_cases.html)
Wilkhahn, Ger-
many - furniture
services
This company offers a range of furniture products to the consumer that en-
vironmentally design conscious. Products are made for easy repair and
maintenance, disassembly and reuse. They also sell a maintenance sub-
scription to the sold furniture. This service annually replaces parts of the
furniture that are worn out.
(www.cfsd.org.uk/events/tspd6/tspd6_3s_cases.html)
Osaka Eco
town
The program aims at creating a national scale model of a sound material-
cycle society in Osaka metropolitan area. In order to reinvigorate industries
in Osaka through vitalizing environmental businesses, the program includes
the construction of innovative private recycling facilities on a vacant lot of
demolished final disposal site combined with nature restoration.
Saraya A company located in the Osaka Eco town.
Cosmetics/detergent company, actively participating in several initiatives to
improve the environment, hereunder The Kansai Sustainability Network
(KSN) – an experimental facility that converts organic waste into charcoal
for carbon sequestration, agriculture and commercial purposes. Since
2003, the KSN has been exploring this green technology as a means of
offsetting the effects of greenhouse emissions.
Metabolix Founded in 1992, Metabolix is an innovation-driven bioscience company
providing sustainable, clean solutions to the world’s needs for plastics, fuels
Innovative Business Models with Environmental Benefits
114
.
and chemicals.
50-50 joint venture with Archer Daniels Midland (ADM), to commercialize
the production of Mirel™ bioplastics.
Solvay sustain-
able develop-
ment
Solvay has changed radically in recent years, into a group focused on com-
petitiveness, leadership and high added value activities, aimed at sustained
and profitable growth and led by a passion for innovation.
A range of initiatives to profit from environmental initiatives e.g. concerning
eco-efficiency and reducing hazardous waste
ECOVER ECOVER built the world’s first ecological factory in Malle, Belgium. Today,
Belgium’s Minister of Environmental Affairs and Pensions, Bruno Tobback,
is opening ECOVER’s second ecological factory in France. The new factory
is situated in Landacres Park, a business park that limits entry to compa-
nies showing respect for nature as an extremely important aspect of run-
ning their business.
Transportation
Management
Associations
Transportation Management Associations (TMAs) are non-profit, member-
controlled organizations that provide transportation services in a particular
area, such as a commercial district, mall, medical centre or industrial park.
They are generally public-private partnerships, consisting primarily of area
businesses with local government support. Transportation Management
Coordinators (TMC) are professionals who work for TMAs or individual em-
ployers.
TMAs provide an institutional framework for TDM Programs and services.
They are usually more cost effective than programs managed by individual
businesses. TMAs allow small employers to provide Commute Trip Reduc-
tion services comparable to those offered by large companies. They avoid
problems that may be associated with government-run TDM programs,
since they are controlled by members.
Transportation Management Associations can provide a variety of services
that encourage more efficient use of transportation and parking resources.
(http://www.vtpi.org/tdm/tdm44.htm).
Product-life-
cycle manage-
ment (and in-
formation track-
ing using smart
embedded sys-
tems)
In the actual globally changing business environment, companies are seek-
ing new ways of providing additional value to customers and gain a com-
petitive edge over their competitors. Past initiatives aimed solely at product
cost, quality, or time-to-market are no longer sufficient to gain market ad-
vantage. The focus today is on innovation: products that differentiate them-
selves from others while also being affordable, reliable, and early to market.
Total management of the product lifecycle is critical to innovatively meet
customer needs throughout its entire life cycle without driving up costs,
sacrificing quality, or delaying product delivery. The ability of industry to
provide such holistic products and supporting services is currently limited
by the information gap in the products life cycle (i.e. the flow of information
between the design/production phase and middle and end of life phase of
the products life cycle).
PROMISE [ed.: an EU-funded international research project) offers the fol-
lowing business proposition to the Product Lifecycle stakeholders: to create
value by transforming information to knowledge at all phases of the product
lifecycle and thus improve product and service quality, efficiency and sus-
tainability. www.promise.no
Innovative Business Models with Environmental Benefits
115
.
11 Sources
11.1 References
Børsen (2008a): 27 February 2008a CSP (2004): Chemical Management Services: Industry Report 2004.CMS
Forum. Danish Energy Authority (2007): Omkostninger til miljøvenlig elproduk-
tion (PSO-omkostninger), 15-06-2007 EFP (Energistyrelsens energiforskningsprogram) [the Danish Energy
Agency's Energy Research Programme] (2007): Energitjenester - Sta-tusredegørelse og eksempler. http://www.bygningsenergi.dk/fundanemt/files/Delrapport_1_041007.pdf
Eurostat. 2007. European Business. Facts and Figures. Eurostat Statistical Books.
Federal Statistical Office (2008) Environmental Statistics and Accounts - Air Emissions in the EU. Federal Statistical Office, Germany.
Fuji Xerox (2005): Corporate societal responsibility: knowledge learning through sustainable global supply chain management. Available from http://www.reman.org/pdf/Fuji-Xerox.pdf
Franke, C., Basdere, B., Ciupek, M. and Seliger, S. (2006): Remanufactur-ing of mobile phones - capacity, program and facility adaption plan-ning. Omega, 34: 562-570.
Giuntini, R. and Gaudette, K. (2003): Remanufacturing: The next great opportunity for boosting US productivity. Business Horizons, 46(6): 41-48.
Goldman, C., Hopper, N., and Osborn, J. (2005): Review of U.S. ESCO Industry Market Trends: An Empirical Analysis of Project Data. Envi-ronmental Energy Technologies Division, Ernesto Orlando Lawrence Berkeley National Laboratories. Energy Policy 33(3): 387-405.
GM (2007): 2005/06 Corporate Responsibility Report. General Motors Corporation. Available from http://www.gm.com/corporate/responsibility/reports/
Haefeli, U., Matti, D., Schreyer, C. and Maibach, M. (2006): Evaluation Car-Sharing: Schlussbericht. Bern: Bundesamt für Energie.
HM Treasury (2006): PFI: strengthening long-term partnerships. London: HM Treasury
Hockerts (2003): Mobility Car-Sharing (E). Environmental and Social Im-pacts. Oikos Sustainability Case Collection, draft version.
Innovative Business Models with Environmental Benefits
116
.
Hodge, G. and Greve, C. (2007): Public-Private Partnerships: An Interna-tional Performance Review. Public Administration Review 67(3): 545-558.
Hopper, N., Goldman, C., Gilligan, D. and Singer, T.E. (2007): A Survey of the U.S. ESCO Industry: Market Growth and Development from 2000-20006. Energy Analysis Department, Ernest Orlando Lawrence Berkeley National Laboratory.
Information, 13 June 2006 (Jens Holstielsen, DI) Jacobsson, U. (2002): Towards more sustainable mobility: Exploring suc-
cess factors for car sharing in Europe. Thesis, Lund: Lund University. King, A.M. and Burgess, S.C. (2005): The development of a remanufactur-
ing platform design: a strategic response to the Directive on Waste Electrical and Electronic Equipment. Proceedings of the Institution of Mechanical Engineers. Part B. Journal of engineering manufacture, 219: 623-631.
Ligon, P., Marett, G. and Votta, T. (2001): Advanced Resource Manage-ment in Nebraska - A Demonstration project Sponsored by Nebraska Environmental Trust. Tellus Institute, Boston.
Mobility (1997): Statuetten der Mobility Genossenschaft. www.mobility.ch
Mobility (2007): Meilensteine der Geschichte von Mobility und ihrer Vor-gängergenossenschaften. Medienkoferenz (04-05-2007).
Mobility (2008):Mobility CarSharing expandiert nach Österreich. Medi-enmittelung, Luzern/Wien (03-01-2008). Accessible from: http://www.mobility.ch/upload/docs/PDF/MM_2008-01-03_Denzel_D_DEF1.pdf
Mobility (2008b): Mobility continues to grow. Press release, 14-03-2008. Mont, O., Singhal, P. and Fadeeva, Z. (2006): Chemical Management Ser-
vices in Sweden and Europe: Lessons for the Future. Journal of Indus-trial Ecology, 10(1-2): 279-292.
Mont, O. (2002): Clarifying the concept of product-service system. Jour-nal of Cleaner Production, 10 (3): 237-245.
Muheim, P. (1998): CarSharing – der Schlüssel zur kombinierten mo-bilität. Programleitung Energie 2000.
Muheim, P. (2005): Mobility CarSharing Switzerland – the unconventional approach. Mobility CarSharing Switzerland, Moses final conference 2005.
Nagler, B. (1999): Reintroducing Remanufacturing. Machine Design, 71(22): 78-84.
OECD (2004):Waste Contract Design and Management for enhanced Waste Minimisation. Working Group on waste Prevention and Recy-cling, Organisation for Economic Co-operation and Development, ENV/EPOC/WGWPRN(2004)3/FINAL.
Oldham, J. and Votta, T. (2003): Chemical Management Services: Green-ing the Supply Chain. Greener Management International, 41: 89-100.
PartnershipsUK. 2007. PFI: The state of the Market. London: Partnerships UK.
Paolo B., Rezessy, S. and Vine, E. (2006a). Energy service companies in European Countries: Current status and a strategy to foster their devel-opment. Energy Policy, 34: 1818-1832.
Innovative Business Models with Environmental Benefits
117
.
PricewaterhouseCoopers (2005) Delivering the PPP promise. A review of PPP issues and activities. PricewaterhouseCoopers (www.pwc.com)
PU-BENEFS (2005) Best practice report Sweden Region Fastigheter Skåne. Sweden: Energy Agency for Southeast Sweden.
Scally, John (2004): Public-Private Partnerships in Ireland: An Overview. Quarterly Bulletin, Autumn 2004.
Statistics of shared cars (2008): Development in number of shared cars in Denmark. Dansk Delebiler.
Stoughton, M. and Votta, T. (2003): Implementing service-based chemical procurement: lessons and results. Journal of Cleaner Production, 11(8): 839-849.
Sundin, E. and Bras, B. (2005): Making functional sales environmentally and economically beneficial through remanufacturing. Journal of Cleaner Production, 13(9): 913-925.
TAC (2008a): One page project summary sheet provided by TAC Tukker, A. (2004). Eight types of product-service-system: eight ways to
sustainability? Experiences from Suspronet. Business Strategy and the Environment. 13: 246-260.
US EPA (1997): Remanufactured Products: Good as New. WasteWise Update, EPA530-N-97-002.
US EPA (2001): From Waste to Resource Management: Reinventing Waste Contracts and Services. A Discussion Paper prepared for the US EPA WasteWise programme.
US EPA (Year unknown): Resource Management: Innovative Solid Waste Contracting Methods. U.S. EPA. On-line report accessible from: http://www.epa.gov/wastewise/wrr/rm.htm
Vine, E. (2005). An International survey of the energy service company (ESCO) industry. Energy Policy, 33: 691-704.
Vrij, A., Meester, A., Tomiyama, T. (2006): A Comparative Study of Models of Remarketing. Paper for the 13th CIRP International Confer-ence on Life Cycle Engineering, Leuven (31-05-2006 - 02-06-2006). Document accessible from http://www.mech.kuleuven.be/lce2006/Registration_papers.htm
Legislation
Directive 2006/32/EC of 5 April 2006, Chapter 1, Article 3, point 1. Directive on energy end-use efficiency and energy services
Directive 2002/95/EC Waste Electrical and Electronic Equipment Directive
EC 1907/2006 European Community Regulation on chemicals and their safe use.
11.2 List of case interviews
Company Name and position Date
Novo Nordisk Vibeke Burchard, project manager for the climate
strategy
25 April 2008
ASML Boudewijn Sluijk, Director of Product Marketing 9 May 2008
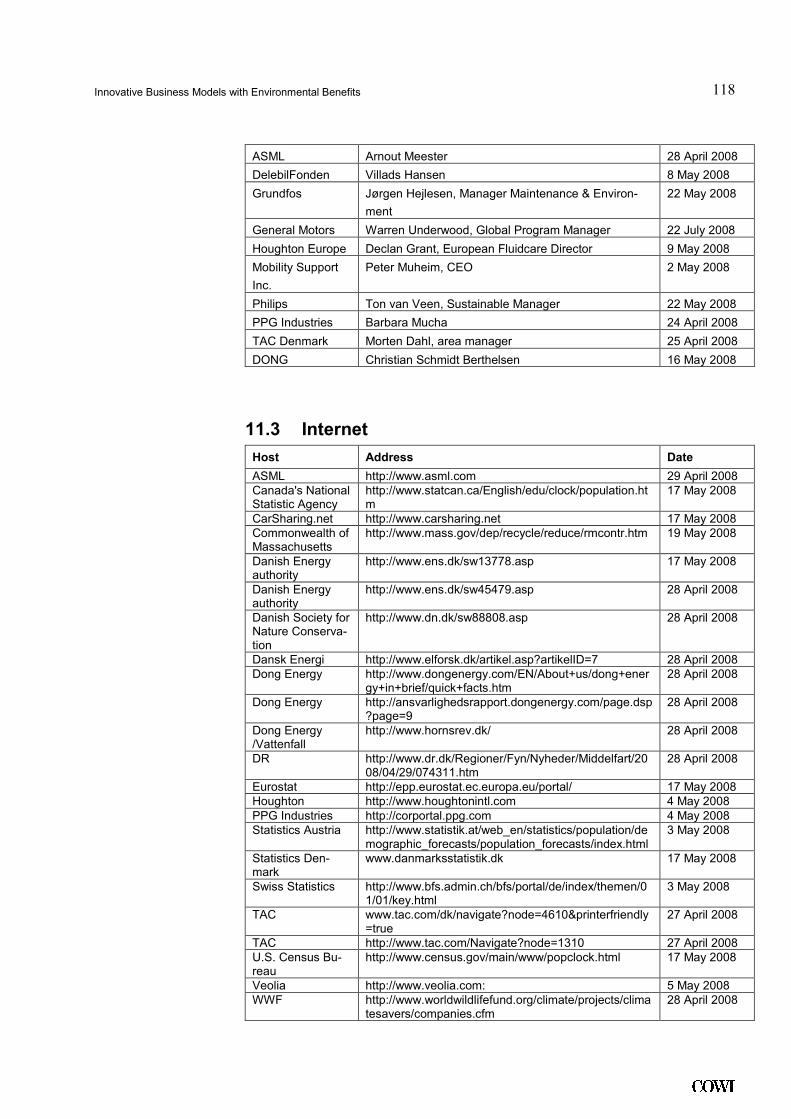
Innovative Business Models with Environmental Benefits
118
.
ASML Arnout Meester 28 April 2008
DelebilFonden Villads Hansen 8 May 2008
Grundfos Jørgen Hejlesen, Manager Maintenance & Environ-
ment
22 May 2008
General Motors Warren Underwood, Global Program Manager 22 July 2008
Houghton Europe Declan Grant, European Fluidcare Director 9 May 2008
Mobility Support
Inc.
Peter Muheim, CEO 2 May 2008
Philips Ton van Veen, Sustainable Manager 22 May 2008
PPG Industries Barbara Mucha 24 April 2008
TAC Denmark Morten Dahl, area manager 25 April 2008
DONG Christian Schmidt Berthelsen 16 May 2008
11.3 Internet
Host Address Date
ASML http://www.asml.com 29 April 2008 Canada's National Statistic Agency
http://www.statcan.ca/English/edu/clock/population.htm
17 May 2008
CarSharing.net http://www.carsharing.net 17 May 2008 Commonwealth of Massachusetts
http://www.mass.gov/dep/recycle/reduce/rmcontr.htm 19 May 2008
Danish Energy authority
http://www.ens.dk/sw13778.asp 17 May 2008
Danish Energy authority
http://www.ens.dk/sw45479.asp 28 April 2008
Danish Society for Nature Conserva-tion
http://www.dn.dk/sw88808.asp 28 April 2008
Dansk Energi http://www.elforsk.dk/artikel.asp?artikelID=7 28 April 2008 Dong Energy http://www.dongenergy.com/EN/About+us/dong+ener
gy+in+brief/quick+facts.htm 28 April 2008
Dong Energy http://ansvarlighedsrapport.dongenergy.com/page.dsp?page=9
28 April 2008
Dong Energy /Vattenfall
http://www.hornsrev.dk/ 28 April 2008
DR http://www.dr.dk/Regioner/Fyn/Nyheder/Middelfart/2008/04/29/074311.htm
28 April 2008
Eurostat http://epp.eurostat.ec.europa.eu/portal/ 17 May 2008 Houghton http://www.houghtonintl.com 4 May 2008 PPG Industries http://corportal.ppg.com 4 May 2008 Statistics Austria http://www.statistik.at/web_en/statistics/population/de
mographic_forecasts/population_forecasts/index.html 3 May 2008
Statistics Den-mark
www.danmarksstatistik.dk 17 May 2008
Swiss Statistics http://www.bfs.admin.ch/bfs/portal/de/index/themen/01/01/key.html
3 May 2008
TAC www.tac.com/dk/navigate?node=4610&printerfriendly=true
27 April 2008
TAC http://www.tac.com/Navigate?node=1310 27 April 2008 U.S. Census Bu-reau
http://www.census.gov/main/www/popclock.html 17 May 2008
Veolia http://www.veolia.com: 5 May 2008 WWF http://www.worldwildlifefund.org/climate/projects/clima
tesavers/companies.cfm 28 April 2008
Recommended