Shri Lakshmi Cotsyn Limited
Independent Equity Research Enhancing investment decisions
In-depth analysis of the fundamentals and valuation
Business Prospects Financial Performance
Corporate Governance
Management Evaluation
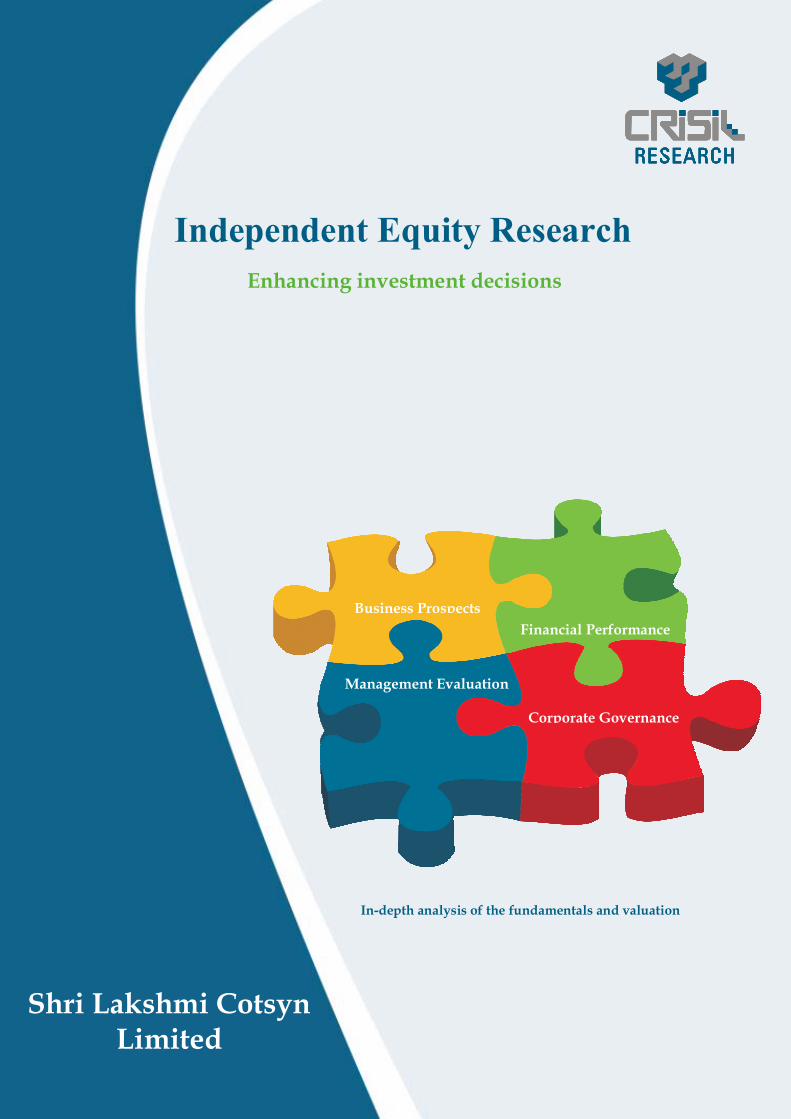
Explanation of CRISIL Fundamental and Valuation (CFV) matrix The CFV Matrix (CRISIL Fundamental and Valuation Matrix) addresses the two important analysis of an investment making process – Analysis of Fundamentals (addressed through Fundamental Grade) and Analysis of Returns (Valuation Grade)
Fundamental Grade CRISIL’s Fundamental Grade represents an overall assessment of the fundamentals of the company graded in relation to other listed equity securities in India. The grade facilitates easy comparison of fundamentals between companies, irrespective of the size or the industry they operate in. The grading factors in the following:
Business Prospects: Business prospects factors in Industry prospects and company’s future financial performance Management Evaluation: Factors such as track record of the management, strategy are taken into consideration Corporate Governance: Assessment of adequacy of corporate governance structure and disclosure norms
The grade is assigned on a five-point scale from grade 5 (indicating Excellent fundamentals) to grade 1 (Poor fundamentals)
CRISIL Fundamental Grade Assessment 5/5 Excellent fundamentals 4/5 Superior fundamentals 3/5 Good fundamentals 2/5 Moderate fundamentals 1/5 Poor fundamentals
Valuation Grade CRISIL’s Valuation Grade represents an assessment of the potential value in the company stock for an equity investor over a 12 month period. The grade is assigned on a five-point scale from grade 5 (indicating strong upside from the current market price (CMP)) to grade 1 (strong downside from the CMP).
CRISIL Valuation Grade Assessment 5/5 Strong upside (>25% from CMP) 4/5 Upside (10-25% from CMP) 3/5 Align (+-10% from CMP) 2/5 Downside (negative 10-25% from CMP) 1/5 Strong downside (<-25% from CMP) Analyst Disclosure Each member of the team involved in the preparation of the grading report, hereby affirms that there exists no conflict of interest that can bias the grading recommendation of the company. Additional Disclosure This report has been sponsored by NSE - Investor Protection Fund Trust (NSEIPFT). Disclaimer: This Exchange-commissioned Report (Report) is based on data publicly available or from sources considered reliable. CRISIL Ltd. (CRISIL) does not represent that it is accurate or complete and hence, it should not be relied upon as such. The data / Report are subject to change without any prior notice. Opinions expressed herein are our current opinions as on the date of this Report. Nothing in this Report constitutes investment, legal, accounting or tax advice or any solicitation, whatsoever. The subscriber / user assumes the entire risk of any use made of this data / Report. CRISIL especially states that it has no financial liability, whatsoever, to the subscribers / users of this Report. This Report is for the personal information only of the authorized recipient in India only. This Report should not be reproduced or redistributed or communicated directly or indirectly in any form to any other person – especially outside India or published or copied in whole or in part, for any purpose.
CRISIL Equities 1
Weaving a diversified pattern Industry: Textiles Date: October 13, 2010
Independent Research Report – Shri Lakshmi Cotsyn Ltd
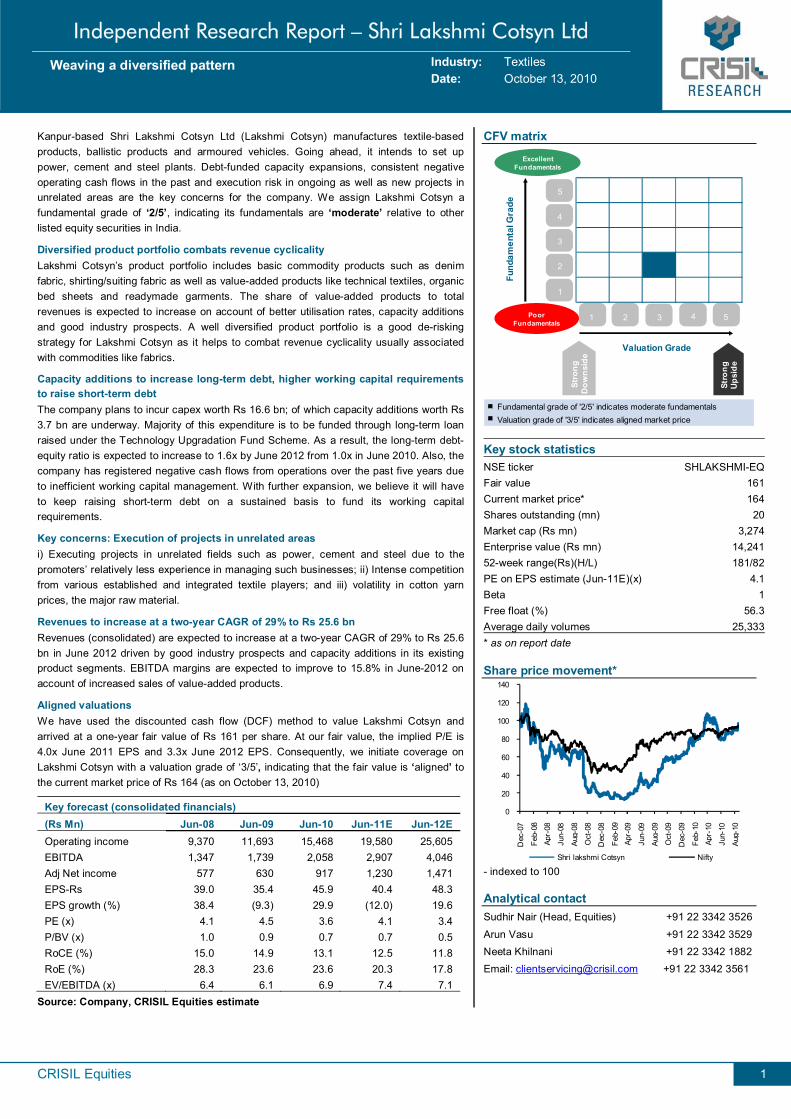
Kanpur-based Shri Lakshmi Cotsyn Ltd (Lakshmi Cotsyn) manufactures textile-based products, ballistic products and armoured vehicles. Going ahead, it intends to set up power, cement and steel plants. Debt-funded capacity expansions, consistent negative operating cash flows in the past and execution risk in ongoing as well as new projects in unrelated areas are the key concerns for the company. We assign Lakshmi Cotsyn a fundamental grade of ‘2/5’, indicating its fundamentals are ‘moderate’ relative to other listed equity securities in India.
Diversified product portfolio combats revenue cyclicality Lakshmi Cotsyn’s product portfolio includes basic commodity products such as denim fabric, shirting/suiting fabric as well as value-added products like technical textiles, organic bed sheets and readymade garments. The share of value-added products to total revenues is expected to increase on account of better utilisation rates, capacity additions and good industry prospects. A well diversified product portfolio is a good de-risking strategy for Lakshmi Cotsyn as it helps to combat revenue cyclicality usually associated with commodities like fabrics.
Capacity additions to increase long-term debt, higher working capital requirements to raise short-term debt The company plans to incur capex worth Rs 16.6 bn; of which capacity additions worth Rs 3.7 bn are underway. Majority of this expenditure is to be funded through long-term loan raised under the Technology Upgradation Fund Scheme. As a result, the long-term debt-equity ratio is expected to increase to 1.6x by June 2012 from 1.0x in June 2010. Also, the company has registered negative cash flows from operations over the past five years due to inefficient working capital management. With further expansion, we believe it will have to keep raising short-term debt on a sustained basis to fund its working capital requirements.
Key concerns: Execution of projects in unrelated areas i) Executing projects in unrelated fields such as power, cement and steel due to the promoters’ relatively less experience in managing such businesses; ii) Intense competition from various established and integrated textile players; and iii) volatility in cotton yarn prices, the major raw material.
Revenues to increase at a two-year CAGR of 29% to Rs 25.6 bn Revenues (consolidated) are expected to increase at a two-year CAGR of 29% to Rs 25.6 bn in June 2012 driven by good industry prospects and capacity additions in its existing product segments. EBITDA margins are expected to improve to 15.8% in June-2012 on account of increased sales of value-added products.
Aligned valuations We have used the discounted cash flow (DCF) method to value Lakshmi Cotsyn and arrived at a one-year fair value of Rs 161 per share. At our fair value, the implied P/E is 4.0x June 2011 EPS and 3.3x June 2012 EPS. Consequently, we initiate coverage on Lakshmi Cotsyn with a valuation grade of ‘3/5’, indicating that the fair value is ‘aligned’ to the current market price of Rs 164 (as on October 13, 2010)
Key forecast (consolidated financials) (Rs Mn) Jun-08 Jun-09 Jun-10 Jun-11E Jun-12E Operating income 9,370 11,693 15,468 19,580 25,605 EBITDA 1,347 1,739 2,058 2,907 4,046 Adj Net income 577 630 917 1,230 1,471 EPS-Rs 39.0 35.4 45.9 40.4 48.3 EPS growth (%) 38.4 (9.3) 29.9 (12.0) 19.6 PE (x) 4.1 4.5 3.6 4.1 3.4 P/BV (x) 1.0 0.9 0.7 0.7 0.5 RoCE (%) 15.0 14.9 13.1 12.5 11.8 RoE (%) 28.3 23.6 23.6 20.3 17.8 EV/EBITDA (x) 6.4 6.1 6.9 7.4 7.1
Source: Company, CRISIL Equities estimate
CFV matrix
Fundamental grade of '2/5' indicates moderate fundamentalsValuation grade of '3/5' indicates aligned market price
1
2
3
4
5
1 2 3 4 5
Valuation Grade
Fund
amen
tal G
rade
Poor Fundamentals
ExcellentFundamentals
Stro
ngD
owns
ide
Stro
ngUp
side
Key stock statistics NSE ticker SHLAKSHMI-EQFair value 161Current market price* 164Shares outstanding (mn) 20Market cap (Rs mn) 3,274Enterprise value (Rs mn) 14,24152-week range(Rs)(H/L) 181/82PE on EPS estimate (Jun-11E)(x) 4.1Beta 1Free float (%) 56.3Average daily volumes 25,333* as on report date Share price movement*
0
20
40
60
80
100
120
140
Dec
-07
Feb-
08
A pr-
08
Jun-
08
Aug-
08
Oct
-08
Dec
-08
Feb-
09Ap
r-09
Jun-
09
Aug-
09
Oct
-09
Dec
-09
Feb-
10
A pr-
10
Jun-
10
Aug-
10
Shri lakshmi Cotsyn Nifty - indexed to 100 Analytical contact Sudhir Nair (Head, Equities) +91 22 3342 3526
Arun Vasu +91 22 3342 3529 Neeta Khilnani +91 22 3342 1882 Email: [email protected] +91 22 3342 3561
CR
ISIL
Equ
ities
Shri
Laks
hmi C
otsy
n Li
mite
d
2
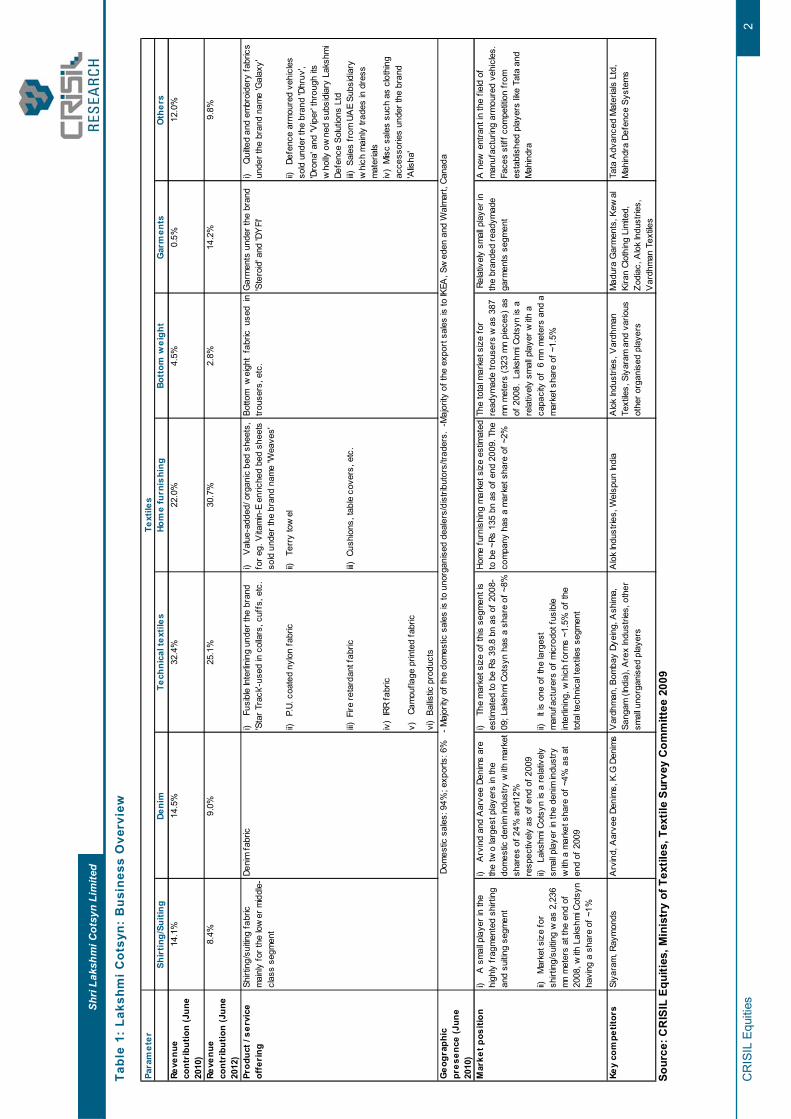
Tabl
e 1:
Lak
shm
i Cot
syn:
Bus
ines
s O
verv
iew
Pa
ram
eter
Shir
ting/
Suiti
ngDe
nim
Tech
nica
l tex
tiles
Hom
e fu
rnis
hing
Bott
om w
eigh
tG
arm
ents
Oth
ers
Reve
nue
cont
ribu
tion
(Jun
e 20
10)
14.1
%14
.5%
32.4
%22
.0%
4.5%
0.5%
12.0
%
Reve
nue
cont
ribu
tion
(Jun
e 20
12)
8.4%
9.0%
25.1
%30
.7%
2.8%
14.2
%9.
8%
i)
Fusi
ble
Inte
rlini
ng u
nder
the
bran
d 'S
tar T
rack
'-use
d in
col
lars
, cuf
fs, e
tc.
i)
Val
ue-a
dded
/ org
anic
bed
she
ets,
fo
r eg.
Vita
min
-E e
nric
hed
bed
shee
ts
sold
und
er th
e br
and
nam
e 'W
eave
s'
i)
Qui
lted
and
embr
oide
ry fa
bric
s un
der t
he b
rand
nam
e 'G
alax
y'
ii)
P.U.
coa
ted
nylo
n fa
bric
ii)
Terr
y to
wel
ii)
Defe
nce
arm
oure
d ve
hicl
es
sold
und
er th
e br
and
'Dhr
uv',
'Dro
na' a
nd 'V
iper
' thr
ough
its
who
lly o
wne
d su
bsid
iary
Lak
shm
i De
fenc
e So
lutio
ns L
tdiii)
Fire
reta
rdan
t fab
riciii)
Cus
hion
s, ta
ble
cove
rs, e
tc.
iii) S
ales
from
UA
E Su
bsid
iary
w
hich
mai
nly
trade
s in
dre
ss
mat
eria
lsiv
) IR
R fa
bric
v)
Cam
oufla
ge p
rinte
d fa
bric
vi)
Ballis
tic p
rodu
cts
Geo
grap
hic
pres
ence
(Jun
e 20
10)
i)
A s
mal
l pla
yer i
n th
e hi
ghly
frag
men
ted
shirt
ing
and
suitin
g se
gmen
t
i)
Arv
ind
and
Aar
vee
Deni
ms
are
the
two
larg
est p
laye
rs in
the
dom
estic
den
im in
dust
ry w
ith m
arke
t sh
ares
of 2
4% a
nd12
%
resp
ectiv
ely
as o
f end
of 2
009
i)
The
mar
ket s
ize
of th
is s
egm
ent i
s es
timat
ed to
be
Rs 3
9.8
bn a
s of
200
8-09
; Lak
shm
i Cot
syn
has
a sh
are
of ~
8%
ii)
Mar
ket s
ize
for
shirt
ing/
suitin
g w
as 2
,236
m
n m
eter
s at
the
end
of
2008
, with
Lak
shm
i Cot
syn
havi
ng a
sha
re o
f ~1%
ii)
Laks
hmi C
otsy
n is
a re
lativ
ely
smal
l pla
yer i
n th
e de
nim
indu
stry
w
ith a
mar
ket s
hare
of ~
4% a
s at
en
d of
200
9
ii)
It is
one
of t
he la
rges
t m
anuf
actu
rers
of m
icro
dot f
usib
le
inte
rlini
ng, w
hich
form
s ~1
.5%
of t
he
tota
l tec
hnic
al te
xtile
s se
gmen
t
Key
com
petit
ors
Siya
ram
, Ray
mon
dsA
rvin
d, A
arve
e De
nim
s, K
.G D
enim
s V
ardh
man
, Bom
bay
Dyei
ng, A
shim
a,
Sang
am (I
ndia
), A
rex
Indu
strie
s, o
ther
sm
all u
norg
anis
ed p
laye
rs
Alo
k In
dust
ries,
Wel
spun
Indi
a A
lok
Indu
strie
s, V
ardh
man
Te
xtile
s, S
iyar
am a
nd v
ario
us
othe
r org
anis
ed p
laye
rs
Mad
ura
Gar
men
ts, K
ewal
Ki
ran
Clot
hing
Lim
ited,
Zo
diac
, Alo
k In
dust
ries,
V
ardh
man
Tex
tiles
Tata
Adv
ance
d M
ater
ials
Ltd
, M
ahin
dra
Defe
nce
Syst
ems
Text
iles
Prod
uct /
ser
vice
of
feri
ngSh
irtin
g/su
iting
fabr
ic
mai
nly
for t
he lo
wer
mid
dle-
clas
s se
gmen
t
Deni
m fa
bric
Botto
mw
eigh
tfa
bric
used
intro
user
s, e
tc.
Gar
men
ts u
nder
the
bran
d 'S
tero
id' a
nd 'D
YFI
'
iv)
Mis
c sa
les
such
as
clot
hing
ac
cess
orie
s un
der t
he b
rand
'A
lisha
'
Dom
estic
sal
es: 9
4%; e
xpor
ts: 6
%
- Maj
ority
of t
he d
omes
tic s
ales
is to
uno
rgan
ised
dea
lers
/dis
tribu
tors
/trad
ers.
-M
ajor
ity o
f the
exp
ort s
ales
is to
IKEA
, Sw
eden
and
Wal
mar
t, Ca
nada
Mar
ket p
ositi
onHo
me
furn
ishi
ng m
arke
t siz
e es
timat
ed
to b
e ~R
s 13
5 bn
as
of e
nd 2
009.
The
co
mpa
ny h
as a
mar
ket s
hare
of ~
2%
The
tota
l mar
ket s
ize
for
read
ymad
e tro
user
s w
as 3
87
mn
met
ers
(323
mn
piec
es) a
s of
200
8. L
aksh
mi C
otsy
n is
a
rela
tivel
y sm
all p
laye
r with
a
capa
city
of
6 m
n m
eter
s an
d a
mar
ket s
hare
of ~
1.5%
Rel
ativ
ely
smal
l pla
yer i
n th
e br
ande
d re
adym
ade
garm
ents
seg
men
t
A n
ew e
ntra
nt in
the
field
of
man
ufac
turin
g ar
mou
red
vehi
cles
. Fa
ces
stiff
com
petit
ion
from
es
tabl
ishe
d pl
ayer
s lik
e Ta
ta a
nd
Mah
indr
a
So
urce
: CR
ISIL
Equ
ities
, Min
istr
y of
Tex
tiles
, Tex
tile
Surv
ey C
omm
ittee
200
9
CRISIL Equities
Shri Lakshmi Cotsyn Limited
3
Grading Rationale Diversified product portfolio – a good de-risking strategy Incorporated in 1988, Lakshmi Cotsyn has expanded from manufacturing only cotton
and blended fabrics to value-added products like technical textiles, organic bed sheets
and readymade garments to name a few. A well diversified product portfolio is a good de-risking strategy for Lakshmi Cotsyn as it helps to combat revenue cyclicality usually
associated with commodities like fabrics.
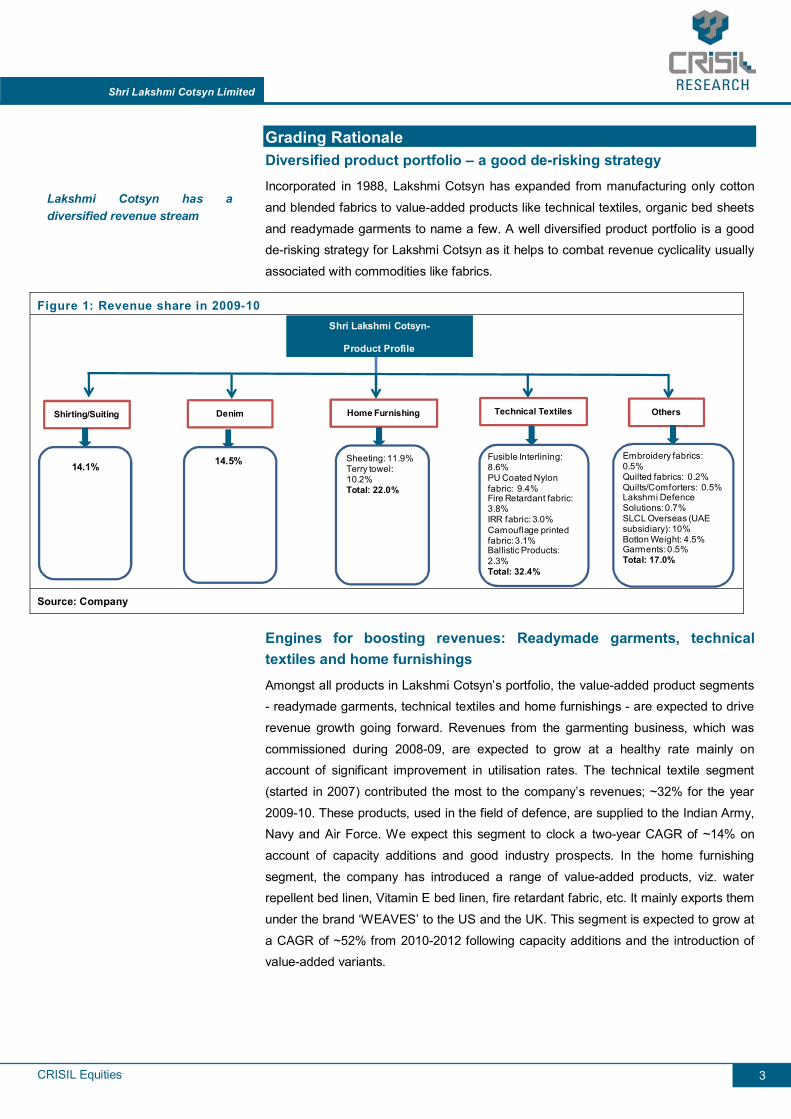
Figure 1: Revenue share in 2009-10 Shri Lakshmi Cotsyn-
Product Profile
Shirting/Suiting Denim Home Furnishing Technical Textiles Others
14.1% 14.5% Sheeting: 11.9% Terry towel: 10.2%Total: 22.0%
Fusible Interlining: 8.6%PU Coated Nylon fabric: 9.4%Fire Retardant fabric: 3.8% IRR fabric: 3.0%Camouflage printed fabric: 3.1%Ballistic Products: 2.3%Total: 32.4%
Embroidery fabrics: 0.5%Quilted fabrics: 0.2%Quilts/Comforters: 0.5% Lakshmi Defence Solutions: 0.7%SLCL Overseas (UAE subsidiary): 10%Botton Weight: 4.5%Garments: 0.5%Total: 17.0%
Source: Company
Engines for boosting revenues: Readymade garments, technical textiles and home furnishings
Amongst all products in Lakshmi Cotsyn’s portfolio, the value-added product segments - readymade garments, technical textiles and home furnishings - are expected to drive
revenue growth going forward. Revenues from the garmenting business, which was
commissioned during 2008-09, are expected to grow at a healthy rate mainly on account of significant improvement in utilisation rates. The technical textile segment
(started in 2007) contributed the most to the company’s revenues; ~32% for the year
2009-10. These products, used in the field of defence, are supplied to the Indian Army, Navy and Air Force. We expect this segment to clock a two-year CAGR of ~14% on
account of capacity additions and good industry prospects. In the home furnishing
segment, the company has introduced a range of value-added products, viz. water repellent bed linen, Vitamin E bed linen, fire retardant fabric, etc. It mainly exports them
under the brand ‘WEAVES’ to the US and the UK. This segment is expected to grow at
a CAGR of ~52% from 2010-2012 following capacity additions and the introduction of value-added variants.
Lakshmi Cotsyn has a diversified revenue stream
CRISIL Equities
Shri Lakshmi Cotsyn Limited
4
Industry outlook: CRISIL Research has estimated the domestic readymade garments
industry to grow at a CAGR of 7.4% from Rs 1,155 bn in 2009 to Rs 1,649 bn by 2014
driven by a rise in income levels, growing preference for readymade garments vis-à-vis tailored garments, and growth in organised retailing. The market size of the technical
textile segment in India is estimated to be ~Rs 39.8 bn as of 2008-09 and is expected
to grow at a CAGR of 11% to Rs 66.4 bn in 2012-13.(Source: Ministry of textiles) Majority of the home-furnishing products manufactured domestically are exported to the
US and the European Union. India, Pakistan and China are the key players in the US
market for bed linen, accounting for ~85% of the total market in value terms. Although, the slowdown in the US economy had impacted Indian exports, India managed to
slightly improve its market share from 16.8% during January-July 2008 period to 17.8%
during January-July 2009 period (Source: CRISIL Research). Post the downturn, home furnishing exports are expected to grow given the increased outsourcing from low-cost
producing nations like India.
CR
ISIL
Equ
ities
Shri
Laks
hmi C
otsy
n Li
mite
d
5
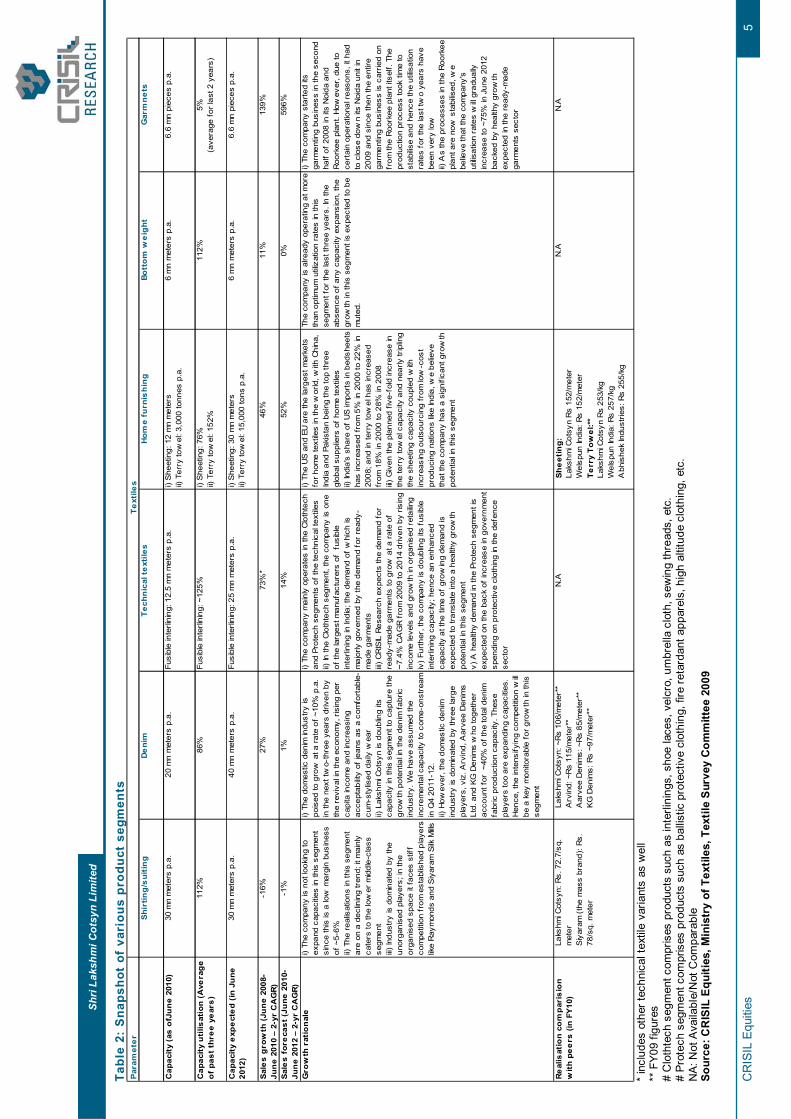
Tabl
e 2:
Sna
psho
t of
var
ious
pro
duct
seg
men
ts
Par
amet
er
Shi
rtin
g/s
uiti
ng
De
nim
Tec
hnic
al t
ext
iles
Hom
e fu
rnis
hin
gBo
tto
m w
eig
htG
arm
ne
ts
Cap
acit
y (a
s o
fJu
ne
201
0)30
mn
met
ers
p.a.
20 m
n m
eter
s p.
a.Fu
sibl
e in
terli
ning
: 12.
5 m
n m
eter
s p.
a.i)
She
etin
g: 1
2 m
n m
eter
s
ii)
Ter
ry to
wel
: 3,0
00 to
nnes
p.a
.6
mn
met
ers
p.a.
6.6
mn
piec
es p
.a.
Cap
acit
y u
tilis
atio
n (
Ave
rag
e
of
past
thr
ee
ye
ars
)11
2%86
%Fu
sibl
e in
terli
ning
: ~12
5%i)
She
etin
g: 7
6%
ii) T
erry
tow
el: 1
52%
112%
5%
(ave
rage
for l
ast 2
yea
rs)
Cap
acit
y e
xpe
cte
d (
in J
une
20
12)
30 m
n m
eter
s p.
a.40
mn
met
ers
p.a.
Fusi
ble
inte
rlini
ng: 2
5 m
n m
eter
s p.
a.i)
She
etin
g: 3
0 m
n m
eter
s
ii) T
erry
tow
el: 1
5,00
0 to
ns p
.a.
6 m
n m
eter
s p.
a.6.
6 m
n pi
eces
p.a
.
Sal
es
gro
wth
(Ju
ne
200
8-Ju
ne
201
0 –
2-yr
CA
GR
)-1
6%27
%73
%*
46%
11%
139%
Sal
es
for
eca
st (J
une
201
0-Ju
ne
201
2 –
2-yr
CA
GR
) -1
%1%
14%
52%
0%59
6%
Gro
wth
rat
ion
ale
i) Th
e co
mpa
ny is
not
look
ing
to
expa
nd c
apac
ities
in th
is s
egm
ent
sinc
e th
is is
a lo
w m
argi
n bu
sine
ss
of ~
5-6%
ii)
The
real
isat
ions
in th
is s
egm
ent
are
on a
dec
linin
g tr
end;
it m
ainl
y ca
ters
to th
e lo
wer
mid
dle-
clas
s se
gmen
t
iii) In
dust
ry is
dom
inat
ed b
y th
e un
orga
nise
d pl
ayer
s; in
the
orga
nise
d sp
ace
it fa
ces
stiff
co
mpe
titio
n fr
om e
stab
lishe
d pl
ayer
s lik
e R
aym
onds
and
Siy
aram
Silk
Mills
i) Th
e do
mes
tic d
enim
indu
stry
is
pois
ed to
gro
w a
t a ra
te o
f ~10
% p
.a.
in th
e ne
xt tw
o-th
ree
year
s dr
iven
by
the
revi
val i
n th
e ec
onom
y, r
isin
g pe
r ca
pita
inco
me
and
incr
easi
ng
acce
ptab
ility
of je
ans
as a
com
fort
able
- cu
m-s
tylis
ed d
aily
wea
r
ii) L
aksh
mi C
otsy
n is
dou
blin
g its
ca
paci
ty in
this
seg
men
t to
capt
ure
the
grow
th p
oten
tial in
the
deni
m fa
bric
in
dust
ry. W
e ha
ve a
ssum
ed th
e in
crem
enta
l cap
acity
to c
ome-
onst
ream
in
Q4
2011
-12.
ii) H
owev
er, t
he d
omes
tic d
enim
in
dust
ry is
dom
inat
ed b
y th
ree
larg
e pl
ayer
s, v
iz. A
rvin
d, A
arve
e D
enim
s Lt
d. a
nd K
G D
enim
s w
ho to
geth
er
acco
unt f
or ~
40%
of t
he to
tal d
enim
fa
bric
pro
duct
ion
capa
city
. The
se
play
ers
too
are
expa
ndin
g ca
paci
ties.
H
ence
, the
inte
nsify
ing
com
petit
ion
will
be a
key
mon
itora
ble
for g
row
th in
this
se
gmen
t
i) Th
e co
mpa
ny m
ainl
y op
erat
es in
the
Clo
thte
ch
and
Prot
ech
segm
ents
of t
he te
chni
cal t
extil
es
ii) In
the
Clo
thte
ch s
egm
ent,
the
com
pany
is o
ne
of th
e la
rges
t man
ufac
ture
rs o
f f
usib
le
inte
rlini
ng in
Indi
a; th
e de
man
d of
whi
ch is
m
ajor
ly g
over
ned
by th
e de
man
d fo
r re
ady-
mad
e ga
rmen
ts
iii) C
RIS
IL R
esea
rch
expe
cts
the
dem
and
for
read
y-m
ade
garm
ents
to g
row
at a
rat
e of
~7
.4%
CA
GR
fro
m 2
009
to 2
014
driv
en b
y ris
ing
inco
me
leve
ls a
nd g
row
th in
org
anis
ed r
etai
ling
iv)
Furth
er, t
he c
ompa
ny is
dou
blin
g its
fus
ible
in
terli
ning
cap
acity
; hen
ce a
n en
hanc
ed
capa
city
at t
he ti
me
of g
row
ing
dem
and
is
expe
cted
to tr
ansl
ate
into
a h
ealth
y gr
owth
po
tent
ial i
n th
is s
egm
ent
v)
A h
ealth
y de
man
d in
the
Prot
ech
segm
ent i
s ex
pect
ed o
n th
e ba
ck o
f in
crea
se in
gov
ernm
ent
spen
ding
on
prot
ectiv
e cl
othi
ng in
the
defe
nce
sect
or
i) Th
e U
S a
nd E
U a
re th
e la
rges
t mar
kets
fo
r hom
e te
xtile
s in
the
wor
ld, w
ith C
hina
, In
dia
and
Paki
stan
bei
ng th
e to
p th
ree
glob
al s
uppl
iers
of
hom
e te
xtile
s
ii)
Indi
a's
shar
e of
US
impo
rts
in b
edsh
eets
ha
s in
crea
sed
from
5%
in 2
000
to 2
2% in
20
08; a
nd in
terr
y to
wel
has
incr
ease
d fr
om 1
8% in
200
0 to
28%
in 2
008
iii)
Giv
en th
e pl
anne
d fiv
e-fo
ld in
crea
se in
th
e te
rry
tow
el c
apac
ity a
nd n
early
trip
ling
the
shee
ting
capa
city
cou
pled
with
in
crea
sing
out
sour
cing
fro
m lo
w-c
ost
prod
ucin
g na
tions
like
Indi
a, w
e be
lieve
th
at th
e co
mpa
ny h
as a
sig
nific
ant g
row
th
pote
ntia
l in
this
seg
men
t
The
com
pany
is a
lread
y op
erat
ing
at m
ore
than
opt
imum
util
izat
ion
rate
s in
this
se
gmen
t for
the
last
thre
e ye
ars.
In th
e ab
senc
e of
any
cap
acity
exp
ansi
on, t
he
grow
th in
this
seg
men
t is
expe
cted
to b
e m
uted
.
i) Th
e co
mpa
ny s
tarte
d its
ga
rmen
ting
busi
ness
in th
e se
cond
ha
lf of
200
8 in
its
Noi
da a
nd
Roo
rkee
pla
nt. H
owev
er, d
ue to
ce
rtai
n op
erat
iona
l rea
sons
, it h
ad
to c
lose
dow
n its
Noi
da u
nit i
n 20
09 a
nd s
ince
then
the
entir
e ga
rmen
ting
busi
ness
is c
arrie
d on
fr
om th
e R
oork
ee p
lant
itse
lf. T
he
prod
uctio
n pr
oces
s to
ok ti
me
to
stab
ilise
and
henc
e th
e ut
ilisat
ion
rate
s fo
r th
e la
st tw
o ye
ars
have
be
en v
ery
low
ii) A
s th
e pr
oces
ses
in th
e R
oork
ee
plan
t are
now
sta
bilis
ed, w
e be
lieve
that
the
com
pany
's
utilis
atio
n ra
tes
will
grad
ually
in
crea
se to
~75
% in
Jun
e 20
12
back
ed b
y he
alth
y gr
owth
ex
pect
ed in
the
read
y-m
ade
garm
ents
sec
tor
Re
alis
atio
n co
mp
aris
ion
wit
h p
ee
rs (
in F
Y10
)La
kshm
i Cot
syn:
Rs.
72.
7/sq
. m
eter
Siy
aram
(th
e m
ass
bran
d): R
s.
78/s
q. m
eter
Laks
hmi C
otsy
n: ~
Rs
106/
met
er**
A
rvin
d: ~
Rs
115/
met
er**
A
arve
e D
enim
s: ~
Rs
85/m
eter
**
KG
Den
ims:
Rs
~97/
met
er**
N.A
S
he
etin
g:
La
kshm
i Cot
syn
Rs
152/
met
er
W
elsp
un In
dia:
Rs
152/
met
er
Te
rry
To
wel
:**
La
kshm
i Cot
syn
Rs
253/
kg
W
elsp
un In
dia:
Rs
257/
kg
Abh
ishe
k In
dust
ries:
Rs
255/
kg
N.A
N.
A
Te
xtile
s
*
incl
udes
oth
er te
chni
cal t
extil
e va
riant
s as
wel
l **
FY0
9 fig
ures
#
Clo
thte
ch s
egm
ent c
ompr
ises
pro
duct
s su
ch a
s in
terli
ning
s, s
hoe
lace
s, v
elcr
o, u
mbr
ella
clo
th, s
ewin
g th
read
s, e
tc.
# Pr
otec
h se
gmen
t com
pris
es p
rodu
cts
such
as
ballis
tic p
rote
ctiv
e cl
othi
ng, f
ire re
tard
ant a
ppar
els,
hig
h al
titud
e cl
othi
ng, e
tc.
NA:
Not
Ava
ilabl
e/N
ot C
ompa
rabl
e So
urce
: CR
ISIL
Equ
ities
, Min
istr
y of
Tex
tiles
, Tex
tile
Surv
ey C
omm
ittee
200
9
CRISIL Equities
Shri Lakshmi Cotsyn Limited
6
Value-added products to further dominate product mix
Initially, the shirting/suiting segment dominated the company’s revenues. However, with the commencement of technical textile production in 2007, revenues are
dominated by higher value-added products. Lakshmi Cotsyn earned ~55% of revenues
from value-added products (garments, home-furnishing and technical textiles) in 2009-10. With the improvement in utilisation rates and capacity additions in these segments,
their combined revenue share is expected to increase to ~70% in 2011-12. Thus, the
value-added products are further expected to dominate the product mix going forward, which will help improve the company’s margins.
Not present throughout the value chain Compared to its peers operating in multi-product segments, Lakshmi Cotsyn is not entirely backward integrated. It does not manufacture all the required cotton yarn, the
major raw material; hence any increase in cotton yarn prices can put a strain on the
company’s operating margins. It also does not have an established exclusive retail network to enable higher brand visibility, for e.g. Alok Industries houses its brands in its
exclusive retail outlet, ‘H&A’, present across India, which gives it a larger reach and
higher visibility for its brands. The company has opted for distribution through multi-brand outlets since it entails a lower capital expenditure than establishing an exclusive
brand outlet.
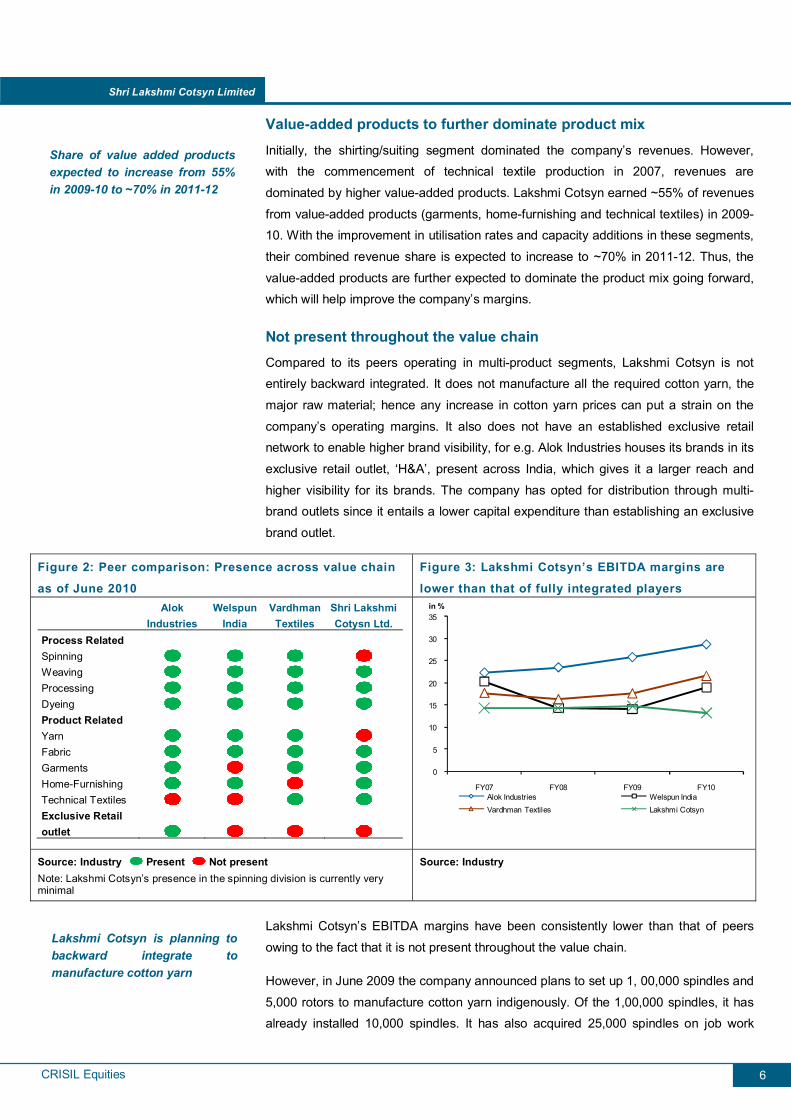
Figure 2: Peer comparison: Presence across value chain
as of June 2010
Figure 3: Lakshmi Cotsyn’s EBITDA margins are
lower than that of fully integrated players
Alok
Industries Welspun
India Vardhman
Textiles Shri Lakshmi Cotysn Ltd.
Process Related Spinning
Weaving
Processing
Dyeing
Product Related Yarn
Fabric
Garments
Home-Furnishing
Technical Textiles
Exclusive Retail outlet
0
5
10
15
20
25
30
35
FY07 FY08 FY09 FY10
in %
Alok Industries Welspun IndiaVardhman Textiles Lakshmi Cotsyn
Source: Industry Present Not present Note: Lakshmi Cotsyn’s presence in the spinning division is currently very minimal
Source: Industry
Lakshmi Cotsyn’s EBITDA margins have been consistently lower than that of peers
owing to the fact that it is not present throughout the value chain.
However, in June 2009 the company announced plans to set up 1, 00,000 spindles and
5,000 rotors to manufacture cotton yarn indigenously. Of the 1,00,000 spindles, it has already installed 10,000 spindles. It has also acquired 25,000 spindles on job work
Share of value added products expected to increase from 55% in 2009-10 to ~70% in 2011-12
Lakshmi Cotsyn is planning to backward integrate to manufacture cotton yarn
CRISIL Equities
Shri Lakshmi Cotsyn Limited
7
from the U.P. State Co-operative Federation in the latter half of 2009. These met ~20%
of its cotton yarn requirements. The rest is purchased from outside sources. The
management has indicated that the backward integration project is expected to be commissioned by the end of December 2011. Once commissioned, the company’s
margins are expected to improve due to savings in raw material costs resulting from in-
house manufacturing of cotton yarn instead of purchasing it externally.
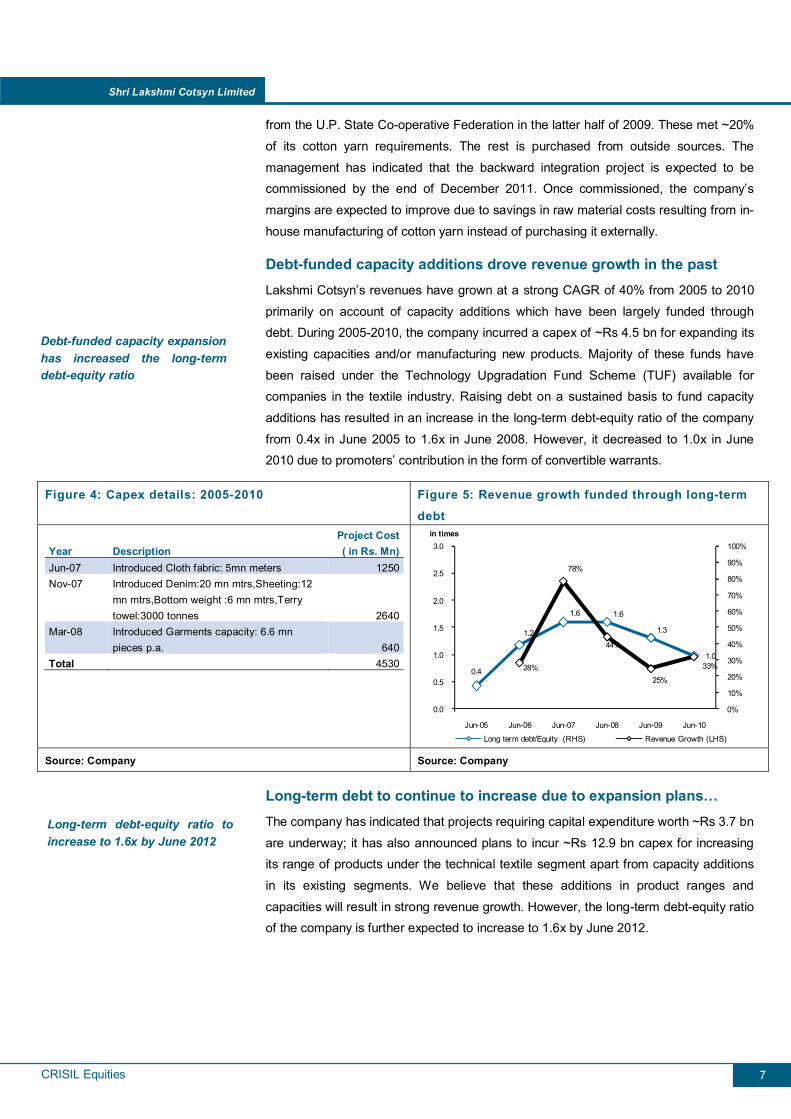
Debt-funded capacity additions drove revenue growth in the past Lakshmi Cotsyn’s revenues have grown at a strong CAGR of 40% from 2005 to 2010
primarily on account of capacity additions which have been largely funded through debt. During 2005-2010, the company incurred a capex of ~Rs 4.5 bn for expanding its
existing capacities and/or manufacturing new products. Majority of these funds have
been raised under the Technology Upgradation Fund Scheme (TUF) available for companies in the textile industry. Raising debt on a sustained basis to fund capacity
additions has resulted in an increase in the long-term debt-equity ratio of the company
from 0.4x in June 2005 to 1.6x in June 2008. However, it decreased to 1.0x in June 2010 due to promoters’ contribution in the form of convertible warrants.
Figure 4: Capex details: 2005-2010 Figure 5: Revenue growth funded through long-term
debt
Year Description Project Cost( in Rs. Mn)
Jun-07 Introduced Cloth fabric: 5mn meters 1250Nov-07 Introduced Denim:20 mn mtrs,Sheeting:12
mn mtrs,Bottom weight :6 mn mtrs,Terry towel:3000 tonnes 2640
Mar-08 Introduced Garments capacity: 6.6 mn pieces p.a. 640
Total 4530 0.4
1.2
1.6 1.6
1.3
1.028%
78%
44%
25%
33%
0%
10%
20%
30%
40%
50%
60%
70%
80%
90%
100%
0.0
0.5
1.0
1.5
2.0
2.5
3.0
Jun-05 Jun-06 Jun-07 Jun-08 Jun-09 Jun-10
in times
Long term debt/Equity (RHS) Revenue Growth (LHS)
Source: Company Source: Company
Long-term debt to continue to increase due to expansion plans… The company has indicated that projects requiring capital expenditure worth ~Rs 3.7 bn
are underway; it has also announced plans to incur ~Rs 12.9 bn capex for increasing its range of products under the technical textile segment apart from capacity additions
in its existing segments. We believe that these additions in product ranges and
capacities will result in strong revenue growth. However, the long-term debt-equity ratio of the company is further expected to increase to 1.6x by June 2012.
Debt-funded capacity expansion has increased the long-term debt-equity ratio
Long-term debt-equity ratio to increase to 1.6x by June 2012
CRISIL Equities
Shri Lakshmi Cotsyn Limited
8
Figure 6: Capex details: 2010 onwards Figure 7: Revenue growth will continue to be funded
through long-term debt Expected Commissioning Description
Project cost( in Rs Mn)
Nov-10 Terry towel capacity expansion from 3,000 tpa to 15,000 tpa 3778*
Dec-11 Capacity expansion in the denim, technical textile and sheeting segment 9920
Dec-11 Backward integration: Setting up 1,00,000 spindles and 5,000 rotors 3000
Total 16,698*It also includes the cost of setting up a 16MW captive power plant
1.01.3
1.6
32%27%
31%
0%
10%
20%
30%
40%
50%
60%
70%
80%
90%
100%
0.0
0.5
1.0
1.5
2.0
2.5
3.0
Jun-10 Jun-11E Jun-12E
in times
Long term debt/Equity (RHS) Revenue Growth (LHS)
Source: Company Source: CRISIL Equities estimates
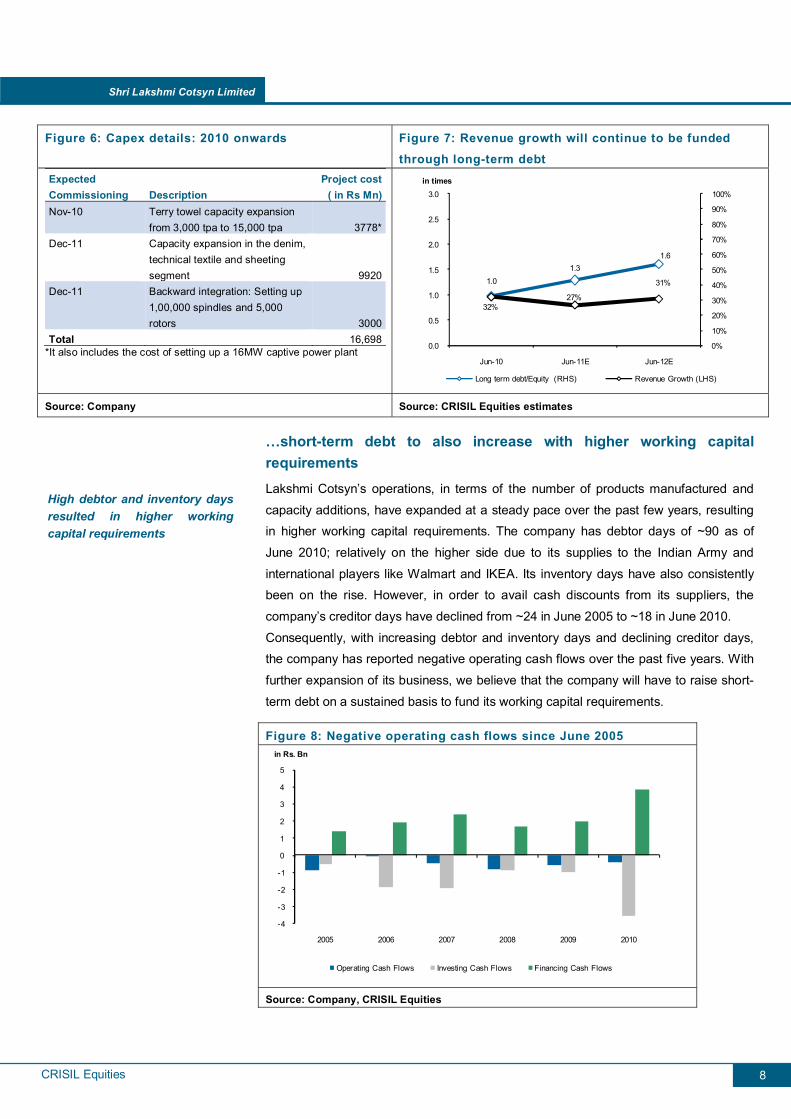
…short-term debt to also increase with higher working capital requirements Lakshmi Cotsyn’s operations, in terms of the number of products manufactured and
capacity additions, have expanded at a steady pace over the past few years, resulting in higher working capital requirements. The company has debtor days of ~90 as of
June 2010; relatively on the higher side due to its supplies to the Indian Army and
international players like Walmart and IKEA. Its inventory days have also consistently been on the rise. However, in order to avail cash discounts from its suppliers, the
company’s creditor days have declined from ~24 in June 2005 to ~18 in June 2010.
Consequently, with increasing debtor and inventory days and declining creditor days, the company has reported negative operating cash flows over the past five years. With
further expansion of its business, we believe that the company will have to raise short-
term debt on a sustained basis to fund its working capital requirements.
Figure 8: Negative operating cash flows since June 2005
-4
-3
-2
-1
0
1
2
3
4
5
2005 2006 2007 2008 2009 2010
in Rs. Bn
Operating Cash Flows Investing Cash Flows Financing Cash Flows
Source: Company, CRISIL Equities
High debtor and inventory days resulted in higher working capital requirements
CRISIL Equities
Shri Lakshmi Cotsyn Limited
9
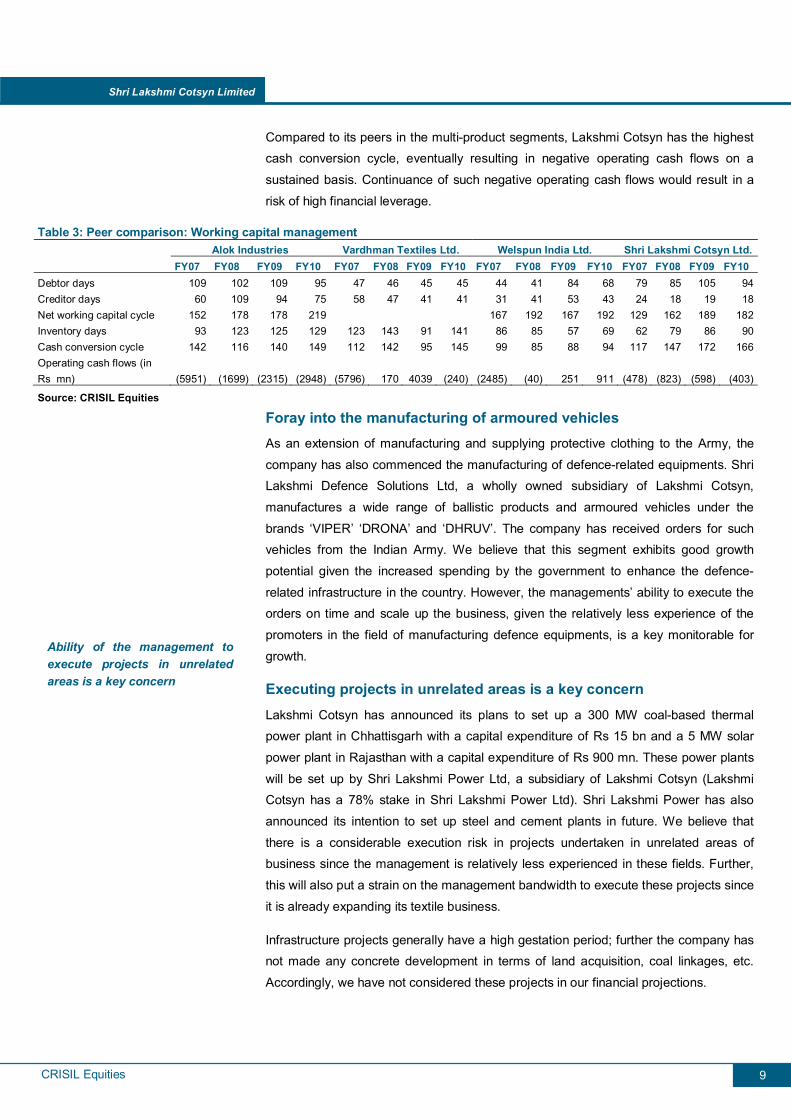
Compared to its peers in the multi-product segments, Lakshmi Cotsyn has the highest cash conversion cycle, eventually resulting in negative operating cash flows on a
sustained basis. Continuance of such negative operating cash flows would result in a
risk of high financial leverage. Table 3: Peer comparison: Working capital management Alok Industries Vardhman Textiles Ltd. Welspun India Ltd. Shri Lakshmi Cotsyn Ltd. FY07 FY08 FY09 FY10 FY07 FY08 FY09 FY10 FY07 FY08 FY09 FY10 FY07 FY08 FY09 FY10 Debtor days 109 102 109 95 47 46 45 45 44 41 84 68 79 85 105 94Creditor days 60 109 94 75 58 47 41 41 31 41 53 43 24 18 19 18Net working capital cycle 152 178 178 219 167 192 167 192 129 162 189 182Inventory days 93 123 125 129 123 143 91 141 86 85 57 69 62 79 86 90Cash conversion cycle 142 116 140 149 112 142 95 145 99 85 88 94 117 147 172 166Operating cash flows (in Rs mn) (5951) (1699) (2315) (2948) (5796) 170 4039 (240) (2485) (40) 251 911 (478) (823) (598) (403)
Source: CRISIL Equities Foray into the manufacturing of armoured vehicles As an extension of manufacturing and supplying protective clothing to the Army, the
company has also commenced the manufacturing of defence-related equipments. Shri Lakshmi Defence Solutions Ltd, a wholly owned subsidiary of Lakshmi Cotsyn,
manufactures a wide range of ballistic products and armoured vehicles under the
brands ‘VIPER’ ‘DRONA’ and ‘DHRUV’. The company has received orders for such vehicles from the Indian Army. We believe that this segment exhibits good growth
potential given the increased spending by the government to enhance the defence-
related infrastructure in the country. However, the managements’ ability to execute the orders on time and scale up the business, given the relatively less experience of the
promoters in the field of manufacturing defence equipments, is a key monitorable for
growth.
Executing projects in unrelated areas is a key concern Lakshmi Cotsyn has announced its plans to set up a 300 MW coal-based thermal power plant in Chhattisgarh with a capital expenditure of Rs 15 bn and a 5 MW solar
power plant in Rajasthan with a capital expenditure of Rs 900 mn. These power plants
will be set up by Shri Lakshmi Power Ltd, a subsidiary of Lakshmi Cotsyn (Lakshmi Cotsyn has a 78% stake in Shri Lakshmi Power Ltd). Shri Lakshmi Power has also
announced its intention to set up steel and cement plants in future. We believe that
there is a considerable execution risk in projects undertaken in unrelated areas of business since the management is relatively less experienced in these fields. Further,
this will also put a strain on the management bandwidth to execute these projects since
it is already expanding its textile business.
Infrastructure projects generally have a high gestation period; further the company has not made any concrete development in terms of land acquisition, coal linkages, etc.
Accordingly, we have not considered these projects in our financial projections.
Ability of the management to execute projects in unrelated areas is a key concern
CRISIL Equities
Shri Lakshmi Cotsyn Limited
10
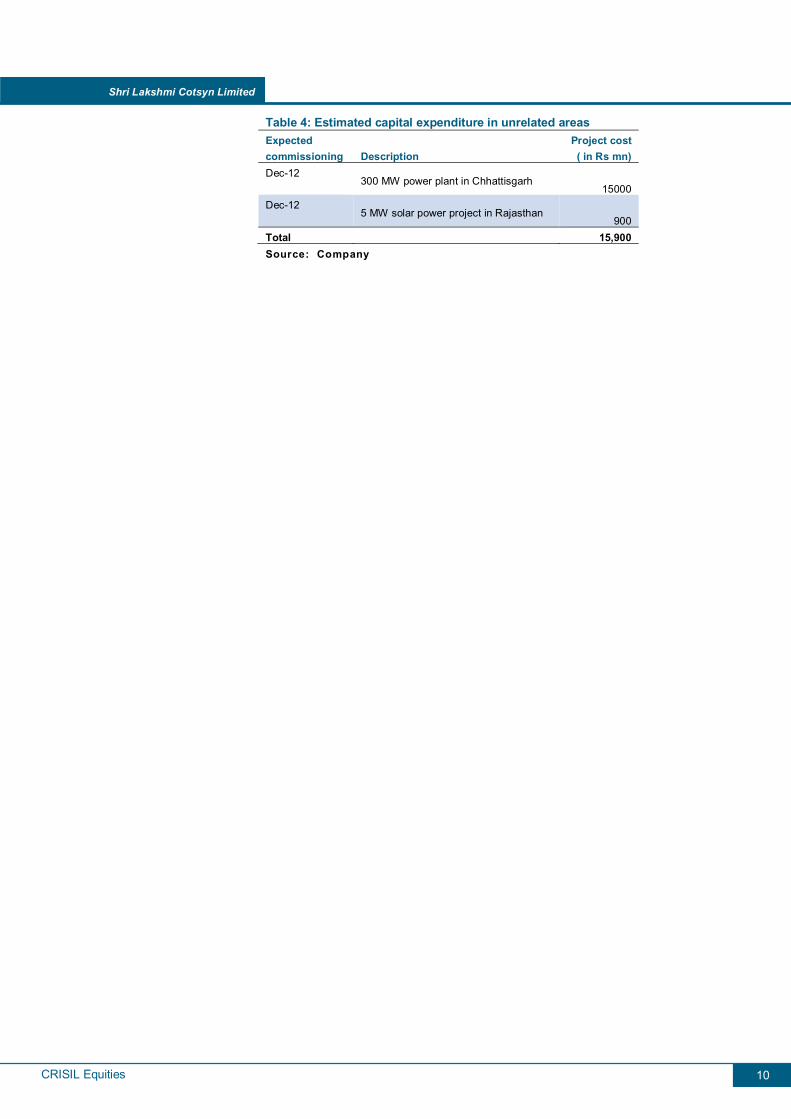
Table 4: Estimated capital expenditure in unrelated areas Expected commissioning Description
Project cost ( in Rs mn)
Dec-12 300 MW power plant in Chhattisgarh
15000 Dec-12
5 MW solar power project in Rajasthan 900
Total 15,900 Source: Company
CRISIL Equities
Shri Lakshmi Cotsyn Limited
11
Key risks
Project execution risk in related and unrelated areas
The company has announced various capacity additions in the textile segment. It also has plans to venture into unrelated areas such as power, cement and steel. The
company is estimated to incur ~Rs 16.6 bn to fund the capacity additions in the textile
business and ~Rs 15.9 bn to fund the infrastructure-related projects in the medium term (excluding the funding for cement and steel businesses). We believe that it faces
a moderate execution risk in the textile-related projects since it has successfully
implemented such product introductions/additions in the past, albeit with a few delays (ranging from three months to a year). However, it faces a considerable execution risk
in its infrastructure-related projects due to the relatively less experience of the
promoters in managing such businesses.
Intense competition in the textile industry The company faces intense competition from various established and integrated players like Vardhman Textiles, and Alok Industries, as well as from a large number of
unorganised players.
Volatile raw material prices The company’s EBITDA margins are susceptible to volatile raw material prices, which
form ~90% of the total operating costs. The company is not entirely backward
integrated and procures majority of cotton yarn, its major raw material, from external sources. Given the company’s limited pricing flexibility due to its relatively small size
and the intensifying competition in the textile industry, any increase in the prices of
cotton could strain the company’s EBITDA margins.
Execution risks, increasing competition, volatility in raw material costs are the key risks
CRISIL Equities
Shri Lakshmi Cotsyn Limited
12
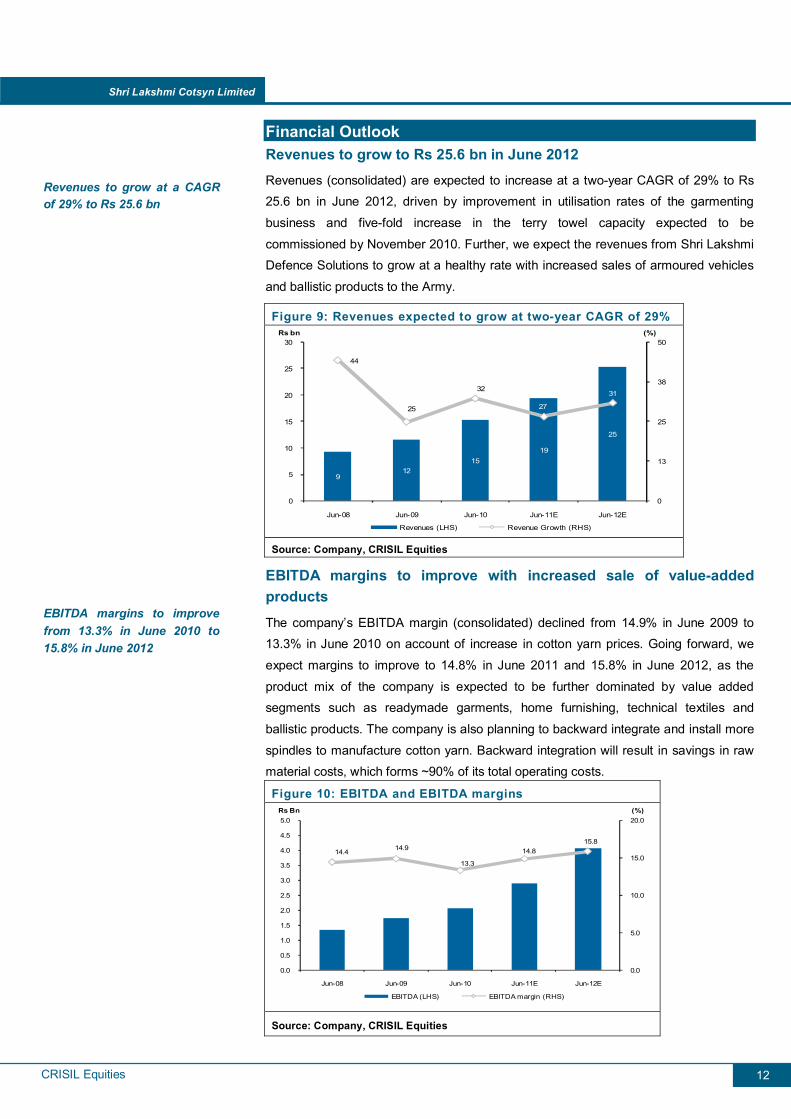
Financial Outlook Revenues to grow to Rs 25.6 bn in June 2012 Revenues (consolidated) are expected to increase at a two-year CAGR of 29% to Rs 25.6 bn in June 2012, driven by improvement in utilisation rates of the garmenting
business and five-fold increase in the terry towel capacity expected to be
commissioned by November 2010. Further, we expect the revenues from Shri Lakshmi Defence Solutions to grow at a healthy rate with increased sales of armoured vehicles
and ballistic products to the Army.
Figure 9: Revenues expected to grow at two-year CAGR of 29%
912
1519
25
44
25
32
27
31
0
13
25
38
50
0
5
10
15
20
25
30
Jun-08 Jun-09 Jun-10 Jun-11E Jun-12E
(%)Rs bn
Revenues (LHS) Revenue Growth (RHS)
Source: Company, CRISIL Equities
EBITDA margins to improve with increased sale of value-added products
The company’s EBITDA margin (consolidated) declined from 14.9% in June 2009 to 13.3% in June 2010 on account of increase in cotton yarn prices. Going forward, we
expect margins to improve to 14.8% in June 2011 and 15.8% in June 2012, as the
product mix of the company is expected to be further dominated by value added segments such as readymade garments, home furnishing, technical textiles and
ballistic products. The company is also planning to backward integrate and install more
spindles to manufacture cotton yarn. Backward integration will result in savings in raw material costs, which forms ~90% of its total operating costs.
Figure 10: EBITDA and EBITDA margins
14.4 14.9
13.3
14.815.8
0.0
5.0
10.0
15.0
20.0
0.0
0.5
1.0
1.5
2.0
2.5
3.0
3.5
4.0
4.5
5.0
Jun-08 Jun-09 Jun-10 Jun-11E Jun-12E
(%)Rs Bn
EBITDA (LHS) EBITDA margin (RHS)
Source: Company, CRISIL Equities
Revenues to grow at a CAGR of 29% to Rs 25.6 bn
EBITDA margins to improve from 13.3% in June 2010 to 15.8% in June 2012
CRISIL Equities
Shri Lakshmi Cotsyn Limited
13
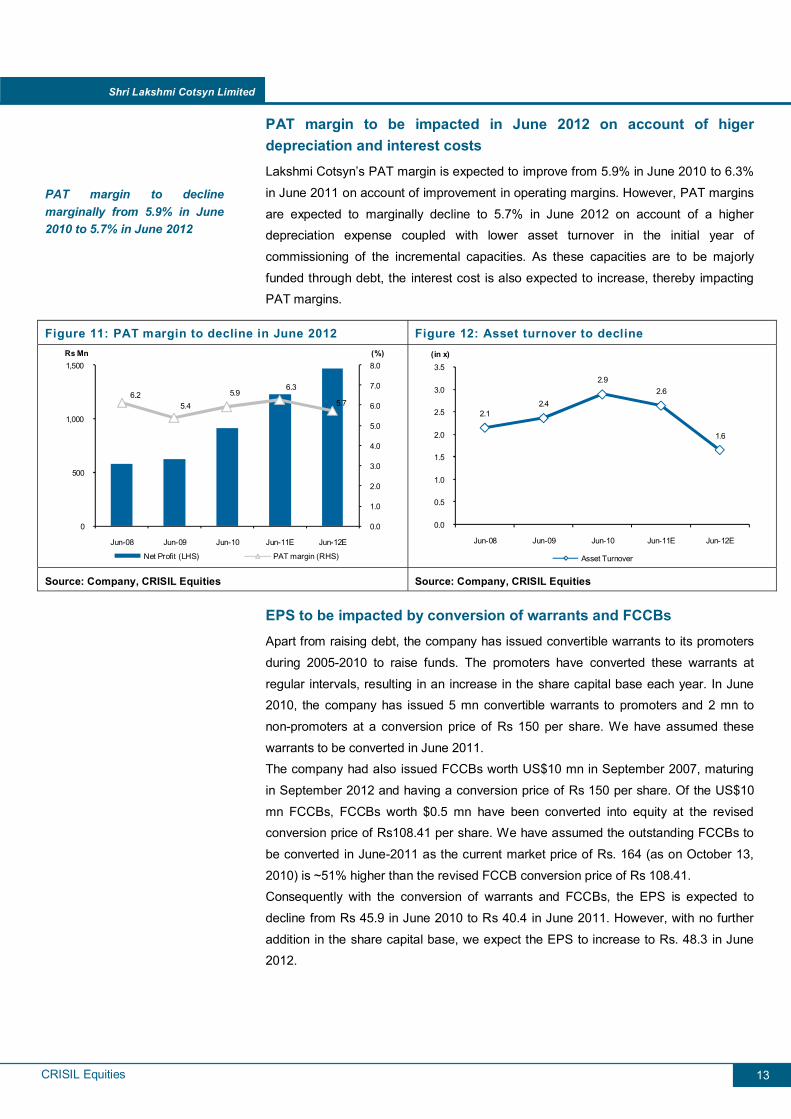
PAT margin to be impacted in June 2012 on account of higer depreciation and interest costs Lakshmi Cotsyn’s PAT margin is expected to improve from 5.9% in June 2010 to 6.3%
in June 2011 on account of improvement in operating margins. However, PAT margins
are expected to marginally decline to 5.7% in June 2012 on account of a higher depreciation expense coupled with lower asset turnover in the initial year of
commissioning of the incremental capacities. As these capacities are to be majorly
funded through debt, the interest cost is also expected to increase, thereby impacting PAT margins.
Figure 11: PAT margin to decline in June 2012 Figure 12: Asset turnover to decline
6.25.4
5.96.3
5.7
0.0
1.0
2.0
3.0
4.0
5.0
6.0
7.0
8.0
0
500
1,000
1,500
Jun-08 Jun-09 Jun-10 Jun-11E Jun-12E
(%)Rs Mn
Net Profit (LHS) PAT margin (RHS)
2.12.4
2.92.6
1.6
0.0
0.5
1.0
1.5
2.0
2.5
3.0
3.5
Jun-08 Jun-09 Jun-10 Jun-11E Jun-12E
(in x)
Asset Turnover
Source: Company, CRISIL Equities Source: Company, CRISIL Equities
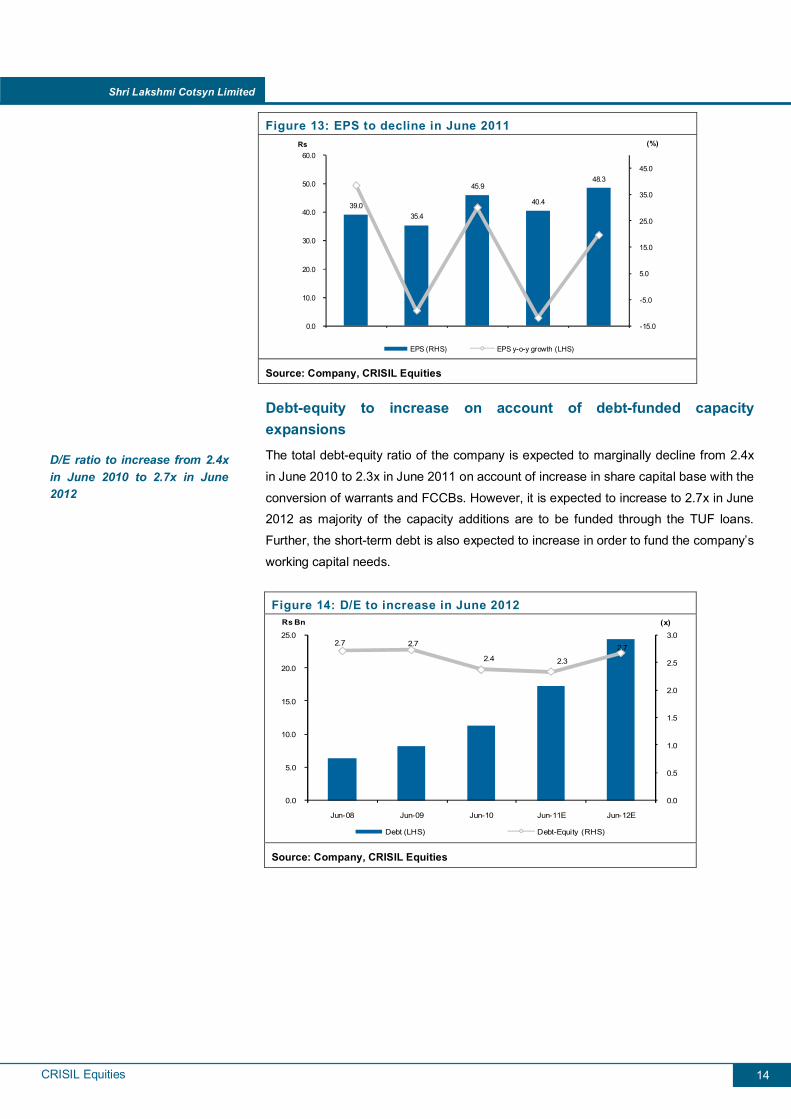
EPS to be impacted by conversion of warrants and FCCBs Apart from raising debt, the company has issued convertible warrants to its promoters
during 2005-2010 to raise funds. The promoters have converted these warrants at
regular intervals, resulting in an increase in the share capital base each year. In June 2010, the company has issued 5 mn convertible warrants to promoters and 2 mn to
non-promoters at a conversion price of Rs 150 per share. We have assumed these
warrants to be converted in June 2011. The company had also issued FCCBs worth US$10 mn in September 2007, maturing
in September 2012 and having a conversion price of Rs 150 per share. Of the US$10
mn FCCBs, FCCBs worth $0.5 mn have been converted into equity at the revised conversion price of Rs108.41 per share. We have assumed the outstanding FCCBs to
be converted in June-2011 as the current market price of Rs. 164 (as on October 13,
2010) is ~51% higher than the revised FCCB conversion price of Rs 108.41. Consequently with the conversion of warrants and FCCBs, the EPS is expected to
decline from Rs 45.9 in June 2010 to Rs 40.4 in June 2011. However, with no further
addition in the share capital base, we expect the EPS to increase to Rs. 48.3 in June 2012.
PAT margin to decline marginally from 5.9% in June 2010 to 5.7% in June 2012
CRISIL Equities
Shri Lakshmi Cotsyn Limited
14
Figure 13: EPS to decline in June 2011
39.035.4
45.9
40.4
48.3
-15.0
-5.0
5.0
15.0
25.0
35.0
45.0
0.0
10.0
20.0
30.0
40.0
50.0
60.0(%)Rs
EPS (RHS) EPS y-o-y growth (LHS)
Source: Company, CRISIL Equities
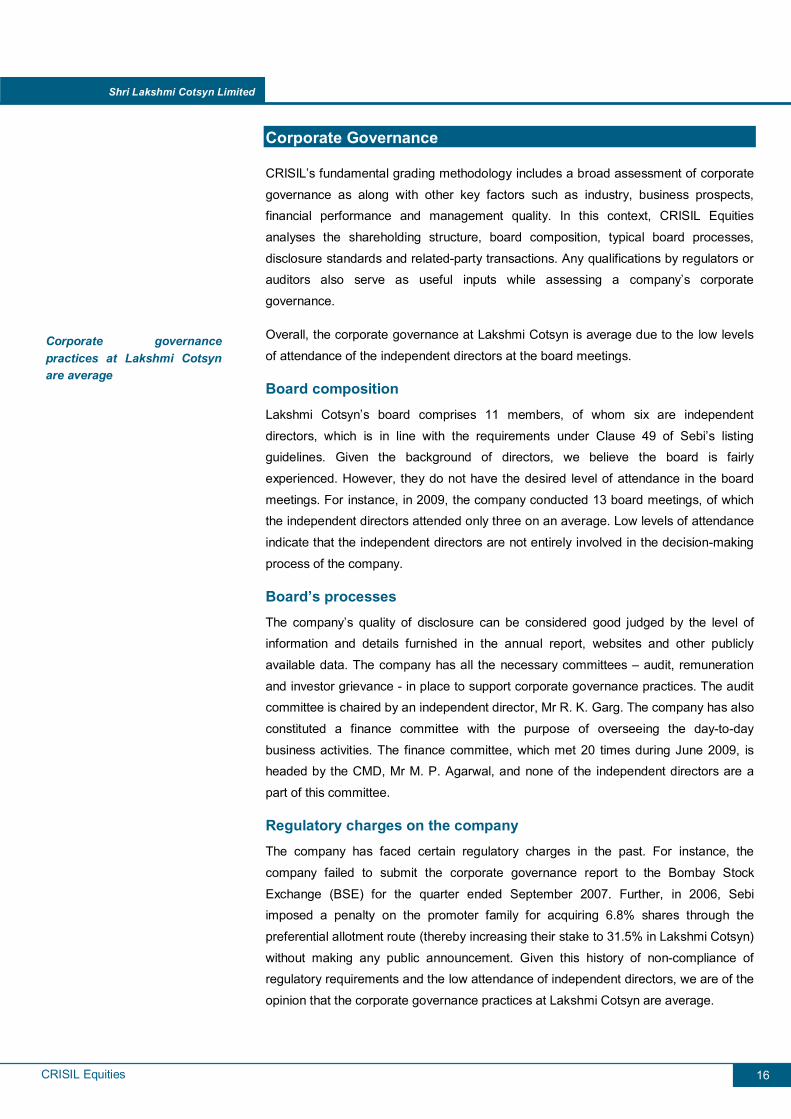
Debt-equity to increase on account of debt-funded capacity expansions The total debt-equity ratio of the company is expected to marginally decline from 2.4x
in June 2010 to 2.3x in June 2011 on account of increase in share capital base with the
conversion of warrants and FCCBs. However, it is expected to increase to 2.7x in June 2012 as majority of the capacity additions are to be funded through the TUF loans.
Further, the short-term debt is also expected to increase in order to fund the company’s
working capital needs.
Figure 14: D/E to increase in June 2012
2.7 2.7
2.4 2.3
2.7
0.0
0.5
1.0
1.5
2.0
2.5
3.0
0.0
5.0
10.0
15.0
20.0
25.0
Jun-08 Jun-09 Jun-10 Jun-11E Jun-12E
(x)Rs Bn
Debt (LHS) Debt-Equity (RHS)
Source: Company, CRISIL Equities
D/E ratio to increase from 2.4x in June 2010 to 2.7x in June 2012
CRISIL Equities
Shri Lakshmi Cotsyn Limited
15
Management Overview CRISIL's fundamental grading methodology includes a broad assessment of management quality, apart from other key factors such as industry and business
prospects, and financial performance.
Experienced but ambitious management Lakshmi Cotsyn has an experienced management headed by Mr M. P. Agarwal,
chairman and managing director, who has more than three decades of experience in
the textile industry. Mr Pawan Agarwal, Mr. M. P. Agarwal’s son, is the joint managing director. He has been looking after the company’s production, quality control and
marketing operations for the past 18 years.
The management is reasonably experienced and well versed with the dynamics of the
textile industry. However, it has ambitious plans of setting up a thermal coal based power and solar power plants, cement and steel plants through its subsidiary Shri
Lakshmi Power Ltd in the medium term. All these projects are in the initial stage of
registration with the concerned state government. Hence, we believe that without any concrete development in terms of land acquisitions (the company is in the process of
acquiring land), coal linkages, etc., the management’s target of completing these
projects in the next two-three years is ambitious.
Management’s strategy of diversifying into unrelated areas a concern The businesses in the infrastructure space do not add any synergies to the existing textile business and their execution remains a risk given the promoters’ relatively less
experience in these areas.
Largely a family-driven firm Based on our interactions and assesment, we believe that the company has a
reasonably good second line of management. The company is highly dependent on the
promoters for all important strategic decisions. We believe that the top management posts are likely to remain with the family members since Lakshmi Cotsyn is
fundamentally a promoter-driven company.
Management’s plans in the infrastructure space are ambitious
CRISIL Equities
Shri Lakshmi Cotsyn Limited
16
Corporate Governance
CRISIL’s fundamental grading methodology includes a broad assessment of corporate
governance as along with other key factors such as industry, business prospects, financial performance and management quality. In this context, CRISIL Equities
analyses the shareholding structure, board composition, typical board processes,
disclosure standards and related-party transactions. Any qualifications by regulators or auditors also serve as useful inputs while assessing a company’s corporate
governance.
Overall, the corporate governance at Lakshmi Cotsyn is average due to the low levels
of attendance of the independent directors at the board meetings.
Board composition Lakshmi Cotsyn’s board comprises 11 members, of whom six are independent
directors, which is in line with the requirements under Clause 49 of Sebi’s listing guidelines. Given the background of directors, we believe the board is fairly
experienced. However, they do not have the desired level of attendance in the board
meetings. For instance, in 2009, the company conducted 13 board meetings, of which the independent directors attended only three on an average. Low levels of attendance
indicate that the independent directors are not entirely involved in the decision-making
process of the company.
Board’s processes The company’s quality of disclosure can be considered good judged by the level of information and details furnished in the annual report, websites and other publicly
available data. The company has all the necessary committees – audit, remuneration
and investor grievance - in place to support corporate governance practices. The audit committee is chaired by an independent director, Mr R. K. Garg. The company has also
constituted a finance committee with the purpose of overseeing the day-to-day
business activities. The finance committee, which met 20 times during June 2009, is headed by the CMD, Mr M. P. Agarwal, and none of the independent directors are a
part of this committee.
Regulatory charges on the company The company has faced certain regulatory charges in the past. For instance, the
company failed to submit the corporate governance report to the Bombay Stock
Exchange (BSE) for the quarter ended September 2007. Further, in 2006, Sebi imposed a penalty on the promoter family for acquiring 6.8% shares through the
preferential allotment route (thereby increasing their stake to 31.5% in Lakshmi Cotsyn)
without making any public announcement. Given this history of non-compliance of regulatory requirements and the low attendance of independent directors, we are of the
opinion that the corporate governance practices at Lakshmi Cotsyn are average.
Corporate governance practices at Lakshmi Cotsyn are average
CRISIL Equities
Shri Lakshmi Cotsyn Limited
17
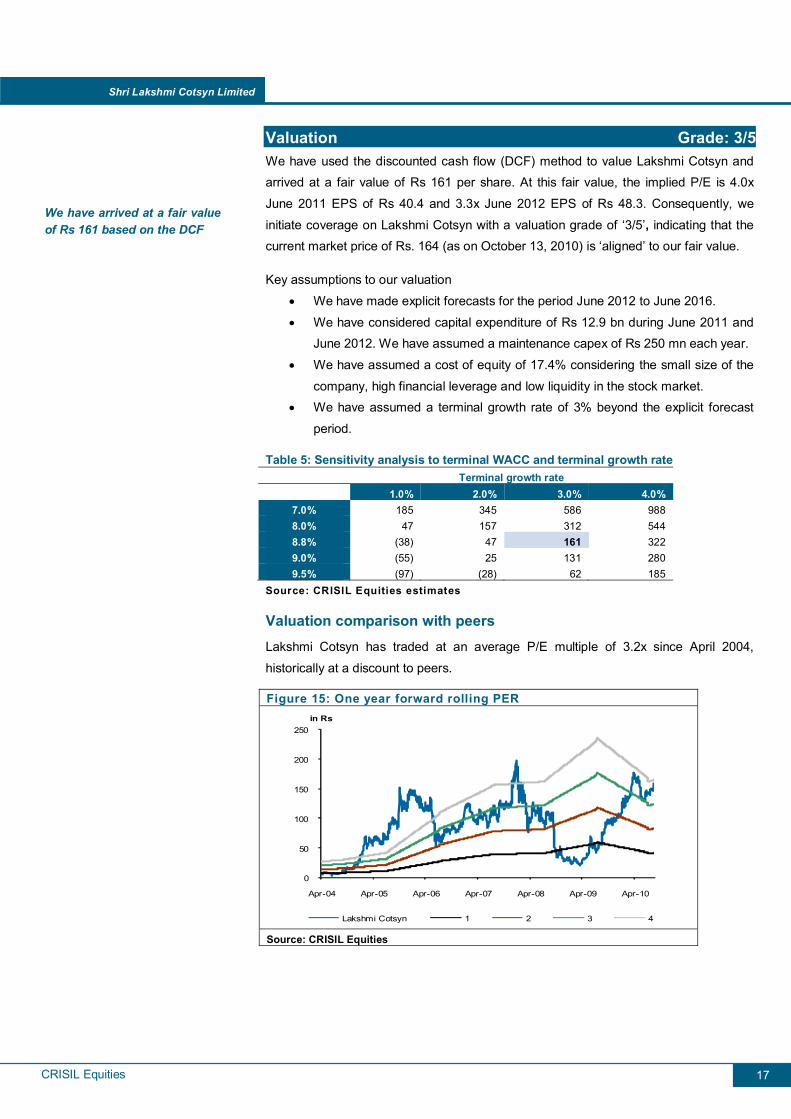
Valuation Grade: 3/5 We have used the discounted cash flow (DCF) method to value Lakshmi Cotsyn and arrived at a fair value of Rs 161 per share. At this fair value, the implied P/E is 4.0x
June 2011 EPS of Rs 40.4 and 3.3x June 2012 EPS of Rs 48.3. Consequently, we
initiate coverage on Lakshmi Cotsyn with a valuation grade of ‘3/5’, indicating that the current market price of Rs. 164 (as on October 13, 2010) is ‘aligned’ to our fair value.
Key assumptions to our valuation
• We have made explicit forecasts for the period June 2012 to June 2016.
• We have considered capital expenditure of Rs 12.9 bn during June 2011 and June 2012. We have assumed a maintenance capex of Rs 250 mn each year.
• We have assumed a cost of equity of 17.4% considering the small size of the
company, high financial leverage and low liquidity in the stock market. • We have assumed a terminal growth rate of 3% beyond the explicit forecast
period.
Table 5: Sensitivity analysis to terminal WACC and terminal growth rate Terminal growth rate
1.0% 2.0% 3.0% 4.0% 7.0% 185 345 586 988 8.0% 47 157 312 544 8.8% (38) 47 161 322 9.0% (55) 25 131 280 9.5% (97) (28) 62 185
Source: CRISIL Equities estimates
Valuation comparison with peers Lakshmi Cotsyn has traded at an average P/E multiple of 3.2x since April 2004,
historically at a discount to peers.
Figure 15: One year forward rolling PER
0
50
100
150
200
250
Apr-04 Apr-05 Apr-06 Apr-07 Apr-08 Apr-09 Apr-10
in Rs
Lakshmi Cotsyn 1 2 3 4
Source: CRISIL Equities
We have arrived at a fair value of Rs 161 based on the DCF
CRISIL Equities
Shri Lakshmi Cotsyn Limited
18
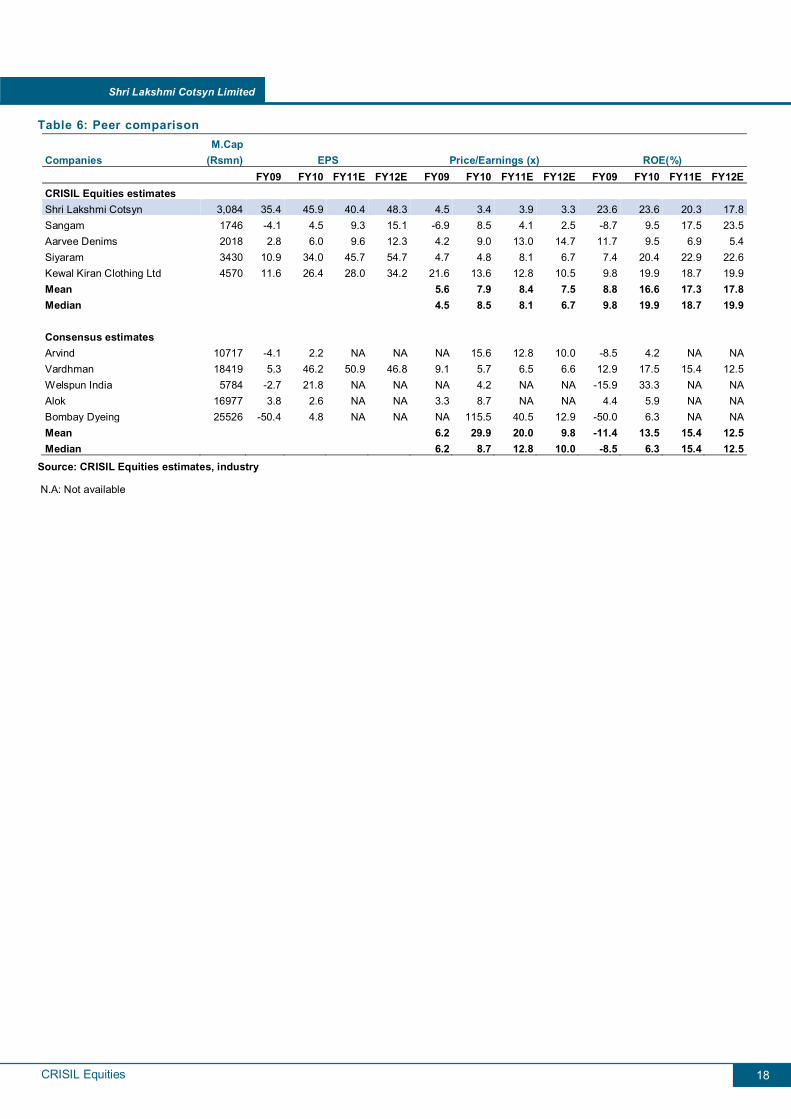
Table 6: Peer comparison
Companies M.Cap
(Rsmn) EPS Price/Earnings (x) ROE(%) FY09 FY10 FY11E FY12E FY09 FY10 FY11E FY12E FY09 FY10 FY11E FY12E
CRISIL Equities estimates Shri Lakshmi Cotsyn 3,084 35.4 45.9 40.4 48.3 4.5 3.4 3.9 3.3 23.6 23.6 20.3 17.8Sangam 1746 -4.1 4.5 9.3 15.1 -6.9 8.5 4.1 2.5 -8.7 9.5 17.5 23.5Aarvee Denims 2018 2.8 6.0 9.6 12.3 4.2 9.0 13.0 14.7 11.7 9.5 6.9 5.4Siyaram 3430 10.9 34.0 45.7 54.7 4.7 4.8 8.1 6.7 7.4 20.4 22.9 22.6Kewal Kiran Clothing Ltd 4570 11.6 26.4 28.0 34.2 21.6 13.6 12.8 10.5 9.8 19.9 18.7 19.9Mean 5.6 7.9 8.4 7.5 8.8 16.6 17.3 17.8Median 4.5 8.5 8.1 6.7 9.8 19.9 18.7 19.9
Consensus estimates Arvind 10717 -4.1 2.2 NA NA NA 15.6 12.8 10.0 -8.5 4.2 NA NAVardhman 18419 5.3 46.2 50.9 46.8 9.1 5.7 6.5 6.6 12.9 17.5 15.4 12.5Welspun India 5784 -2.7 21.8 NA NA NA 4.2 NA NA -15.9 33.3 NA NAAlok 16977 3.8 2.6 NA NA 3.3 8.7 NA NA 4.4 5.9 NA NABombay Dyeing 25526 -50.4 4.8 NA NA NA 115.5 40.5 12.9 -50.0 6.3 NA NAMean 6.2 29.9 20.0 9.8 -11.4 13.5 15.4 12.5Median 6.2 8.7 12.8 10.0 -8.5 6.3 15.4 12.5
Source: CRISIL Equities estimates, industry
N.A: Not available
CRISIL Equities
Shri Lakshmi Cotsyn Limited
19
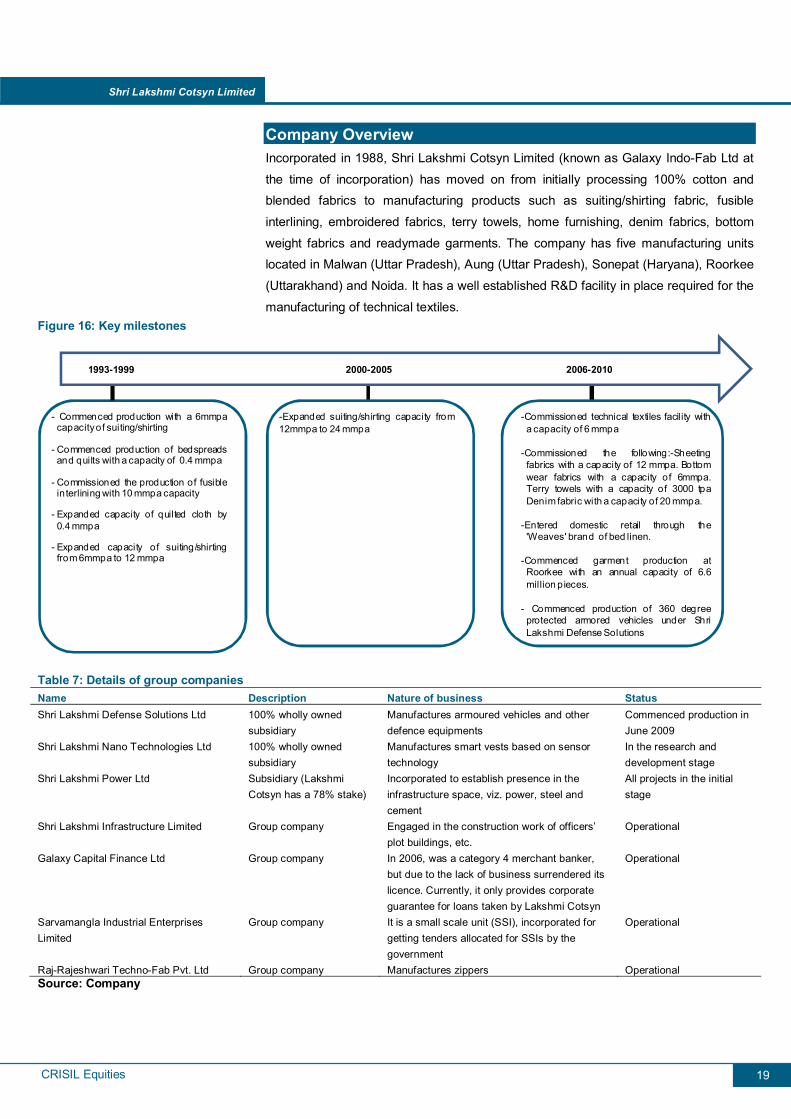
Company Overview Incorporated in 1988, Shri Lakshmi Cotsyn Limited (known as Galaxy Indo-Fab Ltd at
the time of incorporation) has moved on from initially processing 100% cotton and blended fabrics to manufacturing products such as suiting/shirting fabric, fusible
interlining, embroidered fabrics, terry towels, home furnishing, denim fabrics, bottom
weight fabrics and readymade garments. The company has five manufacturing units located in Malwan (Uttar Pradesh), Aung (Uttar Pradesh), Sonepat (Haryana), Roorkee
(Uttarakhand) and Noida. It has a well established R&D facility in place required for the
manufacturing of technical textiles. Figure 16: Key milestones
1993-1999
- Commenced production with a 6mmpacapacityof suiting/shirting
- Commenced production of bedspreadsand quilts with a capacity of 0.4 mmpa
- Commissioned the production of fusibleinterlining with 10 mmpa capacity
- Expanded capacity of quilted cloth by0.4 mmpa
- Expanded capacity of suiting/shirtingfrom 6mmpa to 12 mmpa
2000-2005
-Expanded suiting/shirting capacity from12mmpa to 24 mmpa
-Commissioned technical textiles facility witha capacity of 6 mmpa
-Commissioned the following:-Sheetingfabrics with a capacity of 12 mmpa. Bottomwear fabrics with a capacity of 6mmpa.Terry towels with a capacity of 3000 tpaDenim fabric with a capacity of 20 mmpa.
-Entered domestic retail through the'Weaves' brand of bed linen.
-Commenced garment production atRoorkee with an annual capacity of 6.6million pieces.
- Commenced production of 360 degreeprotected armored vehicles under ShriLakshmi Defense Solutions
2006-2010
Table 7: Details of group companies Name Description Nature of business Status Shri Lakshmi Defense Solutions Ltd 100% wholly owned
subsidiary Manufactures armoured vehicles and other defence equipments
Commenced production in June 2009
Shri Lakshmi Nano Technologies Ltd 100% wholly owned subsidiary
Manufactures smart vests based on sensor technology
In the research and development stage
Shri Lakshmi Power Ltd Subsidiary (Lakshmi Cotsyn has a 78% stake)
Incorporated to establish presence in the infrastructure space, viz. power, steel and cement
All projects in the initial stage
Shri Lakshmi Infrastructure Limited Group company Engaged in the construction work of officers’ plot buildings, etc.
Operational
Galaxy Capital Finance Ltd Group company In 2006, was a category 4 merchant banker, but due to the lack of business surrendered its licence. Currently, it only provides corporate guarantee for loans taken by Lakshmi Cotsyn
Operational
Sarvamangla Industrial Enterprises Limited
Group company It is a small scale unit (SSI), incorporated for getting tenders allocated for SSIs by the government
Operational
Raj-Rajeshwari Techno-Fab Pvt. Ltd Group company Manufactures zippers Operational Source: Company
CRISIL Equities
Shri Lakshmi Cotsyn Limited
20
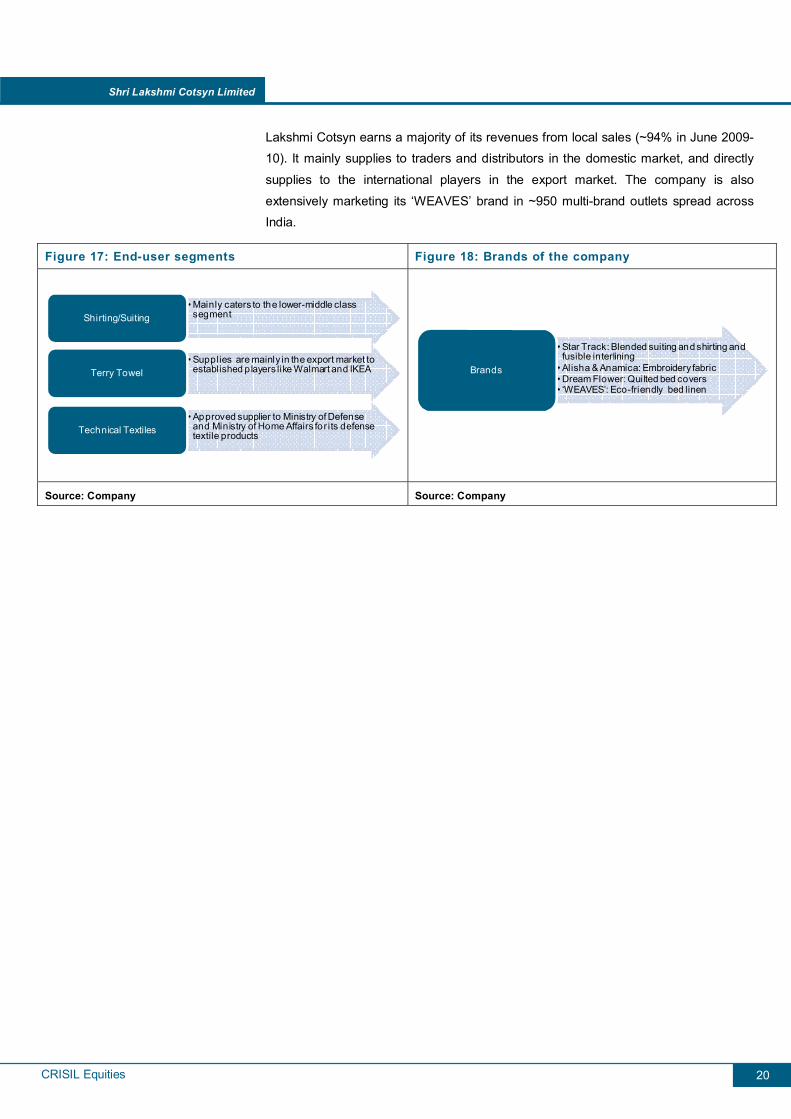
Lakshmi Cotsyn earns a majority of its revenues from local sales (~94% in June 2009-10). It mainly supplies to traders and distributors in the domestic market, and directly
supplies to the international players in the export market. The company is also
extensively marketing its ‘WEAVES’ brand in ~950 multi-brand outlets spread across India.
Figure 17: End-user segments Figure 18: Brands of the company
• Mainly caters to the lower-middle class segment Shirting/Suiting
• Supplies are mainly in the export market to established players like Walmart and IKEATerry Towel
• Approved supplier to Ministry of Defense and Ministry of Home Affairs for its defense textile products Technical Textiles
• Star Track: Blended suiting and shirting and fusible interlining
• Alisha & Anamica: Embroidery fabric• Dream Flower: Quilted bed covers• ‘WEAVES’: Eco-friendly bed linen
Brands
Source: Company Source: Company
CRISIL Equities
Shri Lakshmi Cotsyn Limited
21
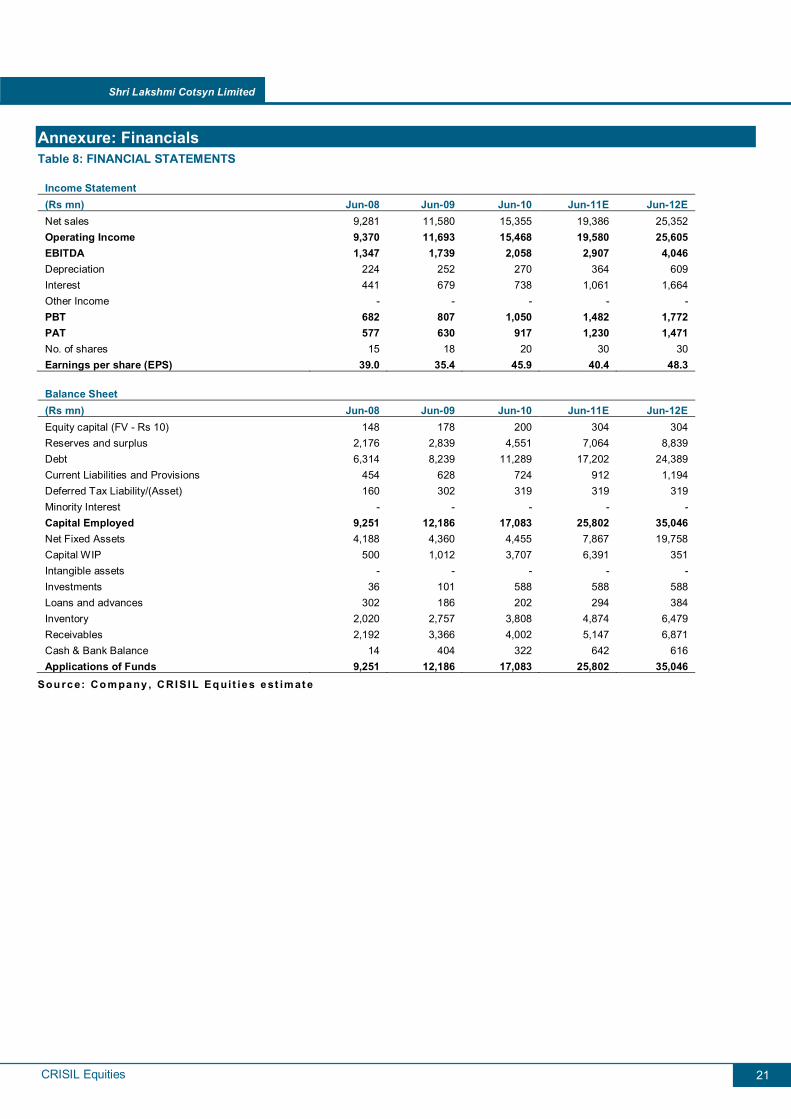
Annexure: Financials Table 8: FINANCIAL STATEMENTS
Income Statement (Rs mn) Jun-08 Jun-09 Jun-10 Jun-11E Jun-12E Net sales 9,281 11,580 15,355 19,386 25,352 Operating Income 9,370 11,693 15,468 19,580 25,605 EBITDA 1,347 1,739 2,058 2,907 4,046 Depreciation 224 252 270 364 609 Interest 441 679 738 1,061 1,664 Other Income - - - - - PBT 682 807 1,050 1,482 1,772 PAT 577 630 917 1,230 1,471 No. of shares 15 18 20 30 30 Earnings per share (EPS) 39.0 35.4 45.9 40.4 48.3
Balance Sheet (Rs mn) Jun-08 Jun-09 Jun-10 Jun-11E Jun-12E Equity capital (FV - Rs 10) 148 178 200 304 304 Reserves and surplus 2,176 2,839 4,551 7,064 8,839 Debt 6,314 8,239 11,289 17,202 24,389 Current Liabilities and Provisions 454 628 724 912 1,194 Deferred Tax Liability/(Asset) 160 302 319 319 319 Minority Interest - - - - - Capital Employed 9,251 12,186 17,083 25,802 35,046 Net Fixed Assets 4,188 4,360 4,455 7,867 19,758 Capital WIP 500 1,012 3,707 6,391 351 Intangible assets - - - - - Investments 36 101 588 588 588 Loans and advances 302 186 202 294 384 Inventory 2,020 2,757 3,808 4,874 6,479 Receivables 2,192 3,366 4,002 5,147 6,871 Cash & Bank Balance 14 404 322 642 616 Applications of Funds 9,251 12,186 17,083 25,802 35,046
Sou rc e: Co m pa ny , CRI SI L Eq ui t ie s e st im at e
CRISIL Equities
Shri Lakshmi Cotsyn Limited
22
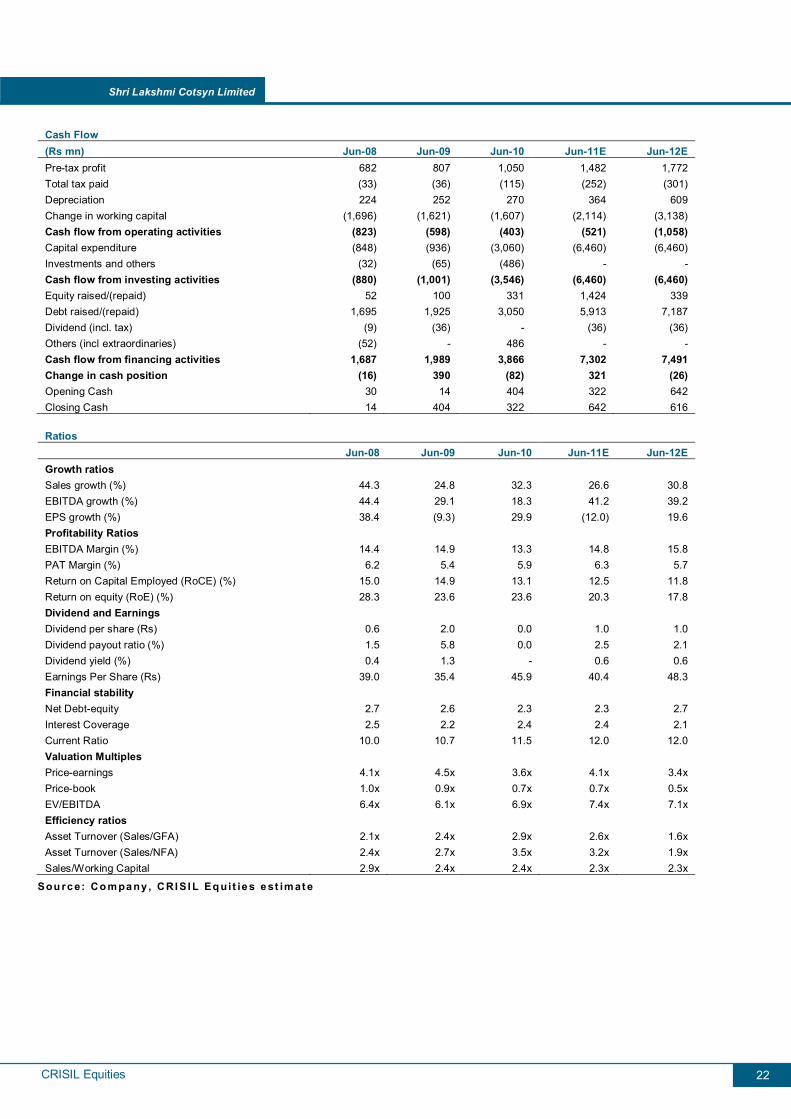
Cash Flow (Rs mn) Jun-08 Jun-09 Jun-10 Jun-11E Jun-12E Pre-tax profit 682 807 1,050 1,482 1,772 Total tax paid (33) (36) (115) (252) (301) Depreciation 224 252 270 364 609 Change in working capital (1,696) (1,621) (1,607) (2,114) (3,138) Cash flow from operating activities (823) (598) (403) (521) (1,058) Capital expenditure (848) (936) (3,060) (6,460) (6,460) Investments and others (32) (65) (486) - - Cash flow from investing activities (880) (1,001) (3,546) (6,460) (6,460) Equity raised/(repaid) 52 100 331 1,424 339 Debt raised/(repaid) 1,695 1,925 3,050 5,913 7,187 Dividend (incl. tax) (9) (36) - (36) (36) Others (incl extraordinaries) (52) - 486 - - Cash flow from financing activities 1,687 1,989 3,866 7,302 7,491 Change in cash position (16) 390 (82) 321 (26) Opening Cash 30 14 404 322 642 Closing Cash 14 404 322 642 616
Ratios Jun-08 Jun-09 Jun-10 Jun-11E Jun-12E Growth ratios Sales growth (%) 44.3 24.8 32.3 26.6 30.8 EBITDA growth (%) 44.4 29.1 18.3 41.2 39.2 EPS growth (%) 38.4 (9.3) 29.9 (12.0) 19.6 Profitability Ratios EBITDA Margin (%) 14.4 14.9 13.3 14.8 15.8 PAT Margin (%) 6.2 5.4 5.9 6.3 5.7 Return on Capital Employed (RoCE) (%) 15.0 14.9 13.1 12.5 11.8 Return on equity (RoE) (%) 28.3 23.6 23.6 20.3 17.8 Dividend and Earnings Dividend per share (Rs) 0.6 2.0 0.0 1.0 1.0 Dividend payout ratio (%) 1.5 5.8 0.0 2.5 2.1 Dividend yield (%) 0.4 1.3 - 0.6 0.6 Earnings Per Share (Rs) 39.0 35.4 45.9 40.4 48.3 Financial stability Net Debt-equity 2.7 2.6 2.3 2.3 2.7 Interest Coverage 2.5 2.2 2.4 2.4 2.1 Current Ratio 10.0 10.7 11.5 12.0 12.0 Valuation Multiples Price-earnings 4.1x 4.5x 3.6x 4.1x 3.4x Price-book 1.0x 0.9x 0.7x 0.7x 0.5x EV/EBITDA 6.4x 6.1x 6.9x 7.4x 7.1x Efficiency ratios Asset Turnover (Sales/GFA) 2.1x 2.4x 2.9x 2.6x 1.6xAsset Turnover (Sales/NFA) 2.4x 2.7x 3.5x 3.2x 1.9xSales/Working Capital 2.9x 2.4x 2.4x 2.3x 2.3x
Sou rc e: Co m pa ny , CRI SI L Eq ui t ie s e st im at e
CRISIL Equities
Shri Lakshmi Cotsyn Limited
23
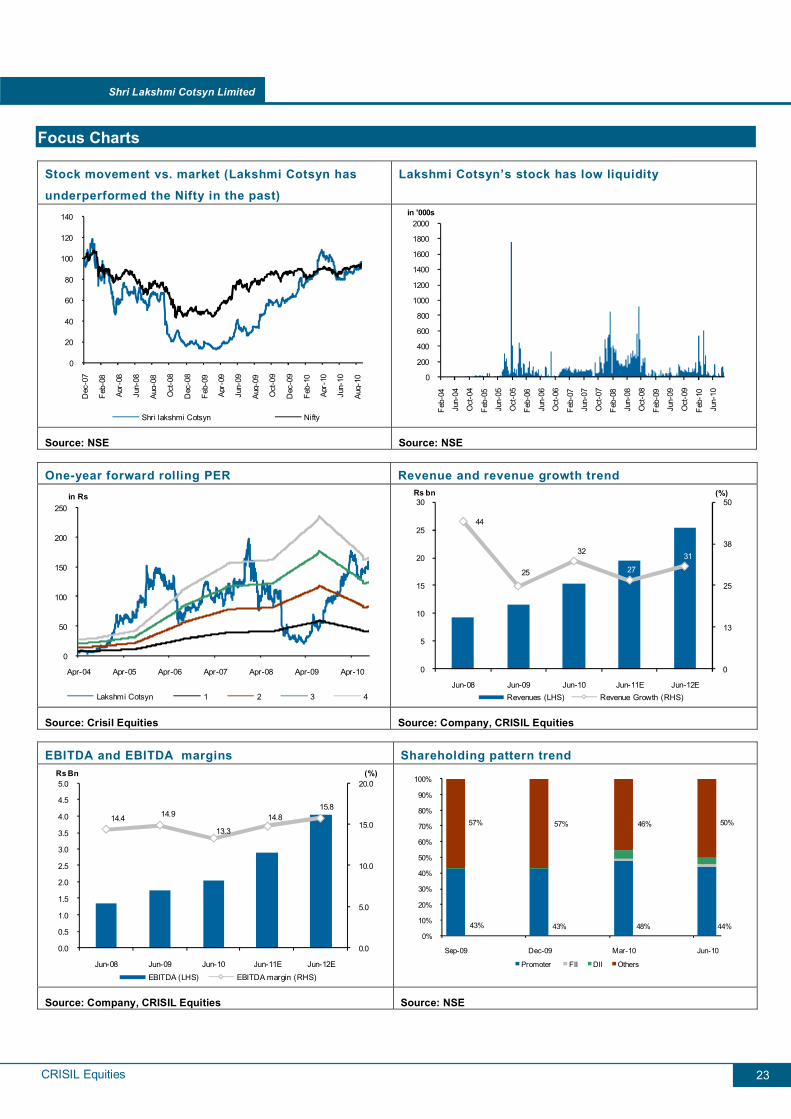
Focus Charts
Stock movement vs. market (Lakshmi Cotsyn has
underperformed the Nifty in the past)
Lakshmi Cotsyn’s stock has low liquidity
0
20
40
60
80
100
120
140
Dec
-07
Feb-
08
A pr-
08
Jun-
08
Aug-
08
Oct
-08
Dec
-08
Feb-
09
A pr-
09
Jun-
09
Aug-
09
Oct
-09
Dec
-09
Feb-
10
A pr-
10
Jun-
10
Aug-
10
Shri lakshmi Cotsyn Nifty
0
200
400
600
800
1000
1200
1400
1600
1800
2000
Feb-
04
Jun-
04
Oct
-04
Feb-
05
Jun-
05
Oct
-05
Feb-
06
Jun-
06
Oct
-06
Feb-
07
Jun-
07
Oct
-07
Feb-
08
Jun-
08
Oct
-08
Feb-
09
Jun-
09
Oct
-09
Feb-
10
Jun-
10
in '000s
Source: NSE Source: NSE
One-year forward rolling PER Revenue and revenue growth trend
0
50
100
150
200
250
Apr-04 Apr-05 Apr-06 Apr-07 Apr-08 Apr-09 Apr-10
in Rs
Lakshmi Cotsyn 1 2 3 4
44
25
32
27
31
0
13
25
38
50
0
5
10
15
20
25
30
Jun-08 Jun-09 Jun-10 Jun-11E Jun-12E
(%)Rs bn
Revenues (LHS) Revenue Growth (RHS)
Source: Crisil Equities Source: Company, CRISIL Equities
EBITDA and EBITDA margins Shareholding pattern trend
14.4 14.9
13.3
14.815.8
0.0
5.0
10.0
15.0
20.0
0.0
0.5
1.0
1.5
2.0
2.5
3.0
3.5
4.0
4.5
5.0
Jun-08 Jun-09 Jun-10 Jun-11E Jun-12E
(%)Rs Bn
EBITDA (LHS) EBITDA margin (RHS)
43% 43% 48% 44%
57% 57% 46% 50%
0%
10%
20%
30%
40%
50%
60%
70%
80%
90%
100%
Sep-09 Dec-09 Mar-10 Jun-10
Promoter FII DII Others
Source: Company, CRISIL Equities Source: NSE
This page is intentionally left blank
CRISIL Independent Equity Research Team Mukesh Agarwal [email protected] +91 (22) 3342 3035 Director Tarun Bhatia [email protected] +91 (22) 3342 3226 Director- Capital Markets Analytical Contacts Chetan Majithia [email protected] +91 (22) 3342 4148 Sudhir Nair [email protected] +91 (22) 3342 3526 Sector Contacts Nagarajan Narasimhan [email protected] +91 (22) 3342 3536 Ajay D'Souza [email protected] +91 (22) 3342 3567 Manoj Mohta [email protected] +91 (22) 3342 3554 Sachin Mathur [email protected] +91 (22) 3342 3541 Sridhar C [email protected] +91 (22) 3342 3546 Business Development Contacts Vinaya Dongre [email protected] +91 99 202 25174 Sagar Sawarkar [email protected] +91 98 216 38322 CRISIL’s Equity Offerings The Equity Group at CRISIL Research provides a wide range of services including:
Independent Equity Research IPO Grading White Labelled Research Valuation on companies for use of Institutional Investors, Asset Managers, Corporate
Other Services by the Research group include
CRISINFAC Industry research on over 60 industries and Economic Analysis Customised Research on Market sizing, Demand modelling and Entry strategies Customised research content for Information Memorandum and Offer documents
25
For further details or more information, please contact: Client Servicing CRISIL Research CRISIL House Central Avenue Hiranandani Business Park Powai, Mumbai - 400 076, India. Phone +91 (22) 3342 3561/ 62 Fax +91 (22) 3342 3501 E-mail: [email protected] E-mail: [email protected] www.ier.co.in
About CRISIL Limited CRISIL is India's leading Ratings, Research, Risk and Policy Advisory Company About CRISIL Research CRISIL Research is India's largest independent, integrated research house. We leverage our unique, integrated research platform and capabilities spanning the entire economy-industry-company spectrum to deliver superior perspectives and insights to over 600 domestic and global clients, through a range of subscription products and customised solutions.
Mumbai CRISIL House Central Avenue Hiranandani Business Park Powai, Mumbai - 400 076, India. Phone +91 (22) 3342 8026/29/35 Fax +91 (22) 3342 8088
New Delhi The Mira G-1 (FF),1st Floor, Plot No. 1&2 Ishwar Nagar, Near Okhla Crossing New Delhi -110 065, India. Phone +91 (11) 4250 5100, 2693 0117-21 Fax +91 (11) 2684 2212/ 13
Bengaluru W-101, Sunrise Chambers 22, Ulsoor Road Bengaluru - 560 042, India. Phone +91 (80) 4117 0622 Fax +91 (80) 2559 4801
Kolkata ‘Horizon’, Block ‘B’, 4th floor 57 Chowringhee Road Kolkata - 700 071, India. Phone +91 (33) 2283 0595 Fax +91 (33) 2283 0597
Chennai Mezzanine Floor, Thappar House 43 / 44, Montieth Road Egmore Chennai - 600 008, India. Phone +91 (44) 2854 6205/06, 2854 6093 Fax +91 (44) 2854 7531
Recommended