IDEA ASSESSMENT IN OPEN INNOVATION:
A STATE OF PRACTICE
Schulze, Thimo, Business School, University of Mannheim, Germany,
Indulska, Marta, UQ Business School, The University of Queensland, Brisbane, QLD,
Australia, [email protected]
Geiger, David, Business School, University of Mannheim, Germany,
Korthaus, Axel, School of Management and Information Systems, Victoria University,
Melbourne, VI, Australia, [email protected]
Abstract
Open innovation has become a fruitful approach to increasing the potential of innovation in
organisations. Similar to traditional innovation, an open innovation approach can be characterised in
three phases; namely idea generation, idea assessment and idea implementation/diffusion. While the
academic community has begun to provide initial guidance for improving the various stages of the
open innovation process, still little is known about how organisations currently assess ideas once they
are collected. The potentially vast quantity of ideas collected through an open innovation approach
has limited benefits to an organisation that is not able to categorise and assess ideas. Accordingly, in
this study we carry out an exploratory survey among 331 managers to obtain a better understanding
of idea assessment in practice. Our findings show, among others, that organisations investing in
information systems for idea management have a higher satisfaction with the effectiveness of idea
assessment, which is, in turn, associated with higher satisfaction with the innovation process overall.
Keywords: open innovation, user innovation, idea assessment, idea evaluation.
1 Introduction
Innovation is the bloodline of any organisation aiming to succeed in today’s globalised economy.
Hyper-competition and the fast spread of information force organisations to focus on their innovation
efforts to be able to adapt and stay ahead of the evolving global market place (Schoonhoven et al.,
1990). Traditionally, innovation was conducted in internal Research & Development (R&D)
departments in organisations without any regard for external ideas (Lichtenthaler and Lichtenthaler,
2010). This closed approach to innovation, however, has over the years evolved into an open one in
which ideas that are both internal and external to the organisation are considered valuable
(Chesbrough, 2006).
Regardless of whether a specific innovation approach is open or closed, innovation is defined as a
process through which ideas are transformed into new products, services or processes (Baregheh et al.,
2009). It is typically seen as a three-step process that encompasses activities related to idea generation,
idea conversion and idea diffusion (Hansen and Birkinshaw, 2007). In the first phase of the innovation
process, organisations focus on creating a substantial set of ideas. The more ideas generated at this
stage and the higher their quality, creativity, and applicability, the more chances the organisation has
for successful innovation (Hansen and Birkinshaw, 2007). The ideas are then assessed in the second
phase, with prioritised ideas converted into products or services, followed by activities increasing
diffusion of the new product or service in the third phase. Accordingly, the success of an innovation
process depends on how well the organisation is able to address each of the three phases.
While the traditional closed innovation approach is well understood in literature, further research is
needed that guides how the three phases of the open innovation process can be improved (Pashkina
and Indulska, 2011). Open innovation, which emerged as a paradigm only over the last decade, brings
new challenges to the innovation process. It has a higher reliance on communication technology, the
world wide web, social networks, and other technologies that connect organisations to external idea
sources. This can potentially bring a broader and less specific set of inputs into the innovation process.
Open innovation, therefore, calls for further research relating to the three underlying innovation
phases. While the academic community has begun to respond to this gap in the body of open
innovation knowledge, thus far mainly the idea generation phase received attention (Pashkina and
Indulska, 2011; West and Bogers, 2011). However, while idea generation is critical, even with the best
collection of ideas, an innovation process can still fail if the organisation does not have the appropriate
idea assessment approaches in place.
In the context of open innovation, the issue of evaluating and integrating ideas has significant and
different challenges than idea assessment in closed innovation approaches. In contrast to closed
innovation, a successful open idea generation approach leaves organisations with the task to screen
“hundreds of ideas generated by experts, employees, or consumers“ (Toubia and Florès, 2007). The
IBM Innovation Jam, for instance, generated 46,000 ideas, which needed to be screened for their
relevance and feasibility (Bjelland and Wood, 2008). This process consisted of a multi-stage process
involving a large group of volunteers that assisted in clustering and pre-selecting the ideas followed by
a one-week review session with 50 senior executives and professionals. Blohm et al. (2011b) posit that
constraints of time, budget, cognitive resources, and organisational structures limit an organisations
absorptive capacity regarding such large amounts of ideas. According to Robinson and Schroeder
(2009), it takes about $500 and four hours of staff and management time to evaluate one idea in a
Fortune 100 company. In summary, there is a clear need for new methods, mechanisms, and tools for
efficient idea assessment in open innovation approaches (Blohm et al., 2011b; Dahan et al., 2010).
Accordingly, given these challenges, in this paper we focus our research efforts on the idea assessment
aspect of the open innovation process. We choose this focus not only because of a clear gap in
literature but also due to the reliance of this aspect of the process on supporting technology. The large
number of ideas collected needs to be stored and categorised, which typically is done with the use of
an information system (an idea management system) (Nilsson et al., 2002). Due to the lack of

empirical evidence in this area, this study aims to develop a better understanding of idea assessment
practices currently in place in organisational open innovation processes, and aims to discover what
information systems features and organisational approaches for idea assessment tend to be associated
with higher levels of idea assessment satisfaction within an organisation.
We therefore undertake survey-based research that addresses the following research questions:
What is the current practice of idea assessment in organisational open innovation?
o Which information system features are positively associated with improved idea assessment?
o What organisational approaches to idea assessment are associated with improved idea
assessment?
We proceed as follows: Section 2 outlines related work relevant to the topic of idea assessment.
Section 3 justifies the research methodology selected for this study. Section 4 provides the results of
the survey of the current landscape of idea assessment practices in organisations, with a focus on the
information system and other organisational features that have the potential to increase idea
assessment success. Section 5 discusses the implications of the data analysis for research and practice.
Finally, section 6 concludes the paper and gives an outlook to future work.
2 Related Work
Several literature reviews in the field point to the importance of understanding the determinants of
successful open innovation by analysing the organizational capabilities and processes across firms
(Greer and Lei, 2011; Lichtenthaler, 2011). West and Bogers (2011) conclude, based on their review
of 280 open innovation research papers, that most research on inbound open innovation is concerned
with obtaining external innovations rather than with the subsequent phases of the innovation process.
This is surprising considering that organisations with an inherently limited absorptive capacity (Blohm
et al., 2011b) have to process an increasingly large quantity of external input (Dahan et al, 2010;
Toubia and Flores, 2007). Despite the clear need for a better understanding of best practice idea
assessment in open innovation, only a scarcity of research addresses this topic. West and Bogers
(2011) thus identify a broad research opportunity in analysing “what happens to innovations once they
come into the firm” (West & Bogers, 2011) and highlight the need for studies that measure differences
in how firms derive value from external innovations.
While there is a lack of research on idea assessment, several studies have begun to tackle this topic in
the academic community. In particular, they focus on technology support for idea evaluation.
Hrastinski et al. (2010), for example, analyse a sample of 51 innovation management systems and find
that 84% of the utilised systems contain features that support organisations in idea evaluation. Riedl et
al. (2009) perform an analysis of 25 public idea portals and identify several aspects that support the
different phases of idea management. In compliance with most of the existing literature, they identify
‘ratings’ and ‘grouping and clustering’ as two mechanisms to support structured idea assessment.
From the perspective of research on idea rating, studies have focused on assessment criteria (Dean et
al., 2006), rating scales (Riedl et al., 2010), and various algorithms (Salminen and Harmaakorpi, 2011;
Toubia and Florès, 2007). Several studies explore the potential of prediction markets or idea markets
as a form of implicit rating (Bothos et al., 2009; Dahan et al., 2010; Kamp and Koen, 2009; LaComb
et al., 2007; Soukhoroukova et al., 2012). Blohm et al. (2011b) compare the performance of both
mechanisms in terms of evaluation accuracy and satisfaction. Riedl et al. (2009), focusing on idea
categorisation, recognise that clustering methods are particularly helpful to organise large idea
portfolios. Research in this direction explores methods that are based on human and machine
intelligence to tag, classify or otherwise aggregate the open innovation input in order to facilitate
subsequent idea assessment. For example, the IBM Innovation Jam applied a combination of text
mining software and human categorisation to cluster the vast pool of collected thoughts (Bjelland and
Wood, 2008). In similar vein, a recent study has turned to developing frameworks for directly
structuring ideas at the time of contribution (Kain et al., 2011).
3 Methodology
Due to the lack of empirical evidence on the current practice of idea assessment, our approach of
choice is an exploratory survey conducted in an online setting. A survey approach allows us to
feasibly gather a large number of responses from geographically distributed areas (Singleton et al.,
2009) and also provides the flexibility required when the target participants are time-poor high level
managers or C-level senior executives (e.g. CIO, CEO), as it is the case in this study.
In the following sub-sections we discuss the survey development process, the data collection and the
subsequent approach for data analysis.
3.1 Survey Development
Due to the lack of prior empirical studies capturing the state of idea assessment in open innovation,
our survey design relies on the limited existing literature combined with researcher input based on
anecdotal evidence and consultation with academic open innovation experts (through a pilot survey).
To develop the survey instrument, we design questions that address the core three areas highlighted in
existing research (technology support for idea assessment, rating, and categorisation) and, in addition,
incorporate questions relating to organisational aspects of idea assessment, as well as a variety of
questions that aim to capture the success and effectiveness of idea assessment. Accordingly, in the
exploratory spirit of the study, the survey instrument contains four distinct sets of questions as follows:
Demographic questions. Several questions capture the demographic landscape of our survey
participants and the organisations they work for. Among others, we include questions relating to role
and experience, the innovation budget of the organisation, organisation size and industry
classification.
Information systems questions. We include a question relating to system functionality in order to
explore the use of specific information system features for idea assessment. This also opens the ability
to compare responses based on use, or lack of use, of information systems for idea management. We
also include questions that explore obstacles that stand in the way of efficient idea assessment in an
organisation, including IT-related issues.
Organisational aspect questions. We use categorical and ordinal scales to explore different
organisational aspects of idea assessment. Mainly, the questions relate to the frequency of idea
assessment, the percentage of ideas assessed, which criteria are used for assessment, how ideas are
categorised and whether ratings are used.
Satisfaction and effectiveness questions. We rely on a 7-point Likert scale to measure the overall
satisfaction with the innovation and assessment process. In addition, two questions specifically focus
on the effectiveness of the idea assessment approach and the overall innovation process, respectively.
Four questions are dedicated to capturing satisfaction levels with assessing the quality of the collected
ideas, organising the collected ideas, categorising the collected ideas, and channelling the ideas to the
relevant roles/areas within the company, respectively. An additional question measures the ability of
the organisation to expose its employees to the collected ideas (measured by agreement Likert scale).
3.2 Data Collection
Given our focus on open innovation, we consider the well-informed target participants to be at the
senior management and executive level in organisations. Accordingly, a survey broker was used to
enable a more targeted approach to reach the relevant participants. Given the typically time-poor
nature of such respondents, we chose to conduct a web-based survey that was easily accessible and
available in any time/place situation. The survey was formatted in a way to also be accessible via
mobile devices given the target audience. Overall 3241 participants were invited to respond to the
survey. They were selected because of their senior and executive roles, as per the survey broker

database, within organisations with an operating base in Australia. At the close of the survey, which
remained open for two weeks, 667 responses were collected, resulting in a response rate of 20.5%.
From this number of responses, we eliminated 76 responses that were incomplete, then a further 211
responses because the respondents no longer held roles that were deemed to be informed about the
overall innovation practice in the organisation (i.e. not senior or executive management roles). A
further 49 responses were filtered out because they indicated that the organisation in question did not
participate in open innovation. Following this filtering process we were left with 331 well-targeted
responses. While the response rate is relatively low, the overall number of responses is significant for
data analysis. The data is also closely aligned with the typical industry distribution of organisations
(Australian Bureau of Statistics, 2011), thus providing a good basis for exploratory work. We posit
that the response rate is low due to the target population that tends to be time-poor and hard to access
in survey based research (Baruch, 1999).
3.3 Data Analysis Methodology
We use IBM SPSS Statistics (v19) to analyse the data. For categorical questions with nominal
answers, we report the absolute and relative frequencies. Since absolute values are not meaningful for
Likert scale data, we use these scales to compare different sub-groups based on the questions with a
dichotomous or categorical scale (by forming two or more sub-groups for the comparison). Because
Likert scales are ordinal, we use the non-parametric Mann-Whitney-Wilcoxon-U-Test (for two
groups) and the Kruskal-Wallis-Test (for three or more groups). These tests are used to assess whether
one of the two groups has significantly larger values than other groups within the data. The main test
results are the mean rank (i.e. the mean position of the elements of one group in the ordered sequence
of the population, and the test statistics U (Mann-Whitney-Wilcoxon) respectively Chi-Square
(Kruskal-Wallis). These can be used to calculate the standard score Z and thus the p-value
(significance level). These two non-parametric tests are similar to the T-Test or ANOVA for normally
distributed data. However, given that a Kolmogorov-Smirnov-Test shows that our Likert scale data
does not significantly follow a normal distribution (p < 0.001), we cannot apply the T-Test or
ANOVA. Accordingly, we also report medians and quartiles rather than mean and variance.
4 Data Analysis
4.1 Demographic Data
The representative survey participant works in a for-profit organisation (75%) that has less than 100
employees (54%) with an average annual revenue of approximately $5 million. This most typical
participant tends to be at managerial level (74%) with an average of 10 years of relevant experience.
CEOs represent 11% of our respondents. Other, less typical respondents, work for non-profits (10%)
and government (15%), many in small companies with 10 or less (26%) or 11-100 (28%) employees.
Close to 30% of these participants work in large organisations – 10% having between 1,001 and 5,001
employees and 17% over 5,000 employees. Given the variety of organisational sizes, it is not
surprising that the annual revenue is also distributed from below $1M (21%) to over $10M (39%). The
organisations operate in a variety of industries, with the most frequent being: Retail Trade (19%),
Manufacturing (11%), Health and Community Services (10%), Education (9%), and Construction
(7%). Other than manager, some respondents have positions as CEO (11%) or project manager (9%).
From the perspective of innovation, 72% of the survey participants are directly involved in innovation
or improvement initiatives/projects within their company. The (total) annual innovation budget
(including internal and external innovation) is widely spread with an average of $150,000 per year.
The results become more meaningful when considering the innovation budget in relation to the annual
revenue. For 29% of organisations the innovation budget is less than 2.5% of the annual revenue,
while 19% invest between 2.5% and 10% of their annual revenue in innovation. Only 7.3% of
organisations have an innovation budget that is over 10% of their revenue.
4.2 Current Status of Idea Assessment
We approach the research question regarding the current practice of idea assessment in organisations
by reporting the results of three categorical questions that allowed multiple choice responses. In these
questions we aimed to explore whether the organisation uses specific criteria for idea assessment and,
if so, which criteria are used, who is responsible for the assessment, how frequently ideas are assessed,
what percentage of ideas is assessed, and whether information systems are used to facilitate idea
management and assessment.
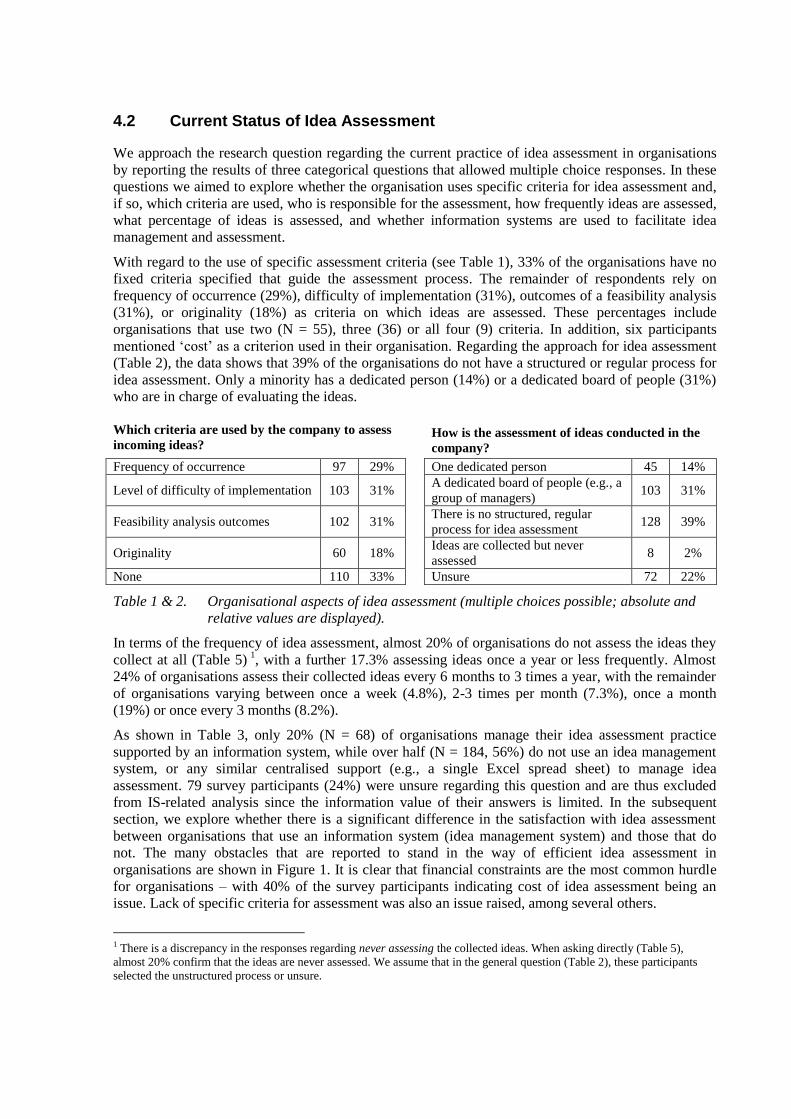
With regard to the use of specific assessment criteria (see Table 1), 33% of the organisations have no
fixed criteria specified that guide the assessment process. The remainder of respondents rely on
frequency of occurrence (29%), difficulty of implementation (31%), outcomes of a feasibility analysis
(31%), or originality (18%) as criteria on which ideas are assessed. These percentages include
organisations that use two (N = 55), three (36) or all four (9) criteria. In addition, six participants
mentioned ‘cost’ as a criterion used in their organisation. Regarding the approach for idea assessment
(Table 2), the data shows that 39% of the organisations do not have a structured or regular process for
idea assessment. Only a minority has a dedicated person (14%) or a dedicated board of people (31%)
who are in charge of evaluating the ideas.
Which criteria are used by the company to assess
incoming ideas?
How is the assessment of ideas conducted in the
company?
Frequency of occurrence 97 29% One dedicated person 45 14%
Level of difficulty of implementation 103 31% A dedicated board of people (e.g., a
group of managers) 103 31%
Feasibility analysis outcomes 102 31% There is no structured, regular
process for idea assessment 128 39%
Originality 60 18% Ideas are collected but never
assessed 8 2%
None 110 33% Unsure 72 22%
Table 1 & 2. Organisational aspects of idea assessment (multiple choices possible; absolute and
relative values are displayed).
In terms of the frequency of idea assessment, almost 20% of organisations do not assess the ideas they
collect at all (Table 5) 1
, with a further 17.3% assessing ideas once a year or less frequently. Almost
24% of organisations assess their collected ideas every 6 months to 3 times a year, with the remainder
of organisations varying between once a week (4.8%), 2-3 times per month (7.3%), once a month
(19%) or once every 3 months (8.2%).
As shown in Table 3, only 20% (N = 68) of organisations manage their idea assessment practice
supported by an information system, while over half (N = 184, 56%) do not use an idea management
system, or any similar centralised support (e.g., a single Excel spread sheet) to manage idea
assessment. 79 survey participants (24%) were unsure regarding this question and are thus excluded
from IS-related analysis since the information value of their answers is limited. In the subsequent
section, we explore whether there is a significant difference in the satisfaction with idea assessment
between organisations that use an information system (idea management system) and those that do
not. The many obstacles that are reported to stand in the way of efficient idea assessment in
organisations are shown in Figure 1. It is clear that financial constraints are the most common hurdle
for organisations – with 40% of the survey participants indicating cost of idea assessment being an
issue. Lack of specific criteria for assessment was also an issue raised, among several others.
1 There is a discrepancy in the responses regarding never assessing the collected ideas. When asking directly (Table 5),
almost 20% confirm that the ideas are never assessed. We assume that in the general question (Table 2), these participants
selected the unstructured process or unsure.
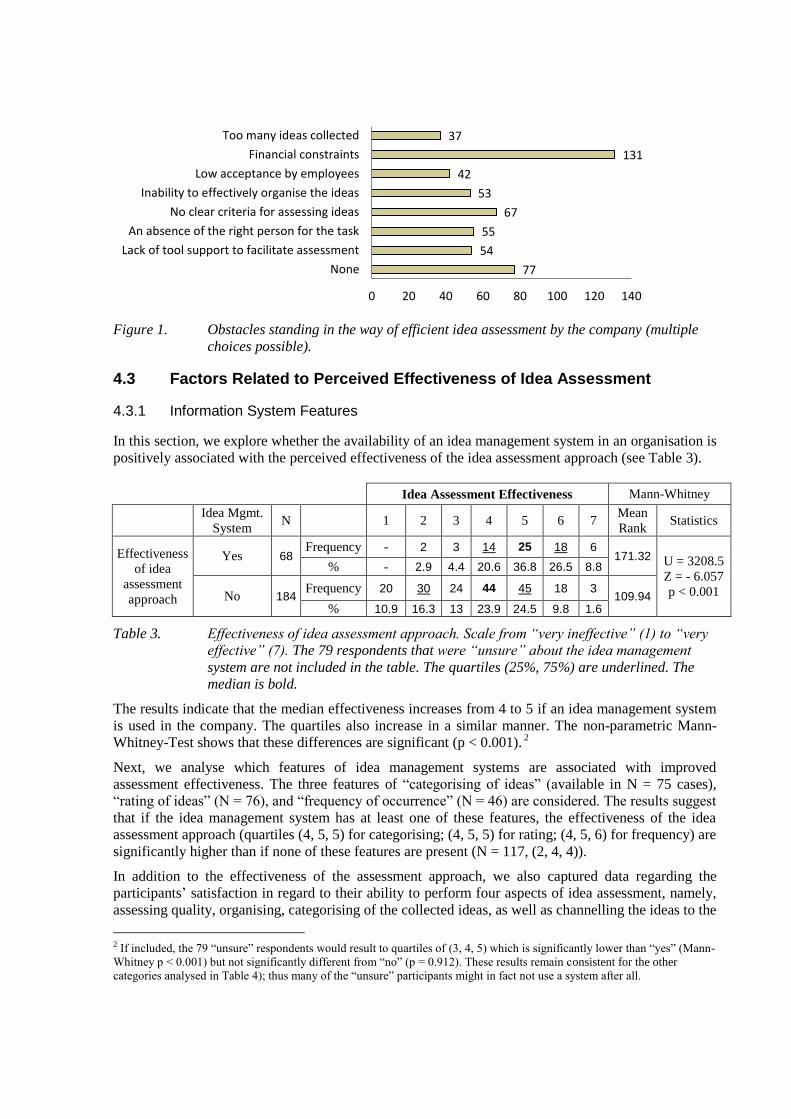
Figure 1. Obstacles standing in the way of efficient idea assessment by the company (multiple
choices possible).
4.3 Factors Related to Perceived Effectiveness of Idea Assessment
4.3.1 Information System Features
In this section, we explore whether the availability of an idea management system in an organisation is
positively associated with the perceived effectiveness of the idea assessment approach (see Table 3).
Idea Assessment Effectiveness Mann-Whitney
Idea Mgmt.
System N 1 2 3 4 5 6 7
Mean
Rank Statistics
Effectiveness
of idea
assessment
approach
Yes 68 Frequency - 2 3 14 25 18 6
171.32 U = 3208.5
Z = - 6.057
p < 0.001
% - 2.9 4.4 20.6 36.8 26.5 8.8
No 184 Frequency 20 30 24 44 45 18 3
109.94 % 10.9 16.3 13 23.9 24.5 9.8 1.6
Table 3. Effectiveness of idea assessment approach. Scale from “very ineffective” (1) to “very
effective” (7). The 79 respondents that were “unsure” about the idea management
system are not included in the table. The quartiles (25%, 75%) are underlined. The
median is bold.
The results indicate that the median effectiveness increases from 4 to 5 if an idea management system
is used in the company. The quartiles also increase in a similar manner. The non-parametric Mann-
Whitney-Test shows that these differences are significant (p < 0.001). 2
Next, we analyse which features of idea management systems are associated with improved
assessment effectiveness. The three features of “categorising of ideas” (available in N = 75 cases),
“rating of ideas” (N = 76), and “frequency of occurrence” (N = 46) are considered. The results suggest
that if the idea management system has at least one of these features, the effectiveness of the idea
assessment approach (quartiles (4, 5, 5) for categorising; (4, 5, 5) for rating; (4, 5, 6) for frequency) are
significantly higher than if none of these features are present (N = 117, (2, 4, 4)).
In addition to the effectiveness of the assessment approach, we also captured data regarding the
participants’ satisfaction in regard to their ability to perform four aspects of idea assessment, namely,
assessing quality, organising, categorising of the collected ideas, as well as channelling the ideas to the
2 If included, the 79 “unsure” respondents would result to quartiles of (3, 4, 5) which is significantly lower than “yes” (Mann-
Whitney p < 0.001) but not significantly different from “no” (p = 0.912). These results remain consistent for the other
categories analysed in Table 4); thus many of the “unsure” participants might in fact not use a system after all.
77
54
55
67
53
42
131
37
0 20 40 60 80 100 120 140
None
Lack of tool support to facilitate assessment
An absence of the right person for the task
No clear criteria for assessing ideas
Inability to effectively organise the ideas
Low acceptance by employees
Financial constraints
Too many ideas collected
relevant areas within the company. For all four aspects, the existence of an idea management system
significantly (p < 0.001) improves the level of satisfaction; from a median of 4 to a median of 5 or 6
(see Table 4).
Satisfaction Rating Mann-Whitney
Idea Mgmt.
System N 1 2 3 4 5 6 7
Mean
Rank Statistics
Assess the
quality of the
ideas
collected
Yes 68 Frequency - 2 2 14 14 23 13
171.13 U = 3221.0
Z = - 6.029
p < 0.001
% - 2.9 2.9 20.6 20.6 33.8 19.1
No 184 Frequency 15 24 18 51 44 27 5 110.01
% 8.2 13.0 9.8 27.7 23.9 14.7 2.7
Organise the
collected
ideas
Yes 68 Frequency 1 - 3 12 22 18 13
174.10 U = 3019.5
Z = - 6.445
p < 0.001
% 1.5 - 2.9 17.6 32.4 26.5 19.1
No 184 Frequency 15 27 17 50 49 24 2 108.91
% 8.2 14.7 9.2 27.2 26.6 13.0 1.1
Categorise
the collected
ideas
Yes 68 Frequency - 1 3 17 15 19 13
172.18 U = 3150
Z = - 6.177
p < 0.001
% - 1.5 4.4 25.0 22.1 27.9 19.1
No 184 Frequency 16 25 21 53 45 21 3
109.62 % 8.7 13.6 11.4 28.8 24.5 11.4 1.6
Channel
ideas to
relevant areas
in company
Yes 68 Frequency - 1 7 8 14 21 17
168.15 U = 3424
Z = - 5.615
p < 0.001
% - 1.5 10.3 11.8 20.6 30.9 25.0
No 184 Frequency 12 23 17 47 47 30 8
111.11 % 6.5 12.5 9.2 25.5 25.5 16.3 4.3
Table 4. Satisfaction with capabilities of the company. Scale from “very dissatisfied” (1) to
“very satisfied” (7). The 79 respondents that were “unsure” about the idea
management system are not included in the table. The quartiles (25%, 75%) are
underlined. The median is bold.
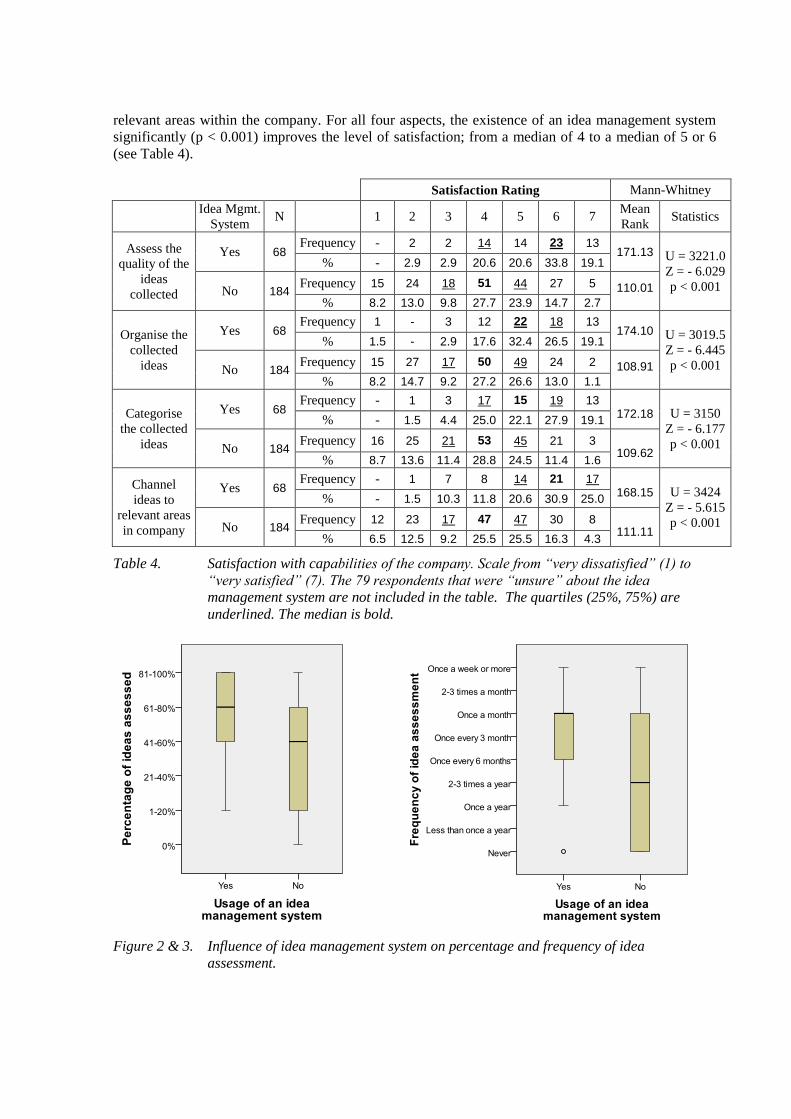
Figure 2 & 3. Influence of idea management system on percentage and frequency of idea
assessment.

The existence of an idea management system also has an influence on the two objective measures of
how often and how many ideas are assessed (see Figure 2 & 3). The median of the percentage of ideas
assessed significantly improves from “41-60%” to “61-80%” (U = 4318.5, Z = -3.845, p < 0.001) if an
idea management system is used by the organisation. The median of the frequency of idea assessment
also significantly improves from “2-3 times a year” to “once a month” (U = 3414.5, Z = -5.595, p =
0.000) if an idea management system is in place.
4.3.2 Other Organisational Factors
In this section, we evaluate which organisational factors have a positive association with effectiveness
of and satisfaction with idea assessment. The first set of questions regard the frequency of idea
assessment (Table 5). Our data shows that 28% of the organisations represented by our survey
respondents never assess the quality of incoming ideas, or do so less than once a year. 31% perform
this evaluation at least once a month; while the rest does so less often. The results also indicate that
this frequency has a clear and significant association with all effectiveness and satisfaction metrics,
three of which are exemplified in Table 5.
Effectiveness of idea
assessment
Expose employees to
ideas
Channel ideas to
areas in company
Frequency of idea
assessment N % Median Mean Rank Median Mean Rank Median Mean Rank
Never 66 19.9 3 103.45 4 107.57 4 110.70
Less than once a year 27 8.2 3 84.26 4 114.13 4 93.11
Once a year 30 9.1 3.5 139.82 4 160.47 5 151.32
2-3 times a year 36 10.9 4 152.28 4.5 166.83 5 153.94
Once every 6 months 42 12.7 4 172.89 4 157.49 4.5 163.06
Once every 3 months 27 8.2 5 215.04 5 185.59 5 206.15
Once a month 63 19.0 5 223.82 5 212.13 5 215.46
2-3 times a month 24 7.3 5 221.06 6 224.38 6 229.63
Once a week or more 16 4.8 5 230.81 6 223.16 6 221.56
Total 331 100 Chi-Square: 100.578
df = 8; p < 0.001
Chi-Square: 66.395
df = 8; p < 0.001
Chi-Square: 79.762
df = 8; p < 0.001
Table 5. On the left: Frequency of idea assessment in absolute and relative values. On the
right: Effectiveness/satisfaction relative to the frequency of idea assessment.
Differences tested with the Kruskal-Wallis-Test.
For example, the satisfaction with channelling the ideas to appropriate areas within the company
increases from a median of 4 to a median of 6 if ideas are evaluated more often. Similarly, the
effectiveness of idea assessment is improved when frequency of idea assessment is increased.
A similar pattern is uncovered if we consider the percentage of ideas assessed by organisations (the
following results not shown in a table or graph for space limitations). Twenty-eight per cent of our
respondents indicate that only 20% or less of the submitted ideas are assessed in their organisation.
Fourteen per cent indicate that between 21% and 40% of submitted ideas are assessed, with nineteen
per cent indicating that between 61% and 80% are assessed, and a further nineteen per cent assessing
81% of the ideas or more. This percentage of assessed ideas has a clear association with the
satisfaction and assessment metrics. Consistently, the more ideas are assessed, the higher the
satisfaction. For example, when considering satisfaction with exposing employees to ideas, the median
steadily increases from 2 to 6.

5 Discussion
The explorative results of our quantitative study have several implications for research and practice.
As a prelude to this discussion, we first put idea assessment in the perspective of the overall
innovation process. To do so, in our study we also measure the overall effectiveness of the innovation
process (including idea generation and implementation). Our data indicates that this value is
significantly correlated with the effectiveness of idea assessment (Kendall-Tau correlation coefficient τ
= 0.668, p < 0.001), suggesting that idea assessment is a very important phase of the innovation
process. Thus, identification of any practices or tools/functionality that help improve effectiveness of
idea assessment is also likely to improve the overall effectiveness of the innovation process.
All additional findings from our study presented in this section are highly significant with at least p =
0.001. However, because of the explorative nature of our study, these findings require further study.
5.1 Need for Information Systems in the Innovation Process
Many idea management systems for various target groups exist and offer different features – e.g., idea
submission and evaluation (Hrastinski et al., 2010). Surprisingly, however, only 20% of the
respondents in our study are aware that their company uses some form of an idea management system.
While many organisations without such a system may not see the lack as an obstacle, our data
consistently outlines the benefits of technical support of the idea assessment process. Organisations
using an information system are more effective in innovation overall and more satisfied with aspects
such as organising, categorising, assessing, and implementing the collected ideas. They are also able to
assess a higher quantity of the collected ideas in a much higher frequency.
Future work could investigate this discrepancy between clear benefits of using an information system
and the lack of adoption of these systems within organisations and therefore improve the
understanding for diffusion of these systems. More focus should also be directed to the utility of
complex systems that have high theoretical value but are impractical because of high cognitive load
(Blohm et al., 2011b) or financial constraints. Interestingly, having ‘too many collected ideas’ – a
common problem reported in literature (e.g. Toubia and Florès, 2007) – is only encountered by a
minority of our survey participants. Even if collective intelligence or crowdsourcing platforms are
used, channelling these ideas to relevant areas in the company still relies on internal processes. Our
survey results suggest that information systems can help with this process.
5.2 Organisational Factors and Idea Assessment
Our data shows that almost 40% of the participants’ organisations do not have a regular, structured
process for idea assessment. These companies assess fewer ideas less frequently, leading to lower
effectiveness. Alarmingly, almost 20% of organisations do not assess the ideas they collect at all.
Besides a lack of time, some companies might see open innovation as a mere marketing instrument
with the primary goal of engaging users in discussions about the brand; and thus the actual idea output
is secondary. The reliance on one dedicated person for idea assessment, or a dedicated board of
people, seems to be primarily moderated by the number of employees in the company (with the data
showing no differences in satisfaction between these two approaches). Future research should
investigate this aspect more closely, also taking into account different manager types, e.g. those rather
looking for incremental ideas or breakthrough ideas (Vandenbosch et al., 2006).
While detailed literature exists regarding dimensions of idea quality (Blohm et al., 2011a; Dean et al.,
2006), one third of our survey respondents report not having fixed assessment criteria, while only a
third uses one criterion (equally distributed between frequency, difficulty, feasibility, and originality).
Existing literature, however, indicates that complex rating scales are more efficient than simple scales
(Riedl et al., 2010). Thus, the question remains which of the different dimensions is best suited in
which cases, especially if financial or other constraints persist. Financial constraints are mentioned

most frequently as an obstacle to effective idea assessment, but the acknowledgement of this obstacle
does not lead to significantly lower satisfaction metrics. However, if these financial constraints lead to
not having the right person available, or not being able to utilise an appropriate tool for idea
assessment, and thus being unable to organise the ideas, satisfaction and effectiveness of the
assessment process are reduced because fewer ideas can be properly assessed.
6 Conclusion
This paper contributes to the discussion of the current state of practice of idea assessment in open
innovation initiatives. Based on 331 survey responses, the study explores what practices organisations
currently employ in their efforts to evaluate incoming ideas and, specifically, what role information
systems play in idea assessment. Our study finds that organisations using idea management systems –
information systems dedicated to improving the practice of managing incoming ideas – are overall
more satisfied with idea assessment, and, furthermore, more satisfied with their open innovation
initiatives as a whole. When considering other organisational factors, perhaps not surprisingly, the
study also indicates that more frequent idea assessment is associated with higher satisfaction levels for
the diffusion of ideas through the organisation. Similarly, organisations that have practices in place
that allow a higher percentage of incoming ideas to be assessed have a higher level of satisfaction with
idea assessment and with the overall innovation process. So overall, the data clearly states the benefits
of having a regular and structured idea assessment process supported by IT.
While the study presents the first empirical snapshot of idea assessment in practice, it is not without
limitations. One limitation of our work is that the survey did not control for other possible alternative
explanations, hence, some of our findings might be due to mere correlation rather than causal effects.
However, the results are a good basis on which to test many hypotheses in a more rigorous positivist
matter. Another limitation stems from the target participants – the survey was only targeted at
Australian corporations and the response rate was low, hence external reliability can be limited.
However, the demographics of respondents indicate a good mix of executives from small and big
companies, leading us to believe that the results will be similar in Western countries with similar
corporate structures. In addition, given the exploratory nature of the study based on limited existing
literature, question and measure development is a limitation of this work. Last, due to the limited
survey length, we were also not able to go into much detail regarding many technical aspects of the
idea evaluation process or how technology support is utilised in different aspects of idea assessment,
the full assessment scales used, or the relation between internal and external evaluation (while we
focus on open innovation only, we did not make a distinction between assessment of internal and
external ideas). Many of these aspects could be better measured in semi-structured interviews rather
than a quantitative survey. Future work could leverage the potential of a mixed methods approach that
also employs qualitative instruments to generate additional insights that will further help increase our
understanding of the phenomenon studied in this paper.
References
Australian Bureau of Statistics (2011): “Employed persons by Industry - Trend, Seasonally adjusted“.
http://www.abs.gov.au/
Baregheh, A.; Rowley, J.; Sambrook, S. (2009): “Towards a multidisciplinary definition of innovation“. In:
Management decision. 47 (8), pp. 1323–1339.
Baruch, Y. (1999): “Response rate in academic studies-A comparative analysis“. In: Human relations. 52 (4),
pp. 421–438.
Bjelland, O. M.; Wood, R. C. (2008): “An inside view of IBM’s “Innovation Jam”“. In: MIT Sloan Management
Review. 50 (1), pp. 32–40.
Blohm, I.; Bretschneider, U.; Leimeister, J. M.; Krcmar, H. (2011a): “Does collaboration among participants
lead to better ideas in IT-based idea competitions? An empirical investigation“. In: International Journal of
Networking and Virtual Organisations. 9 (2), pp. 106-122.

Blohm, I.; Riedl, C.; Leimeister, J. M.; Krcmar, H. (2011b): “Idea Evaluation Mechanisms for Collective
Intelligence in Open Innovation Communities: Do Traders outperform Raters?“. In: Thirty Second
International Conference on Information Systems (ICIS). Shanghai, China.
Bothos, E.; Apostolou, D.; Mentzas, G. (2009): “Collective intelligence for idea management with Internet-based
information aggregation markets“. In: Internet Research. 19 (1), pp. 26–41.
Chesbrough, H. W. (2006): “Open innovation: the new imperative for creating and profiting from technology”.
Harvard Business Press. ISBN: 1422102831.
Dahan, E.; Soukhoroukova, A.; Spann, M. (2010): “New Product Development 2.0: Preference Markets—How
Scalable Securities Markets Identify Winning Product Concepts and Attributes“. In: Journal of Product
Innovation Management. 27 (7), pp. 937–954.
Dean, D. L.; Hender, J. M.; Rodgers, T. L.; Santanen, E. L. (2006): “Identifying quality, novel, and creative
Ideas: Constructs and scales for idea evaluation“. In: Journal of the Association for Information Systems. 7
(10), pp. 646–698.
Greer, C. R.; Lei, D. (2011): “Collaborative Innovation with Customers: A Review of the Literature and
Suggestions for Future Research“. In: International Journal of Management Reviews.
Hansen, M. T.; Birkinshaw, J. (2007): “The innovation value chain“. In: Harvard Business Review. 85 (6),
p. 121.
Hrastinski, S.; Kviselius, N. Z.; Ozan, H.; Edenius, M. (2010): “A review of technologies for open innovation:
Characteristics and future trends“. In: 43rd Hawaii International Conference on System Sciences (HICSS).
Kain, A.; Kirschner, R.; Lang, A.; Lindemann, U. (2011):”Facing the Open Innovation Dilemma–Structuring
Input at the Company’s Border“. In: Proceedings of the 18th International Conference on Engineering
Design (ICED11), Vol. 1. pp. 487–498.
Kamp, G.; Koen, P. A. (2009): “Improving the idea screening process within organizations using prediction
markets: A theoretical perspective“. In: The Journal of Prediction Markets. 3 (2), pp. 39-64.
LaComb, C. A.; Barnett, J. A.; Pan, Q. (2007): “The imagination market“. In: Information Systems Frontiers. 9
(2-3), pp. 245-256.
Lichtenthaler, U. (2011): “Open Innovation: Past Research, Current Debates, and Future Directions“. In:
Academy Of Management Perspectives. 25 (1), pp. 75-93.
Lichtenthaler, U.; Lichtenthaler, E. (2010): “Technology transfer across organizational boundaries: absorptive
capacity and desorptive capacity“. In: California Management Review. 53 (1), pp. 154–170.
Nilsson, L.; Elg, M.; Bergman, B. (2002): “Managing ideas for the development of new products“. In:
International Journal of Technology Management. 24 (5), pp. 498–513.
Pashkina, E.; Indulska, M. (2011): “Where are the Ideas ?: External Idea Acquisition“. In: 22nd Australasian
Conference on Information Systems (ACIS). Sydney, Australia.
Riedl, C.; Blohm, I.; Leimeister, J. M.; Krcmar, H. (2010): “Rating scales for collective intelligence in
innovation communities: Why quick and easy decision making does not get it right“. In: Thirty First
International Conference on Information Systems (ICIS). St. Louis, USA.
Riedl, C.; May, N.; Finzen, J.; Stathel, S.; Kaufman, V.; Krcmar, H. (2009): “An idea ontology for innovation
management“. In: International Journal on Semantic Web and Information Systems. 5 (4), pp. 1–18.
Robinson, A. G.; Schroeder, D. M. (2009): “Ideas Are Free: How the Idea Revolution Is Liberating People and
Transforming Organizations”. Berrett-Koehler Publishers. ISBN: 1576752828.
Salminen, J.; Harmaakorpi, V. (2011): “Collective Intelligence and Practice-Based Innovation: An Idea
Evaluation Method Based on Collective Intelligence“. In: Practice-Based Innovation: Insights, Applications
and Policy Implications. Springer. pp. 213–232.
Schoonhoven, C. B.; Eisenhardt, K. M.; Lyman, K. (1990): “Speeding products to market: Waiting time to first
product introduction in new firms“. In: Administrative Science Quarterly. 35 (1), pp. 177–207.
Singleton, R. A., Jr.; Straits, B. C. (2009): “Approaches to Social Research”. Oxford University Press, USA. 5th
edition. ISBN: 0195372980
Soukhoroukova, A.; Spann, M.; Skiera, B. (2012): “Sourcing, Filtering, and Evaluating New Product Ideas: An
Empirical Exploration of the Performance of Idea Markets“. In: Journal of Product Innovation Management.
29 (1), pp. 100-112.
Toubia, O.; Florès, L. (2007): “Adaptive Idea Screening Using Consumers“. In: Marketing Science. 26 (3),
pp. 342-360.
Vandenbosch, B.; Saatcioglu, A.; Fay, S. (2006): “Idea Management: A Systemic View“. In: Journal of
Management Studies. Wiley Online Library 43 (2), pp. 259–288.
West, J.; Bogers, M. (2011):”Profiting from External Innovation: A Review of Research on Open Innovation“.
In: 9th International Open and User Innovation Workshop. Vienna, Austria.
Recommended