Embed Size (px)
Citation preview
1
The contents of these pages are copyright © 2012 Frost & Sullivan. All rights reserved.
growth team m e m b e r s h i p™
Co-Sponsor
Open Innovation for Idea Generation
europe
2012 r&d/innovation and product development priorities survey results
TWEET ABOUT THE SURVEYS
#2012priorities
2
The contents of these pages are copyright © 2012 Frost & Sullivan. All rights reserved.
2012 survey resultsgrowth team m e m b e r s h i p™
CONTENTS
INTRO
Executive Summary . . . . . . . . . . . . . . . . . . . . . . . . . . . . . . . . . . . . 3
Survey Purpose and Respondents . . . . . . . . . . . . . . . . . . . . . . . . . . . . 4
What is the Growth Team Membership™ . . . . . . . . . . . . . . . . . . . . . . . . 5
R&D/Innovation and Product Development Overarching Challenges . . . . . . . . . . 6
Key R&D/Innovation and Product Development Challenges . . . . . . . . . . . . . . . 7SECTION
1
Respondent Demographics . . . . . . . . . . . . . . . . . . . . . . . . . . . . . . . . 19SECTION
4
R&D/Innovation and Product Development Resource Trends . . . . . . . . . . . . . . 10SECTION
2
Special Interest Topic: Open Innovation . . . . . . . . . . . . . . . . . . . . . . . . . 15SECTION
3
3
The contents of these pages are copyright © 2012 Frost & Sullivan. All rights reserved.
2012 survey resultsgrowth team m e m b e r s h i p™
Growth Team Membership™ research.
Introduction
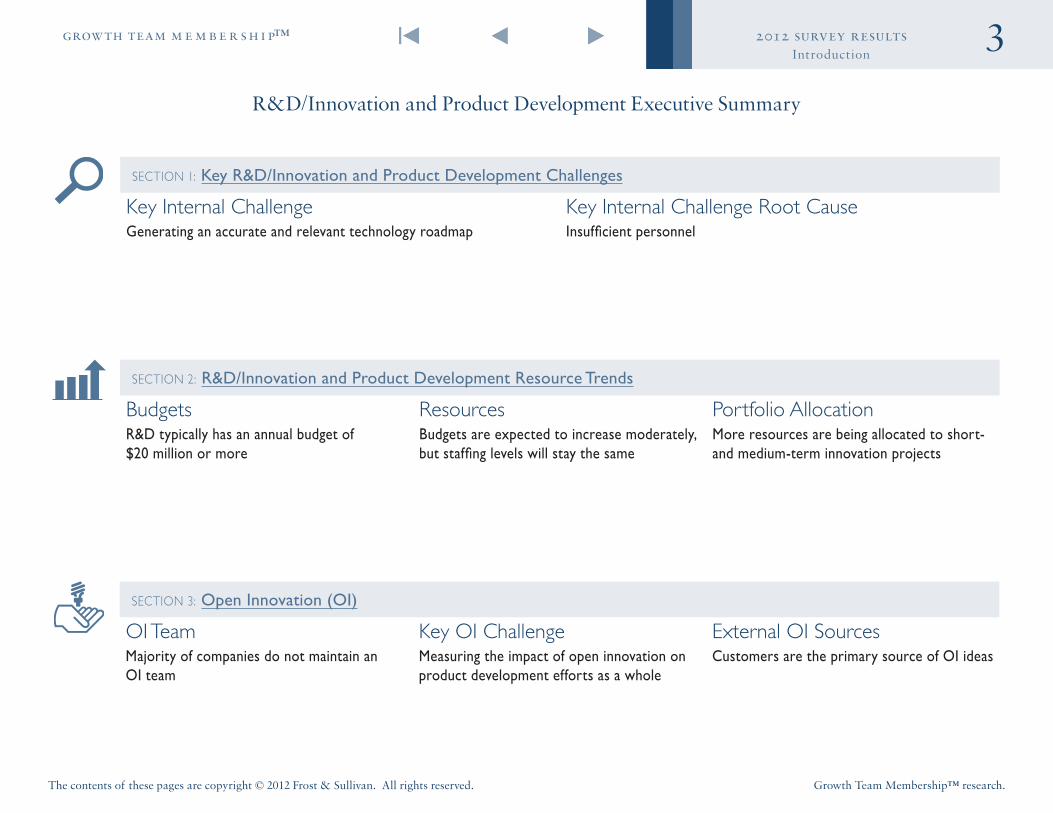
R&D/Innovation and Product Development Executive Summary
SECTION 1: Key R&D/Innovation and Product Development Challenges
Key Internal Challenge Key Internal Challenge Root CauseGenerating an accurate and relevant technology roadmap Insufficient personnel
SECTION 2: R&D/Innovation and Product Development Resource Trends
Budgets Resources Portfolio AllocationR&D typically has an annual budget of $20 million or more
Budgets are expected to increase moderately, but staffing levels will stay the same
More resources are being allocated to short- and medium-term innovation projects
SECTION 3: Open Innovation (OI)
OI Team Key OI Challenge External OI Sources Majority of companies do not maintain an OI team
Measuring the impact of open innovation on product development efforts as a whole
Customers are the primary source of OI ideas
4
The contents of these pages are copyright © 2012 Frost & Sullivan. All rights reserved.
2012 survey resultsgrowth team m e m b e r s h i p™
Growth Team Membership™ research.
Introduction
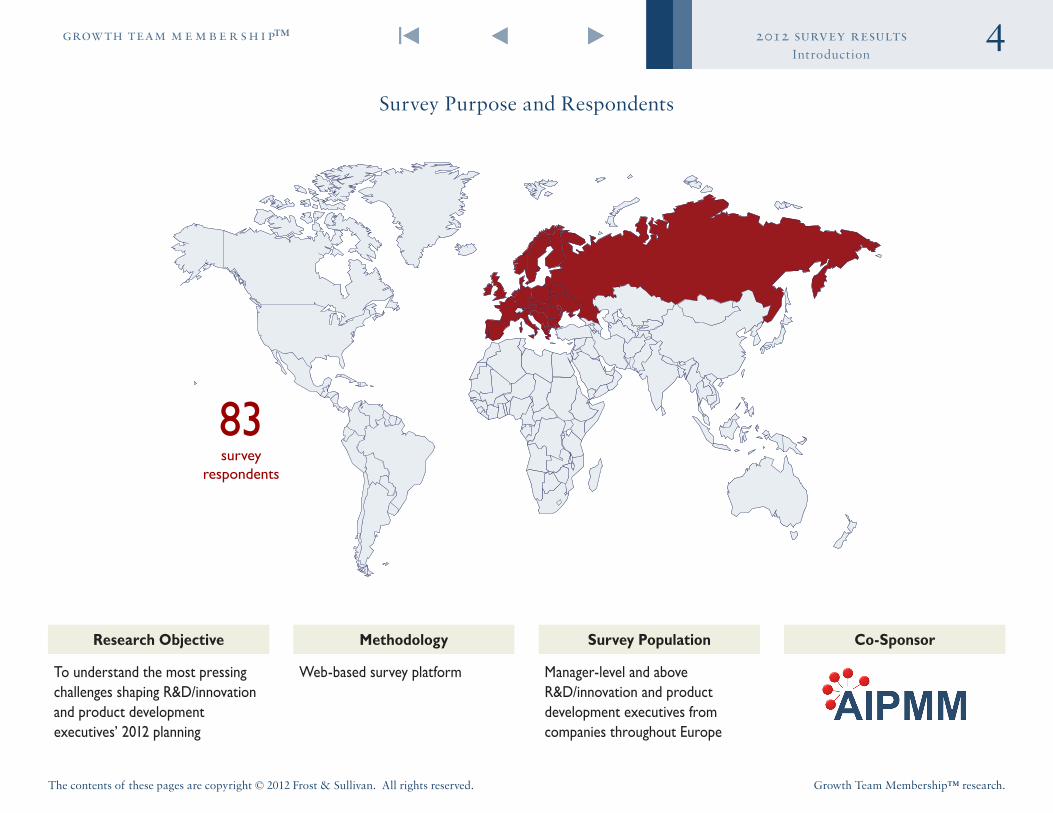
Survey Purpose and Respondents
Co-SponsorSurvey PopulationMethodologyResearch Objective
To understand the most pressing challenges shaping R&D/innovation and product development executives’ 2012 planning
Web-based survey platform Manager-level and above R&D/innovation and product development executives from companies throughout Europe
83survey
respondents
5
The contents of these pages are copyright © 2012 Frost & Sullivan. All rights reserved.
2012 survey resultsgrowth team m e m b e r s h i p™
Growth Team Membership™ research.
Introduction
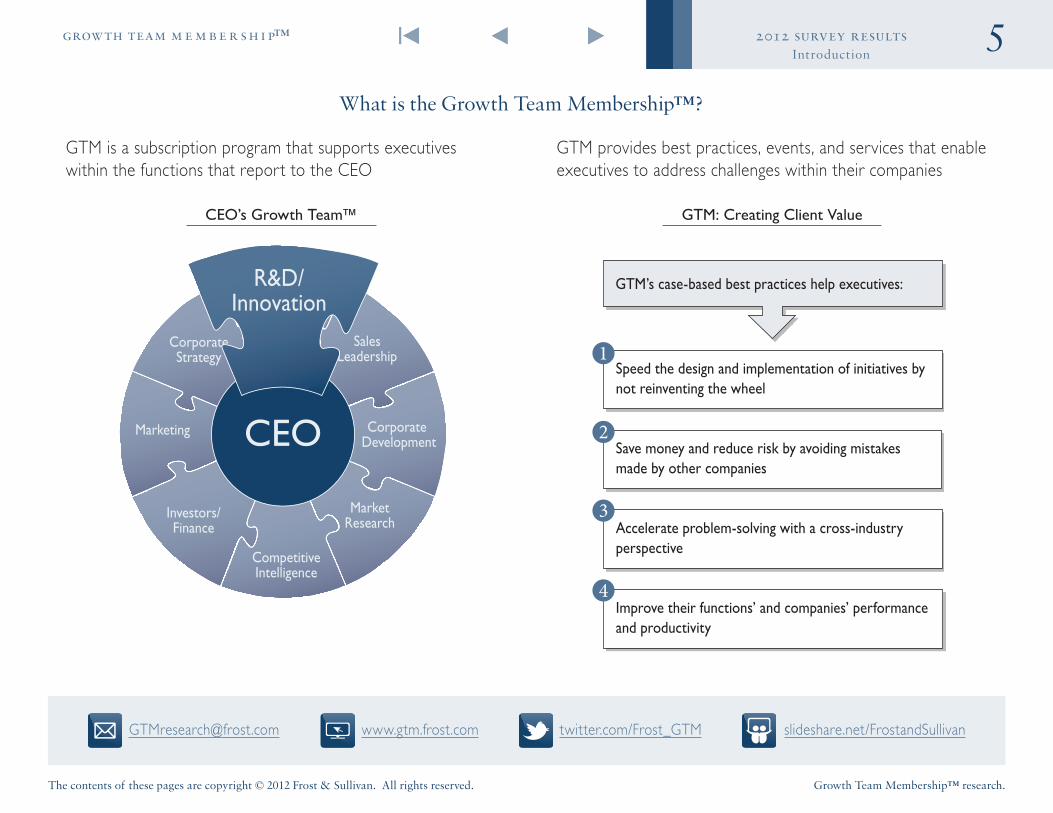
What is the Growth Team Membership™?
GTM is a subscription program that supports executives within the functions that report to the CEO
GTM provides best practices, events, and services that enable executives to address challenges within their companies
CorporateStrategy
Corporate Development
Marketing
CompetitiveIntelligence
MarketResearch
SalesLeadership
R&D/Innovation
Investors/Finance
CEO
R&D/Innovation
CEO’s Growth Team™ GTM: Creating Client Value
GTM’s case-based best practices help executives:
Speed the design and implementation of initiatives by not reinventing the wheel
Save money and reduce risk by avoiding mistakes made by other companies
Accelerate problem-solving with a cross-industry perspective
Improve their functions’ and companies’ performance and productivity
[email protected] www.gtm.frost.com slideshare.net/FrostandSullivantwitter.com/Frost_GTM
6
The contents of these pages are copyright © 2012 Frost & Sullivan. All rights reserved.
2012 survey resultsgrowth team m e m b e r s h i p™
Growth Team Membership™ research.
Introduction
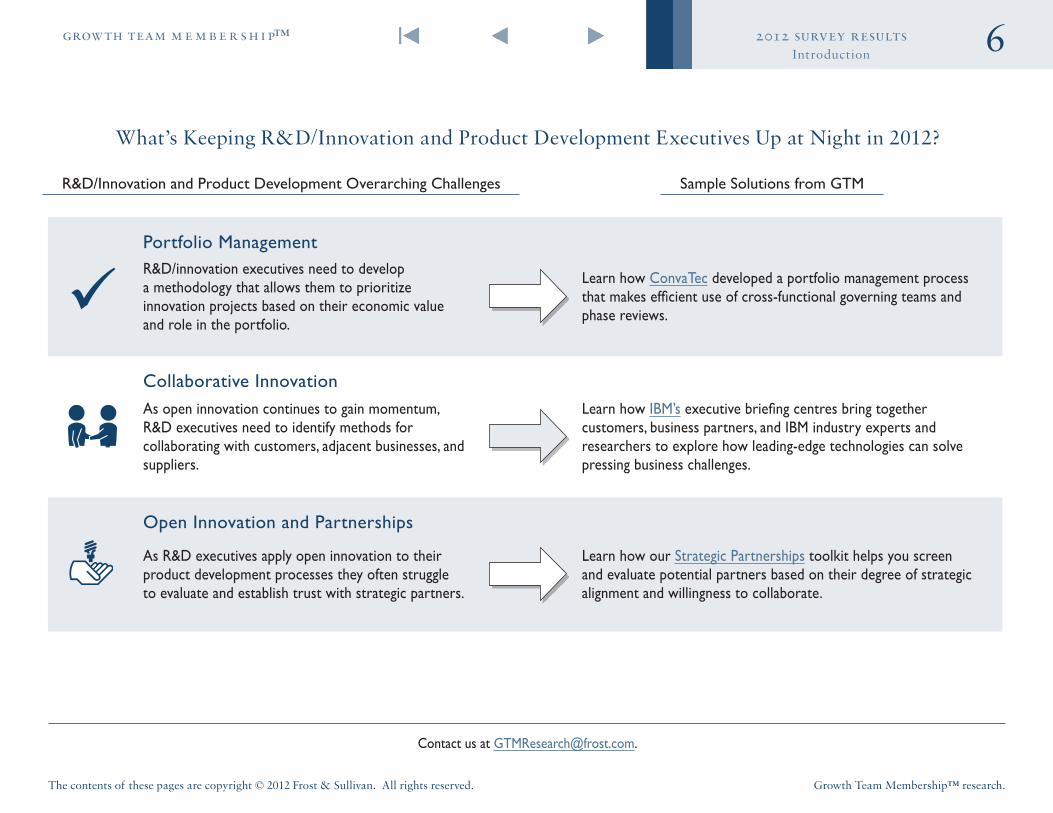
R&D/Innovation and Product Development Overarching Challenges Sample Solutions from GTM
What’s Keeping R&D/Innovation and Product Development Executives Up at Night in 2012?
Contact us at GTMResearch@frost .com .
Portfolio ManagementR&D/innovation executives need to develop a methodology that allows them to prioritize innovation projects based on their economic value and role in the portfolio .
Learn how ConvaTec developed a portfolio management process that makes efficient use of cross-functional governing teams and phase reviews .
Collaborative InnovationAs open innovation continues to gain momentum, R&D executives need to identify methods for collaborating with customers, adjacent businesses, and suppliers .
Learn how IBM’s executive briefing centres bring together customers, business partners, and IBM industry experts and researchers to explore how leading-edge technologies can solve pressing business challenges .
Open Innovation and Partnerships
As R&D executives apply open innovation to their product development processes they often struggle to evaluate and establish trust with strategic partners .
Learn how our Strategic Partnerships toolkit helps you screen and evaluate potential partners based on their degree of strategic alignment and willingness to collaborate .
7
The contents of these pages are copyright © 2012 Frost & Sullivan. All rights reserved.
2012 survey resultsgrowth team m e m b e r s h i p™
Growth Team Membership™ research.
INTRO
SECTION
1
SECTION
2
SECTION
4
SECTION
3
SECTION
1 Key R&D/Innovation and Product Development Challenges
8
The contents of these pages are copyright © 2012 Frost & Sullivan. All rights reserved.
2012 survey resultsgrowth team m e m b e r s h i p™
Growth Team Membership™ research.
Section 1
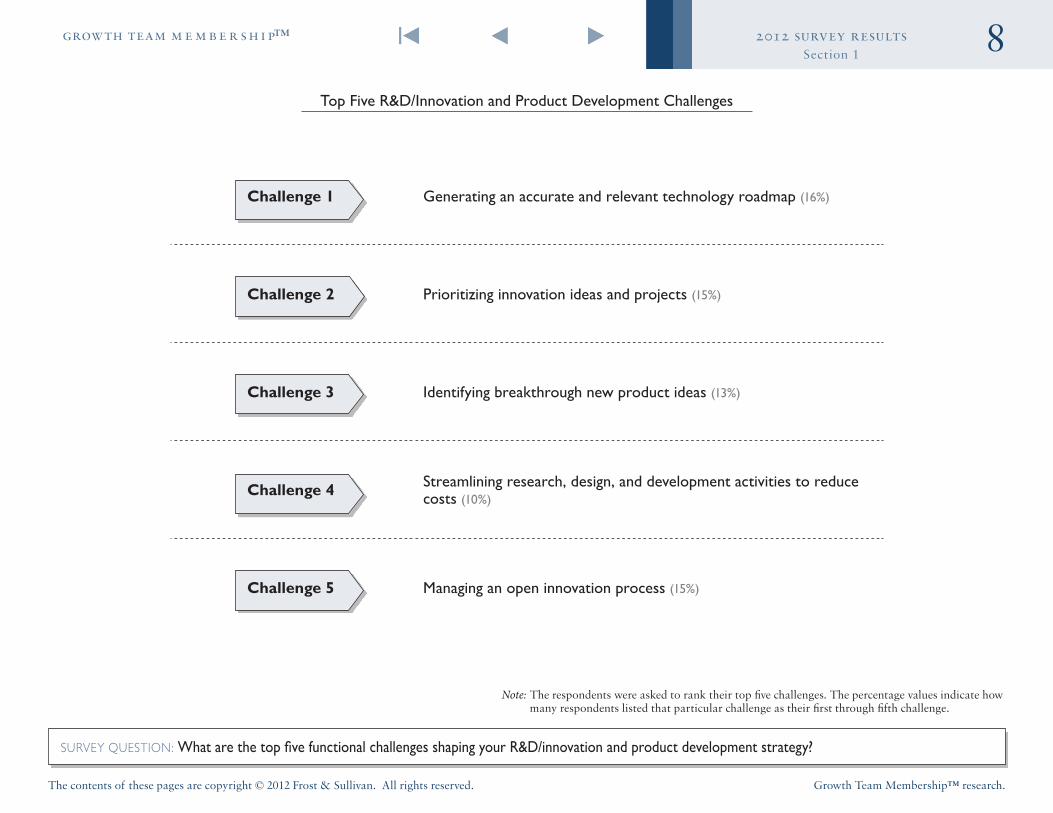
Challenge 1 Generating an accurate and relevant technology roadmap (16%)
Challenge 2 Prioritizing innovation ideas and projects (15%)
Challenge 3 Identifying breakthrough new product ideas (13%)
Challenge 4 Streamlining research, design, and development activities to reduce costs (10%)
Challenge 5 Managing an open innovation process (15%)
Top Five R&D/Innovation and Product Development Challenges
SURVEY QUESTION: What are the top five functional challenges shaping your R&D/innovation and product development strategy?
Note: The respondents were asked to rank their top five challenges. The percentage values indicate how many respondents listed that particular challenge as their first through fifth challenge.
9
The contents of these pages are copyright © 2012 Frost & Sullivan. All rights reserved.
2012 survey resultsgrowth team m e m b e r s h i p™
Growth Team Membership™ research.
Section 1
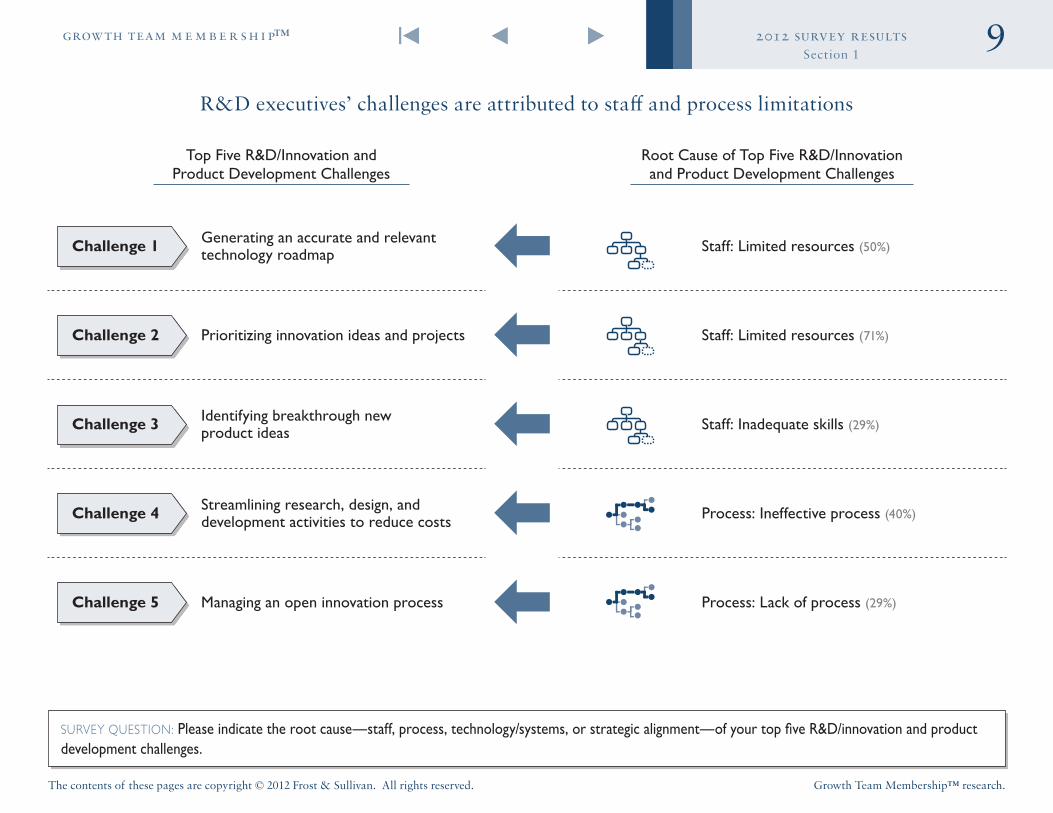
R&D executives’ challenges are attributed to staff and process limitations
SURVEY QUESTION: Please indicate the root cause—staff, process, technology/systems, or strategic alignment—of your top five R&D/innovation and product development challenges .
Root Cause of Top Five R&D/Innovation and Product Development Challenges
Top Five R&D/Innovation and Product Development Challenges
Challenge 1 Generating an accurate and relevant technology roadmap Staff: Limited resources (50%)
Challenge 2 Prioritizing innovation ideas and projects Staff: Limited resources (71%)
Challenge 3 Identifying breakthrough new product ideas Staff: Inadequate skills (29%)
Challenge 4 Streamlining research, design, and development activities to reduce costs Process: Ineffective process (40%)
Challenge 5 Managing an open innovation process Process: Lack of process (29%)
10
The contents of these pages are copyright © 2012 Frost & Sullivan. All rights reserved.
2012 survey resultsgrowth team m e m b e r s h i p™
Growth Team Membership™ research.
INTRO
SECTION
1
SECTION
2
SECTION
4
SECTION
3
SECTION
2 R&D/Innovation and Product Development Resource Trends
11
The contents of these pages are copyright © 2012 Frost & Sullivan. All rights reserved.
2012 survey resultsgrowth team m e m b e r s h i p™
Growth Team Membership™ research.
Section 2
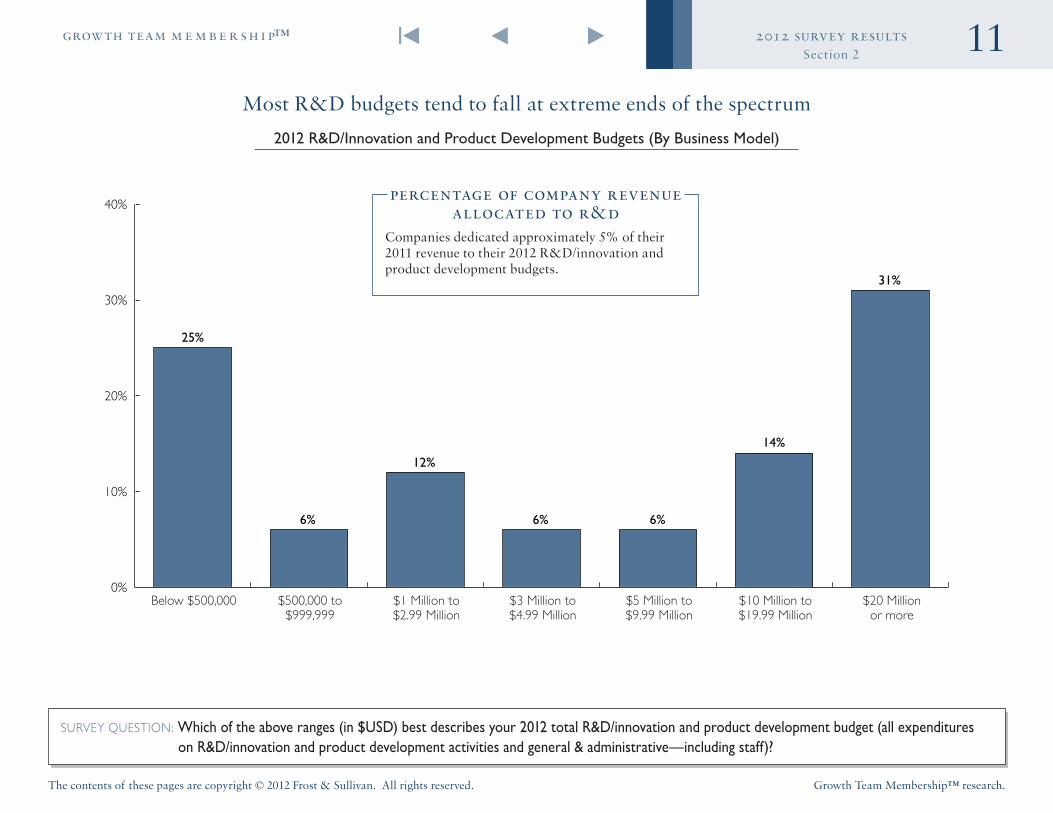
Most R&D budgets tend to fall at extreme ends of the spectrum
2012 R&D/Innovation and Product Development Budgets (By Business Model)
SURVEY QUESTION: Which of the above ranges (in $USD) best describes your 2012 total R&D/innovation and product development budget (all expenditures on R&D/innovation and product development activities and general & administrative—including staff)?
0%
10%
20%
30%
40%
25%
6%
12%
6% 6%
14%
31%
$500,000 to $999,999
Below $500,000 $1 Million to $2.99 Million
$3 Million to $4.99 Million
$5 Million to $9.99 Million
$10 Million to $19.99 Million
$20 Million or more
percentage of company revenue allocated to r&d
Companies dedicated approximately 5% of their 2011 revenue to their 2012 R&D/innovation and product development budgets.
12
The contents of these pages are copyright © 2012 Frost & Sullivan. All rights reserved.
2012 survey resultsgrowth team m e m b e r s h i p™
Growth Team Membership™ research.
Section 2
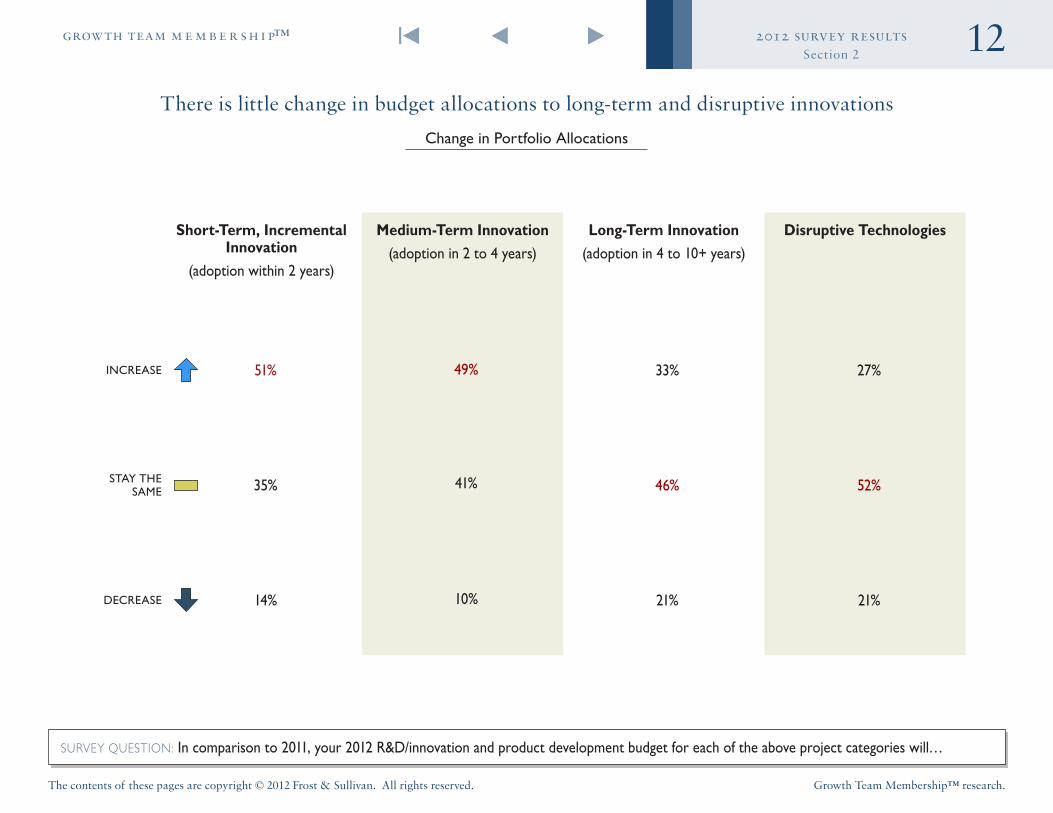
There is little change in budget allocations to long-term and disruptive innovations
Change in Portfolio Allocations
SURVEY QUESTION: In comparison to 2011, your 2012 R&D/innovation and product development budget for each of the above project categories will…
51%
35%
14%
INCREASE
STAY THE SAME
DECREASE
49%
41%
10%
33%
46%
21%
27%
52%
21%
Short-Term, Incremental Innovation
(adoption within 2 years)
Medium-Term Innovation (adoption in 2 to 4 years)
Long-Term Innovation(adoption in 4 to 10+ years)
Disruptive Technologies
13
The contents of these pages are copyright © 2012 Frost & Sullivan. All rights reserved.
2012 survey resultsgrowth team m e m b e r s h i p™
Growth Team Membership™ research.
Section 2
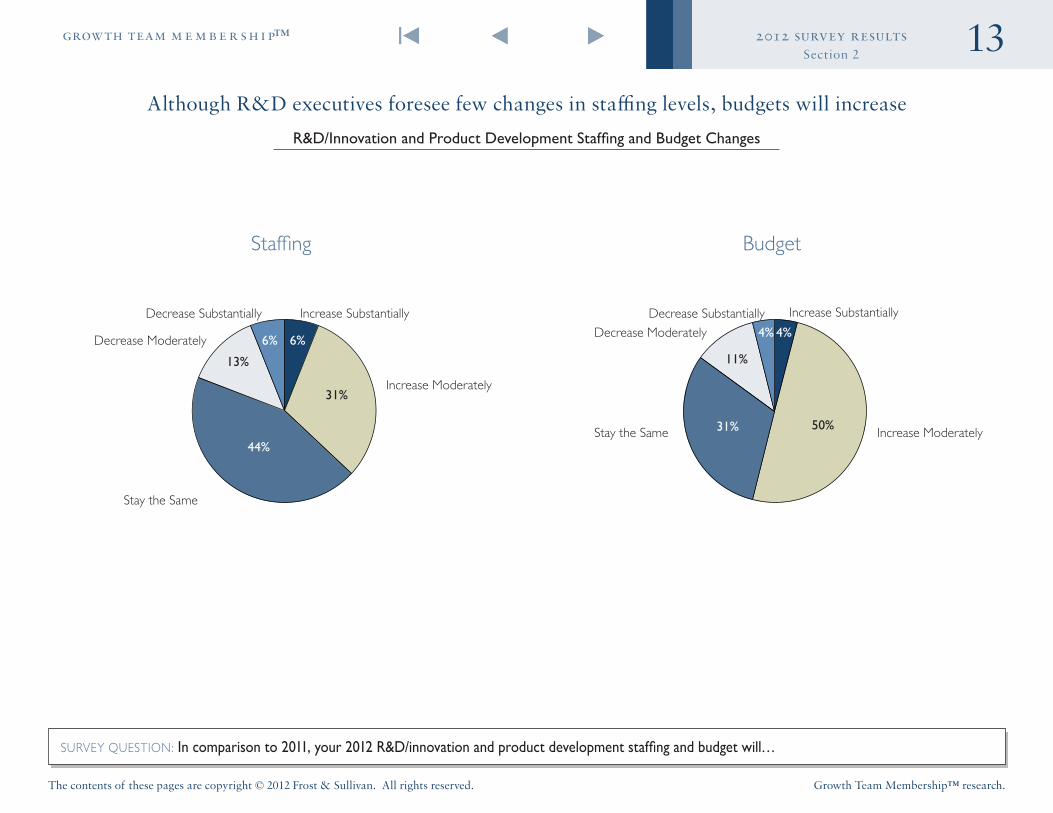
Although R&D executives foresee few changes in staffing levels, budgets will increase
R&D/Innovation and Product Development Staffing and Budget Changes
SURVEY QUESTION: In comparison to 2011, your 2012 R&D/innovation and product development staffing and budget will…
13%
6%
44%
31%
Stay the Same
Decrease Moderately
Decrease Substantially Increase Substantially
Increase Moderately
Staffing Budget
Decrease Substantially Increase Substantially
6% 4%4%
31% 50%
11%
Stay the Same
Decrease Moderately
Increase Moderately
14
The contents of these pages are copyright © 2012 Frost & Sullivan. All rights reserved.
2012 survey resultsgrowth team m e m b e r s h i p™
Growth Team Membership™ research.
Section 2
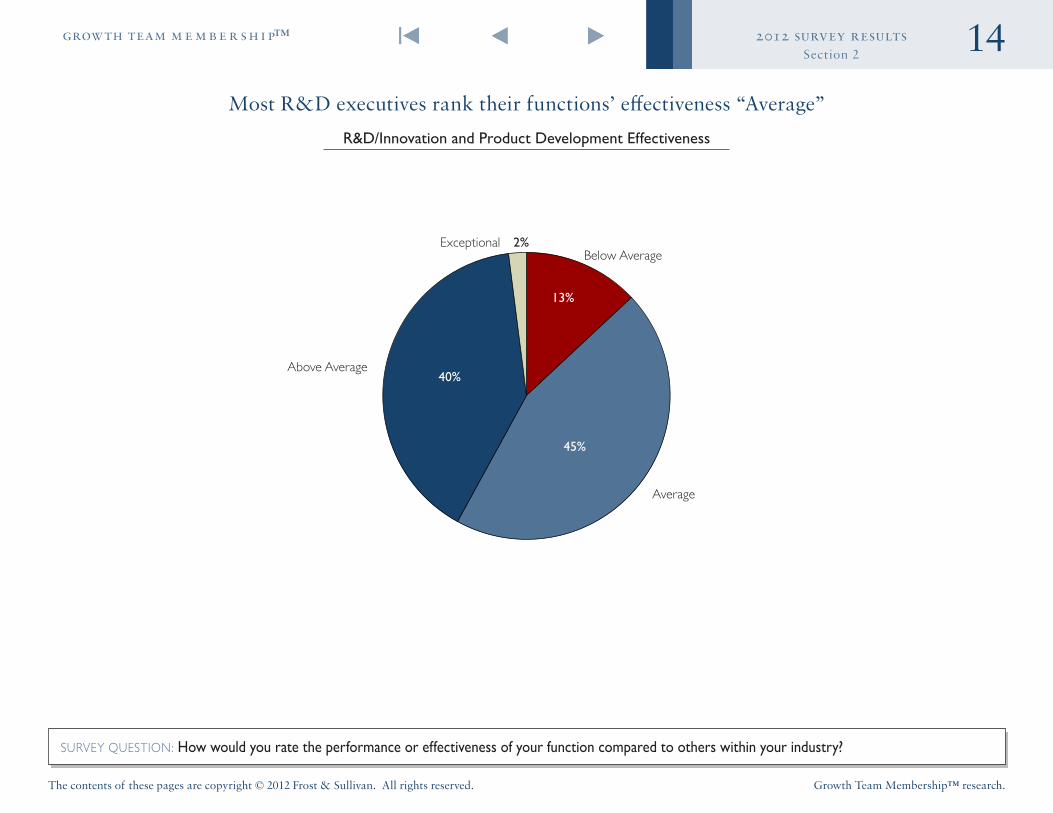
Most R&D executives rank their functions’ effectiveness “Average”
R&D/Innovation and Product Development Effectiveness
SURVEY QUESTION: How would you rate the performance or effectiveness of your function compared to others within your industry?
2%
40%
45%
13%
Above Average
ExceptionalBelow Average
Average
15
The contents of these pages are copyright © 2012 Frost & Sullivan. All rights reserved.
2012 survey resultsgrowth team m e m b e r s h i p™
Growth Team Membership™ research.
INTRO
SECTION
1
SECTION
2
SECTION
4
SECTION
3SECTION
3 Special Interest Topic: Open Innovation
16
The contents of these pages are copyright © 2012 Frost & Sullivan. All rights reserved.
2012 survey resultsgrowth team m e m b e r s h i p™
Growth Team Membership™ research.
Section 3
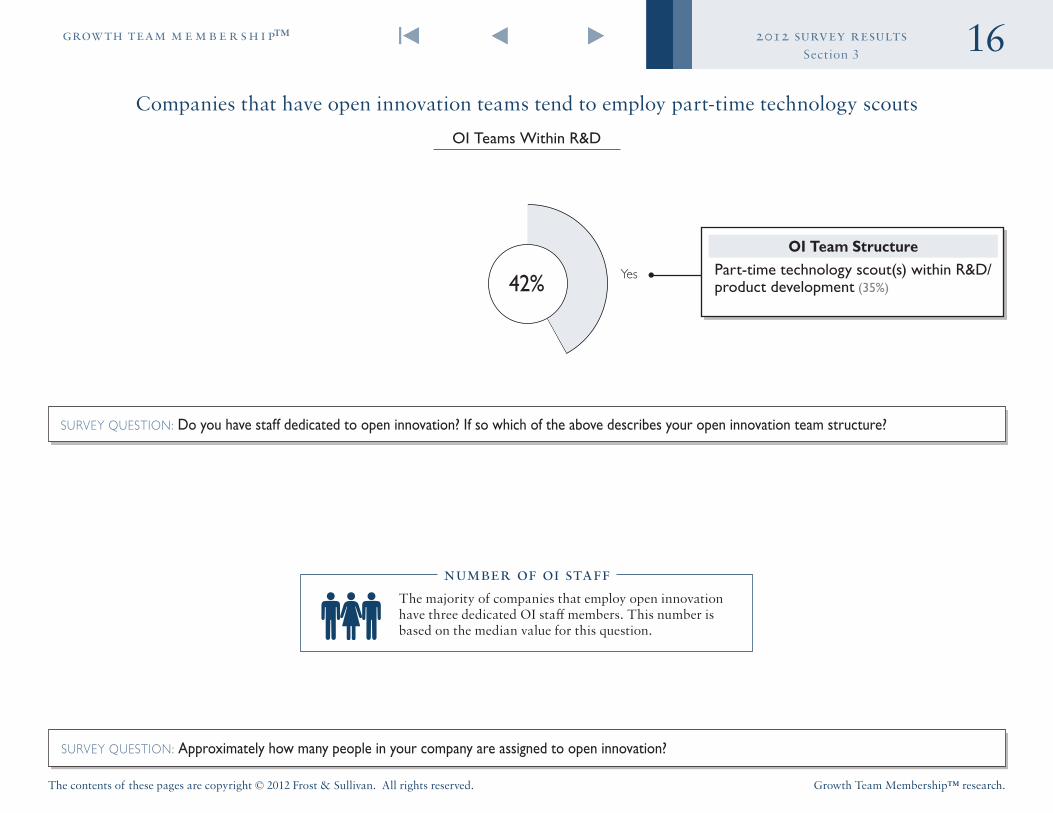
Companies that have open innovation teams tend to employ part-time technology scouts
OI Teams Within R&D
SURVEY QUESTION: Do you have staff dedicated to open innovation? If so which of the above describes your open innovation team structure?
Yes42%
SURVEY QUESTION: Approximately how many people in your company are assigned to open innovation?
number of oi staffThe majority of companies that employ open innovation have three dedicated OI staff members. This number is based on the median value for this question.
OI Team StructurePart-time technology scout(s) within R&D/product development (35%)
17
The contents of these pages are copyright © 2012 Frost & Sullivan. All rights reserved.
2012 survey resultsgrowth team m e m b e r s h i p™
Growth Team Membership™ research.
Section 3
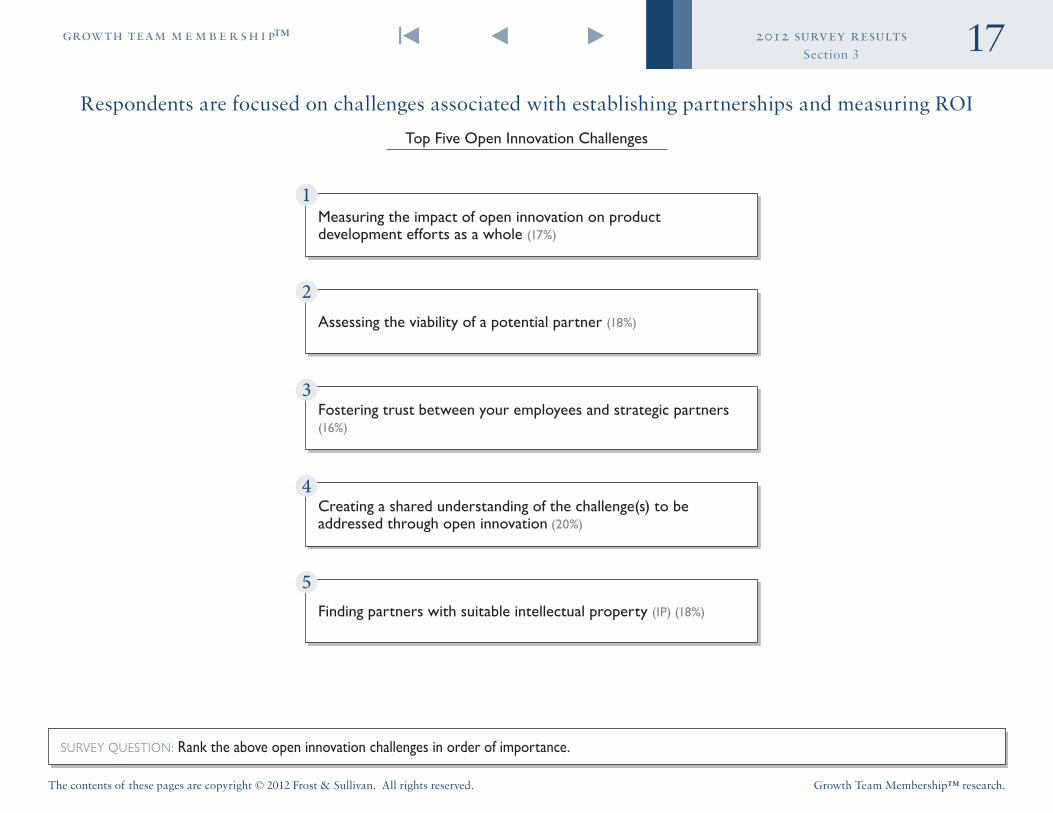
Respondents are focused on challenges associated with establishing partnerships and measuring ROI
Top Five Open Innovation Challenges
SURVEY QUESTION: Rank the above open innovation challenges in order of importance .
Fostering trust between your employees and strategic partners (16%)
Creating a shared understanding of the challenge(s) to be addressed through open innovation (20%)
Finding partners with suitable intellectual property (IP) (18%)
Assessing the viability of a potential partner (18%)
Measuring the impact of open innovation on product development efforts as a whole (17%)
18
The contents of these pages are copyright © 2012 Frost & Sullivan. All rights reserved.
2012 survey resultsgrowth team m e m b e r s h i p™
Growth Team Membership™ research.
Section 3
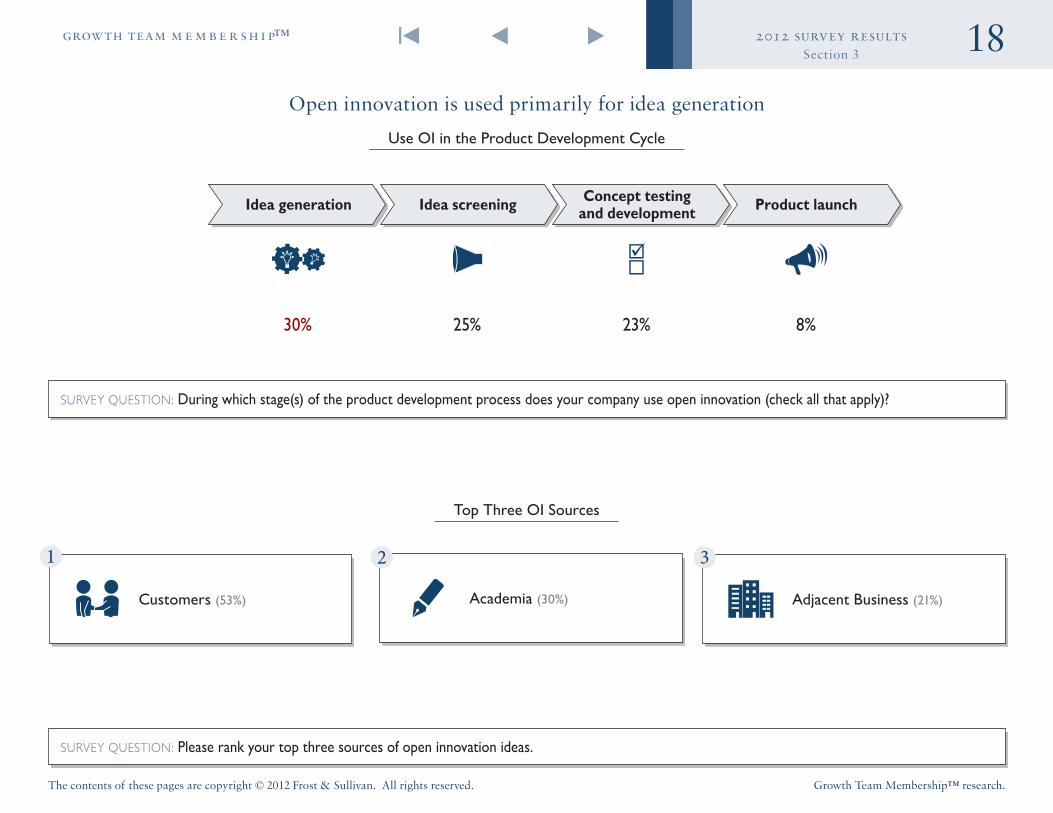
Academia (30%)
Open innovation is used primarily for idea generation
Use OI in the Product Development Cycle
SURVEY QUESTION: During which stage(s) of the product development process does your company use open innovation (check all that apply)?
30% 25% 23% 8%
Idea generation Idea screening Concept testing and development Product launch
SURVEY QUESTION: Please rank your top three sources of open innovation ideas .
Top Three OI Sources
Customers (53%) Adjacent Business (21%)
19
The contents of these pages are copyright © 2012 Frost & Sullivan. All rights reserved.
2012 survey resultsgrowth team m e m b e r s h i p™
Growth Team Membership™ research.
INTRO
SECTION
1
SECTION
2
SECTION
4
SECTION
3
SECTION
4 Respondent Demographics
20
The contents of these pages are copyright © 2012 Frost & Sullivan. All rights reserved.
2012 survey resultsgrowth team m e m b e r s h i p™
Growth Team Membership™ research.
Section 4
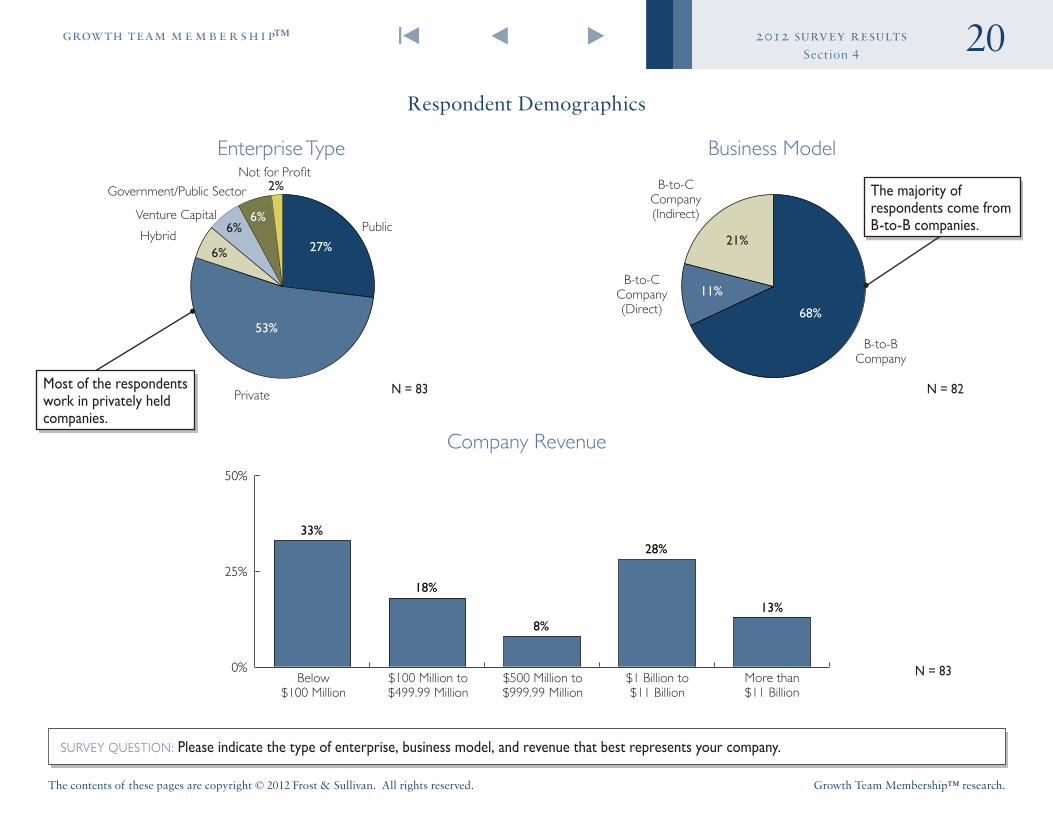
Respondent Demographics
SURVEY QUESTION: Please indicate the type of enterprise, business model, and revenue that best represents your company .
N = 83
N = 82N = 83
Enterprise Type Business Model
Company Revenue
53%
6%
6%6%
2%
27% 21%
11%
68%
Public
Private
Hybrid
B-to-B Company
Venture Capital
Government/Public Sector
Not for Profit
0%
25%
50%
33%
18%
8%
28%
13%
Below $100 Million
$100 Million to $499.99 Million
$500 Million to $999.99 Million
$1 Billion to $11 Billion
More than $11 Billion
B-to-C Company (Indirect)
B-to-C Company (Direct)
The majority of respondents come from B-to-B companies .
Most of the respondents work in privately held companies .
21
The contents of these pages are copyright © 2012 Frost & Sullivan. All rights reserved.
2012 survey resultsgrowth team m e m b e r s h i p™
Growth Team Membership™ research.
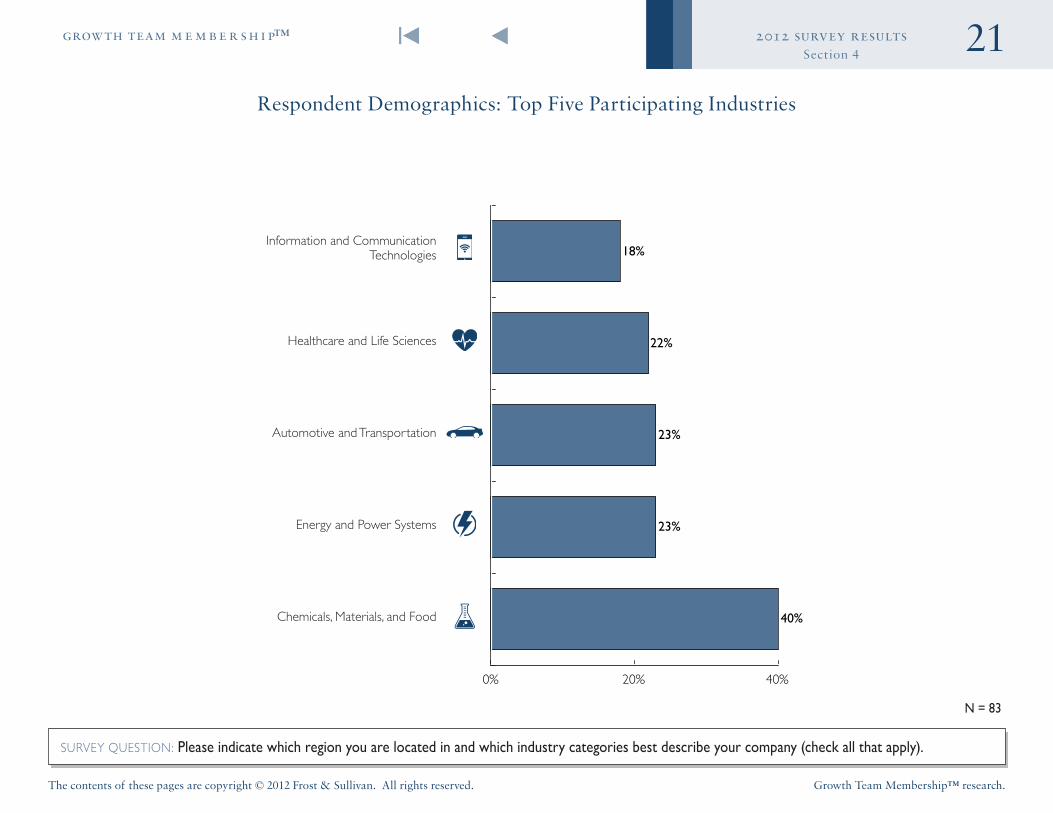
Section 4
Energy and Power Systems
Chemicals, Materials, and Food
SURVEY QUESTION: Please indicate which region you are located in and which industry categories best describe your company (check all that apply) .
Respondent Demographics: Top Five Participating Industries
N = 83
0% 20% 40%
40%
23%
23%
22%
18%
Automotive and Transportation
Healthcare and Life Sciences
Information and Communication Technologies