8/3/2019 IDBI Bank Q2FY12 Result Update
http://slidepdf.com/reader/full/idbi-bank-q2fy12-result-update 1/3
Wealth Research, Unicon Financial Intermediaries. Pvt Ltd.
Email: [email protected]
NG TERM INVESTMENT CALL
BUY21 October 2011
Company Report | Q2FY12 Result Update
Q2FY12 Result Highlights
IDBI Bank’s (IDBI) PAT grew by 20% to INR 5.15 bn on YoY basis
and on sequential basis by 54% due to lower provisioning & tax
expenses. However the net interest income (NII) has fallen by 4%
& 3% to INR 11.2 bn on YoY & QoQ basis respectively. The non-
interest income stood at INR 4.7 bn declining by 3% on YoY basis,
due to lower fee income of INR 3.6 bn.
Advances grew by 20% to INR 1.56 tn because of higher growth in
retail portfolio. Deposits grew by 13% to INR 1.7 tn. The
proportion of bulk deposits in total deposits is also reducing due
to a rise in retail term deposits. It now constitutes around 60% of
deposits. The bank is targeting to reduce the same to 50% in the
next two years. CASA ratio increased to 19.19% in Q2FY12 from
15.26% in Q2FY11. Due to higher cost of deposits NIMs declined
by 24 bps & 7 bps to 2% in Q2FY11 on YopY & QoQ basis
respectively.
During Q2FY12, overall asset quality deteriorated with higher
slippages. The gross and net non performing assets (NPAs)increased to 2.47% and 1.57% in Q2FY12 from 1.88% and 1.19% in
Q2FY11 respectively. The slippages remained high at INR 9.25 Bn,
mainly contributed by the small and medium enterprise (SME)
segment.
The tax provisions were lower during the quarter (24.8%
compared to 44.6% in Q2FY12) while they were around 34% for
H1FY12, in line with the guidance for the full year. The provision
expenses declined by 27.4% & 24.7% on YoY & QoQ basis
respectively, due to lower provision requirement on NPAs (INR
1.83 Bn vs INR 3.6 Bn in Q1FY12). The bank also provided INR
1.08 Bn towards depreciation in security receipts.
The cost to income ratio of the bank stood at 37.1% as against
38.2% in Q2FY11 and 34.9% in Q1FY12. The bank has opened 25
branches during the quarter taking the total branches to 908. The
bank plans to expand its branch network to 1,000 branches by
FY12.
Industry Banking
CMP (INR) 104Target (INR) 196
52 week High/Low (INR) 202/94
Market Cap (INR BN) 103187
3M Avg. Daily Volumes 2074600
P/BV FY12E 0.7x
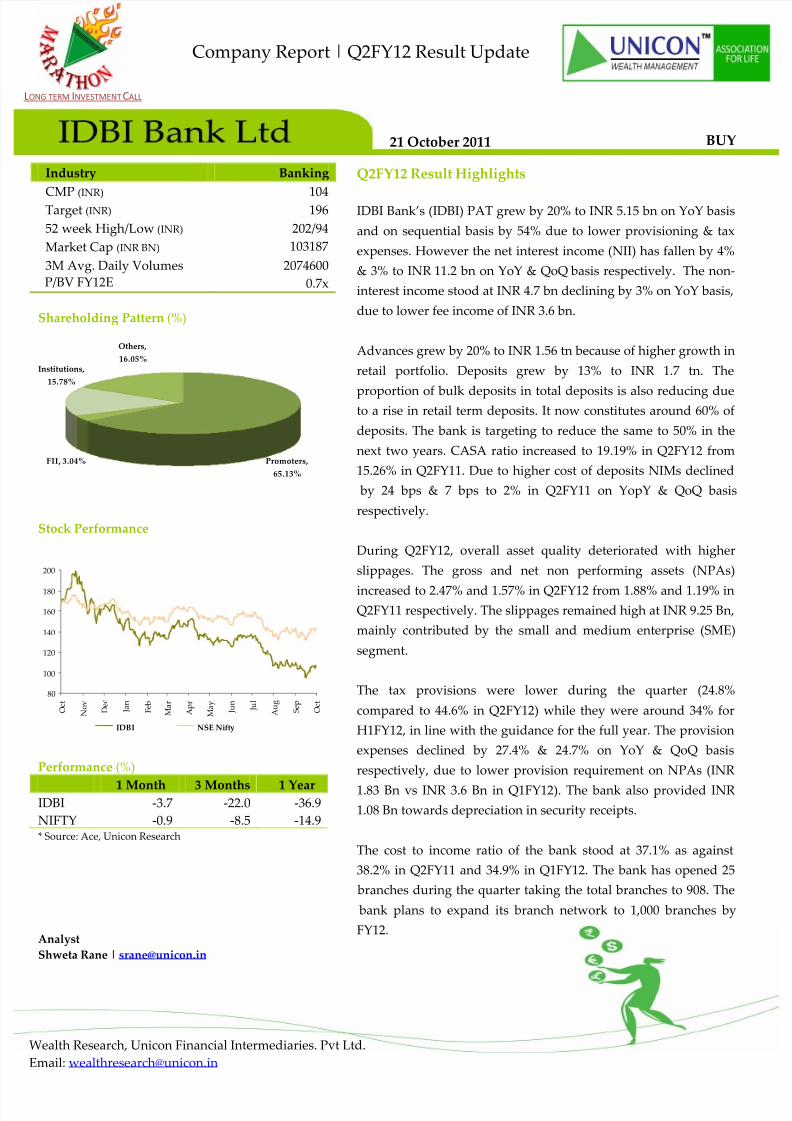
Shareholding Pattern (%)
Promoters,
65.13%
FII, 3.04%
Others,
16.05%Institutions,
15.78%
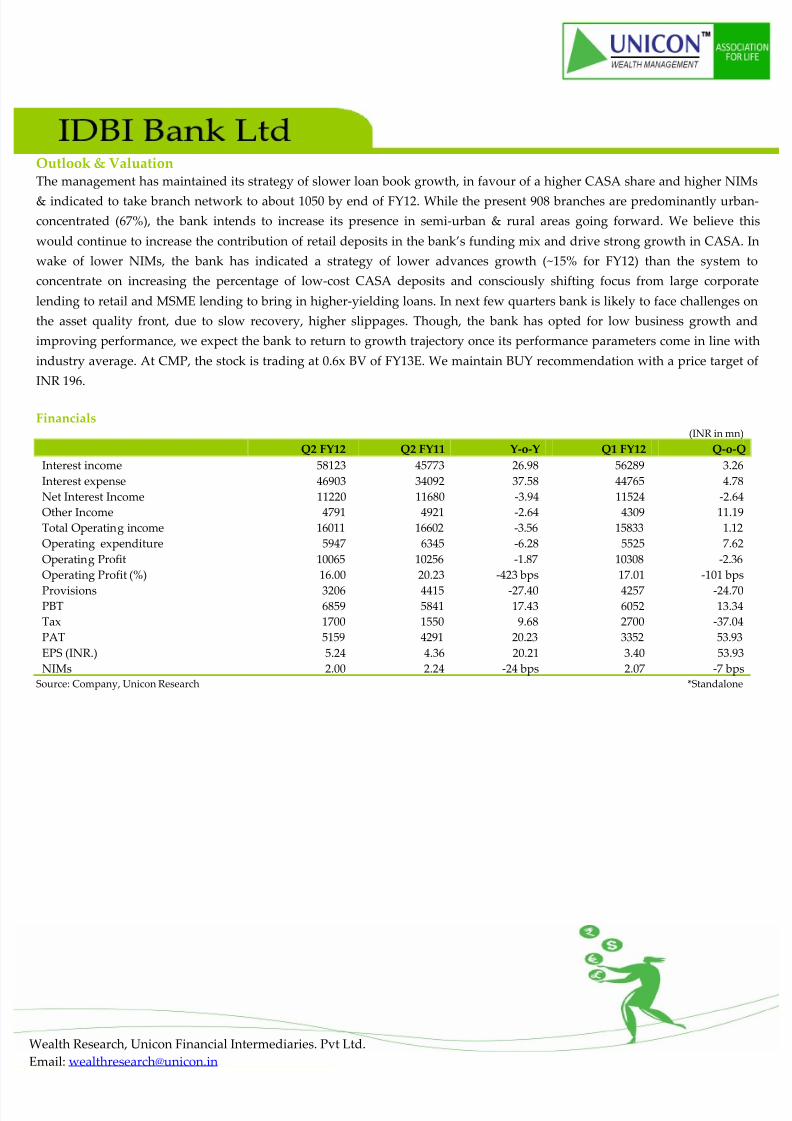
Stock Performance
80
100
120
140
160
180
200
O c t
N o v
D e c
J a n
F e b
M a r
A p r
M a y
J u n
J u l
A u g
S e p
O c t
IDBI NSE Nifty Performance (%)
1 Month 3 Months 1 Year
IDBI -3.7 -22.0 -36.9
NIFTY -0.9 -8.5 -14.9* Source: Ace, Unicon Research
Analyst
Shweta Rane | [email protected]
8/3/2019 IDBI Bank Q2FY12 Result Update
http://slidepdf.com/reader/full/idbi-bank-q2fy12-result-update 2/3
Wealth Research, Unicon Financial Intermediaries. Pvt Ltd.
Email: [email protected]
Outlook & ValuationThe management has maintained its strategy of slower loan book growth, in favour of a higher CASA share and higher NIMs
& indicated to take branch network to about 1050 by end of FY12. While the present 908 branches are predominantly urban-
concentrated (67%), the bank intends to increase its presence in semi-urban & rural areas going forward. We believe this
would continue to increase the contribution of retail deposits in the bank’s funding mix and drive strong growth in CASA. In
wake of lower NIMs, the bank has indicated a strategy of lower advances growth (~15% for FY12) than the system to
concentrate on increasing the percentage of low-cost CASA deposits and consciously shifting focus from large corporate
lending to retail and MSME lending to bring in higher-yielding loans. In next few quarters bank is likely to face challenges on
the asset quality front, due to slow recovery, higher slippages. Though, the bank has opted for low business growth and
improving performance, we expect the bank to return to growth trajectory once its performance parameters come in line with
industry average. At CMP, the stock is trading at 0.6x BV of FY13E. We maintain BUY recommendation with a price target of
INR 196.
Financials(INR in mn)
Q2 FY12 Q2 FY11 Y-o-Y Q1 FY12 Q-o-Q
Interest income 58123 45773 26.98 56289 3.26
Interest expense 46903 34092 37.58 44765 4.78
Net Interest Income 11220 11680 -3.94 11524 -2.64
Other Income 4791 4921 -2.64 4309 11.19
Total Operating income 16011 16602 -3.56 15833 1.12
Operating expenditure 5947 6345 -6.28 5525 7.62
Operating Profit 10065 10256 -1.87 10308 -2.36
Operating Profit (%) 16.00 20.23 -423 bps 17.01 -101 bpsProvisions 3206 4415 -27.40 4257 -24.70
PBT 6859 5841 17.43 6052 13.34
Tax 1700 1550 9.68 2700 -37.04
PAT 5159 4291 20.23 3352 53.93
EPS (INR.) 5.24 4.36 20.21 3.40 53.93
NIMs 2.00 2.24 -24 bps 2.07 -7 bpsSource: Company, Unicon Research *Standalone
8/3/2019 IDBI Bank Q2FY12 Result Update
http://slidepdf.com/reader/full/idbi-bank-q2fy12-result-update 3/3
Wealth Research, Unicon Financial Intermediaries. Pvt Ltd.
Email: [email protected]
Unicon Investment Ranking Methodology
Rating Buy Accumulate Hold Reduce Sell
Return Range >= 20% 10% to 20% -10% to 10% -10% to -20% <= -20%
Disclaimer
This document has been issued by Unicon Financial Intermediaries Pvt. Ltd. (“UNICON”) for the information of its customers only. UNICON is governed by
the Securities and Exchange Board of India. This document is not for public distribution and has been furnished to you solely for your information and must
not be reproduced or redistributed to any other person. Persons into whose possession this document may come are required to observe these restrictions. The
information and opinions contained herein have been compiled or arrived at based upon information obtained in good faith from public sources believed to
be reliable. Such information has not been independently verified and no guarantee, representation or warranty, express or implied is made as to its accuracy,completeness or correctness. All such information and opinions are subject to change without notice. This document has been produced independently of any
company or companies mentioned herein, and forward looking statements; opinions and expectations contained herein are subject to change without notice.
This document is for information purposes only and is provided on an “as is” basis. Descriptions of any company or companies or their securities mentioned
herein are not intended to be complete and this document is not, and should not be construed as an offer, or solicitation of an offer, to buy or sell or subscribe
to any securities or other financial instruments. We are not soliciting any action based on this document. UNICON, its associate and group companies its
directors or employees do not take any responsibility, financial or otherwise, of the losses or the damages sustained due to the investments made or any action
taken on basis of this document, including but not restricted to, fluctuation in the prices of the shares and bonds, reduction in the dividend or income, etc. This
document is not directed to or intended for display, downloading, printing, reproducing or for distribution to or use by any person or entity who is a citizen
or resident or located in any locality, state, country or other jurisdiction where such distribution, publication, reproduction, availability or use would be
contrary to law or regulation or would subject UNICON or its associates or group companies to any registration or licensing requirement within such
jurisdiction. If this document is inadvertently sent or has reached any individual in such country, the same may be ignored and brought to the attention of the
sender. This document may not be reproduced, distributed or published for any purpose without prior written approval of UNICON. This document is for
the general information and does not take into account the particular investment objectives, financial situation or needs of any individual customer, and it
does not constitute a personalised recommendation of any particular security or investment strategy. Before acting on any advice or recommendation in thisdocument, a customer should consider whether i t is suitable given the customer’s particular circumstances and, if necessary, seek professional advice. Certain
transactions, including those involving futures, options, and high yield securities, give rise to substantial risk and are not suitable for all investors. UNICON,
its associates or group companies do not represent or endorse the accuracy or reliability of any of the information or content of the document and reliance
upon it is at your own risk.
UNICON, its associates or group companies, expressly disclaims any and all warranties, express or implied, including without limitation warranties of
merchantability and fitness for a particular purpose with respect to the document and any information in it. UNICON, its associates or group companies, shall
not be liable for any direct, indirect, incidental, punitive or consequential damages of any kind with respect to the document. No part of this publication may
be reproduced, stored in a retrieval system, or transmitted, on any form or by any means, electronic, mechanical, photocopying, recording, or otherwise,
without the prior written permission of Unicon Financial Intermediaries Pvt. Ltd.
Address:
Wealth Management
Unicon Financial Intermediaries. Pvt. Ltd.VILCO Center, 2nd Floor,
8 Subhash Road, Vile Parle (E)
Mumbai 400 057Ph: 022-3390 1234
Email: [email protected]
Visit us at www.unicon.in
Recommended